Attached files
| file | filename |
|---|---|
| 8-K - CURRENT REPORT - Global Net Lease, Inc. | v424999_8k.htm |
Exhibit 99.1

November 2015 Investor Presentation

Diversified by asset type, geography, tenant and tenant industry Focus on single tenant, net lease, income producing, mission critical assets in the U.S., UK, Germany, the Netherlands and Finland 79% of NOI derived from investment grade rated or implied investment grade rated tenants (1) 11.5 year weighted average remaining portfolio lease term (2) provides reliable cash flows with contractual and indexed rent growth (3) GNL is positioned to take advantage of broad net lease opportunities in both Western Europe and the U.S. Target markets nearly 3x the size of U.S. market with fewer competitors focused on owner - occupied real estate in Europe Proven track record across multiple economic cycles Externally advised by AR Capital and Moor Park, providing a highly scalable acquisition and asset management platform with visible acquisition pipeline from proven, country focused proprietary origination network 20 - year management agreement provides GNL with a lower cost structure vs. peers Enhances performance - based compensation, which aligns management and shareholder interests Strong and flexible capital structure Foreign currency risk reduced through asset / liability matching and quarterly rolling forward swaps on net income Estimated annual Pro Forma Run Rate AFFO for year - end 2015 of $0.82 per fully diluted share (4) Investment Highlights High - Quality, Diversified Net Lease Portfolio Strong, Creditworthy Tenant Base with Attractive Lease Terms Global Investment Strategy Experienced Management Team Flexible Balance Sheet Outlook Remains Strong 2 ___________________________ Source: All portfolio and financial information derived from company financial statements as of 9/30/2015 . Information shown based on U.S. Dollar equivalent amounts using exchange rates as of 9/30/2015 . 1. Based on annualized 2015 GAAP NOI estimate and is not based on historical performance. See discussion under the captions “For war d Looking Statements” and “Projections” in this investor presentation for more information. Actual ratings reflect the tenant rating. Implied ratings are determined using a proprietary Moody’s analytical too l, which compares the risk metrics of the non - rated company to those of a company with an a ctual rating. A tenant with a parent that has an investment grade rating is included in implied investment grade. Ratings inf orm ation is as of the date the property was underwritten by the company. 2. Based on square feet. 3. Refers to leases with fixed percent or actual increases, or country – specific CPI - indexed increases . 4. Annual Pro Forma Run Rate AFFO per share represents the projected AFFO from the existing portfolio including the impact of th e c ontractual rent increases and in - place currency hedges adjusted to reflect the full year impact of the following pro forma adjustments: adjusted general and administrative expenses to reflect GNL’s transition to a publicly listed company (including base management fee, incentive fee and reimbursable expenses) and $206.1 million of acquisitions completed in the third quarter, (AFFO is a non - GAAP performance metric ). Executive Summary Financial Highlights Portfolio Overview Investment Strategy Management Team Conclusion Favorable Cost Structure

Cash NOI $43.3 million AFFO $31.2 million AFFO per diluted share $0.18 Dividend Yield – annualized (1) 7.7% Net Debt / Enterprise Value (2) 43.3% Euro / GBP / US $ Exposure 41% / 38% / 21% Weighted Average Interest Rate Cost 2.5% Fixed / Floating Rate Debt 67.8% / 32.2% Interest Coverage 5.8x Weighted Average Debt Maturity 3.3 years 3Q 2015 Key Highlights 3 Source: All portfolio and financial information derived from company financial statements as of 9/30/2015 . Information shown based on U.S. Dollar equivalent amounts using exchange rates as of 9/30/2015 . 1. Based on share price of $9.20 as of 9/30/2015. 2. Based on enterprise value of $2.8 billion calculated using the 9/30/2015 closing share price of $9.20 and total combined debt of $1.2 billion, including $509.4 million of mortgage debt. Financial Leverage Executive Summary Financial Highlights Portfolio Overview Investment Strategy Management Team Conclusion

100% 100% 100% 100% 100% 100% 100% 90% 64% 60% 10% 37% 40% 0% 20% 40% 60% 80% 100% GPT LXP NNN O SIR SRC STOR CSG WPC GNL U.S. Europe GNL U.S. Best in Class Portfolio Geographic Breakdown 6.2 8.7 8.9 9.6 10.1 10.8 11.4 11.5 11.5 15.0 0.0 2.0 4.0 6.0 8.0 10.0 12.0 14.0 16.0 CSG LXP WPC GPT O SRC SIR NNN GNL STOR Average Remaining Lease Term (Years) 97.7% 98.3% 98.5% 98.8% 98.8% 99.2% 99.5% 99.6% 99.7% 100.0% 90% 92% 94% 96% 98% 100% SIR O SRC NNN WPC CSG STOR GPT LXP GNL Occupancy 23.5% 27.0% 35.0% 38.0% 41.0% 41.0% 44.0% 44.0% 53.8% 0.0% 10.0% 20.0% 30.0% 40.0% 50.0% 60.0% 70.0% STOR WPC NNN LXP GPT SRC SIR O GNL CSG % Investment Grade Comps Average: 10.4 years Comps Average: 34.7% Comps Average: 99.0% ___________________________ Source: Company filings as of 9/30/2015 except for STOR, which is as of 6/30/2015. Note: CSG represents Chambers Street Properties, GNL represents Global Net Lease, GPT represents Gramercy Property Trust, LXP re presents Lexington Realty Trust, NNN represents National Retail Properties, O represents Realty Income, SIR represents Select Income REIT, SRC represents Spirit Realty Capital, STOR represents Store Capi tal , and WPC represents W.P. Carey. All information based on annualized rent, except for CSG’s geographic breakdown, which is based on acquisition cost. 1. WPC’s international exposure includes less than 5% of annualized base rent derived from other non - European markets (Australia, C anada, Mexico, Thailand, Malaysia and Japan). 2. LXP excludes ground leases. Lease maturity ~12.4 years including ground leases. 3. STOR includes eight ground leases with an average lease term of 75 years. (1) (2) (3) N/A Executive Summary Financial Highlights Portfolio Overview Investment Strategy Management Team Conclusion 4 79% incl. Implied IG Tenants

Tenant Rating (1) Country Property Type % of Portfolio NOI (2) Baa1 GER Office 5.3% **BBB US Distribution 4.8% **BBB - US Retail 4.4% **Aaa FIN Industrial 4.4% AA+ US Office 4.3% BBB+ US Office 3.1% Crown Crest *A2 UK Distribution 2.9% ***AA - FIN Office 2.9% *Baa2 UK Office 2.4% Aa2 US Office 2.4% High - Quality Portfolio Portfolio Overview Source: All portfolio and financial information derived from company financial statements as of 9/30/2015. Information shown based on U.S. Dollar equivalent amounts using exchange rates as of 9/30/2015. 1. Actual ratings reflect the tenant rating. Implied ratings are determined using a proprietary Moody’s analytical tool, which c omp ares the risk metrics of the non - rated company to those of a company with an actual r ating. A tenant with a parent that has an investment grade rating is included in implied investment grade. Ratings informatio n i s as of the date the property was underwritten by the company. 2. Based on 2015 GAAP NOI. Estimated GAAP NOI represents an estimate and is not based on historical fact. See the discussion und er the captions, “Forward Looking Statements” and “Projections” in this investor presentation for more information. 3. Based on square feet. 4. Fixed percent or actual increases, or country - specific CPI - indexed increases . * Represents Moody’s Implied Rating ** Represents Tenant Parent Rating *** Represents Lease Guarantor Rating GNL owns a large scale portfolio of 329 net lease assets diversified across five countries, 86 tenants and 39 industries as of September 30 th , 2015. Lease Expiration Schedule (% of SF Per Year) Weighted A verage Lease Term: 11.5 (3) years 5 Top Ten Tenants # of Properties 329 Total Square Feet (mm) 18.7 Number of Tenants 86 Number of Industries 39 Countries 5 Occupancy 100% Weighted Average Remaining Lease Term (3) 11.5 years % of NOI from Investment Grade Tenants (1)(2) 79% % of Portfolio NOI from Leases with Contractual Rent Increases (2)(4) 89% The Portfolio’s Top Ten Tenants Represent 37% of P ortfolio NOI 0% 0% 0% 0% 2% 2% 8% 10% 21% 57% Executive Summary Financial Highlights Portfolio Overview Investment Strategy Management Team Conclusion
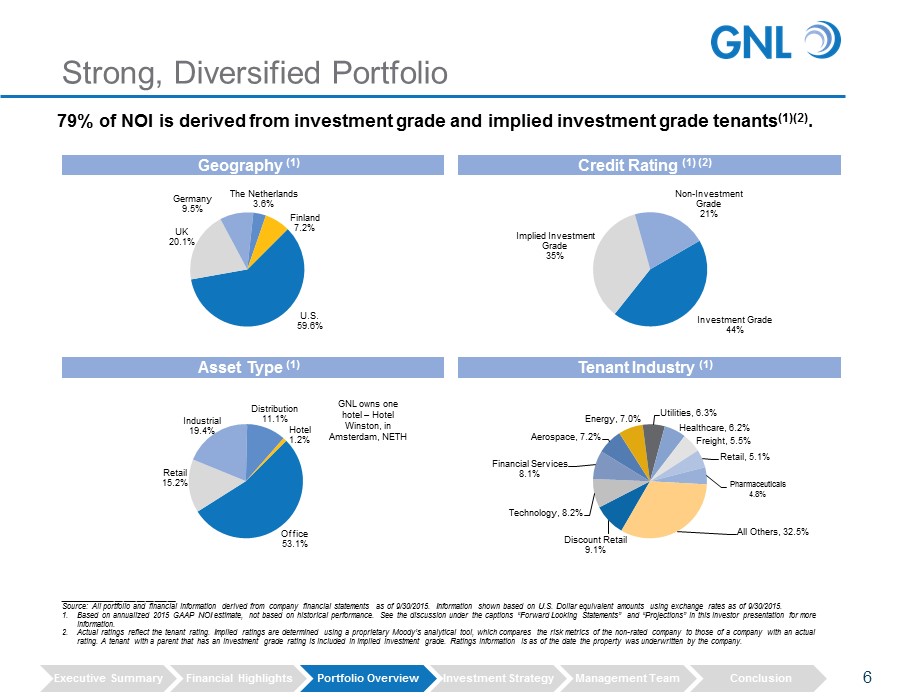
Strong, Diversified Portfolio ___________________________ Source: All portfolio and financial information derived from company financial statements as of 9/30/2015 . Information shown based on U.S. Dollar equivalent amounts using exchange rates as of 9/30/2015 . 1. Based on annualized 2015 GAAP NOI estimate, not based on historical performance. See the discussion under the captions “Forwa rd Looking Statements” and “Projections” in this investor presentation for more information. 2. Actual ratings reflect the tenant rating. Implied ratings are determined using a proprietary Moody’s analytical tool, which compares the risk metrics of the non - rated company to those of a company with an actual r ating . A tenant with a parent that has an investment grade rating is included in implied investment grade. Ratings information is as of the date the property was underwritten by the company. Investment Grade 44% Implied Investment Grade 35% Non - Investment Grade 21% Credit Rating (1) (2) Tenant Industry (1) 79% of NOI is derived from investment grade and implied investment grade tenants (1)(2) . 6 U.S. 59.6% UK 20.1% Germany 9.5% The Netherlands 3.6% Finland 7.2% Geography (1) Office 53.1% Retail 15.2% Industrial 19.4% Distribution 11.1% Hotel 1.2% Asset Type (1) GNL owns one hotel – Hotel Winston, in Amsterdam, NETH Discount Retail 9.1% Technology , 8.2% Financial Services 8.1% Aerospace , 7.2% Energy , 7.0% Utilities , 6.3% Healthcare , 6.2% Freight , 5.5% Retail , 5.1% Pharmaceuticals 4.8% All Others, 32.5% Executive Summary Financial Highlights Portfolio Overview Investment Strategy Management Team Conclusion
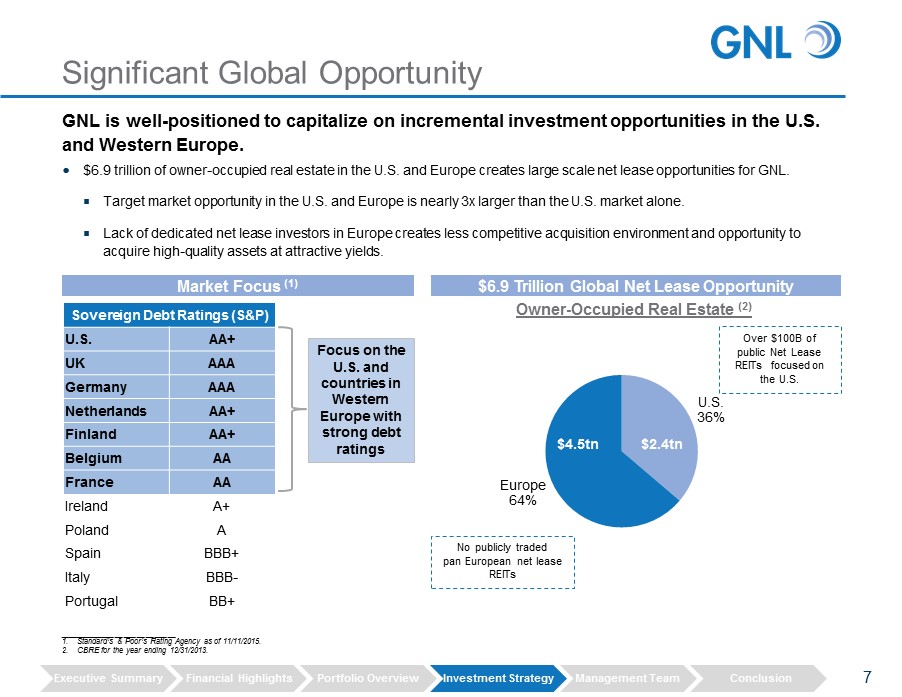
Significant Global Opportunity GNL is well - positioned to capitalize on incremental investment opportunities in the U.S. and Western Europe. Sovereign Debt Ratings (S&P) U.S. AA+ UK AAA Germany AAA Netherlands AA+ Finland AA+ Belgium AA France AA Ireland A+ Poland A Spain BBB+ Italy BBB - Portugal BB+ ___________________________ 1. Standard’s & Poor’s Rating Agency as of 11/11/2015. 2. CBRE for the year ending 12/31/2013. Focus on the U.S. and countries in Western Europe with strong debt ratings Owner - Occupied Real Estate (2) $6.9 Trillion Global Net Lease Opportunity $6.9 trillion of owner - occupied real estate in the U.S. and Europe creates large scale net lease opportunities for GNL. Target market opportunity in the U.S. and Europe is nearly 3x larger than the U.S. market alone. Lack of dedicated net lease investors in Europe creates less competitive acquisition environment and opportunity to acquire high - quality assets at attractive yields. Market Focus (1) U.S. 36% Europe 64% 7 $2.4tn $4.5tn No publicly traded pan European net lease REITs Over $100B of public Net Lease REITs focused on the U.S. Executive Summary Financial Highlights Portfolio Overview Investment Strategy Management Team Conclusion

Focused Investment Strategy Creates Value U.S ., UK , Germany, Finland , Belgium, Netherlands, Luxembourg and France Tenant Credit Quality Geography Real Estate / Market Fundamentals Asset Type Investment Strategy – Key Criteria Competitive advantage analysis Business model evaluation Tenant credit review Real Estate financial analysis Review & benchmark underlying asset level trading performance Key due diligence metrics – valuation, technical, insurance, legal, tax, accounting Disciplined Acquisition Process Total Net Lease Deals Evaluated (1) : ~ $19.7 billion Total Net Lease Acquisitions (1) : ~ $2.6 billion Total Net Lease LOIs Submitted (1) : ~$6.8 billion 8 Structure & Pricing Single tenant, net lease, income producing, commercial properties Corporate headquarters or other mission critical assets Long - term leases tied to inflation indices for annual increases Maximize differential between cap rates and cost of funding Well - defined investment strategy and rigorous underwriting process used to assemble high - quality, long duration, diversified, net lease property portfolio in the U.S. and Europe. 1. Figures represent Global Net Lease’s total evaluations. Executive Summary Financial Highlights Portfolio Overview Investment Strategy Management Team Conclusion
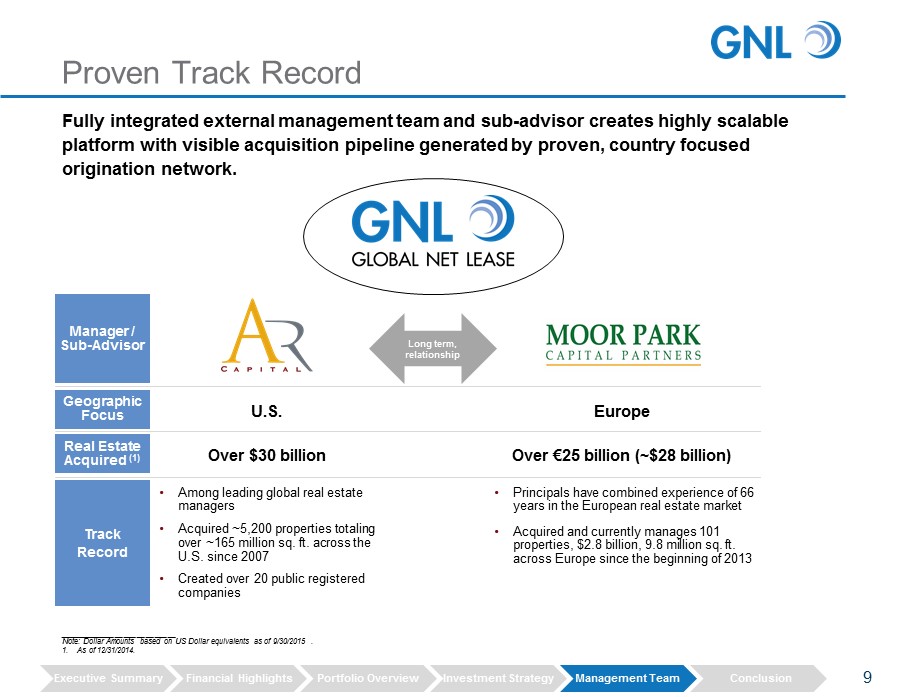
Proven Track Record Over € 25 billion (~$28 billion) Over $30 billion • Principals have combined experience of 66 years in the European real estate market • Acquired and currently manages 101 properties, $2.8 billion, 9.8 million sq. ft. across Europe since the beginning of 2013 • Among leading global real estate managers • Acquired ~5,200 properties totaling over ~165 million sq. ft. across the U.S. since 2007 • Created over 20 public registered companies Long term, relationship ___________________________ Note: Dollar Amounts based on US Dollar equivalents as of 9/30/2015 . 1. As of 12/31/2014. Fully integrated external management team and sub - advisor creates highly scalable platform with visible acquisition pipeline generated by proven, country focused origination network. Europe U.S. Manager / Sub - Advisor Geographic Focus Real Estate Acquired (1) Track Record 9 Executive Summary Financial Highlights Portfolio Overview Investment Strategy Management Team Conclusion

Internalized Advantages Embedded in an External Structure 10 Appropriate, Cost Efficient Fees Management fee capped based on AUM; cap as a percentage of AUM is reduced as GNL grows More cost efficient given GNL’s current size Long - term management agreement provides shareholders with advantages historically only associated with internal management structures. Performance Standards Board Control Board of Directors has the ability to request a change of underperforming senior managers Board of Directors sets annual performance objectives; failure to achieve objectives provides board with the right to terminate the management agreement Termination Rights Upon change - of - control Upon failure to achieve performance objectives For cause Alignment of Interests Incentive fees paid 50% cash / 50% stock Leveraging Advisor’s Platform Increased depth of management and support capabilities Management agreement provides GNL with access to a larger team than it could assemble under a fully internalized structure Executive Summary Financial Highlights Portfolio Overview Investment Strategy Management Team Conclusion

• Initial base fee of $18mm per annum (implied 0.75% of AUM) (1) • To be increased by 1.25% on new equity raised • Eliminated acquisition fees, financing fees, and reimbursement of internal acquisition expenses (2) • Incentive fee tied to Core AFFO (3) 15% of Core AFFO in excess of $0.78 per share and up to $1.02 per share (4) 25% of Core AFFO in excess of $1.02 per share Incentive fee hurdles expected to be increased by 1% – 3% annually Incentive fee will be paid 50% in cash and 50% in stock, with lock - ups expiring over a 3 - year period • 0.75% of AUM to be reduced by 0.03% for every additional $1 billion of AUM above $3 billion to a floor of 0.40% • Notwithstanding the foregoing, if AUM exceeds $10 billion, the fee cap will be subject to a floor of the lesser of 0.50% or the comparable G&A load of a peer set to be determined in good faith by the Board • Total fees are subject to a cap of 1.25% of AUM until the Company reaches $5 billion of AUM, after which the cap reduces linearly until AUM reaches $15 billion, at which the cap would be 0.95% of AUM (5) • Initial Term of 20 years • Following the Initial Term, automatically renewed for successive 5 - year terms Management Agreement – Summary Terms Base Management Fee Incentive Fee Base Management Fee Cap Total Fee Cap Duration 11 ___________________________ 1. Based on AUM at listing on 6/2/2015 2. GNL covers third party Acquisition Expenses. 3. Core AFFO is a non - GAAP performance metric. See the discussion under the caption “Definitions” in this investor presentation for managements’ discussion regarding non - GAAP metrics. 4. Reflects Listing Tender adjustment. 5. Base management fee plus incentive fee. Executive Summary Portfolio Overview Investment Strategy Management Team Financial Overview Conclusion

Assembled high - quality net lease property portfolio Originated all assets in portfolio Established local presence and expertise in our markets Designed cost - effective management structure Created in - place hedges to mitigate currency risk Pursuing pragmatic, steady growth Conclusion RWE – North Rhine, Germany Western Digital - San Jose, CA GSA - International Falls, MN Provident Financial - Bradford, UK 12 Executive Summary Financial Highlights Portfolio Overview Investment Strategy Management Team Conclusion

The Platform

Experienced Management Team Executive Management Team Moor Park Capital Shemeel Khan Chief Executive Officer / Co - Founder 22 years of real estate experience Previously served as partner in the European Funds Group at Nomura Also worked in Real Estate Investment Banking at Bankers Trust Jagdeep Kapoor Co - Founder 14 years of real estate experience Previously served as a partner in the European Funds Group and Head of Strategic Platforms in the Asset Finance Group at Nomura Also worked in the Real Estate Investment Banking Group at Credit Suisse First Boston and the Interest Rate Swaps division at JP Morgan Gary Wilder Chairman / Co - Founder Over 29 years of real estate experience Previously served as Managing Partner and Co - Head of the European Funds Group at Nomura Also served as Managing Director and Co - Head of Real Estate Investment Banking at Credit Suisse First Boston and Managing Director in the Real Estate Group at Bankers Trust 14 Scott Bowman Chief Executive Officer Previously held executive leadership positions for over 25 years at industry leading global companies including The Jones Group, Ralph Lauren and LVMH Served as an independent director of ARC Global Trust from launch until September 2014 when he joined ARC Global Trust’s management team as CEO Andrew Winer President and Chief Investment Officer 23 years of real estate finance experience Previously led teams in Commercial Real Estate Finance at Credit Suisse in CMBS syndication and distribution, loan pricing and hedging and asset management Patrick Goulding Chief Financial Officer 25 years of experience in real estate finance accounting and operations Previously served as Managing Director and Global Head of Portfolio Management for Morgan Stanley’s opportunistic real estate platform Prior to joining Morgan Stanley, served as Managing Director at Strategic Value Partners, a global alternative investment firm Externally advised by AR Capital and Moor Park, providing a best in class management team across the U.S. and Europe.
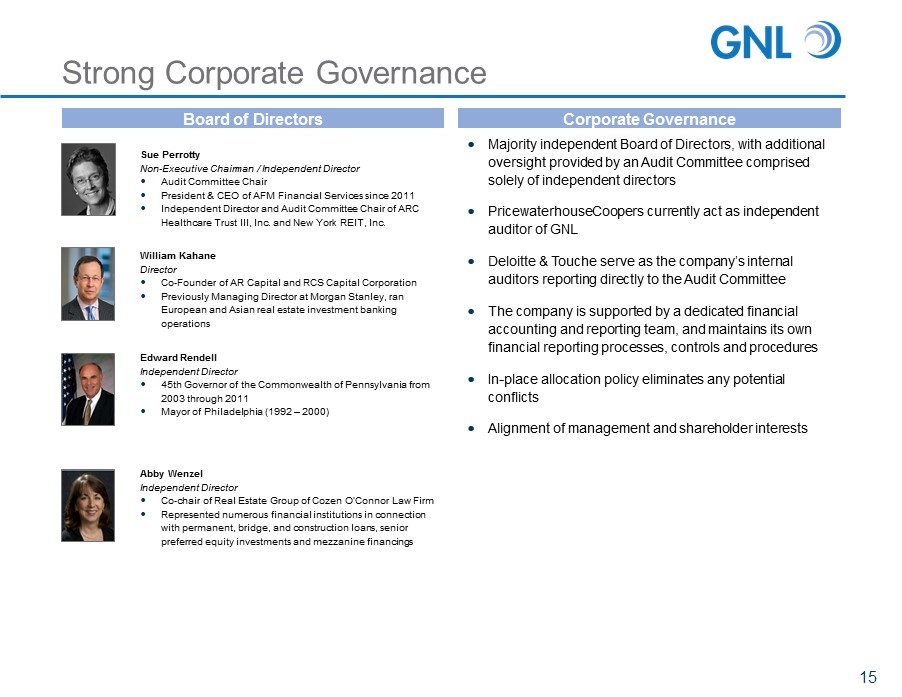
Majority independent Board of Directors , with additional oversight provided by an Audit Committee comprised solely of independent directors PricewaterhouseCoopers currently act as independent auditor of GNL Deloitte & Touche serve as the company’s internal auditors reporting directly to the Audit Committee The company is supported by a dedicated financial accounting and reporting team, and maintains its own financial reporting processes, controls and procedures In - place allocation policy eliminates any potential conflicts Alignment of management and shareholder interests Strong Corporate Governance 15 Board of Directors William Kahane Director Co - Founder of AR Capital and RCS Capital Corporation Previously Managing Director at Morgan Stanley, ran European and Asian real estate investment banking operations Edward Rendell Independent Director 45th Governor of the Commonwealth of Pennsylvania from 2003 through 2011 Mayor of Philadelphia (1992 – 2000) Abby Wenzel Independent Director Co - chair of Real Estate Group of Cozen O’Connor Law Firm Represented numerous financial institutions in connection with permanent, bridge, and construction loans, senior preferred equity investments and mezzanine financings Sue Perrotty Non - Executive Chairman / Independent Director Audit Committee Chair President & CEO of AFM Financial Services since 2011 Independent Director and Audit Committee Chair of ARC Healthcare Trust III, Inc. and New York REIT, Inc. Corporate Governance

Shameel Kahn CEO Gary Wilder Executive Chairman Jagdeep Kapoor CIO Moor Park Investment Committee Germany United Kingdom Nordics Benelux France Michael Glaser Illias Harcha Javier paz Valibuena Lars Von der Berg Greg Smith Veronia Baldi Diego Voss Mike Pille Jamal Dutheil Rodolphe De Clermont - Tonnerre Brian Mansouri Vice President Kyle Gray Analyst Audrey Ellis Vice President Lucas O’Connor Analyst U.S. Team GNL Board of Directors Synergistic Value: Advisory Services Group Operations Investor Relations Accounting Legal Due Diligence IT Marketing Human Resources Financing Asset Management William Kahane Director Edward Rendell Independent Sue Perrotty Exec. Chairman GNL Management Team / Investment Committee Scott Bowman CEO Andrew Winer President & CIO Patrick Goulding CFO Broad, Multi - Disciplinary Acquisition Footprint Abby Wenzel Independent 16

I NSTITUTIONS A DVISORS D EVELOPERS R ELATIONSHIP B ROKERAGE F IRMS “B AD B ANK ” D EBT P OOLS Origination network targeted to transactions with advantaged position Disciplined and rigorous approach to underwriting Capacity to underwrite complexity and structure creatively Portfolios / large - scale transactions Investments with embedded value drivers Organizational scale and large footprint drives sourcing Country focused investment teams – local relationships Strong reputation with vendors Extensive market knowledge Execution experience across all real estate asset classes Ability to deliver with speed and volume in markets lacking institutional liquidity Superior Sourcing Network 17
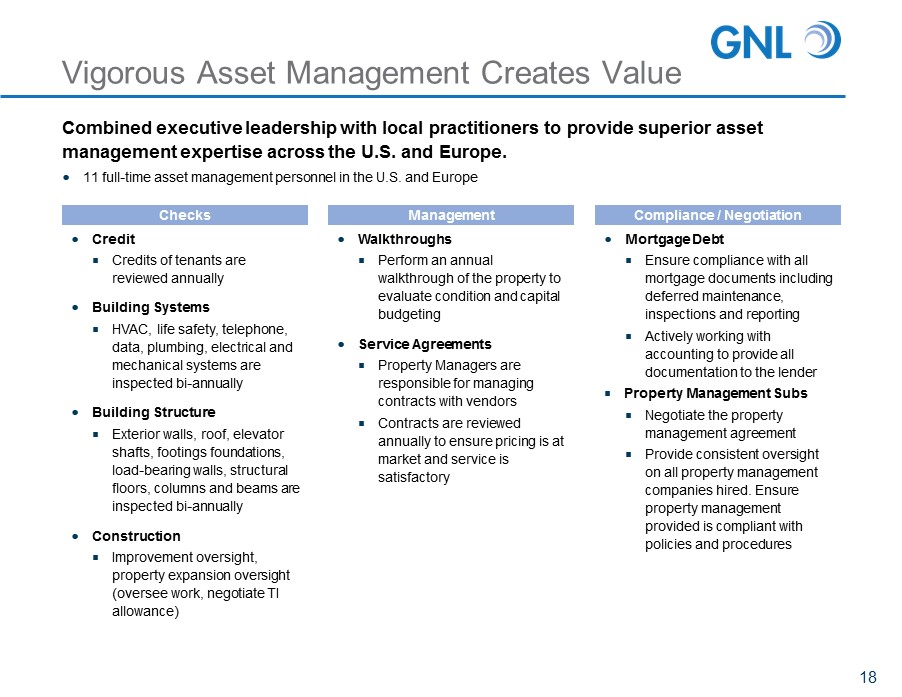
Vigorous Asset Management Creates Value 11 full - time asset management personnel in the U.S. and Europe Combined executive leadership with local practitioners to provide superior asset management expertise across the U.S. and Europe. 18 Checks Compliance / Negotiation Management Credit Credits of tenants are reviewed annually Building Systems HVAC, life safety, telephone, data, plumbing, electrical and mechanical systems are inspected bi - annually Building Structure Exterior walls, roof, elevator shafts, footings foundations, load - bearing walls, structural floors, columns and beams are inspected bi - annually Construction Improvement oversight, property expansion oversight (oversee work, negotiate TI allowance) Walkthroughs Perform an annual walkthrough of the property to evaluate condition and capital budgeting Service Agreements Property Managers are responsible for managing contracts with vendors Contracts are reviewed annually to ensure pricing is at market and service is satisfactory Mortgage Debt Ensure compliance with all mortgage documents including deferred maintenance, inspections and reporting Actively working with accounting to provide all documentation to the lender Property Management Subs Negotiate the property management agreement Provide consistent oversight on all property management companies hired. Ensure property management provided is compliant with policies and procedures

Legal Notices
Forward Looking Statements The statements in this presentation that are not historical facts may be forward - looking statements . These forward - looking statements involve risks and uncertainties that could cause actual results or events to be materially different . Forward - looking statements may include but are not limited to, statements regarding stockholder liquidity and investment value and returns . The words “anticipates,” believes,” “expects,” “estimates,” “projects,” “plans,” “intends,” “may,” “will,” “would” and similar expressions are intended to identify forward - looking statements, although not all forward - looking statements contain these identifying words . Actual results may differ materially from those contemplated by such forward - looking statements, including those set forth in the Risk Factors section of our Annual Report on Form 10 - K filed on April 3 , 2015 . Further, forward - looking statements speak only as of the date they are made, and we undertake no obligation to update or reverse any forward - looking statement to reflect changed assumptions, the occurrence of anticipated events on changes to future operation results, unless required to do so by law . 20

Risk Factors All of our executive officers are also officers of our Advisor and other American Realty Capital - affiliated entities. As a resu lt, our executive officers, our Advisor and its affiliates face conflicts of interest, including significant conflicts created by our Advisor’s co mpensation arrangements with us and other investment programs advised by American Realty Capital affiliates and conflicts in allocating time among th ese investment programs and us. These conflicts could result in unanticipated actions. Because investment opportunities that are suitable for us may also be suitable for other American Realty Capital - advised invest ment programs, our Advisor and its affiliates face conflicts of interest relating to the purchase of properties and other investments and su ch conflicts may not be resolved in our favor, meaning that we could invest in less attractive assets, which could reduce the investment return to ou r s tockholders. We may be unable to pay or maintain cash dividends or increase dividends over time. We are obligated to pay fees which may be substantial to our Advisor and its affiliates. We depend on tenants for our rental revenue and, accordingly, our rental revenue is dependent upon the success and econom ic viability of our tenants. Increases in interest rates could increase the amount of our debt payments and limit our ability to pay dividends to our stoc kh olders. We may not generate cash flows sufficient to pay dividends to our stockholders, as such, we may be forced to borrow at unfavo ra ble rates or depend on our Advisor to waive reimbursement of certain expense and fees to fund our operations. There is no assurance that o ur Advisor will waive reimbursement of expenses or fees. Any of these dividends may reduce the amount of capital we ultimately invest in properties and other permitted investments an d negatively impact the value of our common stock. We are subject to risks associated with our international investments, including risks associated with compliance with and ch an ges in foreign laws, fluctuations in foreign currency exchange rates and inflation. We are subject to risks associated with any dislocations or liquidity disruptions that may exist or occur in the credit marke ts of the United States of America and Europe from time to time. We may fail to qualify, or continue to qualify, to be treated as a real estate investment trust for U.S. federal income tax p ur poses, which would result in higher taxes, may adversely affect operations and would reduce our NAV and cash available for dividends. We may be deemed to be an investment company under the Investment Company Act of 1940 , as amended (“the Investment Company A ct ”) and thus subject to regulation under the Investment Company Act. We may be exposed to risks due to a lack of tenant diversity, investment types and geographic diversity. We may be exposed to changes in general economic, business and political conditions, including the possibility of intensified i nternational hostilities, acts of terrorism, and changes in conditions of United States of America or international lending, capital and f ina ncing markets. The following are some of the risks and uncertainties, although not all risks and uncertainties, that could cause our actual res ults to differ materially from those presented in our forward - looking statements : 21
Projections This presentation includes estimated projections of future operating results . These projections were not prepared in accordance with published guidelines of the SEC or the guidelines established by the American Institute of Certified Public Accountants for preparation and presentation of financial projections . This information is not fact and should not be relied upon as being necessarily indicative of future results ; the projections were prepared in good faith by management and are based on numerous assumptions that may prove to be wrong . Important factors that may affect actual results and cause the projections to not be achieved include, but are not limited to, risks and uncertainties relating to the company and other factors described under “Risk Factors” section of the Company’s Annual Report on Form 10 - K dated April 3 , 2015 and any subsequent Quarterly Reports on Form 10 - Q or Current Reports on Form 8 - K and “Forward - Looking Statements . ” The projections also reflect assumptions as to certain business decisions that are subject to change . As a result, actual results may differ materially from those contained in the estimates . Accordingly, there can be no assurance that the estimates will be realized . This presentation also contains estimates and information concerning our industry, including market position, market size, and growth rates of the markets in which we participate, that are based on industry publications and reports . This information involves a number of assumptions and limitations, and you are cautioned not to give undue weight to these estimates . We have not independently verified the accuracy or completeness of the data contained in these industry publications and reports . The industry in which we operate is subject to a high degree of uncertainty and risk due to variety of factors, including those described in the “Risk Factors” section of the Company’s Annual Report on Form 10 - K dated April 3 , 2015 and any subsequent Quarterly Reports on Form 10 - Q or Current Reports on Form 8 - K . These and other factors could cause results to differ materially from those expressed in these publications and reports . 22
Definitions 23 Funds from operations (“FFO”) Due to certain unique operating characteristics of real estate companies, as discussed below, the National Association of Real Estate Investment Trusts ("NAREIT"), an industry trade group, has promulgated a measure known as funds from operations ("FFO"), which we believe to be an appropriate supplemental measure to reflect the operating performance of a REIT . The use of FFO is recommended by the REIT industry as a supplemental performance measure . FFO is not equivalent to net income or loss as determined under accounting principles generally accepted in the United States ("GAAP ") . We define FFO, a non - GAAP measure, consistent with the standards established by the White Paper on FFO approved by the Board of Governors of NAREIT, as revised in February 2004 (the "White Paper") . The White Paper defines FFO as net income or loss computed in accordance with GAAP, excluding gains or losses from sales of property but including asset impairment writedowns , plus depreciation and amortization, and after adjustments for unconsolidated partnerships and joint ventures . Adjustments for unconsolidated partnerships and joint ventures are calculated to reflect FFO . Our FFO calculation complies with NAREIT's definition . The historical accounting convention used for real estate assets requires straight - line depreciation of buildings and improvements, and straight - line amortization of intangibles, which implies that the value of a real estate asset diminishes predictably over time, especially if not adequately maintained or repaired and renovated as required by relevant circumstances or as requested or required by lessees for operational purposes in order to maintain the value disclosed . We believe that, because real estate values historically rise and fall with market conditions, including inflation, interest rates, the business cycle, unemployment and consumer spending, presentations of operating results for a REIT using historical accounting for depreciation and certain other items may be less informative . Historical accounting for real estate involves the use of GAAP . Any other method of accounting for real estate such as the fair value method cannot be construed to be any more accurate or relevant than the comparable methodologies of real estate valuation found in GAAP . Nevertheless, we believe that the use of FFO, which excludes the impact of real estate related depreciation and amortization, among other things, provides a more complete understanding of our performance to investors and to management, and when compared year over year, reflects the impact on our operations from trends in occupancy rates, rental rates, operating costs, general and administrative expenses, and interest costs, which may not be immediately apparent from net income . However, FFO, core funds from operations ("Core FFO") and adjusted funds from operations (“AFFO”), as described below, should not be construed to be more relevant or accurate than the current GAAP methodology in calculating net income or in its applicability in evaluating our operating performance . The method utilized to evaluate the value and performance of real estate under GAAP should be construed as a more relevant measure of operational performance and considered more prominently than the non - GAAP FFO, Core FFO and AFFO measures and the adjustments to GAAP in calculating FFO, Core FFO and AFFO . Other REITs may not define FFO in accordance with the current NAREIT definition (as we do) or may interpret the current NAREIT definition differently than we do and/or calculate Core FFO and/or AFFO differently than we do . Consequently, our presentation of FFO, Core FFO and AFFO may not be comparable to other similarly titled measures presented by other REITs .

Definitions (cont’d) 24 Funds from operations (“FFO”) (Cont’d) We consider FFO, Core FFO and AFFO useful indicators of our performance . Because FFO calculations exclude such factors as depreciation and amortization of real estate assets and gains or losses from sales of operating real estate assets (which can vary among owners of identical assets in similar conditions based on historical cost accounting and useful - life estimates), FFO facilitates comparisons of operating performance between periods and between other REITs in our peer group . Changes in the accounting and reporting promulgations under GAAP (for acquisition fees and expenses from a capitalization/depreciation model to an expensed - as - incurred model) that were put into effect in 2009 and other changes to GAAP accounting for real estate subsequent to the establishment of NAREIT's definition of FFO have prompted an increase in cash - settled expenses, specifically acquisition fees and expenses for all industries as items that are expensed under GAAP, that are typically accounted for as operating expenses . Core adjusted funds from operations (“Core AFFO”) Core FFO is FFO, excluding acquisition and transaction related costs as well as certain other costs that are considered to be non - core, such as charges relating to the Listing Note and listing related fees . The purchase of properties, and the corresponding expenses associated with that process, is a key operational feature of our business plan to generate operational income and cash flows in order to make dividend payments to stockholders . In evaluating investments in real estate, we differentiate the costs to acquire the investment from the operations derived from the investment . By excluding expensed acquisition and transaction related costs as well as non - core costs, we believe Core FFO provides useful supplemental information that is comparable for each type of real estate investment and is consistent with management's analysis of the investing and operating performance of our properties .

Definitions (cont’d) Adjusted funds from operations (“AFFO”) We exclude certain income or expense items from AFFO that we consider more reflective of investing activities, other non - cash income and expense items and the income and expense effects of other activities that are not a fundamental attribute of our business plan . These items include unrealized gains and losses, which may not ultimately be realized, such as gains or losses on contingent valuation rights, gains and losses on investments and early extinguishment of debt . We also exclude dividends on Class B Units as the related shares are assumed to have converted to common stock in our calculation of fully diluted weighted average shares of common stock . In addition, by excluding non - cash income and expense items such as amortization of above - market and below - market leases intangibles, amortization of deferred financing costs, straight - line rent and equity - based compensation from AFFO, we believe we provide useful information regarding income and expense items which have no cash impact and do not provide liquidity to the company or require capital resources of the company . By providing AFFO, we believe we are presenting useful information that assists investors and analysts to better assess the sustainability of our ongoing operating performance without the impacts of transactions that are not related to the ongoing profitability of our portfolio of properties . We also believe that AFFO is a recognized measure of sustainable operating performance by the REIT industry . Further, we believe AFFO is useful in comparing the sustainability of our operating performance with the sustainability of the operating performance of other real estate companies that are not making a significant number of acquisitions . Investors are cautioned that AFFO should only be used to assess the sustainability of our operating performance excluding these activities, as it excludes certain costs that have a negative effect on our operating performance during the periods in which these costs are incurred . In calculating AFFO, we exclude certain expenses, which under GAAP are characterized as operating expenses in determining operating net income . These expenses are paid in cash by us, and therefore such funds will not be available to distribute to investors . All paid and accrued merger, acquisition and transaction related fees and certain other expenses negatively impact our operating performance during the period in which expenses are incurred or properties are acquired will also have negative effects on returns to investors, the ability to fund dividends or distributions in the future, and cash flows generated by us, unless earnings from operations or net sales proceeds from the disposition of other properties are generated to cover the purchase price of the property and certain other expenses . AFFO that excludes such costs and expenses would only be comparable to companies that did not have such activities . Further, under GAAP, certain contemplated non - cash fair value and other non - cash adjustments are considered operating non - cash adjustments to net income in determining cash flow from operating activities . In addition, we view fair value adjustments as items which are unrealized and may not ultimately be realized . We view both gains and losses from fair value adjustments as items which are not reflective of ongoing operations and are therefore typically adjusted for when assessing operating performance . Excluding income and expense items detailed above from our calculation of AFFO provides information consistent with management's analysis of the operating performance of the properties . Additionally, fair value adjustments, which are based on the impact of current market fluctuations and underlying assessments of general market conditions, but can also result from operational factors such as rental and occupancy rates, may not be directly related or attributable to our current operating performance . By excluding such changes that may reflect anticipated and unrealized gains or losses, we believe AFFO provides useful supplemental information . 25

Definitions (cont’d) 26 Adjusted Earnings before Interest, Taxes, Depreciation and Amortization, Net Operating Income, Cash Net Operating Income and Adjusted Cash Net Operating Income . We believe that earnings before interest, taxes, depreciation and amortization adjusted for acquisition and transaction - related expenses, other non - cash items and including our pro - rata share from unconsolidated joint ventures ("Adjusted EBITDA") is an appropriate measure of our ability to incur and service debt . Adjusted EBITDA should not be considered as an alternative to cash flows from operating activities, as a measure of our liquidity or as an alternative to net income as an indicator of our operating activities . Other REITs may calculate Adjusted EBITDA differently and our calculation should not be compared to that of other REITs . Net operating income ("NOI") is a non - GAAP financial measure equal to net income (loss), the most directly comparable GAAP financial measure, less discontinued operations, interest, other income and income from preferred equity investments and investment securities, plus corporate general and administrative expense, acquisition and transaction - related expenses, depreciation and amortization, other non - cash expenses and interest expense . NOI is adjusted to include our pro rata share of NOI from unconsolidated joint ventures . We use NOI internally as a performance measure and believe NOI provides useful information to investors regarding our financial condition and results of operations because it reflects only those income and expense items that are incurred at the property level . Therefore, we believe NOI is a useful measure for evaluating the operating performance of our real estate assets and to make decisions about resource allocations . Further, we believe NOI is useful to investors as a performance measure because, when compared across periods, NOI reflects the impact on operations from trends in occupancy rates, rental rates, operating costs and acquisition activity on an unlevered basis, providing perspective not immediately apparent from net income . NOI excludes certain components from net income in order to provide results that are more closely related to a property's results of operations . For example, interest expense is not necessarily linked to the operating performance of a real estate asset and is often incurred at the corporate level as opposed to the property level . In addition, depreciation and amortization, because of historical cost accounting and useful life estimates, may distort operating performance at the property level . NOI presented by us may not be comparable to NOI reported by other REITs that define NOI differently . We believe that in order to facilitate a clear understanding of our operating results, NOI should be examined in conjunction with net income (loss) as presented in our consolidated financial statements . NOI should not be considered as an alternative to net income (loss) as an indication of our performance or to cash flows as a measure of our liquidity . Cash NOI is NOI presented on a cash basis, which is NOI after eliminating the effects of straight - lining of rent and the amortization of above and below market leases .