Attached files
| file | filename |
|---|---|
| EX-23.2 - EXHIBIT 23.2 - Fuda Group (USA) Corp | v424806_ex23-2.htm |
| EX-23.1 - EXHIBIT 23.1 - Fuda Group (USA) Corp | v424806_ex23-1.htm |
| As filed with the Securities and Exchange Commission | on Registration No. |
SECURITIES AND EXCHANGE COMMISSION
Washington, D.C. 20549
FORM S-1
REGISTRATION STATEMENT UNDER
THE SECURITIES ACT OF 1933
FUDA GROUP (USA) CORPORATION
(Exact name of registrant as specified in its charter)
SPRUCE VALLEY ACQUISITION CORPORATION
(Former Name of Registrant)
| Delaware | 1041 | 47-2031462 | ||
| State or other jurisdiction | Primary Standard Industrial | (I.R.S. Employer | ||
| incorporation or organization | Classification Code Number) | Identification Number) |
48 Wall Street, 11th Floor
New York 10005, NY, USA
(646) 837-7950
(Address, including zip code, and telephone number, including area code
of registrant’s principal executive offices)
Xiaobin Wu
48 Wall Street, 11th Floor
New York 10005, NY, USA
(646) 837-7950
(Name, address, including zip code, and telephone number,
including area code, of agent for service)
with copies to
Lee W. Cassidy, Esq.
Anthony A. Patel, Esq.
Cassidy & Associates
9454 Wilshire Boulevard
Beverly Hills, California 90212
(949) 673-4510 (tel) / (949) 673-4525 (fax)
Approximate Date of Commencement of proposed sale to the public: As soon as practicable after the effective date of this Registration Statement.
If any of the securities being registered on this Form are to be offered on a delayed or continuous basis pursuant to Rule 415 under the Securities Act of 1933, check the following box. x
If this Form is filed to register additional securities for an offering pursuant to Rule 462(b) under the Securities Act, please check the following box and list the Securities Act registration statement number of the earlier effective registration statement for the same offering. ¨
If this Form is a post-effective amendment filed pursuant to Rule 462(c) under the Securities Act, check the following box and list the Securities Act registration statement number of the earlier registration statement for the same offering. ¨
If this Form is a post-effective amendment filed pursuant to Rule 462(d) under the Securities Act, check the following box and list the Securities Act registration number of the earlier effective registration statement for the same offering. ¨
Indicate by check mark whether the registrant is a large accelerated filer, an accelerated filer, a non-accelerated filer, or a smaller reporting company. See definitions “large accelerated filer,” “accelerated file,” and “smaller reporting company” in Rule 12b-2 of the Exchange Act. (Check one):
| Large accelerated filer | ¨ | Accelerated filed | ¨ |
| Non-accelerated filed | x | Smaller reporting company | ¨ |
The registrant hereby amends this registration statement on such date or dates as may be necessary to delay its effective date until the registrant shall file a further amendment which specifically states that this registration statement shall thereafter become effective in accordance with section 8(a) of the Securities Act of 1933 or until the registration statement shall become effective on such date as the Commission acting pursuant to said section 8(a), may determine.
CALCULATION OF REGISTRATION FEE
| Proposed | ||||||||
| Maximum | Amount of | |||||||
| Title of Each Class of | Aggregate | Registration | ||||||
| Securities to be Registered | Offering Price (1) (2) | Fee | ||||||
| Common Stock, par value | ||||||||
| Par value $0.0001 per share | $ | 200,000,000 | $ | 20,140 | ||||
| (1) | Includes 135, 954,309 shares of Common Stock to be sold. |
| (2) | Estimated solely for the purpose of calculating the registration fee pursuant to Rule 457(o) of the Securities Act of 1933. |
EXPLANATORY NOTE
This registration statement and the prospectus therein cover the registration of 30,000,000 shares offered by the Company and 105,954,309 shares of common stock offered by the holders thereof.
The information contained in this prospectus is not complete and may be changed. A registration statement relating to these securities has been filed with the Securities and Exchange Commission and these securities may not be sold until that registration statement becomes effective. This prospectus is not an offer to sell these securities and it is not soliciting an offer to buy these securities in any state where the offer or sale is not permitted.
| PROSPECTUS | Subject to Completion, Dated ______, 2015 |

FUDA GROUP (USA) CORPORATION
30,000,000 shares of Common Stock offered by the Company at $____ per share
105,954,309 shares of Common Stock offered by selling shareholders at $____ per share
This prospectus relates to the offer and sale of 135,954,309 shares of common stock (the “Shares”) of Fuda Group (USA) Corporation (the “Company”), $0.0001 par value per share, as follows: (a) 30,000,000 Shares offered by the Company and (b) 105,954,309 Shares offered by the holders thereof (the “Selling Shareholder Shares”), who are deemed to be statutory underwriters. No public market currently exists for our common stock.
The Company intends to lists its common stock on NASDAQ when qualified to do so. If available, the Company intends to apply for listing on NASDAQ using the ticker symbol “FUDA” for its common stock.
The maximum number of Shares that can be sold pursuant to the terms of this offering by the selling shareholders is (in aggregate) 105,934,309. Funds received by the selling shareholders will be immediately available to such selling shareholders for use by them. The Company will not receive any proceeds from the sale of the Selling Shareholder Shares.
The maximum number of Shares that can be sold pursuant to the terms of this offering by the Company is (in aggregate) 30,000,000. Funds received by the Company will be immediately available to the Company for use by the Company. Any and all funds received by the Company for sales of Shares by the Company at any time in the offering will be immediately available to the Company. There is no fixed amount or number of Shares that must be reached or sold before any closing or use of any funds can occur.
The Company intends to maintain the current status and accuracy of this prospectus and to allow both the Company and the selling shareholders to offer and sell the Shares for a period of up to two (2) years, unless earlier completely sold, pursuant to Rule 415 of the General Rules and Regulations of the Securities and Exchange Commission. All costs incurred in the registration of the Shares are being borne by the Company. All selling and other expenses incurred by the selling stockholders will be borne by the selling stockholders.
Prior to this offering, there has been no public market for the Company’s common stock. No assurances can be given that a public market will develop following completion of this offering or that, if a market does develop, it will be sustained. The offering price for the Shares has been arbitrarily determined by the Company and does not necessarily bear any direct relationship to the assets, operations, book or other established criteria of value of the Company. The Shares will become tradable on the effective date of the registration statement of which this prospectus is a part.
The Company qualifies as an “emerging growth company” as defined in the Jumpstart Our Business Startups Act which became law in April, 2012 and will be subject to reduced public company reporting requirements. See “The Company: Jumpstart Our Business Startups Act” contained herein.
Neither the Company nor any selling shareholders has any current arrangements or has entered into any agreements with any underwriters, broker-dealers or selling agents for the sale of the Shares. If the Company or the selling shareholders, respectively, can locate and enter into any such arrangement(s), the Shares will be sold through such licensed underwriter(s), broker-dealer(s) and/or selling agent(s).
Assumed Price
To Public
Per Common Stock Share
Offered by Company
NEITHER THE SECURITIES AND EXCHANGE COMMISSION NOR ANY STATE SECURITIES COMMISSION HAS APPROVED OR DISAPPROVED OF THESE SECURITIES OR PASSED UPON THE ADEQUACY OR ACCURACY OF THIS PROSPECTUS. ANY REPRESENTATION TO THE CONTRARY IS A CRIMINAL OFFENSE.
These securities involve a high degree of risk. See “RISK FACTORS” contained in this prospectus beginning on page 26.
48 Wall Street, 11th Floor
New York 10005, NY, USA
(646) 837-7950
Prospectus dated __________________, 2015
TABLE OF CONTENTS
| 2 |
This summary highlights some information from this prospectus, and it may not contain all the information important to making an investment decision. A potential investor should read the following summary together with the more detailed information regarding the Company and the common stock being sold in this offering, including “Risk Factors” and the financial statements and related notes, included elsewhere in this prospectus.
The Company
The Company, primarily focused on the Manchuria region of Northeastern China, is an international conglomerate focused on three thriving channels:
| · | Gold & Precious Metal, Granite/Marble Trading; |
| · | Mining and Processing of Gold & Precious Metal, Granite/Marble; |
| · | Mergers and Acquisitions Projects. |
It is an emergent gold resources company seeking to develop and operate a portfolio of natural assets with reserves of gold and precious metals. The Company seek properties with known mineralization that are in an advance stage of exploration and have previously undergone some drilling but are under-explored, which the Company believe can advance quickly to increase value. The Company further diversifies into the construction commodities, such as granite and marble, through established vendor and supplier networks. The Company is continually expanding and strengthening its upstream asset resources by acquiring and exploring properties in the region. Therefore, the Company is seeking to raise US$1BN through private investments in exchange for 70% equity. The company will obtain these funds through tranches with fund raising round set at $200M.
Corporate History
Since its 2012 launch, the Company has successfully managed to increase its net worth to over $1.5 billion. Established in August 2012, the Company started as a natural resource trading company, with operations concentrated in an area around Dandong City, Liaoning Province, situated in the Manchuria region of Northeast China. A large percentage of the Company’s customers are industrial wholesalers, government agencies undertaking infrastructure or similar upgrading projects, corporations, renovators and construction companies, as well as stone processing factories. The Company also sells finished products for direct sales to civil engineering construction projects, corporations, and government agencies.
Subsequently, the Company was incorporated in the State of Delaware in September 2014, and was initially known as the Spruce Valley Acquisition Corporation (“Spruce Valley”). In February 2015, Spruce Valley then changed its name to Fuda Group (USA) Corporation. Thereafter, the Company, in a series of acquisitions (collectively known as the “Acquisitions”), beginning from September 2015 and completed on September 28, 2015, has entered into stock-for-stock acquisition agreements with two companies: Fuda Gold (UK) Limited, (“Fuda UK”), a private company organized under the laws of England and Wales, and Marvel Investment Corporation Limited, (“Marvel”), a private company organized under the laws of Hong Kong.
The Company was established for the purpose of achieving synergy with Fuda UK and Marvel by combining their businesses, organizations, operations, assets and resources. Following agreements from all the parties, the aforementioned Acquisitions have resulted in both Fuda UK and Marvel becoming wholly owned subsidiaries of the Company, the surviving entity. The Company has thereby inherited the respective operations and business plans of both Fuda UK and Marvel.
In October 2009, Marvel was incorporated in Hong Kong. Since its inception, Marvel had conducted minimal business operations until it had acquired Liaoning Fuda Mining Co. Ltd., (“Liaoning Fuda”), which was previously incorporated in China in August 2012, pursuant to an equity transfer agreement executed on February 28, 2015 and later consummated on June 30, 2015. Liaoning Fuda was a granite and marble trading company. With Marvel being a wholly owned subsidiary, the Company now has the ability to diversify its operations into the profitable granite and marble business of the construction material industry.
In May 2015, Fuda UK was incorporated in the United Kingdom, and at its inception, Fuda UK had conducted minimal business operations. Following the Acquisitions, which joined Fuda UK with the organization, the Company has been purchasing gold resources and operating wholesale business of gold bars. The Company is currently focusing on the acquisition and exploration of viable mines in Northeastern China, and preparing to advance to the next level by commencing the drilling or extraction of the aforementioned surveyed properties.
The Company is headquartered at 48 Wall Street, 11th Floor, New York 10005, NY, USA. The main phone number of the Company is (646) 837-7950.
Business Operations
The Company, focused on the Manchuria region of Northeast China, is an emergent gold resources company seeking to develop and operate a portfolio of natural assets with reserves of gold and precious metals. The Company further diversifies into the construction commodities, such as granite and marble, through developed vendor and supplier networks. The Company through the acquisition of Marvel continues to expand and strengthen its upstream asset resources by acquiring and exploring undeveloped mining properties in the region.
Since July of 2015, the Company has been exploring, planning, negotiating and engaging in gold trading and processing activities with the vision to execute its main business strategy or mission to purchase gold mining assets and facilities. Specifically, the Company is identifying and purchasing properties in an advanced stage of exploration with known gold or precious mineral deposits. The priority is on locations with certain degrees of drilling, but are under explored, which could rapidly increase in value. An ancillary part of the strategy is to explore merger and acquisition opportunities with other companies in the industry.
At the current preliminary stage of gold and precious metals operations, the Company is purchasing gold ores, powder or sand from various suppliers with the intention to either trade on these or appoint a subcontractor to further extract and process them into bars or other refined products. These gold powder and ores are sourced from other gold mines around China and Africa. This interim gold bar processing operation assists the Company to transition to actual mining of its acquired mines in the near future.
| 3 |
The Company’s management believes that the market demand for natural resources, such as gold, granite and marble, will continue to increase. Gold and other precious metals are commodities and will thereby experience times of high and low trading values, but the demand for it as a commodity would be ever present. The same could be said for granite and marble, which would be additionally affected by the economy in terms of the construction industry.
As for the Company’s diversification into marble and granite industry, the Company is executing plans to acquire an open-pit granite mine that employs saw-cutting methods to remove large granite blocks from the quarry. In addition, the Company is also preparing to further process the raw blocks into slabs, pavers, wall claddings, and carvings. These products can be sold to government agencies for infrastructure projects, corporations, granite processing plants, civil engineering companies as well renovation companies.
Market Opportunity – Mining Acquisition in China1
FUDA Group USA recognizes that a significant opportunity exists in the gold and silver jewelry market. In 2011 Chinese demand for gold (25% of global gold demand) exceeded demand from East Indians (23% of global gold demand) who were previous to that the largest consumers of gold (90.9 metric tons compared to India's 85.6 metric tons, China's represented a doubling over the previous year). That's after China demanded twice as much gold (in the form of bullion imports) as it produced in 2010 (700 tons against 351 tons) a significant feat considering it was by far the largest producer of gold that year. Those trends will ultimately lead to be a larger international role for Chinese mining companies that recognize the market conditions ripe for foreign deals (expanding their gold reach outside of the country). In Shanghai it is rumored that China might launch its own gold tracking Exchange Traded Fund which could spark derivative products demand. At the end of 2014, gold accounted for 58% of jewelry demand. Currently, 57% of this demand is filled from India and China.
Business Strategy
Our business strategy is to widen its market position in the gold mining and trading industry by directly acquiring a number of mines throughout Asia. We seek properties with known mineralization that are in an advanced stage of exploration and have previously undergone some drilling but are under-explored, which we believe we can advance quickly to increase value.
The key success factors in the Mining industry are:
| · | Acquiring explorative mining properties (previously drilled, but under-explored) where the cost of yielding raw materials is less than the market value of those materials; |
| · | Optimizing the company’s value chain; |
| · | Developing a good reputation for transparent business practices and a set of ethics; |
| · | Establishing the Company’s brand name with commodity traders, brokerages and direct buyer; |
| · | Passing savings via the Company’s direct integration through refineries, wholesaling and access to mines; |
| · | Holding a strong track record in supplier - buyer relationship; |
| · | Positioning the Company for future joint ventures and investments; and |
| · | Accessing a highly skilled workforce, as most production activities need to be operated manually in this industry. |
Competition: The 7 Biggest Chinese Mining Companies2
The metals and mining sector in China is represented at the top by large state-owned firms organized to extract and process resources on a provincial or regional scale. The firms in this list mine a wide variety of mineral resources, including coal, bauxite, copper, gold, zinc and iron ore. Most of the companies are also involved in varied business activities that grew out of their mining operations. This list is ranked according to reported revenues in their consolidated financial statements for 2014. Important resource extraction figures from the same year are also noted:
1 World Gold Council. 2013. Gold Demand Trends
2 Investopedia. Sept 2015. Chinese Mining Companies
| 4 |
1) China Shenhua Energy Co. Ltd., (HKSE: 1088-OL.HK), is China's biggest coal mining company by extraction volume, with a reported commercial production of about 306 million tons in 2014. China Shenhua Energy with its subsidiaries and affiliated companies are also engaged in coal chemical processing, power generation and delivery, plus rail and sea transportation businesses. China Shenhua Energy reported a consolidated revenue of $38.8 billion.
2) Jiangxi Copper Co. Ltd. is China's largest copper mining company, and one of its largest gold and silver mining companies. It processed more than 1.3 million tons of refined copper, over 28 tons of gold and 625 tons of silver in 2014. Besides from processing various metals and chemicals, Jiangxi Copper also produces copper products such as copper rods, tubes and foil. Jiangxi Copper reported more than $31 billion in consolidated revenue.
3) Shaanxi Coal and Chemical Industry Group Co. Ltd. is a coal mining and processing conglomerate with operations in electric power generation, iron and steel production, heavy equipment manufacturing and an array of other businesses. The company reported gross coal production of nearly 140 million tons in 2014, making it China's third-biggest coal producer by volume. Consolidated revenue amounted to $28.7 billion. Several subsidiary companies are listed on the Shanghai Stock Exchange, including Shaanxi Coal Industry Co. Ltd. and Shaanxi Construction Machinery Co. Ltd.
4) Aluminum Corporation Of China Ltd., (NYSE: ACH), also known as Chalco, is China's largest bauxite mining company. The company refines bauxite ore into aluminum oxide, known as alumina, which is then sold or further processed into primary aluminum. Chalco is the world's second-largest alumina processor by volume, reporting production of about 13.2 million tons in 2014. Output of primary aluminum was about 3.7 million tons. Chalco also fabricates aluminum products and engages in coal production and power generation businesses. It reported a consolidated revenue of more than $22 billion in 2014.
5) China Coal Energy Co. Ltd., (HKSE: 1898-OL.HK), is China's second-biggest coal mining firm, reporting a production of more than 165 million tons of coal in 2014. The company also produces coal-related chemicals, manufactures specialized coal mining equipment and provides coal mine engineering services to other mining companies. China Coal Energy reported consolidated revenue of more than $11 billion.
6) Yanzhou Coal Mining Co. Ltd., (NYSE: YZC), is a coal mining and processing firm with associated operations in railway transportation, coal chemical production and power generation. It operates twelve coal mines in China and another nine mines in Australia with a total of six additional mines set to enter commercial production by 2016. Total coal production amounted to more than 80 million tons in 2014. Yanzhou’s consolidated revenue was more than $9.4 billion.
7) Zijin Mining Group, (HKSE: 2899-OL.HK), is China's biggest gold producer, second-biggest copper producer and major producer of iron and silver ores. In 2014, it produced 175 tons of gold, 411,000 tons of copper, 3 million tons of iron concentrates and 349 tons of silver. It also mines zinc, tungsten, tin, lead, molybdenum and coal. In addition to its domestic mines, Zijin Mining Group has mining operations in Kyrgyzstan, Tajikistan, South Africa and Russia. It reported a consolidated revenue of more than $9.1 billion.
The Company’s Advantage
Even though the Company has been in operation for only a number of years, it holds certain advantages over its above state-owned competitors. These advantages are:
| · | Experienced management with significant international exposure; |
| · | Outstanding track record in the industry; |
| · | A vertical integration structure that allows the Company to oversee all areas of the supply chain, ensuring smooth operations and the leveraging of synergies; |
| · | Ability to directly access and associate with multiple mines and refineries; |
| · | Willingness to integrate cutting-edge technology directly into mining techniques to marketing strategy; |
| 5 |
SWOT Analysis
SWOT analysis provides us with an opportunity to examine the internal strengths and weaknesses of the Company. It also allows us to examine the opportunities presented to the Company as well as potential threats.
|
Strengths
· Domination of the supply chain · Full control of inventory · Experienced and knowledgeable management team. · Outstanding business strategy · Track record in mining
|
Weaknesses
· Revenues in the industry are cyclical; · Operational challenges in full vertical approach
|
|
Opportunities
· Increase in higher income of target market. · xThe addition of other related products and services.
|
Threats
· Local and emerging competitors. · Market value of materials are highly volatile · Sales tied to economic growth.
|
Mining Operation
Establish Plant and Facilities: The facility will consist of the processing plant itself with a minimum of 3 CIP tanks, mini-laboratory for assay analysis, firing area, office, provision for canteen and the large remaining portion will be designated as a stockyard. Perimeter fence will cover the entire facility for security purposes.
Manufacturing/Production Plan: A truck will deliver products to the plant using 40 to 50kg used sack containers. Processing will be done on a first come first served basis. Prior to completing the processing, an assay analysis will be conducted to ensure fair processing and to determine the expected amount of gold.
Equipment and Technology: The Company will conduct a series of test to assure the optimal functioning of its machineries before any service from clientele shall be accepted. Operations and dry runs shall operate 24 hours from Monday to Sunday, and 365 days a year, with two allotted days reserved every month for maintenance and downtime.
Variable Labor Requirements: General workers need to be strong and physically fit. Supervisors have, at minimum, experience in ore processing or have previously worked in a processing plant. Assistant manager is an engineer with technical knowledge. Chemists need to have knowledge in basic assay and routine analysis.
Inventory Management: The inventory manager must have a thorough understanding of the principles involved in setting stock levels and the core ability to handle the sheer volume of items on a daily basis.
Management Information Systems:
As other industries are demanding management information systems to increase their ability to manage and analyze every aspect of organizational information, mining industry is also witnessing similar demands on technology. It is crucial for the mining companies to make the transition from traditional methods to technology-enabled business processes. Major focus areas for Fuda Group (USA) include:

| · | Knowledge Sharing |
| · | Safety |
| · | Environmental Impact |
| · | Process Improvement |
| · | Remote operations |
| · | Exploration and production techniques |
| · | Asset management |
| · | Efficiency |
| · | Merger and acquisition |
| · | Mine Automation |
| 6 |
Other Operational Concerns
| Ø | Smooth supply and distribution network |
| Ø | On time order fulfillment and congenial customer service |
| Ø | Research and development on periodic basis |
| Ø | Optimum capacity utilization |
| Ø | Development and implementation of standard quality control procedures |
| Ø | Safety, Health, and Environmental Concerns; knowledge and education of employees and workers |
| Ø | Shrinkage |
Development Plans
The Company has the following long term objectives:
| Ø | To become a technological advanced mining company; |
| Ø | To achieve expertise in production through continuous economies of scale; |
| 7 |
| Ø | To build a strong customer base through Management experience in the mining business and networking; |
| Ø | To improve and innovate production techniques through expertise accumulated over time; |
| Ø | To become an active member of World Gold Council; |
| Ø | To impact the Gold industry in total value creation and upholding positive impact of the industry; and |
| Ø | To establish a healthy partnership with stakeholders and winning their trust. |
Growth Strategy: In the mining business, resource replacement and growth is one of the key technical objectives. This can be achieved by direct investment in exploration, or by relying on successful exploration by others, with the intention of subsequent resource acquisition. The Company wishes to expand the exploration base and which shall be possible through investment in the business.
Key Milestones
Milestone
| Start Date | Duration (days) | Manager | ||||
| Obtain Funding | 01-11-15 | 60.00 | Founder | |||
| Secure Contracts | 31-12-15 | 45.00 | Founder | |||
| Initiating Gold Mining & Trading Operations | 14-02-16 | 90.00 | Management Team |
MANAGEMENT TEAM
| 8 |
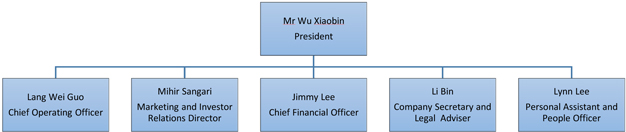
The following is the management team in place for the company.
• Mr. Xiaobin Wu is the President of FUDA Group (USA). He holds a Master of Business Administration Degree from Beijing University. Having been in business for over two decades, he has developed a wide network of business and political contacts in China. He has significant experience providing fiscal, strategic and operational leadership in uniquely challenging situations. Mr. Wu is also a dynamic, results-oriented leader with a strong performance track record.
• Mr. Mihir J. Sangani holds a Degree in Finance from Bombay University, India. Mr. Sangani has significant global marketing & business development experience along with relation investor exposure. Mr. Sangani has managed an over-$200MM portfolio in the area of investment and asset management.
• Mr. Jimmy Lee has a Bachelor of Science Degree in Accounting from the University of Albany. He is well versed with both the US and Asian markets and has deep knowledge of auditing, financial reporting, consulting, taxation, and financial planning.
• Ms. Lynn Lee is a graduate in Economic and Statistics from the National University of Singapore. She has many years of working experience in international locations within various industries in both public and private sectors, as well as multinational corporations to local companies. She has extensive people management experience and significant organization planning and development know-how.
• Mr Li Bin is a graduate from Fudan University, China, a Chinese Ivy-League university. Mr. Li finished his Masters Degree and Doctor of Jurisprudence Degree in the United States. Mr. Li externed for the Honorable Ronald Lew of the Central District of California, and is licensed by the State Bar of California to appear before the California Superior Court and Court of Appeal, the federal District Court and Bankruptcy Court for the Central District of California.
Together, the above-mentioned professionals form a well-rounded team of leaders that hold all the skills and abilities needed to succeed in the international jewelry market.
Past Financial Performance
The Company has been thriving since its inception – its success easily ascertainable from the tables below. The balance sheet indicates how well it has performed in its first two years of operation.
STATEMENTS OF CASH FLOWS
| For the Years Ended | ||||||||
| December 31 | December 31, | |||||||
| 2014 | 2013 | |||||||
| Cash flows from operating activities | $ | 25,862,756 | $ | 7,691,161 | ||||
| Net income/(loss) | ||||||||
| Adjustment to reconcile net loss from operations: | ||||||||
| Bad debt expense | 15,130 | 1,887,886 | ||||||
| Depreciation expense | 4,199 | 1,623 | ||||||
| Changes in Operating Assets and Liabilities | ||||||||
| Accounts receivable | 1,055,131 | -3,218,466 | ||||||
| Inventory | 5,598,542 | -5,602,380 | ||||||
| Prepaid rent | 109,480 | -103,788 | ||||||
| Other receivables | -101,328 | -334,173 | ||||||
| Security deposits to suppliers | 2,715,958 | -88,221 | ||||||
| Accounts payable and accrued expenses | -5,832,650 | 10,116,356 | ||||||
| Taxes payable | 224 | - | ||||||
| Other payables | 11,451 | 8 | ||||||
| Net cash used in operating activities | 29,438,892 | 10,620,006 | ||||||
| Cash flows from financing activities | ||||||||
| Capital contribution from owners | - | 4843139 | ||||||
| Capital distribution to owners | -40,677 | - | ||||||
| Proceeds/(Repayment) to related party, net | -21,059 | -664,251 | ||||||
| Proceeds/(Repayments) from trade financing loans, | -929,005 | 3,973,463 | ||||||
| Net cash provided by financing activities | -990,741 | 8,152,351 | ||||||
| Cash flows from investing activities | ||||||||
| Purchase of land, property and equipment | -31,633,774 | -15,757,961 | ||||||
| Net cash provided by investing activities | -31,633,774 | -15,757,961 | ||||||
| Effect of exchange rate changes | 73,560 | 94.800 | ||||||
| Net increase (decrease) in cash and cash equivalents | -3,112,062 | 3,109,196 | ||||||
| Cash and cash equivalents at beginning of period | 3,112,528 | 3,332 | ||||||
| Cash and cash equivalents at end of period | $ | 466 | 3,112,528 | |||||
| Supplemental disclosures of cash flow information | ||||||||
| Interest paid | $ | 55,682 | 55,377,570 | |||||
| Income taxes paid | - | - | ||||||
STATEMENTS OF OPERATIONS AND COMPREHENSIVE INCOME/(LOSS)
| For the Years Ended | ||||||||
| December 31, | December 31, | |||||||
| 2014 | 2013 | |||||||
| Revenues | $ | 41,081,108 | $ | 58,584,590 | ||||
| Cost of sales | 14,270,331 | 33,414,952 | ||||||
| Gross margin | 26,810,777 | 25,169,638 | ||||||
| Operating expenses | ||||||||
| Selling, general & administrative expenses | 1,235,968 | 11,831,170 | ||||||
| Total operating expenses | 1,235,968 | 11,831,170 | ||||||
| Income (Loss) from operations | 25,574,809 | 13,338,468 | ||||||
| Other income (expenses) | ||||||||
| Interest income | 152 | 263 | ||||||
| Interest expense | -55,682 | -5,377,570 | ||||||
| Government rebate | 343,477 | - | ||||||
| Total other income (expenses) | 287,947 | -5,377,307 | ||||||
| Net income (loss) before income taxes | 25,862,756 | 7,961,161 | ||||||
| Income tax benefit | - | - | ||||||
| Net income (loss) | $ | 25,862,756 | $ | 7,961,161 | ||||
| Foreign currency translation adjustment | -74,609 | 285,207 | ||||||
| Comprehensive income (loss) | $ | 25,788,147 | $ | 8,246,368 | ||||
| 9 |
The table below lists operational expenditure and income. Again, this table demonstrates the high level of success that the Company has achieved in its two years of operation. The fact that it generates considerable revenues indicates the demand for such services. Moreover, FUDA Group USA healthy cash flows show that the Company is safe from a financial crunch.
BALANCE SHEETS
| December 31 | December 31, | |||||||
| 2014 | 2013 | |||||||
| Assets | ||||||||
| Current Assets | ||||||||
| Cash and cash equivalents | $ | 466 | $ | 3,112,528 | ||||
| Accounts receivable, net | 260,624 | 1,348,861 | ||||||
| Inventory | 3,843 | 5,679,351 | ||||||
| Prepaid rent | 65,058 | 176,859 | ||||||
| Other receivables | 436,014 | 338,764 | ||||||
| Security deposits to suppliers | 1,985,178 | 4,763,370 | ||||||
| Total Current Assets | 2,751,183 | 15,419,733 | ||||||
| Land, property and equipment, net | 52,286,087 | 20,878,256 | ||||||
| Total Assets | 55,037,270 | 36,279,989 | ||||||
| Liabilities | ||||||||
| Current Liabilities | ||||||||
| Accounts payable and accrued expenses | 8,420,643 | 14,439,125 | ||||||
| Taxes payable | 224 | - | ||||||
| Due to related parties | 1,548 | 22,915 | ||||||
| Other payables | 11,472 | 8 | ||||||
| Trade financing loans | 3,048,026 | 4,028,054 | ||||||
| Total Current Liabilities | 11,481,913 | 18,490,102 | ||||||
| Total Liabilities | 11,481,913 | 18,490,102 | ||||||
| Commitments & Contingencies - - | ||||||||
| Equity | ||||||||
| Registered capital | 9,554,670 | 9,595,347 | ||||||
| Retained earnings | 33,781,325 | 7,918,569 | ||||||
| Accumulated other comprehensive income | 219,362 | 293,971 | ||||||
| Total Equity | 43,555,357 | 17,807,887 | ||||||
| Total Liabilities and Equity | 55,037,270 | 36,297,989 | ||||||
STATEMENTS OF OWNERS' EQUITY
For the Years Ended December 31, 2014 and 2013
| Accumulated | ||||||||||||||||
| Other | Total | |||||||||||||||
| Registered | Retained | Comprehensive | Owners' | |||||||||||||
| Capital | Earnings/(Loss) | lncome/(Loss) | Equity | |||||||||||||
| $ - | $ - | $ - | $ - | |||||||||||||
| Balance, August 2012 (Inception) | ||||||||||||||||
| Capital contribution from owners | 4,752,208 | 4,752,208 | ||||||||||||||
| Net (loss) for the period | -42,592 | -42,592 | ||||||||||||||
| Cumulative translation adjustment | 8,764 | 8,764 | ||||||||||||||
| Balance, December 31, 2012 | 4,752,208 | -42,592 | 8,764 | 4,718,380 | ||||||||||||
| Capital contribution from owners | 4,843,139 | 4,843,139 | ||||||||||||||
| Net income for the period | 7,961,161 | 7,961,161 | ||||||||||||||
| Cumulative translation adjustment | 285,207 | 285,207 | ||||||||||||||
| Balance, December 31, 2013 | 9,595,347 | 7,918,569 | 293,971 | 17,807,887 | ||||||||||||
| Capital distribution to owners | -40,677 | -40,677 | ||||||||||||||
| Net income for the period | 25,862,756 | 25,862,756 | ||||||||||||||
| Cumulative translation adjustment | -74,609 | -74,609 | ||||||||||||||
| Balance, December 31, 2014 | 9,554,670 | 33,781,325 | 219,362 | 43,555,357 | ||||||||||||
| 10 |
Financial Projection: Funding
FUDA Group USA intends to raise $1 billion dollars to purchase gold, granite and resource mines, facilities, machines. The breakdown for the use of the proceeds is as follows:
Gold: Acquisition of Gold Mine US$350 million. All acquisitions will be backed and checked against Reserve and Evaluation reports from the Land Resource Bureau. Acquisition of Gold Sorting and Refinery Facility USD150 million. This money would be used to purchase the facility for the refinery, machinery and technology upgrades.
Granite: Acquisition of Granite Mines US$120 million. The granite mines that we intend to acquire are open-pit mines. Open-pit mines are easier to mine and hence lower operational costs. The mining reserves for the mines are approximately 60 Million M3. The mine purchase price includes processing facilities. All acquisitions will be backed and checked against Reserve and Evaluation reports from the Land Resource Bureau.
Graphite: Acquisition of Graphite Mine US$230 million. This purchase price includes a processing facility with an estimated worth of USD50 million. All acquisitions will be backed and checked against Reserve and Evaluation reports from the Land Resource Bureau.
Fluorite: Acquisition of Fluorite Mine US$150 million. This purchase price includes a processing facility with an estimated worth of USD20 million. All acquisitions will be backed and checked against Reserve and Evaluation reports from the Land Resource Bureau.
Alternatively, it has also been broken down below:
| Use of Start-up Funding | ||||
| Expenses | ||||
| Legal Fees & Professional Fees | $ | 24,240,000 | ||
| Government Fees & Registration | $ | 18,180,000 | ||
| Soil Testing & Land Development | $ | 14,544,000 | ||
| Research & Development | $ | 36,360,000 | ||
| Total Expenses | $ | 121,200,000 | ||
| Long-term Assets | ||||
| Building | $ | 40,400,000 | ||
| Refinery Facilities | $ | 60,600,000 | ||
| Plant & Machinery | $ | 80,800,000 | ||
| Labor Facilities/Barracks | $ | 25,250,000 | ||
| Vehicles | $ | 40,400,000 | ||
| Truck & Loading Vehicle | $ | 55,550,000 | ||
| Railroad | $ | 60,600,000 | ||
| Fork Lifts | $ | 20,200,000 | ||
| Total Long-Term Assets | $ | 383,800,000 | ||
| Short-Term Assets | ||||
| Working Capital | $ | 80,800,000 | ||
| Other Assets (Land) | $ | 424,200,000 | ||
| Total Short-Term Assets | $ | 505,000,000 | ||
| Total Expenses & Assets | ||||
| Total Expenses | $ | 121,200,000 | ||
| Total Assets | $ | 888,800,000 | ||
| Total Funding Requirements | $ | 1,010,000,000 | ||
| Total Funding | ||||
| Total Amount Being Requested | $ | 1,000,000,000 | ||
| Total Funds Already Received | $ | 10,000,000 | ||
| Total Funding | $ | 1,010,000,000 | ||
| Funding Being Requested | ||||
| Investor Amount Being Requested | $ | 1,000,000,000 | ||
| Total Amount Being Requested | $ | 1,000,000,000 | ||
| Funding Already Received | ||||
| Shareholders' Additional Contribution | $ | 10,000,000 | ||
| Total Funding Already Received | $ | 10,000,000 | ||
| Capital and Liabilities | ||||
| Loss (Expansion Cost) | $ | (121,200,000 | ) | |
| Total Funds Received & Requested | $ | 1,010,000,000 | ||
| Cash Balance on Starting Date | $ | 505,000,000 | ||
Assumptions
Funding utilization has been projected on the following assumptions:
| 11 |
| Assumption | ||||
| Line Items | % Distribution | |||
| Building | 4.00 | % | ||
| Refinery Facilities | 6.00 | % | ||
| Plant & Machinery | 8.00 | % | ||
| Labor Facilities/Barracks | 2.50 | % | ||
| Vehicles | 4.00 | % | ||
| Truck & Loading Vehicle | 5.50 | % | ||
| Railroad | 6.00 | % | ||
| Fork Lifts | 2.00 | % | ||
| Other Assets (Land) | 42.00 | % | ||
| Working Capital | 8.00 | % | ||
| Expansion Expenses | 12.00 | % | ||
| Total | 100.00 | % | ||

Financial Indicators
The following table summarizes the projected financial performance with standardized measurement indicators used to evaluate the profitability, leverage, asset turnover and liquidity. As with any long-range projection, accuracy is based on reasonable estimates of return on investment and past performance. The Company believes the following numbers are attainable and reasonable. However, actual results will vary.
| Financial Indicators | ||||||||||||||||||||
| 2015 | 2016 | 2017 | 2018 | 2019 | ||||||||||||||||
| Profitability %'s: | ||||||||||||||||||||
| Gross Margin | 52.67 | % | 48.09 | % | 48.17 | % | 48.49 | % | 48.82 | % | ||||||||||
| Net Profit Margin | -237.78 | % | 38.29 | % | 26.90 | % | 27.68 | % | 28.38 | % | ||||||||||
| EBITDA to Revenue | -208.74 | % | 44.93 | % | 45.47 | % | 46.14 | % | 46.77 | % | ||||||||||
| Return on Assets | -12.54 | % | 11.50 | % | 9.16 | % | 10.30 | % | 11.46 | % | ||||||||||
| Return on Equity | -12.72 | % | 11.80 | % | 9.36 | % | 10.54 | % | 11.75 | % | ||||||||||
| Activity Ratios: | ||||||||||||||||||||
| Accounts Payable Turnover | 2.00 | 6.69 | 8.92 | 8.90 | 8.88 | |||||||||||||||
| Asset Turnover | 0.05 | 0.30 | 0.34 | 0.37 | 0.40 | |||||||||||||||
| Leverage Ratios: | ||||||||||||||||||||
| Debt to Equity | 0.01 | 0.03 | 0.02 | 0.02 | 0.03 | |||||||||||||||
| Debt to Assets Ratio | 1.45 | % | 2.51 | % | 2.15 | % | 2.31 | % | 2.47 | % | ||||||||||
| Interest Coverage Ratio | N/A | N/A | N/A | N/A | N/A | |||||||||||||||
| Liquidity Ratios: | ||||||||||||||||||||
| Current Ratio | 7.40 | 6.05 | 8.18 | 9.86 | 11.32 | |||||||||||||||
| Current Debt to Total Assets Ratio | 1.45 | % | 2.51 | % | 2.15 | % | 2.31 | % | 2.47 | % | ||||||||||
| Additional Indicators: | ||||||||||||||||||||
| Revenue to Equity Ratio | 0.05 | 0.31 | 0.35 | 0.38 | 0.41 | |||||||||||||||
| 12 |
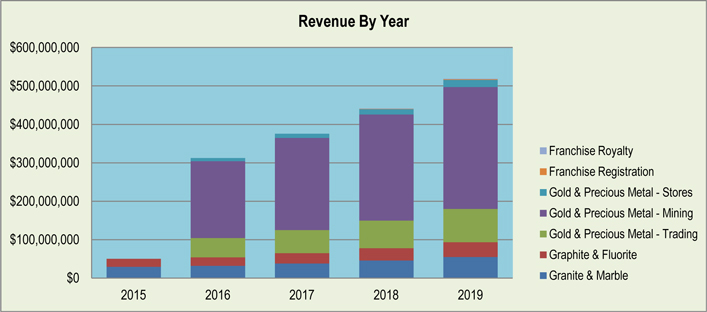
Revenue Projection
Revenue Forecast
| 2015 | 2016 | 2017 | 2018 | 2019 | ||||||||||||||||
| Total | ||||||||||||||||||||
| Granite & Marble (MT) | 202,458 | 218,654 | 262,385 | 314,862 | 377,835 | |||||||||||||||
| Graphite & Fluorite (MT) | 153,066 | 165,312 | 198,374 | 238,049 | 285,659 | |||||||||||||||
| Gold & Precious Metal - Trading (MT) | 0 | 5 | 6 | 7 | 9 | |||||||||||||||
| Gold & Precious Metal - Mining (MT) | 0 | 10 | 12 | 14 | 16 | |||||||||||||||
| Gold & Precious Metal - Stores (Per 100 gram) | 0 | 1,600 | 2,080 | 2,704 | 3,665 | |||||||||||||||
| Franchise Registration (No. of Franchise) | 0 | 0 | 0 | 10 | 16 | |||||||||||||||
| Franchise Royalty (Average Franchise) | 0 | 0 | 0 | 10 | 26 | |||||||||||||||
| Price | ||||||||||||||||||||
| Granite & Marble | $ | 145.16 | $ | 145.16 | $ | 145.16 | $ | 145.16 | $ | 145.16 | ||||||||||
| Graphite & Fluorite | $ | 135.00 | $ | 135.00 | $ | 135.00 | $ | 135.00 | $ | 135.00 | ||||||||||
| Gold & Precious Metal - Trading | $ | 10,000,000.00 | $ | 10,000,000.00 | $ | 10,000,000.00 | $ | 10,000,000.00 | $ | 10,000,000.00 | ||||||||||
| Gold & Precious Metal - Mining | $ | 20,000,000.00 | $ | 20,000,000.00 | $ | 20,000,000.00 | $ | 20,000,000.00 | $ | 20,000,000.00 | ||||||||||
| Gold & Precious Metal - Stores | $ | 5,081.40 | $ | 5,081.40 | $ | 5,081.40 | $ | 5,081.40 | $ | 5,081.40 | ||||||||||
| Franchise Registration | $ | 100,000.00 | $ | 100,000.00 | $ | 100,000.00 | $ | 100,000.00 | $ | 100,000.00 | ||||||||||
| Franchise Royalty | $ | 60,000.00 | $ | 60,000.00 | $ | 60,000.00 | $ | 60,000.00 | $ | 60,000.00 | ||||||||||
| Revenue | ||||||||||||||||||||
| Granite & Marble | $ | 29,388,766 | $ | 31,739,868 | $ | 38,087,841 | $ | 45,705,410 | $ | 54,846,492 | ||||||||||
| Graphite & Fluorite | $ | 20,663,976 | $ | 22,317,095 | $ | 26,780,513 | $ | 32,136,616 | $ | 38,563,939 | ||||||||||
| Gold & Precious Metal - Trading | $ | 0 | $ | 50,000,000 | $ | 60,000,000 | $ | 72,000,000 | $ | 86,400,000 | ||||||||||
| Gold & Precious Metal - Mining | $ | 0 | $ | 200,000,000 | $ | 240,000,000 | $ | 276,000,000 | $ | 317,400,000 | ||||||||||
| Gold & Precious Metal - Stores | $ | 0 | $ | 8,130,240 | $ | 10,569,312 | $ | 13,740,106 | $ | 18,625,364 | ||||||||||
| Franchise Registration | $ | 0 | $ | 0 | $ | 0 | $ | 1,000,000 | $ | 1,600,000 | ||||||||||
| Franchise Royalty | $ | 0 | $ | 0 | $ | 0 | $ | 600,000 | $ | 1,560,000 | ||||||||||
| Total Revenue | $ | 50,052,743 | $ | 312,187,202 | $ | 375,437,667 | $ | 441,182,131 | $ | 518,995,794 | ||||||||||
| Direct Cost | ||||||||||||||||||||
| Granite & Marble | $ | 61.29 | $ | 61.29 | $ | 61.29 | $ | 61.29 | $ | 61.29 | ||||||||||
| Graphite & Fluorite | $ | 73.71 | $ | 73.71 | $ | 73.71 | $ | 73.71 | $ | 73.71 | ||||||||||
| Gold & Precious Metal - Trading | $ | 5,400,000.00 | $ | 5,400,000.00 | $ | 5,400,000.00 | $ | 5,400,000.00 | $ | 5,400,000.00 | ||||||||||
| Gold & Precious Metal - Mining | $ | 10,800,000.00 | $ | 10,800,000.00 | $ | 10,800,000.00 | $ | 10,800,000.00 | $ | 10,800,000.00 | ||||||||||
| Gold & Precious Metal - Stores | $ | 914.65 | $ | 914.65 | $ | 914.65 | $ | 914.65 | $ | 914.65 | ||||||||||
| Direct Cost of Revenue | ||||||||||||||||||||
| Granite & Marble | $ | 12,407,937 | $ | 13,400,572 | $ | 16,080,687 | $ | 19,296,824 | $ | 23,156,189 | ||||||||||
| Graphite & Fluorite | $ | 11,282,531 | $ | 12,185,134 | $ | 14,622,160 | $ | 17,546,592 | $ | 21,055,911 | ||||||||||
| Gold & Precious Metal - Trading | $ | 0 | $ | 27,000,000 | $ | 32,400,000 | $ | 38,880,000 | $ | 46,656,000 | ||||||||||
| Gold & Precious Metal - Mining | $ | 0 | $ | 108,000,000 | $ | 129,600,000 | $ | 149,040,000 | $ | 171,396,000 | ||||||||||
| Gold & Precious Metal - Stores | $ | 0 | $ | 1,463,443 | $ | 1,902,476 | $ | 2,473,219 | $ | 3,352,565 | ||||||||||
| Subtotal Cost of Revenue | $ | 23,690,468 | $ | 162,049,149 | $ | 194,605,323 | $ | 227,236,635 | $ | 265,616,665 | ||||||||||
Revenue Forecast Assumptions: (1) Revenue and costs are based on averages. (2) "Granite & Marble", "Graphite & Fluorite" are projected on trend basis with 15% to 20% growth rate effect. (3) Gold & Previous Metal - Trading, Mining and Stores will be initiated from year 2016. (4) Company will initiate its franchise operations of jewelry stores from year 2018. (5) Franchise royalty is computed at 5% of gross sales of franchise stores. (5) Gold & Precious Metal - Store pricing is based on current gold prices plus 35% (35% represents cutting, designing, wastage and other cost charged to customer).
| 13 |
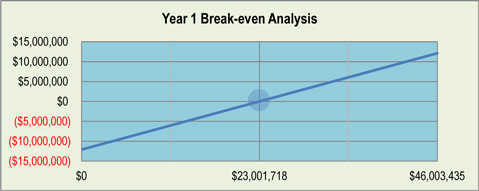
Break-Even Analysis
The following break-even analysis shows the revenue necessary to break-even in the first year of operation. Break-even is where revenue equals expenses. As shown below, the Company is expected to incur average monthly fixed costs of $12M in Year 1. To cover fixed costs and variable costs, which rise and fall with revenue, the Company must, on average, achieve a revenue of $23M per month to break-even.
| Year 2015 Break-even Analysis | ||||
| Monthly Revenue Break-even | $ | 23,001,718 | ||
| Assumptions: | ||||
| Average Monthly Revenue | $ | 4,171,062 | ||
| Average Monthly Variable Cost | $ | 1,974,206 | ||
| Estimated Monthly Fixed Cost | $ | 12,114,773 | ||
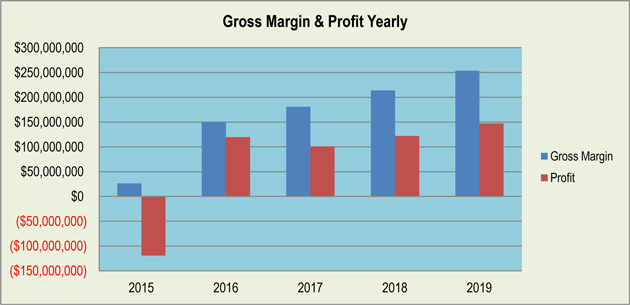
Projected Profit & Loss Account
FUDA Group (USA) intends to deploy its funding to maximize growth and profitability. In the Profit & Loss Account below, gross margin equals sales minus direct costs. The “bottom line” or profit (as measured before and after interest, taxes, depreciation and amortization) equals gross margin minus operating expenses.
| 14 |
| Pro Forma Income Statement | ||||||||||||||||||||
| 2015 | 2016 | 2017 | 2018 | 2019 | ||||||||||||||||
| Revenue | $ | 50,052,743 | $ | 312,187,202 | $ | 375,437,667 | $ | 441,182,131 | $ | 518,995,794 | ||||||||||
| Subtotal Cost of Revenue | $ | 23,690,468 | $ | 162,049,149 | $ | 194,605,323 | $ | 227,236,635 | $ | 265,616,665 | ||||||||||
| Gross Margin | $ | 26,362,275 | $ | 150,138,053 | $ | 180,832,344 | $ | 213,945,496 | $ | 253,379,129 | ||||||||||
| Gross Margin/Revenue | 52.67 | % | 48.09 | % | 48.17 | % | 48.49 | % | 48.82 | % | ||||||||||
| Expenses | ||||||||||||||||||||
| Selling & Advertising Expenses | $ | 1,989,035 | $ | 2,038,761 | $ | 2,089,730 | $ | 2,141,973 | $ | 2,195,522 | ||||||||||
| Administrative Expenses | $ | 3,164,374 | $ | 3,243,483 | $ | 3,324,570 | $ | 3,407,684 | $ | 3,492,876 | ||||||||||
| General Expenses | $ | 1,356,160 | $ | 1,390,064 | $ | 1,424,816 | $ | 1,460,436 | $ | 1,496,947 | ||||||||||
| Salaries, Wages & Benefits | $ | 1,808,214 | $ | 1,853,419 | $ | 1,899,754 | $ | 1,947,248 | $ | 1,995,929 | ||||||||||
| Interest & Bank charges | $ | 723,285 | $ | 741,368 | $ | 759,902 | $ | 778,899 | $ | 798,372 | ||||||||||
| Research & Development | $ | 600,000 | $ | 615,000 | $ | 630,375 | $ | 646,134 | $ | 662,288 | ||||||||||
| Expansion Cost | $ | 121,200,000 | $ | 0 | $ | 0 | $ | 0 | $ | 0 | ||||||||||
| Depreciation | $ | 14,536,203 | $ | 16,202,870 | $ | 17,702,870 | $ | 18,536,203 | $ | 19,536,203 | ||||||||||
| Total Operating Expenses | $ | 145,377,271 | $ | 26,084,964 | $ | 27,832,016 | $ | 28,918,578 | $ | 30,178,138 | ||||||||||
| Profit Before Interest and Taxes | $ | (119,014,996 | ) | $ | 124,053,089 | $ | 153,000,327 | $ | 185,026,918 | $ | 223,200,992 | |||||||||
| EBITDA | $ | (104,478,793 | ) | $ | 140,255,959 | $ | 170,703,197 | $ | 203,563,121 | $ | 242,737,195 | |||||||||
| Taxes Incurred | $ | 0 | $ | 4,519,697 | $ | 52,020,111 | $ | 62,909,152 | $ | 75,888,337 | ||||||||||
| Net Profit | $ | (119,014,996 | ) | $ | 119,533,393 | $ | 100,980,216 | $ | 122,117,766 | $ | 147,312,655 | |||||||||
| Net Profit/Revenue | -237.78 | % | 38.29 | % | 26.90 | % | 27.68 | % | 28.38 | % | ||||||||||
Income Statement Assumptions: (1) Depreciation is based on 30 years; (2) Company taxes are based on 34% from year 2016. (Company availing tax holidays till year 2015)
Projected Cost Of Production/Sale
Cost of production/sales consists of direct mining costs and other cost (which include personnel costs, repairs & maintenance cost, and other direct costs).
| 15 |
Pro Forma Cost of Production/Sales
| 2015 | 2016 | 2017 | 2018 | 2019 | ||||||||||||||||
| PERSONNEL COSTS | ||||||||||||||||||||
| Salaries, Wages and Allowances | $ | 2,132,142 | $ | 14,584,423 | $ | 17,514,479 | $ | 20,451,297 | $ | 23,905,500 | ||||||||||
| Overtime | $ | 236,905 | $ | 1,620,491 | $ | 1,946,053 | $ | 2,272,366 | $ | 2,656,167 | ||||||||||
| Social Security Costs | $ | 355,357 | $ | 2,430,737 | $ | 2,919,080 | $ | 3,408,550 | $ | 3,984,250 | ||||||||||
| Employee Tax Costs | $ | 473,809 | $ | 3,240,983 | $ | 3,892,106 | $ | 4,544,733 | $ | 5,312,333 | ||||||||||
| Personnel Insurance | $ | 236,905 | $ | 1,620,491 | $ | 1,946,053 | $ | 2,272,366 | $ | 2,656,167 | ||||||||||
| Contractual Staff | $ | 3,861,546 | $ | 26,414,011 | $ | 31,720,668 | $ | 37,039,572 | $ | 43,295,516 | ||||||||||
| Training Costs | $ | 118,452 | $ | 810,246 | $ | 973,027 | $ | 1,136,183 | $ | 1,328,083 | ||||||||||
| Travel and Subsistence | $ | 473,809 | $ | 3,240,983 | $ | 3,892,106 | $ | 4,544,733 | $ | 5,312,333 | ||||||||||
| Catering Costs | $ | 2,132,142 | $ | 14,584,423 | $ | 17,514,479 | $ | 20,451,297 | $ | 23,905,500 | ||||||||||
| Protective Clothing | $ | 236,905 | $ | 1,620,491 | $ | 1,946,053 | $ | 2,272,366 | $ | 2,656,167 | ||||||||||
| Safety Equipment | $ | 473,809 | $ | 3,240,983 | $ | 3,892,106 | $ | 4,544,733 | $ | 5,312,333 | ||||||||||
| Other Personnel Costs | $ | 1,184,523 | $ | 8,102,457 | $ | 9,730,266 | $ | 11,361,832 | $ | 13,280,833 | ||||||||||
| Sub-Total | $ | 11,916,306 | $ | 81,510,722 | $ | 97,886,478 | $ | 114,300,028 | $ | 133,605,183 | ||||||||||
| REPAIRS AND MAINTENANCE COSTS | ||||||||||||||||||||
| Materials | $ | 2,369,047 | $ | 16,204,915 | $ | 19,460,532 | $ | 22,723,664 | $ | 26,561,667 | ||||||||||
| Miscellaneous Repairs & Spares | $ | 710,714 | $ | 4,861,474 | $ | 5,838,160 | $ | 6,817,099 | $ | 7,968,500 | ||||||||||
| Travelling Equipment | $ | 236,905 | $ | 1,620,491 | $ | 1,946,053 | $ | 2,272,366 | $ | 2,656,167 | ||||||||||
| Ac Electric System | $ | 118,452 | $ | 810,246 | $ | 973,027 | $ | 1,136,183 | $ | 1,328,083 | ||||||||||
| Office Supplies | $ | 592,262 | $ | 4,051,229 | $ | 4,865,133 | $ | 5,680,916 | $ | 6,640,417 | ||||||||||
| Lubricating Oils | $ | 710,714 | $ | 4,861,474 | $ | 5,838,160 | $ | 6,817,099 | $ | 7,968,500 | ||||||||||
| Workshop Equipment | $ | 473,809 | $ | 3,240,983 | $ | 3,892,106 | $ | 4,544,733 | $ | 5,312,333 | ||||||||||
| HVAC System | $ | 118,452 | $ | 810,246 | $ | 973,027 | $ | 1,136,183 | $ | 1,328,083 | ||||||||||
| Accomodation | $ | 236,905 | $ | 1,620,491 | $ | 1,946,053 | $ | 2,272,366 | $ | 2,656,167 | ||||||||||
| Lifting Equipments | $ | 473,809 | $ | 3,240,983 | $ | 3,892,106 | $ | 4,544,733 | $ | 5,312,333 | ||||||||||
| Repairs Mining Equipment | $ | 592,262 | $ | 4,051,229 | $ | 4,865,133 | $ | 5,680,916 | $ | 6,640,417 | ||||||||||
| Inspection Service Units | $ | 402,738 | $ | 2,754,836 | $ | 3,308,290 | $ | 3,863,023 | $ | 4,515,483 | ||||||||||
| Sub-Total | $ | 7,036,069 | $ | 48,128,597 | $ | 57,797,781 | $ | 67,489,281 | $ | 78,888,150 | ||||||||||
| OTHER DIRECT COSTS | ||||||||||||||||||||
| Repairs Vehicles & Trucks | $ | 473,809 | $ | 3,240,983 | $ | 3,892,106 | $ | 4,544,733 | $ | 5,312,333 | ||||||||||
| Spares Vehicles and Trucks | $ | 473,809 | $ | 3,240,983 | $ | 3,892,106 | $ | 4,544,733 | $ | 5,312,333 | ||||||||||
| Freight Expense | $ | 710,714 | $ | 4,861,474 | $ | 5,838,160 | $ | 6,817,099 | $ | 7,968,500 | ||||||||||
| Energy Cost | $ | 1,184,523 | $ | 8,102,457 | $ | 9,730,266 | $ | 11,361,832 | $ | 13,280,833 | ||||||||||
| External Service | $ | 592,262 | $ | 4,051,229 | $ | 4,865,133 | $ | 5,680,916 | $ | 6,640,417 | ||||||||||
| Depreciaiton Related to Sales and Royalty Expense | $ | 829,166 | $ | 5,671,720 | $ | 6,811,186 | $ | 7,953,282 | $ | 9,296,583 | ||||||||||
| Base & Other Direct Costs | $ | 473,809 | $ | 3,240,983 | $ | 3,892,106 | $ | 4,544,733 | $ | 5,312,333 | ||||||||||
| Sub-Total | $ | 4,738,094 | $ | 32,409,830 | $ | 38,921,065 | $ | 45,447,327 | $ | 53,123,333 | ||||||||||
| Grand Total | $ | 23,690,468 | $ | 162,049,149 | $ | 194,605,323 | $ | 227,236,635 | $ | 265,616,665 | ||||||||||
Projected Cash Flow Statement
The following depictions of FUDA Group (USA)’s projected cash flow show that the Company expects to maintain sufficient cash balances over the five years of this plan. The “pro forma cash flow” table differs from the “pro forma profit & loss account” table. Pro forma cash flow is intended to represent the actual flow of cash in and out of FUDA Group (USA). In comparison, the revenue and expense projections on the profit & loss account include “non-cash” items and exclude funding and investment illustrations.
| 16 |
| Pro Forma Cash Flow | ||||||||||||||||||||
| 2015 | 2016 | 2017 | 2018 | 2019 | ||||||||||||||||
| Cash Received | ||||||||||||||||||||
| Revenue | $ | 50,052,743 | $ | 312,187,202 | $ | 375,437,667 | $ | 441,182,131 | $ | 518,995,794 | ||||||||||
| Owner Contribution | $ | 10,000,000 | $ | 0 | $ | 0 | $ | 0 | $ | 0 | ||||||||||
| Proceeds from Investor | $ | 1,000,000,000 | $ | 0 | $ | 0 | $ | 0 | $ | 0 | ||||||||||
| Subtotal Cash Received | $ | 1,060,052,743 | $ | 312,187,202 | $ | 375,437,667 | $ | 441,182,131 | $ | 518,995,794 | ||||||||||
| Expenditures | ||||||||||||||||||||
| Expenditures from Operations | ||||||||||||||||||||
| Bill Payments | $ | 29,922,162 | $ | 164,075,741 | $ | 259,153,243 | $ | 296,810,407 | $ | 347,762,877 | ||||||||||
| Subtotal Spent on Operations | $ | 29,922,162 | $ | 164,075,741 | $ | 259,153,243 | $ | 296,810,407 | $ | 347,762,877 | ||||||||||
| Additional Cash Spent | ||||||||||||||||||||
| Start-up Costs | $ | 121,200,000 | $ | 0 | $ | 0 | $ | 0 | $ | 0 | ||||||||||
| Purchase Inventory | $ | 0 | $ | 30,000,000 | $ | 4,000,000 | $ | 4,500,000 | $ | 5,000,000 | ||||||||||
| Purchase Long-term Assets | $ | 383,800,000 | $ | 50,000,000 | $ | 45,000,000 | $ | 25,000,000 | $ | 30,000,000 | ||||||||||
| Dividends Paid | $ | 0 | $ | 41,836,687 | $ | 35,343,076 | $ | 42,741,218 | $ | 51,559,429 | ||||||||||
| Subtotal Cash Spent | $ | 959,122,162 | $ | 285,912,429 | $ | 343,496,319 | $ | 369,051,624 | $ | 434,322,306 | ||||||||||
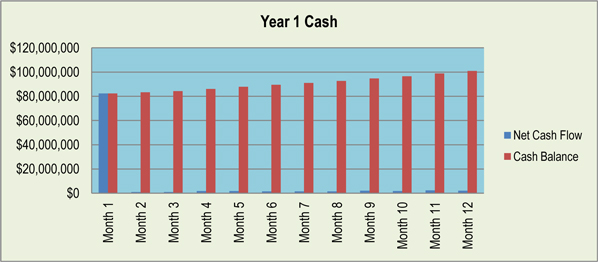
| Net Cash Flow | $ | 100,930,581 | $ | 26,274,774 | $ | 31,941,348 | $ | 72,130,507 | $ | 84,673,489 | ||||||||||
| Cash Balance | $ | 100,931,047 | $ | 127,205,820 | $ | 159,147,168 | $ | 231,277,675 | $ | 315,951,164 | ||||||||||
Cash Flow Assumptions: (1) Proceeds from Investors assume funds were received in the amount of $1 Billion; (2) Shareholders' Contribution is $10M.
Projected Balance Sheet
A balance sheet is a snapshot of FUDA Group (USA)’s financial condition. The balance sheet has three parts: assets, liabilities and ownership equity.
| 17 |
| Pro Forma Balance Sheet | ||||||||||||||||||||
| 2015 | 2016 | 2017 | 2018 | 2019 | ||||||||||||||||
| Assets | ||||||||||||||||||||
| Current Assets | ||||||||||||||||||||
| Cash | $ | 100,931,047 | $ | 127,205,820 | $ | 159,147,168 | $ | 231,277,675 | $ | 315,951,164 | ||||||||||
| Inventory | $ | 3,843 | $ | 30,003,843 | $ | 34,003,843 | $ | 38,503,843 | $ | 43,503,843 | ||||||||||
| Other Current Assets | $ | 761,696 | $ | 761,696 | $ | 761,696 | $ | 761,696 | $ | 761,696 | ||||||||||
| Total Current Assets | $ | 101,696,586 | $ | 157,971,359 | $ | 193,912,707 | $ | 270,543,214 | $ | 360,216,703 | ||||||||||
| Long-term Assets | ||||||||||||||||||||
| Long-term Assets | $ | 436,086,087 | $ | 486,086,087 | $ | 531,086,087 | $ | 556,086,087 | $ | 586,086,087 | ||||||||||
| Accumulated Depreciation | $ | 14,536,203 | $ | 30,739,072 | $ | 48,441,942 | $ | 66,978,145 | $ | 86,514,348 | ||||||||||
| Total Long-term Assets | $ | 421,549,884 | $ | 455,347,015 | $ | 482,644,145 | $ | 489,107,942 | $ | 499,571,739 | ||||||||||
| Other Assets | ||||||||||||||||||||
| Other Assets | $ | 426,185,178 | $ | 426,185,178 | $ | 426,185,178 | $ | 426,185,178 | $ | 426,185,178 | ||||||||||
| Total Assets | $ | 949,431,648 | $ | 1,039,503,552 | $ | 1,102,742,030 | $ | 1,185,836,334 | $ | 1,285,973,620 | ||||||||||
| Liabilities and Capital | ||||||||||||||||||||
| Current Liabilities | ||||||||||||||||||||
| Accounts Payable | $ | 11,830,017 | $ | 24,205,216 | $ | 21,806,553 | $ | 25,524,310 | $ | 29,908,370 | ||||||||||
| Current Borrowing | $ | 1,893,264 | $ | 1,893,264 | $ | 1,893,264 | $ | 1,893,264 | $ | 1,893,264 | ||||||||||
| Other Current Liabilities | $ | 13,244 | $ | 13,244 | $ | 13,244 | $ | 13,244 | $ | 13,244 | ||||||||||
| Subtotal Current Liabilities | $ | 13,736,525 | $ | 26,111,724 | $ | 23,713,061 | $ | 27,430,818 | $ | 31,814,878 | ||||||||||
| Total Liabilities | $ | 13,736,525 | $ | 26,111,724 | $ | 23,713,061 | $ | 27,430,818 | $ | 31,814,878 | ||||||||||
| Paid-in Capital | $ | 1,019,554,670 | $ | 1,019,554,670 | $ | 1,019,554,670 | $ | 1,019,554,670 | $ | 1,019,554,670 | ||||||||||
| Retained Earnings | $ | 35,155,449 | $ | (125,696,234 | ) | $ | (41,505,917 | ) | $ | 16,733,081 | $ | 87,291,417 | ||||||||
| Earnings | $ | (119,014,996 | ) | $ | 119,533,393 | $ | 100,980,216 | $ | 122,117,766 | $ | 147,312,655 | |||||||||
| Total Capital | $ | 935,695,123 | $ | 1,013,391,828 | $ | 1,079,028,969 | $ | 1,158,405,516 | $ | 1,254,158,742 | ||||||||||
| Total Liabilities and Capital | $ | 949,431,648 | $ | 1,039,503,552 | $ | 1,102,742,030 | $ | 1,185,836,334 | $ | 1,285,973,620 | ||||||||||
| Net Worth | $ | 935,695,123 | $ | 1,013,391,828 | $ | 1,079,028,969 | $ | 1,158,405,516 | $ | 1,254,158,742 | ||||||||||
Return On Investments (ROI)
FUDA Group (USA) is currently seeking an equity investor. The Company has placed a value on the Company of around $1.5 billion, and it is looking for a $1 billion investment for 70% of the Company. These funds are sufficient to allow the Company to achieve its business goals and maintain an adequate cash flow balance.
The value of FUDA Group (USA) shares will increase as the Company achieves its goals. The investor will be secure in knowing that the Company’s valuation is increasing as revenues grow, the balance sheet becomes stronger, and the Company attains a strong standing in the market.
The Company believes that it can achieve an excellent valuation in the next five years. Based on reasonable financial ratios and the business plan projections, FUDA Group (USA) is estimated to be valued at ~$9 billion by year 5.
| 18 |
Return on Investment Projection
| Company Valuation* | Outstanding Shares | Per Share Valuation | ||||||||||
| Issued & Committed | $ | 1,428,571,429 | 8,000,000 | $ | 178.5714 | |||||||
| After Investment Group | $ | 1,428,571,429 | 26,666,667 | $ | 53.5714 | |||||||
| Proposed Shares | Per Share | Dollar Investment | ||||||||||
| Investment Group (IG) | 18,666,667 | $ | 53.5714 | $ | 1,000,000,000 | |||||||
26,666,667 Total Shares - ROI for the IG is as follows:
| Company Valuation | Per Share Price | ROI for IG | ||||||||||
| Year 1 | $ | 6,737,004,885 | $ | 252.64 | 472 | % | ||||||
| Year 2 | $ | 7,296,421,164 | $ | 273.62 | 511 | % | ||||||
| Year 3 | $ | 7,769,008,575 | $ | 291.34 | 544 | % | ||||||
| Year 4 | $ | 8,340,519,718 | $ | 312.77 | 584 | % | ||||||
| Year 5 | $ | 9,029,942,941 | $ | 338.62 | 632 | % | ||||||
| Number of Shares | Per Share Price | Proceeds from Sale | ||||||||||
| (for IG) | (for IG) | |||||||||||
| Year 1 | 18,666,667 | $ | 252.64 | $ | 4,715,903,419 | |||||||
| Year 2 | 18,666,667 | $ | 273.62 | $ | 5,107,494,813 | |||||||
| Year 3 | 18,666,667 | $ | 291.34 | $ | 5,438,306,001 | |||||||
| Year 4 | 18,666,667 | $ | 312.77 | $ | 5,838,363,801 | |||||||
| Year 5 | 18,666,667 | $ | 338.62 | $ | 6,320,960,057 | |||||||
ROI Notes: (1) The company valuation has been estimated by management. (2) Future company valuation based off of Net Assets and the current industry multipliers.
Management expects that investors will be able to cash out on their investment in the Company when it generates sufficient profits to repay them. The Company expects to achieve this goal by the end of Year 5. Investors are projected to receive a 632% return on investment. The assumed company valuation was based on a multiplier of 7.2 multiplied by Net Assets.
Sensitivity Analysis
The sensitivity analysis below assumes that revenues are 10% higher or 10% lower than figures projected earlier in this business plan.
Best Case Scenario (Revenue Increases by 10%)
| Year 1 | Year 2 | Year 3 | Year 4 | Year 5 | ||||||||||||||||
| Revenue | $ | 55,058,017 | $ | 343,405,923 | $ | 412,981,433 | $ | 485,300,344 | $ | 570,895,374 | ||||||||||
| Cost of Goods | $ | 26,059,515 | $ | 178,254,064 | $ | 214,065,855 | $ | 249,960,299 | $ | 292,178,332 | ||||||||||
| Gross Margin | $ | 28,998,502 | $ | 165,151,859 | $ | 198,915,578 | $ | 235,340,046 | $ | 278,717,042 | ||||||||||
| Gross Margin/Revenue | 52.67 | % | 48.09 | % | 48.17 | % | 48.49 | % | 48.82 | % | ||||||||||
| Operating Expenses | $ | 145,377,271 | $ | 26,084,964 | $ | 27,832,016 | $ | 28,918,578 | $ | 30,178,138 | ||||||||||
| Net Profit | $ | (118,692,727 | ) | $ | 91,784,151 | $ | 112,915,151 | $ | 136,238,168 | $ | 164,035,677 | |||||||||
| Cash Flow | $ | 101,252,850 | $ | (1,474,469 | ) | $ | 43,876,282 | $ | 86,250,910 | $ | 101,396,511 | |||||||||
| Cash Balance | $ | 101,253,316 | $ | 99,778,848 | $ | 143,655,130 | $ | 229,906,040 | $ | 331,302,551 | ||||||||||
| Net Profit/Revenue | -215.58 | % | 26.73 | % | 27.34 | % | 28.07 | % | 28.73 | % | ||||||||||
| 19 |
Worst Case Scenario (Revenue Decreases by 10%)
| Year 1 | Year 2 | Year 3 | Year 4 | Year 5 | ||||||||||||||||
| Revenue | $ | 45,047,469 | $ | 280,968,482 | $ | 337,893,900 | $ | 397,063,918 | $ | 467,096,215 | ||||||||||
| Cost of Goods | $ | 21,321,421 | $ | 145,844,234 | $ | 175,144,791 | $ | 204,512,972 | $ | 239,054,999 | ||||||||||
| Gross Margin | $ | 23,726,047 | $ | 135,124,248 | $ | 162,749,109 | $ | 192,550,946 | $ | 228,041,216 | ||||||||||
| Gross Margin/Revenue | 52.67 | % | 48.09 | % | 48.17 | % | 48.49 | % | 48.82 | % | ||||||||||
| Operating Expenses | $ | 145,377,271 | $ | 26,084,964 | $ | 27,832,016 | $ | 28,918,578 | $ | 30,178,138 | ||||||||||
| Net Profit | $ | (122,463,190 | ) | $ | 71,965,927 | $ | 89,045,281 | $ | 107,997,363 | $ | 130,589,632 | |||||||||
| Cash Flow | $ | 97,482,387 | $ | (21,292,692 | ) | $ | 20,006,413 | $ | 58,010,104 | $ | 67,950,466 | |||||||||
| Cash Balance | $ | 97,482,853 | $ | 76,190,161 | $ | 96,196,574 | $ | 154,206,679 | $ | 222,157,145 | ||||||||||
| Net Profit/Revenue | -271.85 | % | 25.61 | % | 26.35 | % | 27.20 | % | 27.96 | % | ||||||||||
Financial Assumptions
The assumptions below provide growth rates, cash on hand, and the terms of funding based on an investment amount of $1 Billion.
Financial Assumptions
| Year 1 | Year 2 | Year 3 | Year 4 | Year 5 | ||||||||||||||||
| Growth Assumptions | ||||||||||||||||||||
| Total Revenue Growth | 524 | % | 20 | % | 18 | % | 18 | % | ||||||||||||
| Total Expense Growth | -82 | % | 7 | % | 4 | % | 4 | % | ||||||||||||
| Cash Assumptions | ||||||||||||||||||||
| Months of Cash on Hand | 1 | 59 | 69 | 96 | 126 | |||||||||||||||
| Bill Payment Term (Days) | 32 | 32 | 32 | 32 | 32 | |||||||||||||||
Year 2015 – Monthly Financial Projection
Year 2015 Revenue Forecast
| Month 1 | Month 2 | Month 3 | Month 4 | Month 5 | Month 6 | Month 7 | Month 8 | Month 9 | Month 10 | Month 11 | Month 12 | |||||||||||||||||||||||||||||||||||||
| Total | ||||||||||||||||||||||||||||||||||||||||||||||||
| Granite & Marble (MT) | 6,074 | 10,123 | 12,147 | 16,197 | 18,221 | 18,221 | 18,221 | 18,221 | 20,246 | 20,246 | 22,270 | 22,270 | ||||||||||||||||||||||||||||||||||||
| Graphite & Fluorite (MT) | 4,592 | 7,653 | 9,184 | 12,245 | 13,776 | 13,776 | 13,776 | 13,776 | 15,307 | 15,307 | 16,837 | 16,837 | ||||||||||||||||||||||||||||||||||||
| Price | ||||||||||||||||||||||||||||||||||||||||||||||||
| Granite & Marble | $ | 145.16 | $ | 145.16 | $ | 145.16 | $ | 145.16 | $ | 145.16 | $ | 145.16 | $ | 145.16 | $ | 145.16 | $ | 145.16 | $ | 145.16 | $ | 145.16 | $ | 145.16 | ||||||||||||||||||||||||
| Graphite & Fluorite | $ | 135.00 | $ | 135.00 | $ | 135.00 | $ | 135.00 | $ | 135.00 | $ | 135.00 | $ | 135.00 | $ | 135.00 | $ | 135.00 | $ | 135.00 | $ | 135.00 | $ | 135.00 | ||||||||||||||||||||||||
| Revenue | ||||||||||||||||||||||||||||||||||||||||||||||||
| Granite & Marble | $ | 881,663 | $ | 1,469,438 | $ | 1,763,326 | $ | 2,351,101 | $ | 2,644,989 | $ | 2,644,989 | $ | 2,644,989 | $ | 2,644,989 | $ | 2,938,877 | $ | 2,938,877 | $ | 3,232,764 | $ | 3,232,764 | ||||||||||||||||||||||||
| Graphite & Fluorite | $ | 619,919 | $ | 1,033,199 | $ | 1,239,839 | $ | 1,653,118 | $ | 1,859,758 | $ | 1,859,758 | $ | 1,859,758 | $ | 1,859,758 | $ | 2,066,398 | $ | 2,066,398 | $ | 2,273,037 | $ | 2,273,037 | ||||||||||||||||||||||||
| Total Revenue | $ | 1,501,582 | $ | 2,502,637 | $ | 3,003,165 | $ | 4,004,219 | $ | 4,504,747 | $ | 4,504,747 | $ | 4,504,747 | $ | 4,504,747 | $ | 5,005,274 | $ | 5,005,274 | $ | 5,505,802 | $ | 5,505,802 | ||||||||||||||||||||||||
| Direct Cost | ||||||||||||||||||||||||||||||||||||||||||||||||
| Granite & Marble | $ | 61.29 | $ | 61.29 | $ | 61.29 | $ | 61.29 | $ | 61.29 | $ | 61.29 | $ | 61.29 | $ | 61.29 | $ | 61.29 | $ | 61.29 | $ | 61.29 | $ | 61.29 | ||||||||||||||||||||||||
| Graphite & Fluorite | $ | 73.71 | $ | 73.71 | $ | 73.71 | $ | 73.71 | $ | 73.71 | $ | 73.71 | $ | 73.71 | $ | 73.71 | $ | 73.71 | $ | 73.71 | $ | 73.71 | $ | 73.71 | ||||||||||||||||||||||||
| Direct Cost of Revenue | ||||||||||||||||||||||||||||||||||||||||||||||||
| Granite & Marble | $ | 372,238 | $ | 620,397 | $ | 744,476 | $ | 992,635 | $ | 1,116,714 | $ | 1,116,714 | $ | 1,116,714 | $ | 1,116,714 | $ | 1,240,794 | $ | 1,240,794 | $ | 1,364,873 | $ | 1,364,873 | ||||||||||||||||||||||||
| Graphite & Fluorite | $ | 338,476 | $ | 564,127 | $ | 676,952 | $ | 902,602 | $ | 1,015,428 | $ | 1,015,428 | $ | 1,015,428 | $ | 1,015,428 | $ | 1,128,253 | $ | 1,128,253 | $ | 1,241,078 | $ | 1,241,078 | ||||||||||||||||||||||||
| Subtotal Cost of Revenue | $ | 710,714 | $ | 1,184,523 | $ | 1,421,428 | $ | 1,895,237 | $ | 2,132,142 | $ | 2,132,142 | $ | 2,132,142 | $ | 2,132,142 | $ | 2,369,047 | $ | 2,369,047 | $ | 2,605,952 | $ | 2,605,952 | ||||||||||||||||||||||||
| 20 |
Year 2015 Profit & Loss Account
| Month 1 | Month 2 | Month 3 | Month 4 | Month 5 | Month 6 | Month 7 | Month 8 | Month 9 | Month 10 | Month 11 | Month 12 | |||||||||||||||||||||||||||||||||||||
| Revenue | $ | 1,501,582 | $ | 2,502,637 | $ | 3,003,165 | $ | 4,004,219 | $ | 4,504,747 | $ | 4,504,747 | $ | 4,504,747 | $ | 4,504,747 | $ | 5,005,274 | $ | 5,005,274 | $ | 5,505,802 | $ | 5,505,802 | ||||||||||||||||||||||||
| Subtotal Cost of Revenue | $ | 710,714 | $ | 1,184,523 | $ | 1,421,428 | $ | 1,895,237 | $ | 2,132,142 | $ | 2,132,142 | $ | 2,132,142 | $ | 2,132,142 | $ | 2,369,047 | $ | 2,369,047 | $ | 2,605,952 | $ | 2,605,952 | ||||||||||||||||||||||||
| Gross Margin | $ | 790,868 | $ | 1,318,114 | $ | 1,581,736 | $ | 2,108,982 | $ | 2,372,605 | $ | 2,372,605 | $ | 2,372,605 | $ | 2,372,605 | $ | 2,636,227 | $ | 2,636,227 | $ | 2,899,850 | $ | 2,899,850 | ||||||||||||||||||||||||
| Gross Margin/Revenue | 52.67 | % | 52.67 | % | 52.67 | % | 52.67 | % | 52.67 | % | 52.67 | % | 52.67 | % | 52.67 | % | 52.67 | % | 52.67 | % | 52.67 | % | 52.67 | % | ||||||||||||||||||||||||
| Expenses | ||||||||||||||||||||||||||||||||||||||||||||||||
| Selling & Advertising Expenses | $ | 165,753 | $ | 165,753 | $ | 165,753 | $ | 165,753 | $ | 165,753 | $ | 165,753 | $ | 165,753 | $ | 165,753 | $ | 165,753 | $ | 165,753 | $ | 165,753 | $ | 165,753 | ||||||||||||||||||||||||
| Administrative Expenses | $ | 263,698 | $ | 263,698 | $ | 263,698 | $ | 263,698 | $ | 263,698 | $ | 263,698 | $ | 263,698 | $ | 263,698 | $ | 263,698 | $ | 263,698 | $ | 263,698 | $ | 263,698 | ||||||||||||||||||||||||
| General Expenses | $ | 113,013 | $ | 113,013 | $ | 113,013 | $ | 113,013 | $ | 113,013 | $ | 113,013 | $ | 113,013 | $ | 113,013 | $ | 113,013 | $ | 113,013 | $ | 113,013 | $ | 113,013 | ||||||||||||||||||||||||
| Salaries, Wages & Benefits | $ | 150,684 | $ | 150,684 | $ | 150,684 | $ | 150,684 | $ | 150,684 | $ | 150,684 | $ | 150,684 | $ | 150,684 | $ | 150,684 | $ | 150,684 | $ | 150,684 | $ | 150,684 | ||||||||||||||||||||||||
| Interest & Bank charges | $ | 60,274 | $ | 60,274 | $ | 60,274 | $ | 60,274 | $ | 60,274 | $ | 60,274 | $ | 60,274 | $ | 60,274 | $ | 60,274 | $ | 60,274 | $ | 60,274 | $ | 60,274 | ||||||||||||||||||||||||
| Research & Development | $ | 50,000 | $ | 50,000 | $ | 50,000 | $ | 50,000 | $ | 50,000 | $ | 50,000 | $ | 50,000 | $ | 50,000 | $ | 50,000 | $ | 50,000 | $ | 50,000 | $ | 50,000 | ||||||||||||||||||||||||
| Expansion Cost | $ | 121,200,000 | $ | 0 | $ | 0 | $ | 0 | $ | 0 | $ | 0 | $ | 0 | $ | 0 | $ | 0 | $ | 0 | $ | 0 | $ | 0 | ||||||||||||||||||||||||
| Depreciation | $ | 1,211,350 | $ | 1,211,350 | $ | 1,211,350 | $ | 1,211,350 | $ | 1,211,350 | $ | 1,211,350 | $ | 1,211,350 | $ | 1,211,350 | $ | 1,211,350 | $ | 1,211,350 | $ | 1,211,350 | $ | 1,211,350 | ||||||||||||||||||||||||
| Total Operating Expenses | $ | 123,214,773 | $ | 2,014,773 | $ | 2,014,773 | $ | 2,014,773 | $ | 2,014,773 | $ | 2,014,773 | $ | 2,014,773 | $ | 2,014,773 | $ | 2,014,773 | $ | 2,014,773 | $ | 2,014,773 | $ | 2,014,773 | ||||||||||||||||||||||||
| Profit Before Interest and Taxes | $ | (122,423,904 | ) | $ | (696,659 | ) | $ | (433,036 | ) | $ | 94,209 | $ | 357,832 | $ | 357,832 | $ | 357,832 | $ | 357,832 | $ | 621,455 | $ | 621,455 | $ | 885,078 | $ | 885,078 | |||||||||||||||||||||
| Taxes Incurred | $ | 0 | $ | 0 | $ | 0 | $ | 0 | $ | 0 | $ | 0 | $ | 0 | $ | 0 | $ | 0 | $ | 0 | $ | 0 | $ | 0 | ||||||||||||||||||||||||
| Net Profit | $ | (122,423,904 | ) | $ | (696,659 | ) | $ | (433,036 | ) | $ | 94,209 | $ | 357,832 | $ | 357,832 | $ | 357,832 | $ | 357,832 | $ | 621,455 | $ | 621,455 | $ | 885,078 | $ | 885,078 | |||||||||||||||||||||
| Net Profit/Revenue | -8152.99 | % | -27.84 | % | -14.42 | % | 2.35 | % | 7.94 | % | 7.94 | % | 7.94 | % | 7.94 | % | 12.42 | % | 12.42 | % | 16.08 | % | 16.08 | % | ||||||||||||||||||||||||
| 21 |
Year 1 Cost of Production/Sales
| Month 1 | Month 2 | Month 3 | Month 4 | Month 5 | Month 6 | Month 7 | Month 8 | Month 9 | Month 10 | Month 11 | Month 12 | |||||||||||||||||||||||||||||||||||||
| PERSONNEL COSTS | ||||||||||||||||||||||||||||||||||||||||||||||||
| Salaries, Wages and Allowances | $ | 63,964 | $ | 106,607 | $ | 127,929 | $ | 170,571 | $ | 191,893 | $ | 191,893 | $ | 191,893 | $ | 191,893 | $ | 213,214 | $ | 213,214 | $ | 234,536 | $ | 234,536 | ||||||||||||||||||||||||
| Overtime | $ | 7,107 | $ | 11,845 | $ | 14,214 | $ | 18,952 | $ | 21,321 | $ | 21,321 | $ | 21,321 | $ | 21,321 | $ | 23,690 | $ | 23,690 | $ | 26,060 | $ | 26,060 | ||||||||||||||||||||||||
| Social Security Costs | $ | 10,661 | $ | 17,768 | $ | 21,321 | $ | 28,429 | $ | 31,982 | $ | 31,982 | $ | 31,982 | $ | 31,982 | $ | 35,536 | $ | 35,536 | $ | 39,089 | $ | 39,089 | ||||||||||||||||||||||||
| Employee Tax Costs | $ | 14,214 | $ | 23,690 | $ | 28,429 | $ | 37,905 | $ | 42,643 | $ | 42,643 | $ | 42,643 | $ | 42,643 | $ | 47,381 | $ | 47,381 | $ | 52,119 | $ | 52,119 | ||||||||||||||||||||||||
| Personnel Insurance | $ | 7,107 | $ | 11,845 | $ | 14,214 | $ | 18,952 | $ | 21,321 | $ | 21,321 | $ | 21,321 | $ | 21,321 | $ | 23,690 | $ | 23,690 | $ | 26,060 | $ | 26,060 | ||||||||||||||||||||||||
| Contractual Staff | $ | 115,846 | $ | 193,077 | $ | 231,693 | $ | 308,924 | $ | 347,539 | $ | 347,539 | $ | 347,539 | $ | 347,539 | $ | 386,155 | $ | 386,155 | $ | 424,770 | $ | 424,770 | ||||||||||||||||||||||||
| Training Costs | $ | 3,554 | $ | 5,923 | $ | 7,107 | $ | 9,476 | $ | 10,661 | $ | 10,661 | $ | 10,661 | $ | 10,661 | $ | 11,845 | $ | 11,845 | $ | 13,030 | $ | 13,030 | ||||||||||||||||||||||||
| Travel and Subsistence | $ | 14,214 | $ | 23,690 | $ | 28,429 | $ | 37,905 | $ | 42,643 | $ | 42,643 | $ | 42,643 | $ | 42,643 | $ | 47,381 | $ | 47,381 | $ | 52,119 | $ | 52,119 | ||||||||||||||||||||||||
| Catering Costs | $ | 63,964 | $ | 106,607 | $ | 127,929 | $ | 170,571 | $ | 191,893 | $ | 191,893 | $ | 191,893 | $ | 191,893 | $ | 213,214 | $ | 213,214 | $ | 234,536 | $ | 234,536 | ||||||||||||||||||||||||
| Protective Clothing | $ | 7,107 | $ | 11,845 | $ | 14,214 | $ | 18,952 | $ | 21,321 | $ | 21,321 | $ | 21,321 | $ | 21,321 | $ | 23,690 | $ | 23,690 | $ | 26,060 | $ | 26,060 | ||||||||||||||||||||||||
| Safety Equipment | $ | 14,214 | $ | 23,690 | $ | 28,429 | $ | 37,905 | $ | 42,643 | $ | 42,643 | $ | 42,643 | $ | 42,643 | $ | 47,381 | $ | 47,381 | $ | 52,119 | $ | 52,119 | ||||||||||||||||||||||||
| Other Personnel Costs | $ | 35,536 | $ | 59,226 | $ | 71,071 | $ | 94,762 | $ | 106,607 | $ | 106,607 | $ | 106,607 | $ | 106,607 | $ | 118,452 | $ | 118,452 | $ | 130,298 | $ | 130,298 | ||||||||||||||||||||||||
| Sub-Total | $ | 357,489 | $ | 595,815 | $ | 714,978 | $ | 953,304 | $ | 1,072,468 | $ | 1,072,468 | $ | 1,072,468 | $ | 1,072,468 | $ | 1,191,631 | $ | 1,191,631 | $ | 1,310,794 | $ | 1,310,794 | ||||||||||||||||||||||||
| REPAIRS AND MAINTENANCE COSTS | ||||||||||||||||||||||||||||||||||||||||||||||||
| Materials | $ | 71,071 | $ | 118,452 | $ | 142,143 | $ | 189,524 | $ | 213,214 | $ | 213,214 | $ | 213,214 | $ | 213,214 | $ | 236,905 | $ | 236,905 | $ | 260,595 | $ | 260,595 | ||||||||||||||||||||||||
| Miscellaneous Repairs & Spares | $ | 21,321 | $ | 35,536 | $ | 42,643 | $ | 56,857 | $ | 63,964 | $ | 63,964 | $ | 63,964 | $ | 63,964 | $ | 71,071 | $ | 71,071 | $ | 78,179 | $ | 78,179 | ||||||||||||||||||||||||
| Travelling Equipment | $ | 7,107 | $ | 11,845 | $ | 14,214 | $ | 18,952 | $ | 21,321 | $ | 21,321 | $ | 21,321 | $ | 21,321 | $ | 23,690 | $ | 23,690 | $ | 26,060 | $ | 26,060 | ||||||||||||||||||||||||
| Ac Electric System | $ | 3,554 | $ | 5,923 | $ | 7,107 | $ | 9,476 | $ | 10,661 | $ | 10,661 | $ | 10,661 | $ | 10,661 | $ | 11,845 | $ | 11,845 | $ | 13,030 | $ | 13,030 | ||||||||||||||||||||||||
| Office Supplies | $ | 17,768 | $ | 29,613 | $ | 35,536 | $ | 47,381 | $ | 53,304 | $ | 53,304 | $ | 53,304 | $ | 53,304 | $ | 59,226 | $ | 59,226 | $ | 65,149 | $ | 65,149 | ||||||||||||||||||||||||
| Lubricating Oils | $ | 21,321 | $ | 35,536 | $ | 42,643 | $ | 56,857 | $ | 63,964 | $ | 63,964 | $ | 63,964 | $ | 63,964 | $ | 71,071 | $ | 71,071 | $ | 78,179 | $ | 78,179 | ||||||||||||||||||||||||
| Workshop Equipment | $ | 14,214 | $ | 23,690 | $ | 28,429 | $ | 37,905 | $ | 42,643 | $ | 42,643 | $ | 42,643 | $ | 42,643 | $ | 47,381 | $ | 47,381 | $ | 52,119 | $ | 52,119 | ||||||||||||||||||||||||
| HVAC System | $ | 3,554 | $ | 5,923 | $ | 7,107 | $ | 9,476 | $ | 10,661 | $ | 10,661 | $ | 10,661 | $ | 10,661 | $ | 11,845 | $ | 11,845 | $ | 13,030 | $ | 13,030 | ||||||||||||||||||||||||
| Accomodation | $ | 7,107 | $ | 11,845 | $ | 14,214 | $ | 18,952 | $ | 21,321 | $ | 21,321 | $ | 21,321 | $ | 21,321 | $ | 23,690 | $ | 23,690 | $ | 26,060 | $ | 26,060 | ||||||||||||||||||||||||
| Lifting Equipments | $ | 14,214 | $ | 23,690 | $ | 28,429 | $ | 37,905 | $ | 42,643 | $ | 42,643 | $ | 42,643 | $ | 42,643 | $ | 47,381 | $ | 47,381 | $ | 52,119 | $ | 52,119 | ||||||||||||||||||||||||
| Repairs Mining Equipment | $ | 17,768 | $ | 29,613 | $ | 35,536 | $ | 47,381 | $ | 53,304 | $ | 53,304 | $ | 53,304 | $ | 53,304 | $ | 59,226 | $ | 59,226 | $ | 65,149 | $ | 65,149 | ||||||||||||||||||||||||
| Inspection Service Units | $ | 12,082 | $ | 20,137 | $ | 24,164 | $ | 32,219 | $ | 36,246 | $ | 36,246 | $ | 36,246 | $ | 36,246 | $ | 40,274 | $ | 40,274 | $ | 44,301 | $ | 44,301 | ||||||||||||||||||||||||
| Sub-Total | $ | 211,082 | $ | 351,803 | $ | 422,164 | $ | 562,886 | $ | 633,246 | $ | 633,246 | $ | 633,246 | $ | 633,246 | $ | 703,607 | $ | 703,607 | $ | 773,968 | $ | 773,968 | ||||||||||||||||||||||||
| OTHER DIRECT COSTS | ||||||||||||||||||||||||||||||||||||||||||||||||
| Repairs Vehicles & Trucks | $ | 14,214 | $ | 23,690 | $ | 28,429 | $ | 37,905 | $ | 42,643 | $ | 42,643 | $ | 42,643 | $ | 42,643 | $ | 47,381 | $ | 47,381 | $ | 52,119 | $ | 52,119 | ||||||||||||||||||||||||
| Spares Vehicles and Trucks | $ | 14,214 | $ | 23,690 | $ | 28,429 | $ | 37,905 | $ | 42,643 | $ | 42,643 | $ | 42,643 | $ | 42,643 | $ | 47,381 | $ | 47,381 | $ | 52,119 | $ | 52,119 | ||||||||||||||||||||||||
| Freight Expense | $ | 21,321 | $ | 35,536 | $ | 42,643 | $ | 56,857 | $ | 63,964 | $ | 63,964 | $ | 63,964 | $ | 63,964 | $ | 71,071 | $ | 71,071 | $ | 78,179 | $ | 78,179 | ||||||||||||||||||||||||
| Energy Cost | $ | 35,536 | $ | 59,226 | $ | 71,071 | $ | 94,762 | $ | 106,607 | $ | 106,607 | $ | 106,607 | $ | 106,607 | $ | 118,452 | $ | 118,452 | $ | 130,298 | $ | 130,298 | ||||||||||||||||||||||||
| External Service | $ | 17,768 | $ | 29,613 | $ | 35,536 | $ | 47,381 | $ | 53,304 | $ | 53,304 | $ | 53,304 | $ | 53,304 | $ | 59,226 | $ | 59,226 | $ | 65,149 | $ | 65,149 | ||||||||||||||||||||||||
| Depreciaiton Related to Sales and Royalty Expense | $ | 24,875 | $ | 41,458 | $ | 49,750 | $ | 66,333 | $ | 74,625 | $ | 74,625 | $ | 74,625 | $ | 74,625 | $ | 82,917 | $ | 82,917 | $ | 91,208 | $ | 91,208 | ||||||||||||||||||||||||
| Base & Other Direct Costs | $ | 14,214 | $ | 23,690 | $ | 28,429 | $ | 37,905 | $ | 42,643 | $ | 42,643 | $ | 42,643 | $ | 42,643 | $ | 47,381 | $ | 47,381 | $ | 52,119 | $ | 52,119 | ||||||||||||||||||||||||
| Sub-Total | $ | 142,143 | $ | 236,905 | $ | 284,286 | $ | 379,047 | $ | 426,428 | $ | 426,428 | $ | 426,428 | $ | 426,428 | $ | 473,809 | $ | 473,809 | $ | 521,190 | $ | 521,190 | ||||||||||||||||||||||||
| Grand Total | $ | 710,714 | $ | 1,184,523 | $ | 1,421,428 | $ | 1,895,237 | $ | 2,132,142 | $ | 2,132,142 | $ | 2,132,142 | $ | 2,132,142 | $ | 2,369,047 | $ | 2,369,047 | $ | 2,605,952 | $ | 2,605,952 | ||||||||||||||||||||||||
Year 2015 Cash Flow
| Additional Cash Received | Month 1 | Month 2 | Month 3 | Month 4 | Month 5 | Month 6 | Month 7 | Month 8 | Month 9 | Month 10 | Month 11 | Month 12 | ||||||||||||||||||||||||||||||||||||
| Revenue | $ | 1,501,582 | $ | 2,502,637 | $ | 3,003,165 | $ | 4,004,219 | $ | 4,504,747 | $ | 4,504,747 | $ | 4,504,747 | $ | 4,504,747 | $ | 5,005,274 | $ | 5,005,274 | $ | 5,505,802 | $ | 5,505,802 | ||||||||||||||||||||||||
| Owner Contribution | $ | 10,000,000 | $ | 0 | $ | 0 | $ | 0 | $ | 0 | $ | 0 | $ | 0 | $ | 0 | $ | 0 | $ | 0 | $ | 0 | $ | 0 | ||||||||||||||||||||||||
| Proceeds from Investor | $ | 1,000,000,000 | $ | 0 | $ | 0 | $ | 0 | $ | 0 | $ | 0 | $ | 0 | $ | 0 | $ | 0 | $ | 0 | $ | 0 | $ | 0 | ||||||||||||||||||||||||
| Subtotal Cash Received | $ | 1,011,501,582 | $ | 2,502,637 | $ | 3,003,165 | $ | 4,004,219 | $ | 4,504,747 | $ | 4,504,747 | $ | 4,504,747 | $ | 4,504,747 | $ | 5,005,274 | $ | 5,005,274 | $ | 5,505,802 | $ | 5,505,802 | ||||||||||||||||||||||||
| Bill Payments | $ | 0 | $ | 1,514,136 | $ | 1,987,946 | $ | 2,224,850 | $ | 2,698,660 | $ | 2,935,564 | $ | 2,935,564 | $ | 2,935,564 | $ | 2,935,564 | $ | 3,172,469 | $ | 3,172,469 | $ | 3,409,374 | ||||||||||||||||||||||||
| Additional Cash Spent | ||||||||||||||||||||||||||||||||||||||||||||||||
| Start-up Costs | $ | 121,200,000 | $ | 0 | $ | 0 | $ | 0 | $ | 0 | $ | 0 | $ | 0 | $ | 0 | $ | 0 | $ | 0 | $ | 0 | $ | 0 | ||||||||||||||||||||||||
| Purchase Long-term Assets | $ | 383,800,000 | $ | 0 | $ | 0 | $ | 0 | $ | 0 | $ | 0 | $ | 0 | $ | 0 | $ | 0 | $ | 0 | $ | 0 | $ | 0 | ||||||||||||||||||||||||
| Cash Spent | $ | 929,200,000 | $ | 1,514,136 | $ | 1,987,946 | $ | 2,224,850 | $ | 2,698,660 | $ | 2,935,564 | $ | 2,935,564 | $ | 2,935,564 | $ | 2,935,564 | $ | 3,172,469 | $ | 3,172,469 | $ | 3,409,374 | ||||||||||||||||||||||||
| Net Cash Flow | $ | 82,301,582 | $ | 988,501 | $ | 1,015,219 | $ | 1,779,369 | $ | 1,806,087 | $ | 1,569,182 | $ | 1,569,182 | $ | 1,569,182 | $ | 2,069,710 | $ | 1,832,805 | $ | 2,333,333 | $ | 2,096,428 | ||||||||||||||||||||||||
| Cash Balance | $ | 82,302,048 | $ | 83,290,549 | $ | 84,305,768 | $ | 86,085,137 | $ | 87,891,224 | $ | 89,460,406 | $ | 91,029,589 | $ | 92,598,771 | $ | 94,668,481 | $ | 96,501,286 | $ | 98,834,619 | $ | 100,931,047 | ||||||||||||||||||||||||
| 22 |
Year 2015 Balance Sheet
| Month 1 | Month 2 | Month 3 | Month 4 | Month 5 | Month 6 | Month 7 | Month 8 | Month 9 | Month 10 | Month 11 | Month 12 | |||||||||||||||||||||||||||||||||||||
| Current Assets | ||||||||||||||||||||||||||||||||||||||||||||||||
| Cash | $ | 82,302,048 | $ | 83,290,549 | $ | 84,305,768 | $ | 86,085,137 | $ | 87,891,224 | $ | 89,460,406 | $ | 91,029,589 | $ | 92,598,771 | $ | 94,668,481 | $ | 96,501,286 | $ | 98,834,619 | $ | 100,931,047 | ||||||||||||||||||||||||
| Inventory | $ | 3,843 | $ | 3,843 | $ | 3,843 | $ | 3,843 | $ | 3,843 | $ | 3,843 | $ | 3,843 | $ | 3,843 | $ | 3,843 | $ | 3,843 | $ | 3,843 | $ | 3,843 | ||||||||||||||||||||||||
| Other Current Assets | $ | 761,696 | $ | 761,696 | $ | 761,696 | $ | 761,696 | $ | 761,696 | $ | 761,696 | $ | 761,696 | $ | 761,696 | $ | 761,696 | $ | 761,696 | $ | 761,696 | $ | 761,696 | ||||||||||||||||||||||||
| Total Current Assets | $ | 83,067,587 | $ | 84,056,088 | $ | 85,071,307 | $ | 86,850,676 | $ | 88,656,763 | $ | 90,225,945 | $ | 91,795,128 | $ | 93,364,310 | $ | 95,434,020 | $ | 97,266,825 | $ | 99,600,158 | $ | 101,696,586 | ||||||||||||||||||||||||
| Long-term Assets | $ | 436,086,087 | $ | 436,086,087 | $ | 436,086,087 | $ | 436,086,087 | $ | 436,086,087 | $ | 436,086,087 | $ | 436,086,087 | $ | 436,086,087 | $ | 436,086,087 | $ | 436,086,087 | $ | 436,086,087 | $ | 436,086,087 | ||||||||||||||||||||||||
| Accumulated Depreciation | $ | 1,211,350 | $ | 2,422,700 | $ | 3,634,051 | $ | 4,845,401 | $ | 6,056,751 | $ | 7,268,101 | $ | 8,479,452 | $ | 9,690,802 | $ | 10,902,152 | $ | 12,113,502 | $ | 13,324,853 | $ | 14,536,203 | ||||||||||||||||||||||||
| Total Long-term Assets | $ | 434,874,737 | $ | 433,663,387 | $ | 432,452,036 | $ | 431,240,686 | $ | 430,029,336 | $ | 428,817,986 | $ | 427,606,635 | $ | 426,395,285 | $ | 425,183,935 | $ | 423,972,585 | $ | 422,761,234 | $ | 421,549,884 | ||||||||||||||||||||||||
| Other Assets | ||||||||||||||||||||||||||||||||||||||||||||||||
| Other Assets | $ | 426,185,178 | $ | 426,185,178 | $ | 426,185,178 | $ | 426,185,178 | $ | 426,185,178 | $ | 426,185,178 | $ | 426,185,178 | $ | 426,185,178 | $ | 426,185,178 | $ | 426,185,178 | $ | 426,185,178 | $ | 426,185,178 | ||||||||||||||||||||||||
| Total Assets | $ | 944,127,502 | $ | 943,904,653 | $ | 943,708,521 | $ | 944,276,540 | $ | 944,871,277 | $ | 945,229,109 | $ | 945,586,941 | $ | 945,944,773 | $ | 946,803,133 | $ | 947,424,588 | $ | 948,546,570 | $ | 949,431,648 | ||||||||||||||||||||||||
| Current Liabilities | ||||||||||||||||||||||||||||||||||||||||||||||||
| Accounts Payable | $ | 9,934,779 | $ | 10,408,589 | $ | 10,645,493 | $ | 11,119,303 | $ | 11,356,207 | $ | 11,356,207 | $ | 11,356,207 | $ | 11,356,207 | $ | 11,593,112 | $ | 11,593,112 | $ | 11,830,017 | $ | 11,830,017 | ||||||||||||||||||||||||
| Current Borrowing | $ | 1,893,264 | $ | 1,893,264 | $ | 1,893,264 | $ | 1,893,264 | $ | 1,893,264 | $ | 1,893,264 | $ | 1,893,264 | $ | 1,893,264 | $ | 1,893,264 | $ | 1,893,264 | $ | 1,893,264 | $ | 1,893,264 | ||||||||||||||||||||||||
| Other Current Liabilities | $ | 13,244 | $ | 13,244 | $ | 13,244 | $ | 13,244 | $ | 13,244 | $ | 13,244 | $ | 13,244 | $ | 13,244 | $ | 13,244 | $ | 13,244 | $ | 13,244 | $ | 13,244 | ||||||||||||||||||||||||
| Subtotal Current Liabilities | $ | 11,841,287 | $ | 12,315,097 | $ | 12,552,001 | $ | 13,025,811 | $ | 13,262,715 | $ | 13,262,715 | $ | 13,262,715 | $ | 13,262,715 | $ | 13,499,620 | $ | 13,499,620 | $ | 13,736,525 | $ | 13,736,525 | ||||||||||||||||||||||||
| Total Liabilities | $ | 11,841,287 | $ | 12,315,097 | $ | 12,552,001 | $ | 13,025,811 | $ | 13,262,715 | $ | 13,262,715 | $ | 13,262,715 | $ | 13,262,715 | $ | 13,499,620 | $ | 13,499,620 | $ | 13,736,525 | $ | 13,736,525 | ||||||||||||||||||||||||
| Paid-in Capital | $ | 1,019,554,670 | $ | 1,019,554,670 | $ | 1,019,554,670 | $ | 1,019,554,670 | $ | 1,019,554,670 | $ | 1,019,554,670 | $ | 1,019,554,670 | $ | 1,019,554,670 | $ | 1,019,554,670 | $ | 1,019,554,670 | $ | 1,019,554,670 | $ | 1,019,554,670 | ||||||||||||||||||||||||
| Retained Earnings | $ | 35,155,449 | $ | 35,155,449 | $ | 35,155,449 | $ | 35,155,449 | $ | 35,155,449 | $ | 35,155,449 | $ | 35,155,449 | $ | 35,155,449 | $ | 35,155,449 | $ | 35,155,449 | $ | 35,155,449 | $ | 35,155,449 | ||||||||||||||||||||||||
| Earnings | $ | (122,423,904 | ) | $ | (123,120,563 | ) | $ | (123,553,599 | ) | $ | (123,459,390 | ) | $ | (123,101,558 | ) | $ | (122,743,725 | ) | $ | (122,385,893 | ) | $ | (122,028,061 | ) | $ | (121,406,606 | ) | $ | (120,785,151 | ) | $ | (119,900,074 | ) | $ | (119,014,996 | ) | ||||||||||||
| Total Capital | $ | 932,286,215 | $ | 931,589,556 | $ | 931,156,520 | $ | 931,250,729 | $ | 931,608,561 | $ | 931,966,394 | $ | 932,324,226 | $ | 932,682,058 | $ | 933,303,513 | $ | 933,924,968 | $ | 934,810,045 | $ | 935,695,123 | ||||||||||||||||||||||||
| Total Liabilities and Capital | $ | 944,127,502 | $ | 943,904,653 | $ | 943,708,521 | $ | 944,276,540 | $ | 944,871,277 | $ | 945,229,109 | $ | 945,586,941 | $ | 945,944,773 | $ | 946,803,133 | $ | 947,424,588 | $ | 948,546,570 | $ | 949,431,648 | ||||||||||||||||||||||||
| Net Worth | $ | 932,286,215 | $ | 931,589,556 | $ | 931,156,520 | $ | 931,250,729 | $ | 931,608,561 | $ | 931,966,394 | $ | 932,324,226 | $ | 932,682,058 | $ | 933,303,513 | $ | 933,924,968 | $ | 934,810,045 | $ | 935,695,123 | ||||||||||||||||||||||||
| 23 |
Listing on a National Exchange
Company will apply to list our common stock on The NASDAQ Stock Market. In order for our common stock to be listed, we must fulfill certain listing requirements including a minimum stock price for our common stock. At our Special Meeting of Stockholders held on 1 October, 2015, we received stockholder approval to effect a reverse stock split of our outstanding common stock and to change the allowable exchange ratio to not less than 1-for-4 and not more than 1-for-25. We expect that a reverse stock split would initially result in an increase in the price per share of our common stock and substantially reduce the risk that a U.S. national securities exchange would decline to list our common stock on the basis of failure to meet the exchange’s minimum stock price. No assurances can be given that, even if we satisfy this listing requirement, our listing on The NASDAQ Stock Market or another U.S. national securities exchange will be approved, or that, if our common stock is listed on The NASDAQ Stock Market or another U.S. national securities exchange, we will be able to satisfy the maintenance requirements for continued listing.
Risk Factors
Investing in our common stock involves risks that include the limited operating history, securing adequate capital to continue to expand, maintaining an efficient operating and business model, speculative nature of gold trading, competition, volatile commodity prices and other material factors. For a discussion of these risks and other considerations that could negatively affect the Company, including risks related to this offering and our common stock, see “Risk Factors” and “Cautionary Note Regarding Forward-Looking Statements.”
Corporate Information
Our principal office is located at 48 Wall Street, 11 Floor, New York, NY 10005, and our telephone number is (646) 837-7950. Our website is www.fudagroupusa.com . We expect to make our periodic reports and other information filed with or furnished to the SEC available free of charge through our website as soon as reasonably practicable after those reports and other information are electronically filed with or furnished to the SEC. Information on our website or any other website is not incorporated by reference herein and does not constitute a part of this prospectus.
| 24 |
This prospectus relates to the offer and sale of 135,954,309 shares (“Shares”) of common stock of the Company, as follows: (a) 30,000,000 Shares offered by the Company and (b) 105,954,309 Shares offered by the holders thereof (the “Selling Shareholder Shares”), who are deemed to be statutory underwriters.
.
| Common stock outstanding before the offering | 105,954,309 | (1) | ||
| Common stock for sale by the Company | 30,000,000 | |||
| Common stock for sale by selling shareholders | 105,954,309 | |||
| Common stock outstanding after the offering | 135,954,309 | (2) | ||
| Proceeds to the Company | $ | (3) |
(1) Based on number of shares outstanding as of the date of this prospectus.
(2) Assumes the sale of the maximum number of Shares.
(3) The Company will offer the Shares directly without payment to any officer or director of any commission or compensation for sale of the Shares. The Company will also attempt to locate broker-dealers or selling agents to participate in the sale of the Shares. In such cases, the Company will pay customary selling commissions and expenses of such sales which would reduce the proceeds to the Company.
Any and all funds received by the Company for sales of Shares by the Company at any time in the offering will become immediately available to the Company. There is no fixed amount or number of Shares that must be reached or sold before any closing or use of any funds can occur.
| Use of proceeds | We expect to receive $ million of net proceeds from the sale of the common stock offered by us, after deducting underwriting discounts and commissions and estimated offering expenses. We intend to use the net proceeds from this offering to purchase additional shares of our common stock to fund our future capital development program and for general corporate purposes. |
| Dividend policy | We do not anticipate paying any cash dividends on our common stock. |
| Listing | We intend to apply to list our common stock on NASDAQ. |
| Risk factors | You should carefully read and consider the information beginning on page 26 of this prospectus set forth under the heading “Risk Factors” and all other information set forth in this prospectus before deciding to invest in our common stock. |
The Company had no operations or specific business plan until the Acquisitions.
The condensed statements of operations data for the year ended December 31, 2014 and 2013, and the condensed balance sheet data as of December 31, 2014 are derived from the audited financial statements of Liaoning Fuda Mining Co. Ltd (which was subsequently acquired by Marvel and consolidated under Marvel subsequently) and related notes thereto included herein.
| Year ended | Year ended | |||||||
| December 31, 2014 | December 31, 2013 | |||||||
| Statement of operations data | ||||||||
| Revenue | $ | 42,518,470 | $ | 58,584,590 | ||||
| Gross profit | $ | 28,248,139 | $ | 25,169,638 | ||||
| Income (Loss) from operations | $ | 27,018,801 | $ | 13,338,468 | ||||
| Net income (loss) | $ | 27,016,168 | $ | 7,961,161 | ||||
| 25 |
| At December 31, 2014 | At December 31, 2013 | |||||||
| Balance sheet data | ||||||||
| Cash | $ | 466 | $ | 3,112,528 | ||||
| Other assets | $ | 55,036,804 | $ | 33,185,461 | ||||
| Total assets | $ | 55,037,270 | $ | 36,279,989 | ||||
| Total liabilities | $ | 10,327,151 | $ | 18,490,102 | ||||
| Total members’ equity (deficit) | $ | 44,710,119 | $ | 17,807,887 | ||||
An investment in the Company’s common stock involves a high degree of risk. Investors should carefully consider the following risks and all of the other information contained in this prospectus before the purchase of the Shares. Our business, financial condition and results of operations could be materially and adversely affected by any of these risks. The risks described below are not the only ones facing us. Additional risks not presently known to us or which we consider immaterial also may adversely affect us. If any of the following risks actually occur, the business, financial condition or results of operations of the Company would likely suffer. In this case, the market price of the common stock could decline, and investors may lose all or part of the money their investment.
Risks Related to Our Business
The Company is an early-stage company with a limited operating history, and as such, any prospective investor may have difficulty in assessing the Company’s profitability or performance.
Because the Company (except Fuda Mining Co.) is an early-stage company with a limited operating history, it could be difficult for any investor to assess the performance of the Company or to determine whether the Company will meet its projected business plan. The Company has limited financial results upon which an investor may judge its potential. As a company still in the early stages of its life, the Company may in the future experience under-capitalization, shortages, setbacks and many of the problems, delays and expenses encountered by any early-stage business. An investor will be required to make an investment decision based solely on the Company management’s history, its projected operations in light of the risks, the limited operations and financial results of the Company to date, and any expenses and uncertainties that may be encountered by one engaging in the Company’s industry.
The Company is an early-stage company and has little experience in being a public company.
The Company is an early-stage company and as such has little experience in managing a public company. Such lack of experience may result in the Company experiencing difficulty in adequately operating and growing its business. Further, the Company may be hampered by lack of experience in addressing the issues and considerations which are common to growing companies. As such, the Company’s business performance might likely suffer.
The Company may not successfully consummate or initiate acquisitions.
The ability of the Company to grow through acquisitions (as planned) will depend on a number of factors, including competition for acquisitions, the availability of capital and other resources to consummate acquisitions, and the ability to successfully integrate and train additional staff, including the staff of an acquired company. There can be no assurance that the Company will continue to be able to establish and expand its market presence or to successfully identify suitable acquisition candidates and complete acquisitions on favorable terms.
In addition to facing competition in identifying and consummating successful acquisitions, such acquisitions could involve significant risks, including:
| - | difficulties in the assimilation of the operations, services, and corporate culture of acquired companies, and higher-than-anticipated costs associated with such assimilation; |
| - | over-valuation of acquired companies or delays in realizing or a failure to realize the benefits, revenues, cost savings, and synergies that were anticipated; |
| - | difficulties in integrating the acquired business into information systems, controls, policies, and procedures; |
| - | failure to retain key personnel, business relationships, reputation, or clients of an acquired business; |
| - | the potential impairment of acquired assets; |
| - | diversion of management’s attention from other business activities; |
insufficient indemnification from the selling parties for legal liabilities incurred by the acquired companies prior to acquisition;
| - | the assumption of unknown liabilities and additional risks of the acquired business; and |
| 26 |
| - | unforeseen operating difficulties that require significant financial and managerial resources that would otherwise be available for the ongoing development or expansion of existing operations. |
In addition, future acquisitions could materially and adversely affect the Company’s business, financial condition, results of operations, and liquidity. Possible impairment losses on goodwill and intangible assets, or restructuring charges could occur. These risks could have a material adverse effect on the business because they may result in substantial costs to the Company and disrupt its business.
Reliance on third party agreements and relationships is necessary for development of the Company's business.
The Company will need strong third party relationships and partnerships in order to develop and grow its business. The Company will be substantially dependent on these strategic partners and third party relationships. As a result the Company expects to incur additional expenses which could adversely affect the business, financial condition and results of operations.
The Company is an early-stage company and has a limited history of its operations. The Company will need to continue generating revenue in order to maintain sustained profitability. Ultimately, in spite of the Company’s best or reasonable efforts, the Company may have difficulty in generating revenues or remaining profitable.
The Company does not have any independent directors.
All of the directors of the Company are executive officers and/or employees of the Company. As such, the Company does not have any independent oversight or administration of its management and operations. The Company’s decision-making may suffer from the lack of an independent set of directors, since only officers and employees of the Company will make all important decisions regarding the Company.
The Company depends on its management team to manage its business effectively.
The Company's future success is dependent in large part upon its ability to understand and develop the business plan and to attract and retain highly skilled management, operational and executive personnel. In particular, due to the relatively early stage of the Company's business, its future success is highly dependent on its officers, to provide the necessary experience and background to execute the Company's business plan. The loss of any officer’s services could impede, particularly initially as the Company builds a record and reputation, its ability to develop its objectives, and as such would negatively impact the Company's possible overall development.
The Company may face significant competition from companies that serve its industries.
The Company may face competition from other companies that offer similar solutions. Some of these potential competitors may have longer operating histories, greater brand recognition, larger client bases and significantly greater financial, technical and marketing resources than the Company possesses. These advantages may enable such competitors to respond more quickly to new or emerging trends and changes in customer preferences. These advantages may also allow them to engage in more extensive market research and development, undertake extensive far-reaching marketing campaigns, adopt more aggressive pricing policies and make more attractive offers to potential customers, employees and strategic partners. The Company believes that its current and anticipated solutions are, and will be, sufficiently different from existing competition, and that there is limited to no competition in its local area. However, it is nevertheless possible that potential competitors may have or may rapidly acquire significant market share. Increased competition may result in price reductions, reduced gross margin and loss of market share. The Company may not be able to compete successfully, and competitive pressures may adversely affect its business, results of operations and financial condition.
The Company does not maintain certain insurance, including errors and omissions and indemnification insurance.
The Company has limited capital and, therefore, does not currently have a policy of insurance against liabilities arising out of the negligence of its officers and directors and/or deficiencies in any of its business operations. Even assuming that the Company obtained insurance, there is no assurance that such insurance coverage would be adequate to satisfy any potential claims made against the Company, its officers and directors, or its business operations. Any such liability which might arise could be substantial and may exceed the assets of the Company. The certificate of incorporation and by-laws of the Company provide for indemnification of officers and directors to the fullest extent permitted under Delaware law. Insofar as indemnification for liabilities arising under the Securities Act may be permitted to directors, officers and controlling persons, it is the opinion of the Securities and Exchange Commission that such indemnification is against public policy, as expressed in the Act, and is therefore, unenforceable.
| 27 |
The Company is subject to the potential factors of market and customer changes.
The business of the Company is susceptible to rapidly changing preferences of the marketplace and its customers. The needs of customers are subject to constant change, as staffing needs are as quick to change as are the businesses of customers. Although the Company intends to continue to develop and improve its products and services to meet changing customer needs of the marketplace, there can be no assurance that funds for such expenditures will be available or that the Company's competition will not develop similar or superior capabilities or that the Company will be successful in its internal efforts. The future success of the Company will depend in part on its ability to respond effectively to rapidly changing trends, industry standards and customer requirements by adapting and improving the features and functions of its services. In the Company’s industry, failure by a business to adapt to the changing needs and demands of customers is likely to render the business obsolete.
Government regulation could negatively impact the business.
The Company’s business segments may be subject to various government regulations in the jurisdictions in which they operate. Due to the potential wide scope of the Company’s operations, the Company could be subject to regulation by various political and regulatory entities, including various local and municipal agencies and government sub-divisions. The Company may incur increased costs necessary to comply with existing and newly adopted laws and regulations or penalties for any failure to comply. The Company’s operations could be adversely affected, directly or indirectly, by existing or future laws and regulations relating to its business or industry.
The Company is susceptible to changes in economic conditions.
Demand for natural resources may decline with changing economic conditions. For example, decline in private construction projects may reduce demand for granite products that the Company operates in. International economic conditions or a slowdown of growth in China or around the globe could harm the Company’s business and operations.
Changes in prices for metals or products will affect the Company’s profitability and operations.
Commodities, such as gold, fluctuate and change in price on a daily basis. Changes in these prices could negatively affect the Company’s operations and profitability.
The Company is dependent on its suppliers, and business difficulty for a supplier could harm the Company’s own business.
The Company relies on its key suppliers. Difficulties that the suppliers experience will burden the Company’s ability to operate. The Company needs to diversify among suppliers, but until such time, the Company is dependent and exposed to the risk of its current key suppliers.
The Company is exposed to seasonal risks in its business and operations.
The Company’s business can encounter seasonal issues from time to time in granite and marble mining as the mining and processing activities can typically be done at year round and during the seasonal periods that construction demand slowed, the mines and processing continued operations and built up inventories to prepare for the periods of higher demand.
The Company has a small financial and accounting organization. Being a public company strains the Company's resources, diverts management’s attention and affects its ability to attract and retain qualified officers and directors.
As a reporting company, the Company is already subject to the reporting requirements of the Securities Exchange Act of 1934. However, the requirements of these laws and the rules and regulations promulgated thereunder entail significant accounting, legal and financial compliance costs which are potentially prohibitive to the Company as it develops its business plan, products and scope. These costs have made, and will continue to make, some activities more difficult, time consuming or costly and may place significant strain on its personnel, systems and resources.
The Securities Exchange Act requires, among other things, that companies maintain effective disclosure controls and procedures and internal control over financial reporting. In order to maintain the requisite disclosure controls and procedures and internal control over financial reporting, significant resources and management oversight are required. As a result, management’s attention may be diverted from other business concerns, which could have a material adverse effect on the development of the Company's business, financial condition and results of operations.
| 28 |
The Company's election not to opt out of JOBS Act extended accounting transition period may not make its financial statements easily comparable to other companies.
Pursuant to the JOBS Act of 2012, as an emerging growth company the Company can elect to opt out of the extended transition period for any new or revised accounting standards that may be issued by the PCAOB or the SEC. The Company has elected not to opt out of such extended transition period which means that when a standard is issued or revised and it has different application dates for public or private companies, the Company, as an emerging growth company, can adopt the standard for the private company. This may make comparison of the Company's financial statements with any other public company which is not either an emerging growth company nor an emerging growth company which has opted out of using the extended transition period difficult or impossible as possible different or revised standards may be used.
The recently enacted JOBS Act will also allow the Company to postpone the date by which it must comply with certain laws and regulations intended to protect investors and to reduce the amount of information provided in reports filed with the SEC.
The recently enacted JOBS Act is intended to reduce the regulatory burden on “emerging growth companies. The Company meets the definition of an emerging growth company and so long as it qualifies as an “emerging growth company,” it will, among other things:
be exempt from the provisions of Section 404(b) of the Sarbanes-Oxley Act requiring that its independent registered public accounting firm provide an attestation report on the effectiveness of its internal control over financial reporting;
be exempt from the “say on pay” provisions (requiring a non-binding shareholder vote to approve compensation of certain executive officers) and the “say on golden parachute” provisions (requiring a non-binding shareholder vote to approve golden parachute arrangements for certain executive officers in connection with mergers and certain other business combinations) of the Dodd-Frank Act and certain disclosure requirements of the Dodd- Frank Act relating to compensation of its chief executive officer;
be permitted to omit the detailed compensation discussion and analysis from proxy statements and reports filed under the Securities Exchange Act of 1934 and instead provide a reduced level of disclosure concerning executive compensation; and
be exempt from any rules that may be adopted by the Public Company Accounting Oversight Board requiring mandatory audit firm rotation or a supplement to the auditor’s report on the financial statements.
Although the Company is still evaluating the JOBS Act, it currently intends to take advantage of some or all of the reduced regulatory and reporting requirements that will be available to it so long as it qualifies as an “emerging growth company,”. The Company has elected not to opt out of the extension of time to comply with new or revised financial accounting standards available under Section 102(b) of the JOBS Act. Among other things, this means that the Company's independent registered public accounting firm will not be required to provide an attestation report on the effectiveness of the Company's internal control over financial reporting so long as it qualifies as an emerging growth company, which may increase the risk that weaknesses or deficiencies in the internal control over financial reporting go undetected. Likewise, so long as it qualifies as an emerging growth company, the Company may elect not to provide certain information, including certain financial information and certain information regarding compensation of executive officers that would otherwise have been required to provide in filings with the SEC, which may make it more difficult for investors and securities analysts to evaluate the Company. As a result, investor confidence in the Company and the market price of its common stock may be adversely affected.
If the Company is unable to generate sufficient cash from operations, it may find it necessary to curtail operational activities.
The Company has an extensive business plan hinged on its ability to market and commercialize its products. If the Company is unable to market and/or commercialize its products, then it would not be able to proceed with its business plan or possibly to successfully develop its planned operations at all.
The proposed operations of the Company are speculative.
The success of the proposed business plan of the Company will depend to a great extent on the operations, financial condition and management of the Company. The business operations of the Company remain speculative.
The Company may face significant competition from companies that serve its industries.
The Company may face competition from other companies that offer similar products, ranging from local suppliers to large multinational manufacturers and companies. Some of these potential competitors may have longer operating histories, greater brand recognition, larger client bases and significantly greater financial, technical and marketing resources than the Company does. These advantages may enable such competitors to respond more quickly to new or emerging technologies and changes in customer preferences. These advantages may also allow them to engage in more extensive research and development, undertake extensive far-reaching marketing campaigns, adopt more aggressive pricing policies and make more attractive offers to potential customers, employees and strategic partners. It is possible that potential competitors may have or may rapidly acquire significant market share. Increased competition may result in price reductions, reduced gross margin and loss of market share. The Company may not be able to compete successfully, and competitive pressures may adversely affect its business, results of operations and financial condition.
| 29 |
The Company’s inability to obtain capital, use internally generated cash, or use shares of the Company’s common stock or debt to finance future expansion efforts could impair the growth and expansion of the Company’s business.
Reliance on internally generated cash or debt to finance the Company’s operations or complete business expansion efforts could substantially limit the Company’s operational and financial flexibility. The extent to which the Company will be able or willing to use shares of common stock to consummate expansions will depend on the Company’s market value from time to time and the willingness of potential sellers to accept it as full or partial payment. Using shares of common stock for this purpose also may result in significant dilution to the Company’s then existing stockholders. To the extent that the Company is unable to use common stock to make future expansions, the Company’s ability to grow through expansions may be limited by the extent to which the Company is able to raise capital for this purpose through debt or equity financings. No assurance can be given that the Company will be able to obtain the necessary capital to finance a successful expansion program or the Company’s other cash needs. If the Company is unable to obtain additional capital on acceptable terms, the Company may be required to reduce the scope of any expansion. In addition to requiring funding for expansions, the Company may need additional funds to implement the Company’s internal growth and operating strategies or to finance other aspects of the Company’s operations. The Company’s failure to (i) obtain additional capital on acceptable terms, (ii) use internally generated cash or debt to complete expansions because it significantly limits the Company’s operational or financial flexibility, or (iii) use shares of common stock to make future expansions may hinder the Company’s ability to actively pursue any expansion program the Company may decide to implement and negatively impact the Company’s stock price.
Costs incurred because the Company are a public company may affect the Company’s profitability.
As a public company, the Company incurs significant legal, accounting, and other expenses, and the Company is subject to the SEC’s rules and regulations relating to public disclosure that generally involve a substantial expenditure of financial resources. In addition, the Sarbanes-Oxley Act of 2002, as well as rules subsequently implemented by the SEC, requires changes in corporate governance practices of public companies. The Company expects that full compliance with such rules and regulations will significantly increase the Company’s legal and financial compliance costs and make some activities more time-consuming and costly, which may negatively impact the Company’s financial results. To the extent the Company’s earnings suffer as a result of the financial impact of the Company’s SEC reporting or compliance costs, the Company’s ability to develop an active trading market for the Company’s securities could be harmed.
It may be time-consuming, difficult and costly for the Company to develop and implement the internal controls and reporting procedures required by the Sarbanes-Oxley Act, when applicable to the Company. The Company’s new members of management as of the reverse merger transaction have no experience operating a public company. The Company may need to recruit, hire, train, and retain additional financial reporting, internal controls, and other personnel in order to develop and implement appropriate internal controls and reporting procedures both domestically and internationally. If the Company is unable to comply with the internal controls requirements of the Sarbanes-Oxley Act, when applicable, the Company may have material weaknesses reported in the Company’s independent accountant’s attestation report on the Company’s internal control over financial reporting required by the Sarbanes-Oxley Act.
The PRC legal system embodies uncertainties that could limit the legal protections available to the Company.
The PRC legal system is a civil law system based on written statutes. Unlike common law systems, it is a system in which decided legal cases have little precedential value. In 1979, the PRC government began to promulgate a comprehensive system of laws and regulations governing general economic and business matters. The overall effect of legislation since 1979 has been a significant enhancement of the protections afforded to various forms of foreign-invested enterprises in China. These laws, regulations, and legal requirements, however, are constantly changing, and their interpretation and enforcement involve uncertainties, which could limit the legal protections available to the Company. In addition, the Company cannot predict the effect of future developments in the PRC legal system, particularly with regard to the internet, including the promulgation of new laws, changes to existing laws, or the interpretation or enforcement thereof, or the preemption of local regulations by national laws. Furthermore, any litigation in China may be protracted and result in substantial costs and diversion of resources and management attention.
No assurance of continued market acceptance.
There is no assurance that the Company’s services or solutions will continued to meet with market acceptance. Moreover, there is no assurance that these services and solutions will continue to have any competitive advantages. Also, there is no assurance that the market reception will be positive. The Company’s industry is characterized by a large and fragmented group of competitors, and as such, there can be no guarantee that the Company will not lose business to its existing or potential new competitors.
| 30 |
The Company is susceptible to changes economic conditions.
Demand for natural resources may decline with changing economic conditions. For example, decline in private construction projects may reduce demand for granite products that the Company operates in. International economic conditions or a slowdown of growth in China or around the globe could harm the Company’s business and operations.
Changes in prices for metals or products will affect the Company’s profitability and operations.
Commodities, such as gold, fluctuate and change in price on a daily basis. Changes in these prices could negatively affect the Company’s operations and profitability.
The Company is dependent on its suppliers, and business difficulty for a supplier could harm the Company’s own business.
The Company relies on its key suppliers. Difficulties that the suppliers experience will burden the Company’s ability to operate. The Company needs to diversify among suppliers, but until such time, the Company is dependent and exposed to the risk of its current key suppliers.
The Company is exposed to seasonal risks in its business and operations.
The Company’s business can encounter seasonal issues from time to time in granite and marble mining as the mining and processing activities can typically be done at year round and during the seasonal periods that construction demand slowed, the mines and processing continued operations and built up inventories to prepare for the periods of higher demand.
If the Company is unable to generate sufficient cash from operations, it may find it necessary to curtail operational activities.
The Company has an extensive business plan hinged on its ability to market and commercialize its products. If the Company is unable to market and/or commercialize its products, then it would not be able to proceed with its business plan or possibly to successfully develop its planned operations at all.
The proposed operations of the Company are speculative.
The success of the proposed business plan of the Company will depend to a great extent on the operations, financial condition and management of the Company. The business operations of the Company remain speculative.
The Company may face significant competition from companies that serve its industries.
The Company may face competition from other companies that offer similar products, ranging from local suppliers to large multinational manufacturers and companies. Some of these potential competitors may have longer operating histories, greater brand recognition, larger client bases and significantly greater financial, technical and marketing resources than the Company does. These advantages may enable such competitors to respond more quickly to new or emerging technologies and changes in customer preferences. These advantages may also allow them to engage in more extensive research and development, undertake extensive far-reaching marketing campaigns, adopt more aggressive pricing policies and make more attractive offers to potential customers, employees and strategic partners. It is possible that potential competitors may have or may rapidly acquire significant market share. Increased competition may result in price reductions, reduced gross margin and loss of market share. The Company may not be able to compete successfully, and competitive pressures may adversely affect its business, results of operations and financial condition.
| 31 |
The Company’s inability to obtain capital, use internally generated cash, or use shares of the Company’s common stock or debt to finance future expansion efforts could impair the growth and expansion of the Company’s business.
Reliance on internally generated cash or debt to finance the Company’s operations or complete business expansion efforts could substantially limit the Company’s operational and financial flexibility. The extent to which the Company will be able or willing to use shares of common stock to consummate expansions will depend on the Company’s market value from time to time and the willingness of potential sellers to accept it as full or partial payment. Using shares of common stock for this purpose also may result in significant dilution to the Company’s then existing stockholders. To the extent that the Company is unable to use common stock to make future expansions, the Company’s ability to grow through expansions may be limited by the extent to which the Company is able to raise capital for this purpose through debt or equity financings. No assurance can be given that the Company will be able to obtain the necessary capital to finance a successful expansion program or the Company’s other cash needs. If the Company is unable to obtain additional capital on acceptable terms, the Company may be required to reduce the scope of any expansion. In addition to requiring funding for expansions, the Company may need additional funds to implement the Company’s internal growth and operating strategies or to finance other aspects of the Company’s operations. The Company’s failure to (i) obtain additional capital on acceptable terms, (ii) use internally generated cash or debt to complete expansions because it significantly limits the Company’s operational or financial flexibility, or (iii) use shares of common stock to make future expansions may hinder the Company’s ability to actively pursue any expansion program the Company may decide to implement and negatively impact the Company’s stock price.
If the PRC government finds that the arrangements that establish the structure for operating the Company’s business do not comply with PRC government regulations the Company could suffer penalties.
The PRC government regulates telecommunications-related businesses through strict business licensing requirements and other government regulations. These laws and regulations also include limitations on foreign ownership of PRC companies that engage in telecommunications-related business. Specifically, foreign investors are not allowed to own more than a 50% equity interest in any PRC company engaging in value-added telecommunications business.
The relevant PRC regulatory authorities have broad discretion in determining whether a particular contractual structure is in violation of PRC laws and regulations. If the Company’s corporate and contractual structure is deemed to be illegal, either in whole or in part, the Company may have to modify such structure to comply with regulatory requirements. However, the Company cannot assure any investor that the Company can achieve this without material disruption to the Company’s business. Further, if the Company’s corporate and contractual structure is found to be in violation of any existing or future PRC laws or regulations, the relevant regulatory authorities would have broad discretion in dealing with such violations, including:
| • | revoking the Company’s business and operating licenses; |
| • | levying fines; |
| • | confiscating any of the Company’s income that they deem to be obtained through illegal operations; |
| • | shutting down a portion or all of the Company’s showrooms or branches; |
| • | discontinuing or restricting the Company’s operations in China; |
| • | requiring the Company to restructure its corporate and contractual structure; |
| • | restricting or prohibiting the Company’s use of the proceeds from future offering to finance the Company’s PRC affiliated entity' business and operations; and |
| • | taking other regulatory or enforcement actions that could be harmful to the Company’s business. |
Occurrence of any of these events could materially and adversely affect the Company’s business, financial condition and results of operations.
The Company’s contractual arrangements with the Company’s affiliated PRC entity may result in adverse tax consequences.
As a result of the Company’s corporate structure and the contractual arrangements between the Company and the Company’s affiliated PRC entity, the Company are effectively subject to the 5% PRC business tax on net revenues derived from the Company’s contractual arrangements with the Company’s affiliated PRC entity. The Company may be subject to adverse tax consequences if the PRC tax authorities were to determine that the contracts between the Company and the Company’s affiliated PRC entity were not on an arm’s length basis and constitute a favorable transfer pricing arrangements. If this occurs, the PRC tax authorities could request that the Company’s affiliated PRC entity adjust its taxable income, if any, upward for PRC tax purposes. Such a pricing adjustment could adversely affect the Company by increasing the Company’s affiliated PRC entity’s tax expenses without reducing the Company’s tax expenses, which could subject the Company’s affiliated PRC entity to late payment fees and other penalties for underpayment of taxes. The PRC enterprise income tax law requires every enterprise in China to submit its annual enterprise income tax return together with a report on transactions with its related parties to the relevant tax authorities. The tax authorities may impose reasonable adjustments on taxation if they have identified any related party transactions that are inconsistent with arm’s length principles. As a result, the Company’s contractual arrangements with the Company’s affiliated PRC entity may result in adverse tax consequences to us. As the Company’s affiliated PRC entity suffered accumulated loss since its inception, it has not paid any PRC income tax so far. If it generates net income from transactions with the Company’s PRC subsidiaries pursuant to the contractual arrangements in the future and the PRC tax authorities decide to make transfer pricing adjustments on its net income, the Company’s consolidated net income may be adversely affected.
| 32 |
Restrictions on currency exchange may limit the Company’s ability to utilize the Company’s capital effectively.
All of the Company’s revenues and operating expenses are denominated in Renminbi. The Renminbi is currently freely convertible under the “current account”, which includes dividends, trade, and service-related foreign exchange transactions, but not under the “capital account,” which includes foreign direct investment and loans.
Currently, the Company’s PRC subsidiaries may purchase foreign exchange for settlement of “current account transactions,” and retain foreign exchange in its current account, subject to a ceiling approved by the SAFE, to satisfy foreign exchange liabilities or to pay dividends. The Company cannot, however, assure you that the relevant PRC governmental authorities will not limit or eliminate the Company’s PRC subsidiaries’ abilities to purchase and retain foreign currencies in the future.
Since a significant amount of the Company’s future revenues will be denominated in Renminbi, the existing and any future restrictions on currency exchange may limit the Company’s ability to utilize capital generated in Renminbi to fund the Company’s business activities outside of China, if any, or expenditures denominated in foreign currencies.
Foreign exchange transactions under the capital account are subject to limitations and require registration with or approval by the relevant PRC governmental authorities. In particular, if the Company finances the Company’s PRC subsidiaries by foreign currency loans, those loans cannot exceed certain statutory limits and must be registered with the SAFE, and if the Company finance the Company’s PRC subsidiaries by capital contributions, then those capital contributions must be approved by the Ministry Of Commerce or its local agency. In addition, because of the regulatory issues related to foreign currency loans to, and foreign investment in, domestic PRC enterprises, the Company may not be able to finance its operations by loans or capital contributions. The Company cannot assure you that the Company can obtain these governmental registrations or approvals on a timely basis, if at all. These limitations could affect the ability of these entities to obtain foreign exchange through debt or equity financing, and could adversely affect the Company’s business and financial conditions.
Fluctuation in the value of the Renminbi may reduce the value of the Company’s investment.
The value of the Renminbi against the U.S. dollar and other currencies is affected by, among other things, changes in China's political and economic conditions and China's foreign exchange policies. The conversion of Renminbi into foreign currencies, including U.S. dollars, has been based on exchange rates set by the People's Bank of China. On July 21, 2005, the PRC government changed its decade-old policy of pegging the value of the Renminbi solely to the U.S. dollar. Under this revised policy, the Renminbi is permitted to fluctuate within a narrow and managed band against a basket of certain foreign currencies. Following the removal of the U.S. dollar peg, the Renminbi appreciated more than 20% against the U.S. dollar over the following three years. The People's Bank of China, however, regularly intervenes in the foreign exchange market to limit fluctuations in Renminbi exchange rates and achieve policy goals. For almost two years after July 2008, the Renminbi traded within a narrow range against the U.S. dollar. As a consequence, the Renminbi fluctuated significantly during that period against other freely traded currencies, in tandem with the U.S. dollar. In June 2010, the PRC government announced that it would increase Renminbi exchange rate flexibility. It remains unclear, though, how this flexibility might be implemented. There remains significant international pressure on the PRC government to adopt a more flexible currency policy, which could result in a further and more significant appreciation of the Renminbi against the U.S. dollar.
Because all of the Company’s revenues and expenditures are denominated in Renminbi, appreciation or depreciation in the value of the Renminbi relative to the U.S. dollar would affect the Company’s financial results reported in U.S. dollar terms without giving effect to any underlying change in the Company’s business or results of operations. Fluctuations in the exchange rate will also affect the relative value of any dividend the Company issue that will be exchanged into U.S. dollars and earnings from and the value of any U.S. dollar-denominated investments the Company make in the future.
Very limited hedging transactions are available in China to reduce the Company’s exposure to exchange rate fluctuations. To date, the Company have not entered into any hedging transactions in an effort to reduce the Company’s exposure to foreign currency exchange risk. While the Company may decide to enter into hedging transactions in the future, the availability and effectiveness of these hedging transactions may be limited, and the Company may not be able to successfully hedge the Company’s exposure at all. In addition, the Company’s currency exchange losses may be magnified by Chinese exchange control regulations that restrict the Company’s ability to convert Renminbi into foreign currency.
| 33 |
Our estimated reserves on mines to be acquired are based on many assumptions that may turn out to be inaccurate. Significant inaccuracies in these underlying assumptions will materially affect the quantities and present value of our proved reserves.
Mining is not an exact science and requires subjective estimates of underground accumulations of reserves and assumptions concerning future commodity prices, production levels and operating and development costs. As a result, estimated quantities of proved, probable and possible reserves, projections of future production rates and the timing of development expenditures may be incorrect. The timing of both our production and our incurrence of costs in connection with the development and production of reserves will affect the timing of actual future net cash flows from proved, probable and possible reserves.
The volatility of gold and precious metal commodities prices due to factors beyond our control greatly affects our earnings, cash flows and asset values.
Our financial results vary with fluctuations in the market prices of gold and precious metal. A substantial or extended decline in the market prices of gold and precious metal commodities could have a material adverse effect on our financial results, the value of our assets and our ability to repay any debt that we may incur or to meet our other fixed obligations, and could depress the trading prices of our common stock.
Our revenues, operating results, profitability, future rate of growth and the carrying value of our properties depend primarily upon the prevailing commodity prices. Historically, gold and precious metal as well as specialized commercial minerals prices have been volatile and are subject to fluctuations in response to changes in supply and demand, market uncertainty and a variety of additional factors that are beyond our control.
Our business plan requires substantial additional capital, which we may be unable to raise on acceptable terms in the future, which may in turn limit our ability to execute our business plan and could lead to a loss of properties and have a material adverse effect on our production, reserves and results of operations.
Growing the business and making the necessary acquisitions to execute it is very expensive, and we expect that we will need to raise substantial additional capital, through future private or public equity offerings, strategic alliances or debt financing, before we achieve commercialization of some of our properties.
In the near term, we intend to finance our capital expenditures with cash flows from operations, borrowing availability and proceeds from this offering.
Our business and operating results can be harmed by factors such as the availability, terms and cost of capital or increases in interest rates. Changes in any one or more of these factors could cause our cost of doing business to increase, limit our access to capital, limit our ability to pursue acquisition opportunities, reduce our cash flows available for drilling and place us at a competitive disadvantage. Continuing disruptions and volatility in the global financial markets may lead to an increase in interest rates or a contraction in credit availability, which could impact our ability to finance our operations.
If we are unable to fund our capital requirements, we may be required to curtail our operations relating to an inability to implement our development plan, complete acquisitions or otherwise take advantage of business opportunities or respond to competitive pressures, any of which could have a material adverse effect on our production, revenues and results of operations. In addition, a delay in or the failure to complete proposed or future projects could delay or eliminate potential efficiencies and related cost savings.
Our international operations are subject to political, social and geographic risks of doing business in countries outside the U.S.
We currently have operations located outside of the United States. Our international operations must comply with the U.S. Foreign Corrupt Practices Act and similar anti-corruption and anti-bribery laws of the other jurisdictions in which we operate. There has been a substantial increase in the global enforcement of these laws. Any violation of these laws could result in significant criminal or civil fines and penalties, litigation, and loss of operating licenses or permits, and may damage our reputation, which could have a material adverse effect on our business, results of operations and financial condition.
The inability of one or more of our customers to meet their obligations may adversely affect our financial results.
In addition to credit risk related to receivables from commodity derivative contracts, our principal exposure to credit risk is through receivables from purchasers. Current economic circumstances may further increase these risks. We do not require our customers to post collateral. The inability or failure of our significant customers to meet their obligations to us or their insolvency or liquidation may materially adversely affect our financial condition and results of operations.
We rely on a few key employees whose absence or loss could adversely affect our business.
Many key responsibilities within our business have been assigned to a small number of employees. The loss of their services could adversely affect our business. In particular, the loss of the services of one or more members of our senior management team, could disrupt our operations.
| 34 |
Our failure to successfully identify, complete and integrate future acquisitions of properties or businesses could reduce our operating results and slow our growth.
There is intense competition for acquisition opportunities in our industry and we may not be able to identify attractive acquisition opportunities. Even if we do identify attractive acquisition opportunities, we may not be able to complete the acquisition or do so on commercially acceptable terms. Competition for acquisitions may increase the cost of, or cause us to refrain from, completing acquisitions. Our ability to complete acquisitions is dependent upon, among other things, our ability to obtain debt and equity financing and, in some cases, regulatory approvals. Further, these acquisitions may be in geographic regions in which we do not currently operate, which could result in unforeseen operating difficulties and difficulties in coordinating geographically dispersed operations, personnel and facilities. In addition, if we enter into new geographic markets, we may be subject to additional and unfamiliar legal and regulatory requirements. Compliance with these regulatory requirements may impose substantial additional obligations on us and our management, cause us to expend additional time and resources in compliance activities and increase our exposure to penalties or fines for non-compliance with such additional legal requirements. Completed acquisitions could require us to invest further in operational, financial and management information systems and to attract, retain, motivate and effectively manage additional employees. The inability to effectively manage the integration of acquisitions could reduce our focus on subsequent acquisitions and current operations, which, in turn, could negatively impact our results of operations and growth. Our financial condition and results of operations may fluctuate significantly from period to period, based in part on whether or not significant acquisitions are completed in particular periods.
Any acquisition involves potential risks, including, among other things:
| • | the validity of our assumptions about estimated proved, probable or possible reserves, future production, commodity prices, revenues, capital expenditures, operating expenses and costs; |
| • | an inability to obtain satisfactory title to the assets we acquire; |
| • | a decrease in our liquidity by using a significant portion of our available cash to finance acquisitions; |
| • | a significant increase in our interest expense or financial leverage if we incur additional debt to finance acquisitions; |
| • | the assumption of unknown liabilities, losses or costs for which we obtain no or limited indemnity or other recourse; |
| • | the diversion of management’s attention from other business concerns; |
| • | an inability to hire, train or retain qualified personnel to manage and operate our growing assets; and |
We are subject to various legal proceedings, which may have an adverse effect on our business.
We are party to a number of legal proceedings in the normal course of business activities, including workers’ compensation claims, employment-related disputes, commercial disputes, personal injury claims, royalty claims, property damage claims and contract actions.
There is the potential that litigation could have an adverse effect on our cash flows, results of operations or financial position. If we are not able to successfully defend ourselves with respect to various legal proceedings, there could be a delay or even a halt in our exploration, development or production activities or other business plans, resulting in a reduction in reserves, loss of production and reduced cash flows.
Risks Related to this Offering and Our Common Stock
Shares of common stock in the Company are subject to resale restrictions imposed by Rule 144 of the Securities and Exchange Commission.
The shares of common stock held by current shareholders are “restricted securities” subject to the limitations of Rule 144 under the Securities Act. In general, securities can be sold pursuant to Rule 144 after being fully-paid and held for more than 12 months. Shares of the Company’s common stock are subject to Rule 144 resale restrictions, and accordingly, investors are subject to such resale limitations.
| 35 |
Shareholders of the Company cannot rely upon Rule 144 to resell securities of the Company.
Due to the Company’s previous status as a shell company, shareholders cannot rely upon Rule 144 for resales of the Company’s securities (pursuant to Rule 144(i)). As such, certain shares of common stock have no ability for resale or transfer until the Company meets the requirements of Rule 144(i)(2) of the Securities and Exchange Commission
Rule 144 establishes specific criteria for determining whether a person is not engaged in a distribution of securities. Among other things, Rule 144 creates a safe harbor whereby a person satisfying the applicable conditions of the Rule 144 safe harbor is deemed not to be engaged in a distribution of the securities and therefore not an underwriter of the securities. If a purchaser of securities is unable to rely upon Rule 144 to sell securities (due to Rule 144(i)), then the securities must be registered or another exemption from registration must be found in order for the distribution of securities to be made. In the event that the securities are not registered or another exemption is not found, a purchaser of securities cannot sell or transfer the shares of common stock in the Company since the Company does not meet the requirements of Rule 144(i)(2).
Pursuant to Rule 144(i), reliance upon Rule 144 is typically available for the resale of restricted or unrestricted securities that were initially issued by a reporting or non-reporting shell company (or an issuer that has been at any time previously a reporting or non-reporting shell company) only if the following conditions are met:
-The issuer of the securities that was formerly a reporting or non-reporting shell company has ceased to be a shell company;
-The issuer of the securities is subject to the reporting requirements of Section 13 or 15(d) of the Securities Exchange Act of 1934;
-The issuer of the securities has filed all reports and material required to be filed under Section 13 or 15(d) of the Exchange Act, as applicable, during the preceding 12 months (or for such shorter period that the issuer was required to file such reports and materials), other than Form 8-K reports; and
-At least one year has elapsed from the time that the issuer filed current Form 10 type information with the Commission reflecting its status as an entity that is not a shell company.
The Company may need additional capital, and the sale of additional shares or other equity securities could result in dilution to the Company’s stockholders.
The Company may require additional cash resources due to changed business conditions or other future developments, including any investments the Company may decide to pursue. If the Company’s resources are insufficient to satisfy the Company’s cash requirements, the Company may seek to sell additional equity or debt securities. The sale of additional equity securities could result in dilution to the Company’s stockholders. The incurrence of additional indebtedness would result in increased debt service obligations and could result in further operating and financing covenants that would further restrict the Company’s operations. The Company cannot provide assurances that financing will be available in amounts or on terms acceptable to the Company, if at all.
The Company’s officers and directors beneficially own a majority of the Company’s common stock and, as a result, can exercise control over stockholder and corporate actions.
The officers and directors of the Company currently beneficially own more than 50% of the Company’s outstanding common stock. As such, they will be able to control most matters requiring approval by stockholders, including the election of directors and approval of significant corporate transactions. This concentration of ownership may also have the effect of delaying or preventing a change in control, which in turn could have a material adverse effect on the market price of the Company’s common stock or prevent stockholders from realizing a premium over the market price for their shares.
The Company may complete another primary offering for Shares in parallel with or immediately following this offering.
The Company may conduct a primary offering for Shares to receive proceeds for the Company. Such an offering may be conducted in parallel with or immediately following this offering. Sales of additional Shares will dilute the percentage ownership of existing shareholders in the Company.
We will incur increased costs as a result of being a public company, which may significantly affect our financial condition.
As a public company, we will incur significant legal, accounting and other expenses that we did not incur as a private company to meet related reporting requirements. We also anticipate that we will incur costs associated with corporate governance requirements, including requirements under the Sarbanes-Oxley Act, as well as rules implemented by the SEC and the Financial Industry Regulatory Authority. We expect these rules and regulations to increase our legal and financial compliance costs and to make some activities more time-consuming and costly. Under the Shared Services Agreement that we expect to enter into with FCX at the closing of this offering, FCX will provide legal, accounting and other services necessary for us to meet our regulatory obligations as a public company. If the Shared Services Agreement is terminated or not renewed, we will need to find a replacement service provider or provide such functions ourselves, which may increase the costs associated with meeting our public company reporting requirements.
| 36 |
We expect to incur additional expenses and devote additional management effort toward ensuring compliance with Section 404 of the Sarbanes-Oxley Act. See “—Risks Related to Our Business—If we fail to maintain proper and effective internal controls over financial reporting, our ability to produce accurate and timely financial statements could be impaired and investors’ views of us could be harmed.”
The Company has authorized the issuance of preferred stock with certain preferences.
The board of directors of the Company is authorized to issue up to 20,000,000 shares of $0.0001 par value preferred stock. The board of directors has the power to establish the dividend rates, liquidation preferences, and voting rights of any series of preferred stock, and these rights may be superior to the rights of holders of shares of common stock. The board of directors may also establish redemption and conversion terms and privileges with respect to any shares of preferred stock. Any such preferences may operate to the detriment of the rights of the holders of the Shares, and further, could be used by the board of directors as a device to prevent a change in control of the Company. Currently, no such preferred shares or preferences have been issued to date, but such shares or preferences may be issued at a later time, subject to the sole discretion of the board of directors.
There has been no public market for our common stock, and if the price of our common stock fluctuates significantly, your investment could lose value.
Prior to this offering, there has been no public market for our common stock. Although we intend to apply to list our common stock on the NASDAQ, an active public market may not develop for our common stock or our common stock may not trade in the public market subsequent to this offering at or above the initial public offering price. If an active public market for our common stock does not develop, the stock price and liquidity of our common stock will be materially and adversely affected.
If there is a thin trading market or “float” for our common stock, the market price for our common stock may fluctuate significantly more than the stock market as a whole. Without a large float, our common stock is less liquid than the stock of companies with broader public ownership and, as a result, the stock price of our common stock may be more volatile. In addition, in the absence of an active public trading market, investors may be unable to liquidate their investment in us. The initial offering price may not be indicative of the stock price for our common stock after this offering. In addition, the stock market is subject to significant price and volume fluctuations, and the price of our common stock could fluctuate widely in response to several factors, including:
| • | our quarterly or annual operating results; |
| • | changes in our earnings estimates; |
| • | investment recommendations by securities analysts following our business or our industry; |
| • | additions or departures of key personnel; |
| • | changes in the business, earnings estimates or market perceptions of our competitors; |
| • | our failure to achieve operating results consistent with securities analysts’ projections; |
| • | changes in industry, general market or economic conditions; and |
| • | announcements of legislative or regulatory change. |
If securities or industry analysts do not publish research or reports about our business, if they adversely change their recommendations regarding our common stock or if our operating results do not meet their expectations, our stock price could decline.
The trading market for our common stock will be influenced by the research and reports that industry or securities analysts publish about us or our business. If one or more of these analysts cease coverage of our company or fail to publish reports on us regularly, we could lose visibility in the financial markets, which in turn could cause our stock price or trading volume to decline. Moreover, if one or more of the analysts who cover our company downgrades our common stock or if our operating results do not meet their expectations, our stock price could decline.
| 37 |
We do not intend to pay cash dividends on our common stock in the foreseeable future, and therefore only appreciation of the price of our common stock will provide a return to our stockholders.
We anticipate that we will retain all future earnings, if any, to finance the growth and development of our business. We do not intend to pay cash dividends in the foreseeable future. Any future determination as to the declaration and payment of cash dividends will be at the discretion of our Board of Directors and will depend upon our financial condition, results of operations, contractual restrictions, capital requirements, business prospects and other factors deemed relevant by our Board of Directors. As a result, only appreciation of the price of our common stock, which may not occur, will provide a return to our stockholders.
Costs incurred because the Company are a public company may affect the Company’s profitability.
As a public company, the Company incurs significant legal, accounting, and other expenses, and the Company is subject to the SEC’s rules and regulations relating to public disclosure that generally involve a substantial expenditure of financial resources. In addition, the Sarbanes-Oxley Act of 2002, as well as rules subsequently implemented by the SEC, requires changes in corporate governance practices of public companies. The Company expects that full compliance with such rules and regulations will significantly increase the Company’s legal and financial compliance costs and make some activities more time-consuming and costly, which may negatively impact the Company’s financial results. To the extent the Company’s earnings suffer as a result of the financial impact of the Company’s SEC reporting or compliance costs, the Company’s ability to develop an active trading market for the Company’s securities could be harmed.
It may be time-consuming, difficult and costly for the Company to develop and implement the internal controls and reporting procedures required by the Sarbanes-Oxley Act, when applicable to the Company. The Company’s new members of management as of the reverse merger transaction have no experience operating a public company. The Company may need to recruit, hire, train, and retain additional financial reporting, internal controls, and other personnel in order to develop and implement appropriate internal controls and reporting procedures both domestically and internationally. If the Company is unable to comply with the internal controls requirements of the Sarbanes-Oxley Act, when applicable, the Company may have material weaknesses reported in the Company’s independent accountant’s attestation report on the Company’s internal control over financial reporting required by the Sarbanes-Oxley Act.
This prospectus contains, in addition to historical information, certain information, assumptions and discussions that may constitute forward-looking statements. Such statements are subject to certain risks and uncertainties which could cause actual results to differ materially than those projected or anticipated. Actual results could differ materially from those projected in the forward-looking statements. Although the Company believes its assumptions underlying the forward-looking statements are reasonable, the Company cannot assure an investor that the forward-looking statements set out in this prospectus will prove to be accurate. The Company’s businesses can be affected by, without limitation, such things as natural disasters, economic trends, international strife or upheavals, consumer demand patterns, labor relations, existing and new competition, consolidation, and growth patterns within the industries in which the Company competes and any deterioration in the economy may individually or in combination impact future results.
Special Additional Note Regarding Forward-Looking Statements
This prospectus contains forward-looking statements. The forward-looking statements are contained principally in the sections entitled “Business” and “Risk Factors.” These statements involve known and unknown risks, uncertainties, and other factors that may cause our actual results, performance, or achievements to be materially different from any future results, performances, or achievements expressed or implied by the forward-looking statements. In some cases, forward-looking statements are identified by terms such as “anticipates,” “believes,” “could,” “estimates,” “expects,” “intends,” “may,” “plans,” “potential,” “predicts,” “projects,” “should,” “would,” and similar expressions intended to identify forward-looking statements. Forward-looking statements reflect the Company’s current views respecting future events and are based on assumptions and subject to risks and uncertainties. These risks and uncertainties include, but are not limited to, the factors described in the section captioned “Risk Factors” below.
Given these uncertainties, undue reliance should not be placed on these forward-looking statements. These forward-looking statements include, among other things, statements relating to:
| · | the Company’s ability to find suitable markets for, and increase sales of, the existing products it offers and develops; |
| · | the Company’s ability to successfully defend and maintain its intellectual property rights; |
| 38 |
| · | the Company’s ability to obtain additional capital to fund expansion of its product line, new marketing initiatives, and/or acquisitions; |
| · | economic, regulatory, and legal risks associated with the Company’s operations; or |
| · | the loss of key members of the Company’s management. |
Also, forward-looking statements represent the Company’s estimates and assumptions only as of the date of this prospectus. You should read this report and the documents that the Company references and files as exhibits to this report in their entirety and with the understanding that actual future results may be materially different from what the Company expects. Except as required by law, the Company assumes no obligation to update any forward-looking statements publicly, or to update the reasons actual results could differ materially from those anticipated in any forward-looking statements, even if new information becomes available or other events occur in the future.
The selling stockholders will receive all of the proceeds from the sale of the shares offered by them under this prospectus. We will not receive any proceeds from the sale of shares by the selling stockholders covered by this prospectus. We plan to use all of the net proceeds from this offering to fund our future capital program and for general corporate purposes.
We do not anticipate declaring or paying any cash dividends to holders of our common stock in the foreseeable future. Our future dividend policy is within the discretion of our Board of Directors and will depend upon various factors, including our results of operations, financial condition, capital requirements and investment opportunities.
SELLING SHAREHOLDER SALES
This prospectus relates to the offer and sale of 135,954,309 shares (“Shares”) of common stock of the Company, as follows: (a) 30,000,000 Shares offered by the Company and (b) 105,954,309 Shares offered by the holders thereof (the “Selling Shareholder Shares”), who are deemed to be statutory underwriters. The selling shareholders will offer their shares at a price of $____ per share, until the Company's common stock is listed on a national securities exchange or is quoted on the OTC Bulletin Board (or a successor); after which, the selling shareholders may sell their shares at prevailing market or privately negotiated prices, including (without limitation) in one or more transactions that may take place by ordinary broker's transactions, privately-negotiated transactions or through sales to one or more dealers for resale.
Usual and customary or specifically negotiated brokerage fees or commissions may be paid by the selling shareholders in connection with sales of the common stock. The selling shareholders may from time to time offer their shares through underwriters, brokers-dealers, agents or other intermediaries. The distribution of the common stock by the selling shareholders may be effected in one or more transactions that may take place through customary brokerage channels, in privately negotiated sales; by a combination of these methods; or by other means. The Company will not receive any portion or percentage of any of the proceeds from the sale of the Selling Shareholders’ Shares.
Purchasers of the Shares may experience immediate dilution in the value of their shares of common stock. Purchasers in this offering will pay $___ per Share but immediately after purchase the value of those Shares will be reduced. Dilution represents the difference between the initial public offering price per share paid by purchasers and the net tangible book value per share immediately after completion of the offering. Net tangible book value per share is the net tangible assets of the Company (total assets less total liabilities less intangible assets), divided by the number of shares of common stock outstanding.
DETERMINATION OF OFFERING PRICE
There is no public market for the Company’s common stock and the price at which the Shares are being offered has been arbitrarily determined by the Company. This price does not necessarily bear any direct relationship to the assets, operations, book or other established criteria of value of the Company but represents solely the arbitrary opinion of management of the Company.
Prior to this offering, there has been no public market for our common stock. The initial public offering price would be arbitrary determined or determined by negotiations between a representative of an underwriter (if and when appointed) and us. In determining the initial public offering price of our common stock, the following shall be considered:
| 39 |
| • | the history and prospects for the industry in which we compete; |
| • | our financial information; |
| • | the ability of our management and our business potential and earning prospects; |
| • | the prevailing securities markets at the time of this offering; and |
| • | the recent market prices of, and the demand for, publicly traded shares of generally comparable companies. |
This prospectus relates to the offer and sale of 135,954,309 shares (“Shares”) of common stock of the Company, as follows: (a) 30,000,000 Shares offered by the Company and (b) 105,954,309 Shares offered by the holders thereof (the “Selling Shareholder Shares”), who are deemed to be statutory underwriters. The selling shareholders will offer their shares at a price of $___ per share, until the Company's common stock is listed on a national securities exchange or is quoted on the OTC Bulletin Board (or a successor); after which, the selling shareholders may sell their shares at prevailing market or privately negotiated prices, including (without limitation) in one or more transactions that may take place by ordinary broker's transactions, privately-negotiated transactions or through sales to one or more dealers for resale.
Usual and customary or specifically negotiated brokerage fees or commissions may be paid by the selling shareholders in connection with sales of the common stock. The selling shareholders may from time to time offer their shares through underwriters, brokers-dealers, agents or other intermediaries. The distribution of the common stock by the selling shareholders may be effected in one or more transactions that may take place through customary brokerage channels, in privately negotiated sales; by a combination of these methods; or by other means. The Company will not receive any portion or percentage of any of the proceeds from the sale of the Selling Shareholders’ Shares.
Neither the Company nor the selling shareholders have not entered into any arrangements with any underwriter, broker-dealer or selling agent as of the date of this prospectus. At the time of this prospectus, neither the Company nor the selling shareholders has located a broker-dealer or selling agent to sell the Shares.
The Company intends to maintain the currency and accuracy of this prospectus and to permit offers and sales of the Shares for a period of up to two (2) years, pursuant to Rule 415 of the General Rules and Regulations of the Securities and Exchange Commission.
The offering will terminate 24 months following the date of the initial effectiveness of the registration statement to which this prospectus relates.
Resales of the Securities under State Securities Laws
The National Securities Market Improvement Act of 1996 ("NSMIA") limits the authority of states to impose restrictions upon resales of securities made pursuant to Sections 4(1) and 4(3) of the Securities Act of companies which file reports under Sections 13 or 15(d) of the Securities Exchange Act. Resales of the Shares in the secondary market will be made pursuant to Section 4(1) of the Securities Act (sales other than by an issuer, underwriter or broker). The resale of such Shares may be subject to the holding period and other requirements of Rule 144 of the General Rules and Regulations of the Securities and Exchange Commission.
Selling Shareholders
The selling shareholders shares of common stock referred to above are being registered to permit public sales of the shares, and the selling stockholders may offer the shares for resale from time to time pursuant to this prospectus. The selling stockholders may also sell, transfer or otherwise dispose of all or a portion of their shares in transactions exempt from the registration requirements of the Securities Act or pursuant to another effective registration statement covering those shares. We may from time to time include additional selling stockholders in supplements or amendments to this prospectus.
The distribution of the Selling Shareholder Shares may be effected in one or more transactions that may take place through customary brokerage channels, in privately-negotiated sales, by a combination of these methods or by other means. The selling shareholders may from time to time offer their shares through underwriters, brokers-dealers, agents or other intermediaries. Usual and customary or specifically negotiated brokerage fees or commissions may be paid by the selling shareholders in connection with sales of the Shares. The Company will not receive any portion or percentage of any of the proceeds from the sale of the Selling Shareholders' Shares. Of the 105,954,309 Selling Shareholder Shares included in the registration statement of which this prospectus is a part, 53,218,000 Selling Shareholder Shares are held by officers, affiliates (including five percent shareholders) or directors of the Company.
| 40 |
The following statements relating to the capital stock set forth certain material terms of the securities of the Company; however, reference is made to the more detailed provisions of, and such statements are qualified in their entirety by reference to, the certificate of incorporation and the by-laws, copies of which are filed as exhibits to this registration statement.
Capitalization
The Company is authorized to issue 480,000,000 shares of common stock, par value $0.0001, of which 105,954,309 shares are outstanding as of the date of the registration statement, of which this prospectus is a part. The Company is also authorized to issue 20,000,000 shares of preferred stock, par value $0.0001, of which no shares were outstanding as of the date of the registration statement, of which this prospectus is a part.
In October 2015, the Company adopted an amendment to its certificate of incorporation effecting a reverse share split on a forty-one (41) for one hundred (100) basis, such that each one hundred (100) shares of common stock outstanding held by a stockholder were converted into only forty-one (41) shares of common stock outstanding. All outstanding shares of common stock were so converted in October when such amendment was filed in the State of Delaware. The action was duly approved by the board of directors and shareholders of the Company. As a result of the reverse share split, the total number of outstanding shares of common stock of the Company decreased from 258,339,773 shares outstanding to 105,954,309 shares outstanding at such time.
The following statements relating to the capital stock set forth the material terms of the securities of the Company, however, reference is made to the more detailed provisions of, and such statements are qualified in their entirety by reference to, the certificate of incorporation and the by-laws, copies of which are filed as exhibits to this registration statement.
Common Stock
The Company is registering up to 135,954,309 shares of its common stock for sale to the public at a price of $___ per Share, of which 30,000,000 Shares offered by the Company and 105,954,309 Shares offered by the Selling Shareholders.
Holders of shares of common stock are entitled to one vote for each share on all matters to be voted on by the stockholders. Holders of common stock do not have cumulative voting rights.
Subject to preferences that may be applicable to any outstanding shares of preferred stock, the holders of common stock are entitled to share ratably in dividends, if any, as may be declared from time to time by the board of directors in its discretion from funds legally available therefor. In the event of a liquidation, dissolution or winding up, subject to the rights of the shares of preferred stock, the holders of common stock are entitled to share pro rata all assets remaining after payment in full of all liabilities.
Holders of common stock have no preemptive rights to purchase the Company’s common stock. There are no conversion or redemption rights or sinking fund provisions with respect to the common stock. The Company may issue additional shares of common stock which could dilute its current shareholder's share value.
Preferred Stock
Shares of preferred stock may be issued from time to time in one or more series as may be determined by the board of directors. The board of directors may fix the designation, powers, preferences and rights of the shares of each such series and the qualifications, limitations or restrictions thereof without any further vote or action by the stockholders of the Company, except that no holder of preferred stock shall have preemptive rights. Any shares of preferred stock so issued would have priority over the common stock with respect to dividend or liquidation rights. Any future issuance of preferred stock may have the effect of delaying, deferring or preventing a change in control of the Company without further action by the stockholders and may adversely affect the voting and other rights of the holders of common stock.
| 41 |
At present, the Company has no plans to issue any preferred stock or adopt any series, preferences or other classification of preferred stock. The issuance of shares of preferred stock, or the issuance of rights to purchase such shares, could be used to discourage an unsolicited acquisition proposal. For instance, the issuance of a series of preferred stock might impede a business combination by including class voting rights that would enable the holder to block such a transaction, or facilitate a business combination by including voting rights that would provide a required percentage vote of the stockholders. In addition, under certain circumstances, the issuance of preferred stock could adversely affect the voting power of the holders of the common stock.
Although the Company’s board of directors is required to make any determination to issue such preferred stock based on its judgment as to the best interests of the stockholders of the Company, the board of directors could act in a manner that would discourage an acquisition attempt or other transaction that some, or a majority, of the stockholders might believe to be in their best interests or in which stockholders might receive a premium for their stock over the then market price of such stock. The board of directors does not at present intend to seek stockholder approval prior to any issuance of currently authorized stock, unless otherwise required by law or otherwise.
Transfer Agent
It is anticipated that the transfer agent and registrar for the Company’s common stock is Colonial Stock Transfer Company, Inc.
Dividends
The Company has not paid any dividends to date. The Company intends to offer dividends in the future, depending on the success of its business and its overall financial performance, including the availability of cash and other needs/uses of cash.
Background
The Company was incorporated in the State of Delaware in September 2014 and was formerly known as Spruce Valley Acquisition Corporation. In February 2015, Spruce Valley changed its name to Fuda Group (USA) Corporation.
Prior to the Acquisitions, the Company had no significant business, operations or plan. Accordingly, the business of the Company below is that of Fuda UK and Marvel (and of Liaoning Fuda by virtue of Marvel’s ownership of Liaoning Fuda), each of which was acquired by the Company in the Acquisitions.
The Company is seeking to engage in the business of gold and precious metals trading and investment, and additionally through vendor and supplier relationships trades in granite and marble. The Company is engaged in the business of shipping in 2013 and the brokering of sales in 2014. Besides trading of construction materials such as granite and marble, Liaoning Fuda also purchased titles to land use right surrounding the mines for investment purposes.
The Company has started to explore opportunities in mining and processing of gold. The Company plans to look for mergers and acquisitions opportunities with other companies and also to purchase gold mining assets and facilities.
For gold, trading refers to the purchase of gold powder and then extracting and refining them into gold bars. Mining refers to the actual mining of the gold mines, which the Company plans to pursue in the future.
For granite mining, the Company plans to make acquisitions in an open granite mine that employ's saw cutting methods to remove large raw blocks from the quarry. In addition, the Company also plans to process the raw blocks into slabs, pavers, wall claddings as well as carvings. These products can be sold to government agencies for infrastructure projects, corporations, granite processing plants, civil engineering companies as well renovation companies.
For gold and precious metals operations, the Company currently purchases gold bars for trading. It also buys gold powder and stones for both processing and trading. The processing would encompass the extraction of precious minerals out of the sand/rock, refining them into gold bars. These gold powder and the stones are sourced from gold mines around China and Africa.
The Company has recently engaged in gold trading as a start to its vision to expand into the gold trade. The company has also started to purchase gold powder and stones from various suppliers with the intention to either trade on these or appoint a subcontractor to extract and process this gold powder into gold bars and other precious metal.
| 42 |
The Market
The Company’s management believes that the market demand for natural resources (such as gold, granite and marble) will continue. Gold and other precious metals are commodities and will have times of high and low price, but the demand for it as a commodity would be present. The same to be said for granite and marble that would be affected by the economy in particular the performance in construction trade.
The Company recognizes that a significant opportunity exists in the gold and silver jewellery market. At the end of 2014, gold accounted for 58% of Jewelry demand. Currently, 57% of this demand is filled from India and China. Today 70% of brides choose white gold for their wedding or engagement rings (see http://www.xogroupinc.com/press-releases-home/2011-press-releases/2011-08-30-2011-engagement-and-jewelry-statistics-released.aspx). The total value of the market for white gold wedding and engagement rings in the US, where gold remains at the centre of the wedding ritual, is in excess of US$6.3 billion. Moreover, the US market for gold jewellery has shifted away from mass market gold sales and is enjoying a renaissance at the high end with the growth of designer gold Jewelry brands, particularly in yellow gold, that has become increasingly fashionable on the East and West coasts. A preference towards yellow gold among celebrities and fashion icons is considered the driving force behind this recent trend, in addition to the growing number of innovative yellow gold concepts emerging from up-and-coming jewellery designers (source: IBIS reports).
Over the five years through 2015, revenue for the Jewelry Manufacturing industry has grown 15.6% annually, totaling $90.0 billion. China is the second-largest jewelry-manufacturing and jewelry-consuming country in the word, supplying a vast domestic market and many foreign countries. Exports are expected to reach $57.6 billion in 2015 – 63.9% of industry revenue.
Competing imports are estimated at $31.5 billion in 2015 and account for 49.3% of domestic demand. Over the five years through 2020, industry revenue is forecast to increase at the lower average annualized rate of 8.0%, as the industry begins to mature. In 2020, ACMR-IBISWorld projects total industry revenue at $132.5 billion. Over the next five years, the product structure within the industry will remain relatively steady with gold, diamond and platinum jewelry being the main products.
Weddings are also a key driver of American demand for gold jewelry today. The US market for engagement rings and wedding bands is more than US$9.7 billion. Gold’s dominance of this market is derived from its claim to being the original and authentic metal of love. Its physical beauty, strength, and intrinsic value have made it the definitive choice for wedding bands for almost two thousand years. These qualities are still the reason over 77% of women choose gold for their wedding band today. On average, couples spend between US$1,500 and US$2,000 on the bride’s wedding band, and there is a growing trend towards more premium, customized products.
With regards to trading and margins, the Company expects trading volume for gold to be about 5mt per year. This would include dry bars as well as gold extracted from the gold sand. Selling price is dependent on the market. The Company expects the profit margins to be around 30%.
Market Trends and Dynamics
The future looks bright for the Jewelry Stores industry. During the five years to 2020, the industry is expected to grow largely in line with the overall economy. Consumer confidence and purchasing power are both anticipated to rise steadily as the economic climate continues to improve, bolstering demand for jewelry products. Additionally, growth in the number of households that earn more than $100,000 is expected to accelerate slightly through 2020. These factors will keep demand for industry products high. Consequently, industry revenue is expected to grow at an average annual rate of 2.4% to $38.5 billion during the five years to 2020.
Gold jewelry
Gold jewelry is estimated to account for 9.6% of industry revenue. Consumers may purchase gold for long-term or short-term purposes. Apart from being used as decorative jewelry, some forms of gold jewelry are purchased as inflation-protection vehicles and for stored wealth in periods of uncertainty. This segment includes all gold jewelry items in which diamonds, colored stones or pearls constitute less than 50.0% of jewelry value. Neckwear, which includes gold chains, dominates the product category. This segment’s share of industry revenue has declined amid rising demand for alternative metal types.
Major Market Segmentation
According to IBIS World, consumers within the first, second and third income quintiles are expected to account for a respective 5.9%, 8.2% and 9.4% of industry revenue, each reflecting only a slight expansion over the past five years. Consumers within the fourth income quintile spend considerably more on jewelry items than lower income quintiles. During the year, consumers within this income quintile are expected to account for 18.9% of industry revenue. Demand from this segment has grown in line with rising consumer confidence and discretionary income. Highest income quintile consumers are expected to account for a considerable 57.6% of industry revenue. (source: IBIS World). This is the Company’s target market, the 57.6% or top wage earners in this market segment.
| 43 |
Entry of the Company into the Market
The Company aims to develop a new business model that would form a ‘vertical integration’ of all its three segments, beginning at the mining stage and ending at FUDA Group USA’s new style of Corporate and franchise stores. This would ensure that all aspects of the business run more efficiently and that the Company is able to leverage various synergies without the need for intermediary intervention.
The Company will be involved at every end of the value chain from mining to retailing the final product. The Company is in the process of developing a ‘concept store.’ A concept store is a retail store that goes beyond selling products and appeals to the latest lifestyle trends- it will integrate an omni channel best practices and enable a unique luxury-shopping experience. Through the use of interactive and in-store software, customers will be able to explore products and view customized designs in 3D. Clients may also personalize particular designs. Sales associates will also be trained and highly knowledgeable in the Company’s product line.
As indicated, corporate owned concept stores will be used as a benchmark for performance. Nevertheless, the Company intends to center much of its attention on its franchising. As much as $5 million has been set aside by the Company to build and support the launch of the first corporate store. The Company also realizes that establishing an online retail space is vital to its success.
With this in mind, the Company will engage in e-commerce direct sales to online shoppers. An online store will be set up by FUDA Group USA, allowing customers to purchase directly from the Company without a third-party intermediary. A secure payment gateway will also be implemented, simplifying the online shopping experience for customers.
The Company is keenly aware that it will have to continuously prove its worth to customers in order to build the brand identity that it aims to – one of luxury, personalization, and customer satisfaction.
Products and Services
The main activities of the Company include: sales and marketing of both granite and marble raw blocks and finished products; and sales of gold and other precious metal both raw powder/stones and finished products to domestic as well as international buyers. Though the company is currently focused on selling domestically, it does not intend to abandon international buyers. We do not actively promote to international buyers, however, if there is a request, we will still sell. We expect interest from international buyers to flow in with the appointment of our new marketing director.
The finished products for granite include granite slabs, pavers, carvings and wall claddings. Since one of the particular features of the stone that the Company engages in is that they can be used for both for internal as well as external construction application, the Company has a large target market to reach out to for sales of products.
The Company also buys gold powder and raw stones from suppliers and processes them into gold bars via an appointed subcontractor since July of 2015. The Company purchases gold powder and stones for refining and processing of these materials into its own brand name products. The current product line that the company produces are wholesale bars in the weight of 5kg, 10kg and 25kg. Future product lines of the Company would be to manufacture consumer gold items for consumer retail.
Seasonality of Business
The Company’s business can encounter seasonal demand fluctuations in the granite and marble trade. Though processing activities can be conducted all year around, mining activities are limited during winter. During seasonal periods, construction demand slows as well. Hence to ensure that there are enough inventories to cater for winter sales a temporary build up in inventory is required.
Competition
The metals and mining sector in China is represented at the top by large state-owned firms organized to extract and process resources on a provincial or regional scale. The firms in this list mine a wide variety of mineral resources, including coal, bauxite, copper, gold, zinc and iron ore. Most of the companies are also involved in varied business activities that grew out of their mining operations. This list is ranked according to reported revenues in their consolidated financial statements for 2014. Important resource extraction figures from the same year are also noted:
1) China Shenhua Energy Co. Ltd., (HKSE: 1088-OL.HK), is China's biggest coal mining company by extraction volume, with a reported commercial production of about 306 million tons in 2014. China Shenhua Energy with its subsidiaries and affiliated companies are also engaged in coal chemical processing, power generation and delivery, plus rail and sea transportation businesses. China Shenhua Energy reported a consolidated revenue of $38.8 billion.
| 44 |
2) Jiangxi Copper Co. Ltd. is China's largest copper mining company, and one of its largest gold and silver mining companies. It processed more than 1.3 million tons of refined copper, over 28 tons of gold and 625 tons of silver in 2014. Besides from processing various metals and chemicals, Jiangxi Copper also produces copper products such as copper rods, tubes and foil. Jiangxi Copper reported more than $31 billion in consolidated revenue.
3) Shaanxi Coal and Chemical Industry Group Co. Ltd. is a coal mining and processing conglomerate with operations in electric power generation, iron and steel production, heavy equipment manufacturing and an array of other businesses. The company reported gross coal production of nearly 140 million tons in 2014, making it China's third-biggest coal producer by volume. Consolidated revenue amounted to $28.7 billion. Several subsidiary companies are listed on the Shanghai Stock Exchange, including Shaanxi Coal Industry Co. Ltd. and Shaanxi Construction Machinery Co. Ltd.
4) Aluminum Corporation Of China Ltd., (NYSE: ACH), also known as Chalco, is China's largest bauxite mining company. The company refines bauxite ore into aluminum oxide, known as alumina, which is then sold or further processed into primary aluminum. Chalco is the world's second-largest alumina processor by volume, reporting production of about 13.2 million tons in 2014. Output of primary aluminum was about 3.7 million tons. Chalco also fabricates aluminum products and engages in coal production and power generation businesses. It reported a consolidated revenue of more than $22 billion in 2014.
5) China Coal Energy Co. Ltd., (HKSE: 1898-OL.HK), is China's second-biggest coal mining firm, reporting a production of more than 165 million tons of coal in 2014. The company also produces coal-related chemicals, manufactures specialized coal mining equipment and provides coal mine engineering services to other mining companies. China Coal Energy reported consolidated revenue of more than $11 billion.
6) Yanzhou Coal Mining Co. Ltd., (NYSE: YZC), is a coal mining and processing firm with associated operations in railway transportation, coal chemical production and power generation. It operates twelve coal mines in China and another nine mines in Australia with a total of six additional mines set to enter commercial production by 2016. Total coal production amounted to more than 80 million tons in 2014. Yanzhou’s consolidated revenue was more than $9.4 billion.
7) Zijin Mining Group, (HKSE: 2899-OL.HK), is China's biggest gold producer, second-biggest copper producer and major producer of iron and silver ores. In 2014, it produced 175 tons of gold, 411,000 tons of copper, 3 million tons of iron concentrates and 349 tons of silver. It also mines zinc, tungsten, tin, lead, molybdenum and coal. In addition to its domestic mines, Zijin Mining Group has mining operations in Kyrgyzstan, Tajikistan, South Africa and Russia. It reported a consolidated revenue of more than $9.1 billion.
Strategic Relationship with Suppliers
The Company believes that the relationship with our major suppliers – such as Junda Mining, Heng Xu Mining, and Xiang An Mining will be a major component of the Company’s operating strategy and path to success. The Company hopes to work with our major suppliers in important areas of its business and operations. The Company’s management believes that adding more value to existing suppliers is the most efficient and useful route to building the Company’s business in a competitive industry.
| 45 |
The Company does work with several important suppliers/vendors that are important for its operations and success, including the three most significant suppliers – Junda Mining, Heng Xu Mining and Xiang An Mining.
Governmental Regulations
The Company does not presently need or require any approval of a material nature from government authorities or agencies in order to operate its regular business and operations.
Customers
The Company has many other customers, and plans to continue to grow its customer base. Customers are typically industrial wholesalers, government agencies with infrastructure or upgrading projects, civil engineering firms, corporations, renovators, construction companies and stone processing factories.
Some of construction projects and clients that the Company has worked with for granite/marble include the following:
| Project | Location |
| Beijing Capital Airport Terminal 3 | China |
| CExhibition Hall in DanDong | China |
| Wanda Real Estate Development Construction Projects | China |
| Sun Fortune Building Construction Projects | China |
| Golden Prosperity | Sri Lanka |
| ANU Management | Sri Lanka |
| JFL International Group | Singapore |
| Blandford & Worthing | Singapore |
| Centuary Corporation | India |
| Aaray Global Resources | India |
As the Company has just begun its operations for gold bars and gold powder/stones, they are still growing their customer base. The Company is a member of Singapore Assay Office an independent body that tests and certifies precious metal articles as well as assay and hallmarking. Currently, the clients include Gold Jewellers, Gold Traders and refineries.
Marketing and Sales
The Company has conducted limited advertising and marketing to date to reach new customers. The Company has, however, given substantial attention to constructing the marketing strategy and plans that it will use in order to grow its business and expand its customers. The Company eventually anticipates the need for a significant budget for marketing activities. The primary focus of marketing campaigns will be designed to help the Company find new customers and to increase awareness of the Company’s products, services and competitive solutions. A variety of marketing approaches, emphasizing the competitive advantages, i.e. low cost labour and large domestic market in China, and internal and external application as the key differentiators of the Company’s products and services, are expected to be used in order to attract new customers and entice existing customers to do larger volumes of business with the Company.
The Company expects that its sales team will work closely with the marketing team to win and retain new customers. The sales team will be structured to align with target markets based on territory and customer patterns.
The Company also plans to employ sales persons, distributors and other such agents in China and other countries. Relationships are key to success in the Company’s business. Most institutional and government projects have all been established and maintained through personal contact. Personal selling will remain the Company’s most important means of promotion in the corporate and government sectors.
In and through 2013 to 2014, the Company changed the focus of the business to more regional customers and distributions from international customers and distribution channels. This is in large part due to larger costs associated with international delivery. Focusing on regional customers was easier for collections, customers were familiar with products and logistics costs were significantly lower.
| 46 |
At the present time, the Company generally sells direct to its customers, and wholesalers. Customers organize their own shipping and handling. The materials are stored in their own warehouse. Hence, there is no cost associated with distribution.
The marketing strategy is multi-faceted:
| - | Penetrate the applicable stone market. |
| - | Emphasize personal service and support. |
| - | Foster a long-term relationship business. |
| - | Focus on the public-sector, major contractor and high-end homeowner as key target markets. |
| - | Induce more companies to utilize the Company’s products. |
The Company positions itself with one core objective: satisfied customers are the best marketing tool. When a customer leaves the Company’s business satisfied, knowing that they have dealt with an honest company, knowing that they have a reliable, trustworthy and quality product at an attractive price, the Company expects that its name and services will stand on its own and build the Company’s brand name and reputation.
Pricing
For raw blocks of granite/marble, the pricing varied based on the applicable grades of the blocks. A raw block is a block cut from the mine with the standard dimension of 3m x 2m x 1.5m with no processing, polish or trim. The raw block is then either put directly into inventory, processed further to various stages and put into inventory to meet projected demand needs or immediately processed to customer specification to fulfil an order. Volume discounts are offered by the Company to major clients. The Company considers its pricing strategy to be competitive within its marketplace. For granite/marble, the Company prices finished products using prevailing market rates. The market price is between 1200-1400 Chinese Yuan (USD$193.50 – USD$225.80) per ton.
The averaged Supplier's costs are as below:
| Material | Supply Costs (CNY) | |
| Granite Block Grade A | 2600 | |
| Granite Block Grade B | 2200 | |
| Granite Block Grade C | 275 | |
| Granite Block Grade D | 250 | |
| Slab (Fire) 25mm (Not processed) | 50 | |
| Slab (Fire) 30mm (Not processed) | 55 | |
| Slab (Polished) 15mm (Not processed) | 60 | |
| Slab (Polished) 20mm (Not processed) | 67 | |
| Slab (Polished) 25mm (Not processed) | 80 | |
| Processed Slab (Fire) 300以上×25 | 85 | |
| Processed Slab (Polished) 300以上×20 | 72 | |
| Processed Slab (Polished) 300以上×25 | 85 | |
| Processed Slab (Polished) 300以上×30 | 90 | |
| Mushroom Shape 100*100*50 | 270 | |
| Curbside 2 cut 600 above×150 above×100 | 900 | |
| Curbside 6 cut 600 above×150 above×100 | 1700 |
The cost of Gold extraction is approximately $23 per gram. That includes the cost of purchasing raw gold ore and sand as well as refining costs.
The purchase and sales price of gold bars are determined by the exchange in which the trade is conducted or mutually agreed by both buyers and sellers. The exchanges that current buyers and sellers refer to are LBMA, COMEX and SGEX.
The Company will use a dynamic pricing model. All jewelry prices will be clearly marked in store and online, as the Company will be able to leverage a competitive pricing advantage over other operators due to acquisition of mines. In operating its concept jewelry stores, FUDA Group USA will need to maintain competitive pricing strategy. Some items will be slow moving, and the Company will make a provision for their obsolescence, but most of the products will be always on demand as they will incorporate with modern designs while holding an average predetermined sale price. The Company also expects that its highest quality designs will fetch high revenues. The acquisition of mines will provide the Company savings in the long term due to FUDA Group USA’s ability to source internally.
| 47 |
The retail pricing of jewelry is complex and not necessarily as profitable as one might expect. Jewelry is a competitive niche market with high overhead, high start-up costs, and often low-profit margins. While some jewelry will earn a good profit, a lot of expensive items have a lower markup. According to the Retail Owner's Institute, jewelry stores saw only 5.3 percent profit before taxes in 2012. According to National Jeweler's 2010 Profit Margins Survey, 26 percent of products were marked up 90 to 110 percent. However, 45 percent of jewelry was marked up less than 90 percent. Almost half of all diamond engagement rings were marked up between 25 and 75 percent while almost half of all loose diamonds were sold at less than 50 percent markup. Anniversary rings and non-bridal diamond rings were typically marked up at rates of 90 to 125 percent. Diamond sales account for 46 percent of jewelry store sales. Colored stone jewelry of numerous types was typically marked up at higher rates than diamond jewelry but only accounts for 8 percent of sales. Gold and silver jewelry without stones had higher markups of 90 percent or more. (source: National Jeweler's 2010 Profit Margins Survey).
Because the price of precious metals is constantly changing, the price of jewelry also changes. This does not always benefit the jewelry store owner. For example, say a store owner purchases fifty identical gold chains weighing ten ounces total when gold was valued at $1,400 per ounce. The final retail price of each will reflect the price of the workmanship, shipping costs, the overhead of the store and the price of the gold. Due to market fluctuations, a jeweler may face loss or low markup in jewelry sales. This is a source of major advantage to the Company. Sourcing raw materials internally will shield the company from such fluctuations. Furthermore, the branding element will help the Company earn supernormal margins compared to the typical margin structure of boutique brands and non-branded products.
Operations
The Company is mainly engaged in trading of gold and granite/marble. At present, for granite and marble, the Company is supplying raw blocks to wholesalers and other stone processing plants. Hence, to expand the business as an end-to-end supplier, the Company plans to build its own processing plants and acquire mines to secure the best price supply and ensure a stable supply of materials. The company anticipates this activity will increase profit margin by getting further down the supply chain, and thus increase the value we can provide to our customers by reduce double handling costs in terms of transportation, supply costs and also sub-contractor margins. For gold operations, the Company has only just started to purchase gold powder and stones with the intention to sell directly to refineries or subcontract it out to refineries to extract out the gold and precious metal to form into blocks. Hence, to ensure a stable supply and reduce on the reliance on subcontractors, the intention is for the Company to have its own processing facilities and acquires mines to ensure supply and improve profit margins.
The Company’s operating procedures are compliant as per ISO9001.
Acquisitions
On September 8, 2015, Fuda Group (USA) Corporation, a Delaware corporation (the “Company”), entered into stock-for-stock acquisition agreements with each of Fuda Gold (UK) Limited, a private company organized under the laws of England and Wales (“Fuda UK”), and Marvel Investment Corporation Limited, a private company organized under the laws of Hong Kong (“Marvel”), in separate acquisitions (collectively, and together, the “Acquisitions”), that will be completed on the same date on which the relevant financial statements of the Company has been provided to the satisfaction of the Company. The purpose of the Acquisitions was to facilitate and prepare the Company for expanded business and operations as well as a registration statement and/or public offering of securities. Based on separate agreement of the applicable parties, the Acquisitions were consummated on September 28, 2015.
Fuda UK was incorporated in May 2015 in the United Kingdom. Since its inception, Fuda UK has conducted minimal business operations but has started to purchase gold stones and powder and wholesale trading of gold bars.
Marvel was incorporated in October 2009 in Hong Kong. Since its inception, Marvel conducted minimal business operations until it acquired Liaoning Fuda Mining Co. Ltd. (“Liaoning Fuda”) pursuant to an equity transfer agreement executed on February 28, 2015 and later consummated on June 30, 2015.
Liaoning Fuda was incorporated in China in August 2012. Liaoning Fuda is a granite and marble trading company.
| 48 |
As a result of the Acquisitions, each of Fuda UK and Marvel has been acquired by the Company, and now each has become a wholly owned subsidiary of the Company (furthermore, Liaoning Fuda is a wholly owned subsidiary of Marvel). The Company, as the surviving entity from the Acquisitions, has taken over the respective operations and business plans of each of both Fuda UK and Marvel (and also of Liaoning Fuda by virtue of Marvel’s ownership of Liaoning Fuda).
Mr. Xiaobin Wu, who is the sole officer and director of the Company, beneficially owned and controlled a majority of the shares of each of Fuda UK and Marvel, respectively, prior to the Acquisitions. Mr. Wu is the largest shareholder also of the Company.
Pursuant to the Acquisition Agreements, the Company acquires each of Fuda UK and Marvel through the exchange of (i) all of the outstanding shares of Fuda UK for 50,000,000 shares of common stock of the Company, and (ii) all of the outstanding shares of Marvel for 62,000,000 pre-split shares of common stock of the Company. Accordingly, a total of 112,000,000 pre-split shares were issued in the Acquisitions.
Intellectual Property
The Company intends to protect its intellectual property, trade secrets and proprietary methods and processes (to the extent applicable) in the United States and abroad (including China). However, at the present time, the Company does not possess any intellectual property grants nor has the Company applied for any intellectual property protection.
Employees and Organization
The Company presently has approximately 50-60 employees.
Property
The Company currently has the following physical locations and respective lease arrangements:
The Company’s Beijing Head office is located at Room 1010, 1011, Financial Street Center South Tower, No.9A, Financial Street, Xicheng District, Beijing 100033, P.R. China
The Company’s China Regional office is located at 12th Floor, 100 Jin Jiang Street, Dandong City, Liaoning Province, China
The Company’s USA office is located at 48 Wall Street, 11th Floor, New York, NY 10005, USA
If the Company were forced to relocate, it believes it could obtain an equally satisfactory location at a comparable price.
The Company currently owns land use rights to 8 parcels of lands surrounding the mines for investment purposes, containing a total of approximately 21.56 million square feet of land.
Subsidiaries
The Company has two wholly owned subsidiaries: Fuda UK and Marvel. Liaoning Fuda is a wholly owned subsidiary of Marvel and in turn indirectly a wholly owned subsidiary of the Company.
Relationship with Tiber Creek Corporation
In 2015, the Company entered into an engagement agreement with Tiber Creek Corporation, a Delaware corporation (“Tiber Creek”), whereby Tiber Creek would provide assistance to the Company in effecting transactions for the Company to combine with a public reporting company. Tiber Creek will specifically be providing assistance in transferring control of reporting to the Company, preparing the business combination agreement, effecting the merger; the preparation and filing of forms which include a registration statement, with the Securities and Exchange Commission. They will also assist in listing the Companies securities on a trading exchange; and establishing and maintaining relationships with market makers and broker-dealers.
Tiber Creek received cash fees from the Company in exchange for their consulting services. In addition, the Company’s then-current shareholders, Tiber Creek and MB Americus, LLC, a California limited liability company (“MB Americus”), were permitted to retain the aggregate total of 500,000 shares. The engagement agreement also provides that the shares held by Tiber Creek and MB Americus shall be included in the registration statement filed by the Company.
| 49 |
In general, Tiber Creek holds interests in inactive Delaware corporations which may be used by issuers (such as the Company) to reincorporate their business in the State of Delaware and capitalize the issuer at a level and in a manner (i.e. the number of authorized shares and rights and preferences of shareholders) that is appropriate for a public company. Otherwise, these corporations, such as Spruce Valley Acquisition, are inactive, and Tiber Creek does not conduct any business in such corporations.
James Cassidy and James McKillop (who is the sole owner of MB Americus, an affiliate of Tiber Creek) serve only as interim officers and directors of these corporations (such as Spruce Valley Acquisition) until such time as the changes of control in such corporations are effectuated to the ultimate registering issuers. As the role of Tiber Creek is essentially limited to preparing the corporate structure and organizing the Company for becoming a public company, the roles of Mr. Cassidy and Mr. McKillop are generally limited to facilitating such change of control and securities registration transactions.
Jumpstart Our Business Startups Act
In April, 2012, the Jumpstart Our Business Startups Act ("JOBS Act") was enacted into law. The JOBS Act provides, among other things:
Exemptions for emerging growth companies from certain financial disclosure and governance requirements for up to five years and provides a new form of financing to small companies;
Amendments to certain provisions of the federal securities laws to simplify the sale of securities and increase the threshold number of record holders required to trigger the reporting requirements of the Securities Exchange Act of 1934;
Relaxation of the general solicitation and general advertising prohibition for Rule 506 offerings;
Adoption of a new exemption for public offerings of securities in amounts not exceeding $50 million; and
Exemption from registration by a non-reporting company of offers and sales of securities of up to $1,000,000 that comply with rules to be adopted by the SEC pursuant to Section 4(6) of the Securities Act and exemption of such sales from state law registration, documentation or offering requirements.
In general, under the JOBS Act a company is an emerging growth company if its initial public offering ("IPO") of common equity securities was effected after December 8, 2011 and the company had less than $1 billion of total annual gross revenues during its last completed fiscal year. A company will no longer qualify as an emerging growth company after the earliest of
(i) the completion of the fiscal year in which the company has total annual gross revenues of $1 billion or more,
(ii) the completion of the fiscal year of the fifth anniversary of the company's IPO;
(iii) the company's issuance of more than $1 billion in nonconvertible debt in the prior three-year period, or
(iv) the company becoming a "larger accelerated filer" as defined under the Securities Exchange Act of 1934.
The JOBS Act provides additional new guidelines and exemptions for non-reporting companies and for non-public offerings. Those exemptions that impact the Company are discussed below.
Financial Disclosure. The financial disclosure in a registration statement filed by an emerging growth company pursuant to the Securities Act of 1933 will differ from registration statements filed by other companies as follows:
(i) audited financial statements required for only two fiscal years;
(ii) selected financial data required for only the fiscal years that were audited;
(iii) executive compensation only needs to be presented in the limited format now required for smaller reporting companies. (A smaller reporting company is one with a public float of less than $75 million as of the last day of its most recently completed second fiscal quarter)
However, the requirements for financial disclosure provided by Regulation S-K promulgated by the Rules and Regulations of the SEC already provide certain of these exemptions for smaller reporting companies. The Company is a smaller reporting company. Currently a smaller reporting company is not required to file as part of its registration statement selected financial data and only needs audited financial statements for its two most current fiscal years and no tabular disclosure of contractual obligations.
| 50 |
The JOBS Act also exempts the Company's independent registered public accounting firm from complying with any rules adopted by the Public Company Accounting Oversight Board ("PCAOB") after the date of the JOBS Act's enactment, except as otherwise required by SEC rule.
The JOBS Act also exempts an emerging growth company from any requirement adopted by the PCAOB for mandatory rotation of the Company's accounting firm or for a supplemental auditor report about the audit.
Internal Control Attestation. The JOBS Act also provides an exemption from the requirement of the Company's independent registered public accounting firm to file a report on the Company's internal control over financial reporting, although management of the Company is still required to file its report on the adequacy of the Company's internal control over financial reporting.
Section 102(a) of the JOBS Act exempts emerging growth companies from the requirements in §14A(e) of the Securities Exchange Act of 1934 for companies with a class of securities registered under the 1934 Act to hold shareholder votes for executive compensation and golden parachutes.
Other Items of the JOBS Act. The JOBS Act also provides that an emerging growth company can communicate with potential investors that are qualified institutional buyers or institutions that are accredited to determine interest in a contemplated offering either prior to or after the date of filing the respective registration statement. The Act also permits research reports by a broker or dealer about an emerging growth company regardless if such report provides sufficient information for an investment decision. In addition the JOBS Act precludes the SEC and FINRA from adopting certain restrictive rules or regulations regarding brokers, dealers and potential investors, communications with management and distribution of a research reports on the emerging growth company IPO.
Section 106 of the JOBS Act permits emerging growth companies to submit 1933 Act registration statements on a confidential basis provided that the registration statement and all amendments are publicly filed at least 21 days before the issuer conducts any road show. This is intended to allow the emerging growth company to explore the IPO option without disclosing to the market the fact that it is seeking to go public or disclosing the information contained in its registration statement until the company is ready to conduct a roadshow.
Election to Opt Out of Transition Period. Section 102(b)(1) of the JOBS Act exempts emerging growth companies from being required to comply with new or revised financial accounting standards until private companies (that is, those that have not had a 1933 Act registration statement declared effective or do not have a class of securities registered under the 1934 Act) are required to comply with the new or revised financial accounting standard.
The JOBS Act provides a company can elect to opt out of the extended transition period and comply with the requirements that apply to non-emerging growth companies but any such an election to opt out is irrevocable. The Company has elected not to opt out of the transition period.
Reports to Security Holders
The Company has filed a registration statement on Form S-1, under the Securities Act of 1933, with the Securities and Exchange Commission with respect to the shares of its common stock held by selling shareholders. This prospectus is filed as a part of that registration statement, but does not contain all of the information contained in the registration statement and exhibits. Statements made in the registration statement are summaries of the material terms of the referenced contracts, agreements or documents of the company. Reference is made to the Company’s registration statement and each exhibit attached to it for a more detailed description of matters involving the Company. A potential investor may inspect the registration statement, exhibits and schedules filed with the Securities and Exchange Commission, along with any other filings of the Company, as described below.
In November 2014, the Company (as Spruce Valley Acquisition Corporation) filed a Form 10-12G registration statement pursuant to the Securities Exchange Act of 1934 and is a reporting company pursuant to the Act and files with the Securities and Exchange Commission quarterly and annual reports and management shareholding information. The Company intends to deliver a copy of its annual report to its security holders, and will voluntarily send a copy of the annual report, including audited financial statements, to any registered shareholder who requests the same.
The Company's documents filed with the Securities and Exchange Commission may be inspected at the Commission's principal office in Washington, D.C. Copies of all or any part of the registration statement may be obtained from the Public Reference Section of the Securities and Exchange Commission, 100 F Street N.E., Washington, D.C. 20549. Call the Commission at 1-800-SEC-0330 for further information on the operation of the public reference rooms. The Securities and Exchange Commission also maintains a web site at http://www.sec.gov that contains reports, proxy statements and information regarding registrants that file electronically with the Commission. All of the Company’s filings may be located under the CIK number 0001623013.
| 51 |
The Company plans to launch its first modern ‘concept jewelry store’ in Beijing and New York. These concept stores will act as the benchmark for the development of future corporate owned and franchise stores throughout the United States. Industry activity is concentrated in the Southeast and Mid-Atlantic regions of the United States. Together, these regions account for close to half of industry establishments. High per capita income and large population densities are responsible for the elevated level of concentration of industry establishments in these two regions. The Southeast region, which has 25.4% of the US population, accounts for an estimated 24.8% of industry establishments. Most notably, the state of Florida has 8.8% of industry establishments. Florida’s high concentration of adults over the age of 65 (elderly individuals, on average, have higher disposable incomes than younger Americans and are larger consumers of jewelry products) contributes to the state’s high concentration of industry establishments. Additionally, beach culture in Florida, specifically in Miami, strongly encourages the purchase of jewelry among all age groups.
The Mid-Atlantic region accounts for an estimated 20.6% of industry establishments and 15.5% of the population. This region includes the state of New York, which accounts for 10.0% of all jewelry stores in the country. New York City is home to the Tiffany & Co. flagship store, which attracts a substantial amount of tourist attention and spending. In addition, the average annual income of New York residents is higher than the national average, increasing demand for industry products in New York City, in particular.
Potential Revenue
The Company expects to earn potential revenue from existing customers and product sales and refining and trading activities. The Company prospects for new clients on an ongoing basis and also seeks additional revenue enhancement opportunities from existing clients. The company will be also expanding its portfolio of products.
MANAGEMENT'S DISCUSSION AND ANALYSIS OF FINANCIAL CONDITION
AND RESULTS OF OPERATIONS
The Company was incorporated in the State of Delaware in September 2014 and was formerly known as Spruce Valley Acquisition Corporation. In September 2015, the Company acquired each of Fuda Gold (UK) Limited, a private company organized under the laws of England and Wales (“Fuda UK”), and Marvel Investment Corporation Limited, a private company organized under the laws of Hong Kong (“Marvel”), in separate stock-for-stock acquisitions. Prior to the Acquisitions, the Company had no ongoing business or operations and was established for the purpose of completing a business combination with a target company, such as Fuda UK and Marvel. Accordingly, the business of the Company is now that of Fuda UK and Marvel (and of Liaoning Fuda by virtue of Marvel’s ownership of Liaoning Fuda), each of which was acquired by the Company in the Acquisitions.
References to the financial condition and performance of the Company below in this section “Management’s Discussions and Analysis of Financial Condition and Results of Operation” are to Liaoning Fuda Mining Co. Ltd, Fuda UK and Marvel respectively. The Company’s independent auditors have expressed substantial doubt as to the ability for some companies under the structure but not Liaoning Fuda to continue as a going concern . Unless the Company is able to generate sufficient cash flow from operations and/or obtain additional financing, there is a substantial doubt as to the ability of for some companies under the structure but not Liaoning Fuda to continue as a going concern.
Off-Balance Sheet Arrangements
The Company has no off-balance sheet arrangements.
Equipment Financing
The Company has no existing equipment financing arrangements.
Potential Revenue
The Company expects to earn potential revenue from existing customers and product sales and refining and trading activities. The Company prospects for new clients on an ongoing basis and also seeks additional revenue enhancement opportunities from existing clients. The company will be also expanding its portfolio of products.
| 52 |
Alternative Financial Planning
The Company has no alternative financial plans at the moment. If the Company is not able to successfully raise monies as needed through a private placement or other securities offering (including, but not limited to, a primary public offering of securities), the Company’s ability to expand its business plan or strategy over the next two years will be jeopardized.
Critical Accounting Policies
The financial statements of the Company have been prepared in accordance with accounting principles generally accepted in the United States. The preparation of these financial statements requires making estimates and judgments that affect the reported amounts of assets, liabilities, revenues and expenses, and related disclosure of contingent assets and liabilities. The estimates are based on historical experience and on various other assumptions that are believed to be reasonable under the circumstances, the results of which form the basis of making judgments about the carrying values of assets and liabilities that are not readily apparent from other sources. Actual results may differ from these estimates under different assumptions or conditions.
Capital Resources
As of December 31, 2014, Liaoning Fuda had cash available of $466, Marvel had cash available of $0 and Fuda UK had cash available of $0.
As of June 30, 2015, Marvel and its subsidiary Liaoning Fuda has cash available of $5,420,679 and Fuda UK had cash available of $0.
The Company’s proposed expansion plans and business process improvements described above will necessitate additional capital and financing. Accordingly, the Company plans to raise outside funding in order to achieve its expanded growth and profit objectives in its business over the next two years. The monies raised will be utilized for general operations, working capital, acquisition of mines, acquisition of gold sorting and refining facilities and acquisition of granite and marble processing facilities.
There can be no assurance that the Company’s activities will generate sufficient revenues to sustain its operations without additional capital, or if additional capital is needed, that such funds, if available, will be obtainable on terms satisfactory to the Company. Accordingly, given the Company’s limited cash and cash equivalents on hand, the Company will be unable to implement its contemplated business plans and operations unless it obtains additional financing or otherwise is able to generate sufficient revenues and profits. The Company may raise additional capital through sales of debt or equity, obtain loan financing or develop and consummate other alternative financial plans.
Discussion of Year ended December 31, 2014 and 2013 of Liaoning Fuda Mining Co. Ltd
Liaoning Fuda generated revenues during the year ended December 31, 2014 of $42,518,470, as compared to revenues of $58,584,590 for the year ended December 31, 2013, a decrease of approximately 27% on a year-over-year basis. Gross margin for the year ended December 31, 2014 was $28,248,139 or approximately 66% of revenues as compared to $25,169,638 or approximately 43% of revenues. The increase in gross margin from 2013 to 2014 resulted from decreased in expenses related to exporting and delivery of goods to customers.
During the year ended December 31, 2014, Liaoning Fuda posted operating income of $27,018,801 and net income of $27,016,168 as compared to operating income of 13,338,468 and net income of $7,961,161 for the year ending December 31, 2013. Operating fees from insurance decreased 92% from $4,575,337 in the year ended December 31, 2013 to $345,461 in the same period of 2014. The decrease in these costs was primarily attributable to a decrease in employee wages and salaries, rental of equipment expenses, bad debt expenses, and agency fees charged for overseas sales by $5,889,036 or approximately 356% on a year-over-year basis. The decrease in costs resulted from Liaoning Fuda change of its business model focusing on local domestic market instead of international market. The significant impact due to the change in business model was a result of less exports and more domestic sales which resulted in less gross sales but higher sales margins. The change in business model also reduced the amount of inventory Liaoning Fuda had on hand to $3,843 at the fiscal year ended December 31, 2014 from $5,679,351 for the fiscal year ended December 31, 2013. It also reduced the amounts of sales made on credit as well which reduced the collection times and the cost of trade financing. The details are as follows:
| 53 |
| For the Years Ended | ||||||||
| December 31, | December 31, | |||||||
| 2014 | 2013 | |||||||
| Cost of sales | ||||||||
| Custom duties charges | 194,166 | 1,545,156 | ||||||
| Freight and courier | 540,451 | 3,560,376 | ||||||
| Other cost of sales | 13,535,714 | 28,309,420 | ||||||
| Total | 14,270,331 | 33,414,952 | ||||||
| Selling, general and administrative expenses | ||||||||
| Insurance | 345,461 | 4,575,337 | ||||||
| Employees’ wages and salaries | 471,641 | 1,081,244 | ||||||
| Rent-Equipment | - | 1,475,716 | ||||||
| Bad debt expenses | 15,130 | 1,887,886 | ||||||
| Agency fees | - | 1,930,961 | ||||||
| Other selling, general and administrative expenses | 397,106 | 880,026 | ||||||
| Total | 1,229,338 | 11,831,170 | ||||||
During the year ended December 31, 2014, Liaoning Fuda incurred interest expenses of $346,262 on its trade financing bank loans and received $343,477 as a rebate from the local government as compared to interest expense of $5,377,570 for the year ended December 31, 2013.
During the year ended December 31, 2014, Liaoning Fuda provided cash of $30,592,305 as compared to $10,620,006 for the year ended December 31, 2013 from its operations.
During year ended December 31, 2014, Liaoning Fuda used cash in financing activities totalling $2,144,151 to repay its trade financing loans and related party as well as distributions to its owners. As for the year ended Decembe 31, 2013, Liaoning Fuda has cash provided in financing activities totaling 8,152,351 due to capital contribution by owners and proceeds from trade financing loans.
Liaoning Fuda incurred capital expenditures of $31,633,774 during the year ended December 31, 2014 as compared to $15,757,961 during 2013 in acquisition of lands, property and equipment.
Discussion of Year ended December 31, 2014 and 2013 of Marvel Investments Corporation Limited
Marvel is a holding company and has not generated any income, has had no operations, other than expenses required to maintain its annual filing requirements to comply with local government. The expenses incurred were $986 and $727 for the years ended December 31, 2014 and 2013.
At December 31, 2014, Marvel had sustained a net loss of $8,345.
Discussion of Six Months ended June 30, 2015 and 2014 of Marvel Investments Corporation Limited and its subsidiary Liaoning Fuda Mining Co. Ltd
Effective June 30, 2015, Liaoning Fuda merged with Marvel and became a subsidiary of Marvel.
Marvel and its subsidiary Liaoning Fuda generated revenues during the six months ended June 30, 2015 of $20,088,354, as compared to revenues of $21,684,493 for the six months ended June 30, 2014, a decrease of approximately 7%. Gross margin for the six months ended June 30, 2015 was $12,037,522 or approximately 60% of revenues as compared to $11,840,269 or approximately 55% of revenues. The increase in gross margin from 2014 to 2015 resulted from decreased in expenses related to exporting and delivery of goods to customers.
During the year ended six months ended June 30, 2015, Marvel and its subsidiary Liaoning Fuda posted operating income of $11,705,065 and net income of $11,737,752as compared to operating income of $10,677,214 and net income of $10,623,659 for the six months ending June 30, 2014. Operating fees such as insurance decreased 100% from $336,286 in the six months ended June 30, 2015 to $nil in the same period of 2014. The decrease in these costs was primarily attributable to a decrease in employee wages and salaries, rental of equipment expenses, and bad debt expenses. The decrease in costs resulted from Marvel and its subsidiary Liaoning Fuda change of its business model focusing on local domestic market instead of international market. The significant impact due to the change in business model was a result of less exports and more domestic sales. The details are as follows:
| 54 |
| For the Six Months Ended | ||||||||
| June 30, | June 30, | |||||||
| 2015 | 2014 | |||||||
| Cost of sales | ||||||||
| Custom duties charges | - | 194,291 | ||||||
| Freight and courier | 163 | 532,942 | ||||||
| Other cost of sales | 8,050,669 | 9,116,991 | ||||||
| Total | 8,050,832 | 9,844,224 | ||||||
| Selling, general and administrative expenses | ||||||||
| Insurance | - | 336,286 | ||||||
| Employees’ wages and salaries | 194,549 | 279,457 | ||||||
| Other selling, general and administrative expenses | 137,908 | 256,546 | ||||||
| Total | 332,457 | 872,289 | ||||||
During the six months ended June 30, 2015, Marvel and its subsidiary Liaoning Fuda incurred interest expenses of $1,339 on its trade financing bank loans and received $34,544 as a rebate from the local government as compared to interest expense of $344,972 and received rebate of $651 for the six months ended June 30, 2014. The decrease in interest expense resulted from lower trade financing bank loan outstanding balance. Marvel and its subsidiary Liaoning Fuda incurred interest expense on the sale of accounts receivable at factoring rate during the six months ended June 30, 2014.
During the six months ended June 30, 2015, Marvel and its subsidiary Liaoning Fuda provided cash of $7,316,907 as compared to $30,536,062 for the six months ended June 30, 2014 from its operations.
During six months ended June 30, 2015 and 2014, Marvel and its subsidiary Liaoning Fuda used cash in financing activities totalling $1,904,042 and $2,039,730, respectively, to repay its trade financing loans and related party.
Marvel and its subsidiary Liaoning Fuda incurred capital expenditures of $nil during six months ended June 30, 2015 as compared to $31,667,151 during six months ended June 30, 2014 in acquisition of lands, property and equipment.
Discussion of Six Months ended June 30, 2015 and 2014 of Fuda Gold (UK) Limited
Fuda UK was established on May 20, 2015 as a holding company and has not generated any income, has had no operations, other than expenses to incorporate the company. The expenses incurred was $76 since inception to June 30, 2015
At June 30, 2015, Fuda UK had sustained a net loss of $76.
The following table sets forth information regarding the members of the Company’s board of directors, officers and management.
| Name | Age | Position | Year Commenced with Company | |||
| Xiaobin Wu | 45 | President and Chief Executive Officer | 2015 | |||
| Weiguo Lang | Chief Operating Officer | 2015 | ||||
| Bin Lee | Company Secretary and Legal Adviser |
2015 | ||||
| Jimmy Lee | Chief Financial Officer | 2015 | ||||
| Mihir Sangani | Director, Marketing and Investor Relations |
2015 | ||||
| Lynn Lee | Personal Assistant and People Officer |
2015 |
| 55 |
Xiaobin Wu
Xiaobin Wu serves as Chief Executive Officer, President and Chief Financial Officer of the Company, and is the sole director of the Company. From 2012 to the present, Mr. Wu has been the Managing Director of Liaoning Fuda Mining Co. Ltd. based in Dandong, China. Mr. Wu is also the Managing Director of Marvel Investment Corporation Limited based in Hong Kong, China since 2009. Mr. Wu received a Master of Business Administration degree in 2012 from Peking University in Beijing, China. Mr. Wu has extensive commercial and entrepreneur experience and a wide network of contacts.
Weiguo Lang
Weiguo Lang was appointed Chief Operating Officer in August 2015. Lang has a PhD in Engineering. Mr Lang has published greater than 20 academic papers and reports. He has significant engineering and operational experience in the mining industry.
Bin Li
Bin Li was appointed as Company Secretary and Legal Adviser in October 2015. Mr. Li finished his Masters Degree and Doctor of Jurisprudence Degree in the United States. Mr. Li is licensed by the State Bar of California to appear before the California Superior Court and Court of Appeal, the federal District Court and Bankruptcy Court for the Central District of California.
Jimmy Lee
Jimmy Lee was appointed as Chief Financial Officer in June 2015. He is a qualified well versed with both the US and Asian markets and has deep knowledge about auditing, financial, reporting, consulting, taxation and financial planning. He is also a licensed CPA.
Mihir Sangari
Mihir Sangari was appointed as Director of Sales and Marketing in August 2015. has significant global marketing & business development along with investor relation exposure. Mr. Sangani has expertise includes early stage company capital restructuring, debt financing, capital introductions, and mergers and acquisitions.
Lynn Lee
Lynn Lee was appointed Personal Assistant and People Officer since March 2014. She has many years of working experience in international locations with various industries in both public and private sectors -MNCs and local companies. She has extensive people management experience and organization planning and development experience.
Director Independence
Pursuant to Rule 4200 of The NASDAQ Stock Market one of the definitions of an independent director is a person other than an executive officer or employee of a company. The Company's board of directors has reviewed the materiality of any relationship that each of the directors has with the Company, either directly or indirectly. Based on this review, the board has determined that there are no independent directors.
Committees and Terms
The Board of Directors (the “Board”) has not established any committees of the Board.
Legal Proceedings
There are currently no pending, threatened or actual legal proceedings of a material nature in which the Company is a party.
None of the officers and directors of the Company are presently involved in material legal proceedings. Moreover, during the past ten years, none of the officers and directors of the Company have been involved in material legal proceedings of the nature described in Item 401(f) of Regulation S-K)
| 56 |
Remuneration of Officers: Summary Compensation Table
| Aggregate | ||||||||||||||||||
| Annual | Annual | Accrued | All | Annual | ||||||||||||||
| Earned | Payments | Salary Since | Stock and | Compensation | Other | Compensation | ||||||||||||
| Name/Position | Year | Salary | Made | Inception | Bonus | Options | Plans | Compensation | Total | |||||||||
| Xiaobin Wu | 2014 | |||||||||||||||||
| President, Chief Executive Officer | ||||||||||||||||||
Upon successful completion by the Company of a primary public offering in the future (or the completion of other financing or funding), however, the Company may compensate officers and employees as is discussed below in “Anticipated Officer and Director Remuneration.”
Each of the officers has received certain shares of common stock in the Company in connection with the change of control of the Company. Accordingly, the Company has not recorded any compensation expense in respect of any shares issued to the officers as such shares do not represent compensation that was paid to any officer.
There are no current plans to pay or distribute any cash or non-cash bonus compensation to officers of the Company, until such time as the Company is profitable, experiences positive cash flow or obtains additional financing. However, the Board of Directors may allocate salaries and benefits to the officers in its sole discretion. No officer is subject to a compensation plan or arrangement that results from his or her resignation, retirement, or any other termination of employment with the Company or from a change in control of the company or a change in his or her responsibilities following a change in control. The members of the Board of Directors may receive, if the Board so decides, a fixed fee and reimbursement of expenses, for attendance at each regular or special meeting of the Board, although no such program has been adopted to date. The Company currently has no retirement, pension, or profit-sharing plan covering its officers and directors; however, the Company plans to implement certain such benefits after sufficient funds are realized or raised by the Company (see “Anticipated Officer and Director Remuneration” below.)
Director Compensation
Our subsidiaries’ officers, employees, consultants or advisors who also serve as directors do not receive additional compensation for their service as directors. Our directors who are not our or our subsidiaries’ officers, employees, consultants or advisors or the Company’s officers or employees, who we refer to as our non-employee directors, may receive cash and equity-based compensation for their services as directors.
Employment Agreements
The Company enters into various employment agreements, where necessary, in the standard course of its business operations.
Anticipated Officer and Director Remuneration
The Company intends to pay annual salaries to all of its employees and an annual stipend to its directors when, and if, it completes a primary public offering for the sale of securities (i.e. a public offering raising capital for the Company). At such time, the Company anticipates offering cash and non-cash compensation to other employees and directors. In addition, the Company may also offer additional benefits to employees in its sole and absolute discretion.
SECURITY OWNERSHIP OF CERTAIN BENEFICIAL OWNERS AND MANAGEMENT
The following table sets forth information as of the date of this prospectus regarding the beneficial ownership of the Company’s common stock by each of the Company’s executive officers and directors, individually and as a group and by each person who beneficially owns in excess of five percent of the common stock after giving effect to any exercise of warrants or options held by that person.
| Percent of Class | ||||||||||||||
| Percent of | After | |||||||||||||
| Number of Shares of | Class Before | Offering | ||||||||||||
| Name | Position | Common Stock | Offering (1) | (2) | ||||||||||
| Xiaobin Wu | President, CEO, CFO and Director | 53,218,000 | (3) | 50 | % | * | ||||||||
| Total owned by officers and directors (1) | 53,218,000 | 50 | % | * | ||||||||||
* Less than 1%
(1) Based upon 105,954,309 shares outstanding as of the date of this offering.
(2) Assumes sale of all shares offered, and 135,954,309 shares outstanding following the offering.
(3) Includes 62,000,000 pre-split shares held by Marvel and 50,000,000 pre-split shares held by Fuda UK. As the sole officer and director of the Company, Mr. Wu may be deemed to be the beneficial owner of the shares held by such entities.
| 57 |
CERTAIN RELATIONSHIPS AND RELATED TRANSACTIONS
James Cassidy, a partner in the law firm which acts as counsel to the Company, is the sole owner and director of Tiber Creek Corporation which owns 102,500 shares of the Company's common stock. Tiber Creek has received consulting fees to date from the Company and also holds shares in the Company. Tiber Creek and its affiliate, MB Americus LLC, a California limited liability company, each currently hold 102,500 shares in the Company.
James Cassidy and James McKillop, who are the officers and owners of MB Americus, LLC, were both formerly officers and directors of the Company. As the organizers and developers of Spruce Valley Acquisition, Mr. Cassidy and Mr. McKillop were involved with the Company prior to the Acquisitions. In particular, Mr. Cassidy provided services to the Company without charge, including preparation and filing of the charter corporate documents and preparation of the registration statement for the Company.
Mr. Xiaobin Wu, the Company’s sole officer and director, is also a Managing Director of Liaoning Fuda, a subsidiary of Marvel. Mr. Wu is the Managing Director of Marvel from 2009. Mr. Wu is also the Managing Director of Dangdong Fuda Investment Co., Ltd. an entity which holds an interest in the Company.
This prospectus relates to the offer and sale of 135,954,309 shares (“Shares”) of common stock of the Company, as follows: (a) 30,000,000 Shares offered by the Company and (b) 105,954,309 Shares offered by the holders thereof (the “Selling Shareholder Shares”), who are deemed to be statutory underwriters.
Usual and customary or specifically negotiated brokerage fees or commissions may be paid by the selling shareholders in connection with sales of the common stock. The selling shareholders may from time to time offer their shares through underwriters, brokers-dealers, agents or other intermediaries. The distribution of the common stock by the selling shareholders may be effected in one or more transactions that may take place through customary brokerage channels, in privately negotiated sales; by a combination of these methods; or by other means.
The following table sets forth ownership of shares held by each person who is a selling shareholder.
| Shares Owned Before Offering (1) | Offered Herein | Shares Owned After Offering (2) | ||||||||||||||||||
| Name | Number | Percentage | Number | Number | Percentage | |||||||||||||||
| XIAOBIN WU PRESIDENT, CEO, CFO AND DIRECTOR | 53,218,000 | (3) | 50 | % | 53,218,000 | 0 | * | |||||||||||||
| WU LINA | 5,248,000 | 4.9 | % | 5,248,000 | 0 | * | ||||||||||||||
| LEE WEI | 5,207,000 | 4.9 | % | 5,207,000 | 0 | * | ||||||||||||||
| DANDONG HAO HAN MINING CO. | 5,166,000 | 4.9 | % | 5,166,000 | 0 | * | ||||||||||||||
| SUN LIHUA | 5,125,000 | 4.8 | % | 5,125,000 | 0 | * | ||||||||||||||
| 1503 VENTURE CAPITAL | 5,125,000 | 4.8 | % | 5,125,000 | 0 | * | ||||||||||||||
| GOH SIONG CHOO | 5,022,500 | 4.7 | % | 5,022,500 | 0 | * | ||||||||||||||
| LEE YUE HANG | 5,022,500 | 4.7 | % | 5,022,500 | 0 | * | ||||||||||||||
| FZ ECOMMERCE & BUSINESS DIRECT | 4,920,000 | 4.6 | % | 4,920,000 | 0 | * | ||||||||||||||
| 58 |
| YU HUI ZHEN | 4,592,000 | 4.3 | % | 4,592,000 | 0 | * | ||||||||||||||
| WINNER INTERNATIONAL INDUSTRIES | 4,428,000 | 4.2 | % | 4,428,000 | 0 | * | ||||||||||||||
| WU YUE | 1,681,000 | 1.6 | % | 1,681,000 | 0 | * | ||||||||||||||
| WU ZHONG CHEN | 410,000 | * | 410,000 | 0 | * | |||||||||||||||
| JAMES M. CASSIDY (4) | 102,500 | * | 102,500 | 0 | * | |||||||||||||||
| JAMES K. MCKILLOP (5) | 102,500 | * | 102,500 | 0 | * | |||||||||||||||
| WU XIAO SHUAI | 82,000 | * | 82,000 | 0 | * | |||||||||||||||
| HE YAN PENG | 82,000 | * | 82,000 | 0 | * | |||||||||||||||
| SHI GUO ZHENG | 82,000 | * | 82,000 | 0 | * | |||||||||||||||
| HAO GANG | 41,000 | * | 41,000 | 0 | * | |||||||||||||||
| HAO GANG | 41,000 | * | 41,000 | 0 | * | |||||||||||||||
| LI XIAO LIN | 41,000 | * | 41,000 | 0 | * | |||||||||||||||
| YANG YUAN XI | 20,500 | * | 20,500 | 0 | * | |||||||||||||||
| SUN TAO | 13,667 | * | 13,667 | 0 | * | |||||||||||||||
| YANG YUAN HONG | 13,120 | * | 13,120 | 0 | * | |||||||||||||||
| LI SHOU MIN | 13,120 | * | 13,120 | 0 | * | |||||||||||||||
| SUN SUMMER JIE | 9,922 | * | 9,922 | 0 | * | |||||||||||||||
| ZHANG LEI | 8,200 | * | 8,200 | 0 | * | |||||||||||||||
| SUN YU SHENG | 8,200 | * | 8,200 | 0 | * | |||||||||||||||
| GAO SHIJUN | 8,200 | * | 8,200 | 0 | * | |||||||||||||||
| MA HAI BIN | 8,200 | * | 8,200 | 0 | * | |||||||||||||||
| JIANG MAO XIANG | 8,200 | * | 8,200 | 0 | * | |||||||||||||||
| WU XIAO DAN | 8,200 | * | 8,200 | 0 | * | |||||||||||||||
| WU XIAO DAN | 4,920 | * | 4,920 | 0 | * | |||||||||||||||
| GUO LIANG QIN | 4,100 | * | 4,100 | 0 | * | |||||||||||||||
| GUO LIANG QIN | 4,100 | * | 4,100 | 0 | * | |||||||||||||||
| TAN LIN | 4,100 | * | 4,100 | 0 | * | |||||||||||||||
| LU GUI HUA | 4,100 | * | 4,100 | 0 | * | |||||||||||||||
| ZHANG CHUN HONG | 4,100 | * | 4,100 | 0 | * |
| 59 |
| SUN SU LING | 4,100 | * | 4,100 | 0 | * | |||||||||||||||
| GUO CHUN YAN | 4,100 | * | 4,100 | 0 | * | |||||||||||||||
| DING LI PING | 4,100 | * | 4,100 | 0 | * | |||||||||||||||
| WANG PENG | 2,050 | * | 2,050 | 0 | * | |||||||||||||||
| JIANG ZHAO ZHOU | 2,050 | * | 2,050 | 0 | * | |||||||||||||||
| JIN CHUNFAN | 2,050 | * | 2,050 | 0 | * | |||||||||||||||
| SUN GUANG ZHOU | 2,050 | * | 2,050 | 0 | * | |||||||||||||||
| SANGARI, MIHIR J. | 2,050 | * | 2,050 | 0 | * | |||||||||||||||
| GUO BIN | 2,050 | * | 2,050 | 0 | * | |||||||||||||||
| DU JIANG | 1,230 | * | 1,230 | 0 | * | |||||||||||||||
| LU DE FU | 1,230 | * | 1,230 | 0 | * | |||||||||||||||
| GUO LEI | 820 | * | 820 | 0 | * | |||||||||||||||
| LI JING | 820 | * | 820 | 0 | * | |||||||||||||||
| CHU SONG NAN | 820 | * | 820 | 0 | * | |||||||||||||||
| KONG FAN SHEN | 820 | * | 820 | 0 | * | |||||||||||||||
| WANG ZHAO KUN | 820 | * | 820 | 0 | * | |||||||||||||||
| FU GUO DONG | 820 | * | 820 | 0 | * | |||||||||||||||
| WANG YUAN CHEN | 820 | * | 820 | 0 | * | |||||||||||||||
| LI LIAN YONG | 410 | * | 410 | 0 | * | |||||||||||||||
| DONG XIN | 410 | * | 410 | 0 | * | |||||||||||||||
| LI SHU JING | 410 | * | 410 | 0 | * | |||||||||||||||
| DONG XIN | 410 | * | 410 | 0 | * | |||||||||||||||
| LIU DE JING | 410 | * | 410 | 0 | * | |||||||||||||||
| YANG CUIJIN | 410 | * | 410 | 0 | * | |||||||||||||||
| LAN YU XIU | 100 | * | 100 | 0 | * | |||||||||||||||
| LIN YING HONG | 100 | * | 100 | 0 | * | |||||||||||||||
| WANG CHUN GANG | 100 | * | 100 | 0 | * | |||||||||||||||
| GUAN NAN NAN | 100 | * | 100 | 0 | * | |||||||||||||||
| CHANG NA | 100 | * | 100 | 0 | * |
| 60 |
| LI JUAN | 100 | * | 100 | 0 | * | |||||||||||||||
| WANG CHUN JIU | 100 | * | 100 | 0 | * | |||||||||||||||
| WANG JIA | 100 | * | 100 | 0 | * | |||||||||||||||
| ZHANG WEI | 100 | * | 100 | 0 | * | |||||||||||||||
| ZHAO QIU LING | 100 | * | 100 | 0 | * | |||||||||||||||
| WU XIAO QI | 100 | * | 100 | 0 | * | |||||||||||||||
| YU SHENG | 100 | * | 100 | 0 | * | |||||||||||||||
| XIANG DE HUI | 100 | * | 100 | 0 | * | |||||||||||||||
| YU CHONG JIANG | 100 | * | 100 | 0 | * | |||||||||||||||
| YU CHANG JIANG | 100 | * | 100 | 0 | * | |||||||||||||||
| JIA GUI MING | 100 | * | 100 | 0 | * | |||||||||||||||
| WANG MING WEI | 100 | * | 100 | 0 | * | |||||||||||||||
| JI WEN MING | 100 | * | 100 | 0 | * | |||||||||||||||
| GAO CHENG YI | 100 | * | 100 | 0 | * | |||||||||||||||
| WANG YONG QUAN | 100 | * | 100 | 0 | * | |||||||||||||||
| JIANG DIAN GUO | 100 | * | 100 | 0 | * | |||||||||||||||
| SUN YONG LIN | 100 | * | 100 | 0 | * | |||||||||||||||
| LIN JUN LE | 100 | * | 100 | 0 | * | |||||||||||||||
| WANG CHANG FA | 100 | * | 100 | 0 | * | |||||||||||||||
| WANG CHANG YU | 100 | * | 100 | 0 | * | |||||||||||||||
| CHEN FU GUO | 100 | * | 100 | 0 | * | |||||||||||||||
| PAN GUI LIN | 100 | * | 100 | 0 | * | |||||||||||||||
| LI FU KUAN | 100 | * | 100 | 0 | * | |||||||||||||||
| ZHANG JUN | 100 | * | 100 | 0 | * | |||||||||||||||
| LV LIN | 100 | * | 100 | 0 | * | |||||||||||||||
| BIAN XU | 100 | * | 100 | 0 | * | |||||||||||||||
| YU SHAO LIN | 100 | * | 100 | 0 | * | |||||||||||||||
| DON CHANG JIANG | 100 | * | 100 | 0 | * | |||||||||||||||
| QU QING YOU | 100 | * | 100 | 0 | * | |||||||||||||||
| LIANG ZHONG BIN | 100 | * | 100 | 0 | * |
| 61 |
| HUANG JIN SONG | 100 | * | 100 | 0 | * | |||||||||||||||
| YAN SHU TIAN | 100 | * | 100 | 0 | * | |||||||||||||||
| SONG SHUN TAO | 100 | * | 100 | 0 | * | |||||||||||||||
| LV SHENG DI | 100 | * | 100 | 0 | * | |||||||||||||||
| WANG XIAO PENG | 100 | * | 100 | 0 | * | |||||||||||||||
| DENG JI JUN | 100 | * | 100 | 0 | * | |||||||||||||||
| WAN LI LI | 100 | * | 100 | 0 | * | |||||||||||||||
| WANG YUAN PING | 100 | * | 100 | 0 | * | |||||||||||||||
| JIANG MING RUN | 100 | * | 100 | 0 | * | |||||||||||||||
| JIANG HONG E | 100 | * | 100 | 0 | * | |||||||||||||||
| LIN LU JIANG | 100 | * | 100 | 0 | * | |||||||||||||||
| REN PEI YONG | 100 | * | 100 | 0 | * | |||||||||||||||
| WANG KAI LEI | 100 | * | 100 | 0 | * | |||||||||||||||
| LIN GUO HUA | 100 | * | 100 | 0 | * | |||||||||||||||
| CHEN AI GUO | 100 | * | 100 | 0 | * | |||||||||||||||
| CHEN YI TIAN | 100 | * | 100 | 0 | * | |||||||||||||||
| XU BING DING | 100 | * | 100 | 0 | * | |||||||||||||||
| ZHONG XIN PIN | 100 | * | 100 | 0 | * | |||||||||||||||
| KONG BING HUA | 100 | * | 100 | 0 | * | |||||||||||||||
| GAO LUN | 100 | * | 100 | 0 | * | |||||||||||||||
| JIANG DIAN CHEN | 100 | * | 100 | 0 | * | |||||||||||||||
| TANG FENG BO | 100 | * | 100 | 0 | * | |||||||||||||||
| WANG ZHI QI | 100 | * | 100 | 0 | * | |||||||||||||||
| TANG LONG ZHI | 100 | * | 100 | 0 | * | |||||||||||||||
| LONG FENG GANG | 100 | * | 100 | 0 | * | |||||||||||||||
| ZHANG LEI | 100 | * | 100 | 0 | * | |||||||||||||||
| TANG FENG ZHI | 100 | * | 100 | 0 | * | |||||||||||||||
| WANG YING KUI | 100 | * | 100 | 0 | * | |||||||||||||||
| TANG YI | 100 | * | 100 | 0 | * |
| 62 |
| REN XIAO PING | 100 | * | 100 | 0 | * | |||||||||||||||
| SUI LIAN DE | 100 | * | 100 | 0 | * | |||||||||||||||
| LI JIN YUE | 100 | * | 100 | 0 | * | |||||||||||||||
| JIANG HONG CHENG | 100 | * | 100 | 0 | * | |||||||||||||||
| ZHAO JIN LONG | 100 | * | 100 | 0 | * | |||||||||||||||
| GAO CHENG YANG | 100 | * | 100 | 0 | * | |||||||||||||||
| SUN CHENG MING | 100 | * | 100 | 0 | * | |||||||||||||||
| ZHAOU HONG GUANG | 100 | * | 100 | 0 | * | |||||||||||||||
| YU PENG FEI | 100 | * | 100 | 0 | * | |||||||||||||||
| LI LIANG | 100 | * | 100 | 0 | * | |||||||||||||||
| CONG PEI QUAN | 100 | * | 100 | 0 | * | |||||||||||||||
| JIANG YAN HU | 100 | * | 100 | 0 | * | |||||||||||||||
| LIANG XIN YUE | 100 | * | 100 | 0 | * | |||||||||||||||
| SUN TONG | 100 | * | 100 | 0 | * | |||||||||||||||
| XUE TIAN JIAO | 100 | * | 100 | 0 | * | |||||||||||||||
| YU JUAN | 100 | * | 100 | 0 | * | |||||||||||||||
| PENG SHI XIN | 100 | * | 100 | 0 | * | |||||||||||||||
| SHI HONG YAN | 100 | * | 100 | 0 | * | |||||||||||||||
| YANG LIU XIANG | 100 | * | 100 | 0 | * | |||||||||||||||
| WANG JIA JIA | 100 | * | 100 | 0 | * | |||||||||||||||
| ZHANG YI TAO | 100 | * | 100 | 0 | * | |||||||||||||||
| ZHANG DIAN JUN | 100 | * | 100 | 0 | * | |||||||||||||||
| YANG GUI YAN | 100 | * | 100 | 0 | * | |||||||||||||||
| WU HUI XIN | 100 | * | 100 | 0 | * | |||||||||||||||
| WANG HONG XI | 100 | * | 100 | 0 | * | |||||||||||||||
| SUI YONG GUI | 100 | * | 100 | 0 | * | |||||||||||||||
| LIU XIU MING | 100 | * | 100 | 0 | * | |||||||||||||||
| WANG CHU | 100 | * | 100 | 0 | * | |||||||||||||||
| LI YONG | 100 | * | 100 | 0 | * | |||||||||||||||
| JIANG JIA LONG | 100 | * | 100 | 0 | * |
| 63 |
| HUANG BAO LONG | 100 | * | 100 | 0 | * | |||||||||||||||
| XIE WEN CHAO | 100 | * | 100 | 0 | * | |||||||||||||||
| WANG HONG WEI | 100 | * | 100 | 0 | * | |||||||||||||||
| SHAN ZHI DONG | 100 | * | 100 | 0 | * | |||||||||||||||
| SONG YU MEI | 100 | * | 100 | 0 | * | |||||||||||||||
| FAN JUN TIAN | 100 | * | 100 | 0 | * | |||||||||||||||
| TIAN WEN BAO | 100 | * | 100 | 0 | * | |||||||||||||||
| SUN FU XIANG | 100 | * | 100 | 0 | * | |||||||||||||||
| TIAN TONG HE | 100 | * | 100 | 0 | * | |||||||||||||||
| ZHUANG ZHEN SHI | 100 | * | 100 | 0 | * | |||||||||||||||
| XIA LI JUN | 100 | * | 100 | 0 | * | |||||||||||||||
| LIN YING CHEN | 100 | * | 100 | 0 | * | |||||||||||||||
| XIA YU BAO | 100 | * | 100 | 0 | * | |||||||||||||||
| ZHANG DIAN PING | 100 | * | 100 | 0 | * | |||||||||||||||
| GUO FANG JIN | 100 | * | 100 | 0 | * | |||||||||||||||
| PAN GUI REN | 100 | * | 100 | 0 | * | |||||||||||||||
| SUN CHANG CHENG | 100 | * | 100 | 0 | * | |||||||||||||||
| LI CHENG XIN | 100 | * | 100 | 0 | * | |||||||||||||||
| LIU WEN HAI | 100 | * | 100 | 0 | * | |||||||||||||||
| LV SHI JUN | 100 | * | 100 | 0 | * | |||||||||||||||
| LIN ZHEN YUAN | 100 | * | 100 | 0 | * | |||||||||||||||
| HAN MAO LIN | 100 | * | 100 | 0 | * | |||||||||||||||
| AI YU XUAN | 100 | * | 100 | 0 | * | |||||||||||||||
| LIU KAI SHENG | 100 | * | 100 | 0 | * | |||||||||||||||
| HONG LONG FEI | 100 | * | 100 | 0 | * | |||||||||||||||
| MEI ZHI QIANG | 100 | * | 100 | 0 | * | |||||||||||||||
| ZHENG WEI | 100 | * | 100 | 0 | * | |||||||||||||||
| YANG HUI | 100 | * | 100 | 0 | * | |||||||||||||||
| YU XIAO MIN | 100 | * | 100 | 0 | * |
| 64 |
| WANG YU SHENG | 100 | * | 100 | 0 | * | |||||||||||||||
| GUO FENG LIANG | 100 | * | 100 | 0 | * | |||||||||||||||
| WANG ZHAO FU | 100 | * | 100 | 0 | * | |||||||||||||||
| SHEN MING HUA | 100 | * | 100 | 0 | * | |||||||||||||||
| ZENG LING MING | 100 | * | 100 | 0 | * | |||||||||||||||
| DU CHANG SHENG | 100 | * | 100 | 0 | * | |||||||||||||||
| DONG XIAN JIN | 100 | * | 100 | 0 | * | |||||||||||||||
| LIN DE FU | 100 | * | 100 | 0 | * | |||||||||||||||
| BAI DAN | 100 | * | 100 | 0 | * | |||||||||||||||
| ZHANG LIU JIN | 100 | * | 100 | 0 | * | |||||||||||||||
| AN SHOU YI | 100 | * | 100 | 0 | * | |||||||||||||||
| GU HONG ZHI | 100 | * | 100 | 0 | * | |||||||||||||||
| WANG GUO WEI | 100 | * | 100 | 0 | * | |||||||||||||||
| LIU WEN JUN | 100 | * | 100 | 0 | * | |||||||||||||||
| YUAN QING XIANG | 100 | * | 100 | 0 | * | |||||||||||||||
| ZHU JIN QIANG | 100 | * | 100 | 0 | * | |||||||||||||||
| LIU HONG | 100 | * | 100 | 0 | * | |||||||||||||||
| LIU XIAN DE | 100 | * | 100 | 0 | * | |||||||||||||||
| LU CHANG SHUN | 100 | * | 100 | 0 | * | |||||||||||||||
| TAO CHUAN DONG | 100 | * | 100 | 0 | * | |||||||||||||||
| YAO YONG PU | 100 | * | 100 | 0 | * | |||||||||||||||
| CHEN TAO | 100 | * | 100 | 0 | * | |||||||||||||||
| YANG JIAN | 100 | * | 100 | 0 | * | |||||||||||||||
| SHANG XIU SHENG | 100 | * | 100 | 0 | * | |||||||||||||||
| WANG SHU CHUN | 100 | * | 100 | 0 | * | |||||||||||||||
| ZHANG FA | 100 | * | 100 | 0 | * | |||||||||||||||
| GUO QIANG | 100 | * | 100 | 0 | * | |||||||||||||||
| YU HAO BIN | 100 | * | 100 | 0 | * | |||||||||||||||
| YANG YU LI | 100 | * | 100 | 0 | * | |||||||||||||||
| ZUO KE XIN | 100 | * | 100 | 0 | * |
| 65 |
| WANG PENG | 100 | * | 100 | 0 | * | |||||||||||||||
| GUO XIN | 100 | * | 100 | 0 | * | |||||||||||||||
| YU HAI BAO | 100 | * | 100 | 0 | * | |||||||||||||||
| HAO HOU LAI | 100 | * | 100 | 0 | * | |||||||||||||||
| PAN BIN BIN | 100 | * | 100 | 0 | * | |||||||||||||||
| GAO FEI | 100 | * | 100 | 0 | * | |||||||||||||||
| ZHOU ZHI QI | 100 | * | 100 | 0 | * | |||||||||||||||
| WU SHEN FEI | 100 | * | 100 | 0 | * | |||||||||||||||
| YAN PING | 100 | * | 100 | 0 | * | |||||||||||||||
| WANG XUE YU | 100 | * | 100 | 0 | * | |||||||||||||||
| XU WEI | 100 | * | 100 | 0 | * | |||||||||||||||
| GUAN SHAN LIANG | 100 | * | 100 | 0 | * | |||||||||||||||
| PAN YUN E | 100 | * | 100 | 0 | * | |||||||||||||||
| PAN BAI GUI | 100 | * | 100 | 0 | * | |||||||||||||||
| HAN DE HUI | 100 | * | 100 | 0 | * | |||||||||||||||
| OU CHUN LIN | 100 | * | 100 | 0 | * | |||||||||||||||
| XIAO XUE FU | 100 | * | 100 | 0 | * | |||||||||||||||
| ZHANG ZHONG LIANG | 100 | * | 100 | 0 | * | |||||||||||||||
| ZHANG YOU LIN | 100 | * | 100 | 0 | * | |||||||||||||||
| CHEN YAN JUN | 100 | * | 100 | 0 | * | |||||||||||||||
| MENG QING WEN | 100 | * | 100 | 0 | * | |||||||||||||||
| ZENG FAN TAO | 100 | * | 100 | 0 | * | |||||||||||||||
| YANG BAO KUI | 100 | * | 100 | 0 | * | |||||||||||||||
| YANG YUAN LONG | 100 | * | 100 | 0 | * | |||||||||||||||
| WANG YUAN LI | 100 | * | 100 | 0 | * | |||||||||||||||
| LV ZI LONG | 100 | * | 100 | 0 | * | |||||||||||||||
| CHANG YAN | 100 | * | 100 | 0 | * | |||||||||||||||
| BAI KAI JIN | 100 | * | 100 | 0 | * | |||||||||||||||
| ZHAO JIA LONG | 100 | * | 100 | 0 | * |
| 66 |
| MA XI HONG | 100 | * | 100 | 0 | * | |||||||||||||||
| ZHOU YONG JUN | 100 | * | 100 | 0 | * | |||||||||||||||
| BAO SU ZHEN | 100 | * | 100 | 0 | * | |||||||||||||||
| TIAN TAI HE | 100 | * | 100 | 0 | * | |||||||||||||||
| WANG CHUN XI | 100 | * | 100 | 0 | * | |||||||||||||||
| LIU JIN FA | 100 | * | 100 | 0 | * | |||||||||||||||
| WANG CHUN XUE | 100 | * | 100 | 0 | * | |||||||||||||||
| LIU QING DOU | 100 | * | 100 | 0 | * | |||||||||||||||
| WANG YU ZHONG | 100 | * | 100 | 0 | * | |||||||||||||||
| LIU DE BEN | 100 | * | 100 | 0 | * | |||||||||||||||
| ZHAO DE JUN | 100 | * | 100 | 0 | * | |||||||||||||||
| YAN XUE SHU | 100 | * | 100 | 0 | * | |||||||||||||||
| BAI JUN | 100 | * | 100 | 0 | * | |||||||||||||||
| CHEN YAN | 100 | * | 100 | 0 | * | |||||||||||||||
| PENG DE CAI | 100 | * | 100 | 0 | * | |||||||||||||||
| JIANG CHENG BO | 100 | * | 100 | 0 | * | |||||||||||||||
| ZHANG JI CHU | 100 | * | 100 | 0 | * | |||||||||||||||
| LIU DE LONG | 100 | * | 100 | 0 | * | |||||||||||||||
| HAN XING GUO | 100 | * | 100 | 0 | * | |||||||||||||||
| JIANG HAI JING | 100 | * | 100 | 0 | * | |||||||||||||||
| LEI XIN FENG | 100 | * | 100 | 0 | * | |||||||||||||||
| BAI DONG | 100 | * | 100 | 0 | * | |||||||||||||||
| BAI YANG | 100 | * | 100 | 0 | * | |||||||||||||||
| WANG DAN | 100 | * | 100 | 0 | * | |||||||||||||||
| REN XU CHENG | 100 | * | 100 | 0 | * | |||||||||||||||
| ZHANG JIN HUI | 100 | * | 100 | 0 | * | |||||||||||||||
| BAI XIANG DONG | 100 | * | 100 | 0 | * | |||||||||||||||
| LEI FU LIN | 100 | * | 100 | 0 | * | |||||||||||||||
| TANG WEN GUO | 100 | * | 100 | 0 | * | |||||||||||||||
| WANG SHU YU | 100 | * | 100 | 0 | * |
| 67 |
| SHI MIN HONG | 100 | * | 100 | 0 | * | |||||||||||||||
| GU KUI LONG | 100 | * | 100 | 0 | * | |||||||||||||||
| SONG SHANG FU | 100 | * | 100 | 0 | * | |||||||||||||||
| WANG JIE | 100 | * | 100 | 0 | * | |||||||||||||||
| SUN GUO PING | 100 | * | 100 | 0 | * | |||||||||||||||
| ZHANG XUE LIN | 100 | * | 100 | 0 | * | |||||||||||||||
| WANG SHU FENG | 100 | * | 100 | 0 | * | |||||||||||||||
| PANG SHAO BIN | 100 | * | 100 | 0 | * | |||||||||||||||
| GONG HUI TIAN | 100 | * | 100 | 0 | * | |||||||||||||||
| CAI YING HUA | 100 | * | 100 | 0 | * | |||||||||||||||
| WU QIN GANG | 100 | * | 100 | 0 | * | |||||||||||||||
| JIAO FANG YU | 100 | * | 100 | 0 | * | |||||||||||||||
| YOU TIAN JUN | 100 | * | 100 | 0 | * | |||||||||||||||
| ZHANG ZHEN GUO | 100 | * | 100 | 0 | * | |||||||||||||||
| YANG ZHONG YONG | 100 | * | 100 | 0 | * | |||||||||||||||
| SHI HUA QUAN | 100 | * | 100 | 0 | * | |||||||||||||||
| MAO YONG MEI | 100 | * | 100 | 0 | * | |||||||||||||||
| LI TAO | 100 | * | 100 | 0 | * | |||||||||||||||
| DING MING QIANG | 100 | * | 100 | 0 | * | |||||||||||||||
| YU XING LIANG | 100 | * | 100 | 0 | * | |||||||||||||||
| YU CHANG DE | 100 | * | 100 | 0 | * | |||||||||||||||
| CHEN ZONG NENG | 100 | * | 100 | 0 | * | |||||||||||||||
| CHEN GUANG WEI | 100 | * | 100 | 0 | * | |||||||||||||||
| YU LANG | 100 | * | 100 | 0 | * | |||||||||||||||
| ZHENG QI LONG | 100 | * | 100 | 0 | * | |||||||||||||||
| ZHENG JIE | 100 | * | 100 | 0 | * | |||||||||||||||
| DING FENG LI | 100 | * | 100 | 0 | * | |||||||||||||||
| XIANG MI | 100 | * | 100 | 0 | * | |||||||||||||||
| WANG YUAN SHAN | 100 | * | 100 | 0 | * |
| 68 |
| CHEN LIAN JIANG | 100 | * | 100 | 0 | * | |||||||||||||||
| XU DE JUAN | 100 | * | 100 | 0 | * | |||||||||||||||
| HUANG JIN HOU | 100 | * | 100 | 0 | * | |||||||||||||||
| HUANG ZHAN DONG | 100 | * | 100 | 0 | * | |||||||||||||||
| YU WEN TAO | 100 | * | 100 | 0 | * | |||||||||||||||
| YU XUE DONG | 100 | * | 100 | 0 | * | |||||||||||||||
| CHI YONG BO | 100 | * | 100 | 0 | * | |||||||||||||||
| LIN JUN LE | 100 | * | 100 | 0 | * | |||||||||||||||
| MA DIAN BAO | 100 | * | 100 | 0 | * | |||||||||||||||
| YANG SHU FU | 100 | * | 100 | 0 | * | |||||||||||||||
| WANG MING QUAN | 100 | * | 100 | 0 | * | |||||||||||||||
| HAN LI JUN | 100 | * | 100 | 0 | * | |||||||||||||||
| LIU ZHONG YONG | 100 | * | 100 | 0 | * | |||||||||||||||
| WANG HONG QUAN | 100 | * | 100 | 0 | * | |||||||||||||||
| LIU YANG HUI | 100 | * | 100 | 0 | * | |||||||||||||||
| LI CHENG FANG | 100 | * | 100 | 0 | * | |||||||||||||||
| LU FA YONG | 100 | * | 100 | 0 | * | |||||||||||||||
| ZHUO AN JI | 100 | * | 100 | 0 | * | |||||||||||||||
| LI WEI | 100 | * | 100 | 0 | * | |||||||||||||||
| LV WEN CUI | 100 | * | 100 | 0 | * | |||||||||||||||
| LIU SHU BI | 100 | * | 100 | 0 | * | |||||||||||||||
| WANG DE MEI | 100 | * | 100 | 0 | * | |||||||||||||||
| HUANG SHI MEI | 100 | * | 100 | 0 | * | |||||||||||||||
| DU FANG SHUN | 100 | * | 100 | 0 | * | |||||||||||||||
| SHEN QING HUO | 100 | * | 100 | 0 | * | |||||||||||||||
| CHEN CHUN ZHI | 100 | * | 100 | 0 | * | |||||||||||||||
| ZHONG HAN JIE | 100 | * | 100 | 0 | * | |||||||||||||||
| SHEN LI QING | 100 | * | 100 | 0 | * | |||||||||||||||
| SHEN ZAI GUI | 100 | * | 100 | 0 | * | |||||||||||||||
| LIN JIN DENG | 100 | * | 100 | 0 | * |
| 69 |
| LIN LIAN CHENG | 100 | * | 100 | 0 | * | |||||||||||||||
| ZHONG SHI CHANG | 100 | * | 100 | 0 | * | |||||||||||||||
| LIN LI QIONG | 100 | * | 100 | 0 | * | |||||||||||||||
| WANG QUN | 100 | * | 100 | 0 | * | |||||||||||||||
| WANG YU AN | 100 | * | 100 | 0 | * | |||||||||||||||
| LUO XIAN CAI | 100 | * | 100 | 0 | * | |||||||||||||||
| LUO XIAN YI | 100 | * | 100 | 0 | * | |||||||||||||||
| LAN LIU XIANG | 100 | * | 100 | 0 | * | |||||||||||||||
| ZHOU XUE JUN | 100 | * | 100 | 0 | * | |||||||||||||||
| LIU YAN QUAN | 100 | * | 100 | 0 | * | |||||||||||||||
| LIN QI YONG | 100 | * | 100 | 0 | * | |||||||||||||||
| ZHENG YUAN TOU | 100 | * | 100 | 0 | * | |||||||||||||||
| WANG YUAN QUAN | 100 | * | 100 | 0 | * | |||||||||||||||
| WANG YUAN LIANG | 100 | * | 100 | 0 | * | |||||||||||||||
| LI GANG | 100 | * | 100 | 0 | * | |||||||||||||||
| QI TEN JUN | 100 | * | 100 | 0 | * | |||||||||||||||
| LIU YAO PING | 100 | * | 100 | 0 | * | |||||||||||||||
| SHANG SHU ZHEN | 100 | * | 100 | 0 | * | |||||||||||||||
| ZHANG WEI | 100 | * | 100 | 0 | * | |||||||||||||||
| ZHAO XIN | 100 | * | 100 | 0 | * | |||||||||||||||
| HU SHU JUAN | 100 | * | 100 | 0 | * | |||||||||||||||
| YU YANG | 100 | * | 100 | 0 | * | |||||||||||||||
| FAN GUANG CAI | 100 | * | 100 | 0 | * | |||||||||||||||
| LI XIANG | 100 | * | 100 | 0 | * | |||||||||||||||
| YIN JUN TING | 100 | * | 100 | 0 | * | |||||||||||||||
| ZHAO YING | 100 | * | 100 | 0 | * | |||||||||||||||
| ZHAO SHU ZHI | 100 | * | 100 | 0 | * | |||||||||||||||
| ZHANG WEI | 100 | * | 100 | 0 | * | |||||||||||||||
| QIU FANG LEI | 100 | * | 100 | 0 | * |
| 70 |
| JIANG LING | 100 | * | 100 | 0 | * | |||||||||||||||
| WANG SI HAN | 100 | * | 100 | 0 | * | |||||||||||||||
| REN QIU YING | 100 | * | 100 | 0 | * | |||||||||||||||
| WANG YANG | 100 | * | 100 | 0 | * | |||||||||||||||
| JIANG DIAN YI | 100 | * | 100 | 0 | * | |||||||||||||||
| MA WEN FANG | 100 | * | 100 | 0 | * | |||||||||||||||
| SONG SHI CHENG | 100 | * | 100 | 0 | * | |||||||||||||||
| WU MEI SHENG | 100 | * | 100 | 0 | * | |||||||||||||||
| LU YAO | 100 | * | 100 | 0 | * | |||||||||||||||
| ZHANG JIN TAO | 100 | * | 100 | 0 | * | |||||||||||||||
| SUN JIA JIAN | 100 | * | 100 | 0 | * | |||||||||||||||
| LIANG YU | 100 | * | 100 | 0 | * | |||||||||||||||
| XIANG WAN FA | 100 | * | 100 | 0 | * | |||||||||||||||
| XU DE HENG | 100 | * | 100 | 0 | * | |||||||||||||||
| HAO LI XUE | 100 | * | 100 | 0 | * | |||||||||||||||
| ZHA TIAN FU | 100 | * | 100 | 0 | * | |||||||||||||||
| LIN JIN YANG | 100 | * | 100 | 0 | * | |||||||||||||||
| ZHENG YING QING | 100 | * | 100 | 0 | * | |||||||||||||||
| CHEN CONG HAI | 100 | * | 100 | 0 | * | |||||||||||||||
| LIN AI MING | 100 | * | 100 | 0 | * | |||||||||||||||
| DING YA ZHEN | 100 | * | 100 | 0 | * | |||||||||||||||
| ZHOU ZHENG QING | 100 | * | 100 | 0 | * | |||||||||||||||
| ZHA GUAN FENG | 100 | * | 100 | 0 | * | |||||||||||||||
| ZHENG JIN SHOU | 100 | * | 100 | 0 | * | |||||||||||||||
| LV WEI WEN | 100 | * | 100 | 0 | * | |||||||||||||||
| WU YAO HONG | 100 | * | 100 | 0 | * | |||||||||||||||
| XU ZHONG LIANG | 100 | * | 100 | 0 | * | |||||||||||||||
| DING XIANG GENG | 100 | * | 100 | 0 | * | |||||||||||||||
| HONG LI BAO | 100 | * | 100 | 0 | * | |||||||||||||||
| DONG YUE | 100 | * | 100 | 0 | * |
| 71 |
| SU XIAO GANG | 100 | * | 100 | 0 | * | |||||||||||||||
| LIU JUN DE | 100 | * | 100 | 0 | * | |||||||||||||||
| BAI JIAN | 100 | * | 100 | 0 | * | |||||||||||||||
| WEI LAN XIANG | 100 | * | 100 | 0 | * | |||||||||||||||
| YANG JIAN PING | 100 | * | 100 | 0 | * | |||||||||||||||
| WAN DAI CHUN | 100 | * | 100 | 0 | * | |||||||||||||||
| MA WEN TIAN | 100 | * | 100 | 0 | * | |||||||||||||||
| GUO HAI JIANG | 100 | * | 100 | 0 | * | |||||||||||||||
| ZENG JIA JUN | 100 | * | 100 | 0 | * | |||||||||||||||
| WANG YU KANG | 100 | * | 100 | 0 | * | |||||||||||||||
| LENG XIAN JIA | 100 | * | 100 | 0 | * | |||||||||||||||
| LI YONG CHENG | 100 | * | 100 | 0 | * | |||||||||||||||
| WANG YANG | 100 | * | 100 | 0 | * | |||||||||||||||
| CHEN ZHAO BING | 100 | * | 100 | 0 | * | |||||||||||||||
| DONG ZI JUN | 100 | * | 100 | 0 | * | |||||||||||||||
| DING ZI HU | 100 | * | 100 | 0 | * | |||||||||||||||
| LIU DE SHAN | 100 | * | 100 | 0 | * | |||||||||||||||
| XU JIN LIANG | 100 | * | 100 | 0 | * | |||||||||||||||
| GE HONG SAN | 100 | * | 100 | 0 | * | |||||||||||||||
| GE HONG GUO | 100 | * | 100 | 0 | * | |||||||||||||||
| LUO YU LIN | 100 | * | 100 | 0 | * |
* Less than 1%
(1) Based upon 105,954,309 shares outstanding as of the date of this offering.
(2) Assumes sale of all shares offered, and 135,954,309 shares outstanding following the offering.
(3) Includes 62,000,000 pre-split shares held by Marvel and 50,000,000 pre-split shares held by Fuda UK. As the sole officer and director of the Company, Mr. Wu may be deemed to be the beneficial owner of the shares held by such entities.
(4) Includes 102,500 shares held by Tiber Creek, which provided certain services to the Company as discussed herein. Mr. Cassidy is the president, a director and the sole shareholder of Tiber Creek Corporation, and thus may be deemed the beneficial owner of the shares held by Tiber Creek.
(5) Includes 102,500 shares held by MB Americus, which worked with Tiber Creek to provide services to the Company. Mr. McKillop is the sole principal and owner of MB Americus, and thus may be deemed the beneficial owner or the shares held by MB Americus.
| 72 |
SHARES ELIGIBLE FOR FUTURE SALE
As of the date of this prospectus, there are 105,954,309 shares of common stock outstanding of which 53,218,000 shares are owned (in the aggregate) by officers, directors and 5% shareholders of the Company.
The shares of common stock held by current shareholders are considered “restricted securities” subject to the limitations of Rule 144 under the Securities Act. In general, securities may be sold pursuant to Rule 144 after being fully-paid and held for more than 12 months. While affiliates of the Company are subject to certain limits in the amount of restricted securities they can sell under Rule 144, there are no such limitations on sales by persons who are not affiliates of the Company. In the event non-affiliated holders elect to sell such shares in the public market, there is likely to be a negative effect on the market price of the Company's securities.
Cassidy & Associates, Beverly Hills, California, has given its opinion as attorneys-at-law regarding the validity of the issuance of the Shares offered by the Company. A member of the law firm of Cassidy & Associates is an officer and director of Tiber Creek and may be considered the beneficial owner of the 102,500 shares of common stock of the Company owned by Tiber Creek.
BF Borgers CPA, PC, an independent registered public accounting firm, has audited the balance sheets of Liaoning Fuda Mining CO LTD as of December 31, 2014 and December 31, 2013, and the related statements of operations, changes in stockholders’ equity (deficit), and cash flows for the years ended December 31, 2014 and December 31, 2013, respectively. The Company has included such financial statements in reliance on the report of September 30, 2015, given their authority as experts in accounting and auditing.
Anton & Chia, LLP, an independent registered public accounting firm, has audited Fuda Group (USA) Corporation’s (a development stage company) balance sheet as of December 31, 2014, and the related statements of operations, stockholders’ equity and cash flows for the period from September 25, 2014 (inception) to December 31, 2014. The Company has included such financial statements in the prospectus and elsewhere in the registration statement in reliance on the report of April 2, 2015, given their authority as experts in accounting and auditing.
DISCLOSURE OF COMMISSION POSITION ON INDEMNIFICATION
FOR SECURITIES ACT LIABILITIES
The Company’s certificate of incorporation include an indemnification provision that provides that the Company shall indemnify directors against monetary damages to the Company or any of its shareholders by reason of a breach of the director’s fiduciary except (i) for any breach of the director’s duty of loyalty to the Company or its shareholders, (ii) for acts or omissions not in good faith or which involve intentional misconduct or a knowing violation of law, (iii) for certain unlawful payments of dividends or unlawful stock purchases or redemptions, or (iv) for any transaction for which the director derived an improper personal benefit.
The certificate of incorporation does not specifically indemnify the officers or directors or controlling persons against liability under the Securities Act.
The Securities and Exchange Commission’s position on indemnification of officers, directors and control persons under the Securities Act by the Company is as follows:
INSOFAR AS INDEMNIFICATION FOR LIABILITIES ARISING UNDER THE SECURITIES ACT OF 1933 MAY BE PERMITTED TO DIRECTORS, OFFICERS AND CONTROLLING PERSONS OF THE SMALL BUSINESS ISSUER PURSUANT TO THE RULES OF THE COMMISSION, OR OTHERWISE, THE SMALL BUSINESS ISSUER HAS BEEN ADVISED THAT IN THE OPINION OF THE SECURITIES AND EXCHANGE COMMISSION SUCH INDEMNIFICATION IS AGAINST PUBLIC POLICY AS EXPRESSED IN THE ACT AND IS, THEREFORE, UNENFORCEABLE.
| 73 |
REPORT OF INDEPENDENT REGISTERED PUBLIC ACCOUNTING FIRM
To the Board of Directors and Stockholders of Liaoning Fuda Mining Co. Ltd.:
We have audited the accompanying balance sheets of Liaoning Fuda Mining Co. Ltd. (“the Company”) as of December 31, 2014 and 2013 and the related statements of operations, stockholders’ equity (deficit) and cash flows for the years then ended. These financial statements are the responsibility of the Company's management. Our responsibility is to express an opinion on these financial statements based on our audit.
We conducted our audits in accordance with standards of the Public Company Accounting Oversight Board (United States). Those standards require that we plan and perform the audits to obtain reasonable assurance about whether the financial statements are free of material misstatement. An audit includes examining, on a test basis, evidence supporting the amounts and disclosures in the financial statements, assessing the accounting principles used and significant estimates made by management, as well as evaluating the overall financial statement presentation. We believe that our audits provide a reasonable basis for our opinions.
In our opinion, the financial statement referred to above present fairly, in all material respects, the financial position of Liaoning Fuda Mining Co. Ltd., as of December 31, 2014 and 2013, and the results of its operations and its cash flows for the years then ended, in conformity with generally accepted accounting principles in the United States of America.
The company is not required to have, nor were we engaged to perform, an audit of its internal control over financial reporting. Our audits included consideration of internal control over financial reporting as a basis for designing audit procedures that are appropriate in the circumstances, but not for the purpose of expressing an opinion on the Company's internal control over financial reporting. Accordingly, we express no such opinion.
/s/ B F Borgers CPA PC
B F Borgers CPA PC
Lakewood, CO
September 30, 2015
| 74 |
LIAONING FUDA MINING CO. LTD.
BALANCE SHEETS
(Audited)
| December 31, | December 31, | |||||||
| 2014 | 2013 | |||||||
| Assets | ||||||||
| Current Assets | ||||||||
| Cash and cash equivalents | $ | 466 | $ | 3,112,528 | ||||
| Accounts receivable, net | 260,624 | 1,348,861 | ||||||
| Inventory | 3,843 | 5,679,351 | ||||||
| Prepaid rent | 65,058 | 176,859 | ||||||
| Other receivables | 436,014 | 338,764 | ||||||
| Security deposits to suppliers | 1,985,178 | 4,763,370 | ||||||
| Total Current Assets | 2,751,183 | 15,419,733 | ||||||
| Land, property and equipment, net | 52,286,087 | 20,878,256 | ||||||
| Total Assets | 55,037,270 | 36,297,989 | ||||||
| Liabilities | ||||||||
| Current Liabilities | ||||||||
| Accounts payable and accrued expenses | 8,420,643 | 14,439,125 | ||||||
| Taxes payable | 224 | - | ||||||
| Due to related parties | 1,548 | 22,915 | ||||||
| Other payables | 11,472 | 8 | ||||||
| Trade financing loans | 1,893,264 | 4,028,054 | ||||||
| Total Current Liabilities | 10,327,151 | 18,490,102 | ||||||
| Total Liabilities | 10,327,151 | 18,490,102 | ||||||
| Commitments & Contingencies | - | - | ||||||
| Equity | ||||||||
| Registered capital | 9,554,670 | 9,595,347 | ||||||
| Retained earnings | 34,934,737 | 7,918,569 | ||||||
| Accumulated other comprehensive income | 220,712 | 293,971 | ||||||
| Total Equity | 44,710,119 | 17,807,887 | ||||||
| Total Liabilities and Equity | $ | 55,037,270 | $ | 36,297,989 | ||||
See accompanying notes to financial statements
| 75 |
LIAONING FUDA MINING CO. LTD.
STATEMENTS OF OPERATIONS AND COMPREHENSIVE INCOME/ (LOSS)
(Audited)
| For the Years Ended | ||||||||
| December 31, | December 31, | |||||||
| 2014 | 2013 | |||||||
| Revenues | $ | 42,518,470 | $ | 58,584,590 | ||||
| Cost of sales | 14,270,331 | 33,414,952 | ||||||
| Gross margin | 28,248,139 | 25,169,638 | ||||||
| Operating expenses | ||||||||
| Selling, general & administrative expenses | 1,229,338 | 11,831,170 | ||||||
| Total operating expenses | 1,229,338 | 11,831,170 | ||||||
| Income from operations | 27,018,801 | 13,338,468 | ||||||
| Other income (expenses) | ||||||||
| Interest income | 152 | 263 | ||||||
| Interest expense | (346,262 | ) | (5,377,570 | ) | ||||
| Government rebate | 343,477 | - | ||||||
| Total other expenses | (2,633 | ) | (5,377,307 | ) | ||||
| Net income before income taxes | 27,016,168 | 7,961,161 | ||||||
| Income tax | - | - | ||||||
| Net income | $ | 27,016,168 | $ | 7,961,161 | ||||
| Foreign currency translation adjustment | (73,259 | ) | 285,207 | |||||
| Comprehensive income | $ | 26,942,909 | $ | 8,246,368 | ||||
See accompanying notes to financial statements
| 76 |
LIAONING FUDA MINING CO. LTD.
STATEMENTS OF CASH FLOWS
(Audited)
| For the Years Ended | ||||||||
| December 31, | December 31, | |||||||
| 2014 | 2013 | |||||||
| Cash flows from operating activities | ||||||||
| Net income | $ | 27,016,168 | $ | 7,961,161 | ||||
| Adjustment to reconcile net loss from operations: | ||||||||
| Bad debt expense | 15,130 | 1,887,886 | ||||||
| Depreciation expense | 4,199 | 1,623 | ||||||
| Changes in Operating Assets and Liabilities | ||||||||
| Accounts receivable | 1,055,131 | (3,218,466 | ) | |||||
| Inventory | 5,598,542 | (5,602,380 | ) | |||||
| Prepaid rent | 109,480 | (103,788 | ) | |||||
| Other receivables | (101,328 | ) | (334,173 | ) | ||||
| Security deposits to suppliers | 2,715,958 | (88,221 | ) | |||||
| Accounts payable and accrued expenses | (5,832,650 | ) | 10,116,356 | |||||
| Taxes payable | 224 | - | ||||||
| Other payables | 11,451 | 8 | ||||||
| Net cash provided by operating activities | 30,592,305 | 10,620,006 | ||||||
| Cash flows from financing activities | ||||||||
| Capital contribution from owners | - | 4,843,139 | ||||||
| Capital distribution to owners | (40,677 | ) | - | |||||
| Proceeds/(Repayment) to related party, net | (21,059 | ) | (664,251 | ) | ||||
| Proceeds/(Repayments) from trade financing loans, net | (2,082,415 | ) | 3,973,463 | |||||
| Net cash provided by (used in) financing activities | (2,144,151 | ) | 8,152,351 | |||||
| Cash flows from investing activities | ||||||||
| Purchase of land, property and equipment | (31,633,774 | ) | (15,757,961 | ) | ||||
| Net cash used in investing activities | (31,633,774 | ) | (15,757,961 | ) | ||||
| Effect of exchange rate changes | 73,558 | 94,800 | ||||||
| Net increase (decrease) in cash and cash equivalents | (3,112,062 | ) | 3,109,196 | |||||
| Cash and cash equivalents at beginning of period | 3,112,528 | 3,332 | ||||||
| Cash and cash equivalents at end of period | $ | 466 | $ | 3,112,528 | ||||
| Supplemental disclosures of cash flow information | ||||||||
| Interest paid | $ | 346,262 | $ | 5,377,570 | ||||
| Income taxes paid | $ | - | $ | - | ||||
See accompanying notes to financial statements
| 77 |
LIAONING FUDA MINING CO. LTD.
STATEMENTS OF STOCKHOLDERS' EQUITY
For the Years Ended December 31, 2014 and 2013
(Audited)
| Accumulated | ||||||||||||||||
| Other | Total | |||||||||||||||
| Registered | Retained | Comprehensive | Owners' | |||||||||||||
| Capital | Earnings/(Loss) | Income/(Loss) | Equity | |||||||||||||
| Balance, December 31, 2012 | 4,752,208 | (42,592 | ) | 8,764 | 4,718,380 | |||||||||||
| Capital contribution from owners | 4,843,139 | 4,843,139 | ||||||||||||||
| Net income for the period | 7,961,161 | 7,961,161 | ||||||||||||||
| Cumulative translation adjustment | 285,207 | 285,207 | ||||||||||||||
| Balance, December 31, 2013 | 9,595,347 | 7,918,569 | 293,971 | 17,807,887 | ||||||||||||
| Capital distribution to owners | (40,677 | ) | (40,677 | ) | ||||||||||||
| Net income for the period | 27,016,168 | 27,016,168 | ||||||||||||||
| Cumulative translation adjustment | (73,259 | ) | (73,259 | ) | ||||||||||||
| Balance, December 31, 2014 | 9,554,670 | 34,934,737 | 220,712 | 44,710,119 | ||||||||||||
See accompanying notes to financial statements
| 78 |
| 1. | ORGANIZATION AND DESCRIPTION OF BUSINESS |
Liaoning Fuda Mining Co., Ltd (the “Company”) was established in August 2012 in Dandong City, Liaoning Province, China with authorized capital of 60 million shares at 1 Chinese Yuan per share. The Company is a natural resource trading company that consists of raw blocks, stone carvings, slabs, pavers and wall claddings.
| 2. | SUMMARY OF SIGNIFICANT ACCOUNTING POLICIES |
Basis of Presentation
The accompanying audited financial statements and related notes have been prepared in accordance with generally accepted accounting principles in the United States of America (“US GAAP”). This basis of accounting involves the application of accrual accounting and consequently, revenues and gains are recognized when earned, and expenses and losses are recognized when incurred. The Company’s financial statements are expressed in U.S. dollars.
Use of Estimates
The preparation of financial statements in conformity with US GAAP requires management to make estimates and assumptions that affect the reported amounts of assets and liabilities and disclosure of contingent assets and liabilities at the date of the consolidated financial statements and the amount of revenues and expenses during the reporting periods. Actual results could differ materially from those results.
Comprehensive Income (Loss)
The Company follows the provisions of the Financial Accounting Standards Board (the “FASB”) Accounting Standards Codification (“ASC”) 220 “Reporting Comprehensive Income”, and establishes standards for the reporting and display of comprehensive income, its components and accumulated balances in a full set of general purpose financial statements. The Company’s comprehensive income (loss) consist of net income (loss) and foreign currency translation adjustments.
Fair Value Measurements
The Company applies the provisions of ASC Subtopic 820-10, “Fair Value Measurements”, for fair value measurements of financial assets and financial liabilities and for fair value measurements of nonfinancial items that are recognized or disclosed at fair value in the financial statements. ASC 820 also establishes a framework for measuring fair value and expands disclosures about fair value measurements.
Fair value is defined as the price that would be received to sell an asset or paid to transfer a liability in an orderly transaction between market participants at the measurement date. When determining the fair value measurements for assets and liabilities required or permitted to be recorded at fair value, the Company considers the principal or most advantageous market in which it would transact and it considers assumptions that market participants would use when pricing the asset or liability.
ASC 820 establishes a fair value hierarchy that requires an entity to maximize the use of observable inputs and minimize the use of unobservable inputs when measuring fair value. ASC 820 establishes three levels of inputs that may be used to measure fair value. The hierarchy gives the highest priority to unadjusted quoted prices in active markets for identical assets or liabilities (Level 1 measurements) and the lowest priority to measurements involving significant unobservable inputs (Level 3 measurements). The three levels of the fair value hierarchy are as follows:
- Level 1 inputs to the valuation methodology are quoted prices (unadjusted) for identical assets or liabilities in active markets.
| 79 |
- Level 2 inputs to the valuation methodology include quoted prices for similar assets and liabilities in active markets, and inputs that are observable for the assets or liability, either directly or indirectly, for substantially the full term of the financial instruments.
- Level 3 inputs to the valuation methodology are unobservable and significant to the fair value.
All asset and liabilities are under level 1 inputs as of and the years ended December 31, 2014 and 2013.
Foreign Currency Translation
The functional currency of the Company is the Chinese Renminbi (“RMB”).
The reporting currency of the Company is the US Dollar (“US$”).
Transactions in currencies other than the entity’s functional currency are recorded at the rates of exchange prevailing on the date of the transaction. At the end of each reporting period, monetary items denominated in foreign currencies are translated at the rates prevailing at the end of the reporting periods. Exchange differences arising on the settlement of monetary items and on translation of monetary items at period-end are included in income statement of the period.
For the purpose of presenting these financial statements, the Company’s assets and liabilities are expressed in US$ at the exchange rate on the balance sheet date, stockholder’s equity accounts are translated at historical rates, and income and expense items are translated at the weighted average exchange rate during the period. The resulting translation adjustments are reported under accumulated other comprehensive income in the stockholder’s equity section of the balance sheets.
Exchange rates applied for the foreign currency translation during the period are as follows:
| December 31, | December 31, | |||||||
| US$ to RMB | 2014 | 2013 | ||||||
| Period end spot rate | 6.13849 | 6.11038 | ||||||
| Average periodic rate | 6.145685 | 6.19433 | ||||||
Cash and Cash Equivalents
The Company considers highly-liquid investments with maturities of three months or less, when purchased, to be cash and cash equivalents.
Accounts Receivable
Accounts receivable are stated at the amount the Company expects to collect from outstanding balances. The Company provides for probable uncollectible amounts through a charge to earnings and a credit to an allowance for doubtful accounts based on its assessment of the current status of individual accounts. Balances that are still outstanding after the Company has used reasonable collection efforts are written off through a charge to the allowance for doubtful accounts and a credit to accounts receivable. Accounts receivable balances are considered past due based on contractual terms and the Company does not accrue interest on the past due balances.
Bad debt expenses were $15,130 and $1,887,886 for the years ended December 31, 2014 and 2013, respectively. The company sales during the fiscal year ending December 31, 2014 were consists of more domestic customers than in 2013, and therefore collections were easier and fewer sales were done on credit.
| 80 |
Inventories
Inventories, which are primarily comprised of goods for sale, are stated at the lower of cost or net realizable value, using the first-in first-out (FIFO) method. The Company evaluates the need for reserves associated with obsolete, slow-moving and non-salable inventory by reviewing net realizable values on a periodic basis.
Property and Equipment
Property and equipment are recorded at cost and depreciated using the straight-line method, at original cost, over the estimated useful lives of the assets as follows:
| Office equipment | 5 years |
| Motor Vehicle | 10 years |
Expenditures for repairs and maintenance, which do not improve or extend the expected useful lives of the assets, are expensed as incurred while major replacements and improvements are capitalized.
Revenue Recognition
The Company generally recognizes product sales revenue when the significant risks and rewards of ownership have been transferred pursuant to PRC law, including such factors as when persuasive evidence of an arrangement exists, delivery has occurred, the sales price is fixed or determinable, sales and value-added tax laws have been complied with, and collectability is reasonably assured.
Direct Domestic Sales
The Company recognizes product sales revenue when customers pick up and pay for the goods at once. The Company is responsible for losses when occurred. The Company sets out the terms and conditions of the sales contract and deals directly with customers.
Direct International Sales
The Company recognizes product sales revenue when the bill of lading is received from the shipping company. Although the title does not formally transfer until the goods have reach its destination port, the customer has a binding agreement for the goods; and is obligated to purchase them because a deposit has been made by the customer on the purchased goods. The Company is responsible for losses in case of a shipping issue, but in all cases the Company has purchased insurance to cover for such loss. The Company sets out the terms and conditions of the sales contract and deals directly with customers.
Agency International Sales
The Company recognizes product sales revenue when bill of lading is received from shipping company. Although the title does not formally transfer until the goods have reach its destination port, the customer has a binding agreement for the goods; and is obligated to purchase them because a deposit has been made by the customer on the purchased goods. The Agent is responsible for losses when occurred which the Agent has a blanket insurance to cover for such loss in all cases. The Agent would prepare the terms and conditions of the sales contract and deals directly with customers. . The company feels that it is acceptable to recognize revenue at when the bill of lading is received because at that point they no longer have the risk of loss or non-acceptance by the client and are fully covered for any losses by insurance that reimburses the full sales price for any loss at the point of bill of lading.
| 81 |
Value added taxes
The Company is subject to Value Added Taxes (“VAT”) at a rate of 17% on proceeds received from customers, and are entitled to a refund for VAT already paid or borne on the goods purchased by it that have generated the gross sales proceeds. The VAT balance is recorded in other payables on the balance sheets.
Advertising
The Company expenses advertising costs as incurred and are included in selling expenses.
Government Subsidies
The Company recognizes government grants that are non-operating in nature and with no further conditions to be met as other income when received. The Company recognizes government grants that contain certain operating conditions as liabilities when received, and as a reduction of the related costs for which the grants are intended to compensate when the conditions are met.
The government subsidies received by the Company were $343,477 and $nil for the years ended December 31, 2014 and 2013, respectively.
Income Taxes
The Company’s income tax comprises of China tax accrual as computed using the tax rules and regulations for such jurisdictions. In accordance with the FASB ASC Topic 740, the Company evaluate material tax positions asserted on every income tax return for the technical merits as to the tax supportability under examination or tax litigation. When the Company determines that a tax position is uncertain, the Company records a liability based on whether the tax position’s facts and circumstances on a “more likely than not” basis are supportable under tax laws and regulations. The Company have had no material adjustments to the unrecognized income tax benefits.
The Company accounts for income taxes using an asset and liability approach which allows for the recognition and measurement of deferred tax assets based upon the likelihood of realization of tax benefits in future years. Under the asset and liability approach, deferred taxes are provided for the net tax effects of temporary differences between the carrying amounts of assets and liabilities for financial reporting purposes and the amounts used for income tax purposes. A valuation allowance is provided for deferred tax assets if it is more likely than not these items will either expire before the Company is able to realize their benefits, or that future deductibility is uncertain.
Segment Information
The standard, “Disclosures about Segments of an Enterprise and Related Information,” codified with ASC-280, requires certain financial and supplementary information to be disclosed on an annual and interim basis for each reportable segment of an enterprise. The Company believes that it operates in one business segment (research, development, production, marketing and sales) and in one geographical segment (China), as all of the Company’s current operations are carried in China.
Recent Accounting Pronouncements
In February 2015, FASB issued ASU No. 2015-02, Consolidation (Topic 810): Amendments to the Consolidation Analysis. The new consolidation standard changes the way reporting enterprises evaluate whether (a) they should consolidate limited partnerships and similar entities, (b) fees paid to a decision maker or service provider are variable interests in a VIE, and (c) variable interests in a VIE held by related parties of the reporting enterprise require the reporting enterprise to consolidate the VIE. The guidance is effective for public business entities for annual and interim periods in fiscal years beginning after December 15, 2015. Early adoption is allowed, including early adoption in an interim period. A reporting entity may apply a modified retrospective approach by recording a cumulative-effect adjustment to equity as of the beginning of the fiscal year of adoption or may apply the amendments retrospectively. The Company is currently assessing the impact of the adoption of this guidance on the consolidated financial statements.
| 82 |
In May 2014, the FASB issued ASU No. 2014-09, Revenue from Contracts with Customers, which provides a single comprehensive model to be used in the accounting for revenue arising from contracts with customers and supersedes most current revenue recognition guidance, including industry-specific guidance. The standard’s stated core principle is that an entity should recognize revenue to depict the transfer of promised goods or services to customers in an amount that reflects the consideration to which the entity expects to be entitled in exchange for those goods or services. To achieve this core principle the ASU includes provisions within a five step model that includes identifying the contract with a customer, identifying the performance obligations in the contract, determining the transaction price, allocating the transaction price to the performance obligations, and recognizing revenue when (or as) an entity satisfies a performance obligation. The standard also specifies the accounting for some costs to obtain or fulfill a contract with a customer and requires expanded disclosures about revenue recognition. The standard provides for either full retrospective adoption or a modified retrospective adoption by which it is applied only to the most current period presented. This ASU is effective January 1, 2017. The Company is currently assessing this ASU’s impact on the Company’s consolidated results of operations and financial condition.
The Company believes that there were no other accounting standards recently issued that had or are expected to have a material impact on our financial position or results of operations.
| 3. | SECURITY DEPOSITS TO SUPPLIERS |
Security deposits are amounts paid by the Company to maintain its relationship with the suppliers in order to ensure ample, constant supply and prompt delivery of goods.
Security deposits to suppliers consist of the following:
| December 31, | December 31, | |||||||
| 2014 | 2013 | |||||||
| Supplier A | $ | 765,986 | $ | 1,587,790 | ||||
| Supplier B | 358,720 | 1,587,790 | ||||||
| Supplier C | 860,472 | 1,587,790 | ||||||
| Total | $ | 1,985,178 | $ | 4,763,370 | ||||
| 4. | LAND, PROPERTY & EQUIPMENT |
Land, property & equipment consist of the following:
| December 31, | December 31, | |||||||
| 2014 | 2013 | |||||||
| Land | $ | 52,267,967 | $ | 20,859,045 | ||||
| Office equipment | 8,754 | 5,579 | ||||||
| Motor vehicle | 15,207 | 15,277 | ||||||
| Total | 52,291,928 | 20,879,901 | ||||||
| Less: accumulated depreciation | (5,841 | ) | (1,645 | ) | ||||
| Net | $ | 52,286,087 | $ | 20,878,256 | ||||
The depreciation expense was $4,199and $1,623 for the years ended December 31, 2014 and 2013. The company purchased $31,408,922 in the fiscal year ended December, 31 2014, for two parcels of forest land that surround current granite mines.
| 5. | TRADE FINANCING LOANS |
The Company has executed short term accounts receivables factoring agreements with the banks and the bank would advance the Company a contracted percentage of the invoices factored up front and charge a contracted interest fee at average rate of 2%-4% based on the percentage advanced. When the outstanding accounts receivable invoice is collected, the advanced amount plus any accrued interest are repaid. The Company retains ownership of the accounts receivables and purchased insurance for the full invoiced amount.
| 83 |
The outstanding amount of trade financing loans were $1,893,264 and $4,028,054 as of December 31, 2014 and 2013, respectively.
The interest expenses were $346,262 and $5,377,570 for the years ended December 31, 2014 and 2013, respectively.
| 6. | RELATED PARTY TRANSACTIONS |
The Company received advances from its shareholders from time to time as working capital to fund for its operations. These advances are due on demand, unsecured and non-interest bearing.
The Company has an outstanding payable amount of $nil and $22,915 to Mr. Wu Xiaobin, the Company’s CEO, as of December 31, 2014 and 2013, respectively.
The Company has an outstanding payable amount of $1,548 and $nil to Mr. Yang Yuan Xi, the Company’s legal representative, as of December 31, 2014 and 2013, respectively.
| 7. | GOVERNMENT CONTRIBUTION PLAN |
The Company participates in a government-mandated multi-employer defined contribution plan pursuant to which certain retirement, medical and other welfare benefits are provided to employees. Chinese labor regulations require the Company to pay to the local labor bureau a monthly contribution at a stated contribution rate based on the monthly basic compensation of qualified employees. The relevant local labor bureau is responsible for meeting all retirement benefit obligations; the Company has no further commitments beyond its monthly contribution.
| 8. | STATUTORY RESERVE FUND |
Pursuant to the laws applicable to the PRC, PRC entities must make appropriations from after-tax profit to the non-distributable “statutory surplus reserve fund”. Subject to certain cumulative limits, the “statutory surplus reserve fund” requires annual appropriations of 10% of after-tax profit until the aggregated appropriations reach 50% of the registered capital (as determined under accounting principles generally accepted in the PRC ("PRC GAAP") at each year-end). If the Company has accumulated loss from prior periods, the Company is able to use the current period net income after tax to offset against the accumulate loss.
The PRC regulations also restrict the ability of the Company to make dividend and other payments to offshore entities or individuals. The PRC legal restrictions permit payments of dividend by the Company only out of its accumulated after-tax profits, if any, determined in accordance with PRC GAAP and regulations. Any limitations on the ability of the Company to transfer funds could materially and adversely limit our ability to grow, make investments or acquisitions that could be beneficial to the Company’s business, pay dividends and otherwise fund and conduct the Company’s business.
| 9. | INCOME TAXES |
The Company is established in PRC and its provision for income taxes primarily consists of corporate income taxes related to profits earned in the PRC from sales of products. The Company is subject to income tax rate of 25% but has received an income tax holiday from the government for three years that will expire in 2015.
| 84 |
The reconciliation of effective income tax rate as follows:
| For the Years Ended | ||||||||
| December 31, | December 31, | |||||||
| 2014 | 2013 | |||||||
| PRC Statutory income tax rate | 25 | % | 25 | % | ||||
| Less: Income tax holiday | -25 | % | -25 | % | ||||
| Total | - | - | ||||||
The provision for income tax on earnings as follows:
| For the Years Ended | ||||||||
| December 31, | December 31, | |||||||
| 2014 | 2013 | |||||||
| PRC income tax | $ | 6,754,042 | $ | 1,990,290 | ||||
| Less: Income tax subject to tax holiday | (6,754,042 | ) | (1,990,290 | ) | ||||
| Total | $ | - | $ | - | ||||
| 10. | COMMITMENTS, CONTINGENCIES, RISKS AND UNCERTAINTIES |
The Company has executed various lease agreements for office space and dormitory. The total future minimum lease payments under the operating leases as follows:
| Periods | Amounts | |||
| For year ended December 31, 2015 | $ | 399,359 | ||
| For year ended December 31, 2016 | - | |||
| For year ended December 31, 2017 | - | |||
| For year ended December 31, 2018 | - | |||
| Thereafter | - | |||
| Total | $ | 399,359 | ||
Concentration and Credit risk
Cash deposits with banks are held in financial institutions in China, which are not federally insured deposit protection. Accordingly, the Company has a concentration of credit risk related to these uninsured bank deposits. The Company has not experienced any losses in such accounts and believes it is not exposed to significant credit risk in this area.
The Company depends on a limited number of suppliers for its products. Accordingly, the Company has a concentration risk related to these suppliers. Failure to maintain existing relationships with our suppliers or to establish new relationships in the future could also negatively affect our ability to obtain products sold to customers in a timely manner. If the Company is unable to obtain ample supply of products from existing suppliers or alternative sources of supply, the Company may be unable to satisfy our customers’ orders, which could materially and adversely affect revenues.
The Company’s accounts receivable are potentially exposed to concentration of credit risk. The Company provides credit in the normal course of business and performs ongoing credit evaluations on its customers' financial condition as deemed necessary, but generally does not require collateral to support such receivables.
| 85 |
| 11. | CHANGE IN BUSINESS MARKET FOCUS |
In 2014, the Company changed its business model focusing on the local domestic market instead of the international market. The significant impact due to the change in business model was a result of lessexports and more domestic sales which resulted in less gross sales but higher sales margins. The change in business model also reduced the amount of inventory the company had on hand to $3,843 at the fiscal year ended December 31, 2014 from $5,679,351 for the fiscal year ended December 31, 2013. It also reduced the amounts of sales made on credit as well which reduced the collection times and the cost of trade financing. The details are as follows:
| For the Years Ended | ||||||||
| December 31, | December 31, | |||||||
| 2014 | 2013 | |||||||
| Cost of sales | ||||||||
| Custom duties charges | 194,166 | 1,545,156 | ||||||
| Freight and courier | 540,451 | 3,560,376 | ||||||
| Other cost of sales | 13,535,714 | 28,309,420 | ||||||
| Total | 14,270,331 | 33,414,952 | ||||||
| Selling, general and administrative expenses | ||||||||
| Insurance | 345,461 | 4,575,337 | ||||||
| Employees’ wages and salaries | 471,641 | 1,081,244 | ||||||
| Rent-Equipment | - | 1,475,716 | ||||||
| Bad debt expenses | 15,130 | 1,887,886 | ||||||
| Agency fees | - | 1,930,961 | ||||||
| Other selling, general and administrative expenses | 397,106 | 880,026 | ||||||
| Total | 1,229,338 | 11,831,170 | ||||||
| 86 |
REPORT OF INDEPENDENT REGISTERED PUBLIC ACCOUNTING FIRM
To the Board of Directors and Stockholders of Marvel Investment Corporation Limited:
We have audited the accompanying balance sheets of Marvel Investment Corporation Limited (“the Company”) as of December 31, 2014 and 2013 and the related statements of operations, stockholders’ equity (deficit) and cash flows for the years then ended. These financial statements are the responsibility of the Company's management. Our responsibility is to express an opinion on these financial statements based on our audit.
We conducted our audits in accordance with standards of the Public Company Accounting Oversight Board (United States). Those standards require that we plan and perform the audits to obtain reasonable assurance about whether the financial statements are free of material misstatement. An audit includes examining, on a test basis, evidence supporting the amounts and disclosures in the financial statements, assessing the accounting principles used and significant estimates made by management, as well as evaluating the overall financial statement presentation. We believe that our audits provide a reasonable basis for our opinions.
In our opinion, the financial statement referred to above present fairly, in all material respects, the financial position of Marvel Investment Corporation Limited, as of December 31, 2014 and 2013, and the results of its operations and its cash flows for the years then ended, in conformity with generally accepted accounting principles in the United States of America.
The company is not required to have, nor were we engaged to perform, an audit of its internal control over financial reporting. Our audits included consideration of internal control over financial reporting as a basis for designing audit procedures that are appropriate in the circumstances, but not for the purpose of expressing an opinion on the Company's internal control over financial reporting. Accordingly, we express no such opinion.
The accompanying financial statements have been prepared assuming that the Company will continue as a going concern. As discussed in Note 4 to the financial statements, the Company’s operating losses raise substantial doubt about its ability to continue as a going concern. The financial statements do not include any adjustments that might result from the outcome of this uncertainty.
/s/ B F Borgers CPA PC
B
F Borgers CPA PC
Lakewood, CO
September 30, 2015
| 87 |
MARVEL INVESTMENT CORPORATION LIMITED
BALANCE SHEETS
(Audited)
| December 31, | December 31, | |||||||
| 2014 | 2013 | |||||||
| Assets | ||||||||
| Current Assets | ||||||||
| Cash | $ | - | $ | - | ||||
| Total Current Assets | - | - | ||||||
| Total Assets | - | - | ||||||
| Liabilities | ||||||||
| Current Liabilities | ||||||||
| Accrued Liabilities | - | - | ||||||
| Total Current Liabilities | - | - | ||||||
| Total Liabilities | - | - | ||||||
| Stockholders' Deficit | ||||||||
| Common stock, 1,000,000 shares authorized; 10,000 shares at December 31, 2014 and 2013, respectively | 1,290 | 1,290 | ||||||
| Additional paid-in capital | 8,345 | 7,359 | ||||||
| Subscription receivables | (1,290 | ) | (1,290 | ) | ||||
| Accumulated deficit | (8,345 | ) | (7,359 | ) | ||||
| Total Stockholders' Deficit | - | - | ||||||
| Total Liabilities and Stockholders' Deficit | $ | - | $ | - | ||||
The accompanying notes are an integral part of these financial statements
| 88 |
MARVEL INVESTMENT CORPORATION LIMITED
STATEMENT OF OPERATIONS
(Audited)
| For the Years Ended | ||||||||
| December 31, | December 31, | |||||||
| 2014 | 2013 | |||||||
| Revenues | $ | - | $ | - | ||||
| Cost of Sales | - | - | ||||||
| Gross Margin | - | - | ||||||
| Operating Expenses | ||||||||
| General & Administrative Expenses | 986 | 727 | ||||||
| Total Operating Expenses | 986 | 727 | ||||||
| Loss from operations | (986 | ) | (727 | ) | ||||
| Net Loss before Income Taxes | (986 | ) | (727 | ) | ||||
| Income Tax Benefit | - | - | ||||||
| Net Loss | $ | (986 | ) | $ | (727 | ) | ||
| Net Loss per Common Share - Basic and Diluted | $ | (0 | ) | $ | (0 | ) | ||
| Weighted Average Number of Common Shares Outstanding - Basic and Diluted | 10,000 | 10,000 | ||||||
The accompanying notes are an integral part of these financial statements
| 89 |
MARVEL INVESTMENT CORPORATION LIMITED
STATEMENT OF CASH FLOWS
(Audited)
| For the Years Ended | ||||||||
| December 31, | December 31, | |||||||
| 2014 | 2013 | |||||||
| Cash Flows from Operating Activities | ||||||||
| Net Loss | $ | (986 | ) | $ | (727 | ) | ||
| Adjustment to reconcile net loss from operations: | ||||||||
| Expenses paid by stockholder and contributed as capital | 986 | 727 | ||||||
| Changes in Operating Assets and Liabilities | ||||||||
| Accrued liabilities | - | - | ||||||
| Net Cash Used in Operating Activities | - | - | ||||||
| Net Increase (Decrease) in Cash | - | - | ||||||
| Cash at Beginning of Period | - | - | ||||||
| Cash at End of Period | $ | - | $ | - | ||||
The accompanying notes are an integral part of these financial statements
| 90 |
MARVEL INVESTMENT CORPORATION LIMITED
STATEMENTS OF STOCKHOLDERS' DEFICIT
For years ended December 31, 2014 and 2013
(Audited)
| Total | ||||||||||||||||||||||||
| Common Stock | Additional | Subscription | Accumulated | Stockholders | ||||||||||||||||||||
| Shares | Amount | Paid-In Capital | Receivables | Deficit | Deficit | |||||||||||||||||||
| Balance, October 28, 2009 (Inception) | - | $ | - | $ | 1,239 | $ | - | $ | (1,239 | ) | $ | - | ||||||||||||
| Issuance of common stock | 10,000 | 1,290 | (1,290 | ) | - | |||||||||||||||||||
| Expenses paid by stockholder and contributed as capital | 1,024 | 1,024 | ||||||||||||||||||||||
| Net (loss) for the period | (1,024 | ) | (1,024 | ) | ||||||||||||||||||||
| Balance, December 31, 2009 | 10,000 | 1,290 | 2,263 | (1,290 | ) | (2,263 | ) | - | ||||||||||||||||
| Expenses paid by stockholder and contributed as capital | 1,370 | 1,370 | ||||||||||||||||||||||
| Net (loss) for the period | (1,370 | ) | (1,370 | ) | ||||||||||||||||||||
| Balance, December 31, 2010 | 10,000 | 1,290 | 3,633 | (1,290 | ) | (3,633 | ) | - | ||||||||||||||||
| Expenses paid by stockholder and contributed as capital | 2,187 | 2,187 | ||||||||||||||||||||||
| Net (loss) for the period | (2,187 | ) | (2,187 | ) | ||||||||||||||||||||
| Balance, December 31, 2011 | 10,000 | 1,290 | 5,820 | (1,290 | ) | (5,820 | ) | - | ||||||||||||||||
| Expenses paid by stockholder and contributed as capital | 812 | 812 | ||||||||||||||||||||||
| Net (loss) for the period | (812 | ) | (812 | ) | ||||||||||||||||||||
| Balance, December 31, 2012 | 10,000 | 1,290 | 6,632 | (1,290 | ) | (6,632 | ) | - | ||||||||||||||||
| Expenses paid by stockholder and contributed as capital | 727 | 727 | ||||||||||||||||||||||
| Net (loss) for the period | (727 | ) | (727 | ) | ||||||||||||||||||||
| Balance, December 31, 2013 | 10,000 | 1,290 | 7,359 | (1,290 | ) | (7,359 | ) | - | ||||||||||||||||
| Expenses paid by stockholder and contributed as capital | 986 | 986 | ||||||||||||||||||||||
| Net (loss) for the period | (986 | ) | (986 | ) | ||||||||||||||||||||
| Balance, December 31, 2014 | 10,000 | 1,290 | 8,345 | (1,290 | ) | (8,345 | ) | - | ||||||||||||||||
The accompanying notes are an integral part of these financial statements
| 91 |
MARVEL INVESTMENT CORPORATION LIMITED
Notes to Condensed Financial Statements
NOTE 1 - NATURE OF OPERATIONS
Marvel Investment Corporation Limited (the “Company”) was incorporated on October 28, 2009 under the laws of Hong Kong, PRC. The Company is established to engage in any lawful corporate undertaking, including, but not limited to, selected mergers and acquisitions. The Company has been in the developmental stage since inception and has no operations to date. The Company will attempt to locate and negotiate with a business entity for the combination of that target company with the Company. The combination will normally take the form of a merger, stock-for-stock exchange or stock-for-assets exchange.
NOTE 2 - SUMMARY OF SIGNIFICANT ACCOUNTING POLICIES
Basis of presentation
The condensed financial statements of the Company have been prepared in accordance with generally accepted accounting principles in the United States of America (“US GAAP”). This basis of accounting involves the application of accrual accounting and consequently, revenues and gains are recognized when earned, and expenses and losses are recognized when incurred.
Use of estimates
The preparation of condensed financial statements (unaudited) in conformity with GAAP requires management to make estimates and assumptions that affect the reported amounts of assets and liabilities and disclosure of contingent assets and liabilities at the date of the condensed financial statements, and the reported amounts of revenues and expenses during the reporting periods. Actual results could differ from those estimates.
Cash and cash equivalence
Cash and cash equivalents include cash on hand and on deposit at banking institutions as well as all highly liquid short-term investments with original maturities of 90 days or less. The Company did not have cash or cash equivalents as of December 31, 2014 and 2013.
Concentration risk
Financial instruments that potentially subject the Company to concentrations of credit risk consist principally of cash. The Company places its cash with high quality banking institutions.
Income Taxes
The Company is established in Hong Kong and its income is subject to 16% tax rate.
Under ASC 740, "Income Taxes," deferred tax assets and liabilities are recognized for the future tax consequences attributable to temporary differences between the financial statement carrying amounts of existing assets and liabilities and their respective tax bases. Deferred tax assets and liabilities are measured using enacted tax rates expected to apply to taxable income in the years in which those temporary differences are expected to be recovered or settled. Valuation allowances are established when it is more likely than not that some or all of the deferred tax assets will not be realized. As of December 31, 2014 and 2013, there were no deferred taxes due to the uncertainty of the realization of net operating loss or carry forward prior to expiration.
Comprehensive Income (Loss)
The Company follows the provisions of the Financial Accounting Standards Board (the “FASB”) Accounting Standards Codification (“ASC”) 220 “Reporting Comprehensive Income”, and establishes standards for the reporting and display of comprehensive income, its components and accumulated balances in a full set of general purpose financial statements. The Company’s comprehensive income (loss) consist of net income (loss) and foreign currency translation adjustments.
| 92 |
Foreign Currency Translation
The functional currency of the Company is the Hong Kong Dollar (“HK$”).
The reporting currency of the Company is the US Dollar (“US$”).
Transactions in currencies other than the entity’s functional currency are recorded at the rates of exchange prevailing on the date of the transaction. At the end of each reporting period, monetary items denominated in foreign currencies are translated at the rates prevailing at the end of the reporting periods. Exchange differences arising on the settlement of monetary items and on translation of monetary items at period-end are included in income statement of the period.
For the purpose of presenting these financial statements, the Company’s assets and liabilities are expressed in US$ at the exchange rate on the balance sheet date, stockholder’s equity accounts are translated at historical rates, and income and expense items are translated at the weighted average exchange rate during the period. The resulting translation adjustments are reported under accumulated other comprehensive income in the stockholder’s equity section of the balance sheets.
Revenue recognition
The Company recognizes revenue in accordance with Financial Accounting Standards Board Accounting Standards Codification ("ASC") No. 605, Revenue Recognition. In all cases, revenue is recognized only when the price is fixed and determinable, persuasive evidence of an arrangement exists, the service is performed and collectability of the resulting receivable is reasonably assured. The Company did not generate any revenues since inception.
Fair value of financial instruments
The Company follows guidance for accounting for fair value measurements of financial assets and financial liabilities and for fair value measurements of nonfinancial items that are recognized or disclosed at fair value in the condensed financial statements (unaudited) on a recurring basis. Additionally, the Company adopted guidance for fair value measurement related to nonfinancial items that are recognized and disclosed at fair value in the condensed financial statements (unaudited) on a nonrecurring basis. The guidance establishes a fair value hierarchy that prioritizes the inputs to valuation techniques used to measure fair value. The hierarchy gives the highest priority to unadjusted quoted prices in active markets for identical assets or liabilities (Level 1 measurements) and the lowest priority to measurements involving significant unobservable inputs (Level 3 measurements). The three levels of the fair value hierarchy are as follows:
- Level 1 inputs are quoted prices (unadjusted) in active markets for identical assets or liabilities that the Company has the ability to access at the measurement date.
- Level 2 inputs are inputs other than quoted prices included within Level 1 that are observable for the asset or liability, either directly or indirectly.
- Level 3 inputs are unobservable inputs for the asset or liability.
The carrying amounts of financial assets such as cash approximate their fair values because of the short maturity of these instruments.
NOTE 4 - GOING CONCERN
The Company has not yet generated any revenue since inception to date.
The Company had working capital of $0 and an accumulated deficits and operating losses since it inception. The Company's continuation as a going concern is dependent on its ability to generate sufficient cash flows from operations to meet its obligations and/or obtain additional financing from its members or other sources, as may be required. The accompanying condensed financial statements have been prepared assuming that the Company will continue as a going concern; however, the above condition raises substantial doubt about the Company's ability to do so. The condensed financial statements do not include any adjustments to reflect the possible future effects on the recoverability and classification of assets or the amounts and classifications of liabilities that may result should the Company be unable to continue as a going concern
| 93 |
In order to maintain its current level of operations, the Company will require additional working capital from either cash flow from operations or from the sale of its equity. However, the Company currently has no commitments from any third parties for the purchase of its equity. If the Company is unable to acquire additional working capital, it will be required to significantly reduce its current level of operations.
NOTE 5 - RECENT ACCOUNTING PRONOUNCEMENTS
In August, 2014, the Financial Accounting Standards Board ("FASB") issued Accounting Standards Update (ASU) No. 2014-15, Presentation of Financial Statements-Going Concern (Subtopic 205-40), which now requires management to evaluate whether there are conditions or events, considered in the aggregate, that raise substantial doubt about the entity's ability to continue as a going concern within one year after the date the financial statements are issued. If conditions or events raise substantial doubt about an entity's ability to continue as a going concern, and substantial doubt is not alleviated after consideration of management's plans, additional disclosures are required. The amendments in this update are effective for the annual period ending after December 15, 2016, and for annual periods and interim periods thereafter. Early application is permitted. These requirements were previously included within auditing standards and federal securities law, but are now included within U.S. GAAP. We are currently assessing the impact of the adoption of ASU No. 2014-15 on our financial statements and disclosures.
In June, 2014, the FASB issued ASU No. 2014-10, Development Stage Entities (Topic 915) - Elimination of Certain Financial Reporting Requirements, Including an Amendment to Variable Interest Entities Guidance in Topic 810, Consolidation, which eliminates the concept of a development stage entity (DSE) in its entirety from current accounting guidance. We have elected early adoption of this standard, which eliminates the designation of DSEs and the requirement to disclose results of operations and cash flows since inception. We do not believe the adoption of ASU No. 2014-10 will have significant impact on our financial statements and disclosures.
NOTE 6 - STOCKHOLDERS' EQUITY
The Company is authorized to issue 1,000,000 shares of common stock at HK$1.
On October 20, 2009, the Company issued 10,000 shares of its common stock at HK$1 per share for a total of HK$10,000.
The Company’s shareholder has paid expenses that are contributed as paid-in capital of the Company.
NOTE 7 – SUBSEQUENT EVENTS
Effective June 30, 2015, The Company merged with Liaoning Fuda Mining Co, Ltd.
| 94 |
Marvel Investment Corporation Limited and Subsidiaries
Consolidated Balance Sheets
(Unaudited)
| June 30, 2015 | December 31, 2014 | |||||||
| (unaudited) | ||||||||
| ASSETS | ||||||||
| Current Assets | ||||||||
| Cash and cash equivalents | $ | 5,420,679 | $ | 466 | ||||
| Accounts receivable, net | 212,897 | 260,624 | ||||||
| Inventory | 918,011 | 3,843 | ||||||
| Prepaid rent | 27,057 | 65,058 | ||||||
| Security deposits to suppliers | - | 1,985,178 | ||||||
| Other receivables | 930,680 | 436,014 | ||||||
| Total Current Assets | 7,509,324 | 2,751,183 | ||||||
| Land, Property & equipment (net) | 52,710,480 | 52,286,087 | ||||||
| Total Assets | $ | 60,219,804 | $ | 55,037,270 | ||||
| LIABILITIES AND STOCKHOLDERS' EQUITY | ||||||||
| Current Liabilities | ||||||||
| Accounts payable and accrued expenses | $ | 3,201,507 | $ | 8,420,643 | ||||
| Taxes payable | 226 | 224 | ||||||
| Due to related parties | 1,560 | 1,548 | ||||||
| Other payables | 11,615 | 11,472 | ||||||
| Trade financing loans | - | 1,893,264 | ||||||
| Advances from customers | 121,698 | - | ||||||
| Total Current Liabilities | 3,336,606 | 10,327,151 | ||||||
| Total Liabilities | 3,336,606 | 10,327,151 | ||||||
| Commitments & contingencies | - | - | ||||||
| Stockholders' Equity | ||||||||
| Common stock, 1,000,000 authorized $0.12903 par value, 10,000 shares issued and outstanding at June 30, 2015 and December 31, 2014, respectively | 1,290 | 1,290 | ||||||
| Additional paid-in capital | 9,563,015 | 9,563,015 | ||||||
| Subscription receivables | (1,290 | ) | (1,290 | ) | ||||
| Accumulated other comprehensive income | 656,039 | 220,712 | ||||||
| Accumulated earnings | 46,664,144 | 34,926,392 | ||||||
| Total stockholders' equity | 56,883,198 | 44,710,119 | ||||||
| TOTAL LIABILITIES AND STOCKHOLDERS' EQUITY | $ | 60,219,804 | $ | 55,037,270 | ||||
The accompanying notes are an integral part of these financial statements
| 95 |
Marvel Investment Corporation Limited and Subsidiaries
Consolidated Statements of Operations
(Unaudited)
| For the Three Months Ended | For the Six Months Ended | |||||||||||||||
| June 30, 2015 | June 30, 2014 | June 30, 2015 | June 30, 2014 | |||||||||||||
| Revenues | $ | 10,873,218 | $ | 13,675,783 | $ | 20,088,354 | $ | 21,684,493 | ||||||||
| Cost of sales | 4,704,713 | 5,142,166 | 8,050,832 | 9,844,224 | ||||||||||||
| Gross margin | 6,168,505 | 8,533,617 | 12,037,522 | 11,840,269 | ||||||||||||
| Operating expenses | ||||||||||||||||
| Selling, general & administrative expenses | 172,424 | 239,596 | 332,457 | 872,289 | ||||||||||||
| Total operating expenses | 172,242 | 238,454 | 332,457 | 872,289 | ||||||||||||
| Income (Loss) from operation | 5,996,081 | 8,295,163 | 11,705,065 | 10,967,980 | ||||||||||||
| Other income (expenses) | ||||||||||||||||
| Interest expense, net | 14 | (29,722 | ) | (1,339 | ) | (344,972 | ) | |||||||||
| Government rebate | 106 | 651 | 34,544 | 651 | ||||||||||||
| Total other income | 120 | (30,213 | ) | 33,205 | (344,321 | ) | ||||||||||
| Income before income tax | 5,996,200 | 8,264,950 | 11,738,270 | 10,623,659 | ||||||||||||
| Income tax | (1 | ) | - | (518 | ) | - | ||||||||||
| Net income | 5,996,200 | 8,264,950 | 11,737,752 | 10,623,659 | ||||||||||||
| Foreign currency translation adjustment | 187,450 | 261,572 | 435,327 | (175,708 | ) | |||||||||||
| Comprehensive income | $ | 6,183,650 | $ | 8,526,522 | $ | 12,173,079 | $ | 10,447,951 | ||||||||
| Common Shares Outstanding, basic and diluted | 10,000 | 10,000 | 10,000 | 10,000 | ||||||||||||
| Net income per share | ||||||||||||||||
| Basic and diluted | $ | 600 | $ | 826 | $ | 1,174 | $ | 1,062 | ||||||||
The accompanying notes are an integral part of these financial statements
| 96 |
Marvel Investment Corporation Limited and Subsidiaries
Consolidated Statements of Changes in Stockholders' Equity
For the years ended December 31, 2014 and Six Months Ended June 30, 2015
(Unaudited)
| Accumulated | ||||||||||||||||||||||||||||
| Common Stock | Additional | Other | ||||||||||||||||||||||||||
| $0.12903 Par Value | Paid-in | Subscription | Comprehensive | Accumulated | ||||||||||||||||||||||||
| Shares | Amount | Capital | Receivables | Income | Earnings | Totals | ||||||||||||||||||||||
| Balances at December 31, 2013 | 10,000 | $ | 1,290 | $ | 9,602,706 | $ | (1,290 | ) | $ | 293,971 | $ | 7,911,210 | $ | 17,807,887 | ||||||||||||||
| Capital distribution to owners | (40,677 | ) | (40,677 | ) | ||||||||||||||||||||||||
| Net income | 27,015,182 | 27,015,182 | ||||||||||||||||||||||||||
| Expenses paid by stockholder and contributed as capital | 986 | 986 | ||||||||||||||||||||||||||
| Cumulative translation adjustment | (73,259 | ) | (73,259 | ) | ||||||||||||||||||||||||
| Balances at December 31, 2014 | 10,000 | $ | 1,290 | $ | 9,563,015 | $ | (1,290 | ) | $ | 220,712 | $ | 34,926,392 | $ | 44,710,119 | ||||||||||||||
| Net income | 11,737,752 | 11,737,831 | ||||||||||||||||||||||||||
| Cumulative translation adjustment | 435,327 | 435,248 | ||||||||||||||||||||||||||
| Balances at June 30, 2015 | 10,000 | $ | 1,290 | $ | 9,563,015 | $ | (1,290 | ) | $ | 656,039 | $ | 46,664,144 | $ | 56,883,198 | ||||||||||||||
The accompanying notes are an integral part of these financial statements
| 97 |
Marvel Investment Corporation Limited and Subsidiaries
Consolidated Statements of Cash Flows
(Unaudited)
| For the Six Months Ended | ||||||||
| June 30, 2015 | June 30, 2014 | |||||||
| Cash flows from operating activities | ||||||||
| Net income | $ | 11,737,752 | $ | 10,623,659 | ||||
| Adjustments to reconcile net income to net cash provided by or used in operating activities: | ||||||||
| Depreciation and amortization | 2,120 | 1,313 | ||||||
| Changes in operating assets and liabilities: | ||||||||
| Accounts receivable | 48,698 | 1,054,754 | ||||||
| Inventory | (908,672 | ) | 2,200,176 | |||||
| Prepaid rent | 38,087 | 56,652 | ||||||
| Other receivables | (476,525 | ) | (40,947 | ) | ||||
| Security deposits to suppliers | 1,982,855 | 1,995,028 | ||||||
| Accounts payable and accrued expenses | (5,228,464 | ) | 14,639,310 | |||||
| Taxes payable | - | 96 | ||||||
| Other payables | 87 | 6,021 | ||||||
| Advances from customers | 120,969 | - | ||||||
| Net cash provided by operating activities | 7,316,907 | 30,536,062 | ||||||
| Cash flows from financing activities | ||||||||
| Proceeds/(Repayment) to related party, net | (12,994) | (60,165 | ) | |||||
| Proceeds/(Repayments) from trade financing loans, net | (1,891,048 | ) | (1,979,565 | ) | ||||
| Net cash used in financing activities | (1,904,042 | ) | (2,039,730 | ) | ||||
| Cash flows from investing activities | ||||||||
| Purchase of land, property and equipment | - | (31,667,151 | ) | |||||
| Net cash used in investing activities | - | (31,667,151 | ) | |||||
| Effect of exchange rate changes | 7,348 | 85,227 | ||||||
| NET INCREASE (DECREASE) IN CASH | 5,420,213 | (3,085,592 | ) | |||||
| CASH | ||||||||
| Beginning of period | 466 | 3,112,528 | ||||||
| End of period | $ | 5,420,679 | $ | 26,936 | ||||
| SUPPLEMENTAL DISCLOSURES OF CASH FLOW INFORMATION | ||||||||
| CASH PAID FOR: | ||||||||
| Interest | $ | 1,367 | $ | 54,352 | ||||
| Income Taxes | $ | 518 | $ | - | ||||
The accompanying notes are an integral part of these financial statements
| 98 |
MARVEL INVESTMENT CORPORATION LIMITED AND SUBSIDIARY
Notes to Consolidated Financial Statements
| 1. | ORGANIZATION AND DESCRIPTION OF BUSINESS |
Marvel Investment Corporation Limited (“Marvel”) was incorporated on October 28, 2009 under the laws of Hong Kong, PRC. The Company was established to engage in any lawful corporate undertaking, including, but not limited to, selected mergers and acquisitions.
On February 28, 2015, Marvel entered into an Equity Interest Transfer Agreement with Liaoning Fuda Mining Co., Ltd (“Liaoning Fuda”) whereas Marvel agreed to acquire 100% equity interest in Liaoning effective June 30, 2015. Both Marvel and Liaoning Fuda are under common control of the same shareholder and no consideration was given in exchange for the equity interest in Liaoning Fuda. The acquisition was done to position Liaoning Fuda in a more favorable tax position under the laws of Hong Kong, PRC.
The acquisition was accounted under US GAAP as a business combination under common control with Marvel being the acquirer as both entities were owned by the same shareholder. The accompanying consolidated financial statements have been presented as consolidated, and no purchase price accounting or reverse merger accounting methods were used in consolidation.
Liaoning Fuda was established in August 2012 in Dandong City, Liaoning Province, China (“PRC”) with authorized capital of 60 million Chinese Yuan. Liaoning Fuda is a natural resource trading company that consists of raw blocks, stone carvings, slabs, pavers and wall claddings.
Marvel and its subsidiary shall be collectively known as the “Company”.
| 2. | SUMMARY OF SIGNIFICANT ACCOUNTING POLICIES |
Basis of Presentation
The accompanying unaudited financial statements and related notes have been prepared in accordance with generally accepted accounting principles in the United States of America (“US GAAP”).
This basis of accounting involves the application of accrual accounting and consequently, revenues and gains are recognized when earned, and expenses and losses are recognized when incurred.
The Company’s financial statements are expressed in U.S. dollars.
Principal of Consolidation
The consolidated financial statements include the accounts of the Company and its subsidiaries. All significant inter-company accounts and transactions have been eliminated in consolidation.
Acquisition of Liaoning Fuda
The acquisition was accounted under US GAAP as a business combination under common control with Marvel being the acquirer as both entities were owned by the same shareholder. The consolidated financial statements have been presented at historical costs and on a retroactive basis. No purchase price or reverse merger accounting methods were used.
Use of Estimates
The preparation of financial statements in conformity with US GAAP requires management to make estimates and assumptions that affect the reported amounts of assets and liabilities and disclosure of contingent assets and liabilities at the date of the consolidated financial statements and the amount of revenues and expenses during the reporting periods. Actual results could differ materially from those results.
| 99 |
Comprehensive Income (Loss)
The Company follows the provisions of the Financial Accounting Standards Board (the “FASB”) Accounting Standards Codification (“ASC”) 220 “Reporting Comprehensive Income”, and establishes standards for the reporting and display of comprehensive income, its components and accumulated balances in a full set of general purpose financial statements. The Company’s comprehensive income (loss) consist of net income (loss) and foreign currency translation adjustments.
Fair Value Measurements
The Company applies the provisions of ASC Subtopic 820-10, “Fair Value Measurements”, for fair value measurements of financial assets and financial liabilities and for fair value measurements of nonfinancial items that are recognized or disclosed at fair value in the financial statements. ASC 820 also establishes a framework for measuring fair value and expands disclosures about fair value measurements.
Fair value is defined as the price that would be received to sell an asset or paid to transfer a liability in an orderly transaction between market participants at the measurement date. When determining the fair value measurements for assets and liabilities required or permitted to be recorded at fair value, the Company considers the principal or most advantageous market in which it would transact and it considers assumptions that market participants would use when pricing the asset or liability.
ASC 820 establishes a fair value hierarchy that requires an entity to maximize the use of observable inputs and minimize the use of unobservable inputs when measuring fair value. ASC 820 establishes three levels of inputs that may be used to measure fair value. The hierarchy gives the highest priority to unadjusted quoted prices in active markets for identical assets or liabilities (Level 1 measurements) and the lowest priority to measurements involving significant unobservable inputs (Level 3 measurements). The three levels of the fair value hierarchy are as follows:
- Level 1 inputs to the valuation methodology are quoted prices (unadjusted) for identical assets or liabilities in active markets.
- Level 2 inputs to the valuation methodology include quoted prices for similar assets and liabilities in active markets, and inputs that are observable for the assets or liability, either directly or indirectly, for substantially the full term of the financial instruments.
- Level 3 inputs to the valuation methodology are unobservable and significant to the fair value.
There were no assets or liabilities measured at fair value on a recurring basis subject to the disclosure requirements of ASC 820 as of the balance sheet date.
Foreign Currency Translation
The functional currency of Liaoning Fuda is the Chinese Renminbi (“RMB”).
The functional currency of Marvel is the Hong Kong Dollar (“HK$”).
The reporting currency of the Company is the US Dollar (“US$”).
Transactions in currencies other than the entity’s functional currency are recorded at the rates of exchange prevailing on the date of the transaction. At the end of each reporting period, monetary items denominated in foreign currencies are translated at the rates prevailing at the end of the reporting periods. Exchange differences arising on the settlement of monetary items and on translation of monetary items at period-end are included in income statement of the period.
For the purpose of presenting these financial statements, the Company’s assets and liabilities are expressed in US$ at the exchange rate on the balance sheet date, stockholder’s equity accounts are translated at historical rates, and income and expense items are translated at the weighted average exchange rate during the period. The resulting translation adjustments are reported under accumulated other comprehensive income in the stockholder’s equity section of the balance sheets.
| 100 |
Exchange rate used for the translation as follows:
| June 30, | June 30, | December 31, | ||||||||||
| US$ to RMB | 2015 | 2014 | 2014 | |||||||||
| Period end spot rate | 6.08882 | 6.15520 | 6.13849 | |||||||||
| Average periodic rate | 6.12553 | 6.14176 | 6.14569 | |||||||||
| June 30, | June 30, | December 31, | ||||||||||
| HK$ to US$ | 2015 | 2014 | 2014 | |||||||||
| Period end spot rate | 0.12899 | 0.12901 | 0.12891 | |||||||||
| Average periodic rate | 0.12897 | 0.12895 | 0.1289 | |||||||||
Cash and Cash Equivalents
The Company considers highly-liquid investments with maturities of three months or less, when purchased, to be cash and cash equivalents.
Accounts Receivable
Accounts receivable are stated at the amount the Company expects to collect from outstanding balances. The Company provides for probable uncollectible amounts through a charge to earnings and a credit to an allowance for doubtful accounts based on its assessment of the current status of individual accounts. Balances that are still outstanding after the Company has used reasonable collection efforts are written off through a charge to the allowance for doubtful accounts and a credit to accounts receivable.
Bad debt expenses were $nil and $nil for the six months ended June 30, 2015 and 2014, respectively.
Inventories
Inventories, which are primarily comprised of goods for sale, are stated at the lower of cost or net realizable value, using the first-in first-out (FIFO) method. The Company evaluates the need for reserves associated with obsolete, slow-moving and non-salable inventory by reviewing net realizable values on a periodic basis.
Property and Equipment
Property and equipment are recorded at cost and depreciated using the straight-line method, at original cost, over the estimated useful lives of the assets as follows:
| Office equipment | 5 years |
| Motor Vehicle | 10 years |
Expenditures for repairs and maintenance, which do not improve or extend the expected useful lives of the assets, are expensed as incurred while major replacements and improvements are capitalized.
Security deposits
Security deposits are amounts paid by the Company to its suppliers in order to ensure ample, constant supply and prompt delivery of goods.
| 101 |
Revenue Recognition
The Company generally recognizes product sales revenue when the significant risks and rewards of ownership have been transferred pursuant to PRC law, including such factors as when persuasive evidence of an arrangement exists, delivery has occurred, the sales price is fixed or determinable, sales and value-added tax laws have been complied with, and collectability is reasonably assured.
Direct Domestic Sales
The Company recognizes product sales revenue when customers pick up and pay for the goods at once. The Company is responsible for losses when occurred. The Company sets out the terms and conditions of the sales contract and deals directly with customers.
Direct International Sales
The Company recognizes product sales revenue when bill of lading in received from shipping company although the title does not transfer until the goods have reach its destination port. The Company is responsible for losses when occurred which the Company has purchased insurance to cover for such loss. The Company sets out the terms and conditions of the sales contract and deals directly with customers.
Agency International Sales
The Company recognizes product sales revenue when bill of lading in received from shipping company although the title does not transfer until the goods have reach its destination port. The Agent is responsible for losses when occurred which the Agent has a blanket insurance to cover for such loss. The Agent would prepare the terms and conditions of the sales contract and deals directly with customers.
Value added taxes
The Company is subject to Value Added Taxes (“VAT”) at a rate of 17% on proceeds received from customers, and are entitled to a refund for VAT already paid or borne on the goods purchased by it that have generated the gross sales proceeds. The VAT balance is recorded in other payables on the balance sheets.
Advertising
The Company expenses advertising costs as incurred and are included in selling expenses.
Government Subsidies
The Company recognizes government grants that are non-operating in nature and with no further conditions to be met as other income when received. The Company recognizes government grants that contain certain operating conditions as liabilities when received, and as a reduction of the related costs for which the grants are intended to compensate when the conditions are met.
The government subsidies received by the Company were $34,544 and $651 for the six months ended June 30, 2015 and 2014, respectively.
Income Taxes
The Company accounts for income taxes using an asset and liability approach which allows for the recognition and measurement of deferred tax assets based upon the likelihood of realization of tax benefits in future years. Under the asset and liability approach, deferred taxes are provided for the net tax effects of temporary differences between the carrying amounts of assets and liabilities for financial reporting purposes and the amounts used for income tax purposes. A valuation allowance is provided for deferred tax assets if it is more likely than not these items will either expire before the Company is able to realize their benefits, or that future deductibility is uncertain.
| 102 |
Under ASC 740, a tax position is recognized as a benefit only if it is “more likely than not” that the tax position would be sustained in a tax examination, with a tax examination being presumed to occur. The evaluation of a tax position is a two-step process. The first step is to determine whether it is more-likely-than-not that a tax position will be sustained upon examination, including the resolution of any related appeals or litigations based on the technical merits of that position. The second step is to measure a tax position that meets the more-likely-than-not threshold to determine the amount of benefit to be recognized in the financial statements. A tax position is measured at the largest amount of benefit that is greater than 50 percent likely of being realized upon ultimate settlement. Tax positions that previously failed to meet the more-likely-than-not recognition threshold should be recognized in the first subsequent period in which the threshold is met. Previously recognized tax positions that no longer meet the more-likely-than-not criteria should be de-recognized in the first subsequent financial reporting period in which the threshold is no longer met. Penalties and interest incurred related to underpayment of income tax are classified as income tax expense in the year incurred.
Segment Information
The standard, “Disclosures about Segments of an Enterprise and Related Information,” codified with ASC-280, requires certain financial and supplementary information to be disclosed on an annual and interim basis for each reportable segment of an enterprise. The Company believes that it operates in one business segment (marketing and sales) and in one geographical segment (China), as all of the Company’s current operations are carried in China.
Recent Accounting Pronouncements
In February 2015, FASB issued ASU No. 2015-02, Consolidation (Topic 810): Amendments to the Consolidation Analysis. The new consolidation standard changes the way reporting enterprises evaluate whether (a) they should consolidate limited partnerships and similar entities, (b) fees paid to a decision maker or service provider are variable interests in a VIE, and (c) variable interests in a VIE held by related parties of the reporting enterprise require the reporting enterprise to consolidate the VIE. The guidance is effective for public business entities for annual and interim periods in fiscal years beginning after December 15, 2015. Early adoption is allowed, including early adoption in an interim period. A reporting entity may apply a modified retrospective approach by recording a cumulative-effect adjustment to equity as of the beginning of the fiscal year of adoption or may apply the amendments retrospectively. The Company is currently assessing the impact of the adoption of this guidance on the consolidated financial statements.
In May 2014, the FASB issued ASU No. 2014-09, Revenue from Contracts with Customers, which provides a single comprehensive model to be used in the accounting for revenue arising from contracts with customers and supersedes most current revenue recognition guidance, including industry-specific guidance. The standard’s stated core principle is that an entity should recognize revenue to depict the transfer of promised goods or services to customers in an amount that reflects the consideration to which the entity expects to be entitled in exchange for those goods or services. To achieve this core principle the ASU includes provisions within a five step model that includes identifying the contract with a customer, identifying the performance obligations in the contract, determining the transaction price, allocating the transaction price to the performance obligations, and recognizing revenue when (or as) an entity satisfies a performance obligation. The standard also specifies the accounting for some costs to obtain or fulfill a contract with a customer and requires expanded disclosures about revenue recognition. The standard provides for either full retrospective adoption or a modified retrospective adoption by which it is applied only to the most current period presented. This ASU is effective January 1, 2017. The Company is currently assessing this ASU’s impact on the Company’s consolidated results of operations and financial condition.
The Company believes that there were no other accounting standards recently issued that had or are expected to have a material impact on our financial position or results of operations.
| 3. | SECURITY DEPOSITS TO SUPPLIERS |
Security deposits are amounts paid by the Company to maintain its relationship with the suppliers in order to ensure ample, constant supply and prompt delivery of goods.
| 103 |
Security deposits to suppliers consist of the following:
| June 30, | December 31, | |||||||
| 2015 | 2014 | |||||||
| Supplier A | $ | - | $ | 765,986 | ||||
| Supplier B | - | 358,720 | ||||||
| Supplier C | - | 860,472 | ||||||
| Total | $ | - | $ | 1,985,178 | ||||
| 4. | LAND, PROPERTY & EQUIPMENT |
Land, property & equipment consist of the following:
| June 30, | December 31, | |||||||
| 2015 | 2014 | |||||||
| Land | $ | 52,694,346 | $ | 52,267,967 | ||||
| Office equipment | 8,825 | 8,754 | ||||||
| Motor vehicle | 15,331 | 15,207 | ||||||
| Total | 52,718,502 | 52,291,928 | ||||||
| Less: accumulated depreciation | (8,022 | ) | (5,841 | ) | ||||
| Net | 52,710,480 | $ | 52,286,087 | |||||
The depreciation expense were $4,199 and $1,623 for the years ended December 31, 2014 and 2013.
| 5. | TRADE FINANCING LOANS |
The Company has executed short term accounts receivables factoring agreements with the banks. The bank would advance the Company a contracted percentage of the invoices factored up front and charge a contracted interest fee at average rate of 2%-4% based on the percentage advanced. When the outstanding accounts receivable invoice is collected, the advanced amount plus any accrued interest are repaid. The Company has also purchased insurance for the full invoiced amount.
The outstanding amount of trade financing loans were $0 and $1,893,264 as of June 30, 2015 and December 31, 2014, respectively.
The interest expenses were $1,367 and $345,118 for the six months ended June 30, 2015 and 2014, respectively.
| 6. | RELATED PARTY TRANSACTIONS |
The Company received advances from its owners from time to time as working capital to fund for its operations. These advances are due on demand, unsecured and non-interest bearing.
The Company has an outstanding payable amount of $1,560 and $1,548 to Mr. Yang Yuan Xi, the Company’s legal representative, as of June 30, 2015 and December 31, 2014, respectively.
| 7. | STOCKHOLDERS' EQUITY |
The Company is authorized to issue 1,000,000 shares of common stock at HK$1.00 (approximately US$0.12903) par value.
| 104 |
On October 20, 2009, the Company issued 10,000 shares of its common stock at HK$1.00 per share for a total of HK$10,000 (approximately US$1,290) which remains unpaid as of June 30, 2015.
Marvel’s shareholder has paid expenses on behalf of the Company that are recorded as contribution to paid-in capital. The amounts contributed to paid-in capital were $0 and $0 for the six months ended June 30, 2015 and 2014, respectively.
| 8. | GOVERNMENT CONTRIBUTION PLAN |
Pursuant to the laws applicable to PRC law, the Company is required to participate in a government-mandated multi-employer defined contribution plan pursuant to which certain retirement, medical and other welfare benefits are provided to employees. Chinese labor regulations require the Company to pay to the local labor bureau a monthly contribution at a stated contribution rate based on the monthly basic compensation of qualified employees. The relevant local labor bureau is responsible for meeting all retirement benefit obligations; the Company has no further commitments beyond its monthly contribution.
| 9. | STATUTORY RESERVE |
Pursuant to the laws applicable to the PRC, the Company must make appropriations from after-tax profit to the non-distributable “statutory surplus reserve fund”. Subject to certain cumulative limits, the “statutory surplus reserve fund” requires annual appropriations of 10% of after-tax profit until the aggregated appropriations reach 50% of the registered capital (as determined under accounting principles generally accepted in the PRC ("PRC GAAP") at each year-end). For foreign invested enterprises and joint ventures in the PRC, annual appropriations should be made to the “reserve fund”. For foreign invested enterprises, the annual appropriation for the “reserve fund” cannot be less than 10% of after-tax profits until the aggregated appropriations reach 50% of the registered capital (as determined under PRC GAAP at each year-end). If the Company has accumulated loss from prior periods, the Company is able to use the current period net income after tax to offset against the accumulate loss.
The PRC regulations also restrict the ability of the Company to make dividend and other payments to offshore entities or individuals. The PRC legal restrictions permit payments of dividend by the Company only out of its accumulated after-tax profits, if any, determined in accordance with PRC GAAP and regulations. Any limitations on the ability of the Company to transfer funds could materially and adversely limit our ability to grow, make investments or acquisitions that could be beneficial to the Company’s business, pay dividends and otherwise fund and conduct the Company’s business.
| 10. | INCOME TAXES |
Marvel is established in Hong Kong and its income is subject to a 16% profit tax rate. However, Marvel did not earn any income derived in Hong Kong, and therefore were not subject to Hong Kong Profits Tax.
Liaoning Fuda established in China and its income is subject to income tax rate of 25%. But has received an income tax holiday from the government for three years that will expire in 2015.
The reconciliation of effective income tax rate as follows:
| For the Six months Ended | ||||||||
| June 30, | June 30, | |||||||
| 2015 | 2014 | |||||||
| PRC Statutory income tax rate | 25 | % | 25 | % | ||||
| Less: Income tax holiday | -25 | % | -25 | % | ||||
| Total | - | - | ||||||
| 105 |
The provision for income tax on earnings as follows:
| For the Six months Ended | ||||||||
| June 30, | June 30, | |||||||
| 2015 | 2014 | |||||||
| PRC income tax | 3,227,008 | 2,367,378 | ||||||
| Less: Income tax subject to tax holiday | (3,226,490 | ) | (2,367,378 | ) | ||||
| Total | 518 | - | ||||||
| 11. | COMMITMENTS, CONTINGENCIES, RISKS AND UNCERTAINTIES |
The Company has executed various lease agreements for office space and dormitory. The total future minimum lease payments under the operating leases as follows:
| Periods | Amounts | |||
| For year ended December 31, 2015 | $ | 199,680 | ||
| For year ended December 31, 2016 | - | |||
| For year ended December 31, 2017 | - | |||
| For year ended December 31, 2018 | - | |||
| Thereafter | - | |||
| Total | $ | 199,680 | ||
Concentration and Credit risk
Cash deposits with banks are held in financial institutions in China, which are not federally insured deposit protection. Accordingly, the Company has a concentration of credit risk related to these uninsured bank deposits. The Company has not experienced any losses in such accounts and believes it is not exposed to significant credit risk in this area.
The Company depends on a limited number of suppliers for its products. Accordingly, the Company has a concentration risk related to these suppliers. Failure to maintain existing relationships with our suppliers or to establish new relationships in the future could also negatively affect our ability to obtain products sold to customers in a timely manner. If the Company is unable to obtain ample supply of products from existing suppliers or alternative sources of supply, the Company may be unable to satisfy our customers’ orders, which could materially and adversely affect revenues.
| 106 |
| 12. | CHANGE IN BUSINESS |
In 2014, the Company’s subsidiary has changed its business model focusing on local domestic market instead of international market. The significant impact due to the change in business model are as follows:
| For the Six Months Ended | ||||||||
| June 30, | June 30, | |||||||
| 2015 | 2014 | |||||||
| Cost of sales | ||||||||
| Custom duties charges | - | 194,291 | ||||||
| Freight and courier | 163 | 532,942 | ||||||
| Other cost of sales | 8,050,669 | 9,116,991 | ||||||
| Total | 8,050,832 | 9,844,224 | ||||||
| Selling, general and administrative expenses | ||||||||
| Insurance | - | 336,286 | ||||||
| Employees’ wages and salaries | 194,549 | 279,457 | ||||||
| Other selling, general and administrative expenses | 137,908 | 256,546 | ||||||
| Total | 332,457 | 872,289 | ||||||
| 13. | SUBSEQUENT EVENTS |
On September 24, 2015, the Company executed an agreement and plan of reorganization with Fuda Group (USA) Corporation (“Fuda”) whereby the shareholders the Company agreed to transfer to Fuda at the Closing 10,000 shares of ordinary shares of the Company, HK$1.00 par value per share, in exchange for an aggregate of 62,000,000 shares of voting common stock of Fuda, $0.0001 par value per share. Upon completion of the share exchange the Company will become a subsidiary of Fuda.
| 107 |
REPORT OF INDEPENDENT REGISTERED PUBLIC ACCOUNTING FIRM
To the Board of Directors and Stockholders of Fuda Gold (UK) Limited:
We have audited the accompanying balance sheet of Fuda Gold (UK) Limited (“the Company”) as of June 30, 2015 and the related statement of operations, stockholders’ equity (deficit) and cash flows for the year then ended. These financial statements are the responsibility of the Company's management. Our responsibility is to express an opinion on these financial statements based on our audit.
We conducted our audit in accordance with standards of the Public Company Accounting Oversight Board (United States). Those standards require that we plan and perform the audit to obtain reasonable assurance about whether the financial statements are free of material misstatement. An audit includes examining, on a test basis, evidence supporting the amounts and disclosures in the financial statements, assessing the accounting principles used and significant estimates made by management, as well as evaluating the overall financial statement presentation. We believe that our audit provides a reasonable basis for our opinion.
In our opinion, the financial statement referred to above present fairly, in all material respects, the financial position of Fuda Gold (UK) Limited, as of June 30, 2015, and the results of its operations and its cash flows for the year then ended, in conformity with generally accepted accounting principles in the United States of America.
The company is not required to have, nor were we engaged to perform, an audit of its internal control over financial reporting. Our audit included consideration of internal control over financial reporting as a basis for designing audit procedures that are appropriate in the circumstances, but not for the purpose of expressing an opinion on the Company's internal control over financial reporting. Accordingly, we express no such opinion.
The accompanying financial statements have been prepared assuming that the Company will continue as a going concern. As discussed in Note 4 to the financial statements, the Company’s significant operating losses raise substantial doubt about its ability to continue as a going concern. The financial statements do not include any adjustments that might result from the outcome of this uncertainty.
/s/ B F Borgers CPA PC
B F Borgers CPA PC
Lakewood, CO
September 30, 2015
| 108 |
FUDA GOLD (UK) LIMITED
BALANCE SHEETS
(Audited)
| June 30, | ||||
| 2015 | ||||
| Assets | ||||
| Current Assets | ||||
| Cash | $ | - | ||
| Total Current Assets | - | |||
| Total Assets | - | |||
| Liabilities | ||||
| Current Liabilities | ||||
| Accrued Liabilities | - | |||
| Total Current Liabilities | - | |||
| Total Liabilities | - | |||
| Stockholders' Deficit | ||||
| Common stock, 10 shares authorized; 10 shares at June 30, 2015, respectively | 16 | |||
| Additional paid-in capital | 76 | |||
| Subscription receivables | (16 | ) | ||
| Accumulated deficit | (76 | ) | ||
| Total Stockholders' Deficit | - | |||
| Total Liabilities and Stockholders' Deficit | $ | - | ||
The accompanying notes are an integral part of these financial statements
| 109 |
FUDA GOLD (UK) LIMITED
STATEMENT OF OPERATIONS
(Audited)
| From May 20, 2015 (Inception) | ||||
| to June 30, 2015 | ||||
| Revenues | $ | - | ||
| Cost of Sales | - | |||
| Gross Margin | - | |||
| Operating Expenses | ||||
| General & Administrative Expenses | 76 | |||
| Total Operating Expenses | 76 | |||
| Loss from operations | (76 | ) | ||
| Net Loss before Income Taxes | (76 | ) | ||
| Income Tax Benefit | - | |||
| Net Loss | $ | (76 | ) | |
| Net Loss per Common Share - Basic and Diluted | $ | (8 | ) | |
| Weighted Average Number of Common Shares Outstanding - Basic and Diluted | 10 | |||
The accompanying notes are an integral part of these financial statements
| 110 |
FUDA GOLD (UK) LIMITED
STATEMENT OF CASH FLOWS
(Audited)
| From May 20, 2015 (Inception) | ||||
| to June 30, 2015 | ||||
| Cash Flows from Operating Activities | ||||
| Net Loss | $ | (76 | ) | |
| Adjustment to reconcile net loss from operations: | ||||
| Expenses paid by stockholder and contributed as capital | 76 | |||
| Changes in Operating Assets and Liabilities | ||||
| Net Cash Used in Operating Activities | - | |||
| Effect of exchange rate changes | - | |||
| Net Increase (Decrease) in Cash | - | |||
| Cash at Beginning of Period | - | |||
| Cash at End of Period | $ | - | ||
The accompanying notes are an integral part of these financial statements
| 111 |
FUDA GOLD (UK) LIMITED
STATEMENTS OF STOCKHOLDERS' DEFICIT
From May 20, 2015 (Inception) to June 30, 2015
(Audited)
| Common Stock | Additional | Subscription | Accumulated | Total Stockholders | ||||||||||||||||||||
| Shares | Amount | Paid-In Capital | Receivables | Deficit | Deficit | |||||||||||||||||||
| Balance, May 20, 2015 (Inception) | - | $ | - | $ | - | $ | - | $ | - | $ | - | |||||||||||||
| Issuance of common stock | 10 | 16 | (16 | ) | - | |||||||||||||||||||
| Expenses paid by stockholder and contributed as capital | 76 | 76 | ||||||||||||||||||||||
| Net (loss) for the period | (76 | ) | (76 | ) | ||||||||||||||||||||
| Balance, June 30, 2015 | 10 | 16 | 76 | (16 | ) | (76 | ) | - | ||||||||||||||||
The accompanying notes are an integral part of these financial statements
| 112 |
FUDA GOLD (UK) LIMITED
Notes to Condensed Financial Statements
NOTE 1 - NATURE OF OPERATIONS
Fuda Gold (UK) Limited (the “Company”) was incorporated on May 20, 2015 under the laws of England and Wales. The Company is established to engage in any lawful corporate undertaking, including, but not limited to, selected mergers and acquisitions. The Company has no operations since inception to date. The Company will attempt to locate and negotiate with a business entity for the combination of that target company with the Company. The combination will normally take the form of a merger, stock-for-stock exchange or stock-for-assets exchange.
NOTE 2 - SUMMARY OF SIGNIFICANT ACCOUNTING POLICIES
Basis of presentation
The condensed financial statements of the Company have been prepared in accordance with generally accepted accounting principles in the United States of America (“US GAAP”). This basis of accounting involves the application of accrual accounting and consequently, revenues and gains are recognized when earned, and expenses and losses are recognized when incurred.
Use of estimates
The preparation of condensed financial statements in conformity with GAAP requires management to make estimates and assumptions that affect the reported amounts of assets and liabilities and disclosure of contingent assets and liabilities at the date of the condensed financial statements, and the reported amounts of revenues and expenses during the reporting periods. Actual results could differ from those estimates.
Cash and cash equivalence
Cash and cash equivalents include cash on hand and on deposit at banking institutions as well as all highly liquid short-term investments with original maturities of 90 days or less. The Company did not have cash or cash equivalents as of June 30, 2015.
Income Taxes
The Company is established in England and its income is subject to 20% tax rate.
Under ASC 740, "Income Taxes," deferred tax assets and liabilities are recognized for the future tax consequences attributable to temporary differences between the financial statement carrying amounts of existing assets and liabilities and their respective tax bases. Deferred tax assets and liabilities are measured using enacted tax rates expected to apply to taxable income in the years in which those temporary differences are expected to be recovered or settled. Valuation allowances are established when it is more likely than not that some or all of the deferred tax assets will not be realized. As of June 30, 2015, there were no deferred taxes due to the uncertainty of the realization of net operating loss or carry forward prior to expiration.
Comprehensive Income (Loss)
The Company follows the provisions of the Financial Accounting Standards Board (the “FASB”) Accounting Standards Codification (“ASC”) 220 “Reporting Comprehensive Income”, and establishes standards for the reporting and display of comprehensive income, its components and accumulated balances in a full set of general purpose financial statements. The Company’s comprehensive income (loss) consist of net income (loss) and foreign currency translation adjustments.
Foreign Currency Translation
The functional currency of the Company is the British Pounds (“GBP”).
| 113 |
The reporting currency of the Company is the US Dollar (“US$”).
Transactions in currencies other than the entity’s functional currency are recorded at the rates of exchange prevailing on the date of the transaction. At the end of each reporting period, monetary items denominated in foreign currencies are translated at the rates prevailing at the end of the reporting periods. Exchange differences arising on the settlement of monetary items and on translation of monetary items at period-end are included in income statement of the period.
For the purpose of presenting these financial statements, the Company’s assets and liabilities are expressed in US$ at the exchange rate on the balance sheet date, stockholder’s equity accounts are translated at historical rates, and income and expense items are translated at the weighted average exchange rate during the period. The resulting translation adjustments are reported under accumulated other comprehensive income in the stockholder’s equity section of the balance sheets.
Exchange rates used for translation as follows:
| June 30, | ||||
| GBP to US$ | 2015 | |||
| Period end spot rate | 1.5721 | |||
| Average periodic rate | 1.5550 | |||
Revenue recognition
The Company recognizes revenue in accordance with Financial Accounting Standards Board Accounting Standards Codification ("ASC") No. 605, Revenue Recognition. In all cases, revenue is recognized only when the price is fixed and determinable, persuasive evidence of an arrangement exists, the service is performed and collectability of the resulting receivable is reasonably assured. The Company did not generate any revenues since inception.
Fair value of financial instruments
The Company follows guidance for accounting for fair value measurements of financial assets and financial liabilities and for fair value measurements of nonfinancial items that are recognized or disclosed at fair value in the condensed financial statements (unaudited) on a recurring basis. Additionally, the Company adopted guidance for fair value measurement related to nonfinancial items that are recognized and disclosed at fair value in the condensed financial statements (unaudited) on a nonrecurring basis. The guidance establishes a fair value hierarchy that prioritizes the inputs to valuation techniques used to measure fair value. The hierarchy gives the highest priority to unadjusted quoted prices in active markets for identical assets or liabilities (Level 1 measurements) and the lowest priority to measurements involving significant unobservable inputs (Level 3 measurements). The three levels of the fair value hierarchy are as follows:
- Level 1 inputs are quoted prices (unadjusted) in active markets for identical assets or liabilities that the Company has the ability to access at the measurement date.
- Level 2 inputs are inputs other than quoted prices included within Level 1 that are observable for the asset or liability, either directly or indirectly.
- Level 3 inputs are unobservable inputs for the asset or liability.
The carrying amounts of financial assets such as cash approximate their fair values because of the short maturity of these instruments.
| 114 |
NOTE 4 - GOING CONCERN
The Company has not yet generated any revenue since inception to date.
The Company had working capital of $0 and an accumulated deficit of $(76) as of June 30, 2015. The Company's continuation as a going concern is dependent on its ability to generate sufficient cash flows from operations to meet its obligations and/or obtain additional financing from its members or other sources, as may be required. The accompanying condensed financial statements have been prepared assuming that the Company will continue as a going concern; however, the above condition raises substantial doubt about the Company's ability to do so. The condensed financial statements do not include any adjustments to reflect the possible future effects on the recoverability and classification of assets or the amounts and classifications of liabilities that may result should the Company be unable to continue as a going concern.
In order to maintain its current level of operations, the Company will require additional working capital from either cash flow from operations or from the sale of its equity. However, the Company currently has no commitments from any third parties for the purchase of its equity. If the Company is unable to acquire additional working capital, it will be required to significantly reduce its current level of operations.
NOTE 5 - RECENT ACCOUNTING PRONOUNCEMENTS
In August, 2014, the Financial Accounting Standards Board ("FASB") issued Accounting Standards Update (ASU) No. 2014-15, Presentation of Financial Statements-Going Concern (Subtopic 205-40), which now requires management to evaluate whether there are conditions or events, considered in the aggregate, that raise substantial doubt about the entity's ability to continue as a going concern within one year after the date the financial statements are issued. If conditions or events raise substantial doubt about an entity's ability to continue as a going concern, and substantial doubt is not alleviated after consideration of management's plans, additional disclosures are required. The amendments in this update are effective for the annual period ending after December 15, 2016, and for annual periods and interim periods thereafter. Early application is permitted. These requirements were previously included within auditing standards and federal securities law, but are now included within U.S. GAAP. We are currently assessing the impact of the adoption of ASU No. 2014-15 on our financial statements and disclosures.
In June, 2014, the FASB issued ASU No. 2014-10, Development Stage Entities (Topic 915) - Elimination of Certain Financial Reporting Requirements, Including an Amendment to Variable Interest Entities Guidance in Topic 810, Consolidation, which eliminates the concept of a development stage entity (DSE) in its entirety from current accounting guidance. We have elected early adoption of this standard, which eliminates the designation of DSEs and the requirement to disclose results of operations and cash flows since inception. We do not believe the adoption of ASU No. 2014-10 will have significant impact on our financial statements and disclosures.
NOTE 6 - STOCKHOLDERS' EQUITY
The Company is authorized to issue 10 shares of common stock at GBP1.00 at par value per share.
On May 20, 2015, the Company issued 10 shares of its common stock at GBP1 per share for a total of GPB10 (US$16) which remains unpaid as of June 30, 2015
The Company’s shareholder has paid expenses on behalf of the Company that are recorded as contribution to paid-in capital.
NOTE 7 – SUBSEQUENT EVENTS
On September 24, 2015, the Company executed “Agreement and plan of reorganization” agreement with Fuda Group (USA) Corporation (“Fuda”) whereby the shareholders the Company agreed to transfer to Fuda at the Closing, 10 shares of ordinary shares of the Company, GBP1.00 par value per share, in exchange for an aggregate of 50,000,000 shares of voting common stock of Fuda, $0.0001 par value per share. Upon completion of the share exchange on September 24, the Company will become a subsidiary of Fuda.
| 115 |
Unaudited Pro-Forma Condensed Combined Financial Information
The accompanying unaudited pro-forma condensed financial information have been prepared to present the balance sheet and statements of operations of Fuda Group (USA) Corp. (the “Company” or “Fuda US”), to indicate how the consolidated financial statements of the Company might have looked like if the acquisition of Marvel Investment (“Marvel”) and Fuda Gold (UK) Limited (“Fuda UK”) transactions related to the acquisition had occurred as of the beginning of the periods presented.
The unaudited pro-forma condensed combined balance sheet as of June 30, 2015 and December 31, 2014 are presented as if the acquisition of Marvel had occurred on June 30, 2015 and on December 31, 2014, respectively.
The unaudited pro-forma condensed combined statements of operations for the six months ended June 30, 2015, and year ended December 31, 2014, are presented as if the acquisition of Marvel and Fuda UK had occurred on December 31, 2014 and were carried forward through each of the aforementioned periods presented.
The pro-forma condensed financial statements should be read in conjunction with a reading of the historical financial statements and accompanying notes of the Company included in the Annual Report on Form 10-K for the fiscal year ended December 31, 2014, and the Quarterly Report on Form 10-Q for the quarterly period ended June 30, 2015, and of Liaoning Fuda Mining Co, Ltd, Marvel and Fuda UK included in this Form 8-K for the year ended December 31, 2014 and the six months ended June 30, 2015.
These pro-forma condensed financial statements are presented for illustrative purposes only and are not intended to be indicative of actual consolidated financial position and consolidated results of operations had the purchase been in effect during the periods presented, or of consolidated financial condition or consolidated results of operations that may be reported in the future.
Note the pro-forma adjustments contained in the pro-forma condensed financial statements relate to the assumptions of all prior and existing liabilities of the Company upon consummation of the purchase.
| 116 |
FUDA GROUP (USA) CORP
PRO-FORMA CONSOLIDATED BALANCE SHEETS
December 31, 2014
(Unaudited)
| Historical | Pro-Forma | |||||||||||||||||||||
| (a) | (b) | (c) | ||||||||||||||||||||
| Fuda (US) | Marvel and Subsidiary | Fuda (UK) | Adjustments | Notes | Consolidated | |||||||||||||||||
| Assets | ||||||||||||||||||||||
| Current Assets | ||||||||||||||||||||||
| Cash and cash equivalents | $ | - | $ | 466 | $ | - | $ | 466 | ||||||||||||||
| Accounts receivable, net | - | 260,624 | - | 260,624 | ||||||||||||||||||
| Inventory | - | 3,843 | - | 3,843 | ||||||||||||||||||
| Prepaid rent | - | 65,058 | - | 65,058 | ||||||||||||||||||
| Other receivables | - | 1,985,178 | - | 1,985,178 | ||||||||||||||||||
| Security deposits to suppliers | - | 436,014 | - | 436,014 | ||||||||||||||||||
| Total Current Assets | - | 2,751,183 | - | 2,751,183 | ||||||||||||||||||
| Land, property and equipment, net | - | 52,286,087 | - | 52,286,087 | ||||||||||||||||||
| Total Assets | - | 55,037,270 | - | 55,037,270 | ||||||||||||||||||
| Liabilities | ||||||||||||||||||||||
| Current Liabilities | ||||||||||||||||||||||
| Accounts payable and accrued expenses | - | 8,420,643 | - | 8,420,643 | ||||||||||||||||||
| Taxes payable | - | 224 | - | 224 | ||||||||||||||||||
| Due to related parties | - | 1,548 | - | 1,548 | ||||||||||||||||||
| Other payables | - | 11,472 | - | 11,472 | ||||||||||||||||||
| Trade financing loans | - | 1,893,264 | - | 1,893,264 | ||||||||||||||||||
| Total Current Liabilities | - | 10,327,151 | - | 10,327,151 | ||||||||||||||||||
| Total Liabilities | - | 10,327,151 | - | 10,327,151 | ||||||||||||||||||
| Commitments & Contingencies | - | - | - | - | ||||||||||||||||||
| Equity | ||||||||||||||||||||||
| Common stock, at par value | 2,000 | 1,290 | - | 6,000 | (d) | 13,000 | ||||||||||||||||
| (1,290 | ) | (d) | ||||||||||||||||||||
| 5,000 | (e) | |||||||||||||||||||||
| Additional paid-in capital | 712 | 9,563,015 | - | (6,000 | ) | (d) | 9,553,305 | |||||||||||||||
| (5,000 | ) | (e) | ||||||||||||||||||||
| 1,290 | (d) | |||||||||||||||||||||
| (712 | ) | (f) | ||||||||||||||||||||
| Discount on common stock | (2,000 | ) | (2,000 | ) | ||||||||||||||||||
| Subscription receivables | (1,290 | ) | - | (1,290 | ) | |||||||||||||||||
| Accumulated earnings (loss) | (712 | ) | 34,926,392 | - | 712 | 34,926,392 | ||||||||||||||||
| Accumulated other comprehensive income | - | 220,712 | - | 220,712 | ||||||||||||||||||
| Total Equity | - | 44,710,119 | - | 44,710,119 | ||||||||||||||||||
| Total Liabilities and Equity | $ | - | $ | 55,037,270 | $ | - | $ | 55,037,270 | ||||||||||||||
See accompanying notes to financial statements
Notes
| (a) | Derived from the unaudited balance sheet of Fuda Group (USA) Corp as of June 30, 2015 included in Form 10-Q filed on August 7, 2015. |
| (b) | Derived from the unaudited consolidated balance sheet of Marvel Investment Corporation Limited and Subsidiary as of June 30, 2015 included in this Form 8-K. |
| (c) | Fuda Gold (UK) Limited was incorporated on May 2015, no figures during the year ended December 31, 2014. |
| (d) | Fuda (US) to issue 62,000,000 shares of its common stock in exchange for 10,000 shares of Marvel. |
| (e) | Fuda Gold (UK) Limited was incorporated on May 2015, no figures during the year ended December 31, 2014. |
| (f) | Fuda (US)'s Year Ended December 31, 2014 Net Loss |
| 117 |
FUDA GROUP (USA) CORP
PRO-FORMA CONSOLIDATED STATEMENTS OF OPERATIONS AND COMPREHENSIVE INCOME
FOR THE YEAR ENDED DECEMBER 31, 2014
(Unaudited)
| Historical | Pro-Forma | |||||||||||||||||||||
| (a) | (b) | (c ) | ||||||||||||||||||||
| Fuda (US) | Marvel and Subsidiary | Fuda (UK) | Adjustments | Notes | Consolidated | |||||||||||||||||
| Revenues | $ | - | $ | 42,518,470 | $ | - | $ | 42,518,470 | ||||||||||||||
| Cost of sales | - | 14,270,331 | - | 14,270,331 | ||||||||||||||||||
| Gross margin | - | 28,248,139 | - | 28,248,139 | ||||||||||||||||||
| Operating expenses | ||||||||||||||||||||||
| Selling, general & administrative expenses | 712 | 1,230,324 | - | (712 | ) | (d) | 1,230,324 | |||||||||||||||
| Total operating expenses | 712 | 1,230,324 | - | 1,230,324 | ||||||||||||||||||
| Income (Loss) from operations | (712 | ) | 27,017,815 | - | 27,017,815 | |||||||||||||||||
| Other income (expenses) | ||||||||||||||||||||||
| Interest income | 152 | - | 152 | |||||||||||||||||||
| Interest expense | (346,262 | ) | - | (346,262 | ) | |||||||||||||||||
| Government rebate | 343,477 | - | 343,477 | |||||||||||||||||||
| Total other income (expenses) | - | (2,633 | ) | - | (2,633 | ) | ||||||||||||||||
| Net income (loss) before income taxes | (712 | ) | 27,015,182 | - | 27,015,182 | |||||||||||||||||
| Income tax benefit | - | - | - | - | ||||||||||||||||||
| Net income (loss) | $ | (712 | ) | $ | 27,015,182 | $ | - | $ | 27,015,182 | |||||||||||||
| Foreign currency translation adjustment | - | (73,259 | ) | - | (73,259 | ) | ||||||||||||||||
| Comprehensive income (loss) | $ | (712 | ) | $ | 26,941,923 | $ | - | $ | 26,941,923 | |||||||||||||
See accompanying notes to financial statements
Notes
| (a) | Derived from the unaudited balance sheet of Fuda Group (USA) Corp for the year ended December 31, 2014 included in Form 10-Q filed on August 7, 2015. |
| (b) | Derived from the unaudited consolidated balance sheet of Marvel Investment Corporation Limited for the year ended December 31, 2014 included in this Form 8-K. |
| (c) | Fuda Gold (UK) Limited was incorporated on May 2015, no figures during the year ended December 31, 2014. |
| (d) | Fuda (US)'s Year Ended December 31, 2014 Net Loss |
| 118 |
FUDA GROUP (USA) CORP
PRO-FORMA CONSOLIDATED BALANCE SHEETS
AT JUNE 30, 2015
(Unaudited)
| Historical | Pro-Forma | |||||||||||||||||||||
| (a) | (b) | (c) | ||||||||||||||||||||
| Fuda (US) | Marvel and Subsidiary | Fuda (UK) | Adjustments | Notes | Consolidated | |||||||||||||||||
| Assets | ||||||||||||||||||||||
| Current Assets | ||||||||||||||||||||||
| Cash and cash equivalents | $ | - | $ | 5,420,679 | $ | - | $ | 5,420,679 | ||||||||||||||
| Accounts receivable, net | - | 212,897 | - | 212,897 | ||||||||||||||||||
| Inventory | - | 918,011 | - | 918,011 | ||||||||||||||||||
| Prepaid rent | - | 27,057 | - | 27,057 | ||||||||||||||||||
| Other receivables | - | - | - | - | ||||||||||||||||||
| Security deposits to suppliers | - | 930,680 | - | 930,680 | ||||||||||||||||||
| Total Current Assets | - | 7,509,324 | - | 7,509,324 | ||||||||||||||||||
| Land, property and equipment, net | - | 52,710,480 | - | 52,710,480 | ||||||||||||||||||
| Total Assets | - | 60,219,804 | - | 60,219,804 | ||||||||||||||||||
| Liabilities | ||||||||||||||||||||||
| Current Liabilities | ||||||||||||||||||||||
| Accounts payable and accrued expenses | - | 3,201,507 | - | 3,201,507 | ||||||||||||||||||
| Taxes payable | - | 226 | - | 226 | ||||||||||||||||||
| Due to related parties | - | 1,560 | - | 1,560 | ||||||||||||||||||
| Other payables | - | 11,615 | - | 11,615 | ||||||||||||||||||
| Trade financing loans | - | - | - | - | ||||||||||||||||||
| Advances from customers | 121,698 | 121,698 | ||||||||||||||||||||
| Total Current Liabilities | - | 3,336,606 | - | 3,336,606 | ||||||||||||||||||
| Total Liabilities | - | 3,336,606 | - | 3,336,606 | ||||||||||||||||||
| Commitments & Contingencies | - | - | - | - | ||||||||||||||||||
| Equity | ||||||||||||||||||||||
| Common stock, at par value | 30,200 | 1,290 | 16 | 6,000 | (d) | 41,200 | ||||||||||||||||
| (1,290 | ) | (d) | ||||||||||||||||||||
| 5,000 | (e) | |||||||||||||||||||||
| (16 | ) | (e) | ||||||||||||||||||||
| Additional paid-in capital | 1,331 | 9,563,015 | 76 | (6,000 | ) | (d) | 9,553,321 | |||||||||||||||
| (5,000 | ) | (e) | ||||||||||||||||||||
| 1,290 | (d) | |||||||||||||||||||||
| 16 | (e) | |||||||||||||||||||||
| (712 | ) | (f) | ||||||||||||||||||||
| (695 | ) | (g) | ||||||||||||||||||||
| (1,407 | ) | (h) | ||||||||||||||||||||
| Discount on common stock | (30,200 | ) | (30,200 | ) | ||||||||||||||||||
| Subscription receivables | (1,290 | ) | (16 | ) | (1,306 | ) | ||||||||||||||||
| Accumulated earnings (loss) | (1,331 | ) | 46,664,144 | (76 | ) | 1,407 | (h) | 46,664, 144 | ||||||||||||||
| Accumulated other comprehensive income | - | 656,039 | - | 656,039 | ||||||||||||||||||
| Total Equity | - | 56,883,198 | - | 56,883,198 | ||||||||||||||||||
| Total Liabilities and Equity | $ | - | $ | 60,219,804 | $ | - | $ | 60,219,804 | ||||||||||||||
| $ | - | $ | - | $ | - | - | ||||||||||||||||
See accompanying notes to financial statements
Notes
| (a) | Derived from the unaudited balance sheet of Fuda Group (USA) Corp as of June 30, 2015 included in Form 10-Q filed on August 7, 2015. |
| (b) | Derived from the unaudited consolidated balance sheet of Marvel Investment Corporation Limited as of June 30, 2015 included in this Form 8-K. |
| (c) | Derived from the unaudited balance sheet of Fuda Gold (UK) Limited and its Subsidiary as of June 30, 2015 included in this Form 8-K. |
| (d) | Fuda (US) to issue 62,000,000 shares of its common stock in exchange for 10,000 shares of Marvel. |
| (e) | Fuda (US) to issue 50,000,000 shares of its common stock in exchange for 10 shares of Fuda (UK). |
| (f) | Fuda (US)'s Year Ended December 31, 2014 Net Loss |
| (g) | Fuda (US) and Fuda (UK) Six Months Ended June 30, 2015 Net Loss |
| (h) | Marvel's Year Ended December 31, 2014 and Six Months Ended June 30, 2015 Net Loss |
| 119 |
FUDA GROUP (USA) CORP
PRO-FORMA CONSOLIDATED STATEMENTS OF OPERATIONS AND COMPREHENSIVE INCOME
FOR THE SIX MONTHS ENDED JUNE 30, 2015
(Unaudited)
| Historical | Pro-Forma | |||||||||||||||||||||
| (a) | (b) | (c) | ||||||||||||||||||||
| Fuda (US) | Marvel and subsidiary | Fuda (UK) | Adjustments | Notes | Consolidated | |||||||||||||||||
| Revenues | $ | - | $ | 20,088,354 | $ | - | $ | 20,088,354 | ||||||||||||||
| Cost of sales | - | 8,050,832 | - | 8,050,832 | ||||||||||||||||||
| Gross margin | - | 12,037,522 | - | 12,037,522 | ||||||||||||||||||
| Operating expenses | ||||||||||||||||||||||
| Selling, general & administrative expenses | 619 | 332,457 | 76 | (695 | ) | (d) | 332,457 | |||||||||||||||
| Total operating expenses | 619 | 332,378 | 76 | 332,378 | ||||||||||||||||||
| Income (Loss) from operations | (619 | ) | 11,705,065 | (76 | ) | 11,705, 065 | ||||||||||||||||
| Other income (expenses) | ||||||||||||||||||||||
| Interest income | - | - | - | |||||||||||||||||||
| Interest expense | (1,339 | ) | - | (1,339 | ) | |||||||||||||||||
| Government rebate | 34,544 | - | 34,544 | |||||||||||||||||||
| Total other income (expenses) | - | 33,205 | - | 33,205 | ||||||||||||||||||
| Net income (loss) before income taxes | (619 | ) | 11,738,270 | (76 | ) | 11,738,270 | ||||||||||||||||
| Income tax benefit | - | (518 | ) | - | (518 | ) | ||||||||||||||||
| Net income (loss) | $ | (619 | ) | $ | 11,737,752 | $ | (76 | ) | $ | 11,737,752 | ||||||||||||
| Foreign currency translation adjustment | - | 435,327 | - | 435,327 | ||||||||||||||||||
| Comprehensive income (loss) | $ | (619 | ) | $ | 12,173,079 | $ | (76 | ) | $ | 12,173,079 | ||||||||||||
See accompanying notes to financial statements
Notes
| (a) | Derived from the unaudited balance sheet of Fuda Group (USA) Corp for the year ended December 31, 2014 included in Form 10-Q filed on August 7, 2015. |
| (b) | Derived from the unaudited consolidated balance sheet of Marvel Investment Corporation Limited and its Subsidiary for the year ended December 31, 2014 included in this Form 8-K. |
| (c) | Fuda Gold (UK) Limited was incorporated on May 2015, no figures during the year ended December 31, 2014. |
| (d) | Fuda (US) and Fuda (UK) Six Months Ended June 30, 2015 Net Loss |
| 120 |
UNAUDITED CONDENSED FINANCIAL STATEMENTS
| Unaudited Condensed Financial Statements | 122-124 |
| Notes to Unaudited Condensed Financial Statements | 125-130 |
| 121 |
CONDENSED BALANCE SHEETS
| June 30, | December 31, | |||||||
| 2015 | 2014 | |||||||
| (unaudited) | (audited) | |||||||
| ASSETS | ||||||||
| Current assets | ||||||||
| Total assets | $ | - | $ | - | ||||
| LIABILITIES AND STOCKHOLDERS' EQUITY | ||||||||
| Current liabilities | ||||||||
| Total liabilities | $ | - | $ | - | ||||
| Stockholders' equity | ||||||||
| Preferred stock, $0.0001 par value, 20,000,000 shares authorized; none issued and outstanding as of June 30, 2015 and December 31, 2014 | - | - | ||||||
| Common stock, $0.0001 par value, 480,000,000 shares authorized; 302,000,000 shares and 20,000,000 shares issued and outstanding as of June 30, 2015 and December 31, 2014, respectively | $ | 30,200 | $ | 2,000 | ||||
| Discount on Common Stock | $ | (30,200 | ) | $ | (2,000 | ) | ||
| Additional paid-in capital | $ | 1,331 | $ | 712 | ||||
| Accumulated deficit | $ | (1,331 | ) | $ | (712 | ) | ||
| Total stockholders' equity | $ | - | $ | - | ||||
| Total liabilities and stockholders' equity | $ | - | $ | - | ||||
The accompanying notes are an integral part of these unaudited condensed financial statements.
| 122 |
FUDA GROUP (USA) CORPORATION
UNAUDITED CONDENSED STATEMENTS OF OPERATIONS
| For the three | For the six | |||||||
| months ended | months ended | |||||||
| June 30, 2015 | June 30, 2015 | |||||||
| Revenue | $ | - | $ | - | ||||
| Cost of revenue | $ | - | $ | - | ||||
| Gross profit | $ | - | $ | - | ||||
| Operating expenses | $ | - | $ | 619 | ||||
| Operating loss | $ | - | $ | (619 | ) | |||
| Loss before income taxes | $ | - | $ | (619 | ) | |||
| Income tax expense | $ | - | $ | - | ||||
| Net loss | $ | - | $ | (619 | ) | |||
| Loss per share - basic and diluted | $ | - | $ | (0.00 | ) | |||
| Weighted average shares- basic and diluted | 302,000,000 | 221,991,667 | ||||||
The accompanying notes are an integral part of these unaudited condensed financial statements.
| 123 |
FUDA GROUP (USA) CORPORATION
UNAUDITED CONDENSED STATEMENT OF CASH FLOWS
| For the six | ||||
| months ending | ||||
| June 30, 2015 | ||||
| OPERATING ACTIVITIES | ||||
| Net loss | $ | (619 | ) | |
| Non-cash adjustments to reconcile net loss to net cash: | ||||
| Expenses paid for by stockholder and contributed as capital | $ | 619 | ||
| Changes in Operating Assets and Liabilities: | ||||
| Net cash used in operating activities | $ | - | ||
| Net increase in cash | $ | - | ||
| Cash, beginning of period | $ | - | ||
| Cash, end of period | $ | - | ||
| Supplemental cash flow information: | ||||
| Interest paid | $ | - | ||
| Income tax paid | $ | - | ||
The accompanying notes are an integral part of these unaudited condensed financial statements.
| 124 |
Notes to Unaudited Condensed Financial Statements
NOTE 1 - NATURE OF OPERATIONS
The Company was incorporated on September 25, 2014 under the laws of the state of Delaware to engage in any lawful corporate undertaking, including, but not limited to, selected mergers and acquisitions. The Company has been in the developmental stage since inception and its operations to date have been limited to issuing shares to its original shareholders. The Company will attempt to locate and negotiate with a business entity for the combination of that target company with the Company. The combination will normally take the form of a merger, stock-for-stock exchange or stock-for-assets exchange. In most instances the target company will wish to structure the business combination to be within the definition of a tax-free reorganization under Section 351 or Section 368 of the Internal Revenue Code of 1986, as amended. No assurances can be given that the Company will be successful in locating or negotiating with any target company. The Company has been formed to provide a method for a foreign or domestic private company to become a reporting company with a class of securities registered under the Securities Exchange Act of 1934.
On February 17, 2015, the Company changed its name from Spruce Valley Acquisition Corporation to Fuda Group (USA) Corporation (the "Company" or "Fuda Group") and filed the amendment with the State of Delaware. On February 17, 2015, the Company amended its certificate of incorporation to increase its authorized capitalization to an aggregate of 500,000,000 shares consisting of 480,000,000 shares of common stock and 20,000,000 shares of non-designated preferred stock and filed the amendment with the State of Delaware.
On February 23, 2015, the Company filed a Form 8-K to report a change of control by the following event: the Company redeemed an aggregate of 19,500,000 of the then 20,000,000 shares of outstanding stock at a redemption price of $.0001 per share for an aggregate redemption price of $1,950; the then officers and directors resigned; new officers and directors were appointed and elected; and the Company issued 301,500,000 shares of its common stock pursuant to Section 4(2) of the Securities Act of 1933 at par, representing 99.8% of the total outstanding 302,000,000 shares of common stock as follows:
| Liaoning Fuda Mining Co., LTD | 61,000,000 | |||
| Dandong Hao Han Mining Co., LTD | 58,000,000 | |||
| Xiaobin Wu | 51,500,000 | |||
| B. Square Pty LTD | 48,000,000 | |||
| JFL International Group Private Limited | 35,000,000 | |||
| Lina Wu | 35,000,000 | |||
| Lihua Sun | 13,000,000 |
NOTE 2 - BASIS OF PRESENTATION
The accompanying condensed balance sheet as of December 31, 2014, which has been derived from the Company's audited financial statements as of that date, and the unaudited condensed financial information of the Company as of June 30, 2015 and for the three and six months ended June 30, 2015, has been prepared in accordance with accounting principles generally accepted in the United States of America ("U.S. GAAP") for interim financial information and with the instructions to Form 10-Q and Article 8-03 of Regulation S-X. In the opinion of management, such financial information includes all adjustments considered necessary for a fair presentation of the Company's financial position at such date and the operating results and cash flows for such periods. Operating results for the interim period ended June 30, 2015 are not necessarily indicative of the results that may be expected for the entire year. Certain information and footnote disclosure normally included in financial statements in accordance with generally accepted accounting principles have been omitted pursuant to the rules of the United States Securities and Exchange Commission ("SEC"). These unaudited financial statements should be read in conjunction with our audited financial statements and accompanying notes included in the Company's Annual Report on Form 10-K for the year ended December 31, 2014 filed on April 14, 2015.
| 125 |
NOTE 3 - SUMMARY OF SIGNIFICANT ACCOUNTING POLICIES
USE OF ESTIMATES
The preparation of unaudited condensed financial statements in conformity with GAAP requires management to make estimates and assumptions that affect the reported amounts of assets and liabilities and disclosure of contingent assets and liabilities at the date of the condensed financial statements, and the reported amounts of revenues and expenses during the reporting periods. Actual results could differ from those estimates.
CASH
Cash and cash equivalents include cash on hand and on deposit at banking institutions as well as all highly liquid short-term investments with original maturities of 90 days or less. The Company did not have cash or cash equivalents as of June 30, 2015 and December 31, 2014.
CONCENTRATION OF RISK
Financial instruments that potentially subject the Company to concentrations of credit risk consist principally of cash. The Company places its cash with high quality banking institutions. The Company did not have cash balances in excess of the Federal Deposit Insurance Corporation limit as of June 30, 2015.
INCOME TAXES
Under ASC 740, "Income Taxes," deferred tax assets and liabilities are recognized for the future tax consequences attributable to temporary differences between the financial statement carrying amounts of existing assets and liabilities and their respective tax bases. Deferred tax assets and liabilities are measured using enacted tax rates expected to apply to taxable income in the years in which those temporary differences are expected to be recovered or settled. Valuation allowances are established when it is more likely than not that some or all of the deferred tax assets will not be realized.
As of June 30, 2015 there were no deferred taxes due to the uncertainty of the realization of net operating loss or carry forward prior to expiration.
REVENUE RECOGNITION POLICY
The Company recognizes revenue in accordance with Financial Accounting Standards Board Accounting Standards Codification ("ASC") No. 605, Revenue Recognition. In all cases, revenue is recognized only when the price is fixed and determinable, persuasive evidence of an arrangement exists, the service is performed and collectability of the resulting receivable is reasonably assured.
LOSS PER COMMON SHARE
Basic loss per common share excludes dilution and is computed by dividing net loss by the weighted average number of common shares outstanding during the period. Diluted loss per common share reflect the potential dilution that could occur if securities or other contracts to issue common stock were exercised or converted into common stock or resulted in the issuance of common stock that then shared in the loss of the entity. As of June 30, 2015, there are no outstanding dilutive securities.
| 126 |
FAIR VALUE OF FINANCIAL INSTRUMENTS
The Company follows guidance for accounting for fair value measurements of financial assets and financial liabilities and for fair value measurements of nonfinancial items that are recognized or disclosed at fair value in the unaudited condensed financial statements on a recurring basis. Additionally, the Company adopted guidance for fair value measurement related to nonfinancial items that are recognized and disclosed at fair value in the unaudited condensed financial statements on a nonrecurring basis. The guidance establishes a fair value hierarchy that prioritizes the inputs to valuation techniques used to measure fair value. The hierarchy gives the highest priority to unadjusted quoted prices in active markets for identical assets or liabilities (Level 1 measurements) and the lowest priority to measurements involving significant unobservable inputs (Level 3 measurements). The three levels of the fair value hierarchy are as follows:
- Level 1 inputs are quoted prices (unadjusted) in active markets for identical assets or liabilities that the Company has the ability to access at the measurement date.
- Level 2 inputs are inputs other than quoted prices included within Level 1 that are observable for the asset or liability, either directly or indirectly.
- Level 3 inputs are unobservable inputs for the asset or liability. The carrying amounts of financial assets such as cash approximate their fair values because of the short maturity of these instruments.
NOTE 4 - GOING CONCERN
The Company has not yet generated any revenue since inception to date and has sustained operating losses during the period ended June 30, 2015.
The Company had working capital of $0 and an accumulated deficit of $1,331 as of June 30, 2015. The Company's continuation as a going concern is dependent on its ability to generate sufficient cash flows from operations to meet its obligations and/or obtain additional financing from its members or other sources, as may be required.
The accompanying unaudited condensed financial statements have been prepared assuming that the Company will continue as a going concern; however, the above condition raises substantial doubt about the Company's ability to do so. The unaudited condensed financial statements do not include any adjustments to reflect the possible future effects on the recoverability and classification of assets or the amounts and classifications of liabilities that may result should the Company be unable to continue as a going concern. In order to maintain its current level of operations, the Company will require additional working capital from either cash flow from operations or from the sale of its equity. However, the Company currently has no commitments from any third parties for the purchase of its equity. If the Company is unable to acquire additional working capital, it will be required to significantly reduce its current level of operations.
| 127 |
NOTE 5 - RECENT ACCOUNTING PRONOUNCEMENTS
On June 12, 2015, the Financial Accounting Standards Board ("FASB") issued Accounting Standards Update (ASU) No. 2015-10-Technical Corrections and Improvements. The amendments in this Update cover a wide range of Topics in the Codification. The amendments in this Update represent changes to make minor corrections or minor improvements to the Codification that are not expected to have a significant effect on current accounting practice or create a significant administrative cost to most entities. This Accounting Standards Update is the final version of Proposed Accounting Standards Update 2014-240-Technical Corrections and Improvements, which has been deleted. Transition guidance varies based on the amendments in this Update. The amendments in this Update that require transition guidance are effective for all entities for fiscal years, and interim periods within those fiscal years, beginning after December 15, 2015. Early adoption is permitted, including adoption in an interim period. All other amendments will be effective upon the issuance of this Update. Management is in the process of assessing the impact of this ASU on the Company's financial statements.
On May 21, 2015, the Financial Accounting Standards Board ("FASB") issued Accounting Standards Update (ASU) No. 2015-09 Financial Services Insurance (Topic 944): Disclosures about Short-Duration Contracts. The objectives of the amendments in this Update are to increase transparency of significant estimates made in measuring the liability for unpaid claims and claim adjustment expenses, improve comparability through consistently disclosed information, and provide financial statements users with information to facilitate analysis of the amount, timing, and uncertainty of cash flows arising from contracts issued by insurance entities and the development of loss reserve estimates. For public business entities, effective for annual periods beginning after December 15, 2015, and interim periods within annual periods beginning after December 15, 2016. For all other entities, effective for annual periods beginning after December 15, 2016, and interim periods within annual periods beginning after December 15, 2017. Management is in the process of assessing the impact of this ASU on the Company's financial statements.
On May 12, 2015, the Financial Accounting Standards Board ("FASB") issued Accounting Standards Update (ASU) No. 2015-08 Business Combinations (Topic 805): Pushdown Accounting: Amendments to SEC Paragraphs Pursuant to Staff Accounting Bulletin No. 115. This Accounting Standards Update amends various SEC paragraphs pursuant to the issuance of Staff Accounting Bulletin No. 115. The amendments are effective upon issuance (May 12, 2015). Management is in the process of assessing the impact of this ASU on the Company's financial statements.
On May 1, 2015, the Financial Accounting Standards Board ("FASB") issued Accounting Standards Update (ASU) No. 2015-07 Fair Value Measurement (Topic 820): Disclosures for Investments in Certain Entities That Calculate Net Asset Value per Share (or Its Equivalent). Topic 820, Fair Value Measurement, permits a reporting entity, as a practical expedient, to measure the fair value of certain investments using the net asset value per share of the investment. Currently, investments valued using the practical expedient are categorized within the fair value hierarchy on the basis of whether the investment is redeemable with the investee at net asset value on the measurement date, never redeemable with the investee at net asset value, or redeemable with the investee at net asset value at a future date. To address the diversity in practice related to how certain investments measured at net asset value with future redemption dates are categorized, the amendments in this Update remove the requirement to categorize investments for which fair values are measured using the net asset value per share practical expedient. It also limits disclosures to investments for which the entity has elected to measure the fair value using the practical expedient. This Accounting Standards Update is the final version of Proposed Accounting Standards Update EITF-14B Fair Value Measurement Disclosures for Investments in Certain Entities that Calculate Net Asset Value per Share (or Its Equivalent) (Topic 820), which has been deleted. Effective for public business entities for fiscal years beginning after December 15, 2015, and interim periods within those fiscal years. For all other entities, the amendments in this Update are effective for fiscal years beginning after December 15, 2016, and interim periods within those fiscal years. A reporting entity should apply the amendments retrospectively to all periods presented. The retrospective approach requires that an investment for which fair value is measured using the net asset value per share practical expedient be removed from the fair value hierarchy in all periods presented in an entity's financial statements. Earlier application is permitted. Management is in the process of assessing the impact of this ASU on the Company's financial statements.
| 128 |
On April 30, 2015, the Financial Accounting Standards Board ("FASB") issued Accounting Standards Update (ASU) No. 2015-06 Earnings Per Share (Topic 260): Effects on Historical Earnings per Units of Master Limited Partnership Dropdown Transactions. Under Topic 260, Earnings Per Share, master limited partnerships (MLPs) apply the two-class method to calculate earnings per unit (EPU) because the general partner, limited partners, and incentive distribution rights holders each participate differently in the distribution of available cash. When a general partner transfers (or "drops down") net assets to a master limited partnership and that transaction is accounted for as a transaction between entities under common control, the statements of operations of the master limited partnership are adjusted retrospectively to reflect the dropdown transaction as if it occurred on the earliest date during which the entities were under common control. The amendments in this Update specify that for purposes of calculating historical EPU under the two-class method, the earnings (losses) of a transferred business before the date of a dropdown transaction should be allocated entirely to the general partner interest, and previously reported EPU of the limited partners would not change as a result of a dropdown transaction. Qualitative disclosures about how the rights to the earnings (losses) differ before and after the dropdown transaction occurs also are required. This Accounting Standards Update is the final version of Proposed Accounting Standards Update EITF-14A Earnings Per Share Effects on Historical Earnings per Unit of Master Limited Partnership Dropdown Transactions (Topic 260), which has been deleted. Effective for fiscal years beginning after December 15, 2015, and interim periods within those fiscal years. Earlier application is permitted. The amendments in this Update should be applied retrospectively for all financial statements presented. Management is in the process of assessing the impact of this ASU on the Company's financial statements.
On April 15, 2015, the Financial Accounting Standards Board ("FASB") issued Accounting Standards Update (ASU) No. 2015-05 Intangibles Goodwill and Other Internal-Use Software (Subtopic 350-40): Customer's Accounting for Fees Paid in a Cloud Computing Arrangement. The objective of the amendments in this Update is to address the concerns of stakeholders that the lack of guidance about a customer's accounting for fees in a cloud computing arrangement leads to unnecessary cost and complexity when evaluating the accounting for those fees, as well as some diversity in practice. The amendments in this Update will help entities evaluate the accounting for fees paid by a customer in a cloud computing arrangement by providing guidance as to whether an arrangement includes the sale or license of software. This Accounting Standards Update is the final version of Proposed Accounting Standards Update 2014-230 Intangibles Goodwill and Other Internal-Use Software (Subtopic 350-40), which has been deleted. Effective for annual periods, including interim periods within those annual periods, beginning after December 15, 2015. For all other entities, the amendments will be effective for annual periods beginning after December 15, 2015, and interim periods in annual periods beginning after December 15, 2016. Early adoption is permitted for all entities. Management is in the process of assessing the impact of this ASU on the Company's financial statements.
On April 15, 2015, the Financial Accounting Standards Board ("FASB") issued Accounting Standards Update (ASU) No. 2015-04 Compensation Retirement Benefits (Topic 715): Practical Expedient for the Measurement Date of an Employer's Defined Benefit Obligation and Plan Assets. The amendments in this Update would provide a practical expedient for employers with fiscal year-ends that do not fall on a month-end by permitting those employers to measure defined benefit plan assets and obligations as of the month-end that is closest to the entity's fiscal year-end. This Accounting Standards Update is the final version of Proposed Accounting Standards Update 2014-260 Compensation Retirement Benefits (Topic 715), which has been deleted. Effective for public business entities for financial statements issued for fiscal years beginning after December 15, 2015, and interim periods within those fiscal years. For all other entities, the amendments in this Update are effective for financial statements issued for fiscal years beginning after December 15, 2016, and interim periods within fiscal years beginning after December 15, 2017. Earlier application is permitted. Management is in the process of assessing the impact of this ASU on the Company's financial statements.
On April 7, 2015, the Financial Accounting Standards Board ("FASB") issued Accounting Standards Update (ASU) No. 2015-03 Interest Imputation of Interest (Subtopic 835-30): Simplifying the Presentation of Debt Issuance Costs. To simplify presentation of debt issuance costs, the amendments in this Update would require that debt issuance costs be presented in the balance sheet as a direct deduction from the carrying amount of debt liability, consistent with debt discounts or premiums. The recognition and measurement guidance for debt issuance costs would not be affected by the amendments in this Update. This Accounting Standards Update is the final version of Proposed Accounting Standards Update 2014-250 Interest Imputation of Interest (Subtopic 835-30), which has been deleted. For public business entities, the amendments in this Update are effective for financial statements issued for fiscal years beginning after December 15, 2015, and interim periods within those fiscal years. For all other entities, the amendments in this Update are effective for financial statements issued for fiscal years beginning after December 15, 2015, and interim periods within fiscal years beginning after December 15, 2016. Early adoption of the amendments in this Update is permitted for financial statements that have not been previously issued. Management is in the process of assessing the impact of this ASU on the Company's financial statements.
| 129 |
On February 18, 2015, the Financial Accounting Standards Board ("FASB") issued Accounting Standards Update (ASU) No. 2015-02 Consolidation (Topic 810): Amendments to the Consolidation Analysis. The amendments in this Update affect reporting entities that are required to evaluate whether they should consolidate certain legal entities. All legal entities are subject to reevaluation under the revised consolidation model. Specifically, the amendments: (1) Modify the evaluation of whether limited partnerships and similar legal entities are variable interest entities (VIEs) or voting interest entities; (2) Eliminate the presumption that a general partner should consolidate a limited partnership; (3) Affect the consolidation analysis of reporting entities that are involved with VIEs, particularly those that have fee arrangements and related party relationships; and (4) Provide a scope exception from consolidation guidance for reporting entities with interests in legal entities that are required to comply with or operate in accordance with requirements that are similar to those in Rule 2a-7 of the Investment Company Act of 1940 for registered money market funds. This Accounting Standards Update is the final version of Proposed Accounting Standards Update 2011- 220 Consolidation (Topic 810), which has been deleted. Effective for public business entities for fiscal years, and for interim periods within those fiscal years, beginning after December 15, 2015. For all other entities, the amendments in this Update are effective for fiscal years beginning after December 15, 2016, and for interim periods within fiscal years beginning after December 15, 2017. Early adoption is permitted, including adoption in an interim period. If an entity early adopts the amendments in an interim period, any adjustments should be reflected as of the beginning of the fiscal year that includes that interim period. A reporting entity may apply the amendments in this Update using a modified retrospective approach by recording a cumulative- effect adjustment to equity as of the beginning of the fiscal year of adoption. A reporting entity also may apply the amendments retrospectively. Management is in the process of assessing the impact of this ASU on the Company's financial statements.
In January 2015, the Financial Accounting Standards Board ("FASB") issued Accounting Standards Update (ASU) No. 2015-01 Income Statement Extraordinary and Unusual Items (Subtopic 225-20): Simplifying Income Statement Presentation by Eliminating the Concept of Extraordinary Items. The objective of this Update is to simplify the income statement presentation requirements in Subtopic 225-20 by eliminating the concept of extraordinary items. Extraordinary items are events and transactions that are distinguished by their unusual nature and by the infrequency of their occurrence. Eliminating the extraordinary classification simplifies income statement presentation by altogether removing the concept of extraordinary items from consideration. This Accounting Standards Update is the final version of Proposed Accounting Standards Update 2014-220 Income Statement Extraordinary Items (Subtopic 225-20), which has been deleted. Effective for fiscal years, and interim periods within those fiscal years, beginning after December 15, 2015. A reporting entity may apply the amendments prospectively. A reporting entity also may apply the amendments retrospectively to all prior periods presented in the financial statements. Early adoption is permitted provided that the guidance is applied from the beginning of the fiscal year of adoption. The effective date is the same for both public business entities and all other entities. Management is in the process of assessing the impact of this ASU on the Company's financial statements.
NOTE 6 STOCKHOLDERS' EQUITY
On September 25, 2014 the Company issued 20,000,000 founders common stock to two directors and officers of which 19,500,000 were redeemed on February 20, 2015.
On February 20, 2015, the Company redeemed an aggregate of 19,500,000 of the then 20,000,000 shares of outstanding stock at a redemption price of $.0001 per share for an aggregate redemption price of $1,950.
On February 21, 2015, the Company issued 301,500,000 shares of its common stock pursuant to Section 4(2) of the Securities Act of 1933 at par, representing 99.8% of the total outstanding 302,000,000 shares of common stock as follows:
| Liaoning Fuda Mining Co., LTD | 61,000,000 | |||
| Dandong Hao Han Mining Co., LTD | 58,000,000 | |||
| Xiaobin Wu | 51,500,000 | |||
| B. Square Pty LTD | 48,000,000 | |||
| JFL International Group Private Limited | 35,000,000 | |||
| Lina Wu | 35,000,000 | |||
| Lihua Sun | 13,000,000 |
The Company is authorized to issue 480,000,000 shares of common stock and 20,000,000 shares of preferred stock. As of June 30, 2015, 302,000,000 shares of common stock and no preferred stock were issued and outstanding.
| 130 |
CONDENSED FINANCIAL STATEMENTS
| Unauadited Condensed Financial Statements | 132-134 |
| Notes to Unaudited Condensed Financial Statements | 135-137 |
| 131 |
CONDENSED BALANCE SHEETS
| March 31, | December 31, | |||||||
| 2015 | 2014 | |||||||
| (unaudited) | (audited) | |||||||
| Stockholders' equity (deficit) | ||||||||
| Preferred stock, $0.0001 par value, 20,000,000 shares authorized; none issued and outstanding as of March 31, 2015 | - | - | ||||||
| Common stock, $0.0001 par value, 480,000,000 shares authorized; 302,000,000 shares issued and outstanding as of March 31, 2015 | 30,200 | 2,000 | ||||||
| Discount on Common Stock | (30,200 | ) | (2,000 | ) | ||||
| Additional paid-in capital | 1,331 | 712 | ||||||
| Accumulated deficit | (1,331 | ) | (712 | ) | ||||
| Total stockholders' equity (deficit) | - | - | ||||||
| Total liabilities and stockholders' equity (deficit) | $ | - | $ | - | ||||
The accompanying notes are an integral part of these unaudited condensed financial statements.
| 132 |
FUDA GROUP (USA) CORPORATION
UNAUDITED CONDENSED STATEMENT OF OPERATIONS
| For the three | ||||
| months ended | ||||
| March 31, 2015 | ||||
| Revenue | $ | - | ||
| Cost of revenue | - | |||
| Gross profit | - | |||
| Operating expenses | 619 | |||
| Operating loss | (619 | ) | ||
| Loss before income taxes | (619 | ) | ||
| Income tax expense | - | |||
| Net loss | $ | (619 | ) | |
| Loss per share - basic and diluted | $ | (0.00 | ) | |
| Weighted average shares-basic and diluted | 132,800,000 | |||
The accompanying notes are an integral part of these unaudited condensed financial statements.
| 133 |
FUDA GROUP (USA) CORPORATION
CONDENSED STATEMENT OF CASH FLOWS
(UNAUDITED)
| For the three | ||||
| months ended | ||||
| March 31, 2015 | ||||
| OPERATING ACTIVITIES | ||||
| Net loss | $ | (619 | ) | |
| Non-cash adjustments to reconcile net loss to net cash: | ||||
| Expenses paid for by stockholder and contributed as capital | 619 | |||
| Changes in Operating Assets and Liabilities: | ||||
| Accrued liability | - | |||
| Net cash provided by (used in) operating activities | - | |||
| Proceeds from issuance of common stock | - | |||
| Proceeds from stockholders contribution | - | |||
| Net cash provided by financing activities | - | |||
| Net increase in cash | - | |||
| Cash, beginning of period | - | |||
| Cash, end of period | $ | - | ||
The accompanying notes are an integral part of these unaudited condensed financial statements.
| 134 |
Notes to Unaudited Condensed Financial Statements
NOTE 1 NATURE OF OPERATIONS
NATURE OF OPERATIONS
The Company Company was incorporated on September 25, 2014 under the laws of the state of Delaware to engage in any lawful corporate undertaking, including, but not limited to, selected mergers and acquisitions. The Company has been in the developmental stage since inception and its operations to date have been limited to issuing shares to its original shareholders. The Company will attempt to locate and negotiate with a business entity for the combination of that target company with the Company. The combination will normally take the form of a merger, stock-for-stock exchange or stock-for-assets exchange. In most instances the target company will wish to structure the business combination to be within the definition of a tax-free reorganization under Section 351 or Section 368 of the Internal Revenue Code of 1986, as amended. No assurances can be given that the Company will be successful in locating or negotiating with any target company. The Company has been formed to provide a method for a foreign or domestic private company to become a reporting company with a class of securities registered under the Securities Exchange Act of 1934.
On February 17, 2015, the Company changed its name from Spruce Valley Acquisition Corporation to Fuda Group (USA) Corporation (the "Company" or "Fuda Group") and filed the amendment with the State of Delaware.
On February 17, 2015, the Company amended its certificate of incorporation to increase its authorized capitalization to an aggregate of 500,000,000 shares consisting of 480,000,000 shares of common stock and 20,000,000 shares of non-designated preferred stock and filed the amendment with the State of Delaware.
On February 23, 2015, the Company filed a Form 8-K to report a change of control by the following events: the Company redeemed an aggregate of 19,500,000, the then officers and directors resigned,new officers and directors were appointed, and the Company issued 301,500,000 shares of its common stock.
NOTE 2 BASIS OF PRESENTATION
The accompanying condensed balance sheet as of December 31, 2014, which has been derived from the Company's audited financial statements as of that date, and the unaudited condensed financial information of the Company as of March 31, 2015 and for the three months ended March 31, 2015, has been prepared in accordance with accounting principles generally accepted in the United States of America ("U.S. GAAP") for interim financial information and with the instructions to Form 10-Q and Article 8-03 of Regulation S-X. In the opinion of management, such financial information includes all adjustments considered necessary for a fair presentation of the Company's financial position at such date and the operating results and cash flows for such periods. Operating results for the interim period ended March 31, 2015 are not necessarily indicative of the results that may be expected for the entire year.
Certain information and footnote disclosure normally included in financial statements in accordance with generally accepted accounting principles have been omitted pursuant to the rules of the United States Securities and Exchange Commission ("SEC"). These unaudited financial statements should be read in conjunction with our audited financial statements and accompanying notes included in the Company's Annual Report on Form 10-K for the year ended December 31, 2014 filed on April 15, 2015.
NOTE 3 SUMMARY OF SIGNIFICANT ACCOUNTING POLICIES
USE OF ESTIMATES
The preparation of condensed financial statements (unaudited) in conformity with GAAP requires management to make estimates and assumptions that affect the reported amounts of assets and liabilities and disclosure of contingent assets and liabilities at the date of the condensed financial statements, and the reported amounts of revenues and expenses during the reporting periods. Actual results could differ from those estimates.
CASH
Cash and cash equivalents include cash on hand and on deposit at banking institutions as well as all highly liquid short-term investments with original maturities of 90 days or less. The Company did not have cash or cash equivalents as of March 31, 2015 and December 31, 2014.
CONCENTRATION OF RISK
Financial instruments that potentially subject the Company to concentrations of credit risk consist principally of cash. The Company places its cash with high quality banking institutions. The Company did not have cash balances in excess of the Federal Deposit Insurance Corporation limit as of March 31, 2015.
| 135 |
FUDA GROUP (USA) CORPORATION
Notes to Unaudited Condensed Financial Statements
INCOME TAXES
Under ASC 740, "Income Taxes," deferred tax assets and liabilities are recognized for the future tax consequences attributable to temporary differences between the financial statement carrying amounts of existing assets and liabilities and their respective tax bases. Deferred tax assets and liabilities are measured using enacted tax rates expected to apply to taxable income in the years in which those temporary differences are expected to be recovered or settled. Valuation allowances are established when it is more likely than not that some or all of the deferred tax assets will not be realized. As of March 31, 2015 there were no deferred taxes due to the uncertainty of the realization of net operating loss or carry forward prior to expiration.
REVENUE RECOGNITION POLICY
The Company recognizes revenue in accordance with Financial Accounting Standards Board Accounting Standards Codification ("ASC") No. 605, Revenue Recognition. In all cases, revenue is recognized only when the price is fixed and determinable, persuasive evidence of an arrangement exists, the service is performed and collectability of the resulting receivable is reasonably assured.
LOSS PER COMMON SHARE
Basic loss per common share excludes dilution and is computed by dividing net loss by the weighted average number of common shares outstanding during the period. Diluted loss per common share reflect the potential dilution that could occur if securities or other contracts to issue common stock were exercised or converted into common stock or resulted in the issuance of common stock that then shared in the loss of the entity. As of March 31, 2015, there are no outstanding dilutive securities.
FAIR VALUE OF FINANCIAL INSTRUMENTS
The Company follows guidance for accounting for fair value measurements of financial assets and financial liabilities and for fair value measurements of nonfinancial items that are recognized or disclosed at fair value in the condensed financial statements (unaudited) on a recurring basis. Additionally, the Company adopted guidance for fair value measurement related to nonfinancial items that are recognized and disclosed at fair value in the condensed financial statements (unaudited) on a nonrecurring basis. The guidance establishes a fair value hierarchy that prioritizes the inputs to valuation techniques used to measure fair value. The hierarchy gives the highest priority to unadjusted quoted prices in active markets for identical assets or liabilities (Level 1 measurements) and the lowest priority to measurements involving significant unobservable inputs (Level 3 measurements). The three levels of the fair value hierarchy are as follows:
Level 1 inputs are quoted prices (unadjusted) in active markets for identical assets or liabilities that the Company has the ability to access at the measurement date.
Level 2 inputs are inputs other than quoted prices included within Level 1 that are observable for the asset or liability, either directly or indirectly.
Level 3 inputs are unobservable inputs for the asset or liability. The carrying amounts of financial assets such as cash approximate their fair values because of the short maturity of these instruments.
NOTE 4 - GOING CONCERN
The Company has not yet generated any revenue since inception to date and has sustained operating losses during the period ended March 31, 2015.
The Company had working capital of $0 and an accumulated deficit of $1,331 as of March 31, 2015. The Company's continuation as a going concern is dependent on its ability to generate sufficient cash flows from operations to meet its obligations and/or obtain additional financing from its members or other sources, as may be required.
| 136 |
FUDA GROUP (USA) CORPORATION
Notes to Unaudited Condensed Financial Statements
The accompanying condensed financial statements (unaudited) have been prepared assuming that the Company will continue as a going concern; however, the above condition raises substantial doubt about the Company's ability to do so. The condensed financial statements (unaudited) do not include any adjustments to reflect the possible future effects on the recoverability and classification of assets or the amounts and classifications of liabilities that may result should the Company be unable to continue as a going concern.
In order to maintain its current level of operations, the Company will require additional working capital from either cash flow from operations or from the sale of its equity. However, the Company currently has no commitments from any third parties for the purchase of its equity. If the Company is unable to acquire additional working capital, it will be required to significantly reduce its current level of operations.
NOTE 5 - RECENT ACCOUNTING PRONOUNCEMENTS
Adopted
In August, 2014, the Financial Accounting Standards Board ("FASB") issued Accounting Standards Update (ASU) No. 2014-15, Presentation of Financial Statements-Going Concern (Subtopic 205-40), which now requires management to evaluate whether there are conditions or events, considered in the aggregate, that raise substantial doubt about the entity's ability to continue as a going concern within one year after the date the financial statements are issued. If conditions or events raise substantial doubt about an entity's ability to continue as a going concern, and substantial doubt is not alleviated after consideration of management's plans, additional disclosures are required. The amendments in this update are effective for the annual period ending after December 15, 2016, and for annual periods and interim periods thereafter. Early application is permitted. These requirements were previously included within auditing standards and federal securities law, but are now included within U.S. GAAP. We are currently assessing the impact of the adoption of ASU No. 2014-15 on our financial statements and disclosures.
In June, 2014, the FASB issued ASU No. 2014-10, Development Stage Entities (Topic 915) - Elimination of Certain Financial Reporting Requirements, Including an Amendment to Variable Interest Entities Guidance in Topic 810, Consolidation, which eliminates the concept of a development stage entity (DSE) in its entirety from current accounting guidance. We have elected early adoption of this standard, which eliminates the designation of DSEs and the requirement to disclose results of operations and cash flows since inception. We do not believe the adoption of ASU No. 2014-10 will have significant impact on our financial statements and disclosures.
In May 2014, the FASB issued Accounting Standards Update ("ASU") 2014-09, Revenue from Contracts with Customers (Topic 606). ASU 2014-09 creates a new topic in the ASC Topic 606 and establishes a new control-based revenue recognition model, changes the basis for deciding when revenue is recognized over time or at a point in time, provides new and more detailed guidance on specific topics, and expands and improves disclosures about revenue. In addition, ASU 2014-09 adds a new Subtopic to the Codification, ASC 340-40, Other Assets and Deferred Costs: Contracts with Customers, to provide guidance on costs related to obtaining a contract with a customer and costs incurred in fulfilling a contract with a customer that are not in the scope of another ASC Topic. The guidance in ASU 2014-09 is effective for public entities for annual reporting periods beginning after December 15, 2016, including interim periods therein. Early application is not permitted. Management is in the process of assessing the impact of ASU 2014-09 on the Company's financial statements.
NOTE 6 STOCKHOLDERS' EQUITY
On September 25, 2014 the Company issued 20,000,000 founders common stock to two directors and officers of which 19,500,000 were redeemed on February 20, 2015.
On February 21, 2015, the Company issued 301,500,000 shares of its common stock.
The Company is authorized to issue 480,000,000 shares of common stock and 20,000,000 shares of preferred stock. As of March 31, 2015, 302,000,000 shares of common stock and no preferred stock were issued and outstanding.
| 137 |
FINANCIAL STATEMENTS
| 138 |
| ANTON & CHIA, LLP | CERTIFIED PUBLIC ACCOUNTANTS |
REPORT OF INDEPENDENT REGISTERED PUBLIC ACCOUNTING FIRM
To the Board of Directors and Stockholders of
Fuda Group (USA) Corporation
We have audited the accompanying balance sheet of Fuda Group (USA) Corporation (the "Company") as of December 31, 2014, and the related statement of income, stockholders' deficit, and cash flows for the period from September 25, 2014 (Inception) through December 31, 2014. Fuda Group (USA) Corporation's management is responsible for these financial statements. Our responsibility is to express an opinion on these financial statements based on our audits.
We conducted our audit in accordance with the standards of the Public Company Accounting Oversight Board (United States). Those standards require that we plan and perform the audit to obtain reasonable assurance about whether the financial statements are free of material misstatement. The company is not required to have, nor were we engaged to perform, an audit of its internal control over financial reporting. Our audit included consideration of internal control over financial reporting as a basis for designing audit procedures that are appropriate in the circumstances, but not for the purpose of expressing an opinion on the effectiveness of the company's internal control over financial reporting. Accordingly, we express no such opinion. An audit also includes examining, on a test basis, evidence supporting the amounts and disclosures in the financial statements, assessing the accounting principles used and significant estimates made by management, as well as evaluating the overall financial statement presentation. We believe that our audit provides a reasonable basis for our opinion.
In our opinion, the financial statements referred to above present fairly, in all material respects, the financial position of the Company as of December 31, 2014, and the results of its operations and its cash flows for the period from September 25, 2014 (Inception) through December 31, 2014, in conformity with accounting principles generally accepted in the United States of America.
The accompanying financial statements have been prepared assuming that the Company will continue as a going concern. As discussed in Note 2 to the financial statements, the Company has had no revenues and income since inception. These conditions, among others, raise substantial doubt about the Company's ability to continue as a going concern. Management's plans concerning these matters are also described in Note 2, which includes the raising of additional equity financing or merger with another entity. The financial statements do not include any adjustments that might result from the outcome of this uncertainty.
/s/ Anton & Chia, LLP
Newport Beach, CA
April 2, 2015
| 139 |
BALANCE SHEET
| December 31, 2014 | ||||
| ASSETS | ||||
| Current assets | ||||
| Cash | $ | 0 | ||
| Total assets | $ | 0 | ||
| LIABILITIES AND STOCKHOLDERS' DEFICIT | ||||
| Current liabilities | ||||
| Accrued liabilities | $ | 0 | ||
| Total liabilities | $ | 0 | ||
| Stockholders' deficit | ||||
| Common Stock; $0.0001 par value, 100,000,000 shares authorized; 20,000,000 shares issued and outstanding | 2,000 | |||
| Discount on Common Stock | (2,000 | ) | ||
| Additional paid-in capital | 712 | |||
| Accumulated deficit | (712 | ) | ||
| Total stockholders' deficit | 0 | |||
| Total Liabilities and stockholders' deficit | $ | 0 | ||
The accompanying notes are an integral part of these financial statements
| 140 |
STATEMENT OF OPERATIONS
| For the period from Sept. 25, | ||||
| 2014 (Inception) to | ||||
| December 31, 2014 | ||||
| Revenue | $ | - | ||
| Cost of revenue | - | |||
| Gross profit | - | |||
| Operating expenses | 712 | |||
| Operating loss | (712 | ) | ||
| Loss before income taxes | (712 | ) | ||
| Income tax expense | - | |||
| Net loss | $ | (712 | ) | |
| Loss per share - basic and diluted | $ | (0 | ) | |
| Weighted average shares-basic and diluted | 20,000,000 | |||
The accompanying notes are an integral part of these financial statements
| 141 |
STATEMENT OF CHANGES IN STOCKHOLDERS' DEFICIT
| Discount | Total | |||||||||||||||||||||||
| for | Additional | Stock- | ||||||||||||||||||||||
| Common Stock | Common | Paid-In | Accumulated | holders' | ||||||||||||||||||||
| Shares | Amount | Stock | Capital | Deficit | Deficit | |||||||||||||||||||
| Balance, September 25, 2014 (Inception) | - | $ | - | $ | - | $ | - | $ | - | $ | - | |||||||||||||
| Issuance of common stock | 20,000,000 | 2,000 | (2,000 | ) | - | - | 0 | |||||||||||||||||
| Additional paid-in capital | - | - | - | 712 | - | 712 | ||||||||||||||||||
| Net loss | - | - | - | (712 | ) | (712 | ) | |||||||||||||||||
| Balance, December 31, 2014 | 20,000,000 | $ | 2,000 | $ | (2,000 | ) | $ | 712 | $ | (712 | ) | $ | 0 | |||||||||||
The accompanying notes are an integral part of these financial statements
| 142 |
STATEMENT OF CASH FLOWS
| For the period from | ||||
| September 25, 2014 | ||||
| (Inception) to | ||||
| December 31, 2014 | ||||
| OPERATING ACTIVITIES | ||||
| Net loss | $ | (712 | ) | |
| Non-Cash adjustments to reconcile loss to net cash | ||||
| Expenses paid by stockholder and contributed as capital | 712 | |||
| Changes in Operating Assets and Liabilities | ||||
| Accrued liabilities | 0 | |||
| Net cash used in operating activities | 0 | |||
| INVESTING ACTIVITIES | ||||
| Acquisition of Intangible Assets | - | |||
| Capital Expenditures | - | |||
| Net cash used in investing activities | - | |||
| FINANCING ACTIVITIES | ||||
| Proceeds from issuance of common stock | 0 | |||
| Proceeds from stockholders' contribution | 0 | |||
| Net cash provided by financing activities | 0 | |||
| Net increase in cash | 0 | |||
| Cash, beginning of period | - | |||
| Cash, end of period | $ | 0 | ||
The accompanying notes are an integral part of these financial statements
| 143 |
Notes to the Financial Statements
| NOTE 1 | NATURE OF OPERATIONS AND SUMMARY OF SIGNIFICANT ACCOUNTING POLICIES |
NATURE OF OPERATIONS
Fuda Group (USA) Corporation ("Fuda Group" or "the Company") was incorporated on September 25, 2014 under the laws of the state of Delaware to engage in any lawful corporate undertaking, including, but not limited to, selected mergers and acquisitions. The Company has been in the developmental stage since inception and its operations to date have been limited to issuing shares to its original shareholders. The Company will attempt to locate and negotiate with a business entity for the combination of that target company with the Company. The combination will normally take the form of a merger, stock-for-stock exchange or stock-for-assets exchange. In most instances the target company will wish to structure the business combination to be within the definition of a tax-free reorganization under Section 351 or Section 368 of the Internal Revenue Code of 1986, as amended. No assurances can be given that the Company will be successful in locating or negotiating with any target company. The Company has been formed to provide a method for a foreign or domestic private company to become a reporting company with a class of securities registered under the Securities Exchange Act of 1934.
BASIS OF PRESENTATION
The summary of significant accounting policies presented below is designed to assist in understanding the Company's financial statements. Such financial statements and accompanying notes are the representations of the Company's management, who are responsible for their integrity and objectivity. These accounting policies conform to accounting principles generally accepted in the United States of America ("GAAP") in all material respects, and have been consistently applied in preparing the accompanying financial statements.
USE OF ESTIMATES
The preparation of financial statements in conformity with GAAP requires management to make estimates and assumptions that affect the reported amounts of assets and liabilities and disclosure of contingent assets and liabilities at the date of the financial statements, and the reported amounts of revenues and expenses during the reporting periods. Actual results could differ from those estimates.
CASH
Cash and cash equivalents include cash on hand and on deposit at banking institutions as well as all highly liquid short-term investments with original maturities of 90 days or less. The Company did not have cash equivalents as of December 31, 2014.
| 144 |
CONCENTRATION OF RISK
Financial instruments that potentially subject the Company to concentrations of credit risk consist principally of cash. The Company places its cash with high quality banking institutions. The Company did not have cash balances in excess of the Federal Deposit Insurance Corporation limit as of December 31, 2014.
INCOME TAXES
Under ASC 740, "Income Taxes," deferred tax assets and liabilities are recognized for the future tax consequences attributable to temporary differences between the financial statement carrying amounts of existing assets and liabilities and their respective tax bases. Deferred tax assets and liabilities are measured using enacted tax rates expected to apply to taxable income in the years in which those temporary differences are expected to be recovered or settled. Valuation allowances are established when it is more likely than not that some or all of the deferred tax assets will not be realized. As of December 31, 2014, there were no deferred taxes due to the uncertainty of the realization of net operating loss or carry forward prior to expiration.
LOSS PER COMMON SHARE
Basic loss per common share excludes dilution and is computed by dividing net loss by the weighted average number of common shares outstanding during the period. Diluted loss per common share reflect the potential dilution that could occur if securities or other contracts to issue common stock were exercised or converted into common stock or resulted in the issuance of common stock that then shared in the loss of the entity. As of December 31, 2014, there are no outstanding dilutive securities.
FAIR VALUE OF FINANCIAL INSTRUMENTS
The Company follows guidance for accounting for fair value measurements of financial assets and financial liabilities and for fair value measurements of nonfinancial items that are recognized or disclosed at fair value in the financial statements on a recurring basis. Additionally, the Company adopted guidance for fair value measurement related to nonfinancial items that are recognized and disclosed at fair value in the financial statements on a nonrecurring basis. The guidance establishes a fair value hierarchy that prioritizes the inputs to valuation techniques used to measure fair value. The hierarchy gives the highest priority to unadjusted quoted prices in active markets for identical assets or liabilities (Level 1 measurements) and the lowest priority to measurements involving significant unobservable inputs (Level 3 measurements). The three levels of the fair value hierarchy are as follows:
Level 1 inputs are quoted prices (unadjusted) in active markets for identical assets or liabilities that the Company has the ability to access at the measurement date.
Level 2 inputs are inputs other than quoted prices included within Level 1 that are observable for the asset or liability, either directly or indirectly.
Level 3 inputs are unobservable inputs for the asset or liability. The carrying amounts of financial assets such as cash approximate their fair values because of the short maturity of these instruments.
| 145 |
NOTE 2 - GOING CONCERN
The Company has not yet generated any revenue since inception to date and has sustained operating losses during the period ended December 31, 2014. As of December 31, 2014, the Company has an accumulated deficit of $712. The Company's continuation as a going concern is dependent on its ability to generate sufficient cash flows from operations to meet its obligations and/or obtaining additional financing from its members or other sources, as may be required.
The accompanying financial statements have been prepared assuming that the Company will continue as a going concern; however, the above condition raises substantial doubt about the Company's ability to do so. The financial statements do not include any adjustments to reflect the possible future effects on the recoverability and classification of assets or the amounts and classifications of liabilities that may result should the Company be unable to continue as a going concern.
In order to maintain its current level of operations, the Company will require additional working capital from either cash flow from operations or from the sale of its equity. However, the Company currently has no commitments from any third parties for the purchase of its equity. If the Company is unable to acquire additional working capital, it will be required to significantly reduce its current level of operations.
NOTE 3 - RECENT ACCOUNTING PRONOUNCEMENTS
Adopted
On June 10, 2014, the FASB issued ASU 2014-10, Development Stage Entities (Topic 915). The amendments in this update remove the definition of a development stage entity from Topic 915, thereby removing the distinction between development stage entities and other reporting entities from U.S. GAAP. In addition, the amendments eliminate the requirements for development stage entities to (1) present inception-to-date information on the statements of income, cash flows, and shareholder's equity, (2) label the financial statements as those of a development stage entity, (3) disclose a description of the development stage activities in which the entity is engaged, and (4) disclose in the first year in which the entity is no longer a development stage entity that in prior years it had been in the development stage. Early adoption is permitted. The Company has adopted this accounting standard. The accounting pronouncement does not have a material effect on the financial statements.
Other recent accounting pronouncements issued by the FASB (including its Emerging Issues Task Force) and the United States Securities and Exchange Commission did not or are not believed by management to have a material impact on the Company's present or future financial statements.
NOTE 4 STOCKHOLDERS' DEFICIT
On September 25, 2014, the Company issued 20,000,000 common shares to two directors and officers at a discount of $2,000.
The Company is authorized to issue 100,000,000 shares of common stock and 20,000,000 shares of preferred stock. As of December 31, 2014, 20,000,000 shares of common stock and no preferred stock were issued and outstanding.
| 146 |
PART II
Item 13. Other expenses of Issuance and Distribution
The following table sets forth the Company’s expenses in connection with this registration statement. All of the listed expenses are estimates, other than the filing fees payable to the Securities and Exchange Commission.
| Registration Fees | $ | |||
| State filing fees | $ | |||
| Edgarizing fees | $ | |||
| Transfer agent fees | $ | |||
| Accounting fee | $ | |||
| Legal fees | $ | |||
| Printing | $ |
Item 14. Indemnification of Directors and Officers
The Company's certificate of incorporation, by-laws and other contracts provide for indemnification of its officers, directors, agents, fiduciaries and employees. These provisions allow the Company to pay for the expenses of these persons in connection with legal proceedings brought because of the person's position with the Company.
The Company does not believe that such indemnification affects the capacity of such person acting as officer, director or control person of the Company.
Item 15. Recent Sales of Unregistered Securities
The Company has issued the following securities in the last three (3) years. All such securities were issued pursuant to exemptions from registration under Section 4(2) of the Securities Act of 1933, as amended, as transactions by an issuer not involving any public offering, as noted below. Each of these transactions was issued as part of a private placement of securities by the Company in which (i) no general advertising or solicitation was used, and (ii) the investors purchasing securities were acquiring the same for investment purposes only, without a view to resale.
The Company has issued the following securities in the last three (3) years. All such securities were issued pursuant to an exemption from registration under Section 4(2) of the Securities Act of 1933, as amended, as a transaction by an issuer not involving any public offering, as noted below. Each of these transactions was issued as part of a private placement of securities by the Company in which (i) no general advertising or solicitation was used, and (ii) the investors purchasing securities were acquiring the same for investment purposes only, without a view to resale. Furthermore, no underwriters participated or effectuated any of the transactions specified below. Also, no underwriting discounts or commissions applied to any of the transactions set forth below. All potential investors were contacted personally and possessed at the time of their investment bona fide substantive, pre-existing business relationships with the Company and/or its officers, directors and affiliates. No potential investors were contacted through other means, and no general advertising or general solicitation was used to solicit any investors.
(1) On September 25, 2014, the Company issued the following shares of its common stock:
| Name | Number of Shares | |||
| James Cassidy | 10,000,000 | |||
| James McKillop | 10,000,000 | |||
(2) On February 20, 2015, 19,500,000 shares were redeemed, pro rata, on February 20, 2015 from the holders.
(3) On February 21, 2015, the Company issued 301,500,000 shares as follows:
| Name | Number of Shares | |||
| Liaoning Fuda Mining Co., LTD | 61,000,000 | |||
| Dandong Hao Han Mining Co., LTD | 58,000,000 | |||
| Xiaobin Wu | 51,500,000 | |||
| B. Square Pty LTD | 48,000,000 | |||
| JFL International Group Private Limited | 35,000,000 | |||
| Lina Wu | 35,000,000 | |||
| Lihua Sun | 13,000,000 | |||
| 147 |
(4) Between July 1, 2015 and September 7, 2015, the Company subsequently redeemed those 301,500,000 shares that were issued on February 21, 2015.
(5) Between July 1, 2015 and September 7, 2015, 145,839,773 shares of common stock were issued by the Company to shareholders pursuant to executed subscription agreements under a Regulation D offering or other private placement of securities. Each of these transactions was issued as part of the private placement of securities by the Company in which no underwriting discounts or commissions applied to any of the transactions. The Company conducted such private placement offering in order to build a base of shareholders and establish relationships with a variety of shareholders. Tiber Creek Corporation did not assist the Company in conducting the offering.
(6) On September 30, 2015, the Company issued 112,000,000 shares of common stock in connection with the Acquisitions.
The above number of shares in (1) through (6) above is shown as pre-split numbers of shares. Subsequently, the Company effectuated a 41-for-100 reverse stock split in October 2015.
Subsequent to the split occurring, 350 shareholders were issued 100 shares for a total of 35,000 shares in aggregate issued by the Company.
Item 16. Exhibits and Financial Statement Schedules.
EXHIBITS
| 2.1+ | Agreement and Plan of Reorganization |
| 2.2+ | Agreement and Plan of Reorganization |
| 2.3+ | Equity Transfer Agreement |
| 3.1++ | Certificate of Incorporation |
| 3.2++ | By-laws |
| 3.3++ | [split document] |
| 5.0** | Opinion of Counsel on legality of securities being registered |
| 23.1 | Consent of Accountants |
| 23.2 | Consent of Accountants |
| 23.3 | ** Consent of Attorney (as part of Exhibit 5.0) |
| ** | To be filed |
| + | Previously filed with Form 8-K on October 1, 2015 (File No. 000-55307) as the same exhibit number as the exhibit number listed here, and incorporated herein by this reference. |
| ++ | Previously filed with Form 10-12G on November 3, 2014 (File No. 000-55307) as the same exhibit number as the exhibit number listed here, and incorporated herein by this reference herein by this reference. |
Item 17. Undertakings
The undersigned registrant hereby undertakes:
| 1. | To file, during any period in which offers or sales are being made, a post-effective amendment to this registration statement: |
| i. | To include any prospectus required by section 10(a)(3) of the Securities Act of 1933; |
| ii. | To reflect in the prospectus any facts or events arising after the effective date of the registration statement (or the most recent post-effective amendment thereof) which, individually or in the aggregate, represent a fundamental change in the information set forth in the registration statement. Notwithstanding the foregoing, any increase or decrease in volume of securities offered (if the total dollar value of securities offered would not exceed that which was registered) and any deviation from the low or high end of the estimated maximum offering range may be reflected in the form of prospectus filed with the Commission pursuant to Rule 424(b) if, in the aggregate, the changes in volume and price represent no more than 20% change in the maximum aggregate offering price set forth in the "Calculation of Registration Fee" table in the effective registration statement. |
| iii. | To include any material information with respect to the plan of distribution not previously disclosed in the registration statement or any material change to such information in the registration statement. |
| 2. | That, for the purpose of determining any liability under the Securities Act of 1933, each such post-effective amendment shall be deemed to be a new registration statement relating to the securities offered therein, and the offering of such securities at that time shall be deemed to be the initial bona fide offering thereof. |
| 148 |
| 3. | To remove from registration by means of a post-effective amendment any of the securities being registered which remain unsold at the termination of the offering. |
That, for the purpose of determining liability under the Securities Act of 1933 to any purchaser, each prospectus filed pursuant to Rule 424(b) as part of a registration statement relating to an offering, other than registration statements relying on Rule 430B or other than prospectuses filed in reliance on Rule 430A, shall be deemed to be part of and included in the registration statement as of the date it is first used after effectiveness. Provided, however, that no statement made in a registration statement or prospectus that is part of the registration statement or made in a document incorporated or deemed incorporated by reference into the registration statement or prospectus that is part of the registration statement will, as to a purchaser with a time of contract of sale prior to such first use, supersede or modify any statement that was made in the registration statement or prospectus that was part of the registration statement or made in any such document immediately prior to such date of first use.
| 149 |
SIGNATURES
Pursuant to the requirements of the Securities Act of 1933, the registrant has duly caused this registration statement to be signed on its behalf by the undersigned, thereunto duly authorized in on November 13, 2015.
| FUDA GROUP (USA) CORPORATION | ||
| (formerly Spruce Valley Acquisition Corporation) | ||
| By: | /s/ Xiaobin Wu | |
| Title: Chief Executive Officer (principal executive officer) | ||
| By: | /s/ Xiaobin Wu | |
| Title: Chief Financial Officer (principal financial officer) | ||
| By: | /s/ Xiaobin Wu | |
| Title: Chief Financial Officer (principal accounting officer) |
Pursuant to the requirements of the Securities Act of 1933, this registration statement has been signed below by the following persons in the capacities and on the dates indicated.
| Signature | Capacity | Date |
| /s/ Xiaobin Wu | Director | November 13, 2015 |
| 150 |