Attached files
| file | filename |
|---|---|
| 8-K - FORM 8-K - INVENTIV HEALTH INC | d63254d8k.htm |

inVentiv Health Third Quarter 2015 Earnings Presentation November 16, 2015 Exhibit 99.1 Exhibit 99.1
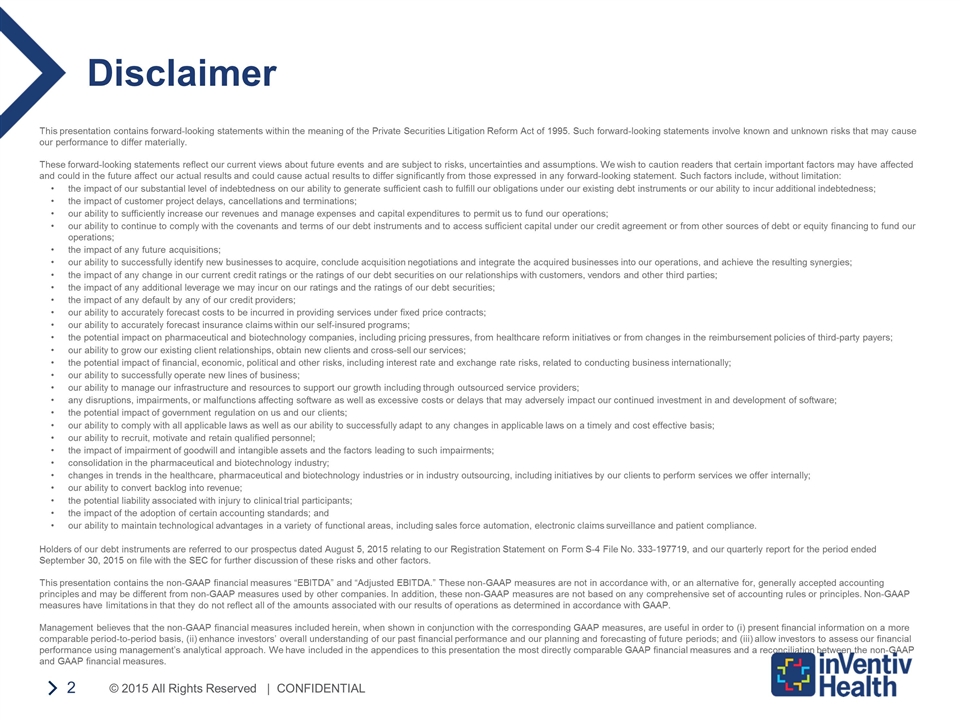
This presentation contains forward-looking statements within the meaning of the Private Securities Litigation Reform Act of 1995. Such forward-looking statements involve known and unknown risks that may cause our performance to differ materially. These forward-looking statements reflect our current views about future events and are subject to risks, uncertainties and assumptions. We wish to caution readers that certain important factors may have affected and could in the future affect our actual results and could cause actual results to differ significantly from those expressed in any forward-looking statement. Such factors include, without limitation: •the impact of our substantial level of indebtedness on our ability to generate sufficient cash to fulfill our obligations under our existing debt instruments or our ability to incur additional indebtedness; • the impact of customer project delays, cancellations and terminations; • our ability to sufficiently increase our revenues and manage expenses and capital expenditures to permit us to fund our operations; • our ability to continue to comply with the covenants and terms of our debt instruments and to access sufficient capital under our credit agreement or from other sources of debt or equity financing to fund our operations; •the impact of any future acquisitions; • our ability to successfully identify new businesses to acquire, conclude acquisition negotiations and integrate the acquired businesses into our operations, and achieve the resulting synergies; • the impact of any change in our current credit ratings or the ratings of our debt securities on our relationships with customers, vendors and other third parties; • the impact of any additional leverage we may incur on our ratings and the ratings of our debt securities; • the impact of any default by any of our credit providers; •our ability to accurately forecast costs to be incurred in providing services under fixed price contracts; •our ability to accurately forecast insurance claims within our self-insured programs; • the potential impact on pharmaceutical and biotechnology companies, including pricing pressures, from healthcare reform initiatives or from changes in the reimbursement policies of third-party payers; • our ability to grow our existing client relationships, obtain new clients and cross-sell our services; • the potential impact of financial, economic, political and other risks, including interest rate and exchange rate risks, related to conducting business internationally; • our ability to successfully operate new lines of business; • our ability to manage our infrastructure and resources to support our growth including through outsourced service providers; • any disruptions, impairments, or malfunctions affecting software as well as excessive costs or delays that may adversely impact our continued investment in and development of software; • the potential impact of government regulation on us and our clients; • our ability to comply with all applicable laws as well as our ability to successfully adapt to any changes in applicable laws on a timely and cost effective basis; • our ability to recruit, motivate and retain qualified personnel; • the impact of impairment of goodwill and intangible assets and the factors leading to such impairments; •consolidation in the pharmaceutical and biotechnology industry; • changes in trends in the healthcare, pharmaceutical and biotechnology industries or in industry outsourcing, including initiatives by our clients to perform services we offer internally; • our ability to convert backlog into revenue; •the potential liability associated with injury to clinical trial participants; •the impact of the adoption of certain accounting standards; and • our ability to maintain technological advantages in a variety of functional areas, including sales force automation, electronic claims surveillance and patient compliance. Holders of our debt instruments are referred to our prospectus dated August 5, 2015 relating to our Registration Statement on Form S-4 File No. 333-197719, and our quarterly report for the period ended September 30, 2015 on file with the SEC for further discussion of these risks and other factors. This presentation contains the non-GAAP financial measures “EBITDA” and “Adjusted EBITDA.” These non-GAAP measures are not in accordance with, or an alternative for, generally accepted accounting principles and may be different from non-GAAP measures used by other companies. In addition, these non-GAAP measures are not based on any comprehensive set of accounting rules or principles. Non-GAAP measures have limitations in that they do not reflect all of the amounts associated with our results of operations as determined in accordance with GAAP. Management believes that the non-GAAP financial measures included herein, when shown in conjunction with the corresponding GAAP measures, are useful in order to (i) present financial information on a more comparable period-to-period basis, (ii) enhance investors’ overall understanding of our past financial performance and our planning and forecasting of future periods; and (iii) allow investors to assess our financial performance using management’s analytical approach. We have included in the appendices to this presentation the most directly comparable GAAP financial measures and a reconciliation between the non-GAAP and GAAP financial measures. Disclaimer
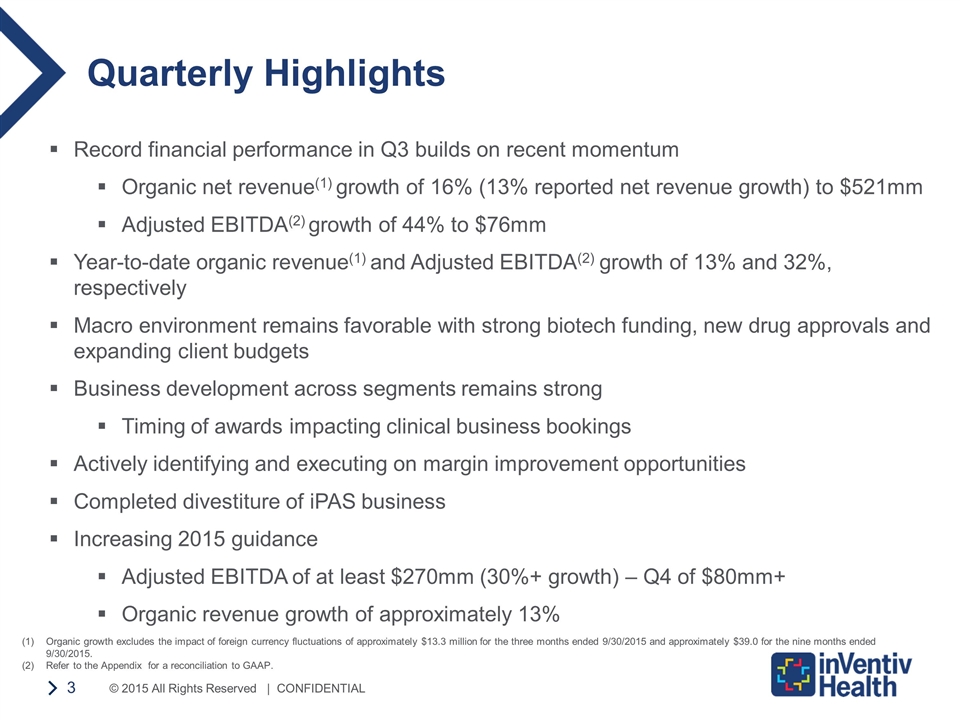
Quarterly Highlights Record financial performance in Q3 builds on recent momentum Organic net revenue(1) growth of 16% (13% reported net revenue growth) to $521mm Adjusted EBITDA(2) growth of 44% to $76mm Year-to-date organic revenue(1) and Adjusted EBITDA(2) growth of 13% and 32%, respectively Macro environment remains favorable with strong biotech funding, new drug approvals and expanding client budgets Business development across segments remains strong Timing of awards impacting clinical business bookings Actively identifying and executing on margin improvement opportunities Completed divestiture of iPAS business Increasing 2015 guidance Adjusted EBITDA of at least $270mm (30%+ growth) – Q4 of $80mm+ Organic revenue growth of approximately 13% Organic growth excludes the impact of foreign currency fluctuations of approximately $13.3 million for the three months ended 9/30/2015 and approximately $39.0 for the nine months ended 9/30/2015. Refer to the Appendix for a reconciliation to GAAP.
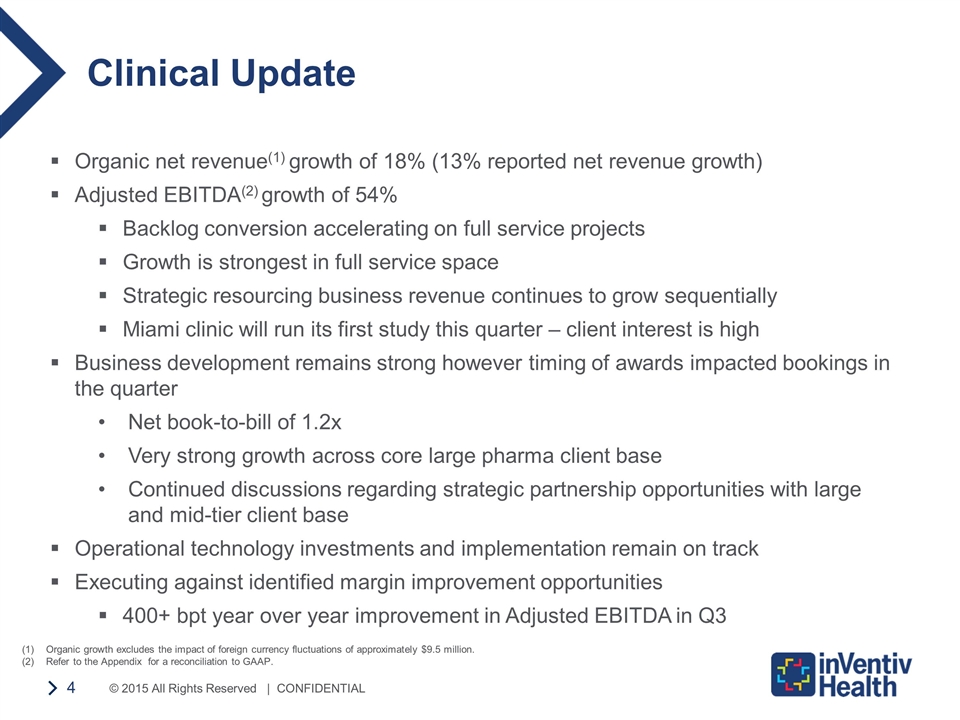
Clinical Update Organic net revenue(1) growth of 18% (13% reported net revenue growth) Adjusted EBITDA(2) growth of 54% Backlog conversion accelerating on full service projects Growth is strongest in full service space Strategic resourcing business revenue continues to grow sequentially Miami clinic will run its first study this quarter – client interest is high Business development remains strong however timing of awards impacted bookings in the quarter Net book-to-bill of 1.2x Very strong growth across core large pharma client base Continued discussions regarding strategic partnership opportunities with large and mid-tier client base Operational technology investments and implementation remain on track Executing against identified margin improvement opportunities 400+ bpt year over year improvement in Adjusted EBITDA in Q3 Organic growth excludes the impact of foreign currency fluctuations of approximately $9.5 million. Refer to the Appendix for a reconciliation to GAAP.
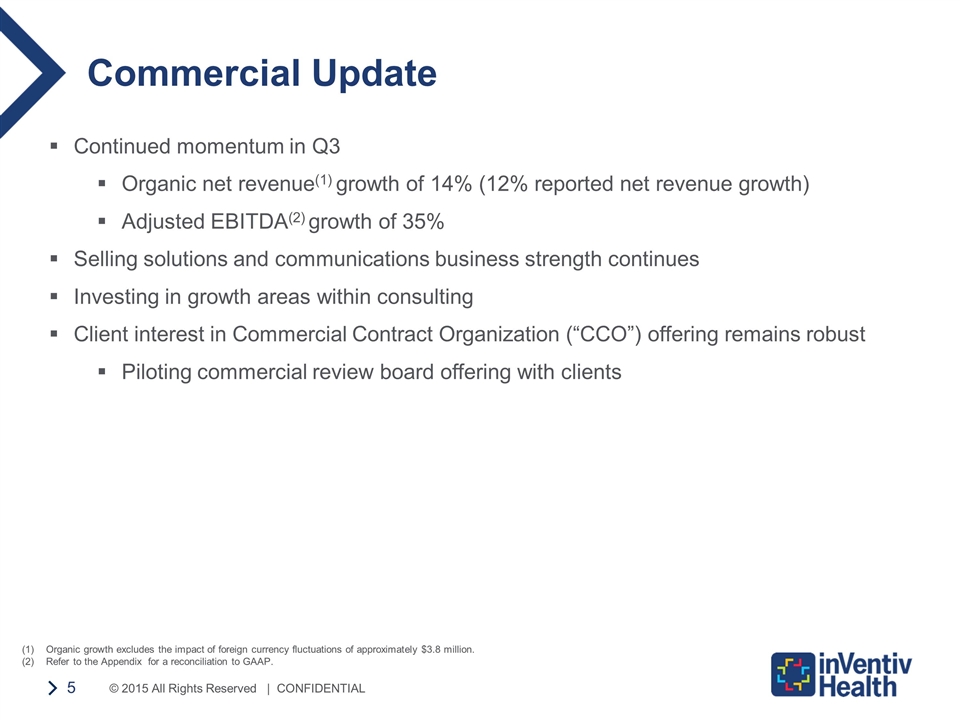
Commercial Update Continued momentum in Q3 Organic net revenue(1) growth of 14% (12% reported net revenue growth) Adjusted EBITDA(2) growth of 35% Selling solutions and communications business strength continues Investing in growth areas within consulting Client interest in Commercial Contract Organization (“CCO”) offering remains robust Piloting commercial review board offering with clients Organic growth excludes the impact of foreign currency fluctuations of approximately $3.8 million. Refer to the Appendix for a reconciliation to GAAP.
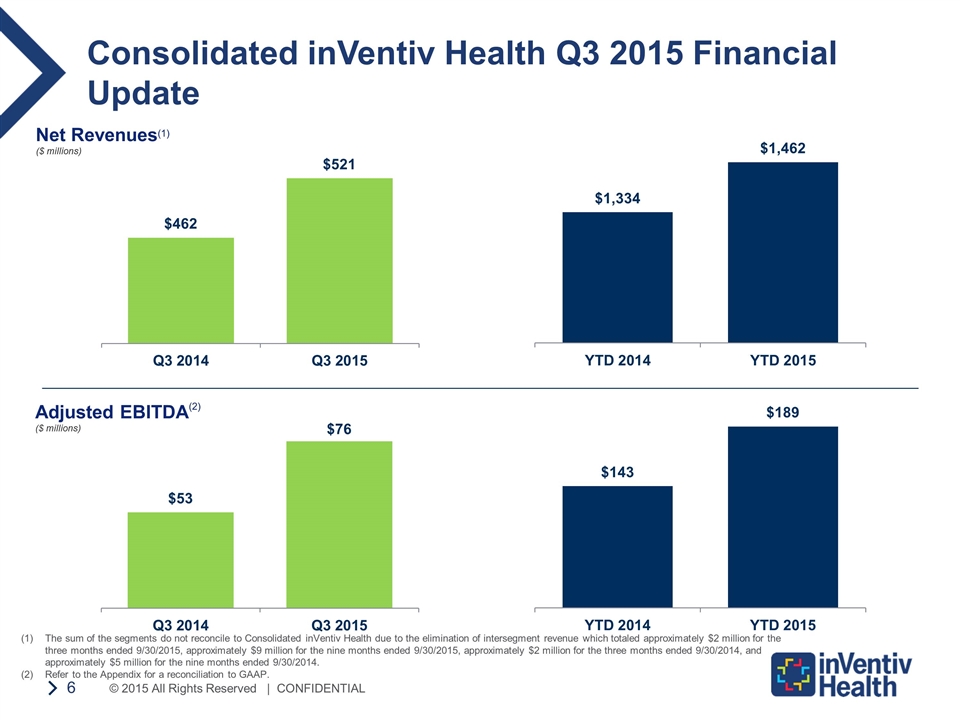
Consolidated inVentiv Health Q3 2015 Financial Update The sum of the segments do not reconcile to Consolidated inVentiv Health due to the elimination of intersegment revenue which totaled approximately $2 million for the three months ended 9/30/2015, approximately $9 million for the nine months ended 9/30/2015, approximately $2 million for the three months ended 9/30/2014, and approximately $5 million for the nine months ended 9/30/2014. Refer to the Appendix for a reconciliation to GAAP. Net Revenues(1) ($ millions) Adjusted EBITDA(2) ($ millions)
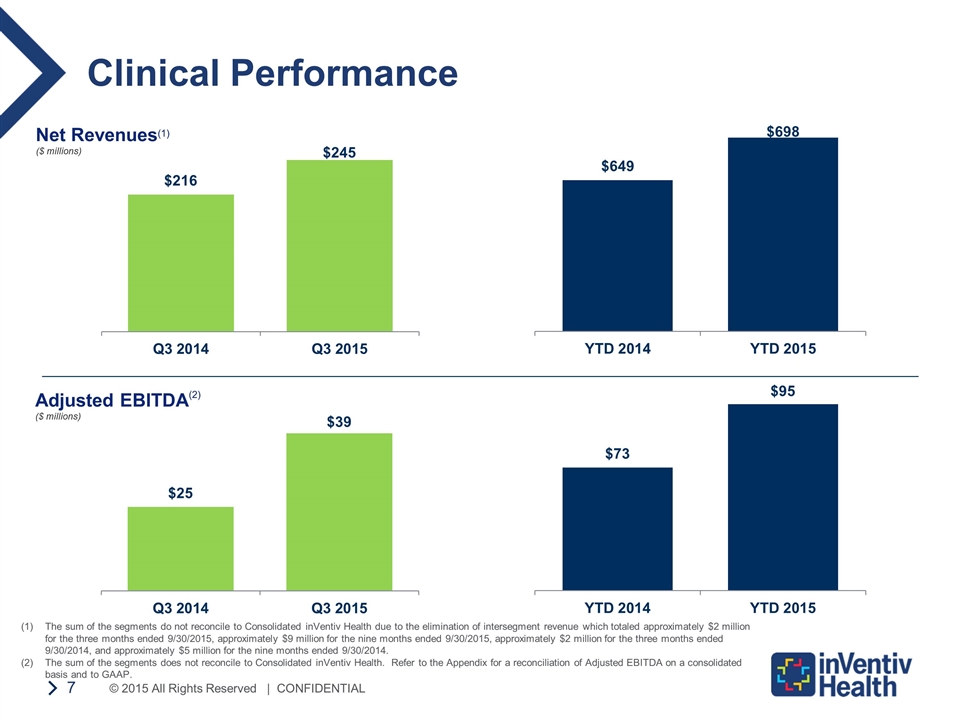
Clinical Performance Net Revenues(1) ($ millions) Adjusted EBITDA(2) ($ millions) The sum of the segments do not reconcile to Consolidated inVentiv Health due to the elimination of intersegment revenue which totaled approximately $2 million for the three months ended 9/30/2015, approximately $9 million for the nine months ended 9/30/2015, approximately $2 million for the three months ended 9/30/2014, and approximately $5 million for the nine months ended 9/30/2014. The sum of the segments does not reconcile to Consolidated inVentiv Health. Refer to the Appendix for a reconciliation of Adjusted EBITDA on a consolidated basis and to GAAP.
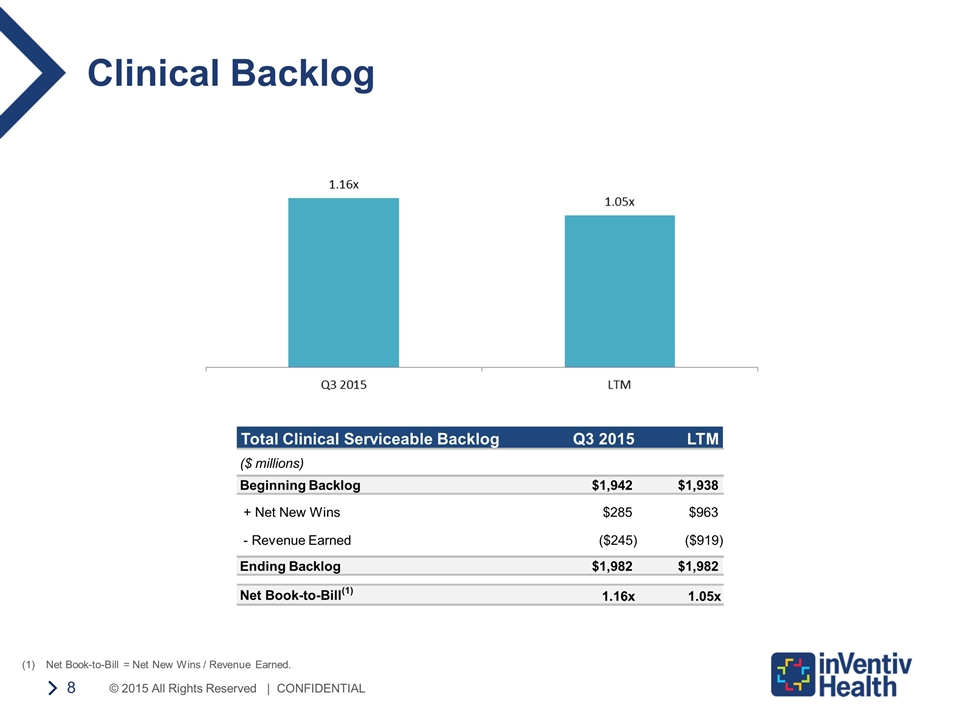
Clinical Backlog Net Book-to-Bill = Net New Wins / Revenue Earned. Total Clinical Serviceable Backlog Q3 2015 LTM ($ millions) Beginning Backlog $1,942 $1,938 + Net New Wins $285 $963 - Revenue Earned ($245) ($919) Ending Backlog $1,982 $1,982 Net Book-to-Bill (1) 1.16x 1.05x
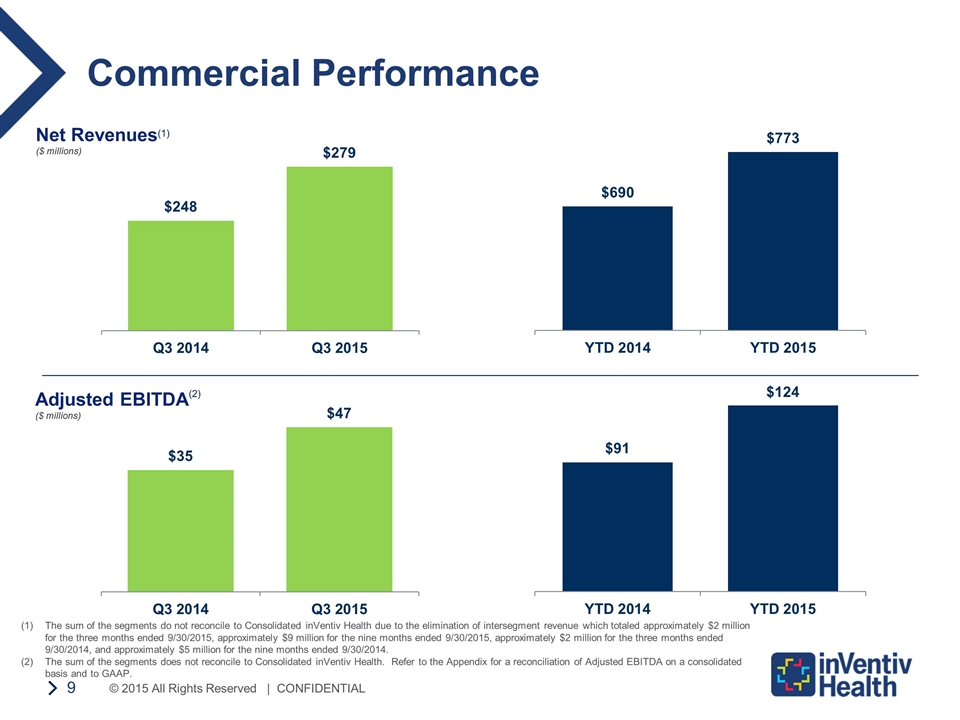
Commercial Performance Net Revenues(1) ($ millions) Adjusted EBITDA(2) ($ millions) The sum of the segments do not reconcile to Consolidated inVentiv Health due to the elimination of intersegment revenue which totaled approximately $2 million for the three months ended 9/30/2015, approximately $9 million for the nine months ended 9/30/2015, approximately $2 million for the three months ended 9/30/2014, and approximately $5 million for the nine months ended 9/30/2014. The sum of the segments does not reconcile to Consolidated inVentiv Health. Refer to the Appendix for a reconciliation of Adjusted EBITDA on a consolidated basis and to GAAP.
Appendix
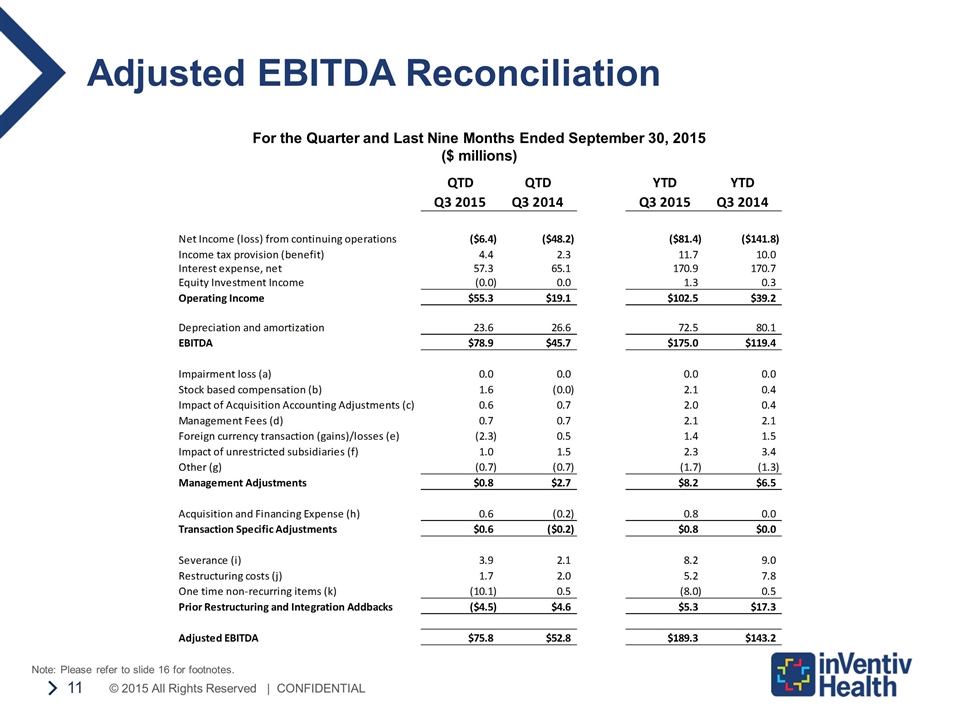
For the Quarter and Last Nine Months Ended September 30, 2015 ($ millions) Adjusted EBITDA Reconciliation Note: Please refer to slide 16 for footnotes.
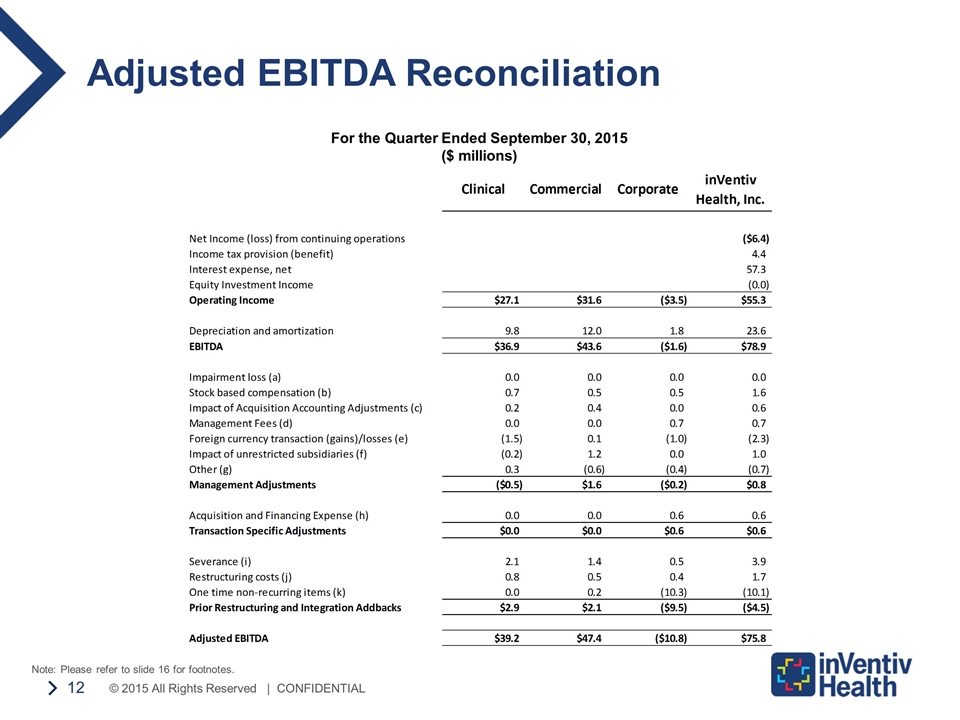
For the Quarter Ended September 30, 2015 ($ millions) Adjusted EBITDA Reconciliation Note: Please refer to slide 16 for footnotes.
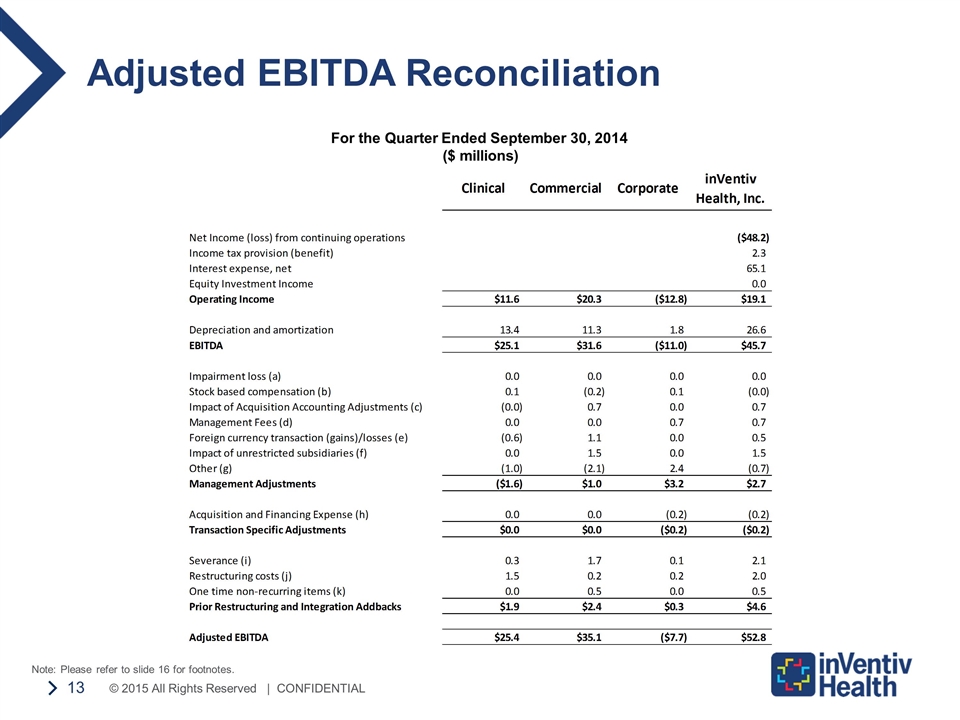
For the Quarter Ended September 30, 2014 ($ millions) Adjusted EBITDA Reconciliation Note: Please refer to slide 16 for footnotes.
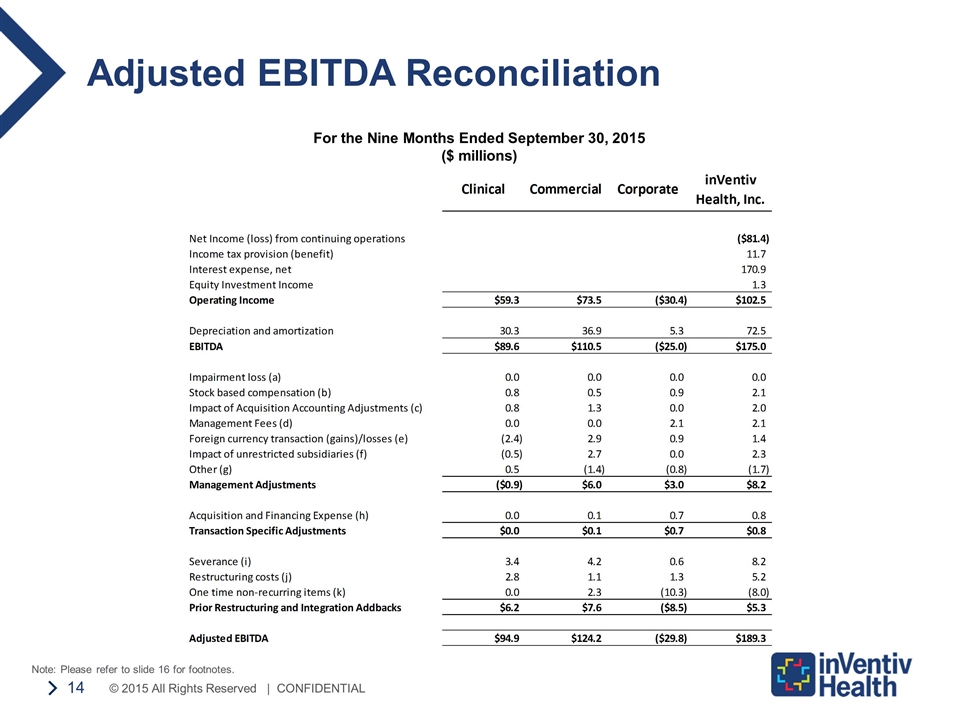
For the Nine Months Ended September 30, 2015 ($ millions) Adjusted EBITDA Reconciliation Note: Please refer to slide 16 for footnotes.
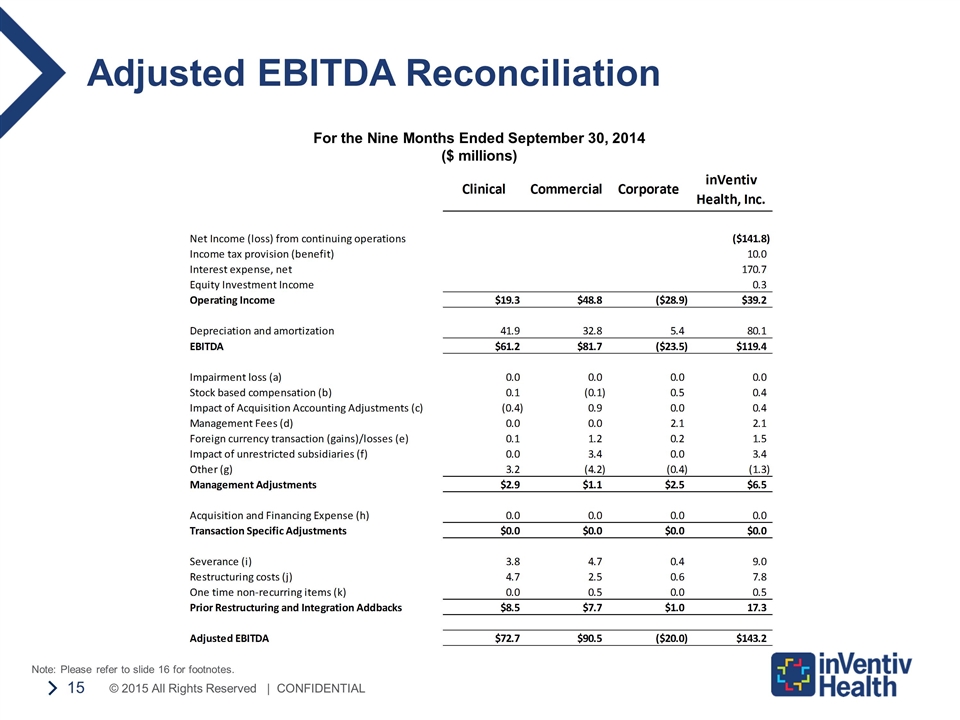
For the Nine Months Ended September 30, 2014 ($ millions) Adjusted EBITDA Reconciliation Note: Please refer to slide 16 for footnotes.
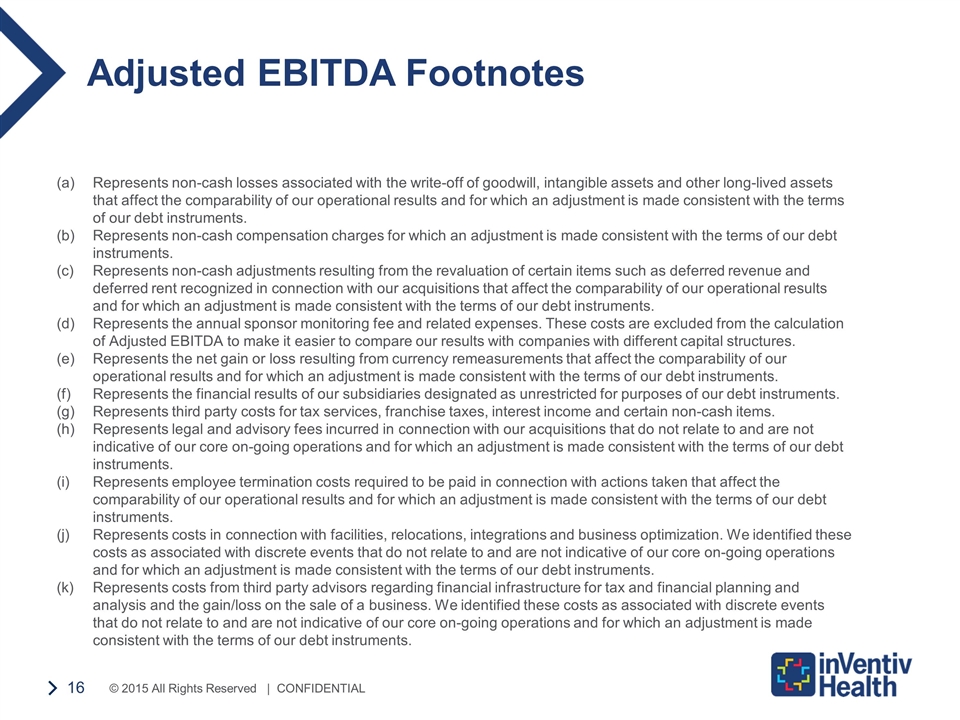
Adjusted EBITDA Footnotes Represents non-cash losses associated with the write-off of goodwill, intangible assets and other long-lived assets that affect the comparability of our operational results and for which an adjustment is made consistent with the terms of our debt instruments. Represents non-cash compensation charges for which an adjustment is made consistent with the terms of our debt instruments. Represents non-cash adjustments resulting from the revaluation of certain items such as deferred revenue and deferred rent recognized in connection with our acquisitions that affect the comparability of our operational results and for which an adjustment is made consistent with the terms of our debt instruments. Represents the annual sponsor monitoring fee and related expenses. These costs are excluded from the calculation of Adjusted EBITDA to make it easier to compare our results with companies with different capital structures. Represents the net gain or loss resulting from currency remeasurements that affect the comparability of our operational results and for which an adjustment is made consistent with the terms of our debt instruments. Represents the financial results of our subsidiaries designated as unrestricted for purposes of our debt instruments. Represents third party costs for tax services, franchise taxes, interest income and certain non-cash items. Represents legal and advisory fees incurred in connection with our acquisitions that do not relate to and are not indicative of our core on-going operations and for which an adjustment is made consistent with the terms of our debt instruments. Represents employee termination costs required to be paid in connection with actions taken that affect the comparability of our operational results and for which an adjustment is made consistent with the terms of our debt instruments. Represents costs in connection with facilities, relocations, integrations and business optimization. We identified these costs as associated with discrete events that do not relate to and are not indicative of our core on-going operations and for which an adjustment is made consistent with the terms of our debt instruments. Represents costs from third party advisors regarding financial infrastructure for tax and financial planning and analysis and the gain/loss on the sale of a business. We identified these costs as associated with discrete events that do not relate to and are not indicative of our core on-going operations and for which an adjustment is made consistent with the terms of our debt instruments.
