Attached files
| file | filename |
|---|---|
| 8-K - FORM 8-K - ASSOCIATED BANC-CORP | form8-k.htm |
BANK OF AMERICA MERRILL LYNCH BANKING AND FINANCIAL SERVICES CONFERENCE NOVEMBER 17, 2015 ASSOCIATED BANC-CORP

FORWARD-LOOKING STATEMENTS Important note regarding forward-looking statements: Statements made in this presentation which are not purely historical are forward-looking statements, as defined in the Private Securities Litigation Reform Act of 1995. This includes any statements regarding management’s plans, objectives, or goals for future operations, products or services, and forecasts of its revenues, earnings, or other measures of performance. Such forward-looking statements may be identified by the use of words such as “believe”, “expect”, “anticipate”, “plan”, “estimate”, “should”, “will”, “intend”, “outlook”, or similar expressions. Forward- looking statements are based on current management expectations and, by their nature, are subject to risks and uncertainties. Actual results may differ materially from those contained in the forward-looking statements. Factors which may cause actual results to differ materially from those contained in such forward-looking statements include those identified in the Company’s most recent Form 10-K and subsequent SEC filings. Such factors are incorporated herein by reference. 1

OUR FOOTPRINT AND FRANCHISE 1 – Period end as of September 30, 2015; Loan pie chart excludes $0.4 billion installment and credit card portfolio 2 – Includes Missouri, Indiana, Ohio, Michigan and Iowa 3 – Houston and Dallas are not shown 1861 1999 2006 1987 2011 2011 2012 Deposits > $2 billion > $1 billion > $300 million 2 Largest bank headquartered in Wisconsin $27 billion in assets: Top 50 publicly traded bank holding company in the U.S. Over 200 banking locations serving over one million customers in over 100 communities Offering a full range of banking services and other financial products and services WI 37% IL 24% MN 12% In Footprint 11% Other 16% Third Quarter 20151 WI 66% IL 27% MN 7% Deposits $20.6 billion Loans $18.5 billion 2 Loan Production Office3

FASTEST GROWING BANK IN WISCONSIN GAINED DEPOSIT MARKET SHARE ACROSS OUR BRANCH FOOTPRINT1 3 Our continued focus on the customer experience has allowed us to gain market share in a competitive and transforming industry Added $2 billion in total deposits2 This growth trend continued in the third quarter of 2015 as we added over $1 billion of additional deposits We have outpaced the total deposit growth across our footprint The year-over-year growth was driven by granular (FDIC-insured) deposits and Net Customer funding activity Our multi-channel delivery model supports a higher level of granular deposits relative to our regional bank peers ASB +7.7% MN (16.4%) ASB +24.5% IL +6.9% ASB +10.6% WI +2.8% 1 – FDIC 2015 U.S Bank Branch Summary of Deposits; growth rates from June 30, 2014 to June 30, 2015 2 – Associated Banc-Corp; growth rates from June 30, 2014 to June 30, 2015 3 – Insured deposits (less than $250,000) covered by the FDIC; growth rates from June 30, 2014 to June 30, 2015 4 – Total deposits net of network transaction deposits and brokered funding 2015 YoY Deposit Growth1 Total Deposits2 +$2.0 billion +11% FDIC Insured3 +$1.4 billion +14% 2015 YoY Deposit Growth Total Net Customer Deposits2,4 +$1.2 billion +8%

ATTRACTIVE MIDWEST MARKETS We Serve a Large and Growing Market… Our footprint covers ~ 20% of the U.S. population1 Our footprint is estimated to have contributed ~ 30% of the country’s recent population growth1 …with Favorable Employment Dynamics Wisconsin, Michigan, Minnesota, Indiana, Iowa, and Ohio have unemployment rates below the national unemployment rate2 Our Markets have Demonstrated Consumer Credit Strength Eight of the Top 10 American cities with the highest credit scores are located within our footprint3 Seven of the Top 10 cities are located in our three state branch footprint The average FICO score on our residential lending portfolio is ~780 Top Concentration of Manufacturing Jobs Our footprint is home to ~ 30% of all manufacturing jobs in the U.S.4 Our footprint’s manufacturing labor force has grown over the past three years4 The Midwest attracts new manufacturing facilities due to favorable energy prices, better infrastructure, and government incentives 1 – US Census Bureau Annual Estimates of the Resident Population, 2011-2014 2 – US Bureau of Labor Statistics, Total Nonfarm Employees, September 2015 3 – Experian.com, 2014 Annual Credit Study, VantageScore registered trademark 4 – US Bureau of Labor Statistics, Manufacturing Industry Employees, 2011-2014 4

$4.1 $4.3 $5.3 $5.9 $6.7 $7.1 $3.4 $3.0 $3.4 $3.8 $4.0 $4.3 $2.8 $4.0 $4.4 $4.5 $4.9 $5.7 $2.6 $2.1 $1.8 $1.5 $1.5 $1.4 3Q 2010 3Q 2011 3Q 2012 3Q 2013 3Q 2014 3Q 2015 Commercial & Business Commercial Real Estate Residential Mortgage Home Equity & Installment GROWING THE LOAN PORTFOLIO (AVERAGE BALANCES, $ IN BILLIONS) 5 Cumulative Change 3Q 2010 – 3Q 2015 +$0.9 billion +$2.9 billion +$2.9 billion $15.7 $17.1 $14.9 $13.4 -$1.1 billion $18.5 1 – During the third quarter of 2015, the Corporation reclassified approximately $500 million of closed end first lien home equity loans to residential mortgage loans in order to better align with the Corporation's regulatory reporting of residential mortgage loan products. All prior periods have been restated to reflect this change. $12.9 1 1

$(77) $241 $437 $711 YEAR OVER YEAR LOAN GROWTH AVERAGE LOAN GROWTH OF $1.3 BILLION, OR 8% FROM THIRD QUARTER 2014 ($ IN MILLIONS) 6 Home Equity & Installment Commercial Real Estate Residential Mortgage Commercial & Business +6% +14% +7% (5%) Change 3Q 2014 – 3Q 2015

Community, Consumer, and Business Corporate and Commercial Specialty Consumer and Business Banking Community Markets Private Client and Institutional Services Corporate Banking Commercial Real Estate Lending Branch Banking Commercial Banking Residential Lending Payments and Direct Channels Rochester, MN Eau Claire, WI La Crosse, WI Central Wisconsin Rockford, IL Peoria, IL Southern Illinois Private Banking Personal Trust Asset Management Retirement Plan Services Associated Financial Group Associated Investment Services Corporate Lending Specialized Lending Verticals Commercial Deposits and Treasury Management Capital Markets CRE Lending Real Estate Investment Trusts CRE Syndications CRE Tax Credits DIVERSE PORTFOLIO OF BUSINESSES 7

Our technology platform and offerings are often ahead of the many community banks that operate in our markets EVOLVING DELIVERY MODEL 8 Deployed new online lending and deposit sales solutions Redesigned AssociatedBank.com to enhance eCommerce Leveraging customer analytics and a virtual sales team to drive cross- sell Investing in technology to enable our branch colleagues to sell digital- channel adoption at the point of sale (i.e., instant activation) Shifting customer behavior and preferences are driving a migration to digital and self-service technologies ATM ~1/3 Teller ~2/3 Branch Transactions >50% >20% Online Banking Mobile Banking Deposit Customer Usage
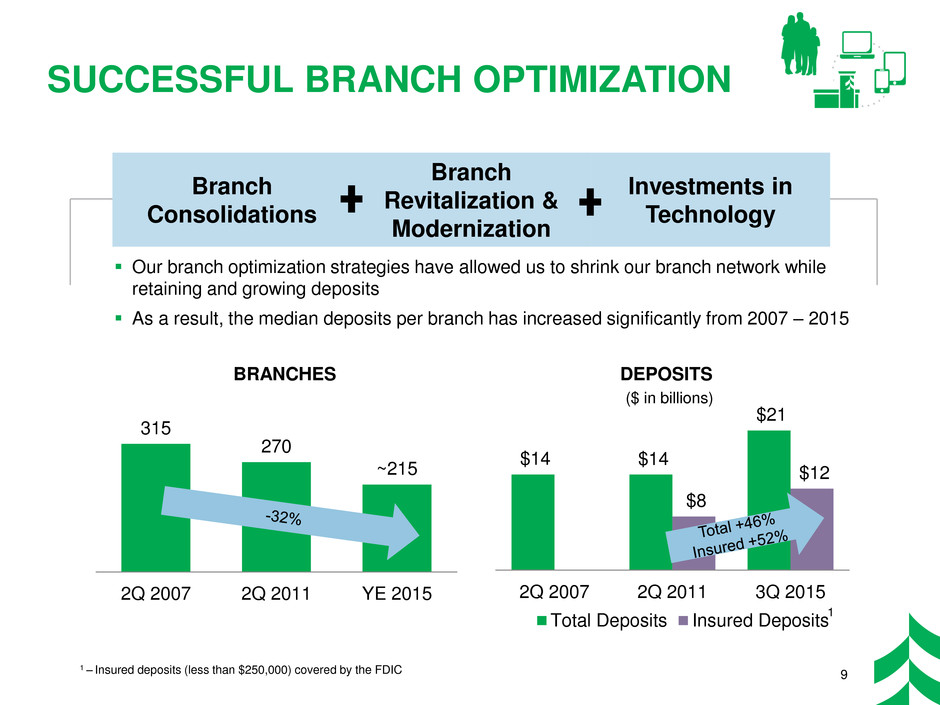
Our branch optimization strategies have allowed us to shrink our branch network while retaining and growing deposits As a result, the median deposits per branch has increased significantly from 2007 – 2015 SUCCESSFUL BRANCH OPTIMIZATION 9 Branch Consolidations Branch Revitalization & Modernization Investments in Technology 1 – Insured deposits (less than $250,000) covered by the FDIC 315 270 ~215 2Q 2007 2Q 2011 YE 2015 $14 $14 $21 $8 $12 2Q 2007 2Q 2011 3Q 2015 Total Deposits Insured Deposits ($ in billions) BRANCHES DEPOSITS 1

1 – Third quarter average 2 – Noninterest-bearing demand accounts 3 – Change in net interest income and earnings at risk due to instantaneous moves in benchmark interest rates. We evaluate the sensitivity using: 1) a dynamic forecast incorporating expected growth in the balance sheet, and 2) a static forecast where the current balance sheet is held constant. Commercial 7% Consumer 22% Commercial 55% Consumer 16% Interest Checking & Savings 22% CDs 8% NIB Demand 23% Money Market 47% ASSET SENSITIVE PROFILE 10 Loans1: Short End Exposure 1.2% 2.6% 1.2% 3.0% 100bps increase 200bps increase Dynamic Forecast Static Forecast Estimated % Change in Earnings3 Over 12 Months ASB’s deposit pricing has historically lagged Federal Reserve interest rate increases Senior management team successfully lagged the market during the last rate cycle (2004—2006) Asset sensitivity expected from deposit rate management Deposits1: Effective Beta ~0.5 Proven Experience Reprice or mature <1 year > 1 year Slow moving Fast moving 2

SECURITIES PORTFOLIO RESTRUCTURE 11 GNMA 50% FNMA & FHLMC 33% Municipals 17% Other <1% September 30, 20151 0% GNMA 20% FNMA & FHLMC2 20% Municipals 50%+ Other3 The shift has resulted in a better liquidity profile and has lowered our risk-weighted assets We will continue to optimize our portfolio as securities mature and the bank reinvests Strategic shift into Ginnie Mae Securities Enhances Our Regulatory Capital Measures GNMA 20% FNMA & FHLMC 63% Municipals 16% Other 1% September 30, 20141 Risk Weighting Profile 1 – Fair Value as of period end 2 – Federal National Mortgage Association (Fannie Mae) and Federal Home Loan Mortgage Corp (Freddie Mac) 3 – Includes Municipals, Agency and Other CMOs, and Corporates

DISCIPLINED CAPITAL PHILOSOPHY TARGETING CET1 RANGE OF 8.0% - 9.5% 12 7.9% 7.9% 7.9% 12.3% 12.2% 11.6% 11.5% 9.7% 9.4% 2007 2008 2009 2010 2011 2012 2013 2014 YTD 2015 Proactive capital management has restored capital to normalized levels; capital is modestly above pre-crisis levels Well positioned for changing economic cycles and future challenges DFAST: We remain “well-capitalized” throughout the forecasting horizon Share repurchase program is on “pause” Common Equity Tier 1 Ratio Basel III Basel I 4 Funding Organic Growth Paying a Competitive Dividend Non-organic Growth Opportunities Share Buybacks and Redemptions 1 2 3 4

71.1% 70.9% 69.2% 68.5% 68.1% $52 $67 $75 $80 $64 4,985 4,968 4,728 4,406 4,436 2011 2012 2013 2014 YTD 2015 3,400 3,600 3,800 4,000 4,200 4,400 4,600 4,800 5,000 $- $20 $40 $60 $80 $100 $120 $140 $160 $180 Technology & Equipment Spend FTE DRIVING EFFICIENCY ($ IN MILLIONS) Fully Tax-Equivalent Efficiency Ratio1 YTD 2015 = 68% Goal = Peer Average or Better 1 – The fully tax-equivalent efficiency ratio is a non-GAAP financial measure. Please refer to the appendix for the definition and a reconciliation of this measure to “efficiency ratio” as defined by the Federal Reserve. 2 – FTE = Average Full Time Equivalent Employees 13 Fully Tax-Equivalent Efficiency Ratio1 2 Back Office Initiatives Built end-to-end commercial loan system Outsourced testing & development Real Estate Initiatives Will close 100 branches by year end (2007 – 2015) Outsourced facilities and consolidated corporate offices Distribution Initiatives Built robust online and mobile sales tools Enhanced website

WHY ASSOCIATED 14 1– Diluted EPS and ROCET1 as of YTD 2015 ; the dividends per common share includes declared dividends 2 – Return on Average Common Equity Tier 1 (ROCET1). Management uses common equity tier 1, along with other capital measures to assess and monitor our capital position. This is a non-GAAP financial measure. Please refer to the appendix for a reconciliation of common equity tier 1 to common equity. Attractive Midwest Markets Diverse Portfolio of Businesses Growing Deposit Base Modern and Rapidly Evolving Delivery Model Asset Sensitive Profile Disciplined Capital Philosophy Management Team Focused on Creating Long-Term Value $0.04 $0.23 $0.33 $0.37 $0.41 $0.66 $1.00 $1.10 $1.16 $0.92 6.7% 9.5% 9.8% 9.9% 10.3% -1.5% 0.5% 2.5% 4.5% 6.5% 8.5% 10.5% $(0.10) $0.10 $0.30 $0.50 $0.70 $0.90 $1.10 $1.30 FY 2011 FY 2012 FY 2013 FY 2014 YTD 2015 Dividends per Common Share Diluted EPS ROCET1 1 2

APPENDIX

$153 $156 $161 $173 $171 3.23% 3.26% 3.13% 3.06% 2.82% 0.00 1.00 2.00 3.00 4.00 5.00 6.00 7.00 8.00 9.00 10.00 $100 $110 $120 $130 $140 $150 $160 $170 $180 3Q 2011 3Q 2012 3Q 2013 3Q 2014 3Q 2015 Net Interest Income Net Interest Margin 3.88% 3.73% 3.42% 3.29% 3.13% 4.36% 4.02% 3.72% 3.55% 3.38% 0.00% 1.00% 2.00% 3.00% 4.00% 5.00% 0.00% 1.00% 2.00% 3.00% 4.00% 5.00% 6.00% 7.00% 3Q 2011 3Q 2012 3Q 2013 3Q 2014 3Q 2015 Total Interest-earning Yield Total Loan Yield NET INTEREST INCOME AND MARGIN 16 Net Interest Income & Net Interest Margin Yield on Interest-earning Assets Cost of Interest-bearing Liabilities 0.56% 0.33% 0.23% 0.19% 0.22% 0.00% 0.20% 0.40% 0.60% 0.80% 1.00% 3Q 2011 3Q 2012 3Q 2013 3Q 2014 3Q 2015 Interest-bearing Deposit Costs Other Funding Costs 0.38% 0.29% 0.40%1 ($ in millions) 1 – Includes the effect of pre-funding $430 million of senior notes due 1Q 2016 0.62% 0.83%

NONINTEREST INCOME TRENDS ($ IN MILLIONS) $4 $10 $10 $14 $10 3Q 2011 3Q 2012 3Q 2013 3Q 2014 3Q 2015 Mortgage Banking (net) Income $60 $55 $58 $54 $64 $9 $26 $13 $20 $16 3Q 2011 3Q 2012 3Q 2013 3Q 2014 3Q 2015 Mortgage Banking (net) and Other Noninterest Income Core Fee-based Revenue $5 $16 $4 $7 $7 3Q 2011 3Q 2012 3Q 2013 3Q 2014 3Q 2015 Other Noninterest Income2 17 1 – Core Fee-based Revenue = Trust service fees plus service charges on deposit accounts plus card-based and other nondeposit fees plus insurance commissions plus brokerage and annuity commissions. This is a non-GAAP measure. Please refer to the press release tables for a reconciliation to noninterest income. 2 – Other Noninterest Income = Total noninterest income minus net mortgage banking income minus core fee-based revenue. This is a non-GAAP measure. Please refer to the press release tables for a reconciliation to noninterest income. $69 $81 $71 $75 $80 1 $11 $12 $11 $8 $18 3Q 2011 3Q 2012 3Q 2013 3Q 2014 3Q 2015 Insurance Commissions
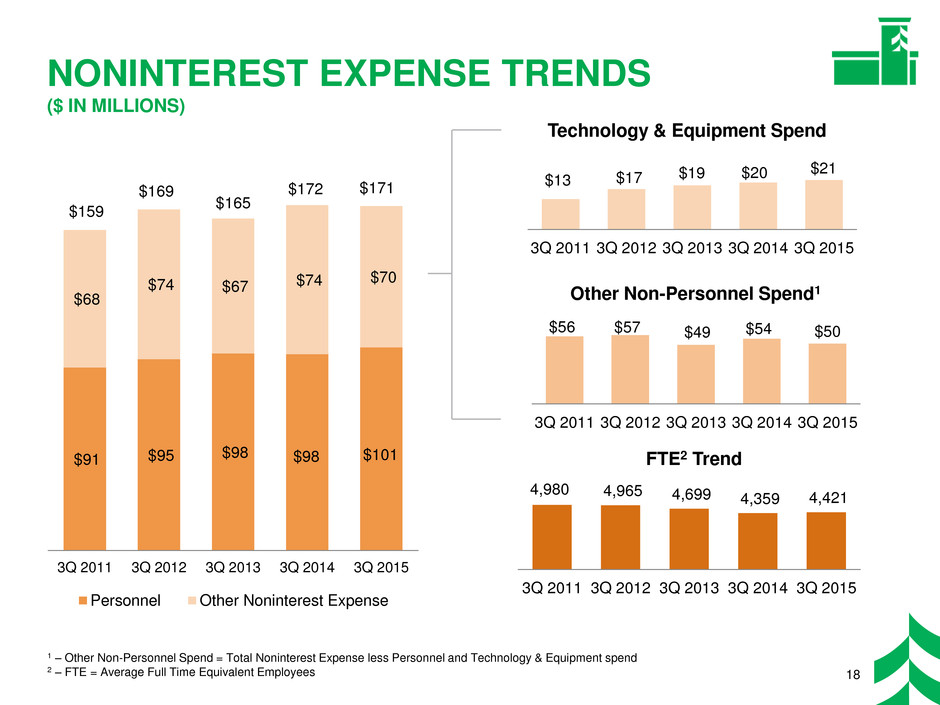
$91 $95 $98 $98 $101 $68 $74 $67 $74 $70 3Q 2011 3Q 2012 3Q 2013 3Q 2014 3Q 2015 Personnel Other Noninterest Expense NONINTEREST EXPENSE TRENDS ($ IN MILLIONS) $56 $57 $49 $54 $50 3Q 2011 3Q 2012 3Q 2013 3Q 2014 3Q 2015 Technology & Equipment Spend $13 $17 $19 $20 $21 3Q 2011 3Q 2012 3Q 2013 3Q 2014 3Q 2015 Other Non-Personnel Spend1 4,980 4,965 4,699 4,359 4,421 - 2,000 4,000 6,000 8,000 3Q 2011 3Q 2012 3Q 2013 3Q 2014 3Q 2015 18 FTE2 Trend $159 $169 $165 $172 $171 1 – Other Non-Personnel Spend = Total Noninterest Expense less Personnel and Technology & Equipment spend 2 – FTE = Average Full Time Equivalent Employees
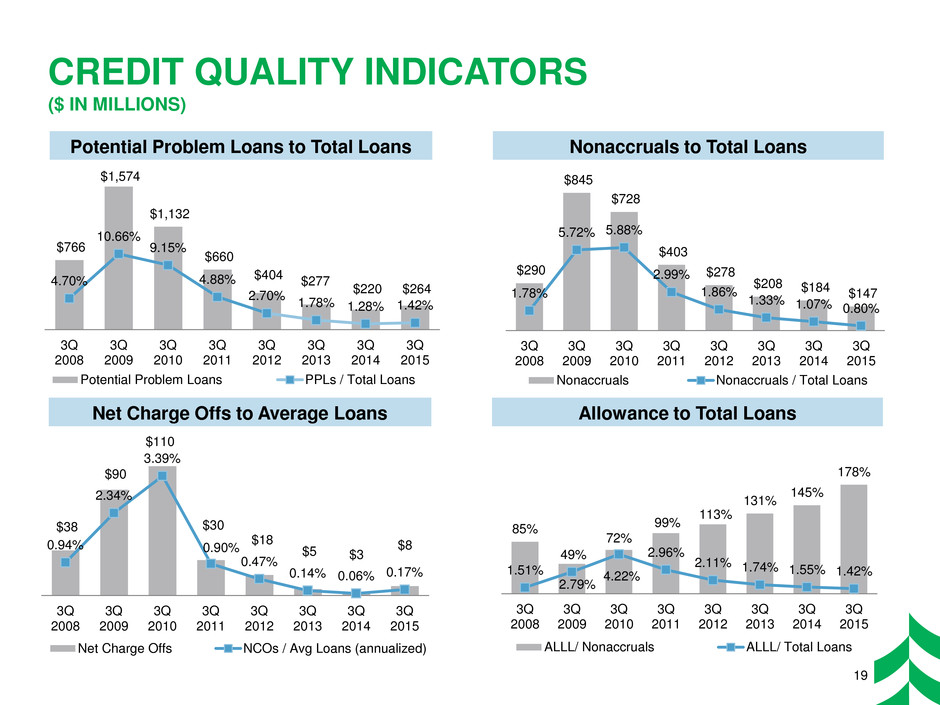
CREDIT QUALITY INDICATORS ($ IN MILLIONS) 19 $290 $845 $728 $403 $278 $208 $184 $147 1.78% 5.72% 5.88% 2.99% 1.86% 1.33% 1.07% 0.80% 0.50% 1.50% 2.50% 3.50% 4.50% 5.50% 6.50% 7.50% 8.50% 9.50% $- $48 $126 204 $ 832 6 40 $ 48 526 $604 872 $ 6 80 48 $926 $1004 812 $1 6 20 48 $1326 404 $1 852 6 60 $1 48 726 $1804 892 $1 6 200 48 $ 122 6 204 $ 8232 6 40 $ 42 8 526 $ 602 4 872 $ 6 280 48 $ 922 6 3004 $ 812 3 6 20 $ 48 3326 $ 404 3 852 $ 6 60 3 48 $ 726 3804 $ 892 3 6 400 $ 48 124 6 $ 204 8432 $ 6 40 44 8 $ 526 604 4 $ 872 6 480 $ 48 924 6 $5004 812 $5 6 20 48 $5326 404 $5 852 6 60 $5 48 726 $5804 892 $5 6 600 48 $ 126 6 204 $ 8632 6 40 $ 46 8 526 $ 606 4 872 $ 6 680 48 $ 926 6 7004 $ 812 7 6 20 $ 48 7326 $ 404 7 852 $ 6 60 7 48 $ 726 7804 $ 892 7 6 800 $ 48 128 6 $ 204 8832 $ 6 40 48 8 $ 526 608 4 $ 872 6 880 $ 48 928 6 $900 3Q 2008 3Q 2009 3Q 2010 3Q 2011 3Q 2012 3Q 2013 3Q 2014 3Q 2015 Nonaccruals Nonaccruals / Total Loans $38 $90 $110 $30 $18 $5 $3 $8 0.94% 2.34% 3.39% 0.90% 0.47% 0.14% 0.06% 0.17% 0.00% 1.00% 2.00% 3.00% 4.00% 5.00% $- $4 $8 $12 $16 $20 $24 $28 $32 $36 $40 $44 $48 $52 $56 $60 $64 $68 $72 $76 $80 $84 $88 $92 $96 $100 $104 $108 $112 $116 $120 $124 $128 $132 $136 $140 $144 $148 3Q 2008 3Q 2009 3Q 2010 3Q 2011 3Q 2012 3Q 2013 3Q 2014 3Q 2015 Net Charge Offs NCOs / Avg Loans (annualized) 85% 49% 72% 99% 113% 131% 145% 178% 1.51% 2.79% 4.22% 2.96% 2.11% 1.74% 1.55% 1.42% 1.00% 2.00% 3.00% 4.00% 5.00% 6.00% 7.00% 8.00% 9.00% 10.00% 0% 80% 160% 3Q 2008 3Q 2009 3Q 2010 3Q 2011 3Q 2012 3Q 2013 3Q 2014 3Q 2015 ALLL/ Nonaccruals ALLL/ Total Loans $766 $1,574 $1,132 $660 $404 $277 $220 $264 4.70% 10.66% 9.15% 4.88% 2.70% 1.78% 1.28% 1.42% 0.50% 2.50% 4.50% 6.50% 8.50% 10.50% 12.50% 14.50% 16.50% 18.50% $- $48 $126 204 $ 832 640 $ 48 526 $604 8 72 $ 680 48 $926 $1004 812 $1 620 48 $1326 40 4 $1 852 660 $1 48 726 $1804 892 $1 6200 48 $ 12 2 6 204 $ 8232 640 $ 42 8 526 $ 602 4 872 $ 6280 4 8 $ 922 6 3004 $ 812 3 620 $ 48 3326 $ 404 3 852 $ 6 60 3 48 $ 726 3804 $ 892 3 6400 $ 48 124 6 $ 204 8 432 $ 640 44 8 $ 526 604 4 $ 872 6480 $ 48 924 6 $500 4 812 $5 620 48 $5326 404 $5 852 660 $5 48 72 6 $5804 892 $5 6600 48 $ 126 6 204 $ 8632 640 $ 4 6 8 526 $ 606 4 872 $ 6680 48 $ 926 6 7004 $ 812 7 6 20 $ 48 7326 $ 404 7 852 $ 660 7 48 $ 726 7804 $ 8 92 7 6800 $ 48 128 6 $ 204 8832 $ 640 48 8 $ 526 60 8 4 $ 872 6880 $ 48 928 6 $9004 812 $9 620 48 $932 6 404 $9 852 660 $9 48 726 $9804 892 $9 6 $1,0004 , 812 $1,0 620 , 48 $1,0326 , 40 4 $1,0 852 , 660 $1,0 48 , 726 $1,0804 , 892 $1,0 6100 , 48 $1, 12 1 6 , 204 $1, 8132 , 640 $1, 41 8 , 526 $1, 601 4 , 872 $1, 6180 , 4 8 $1, 921 6 ,2004 $1, 812 ,2 620 $1, 48 ,2326 $1, 404 ,2 852 $1, 6 60 ,2 48 $1, 726 ,2804 $1, 892 ,2 6300 $1, 48 , 123 6 $1, 204 , 8 332 $1, 640 , 43 8 $1, 526 , 603 4 $1, 872 , 6380 $1, 48 , 923 6 $1,400 4 , 812 $1,4 620 , 48 $1,4326 , 404 $1,4 852 , 660 $1,4 48 , 72 6 $1,4804 , 892 $1,4 6500 , 48 $1, 125 6 , 204 $1, 8532 , 640 $1, 4 5 8 , 526 $1, 605 4 , 872 $1, 6580 , 48 $1, 925 6 ,600 3Q 2008 3Q 2009 3Q 2010 3Q 2011 3Q 2012 3Q 2013 3Q 2014 3Q 2015 Potential Problem Loans PPLs / Total Loans Potential Problem Loans to Total Loans Nonaccruals to Total Loans Net Charge Offs to Average Loans Allowance to Total Loans

OIL AND GAS LENDING UPDATE 20 Portfolio Update Oil & Gas 4% All Other Loans 96% Exclusively focused on the upstream sector (‘Exploration and Production’ or ‘E&P’ sector) Oil & Gas period end loans were relatively flat in the third quarter Reserve Update $95 $321 $414 $663 $758 2.31% 2.44% 1.56% 1.92% 3.83% 1.00% 2.00% 3.00% 4.00% 5.00% 6.00% 7.00% 8.00% $5 $105 $205 $305 $405 $505 $605 $705 $805 3Q 2011 3Q 2012 3Q 2013 3Q 2014 3Q 2015 Period End Loans Reserve % ($ in millions) We proactively risk grade and reserve accordingly against our loan portfolio Fall borrowing base re- determinations are underway Lower market pricing led to downward rating migration within the portfolio Increased reserves to $29 million, up $3 million from the second quarter 3Q 2015 Loan Composition 50 clients Over $1 billion in aggregate commitments Average commitment of $20 million

LOANS BY INDUSTRY AND STATE SEPTEMBER 2015 PERIOD END BALANCES 21 Manufacturing 21% Other 12% Oil & Gas 11% Finance & Insurance 11% Real Estate 10% Wholesale Trade 9% Power & Utilities 9% Retail Trade 4% Health Care and Soc. Assist. 5% Profsnl, Scientific, and Tech Svs 3% Rental and Leasing Svs 3% Transport. and Whsing 2% C&BL by Industry ($7.1 billion) Wisconsin 32% Illinois 16% Minnesota 11% In- Footprint1 8% Other 33% C&BL by State ($7.1 billion) Multi-Family 21% Office / Mixed Use 19% Construction 27% Retail 19% Industrial 7% Other 3% Hotel / Motel 4% CRE by Industry ($4.3 billion) CRE by State ($4.3 billion) Wisconsin 34% Illinois 22% Minnesota 9% In Footprint1 24% Other 11% Residential Mortgage by State ($5.7 billion) Wisconsin 40% Illinois 37% Minnesota 14% In- Footprint1 8% Other 1% Home Equity by State ($1.0 billion) Wisconsin 67% Illinois 18% Minnesota 13% Other 2% 1 – Includes Missouri, Indiana, Ohio, Michigan and Iowa
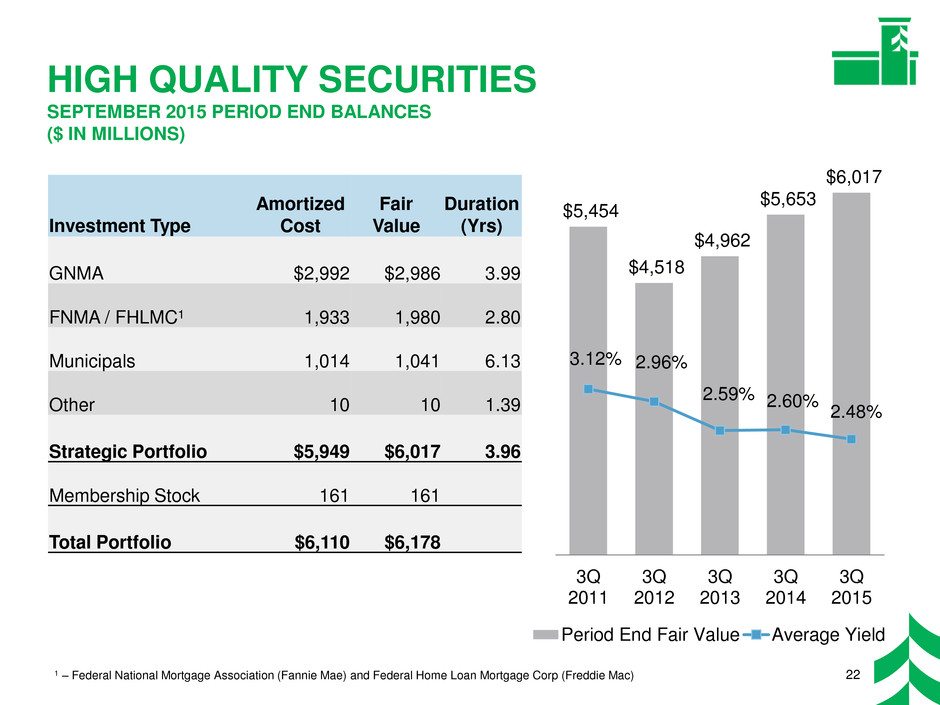
HIGH QUALITY SECURITIES SEPTEMBER 2015 PERIOD END BALANCES ($ IN MILLIONS) 22 $5,454 $4,518 $4,962 $5,653 $6,017 3.12% 2.96% 2.59% 2.60% 2.48% 1.00% 2.00% 3.00% 4.00% 5.00% 6.00% $- $0.01326 390. 52 $0.06578 . 91104 $0. 1730 430.156 $ 6982 0. 95208 $ 21 0. 34 47260 $0. 7386 990.312 $ 2538 0. 51364 $ 770. 90 40316 $0. 2942 455 0. 68 $ 8194 0.50720 $ 330. 46 55972 $0. 8598 6110. 24 $ 3750 0.66376 $ 89 0.702 1528 $0. 41754 670. 80 $ 93806 0. 1932 $ 450.858 7184 $0. 970.910 23 . 36 $ 490.962 7588 $1.00114 271. 40 $ 05366 1. 7992 $ 1051. 18 3144 $1.157 70 831. 96 $ 20922 1. 3548 $ 2611. 74 87300 $1. 1326 391.352 $ 6578 1. 91 404 $ 171. 30 43456 $1. 6982 951.508 $ 2134 1. 47560 $ 731. 86 99612 $1. 25 38 511.664 $ 7790 1.70316 $ 291. 42 7551. 68 $ 81. 94 8071. 20 $ 3346 1.859 72 $ 851. 98 91124 $1. 3750 9631. 76 $ 892.002 1528 $2. 41054 672. 80 $ 93 106 2. 1932 $ 452.158 7184 $2. 97210 232. 36 $ 49262 2. 7588 $ 3012. 14 27 40 $2.35366 792. 92 $ 40518 2. 3144 $ 4572. 70 8396 $2.50922 352. 48 $ 561 74 2. 87600 $2. 1326 . 39652 $2. 6578 912.704 $ 1730 2. 43756 $ 692. 82 95 808 $2. 2134 472.860 $ 7386 2. 99912 $ 252. 38 51964 $2. 7790 3.00316 $ 29 3. 42 05568 $3. 8194 1073. 20 $ 3346 3.15972 $ 853. 98 21124 $3. 3750 263 3. 76 $ 89302 3. 1528 $ 413.354 6780 $3. 93406 193. 32 $ 453.458 71. 84 $ 97 3.510 2336 $3. 49562 753. 88 $ 60114 3. 2740 $ 6533. 66 7992 $3.70518 31 3. 44 $ 75770 3. 8396 $ 8093. 22 3548 $3.86174 873.900 $ 1326 3. 39952 $ 65 3. 78 914.004 $ 1730 4. 43056 $ 694. 82 95108 $4. 2134 474.160 $ 7386 4. 99 212 $ 254. 38 51264 $4. 7790 3034. 16 $ 29. 42 3554. 68 $ 8194 4.40720 $ 33 4. 46 45972 $4. 8598 5114. 24 $ 3750 4.56376 $ 894.602 1528 $4. 41654 67 4. 80 $ 93706 4. 1932 $ 454.758 7184 $4. 97810 234. 36 $ 49862 4. 7588 $ 901 4. 14 2740 $4.95366 794. 92 $5.00518 315. 44 $ 05770 5. 8396 $ 1095. 22 35 48 $5.16174 . 87200 $5. 1326 395.252 $ 6578 5. 91304 $ 175. 30 43356 $5. 69 82 955.408 $ 2134 5. 47460 $ 735. 86 99512 $5. 2538 515.564 $ 7790 5.603 16 $ 295. 42 65568 $5. 8194 7075. 20 $ 3346 5.75972 $ 855. 98 81124 $5. 37 50 8635. 76 $ 89902 5. 1528 $ 415.954 6780 $5. 936.006 6. 1932 $ . 45058 6. 71 84 $ 976.110 2336 $6. 49162 756. 88 $ 20114 6. 2740 $ 2536. 66 7992 $6.305 18 316. 44 $ 35770 6. 8396 $ 4096. 22 3548 $6.46174 876.500 3Q 2011 3Q 2012 3Q 2013 3Q 2014 3Q 2015 Period End Fair Value Average Yield Investment Type Amortized Cost Fair Value Duration (Yrs) GNMA $2,992 $2,986 3.99 FNMA / FHLMC1 1,933 1,980 2.80 Municipals 1,014 1,041 6.13 Other 10 10 1.39 Strategic Portfolio $5,949 $6,017 3.96 Membership Stock 161 161 Total Portfolio $6,110 $6,178 1 – Federal National Mortgage Association (Fannie Mae) and Federal Home Loan Mortgage Corp (Freddie Mac)

RECONCILIATION AND DEFINITIONS OF NON-GAAP ITEMS Efficiency Ratio Reconciliation: 2011 2012 2013 2014 YTD 2015 Federal Reserve efficiency ratio 73.33% 72.92% 71.05% 70.28% 69.79% Taxable equivalent adjustment (1.73) (1.61) (1.46) (1.36) (1.38) Other intangible amortization (0.51) (0.43) (0.41) (0.39) (0.34) Fully tax-equivalent efficiency ratio 71.09% 70.88% 69.18% 68.53% 68.07% The efficiency ratio is defined by the Federal Reserve guidance as noninterest expense (which includes the provision for unfunded commitments) divided by the sum of net interest income plus noninterest income, excluding investment securities gains / losses, net. The fully tax-equivalent efficiency ratio is noninterest expense (which includes the provision for unfunded commitments), excluding other intangible amortization, divided by the sum of taxable equivalent net interest income plus noninterest income, excluding investment securities gains / losses. Management believes the fully tax-equivalent efficiency ratio, which adjusts net interest income for the tax-favored status of certain loans and investment securities, to be the preferred industry measurement as it enhances the comparability of net interest income arising from taxable and tax-exempt sources. This differs from prior presentations. All periods have been adjusted to conform. 23 Update Common Equity Tier 1 Reconciliation: ($ in thousands) 2011 2012 2013 2014 YTD 2015 Common equity $2,802,522 $2,873,127 $2,829,428 $2,740,524 $2,832,418 Goodwill & intangibles, net of DTLs (948,590) (944,395) (940,352) (936,605) (949,716) Tangible common equity 1,853,932 1,928,732 1,889,076 1,803,919 1,882,702 Accumulated other comprehensive income (65,602) (48,603) 24,244 4,850 (15,376) Disallowed servicing assets/Deferred Tax Assets (4,815) (4,595) (437) (2,037) Common equity tier 1 $1,783,515 $1,875,534 $1,913,320 $1,808,332 $1,865,289 Common equity tier 1, a non-GAAP financial measure, is used by banking regulators, investors and analysts to assess and compare the quality and composition of our capital with the capital of other financial services companies. Management uses common equity tier 1, along with other capital measures, to assess and monitor our capital position. Common equity tier 1 for 2015 follows Basel III and is defined as common stock and related surplus, net of treasury stock, plus retained earnings. Common equity tier 1 for 2014 follows Basel I and is defined as tier 1 capital excluding qualifying perpetual preferred stock and qualifying trust preferred securities.
