Attached files
| file | filename |
|---|---|
| 8-K - 8-K - ELECTRONICS FOR IMAGING INC | d37409d8k.htm |
| EX-99.1 - EX-99.1 - ELECTRONICS FOR IMAGING INC | d37409dex991.htm |
| Exhibit 99.2
|

Print is Everywhere,
and It’s Going Digital Investor Day 2015
|
|
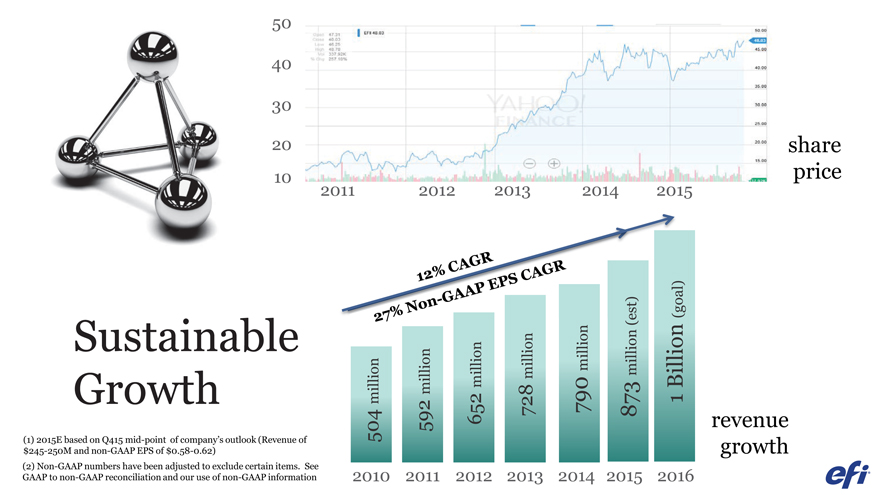
50 40 30
20 share
10 2013 price 2011 2012 2014 2015
( Sustainable million million million million Billion million Growth million 1
504 592 652 728 790 873 revenue
(1) 2015E based on Q415 mid-point of company’s outlook (Revenue of growth $245-250M and non-GAAP EPS of $0.58-0.62) (2) Non-GAAP numbers have been adjusted to exclude certain items. See GAAP to non-GAAP reconciliation and our use of non-GAAP information
2010 2011 2012 2013 2014 2015 2016
|
|
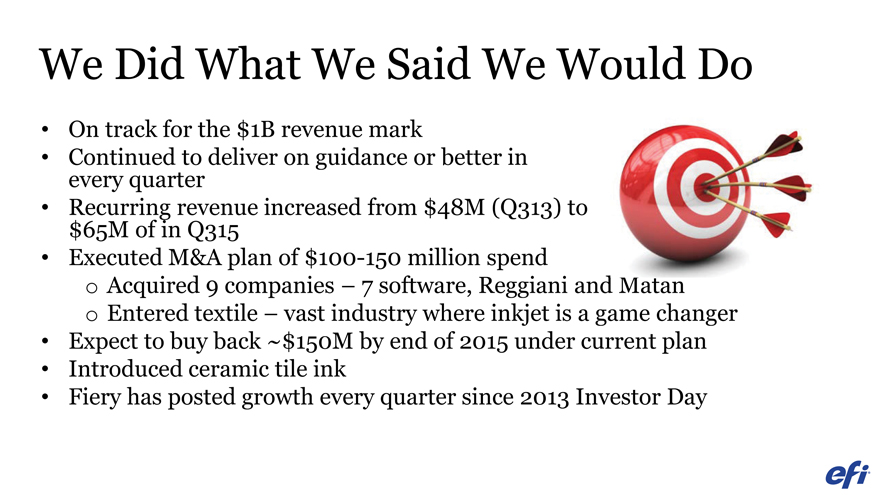
We Did What We Said We Would Do
On track for the $1B revenue mark
Continued every quarter to deliver on guidance or better in
Recurring $65M of in revenue Q315 increased from $48M (Q313) to
Executed M&A plan of $100-150 million spend o Acquired 9 companies – 7 software, Reggiani and Matan o Entered textile – vast industry where inkjet is a game changer
Expect to buy back ~$150M by end of 2015 under current plan
Introduced ceramic tile ink
Fiery has posted growth every quarter since 2013 Investor Day
|
|
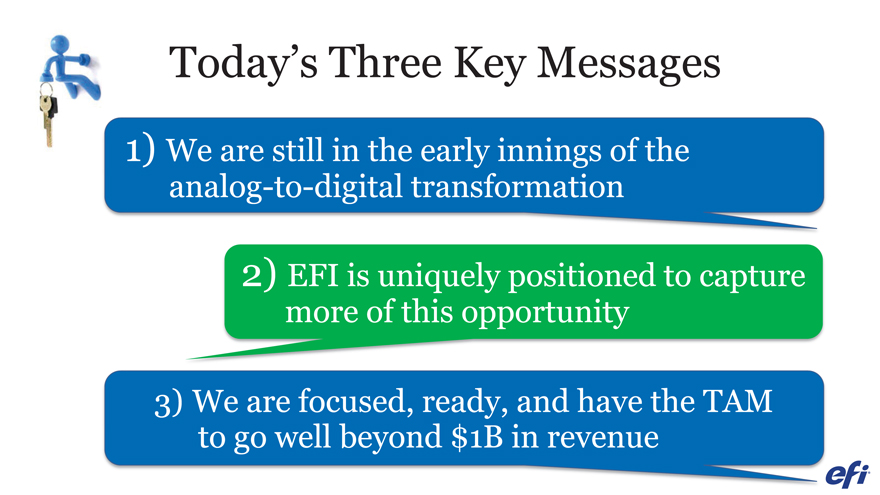
Today’s Three Key Messages
1) We are still in the early innings of the analog-to-digital transformation
2) EFI is uniquely positioned to capture more of this opportunity
3) We are focused, ready, and have the TAM to go well beyond $1B in revenue
|
|
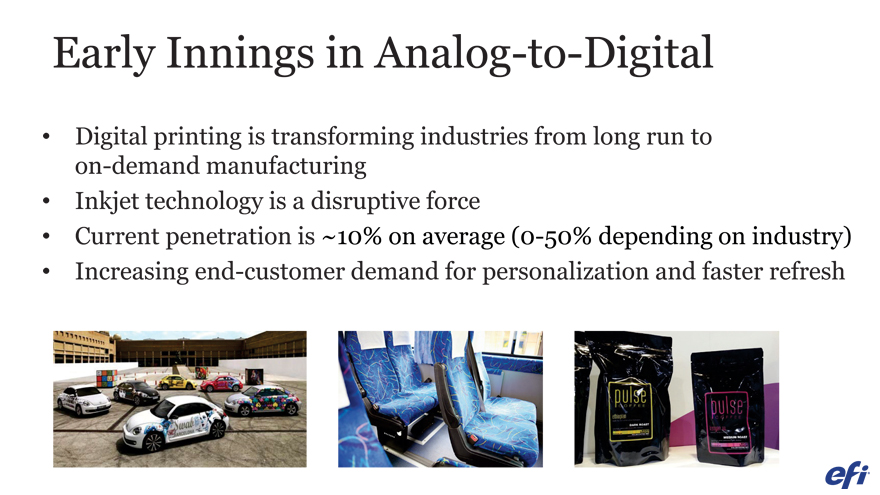
Early Innings in Analog-to-Digital
Digital printing is transforming industries from long run to on-demand manufacturing
Inkjet technology is a disruptive force
Current penetration is ~10% on average (0-50% depending on industry)
Increasing end-customer demand for personalization and faster refresh
|
|
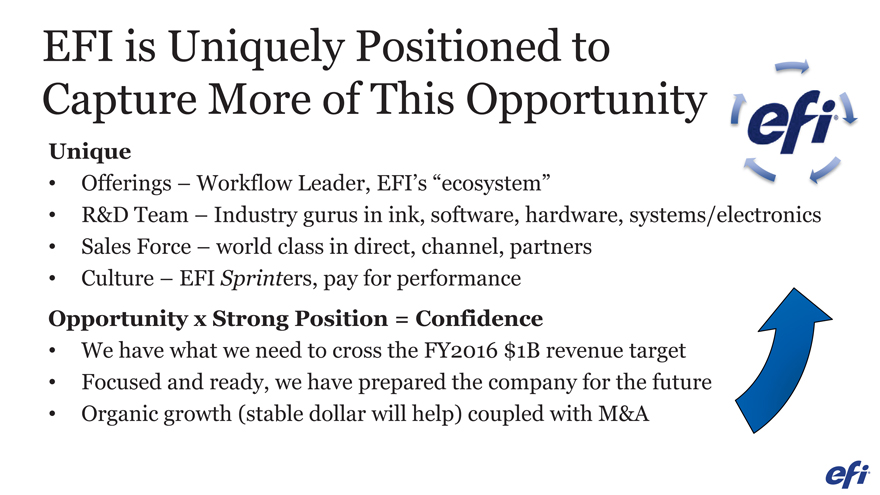
EFI is Uniquely Positioned to Capture More of This Opportunity
Unique
Offerings – Workflow Leader, EFI’s “ecosystem”
R&D Team – Industry gurus in ink, software, hardware, systems/electronics
Sales Force – world class in direct, channel, partners
Culture – EFI Sprinters, pay for performance
Opportunity x Strong Position = Confidence
We have what we need to cross the FY2016 $1B revenue target
Focused and ready, we have prepared the company for the future
Organic growth (stable dollar will help) coupled with M&A
|
|
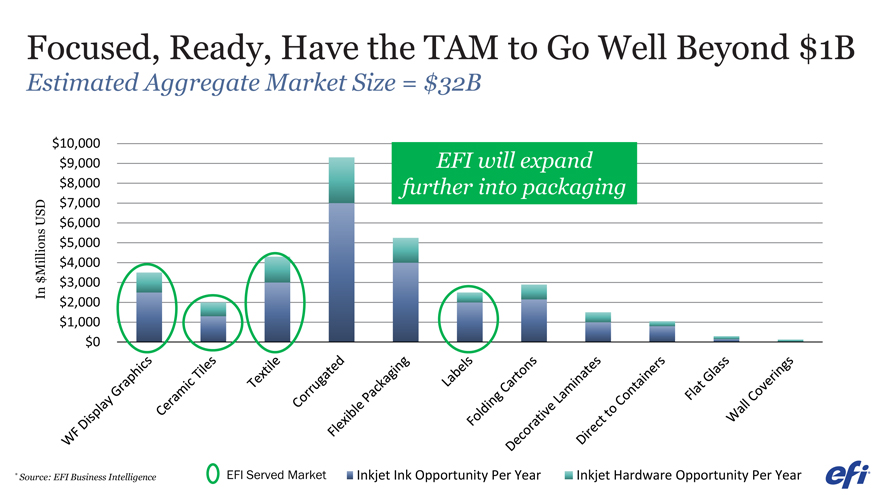
Focused, Ready, Have the TAM to Go Well Beyond $1B
Estimated Aggregate Market Size = $32B
$10,000
$9,000 EFI will expand $8,000 further into packaging
USD $7,000 $6,000 $5,000
Millions $4,000 $ $3,000 In $2,000 $1,000 $0
* Source: EFI Business Intelligence EFI Served Market Inkjet Ink Opportunity Per Year Inkjet Hardware Opportunity Per Year
|
|

Financial Overview
Marc Olin CFO
|
|
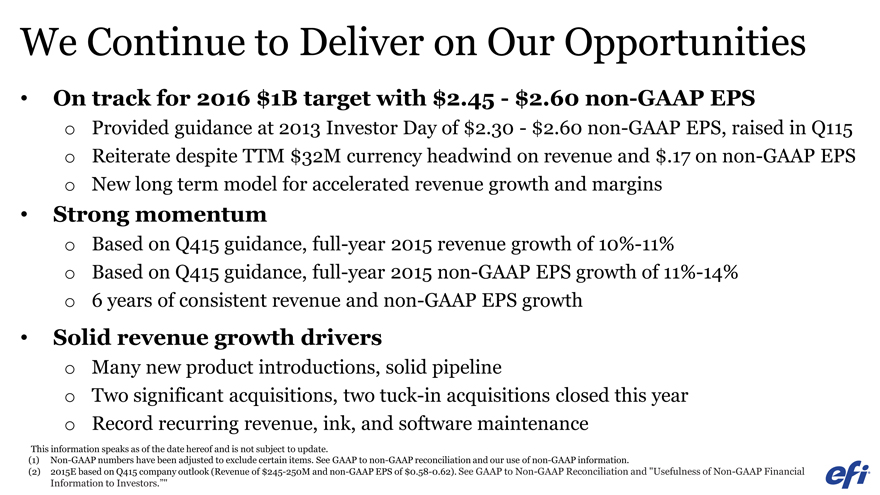
We Continue to Deliver on Our Opportunities
On track for 2016 $1B target with $2.45—$2.60 non-GAAP EPS
o Provided guidance at 2013 Investor Day of $2.30—$2.60 non-GAAP EPS, raised in Q115 o Reiterate despite TTM $32M currency headwind on revenue and $.17 on non-GAAP EPS o New long term model for accelerated revenue growth and margins
Strong momentum
o Based on Q415 guidance, full-year 2015 revenue growth of 10%-11% o Based on Q415 guidance, full-year 2015 non-GAAP EPS growth of 11%-14% o 6 years of consistent revenue and non-GAAP EPS growth
Solid revenue growth drivers
o Many new product introductions, solid pipeline o Two significant acquisitions, two tuck-in acquisitions closed this year o Record recurring revenue, ink, and software maintenance
This information speaks as of the date hereof and is not subject to update.
(1) Non-GAAP numbers have been adjusted to exclude certain items. See GAAP to non-GAAP reconciliation and our use of non-GAAP information.
(2) 2015E based on Q415 company outlook (Revenue of $245-250M and non-GAAP EPS of $0.58-0.62). See GAAP to Non-GAAP Reconciliation and “Usefulness of Non-GAAP Financial Information to Investors.””
|
|
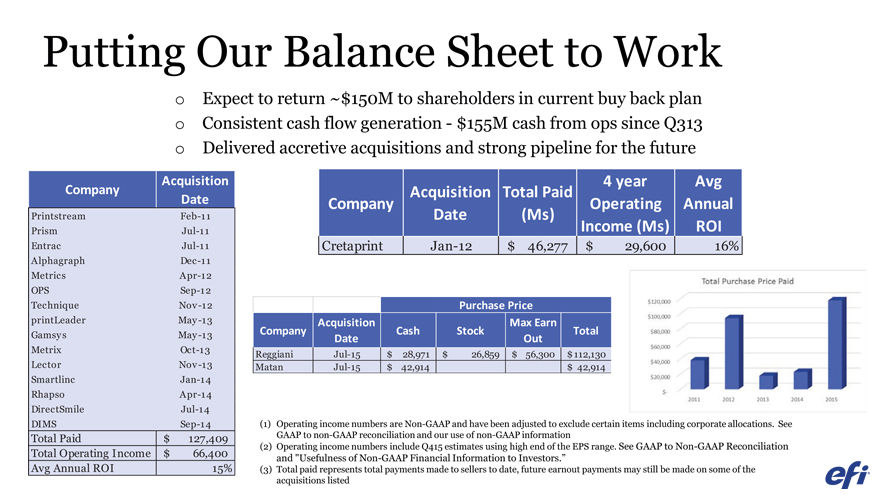
Putting Our Balance Sheet to Work
o Expect to return ~$150M to shareholders in current buy back plan o Consistent cash flow generation—$155M cash from ops since Q313 o Delivered accretive acquisitions and strong pipeline for the future
Company Acquisition
Date
Printstream Feb-11
Prism Jul-11
Entrac Jul-11
Alphagraph Dec -11
Metrics Apr-12
OPS Sep-12
Technique Nov -12
printLeader May -13
Gamsys May -13
Metrix Oct-13
Lector Nov -13
Smartlinc Jan-14
Rhapso Apr-14
DirectSmile Jul-14
DIMS Sep-14
Total Paid $ 127,409
Total Operating Income $ 66,400
Avg Annual ROI 15%
Acquisition Total Paid 4 year Avg
Company Operating Annual
Date (Ms) Income (Ms) ROI
Cretaprint Jan-12 $ 46,277 $ 29,600 16%
(1) Operating income numbers are Non-GAAP and have been adjusted to exclude certain items including corporate allocations. See GAAP to non-GAAP reconciliation and our use of non-GAAP information (2) Operating income numbers include Q415 estimates using high end of the EPS range. See GAAP to Non-GAAP Reconciliation and “Usefulness of Non-GAAP Financial Information to Investors.”
(3) Total paid represents total payments made to sellers to date, future earnout payments may still be made on some of the acquisitions listed
|
|
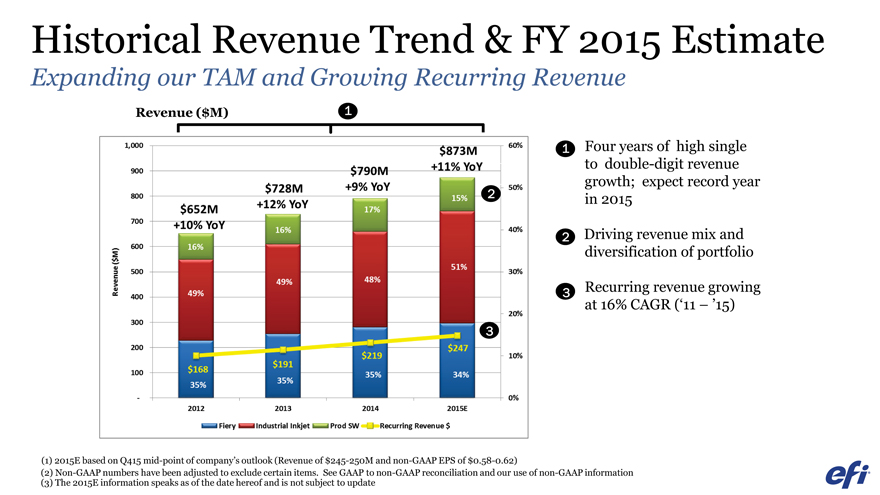
Historical Revenue Trend & FY 2015 Estimate
Expanding our TAM and Growing Recurring Revenue
Revenue ($M) 1
~
~
2
~
3
1 Four years of high single to double-digit revenue growth; expect record year in 2015
2 Driving revenue mix and diversification of portfolio
3 Recurring revenue growing at 16% CAGR (‘11 – ’15)
(1) 2015E based on Q415 mid-point of company’s outlook (Revenue of $245-250M and non-GAAP EPS of $0.58-0.62)
(2) Non-GAAP numbers have been adjusted to exclude certain items. See GAAP to non-GAAP reconciliation and our use of non-GAAP information (3) The 2015E information speaks as of the date hereof and is not subject to update
|
|
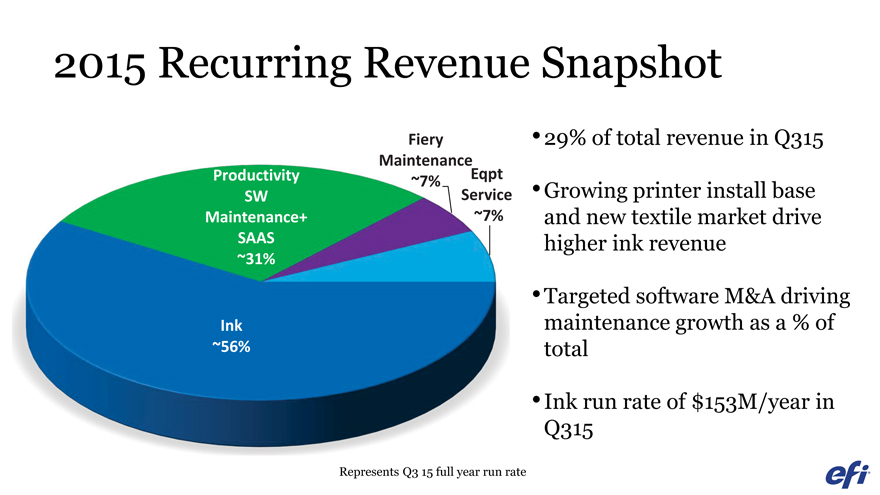
2015 Recurring Revenue Snapshot
Fiery •29% of total revenue in Q315
Maintenance Productivity ~7% Eqpt
SW Service •Growing printer install base Maintenance+ ~7% and new textile market drive SAAS higher ink revenue
~31%
Targeted software M&A driving Ink maintenance growth as a % of ~56% total Ink run rate of $153M/year in Q315
Represents Q3 15 full year run rate
|
|
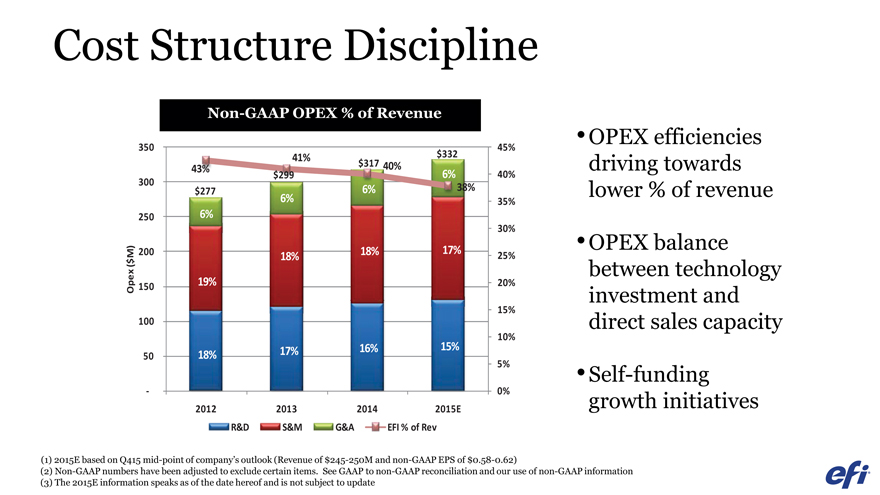
Cost Structure Discipline
Non-GAAP OPEX % of Revenue
350
300
250
( $M)
200
Opex
150
100
50
-
45% 41% $332 43% $317 40% 40% $299 6% $277 6% 38%
6% 35%
6%
30%
18% 17% 25% 18% 19% 20%
15%
10%
17% 16% 15% 18%
5%
0% 2012 2013 2014 2015E
R&D S&M G&A EFI % of Rev
OPEX efficiencies driving towards lower % of revenue OPEX balance between technology investment and direct sales capacity Self-funding growth initiatives
(1) 2015E based on Q415 mid-point of company’s outlook (Revenue of $245-250M and non-GAAP EPS of $0.58-0.62)
(2) Non-GAAP numbers have been adjusted to exclude certain items. See GAAP to non-GAAP reconciliation and our use of non-GAAP information (3) The 2015E information speaks as of the date hereof and is not subject to update
|
|
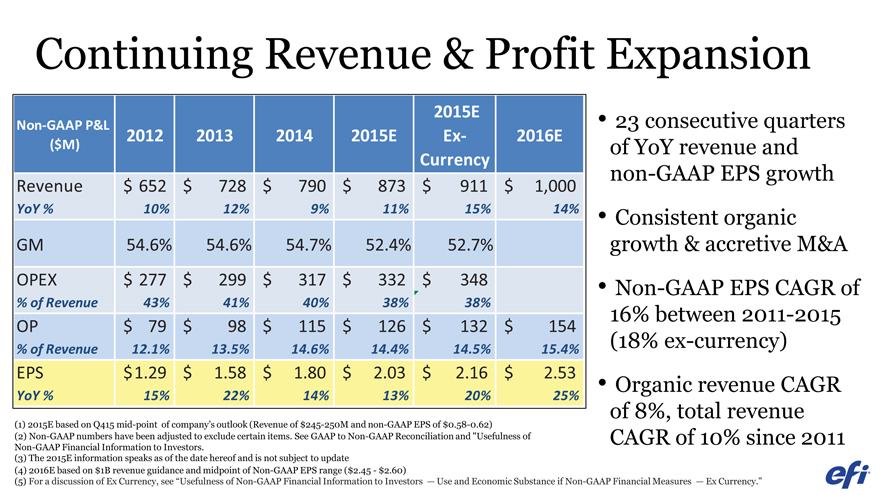
Continuing Revenue & Profit Expansion
2015E
Non-GAAP P&L
($M) 2012 2013 2014 2015E Ex- 2016E
Currency
Revenue $ 652 $ 728 $ 790 $ 873 $ 911 $ 1,000
YoY % 10% 12% 9% 11% 15% 14%
GM 54.6% 54.6% 54.7% 52.4% 52.7%
OPEX $ 277 $ 299 $ 317 $ 332 $ 348
% of Revenue 43% 41% 40% 38% 38%
OP $ 79 $ 98 $ 115 $ 126 $ 132 $ 154
% of Revenue 12.1% 13.5% 14.6% 14.4% 14.5% 15.4%
EPS $ 1.29 $ 1.58 $ 1.80 $ 2.03 $ 2.16 $ 2.53
YoY % 15% 22% 14% 13% 20% 25%
23 consecutive quarters of YoY revenue and non-GAAP EPS growth
Consistent organic growth & accretive M&A
Non-GAAP EPS CAGR of 16% between 2011-2015 (18% ex-currency)
Organic revenue CAGR of 8%, total revenue CAGR of 10% since 2011
(1) 2015E based on Q415 mid-point of company’s outlook (Revenue of $245-250M and non-GAAP EPS of $0.58-0.62) (2) Non-GAAP numbers have been adjusted to exclude certain items. See GAAP to Non-GAAP Reconciliation and “Usefulness of Non-GAAP Financial Information to Investors.
(3) The 2015E information speaks as of the date hereof and is not subject to update
(4) 2016E based on $1B revenue guidance and midpoint of Non-GAAP EPS range ($2.45—$2.60)
(5) For a discussion of Ex Currency, see “Usefulness of Non-GAAP Financial Information to Investors — Use and Economic Substance if Non-GAAP Financial Measures — Ex Currency.”
|
|
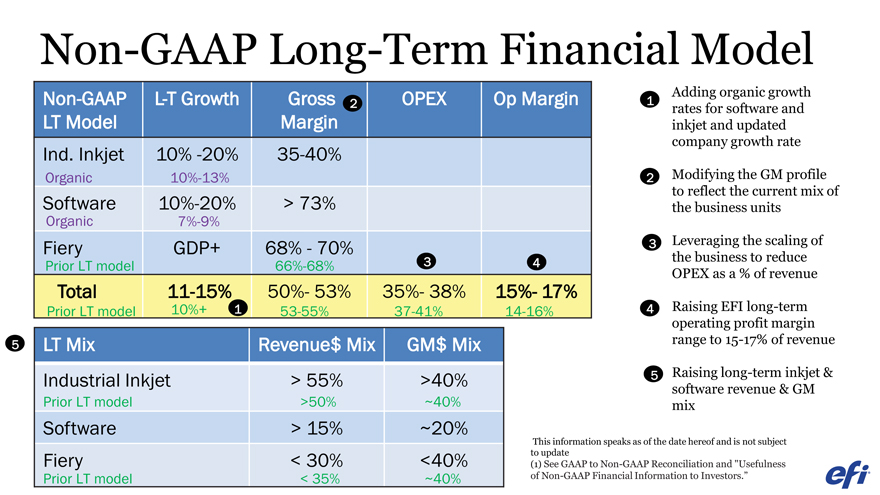
Non-GAAP Long-Term Financial Model
Non-GAAP L-T Growth Gross 2 OPEX Op Margin
LT Model Margin
Ind. Inkjet 10% -20% 35-40%
Organic 10%-13%
Software 10%-20% > 73%
Organic 7%-9%
Fiery GDP+ 68%—70%
Prior LT model 66%-68% 3 4
Total 11-15% 50%- 53% 35%- 38% 15%- 17%
Prior LT model 10%+ 1 53-55% 37-41% 14-16%
5 LT Mix Revenue$ Mix GM$ Mix
Industrial Inkjet > 55% >40%
Prior LT model >50% ~40%
Software > 15% ~20%
Fiery < 30% <40%
Prior LT model < 35% ~40%
Adding organic growth
1 rates for software and inkjet and updated company growth rate
2 Modifying the GM profile to reflect the current mix of the business units
3 Leveraging the scaling of the business to reduce OPEX as a % of revenue
4 Raising EFI long-term operating profit margin range to 15-17% of revenue
5 Raising long-term inkjet & software revenue & GM mix
This information speaks as of the date hereof and is not subject to update (1) See GAAP to Non-GAAP Reconciliation and “Usefulness of Non-GAAP Financial Information to Investors.”
|
|
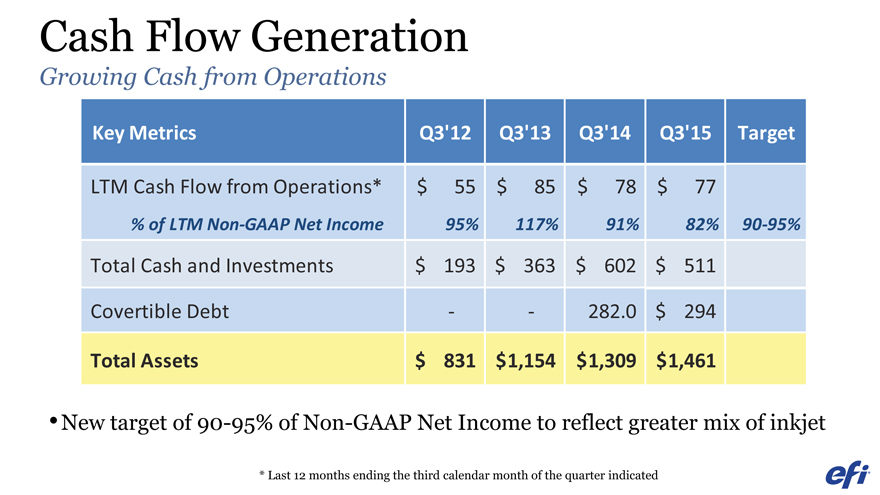
Cash Flow Generation
Growing Cash from Operations
New target of 90-95% of Non-GAAP Net Income to reflect greater mix of inkjet
* Last 12 months ending the third calendar month of the quarter indicated
Key Metrics Q3’12 Q3’13 Q3’14 Q3’15 Target
LTM Cash Flow from Operations* $ 55 $ 85 $ 78 $ 77
% of LTM Non-GAAP Net Income 95% 117% 91% 82% 90-95%
Total Cash and Investments $ 193 $ 363 $ 602 $ 511
Covertible Debt — 282.0 $ 294
Total Assets $ 831 $ 1,154 $ 1,309 $ 1,461
|
|
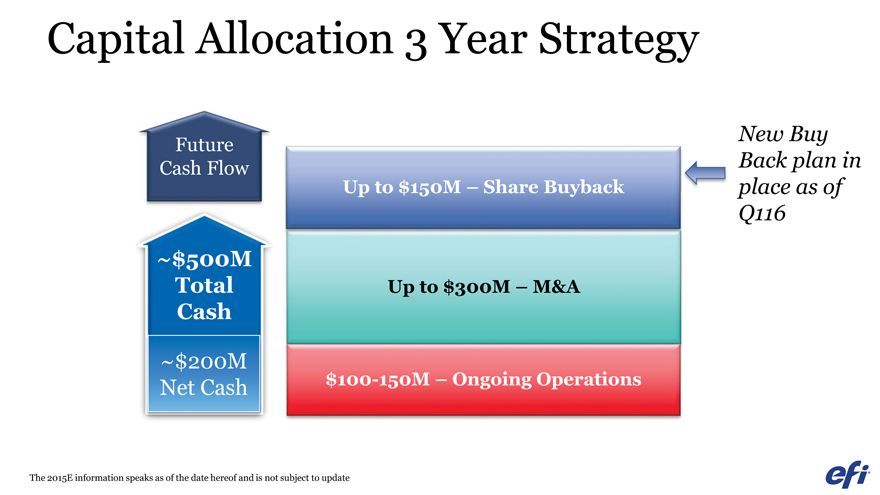
Capital Allocation 3 Year Strategy
New Buy
Future
Cash Flow Back plan in
Up to $150M – Share Buyback place as of
Q116
~$500M
Total Up to $300M – M&A
Cash
~$200M
Net Cash $100-150M – Ongoing Operations
The 2015E information speaks as of the date hereof and is not subject to update
|
|

Appendix
|
|
Safe Harbor For Forward-Looking Statements
Certain statements in this presentation are forward-looking statements within the meaning of Section 27A of the Securities Act of 1933, as amended, and Section 21E of the Securities Exchange Act of 1934, as amended. Statements other than statements of historical fact including words such as “anticipate”, “believe”, “consider”, “continue”, “estimate”, “expect”, “look”, and “plan” and statements in the future tense are forward looking statements. The statements in this presentation that could be deemed forward-looking statements include statements regarding EFI’s strategy, plans, financial projections, expectations regarding its operating income, gross margin, revenue and earnings growth, product portfolio, productivity, future opportunities for EFI and its customers, demand for products, repurchases under its share repurchase plan, and any statements or assumptions underlying any of the foregoing.
Forward-looking statements are subject to certain risks and uncertainties that could cause our actual future results to differ materially, or cause a material adverse impact on our results. Potential risks and uncertainties include, but are not necessarily limited to, intense competition in each of our businesses, including competition from products developed by EFI’s customers; unforeseen expenses; the difficulty of aligning expense levels with revenue; management’s ability to forecast revenues, expenses, and earnings; our ability to successfully integrate acquired businesses; changes in the mix of products sold; the uncertainty of market acceptance of new product introductions; challenge of managing asset levels, including inventory and variations in inventory levels; the uncertainty of continued success in technological advances; the challenges of obtaining timely, efficient, and quality product manufacturing and supply of components; any world-wide financial and economic difficulties and downturns; adverse tax-related matters such as tax audits, changes in our effective tax rate or new tax legislative proposals; the unpredictability of development schedules and commercialization of products by the leading printer manufacturers and declines or delays in demand for our related products; the impact of changing consumer preferences on demand for our textile products; litigation involving intellectual property rights or other related matters; the uncertainty regarding the amount and timing of future share repurchases by EFI and the origin of funds used for such repurchases; the market prices of EFI’s common stock prior to, during and after the share repurchases; and any other risk factors that may be included from time to time in the Company’s SEC reports.
The statements in this presentation are made as of the date of November 11, 2015. EFI undertakes no obligation to update information contained in this presentation. For further information regarding risks and uncertainties associated with EFI’s businesses, please refer to the section entitled “Risk Factors” in the Company’s SEC filings, including, but not limited to, its annual report on Form 10-K and its quarterly reports on Form 10-Q, copies of which may be obtained by contacting EFI’s Investor Relations Department by phone at 650-357-3828 or by email at investor.relations@efi.com or EFI’s Investor Relations website at www.efi.com.
|
|
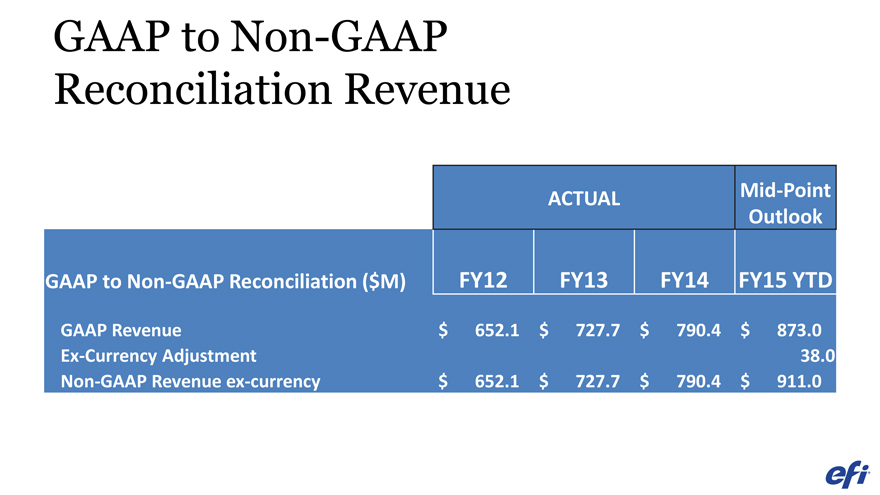
GAAP to Non-GAAP Reconciliation Revenue
ACTUAL Mid-Point
Outlook
GAAP to Non-GAAP Reconciliation ($M) FY12 FY13 FY14 FY15 YTD
GAAP Revenue $ 652.1 $ 727.7 $ 790.4 $ 873.0
Ex-Currency Adjustment 38.0
Non-GAAP Revenue ex-currency $ 652.1 $ 727.7 $ 790.4 $ 911.0
|
|
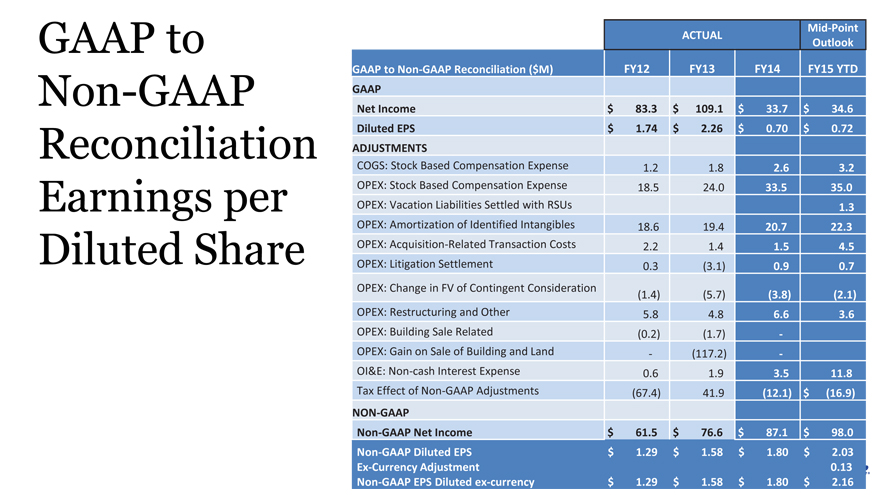
GAAP to Non-GAAP Reconciliation Earnings per Diluted Share
ACTUAL Mid-Point
Outlook
GAAP to Non-GAAP Reconciliation ($M) FY12 FY13 FY14 FY15 YTD
GAAP
Net Income $ 83.3 $ 109.1 $ 33.7 $ 34.6
Diluted EPS $ 1.74 $ 2.26 $ 0.70 $ 0.72
ADJUSTMENTS
COGS: Stock Based Compensation Expense 1.2 1.8 2.6 3.2
OPEX: Stock Based Compensation Expense 18.5 24.0 33.5 35.0
OPEX: Vacation Liabilities Settled with RSUs 1.3
OPEX: Amortization of Identified Intangibles 18.6 19.4 20.7 22.3
OPEX: Acquisition-Related Transaction Costs 2.2 1.4 1.5 4.5
OPEX: Litigation Settlement 0.3 (3.1) 0.9 0.7
OPEX: Change in FV of Contingent Consideration (1.4) (5.7) (3.8) (2.1)
OPEX: Restructuring and Other 5.8 4.8 6.6 3.6
OPEX: Building Sale Related (0.2) (1.7)—
OPEX: Gain on Sale of Building and Land—(117.2)—
OI&E: Non-cash Interest Expense 0.6 1.9 3.5 11.8
Tax Effect of Non-GAAP Adjustments (67.4) 41.9 (12.1) $ (16.9)
NON-GAAP
Non-GAAP Net Income $ 61.5 $ 76.6 $ 87.1 $ 98.0
Non-GAAP Diluted EPS $ 1.29 $ 1.58 $ 1.80 $ 2.03
Ex-Currency Adjustment 0.13
Non-GAAP EPS Diluted ex-currency $ 1.29 $ 1.58 $ 1.80 $ 2.16
|
|
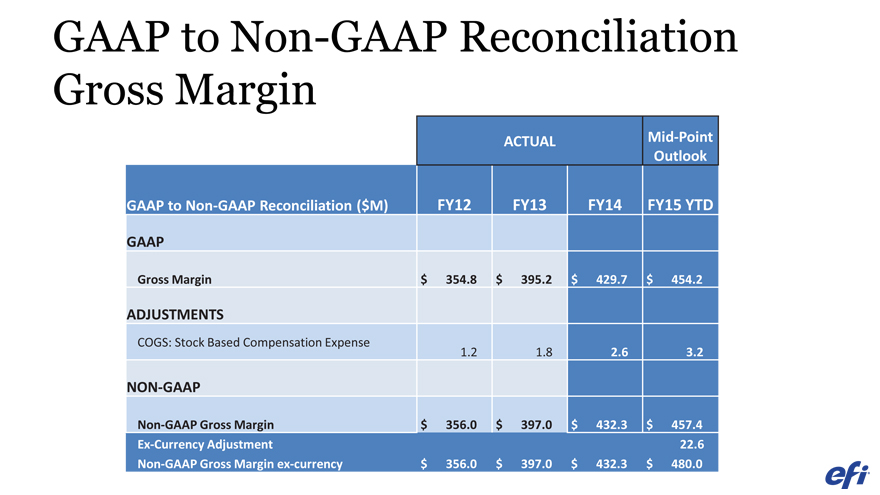
GAAP to Non-GAAP Reconciliation Gross Margin
ACTUAL Mid-Point
Outlook
GAAP to Non-GAAP Reconciliation ($ M) FY12 FY13 FY14 FY15 YTD
GAAP
Gross Margin $ 354.8 $ 395.2 $ 429.7 $ 454.2
ADJUSTMENTS
COGS: Stock Based Compensation Expense 1.2 1.8 2.6 3.2
NON-GAAP
Non-GAAP Gross Margin $ 356.0 $ 397.0 $ 432.3 $ 457.4
Ex-Currency Adjustment 22.6
Non-GAAP Gross Margin ex-currency $ 356.0 $ 397.0 $ 432.3 $ 480.0
|
|
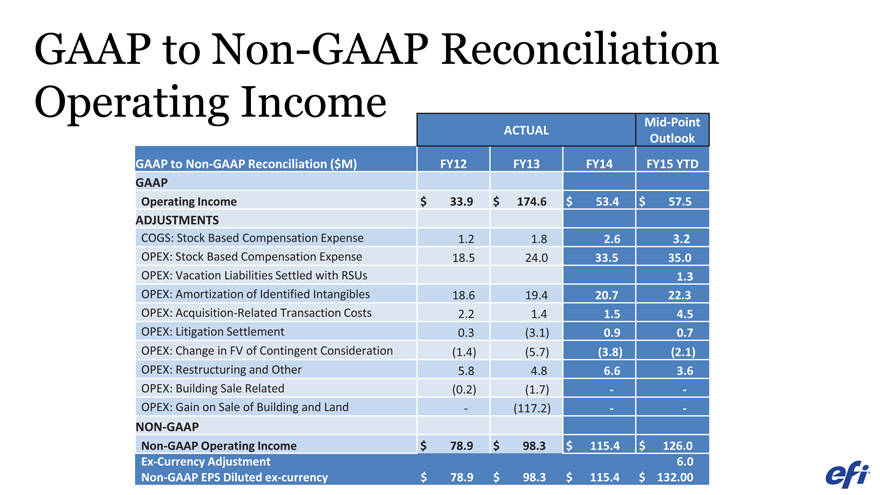
GAAP to Non-GAAP Reconciliation
Operating Income
ACTUAL
Mid-Point
Outlook
GAAP to Non-GAAP Reconciliation ($
M)
FY12
FY13
FY14
FY15 YTD
GAAP
Operating Income
$
33.9
$
174.6
$ 53.4
$ 57.5
ADJUSTMENTS
COGS: Stock Based Compensation Expense
1.2
1.8
2.6
3.2
OPEX: Stock Based Compensation Expense
18.5
24.0
33.5
35.0
OPEX: Vacation Liabilities Settled with RSUs
1.3
OPEX: Amortization of Identified Intangibles
18.6
19.4
20.7
22.3
OPEX: Acquisition-Related Transaction Costs
2.2
1.4
1.5
4.5
OPEX: Litigation Settlement
0.3
(3.1)
0.9
0.7
OPEX: Change in FV of Contingent Consideration
(1.4)
(5.7)
(3.8)
(2.1)
OPEX: Restructuring and Other
5.8
4.8
6.6
3.6
OPEX: Building Sale Related
(0.2)
(1.7)
-
-
OPEX: Gain on Sale of Building and Land
-
(117.2)
-
-
NON-GAAP
Non-GAAP Operating Income
$
78.9
$
98.3
$ 115.4
$ 126.0
Ex-Currency Adjustment
6.0
Non-GAAP EPS Diluted ex-currency
$
78.9
$
98.3
$ 115.4
$ 132.00
|
|
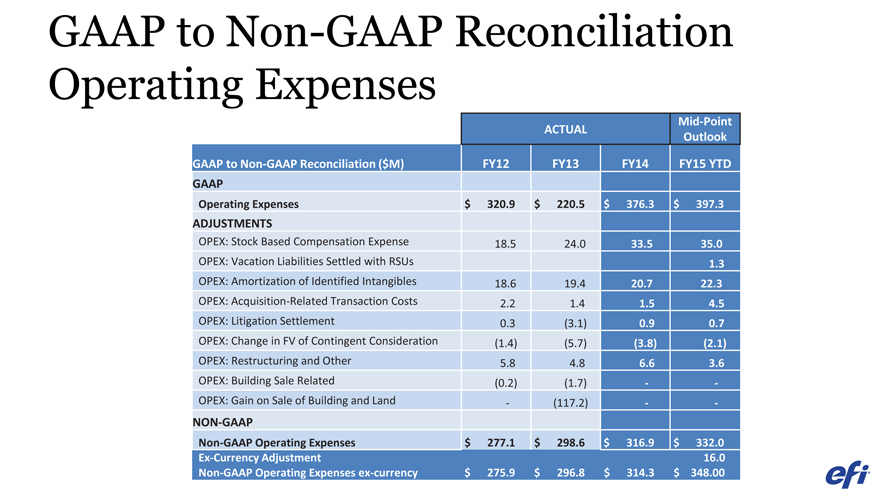
GAAP to Non-GAAP Reconciliation Operating Expenses
Mid-Point
ACTUAL Outlook
GAAP to Non-GAAP Reconciliation ($ M) FY12 FY13 FY14 FY15 YTD
GAAP
Operating Expenses $ 320.9 $ 220.5 $ 376.3 $ 397.3
ADJUSTMENTS
OPEX: Stock Based Compensation Expense 18.5 24.0 33.5 35.0
OPEX: Vacation Liabilities Settled with RSUs 1.3
OPEX: Amortization of Identified Intangibles 18.6 19.4 20.7 22.3
OPEX: Acquisition-Related Transaction Costs 2.2 1.4 1.5 4.5
OPEX: Litigation Settlement 0.3 (3.1) 0.9 0.7
OPEX: Change in FV of Contingent Consideration (1.4) (5.7) (3.8) (2.1)
OPEX: Restructuring and Other 5.8 4.8 6.6 3.6
OPEX: Building Sale Related (0.2) (1.7) —
OPEX: Gain on Sale of Building and Land—(117.2) —
NON-GAAP
Non-GAAP Operating Expenses $ 277.1 $ 298.6 $ 316.9 $ 332.0
Ex-Currency Adjustment 16.0
Non-GAAP Operating Expenses ex-currency $ 275.9 $ 296.8 $ 314.3 $ 348.00
|
|
Usefulness of Non-GAAP Financial Information to Investors
Use and Economic Substance of Non-GAAP Financial Measures
We compute non-GAAP financial metrics by adjusting certain GAAP financial metrics to remove the impact of amortization of acquisition-related intangibles, stock-based compensation expense, restructuring and other expenses, acquisition-related transaction expenses, costs to integrate such acquisitions into our business, changes in the fair value of contingent consideration, litigation settlement charges, non-cash interest expense related to our 0.75% convertible senior notes (“Notes”), imputed interest expense and depreciation, net of accrued sublease income and capitalized interest, related to the sale of our corporate headquarters facility and related land, and the gain on the sale of our corporate headquarters facility and related land. Effective in 2014, we use a constant non-GAAP tax rate of 19%, which we believe reflects the long term average tax rate based on our international structure and geographic distribution of revenue and profit.
Certain variables used in calculating non-GAAP financial metrics cannot be accurately estimated on a forward-looking basis. These non-GAAP financial measures have certain shortcomings, including but not limited to the risk and uncertainties outlined in the Safe Harbor for Forward-Looking Statements section of this presentation. These adjustments are described below:
Ex Currency. To better understand trends in our business, we believe that it is helpful to adjust revenue, gross margin, operating expenses, operating income, and earnings per share to exclude the impact of year-over-year changes in the translation of foreign currencies into U.S. dollars. This is accomplished by using the exchange rate in effect during the comparable prior period. We refer to this adjusted revenue, gross margin, operating expenses, operating income, and earnings per share as “ex currency.” Management believes the ex currency measure provides investors an additional perspective on year-over-year financial trends. The year-over-year currency impact can be determined as the difference between year-over-year actual growth rates and year-over-year ex currency growth rates.
Intangible assets acquired to date are being amortized on a straight-line basis
Stock-based compensation expense recognized in accordance with ASC 718, Stock Compensation
Non-cash settlement of vacation liabilities through the issuance of RSUs, which is not included in the GAAP presentation of our stock-based compensation expense
Restructuring and other expenses consists of: o Restructuring charges incurred as we consolidate the number and size of our facilities and, as a result, reduce the size of our workforce o Acquisition-related executive deferred compensation costs, which are dependent on the continuing employment of a former stockholder of an acquired company, were amortized on a straight-line basis during 2013 and 2012 o Expenses incurred to integrate businesses acquired during the periods reported
Acquisition-related transaction costs associated with businesses acquired during the periods reported and anticipated transactions
Changes in fair value of contingent consideration. Our management determined that we should analyze the total return provided by the investment when evaluating operating results of an acquired entity. The total return consists of operating profit generated from the acquired entity compared to the purchase price paid, including the final amounts paid for contingent consideration without considering any post-acquisition adjustments related to changes in the fair value of the contingent consideration. Because our management believes the final purchase price paid for the acquisition reflects the accounting value assigned to both contingent consideration and to the intangible assets, we exclude the GAAP impact of any adjustments to the fair value of acquisition-related contingent consideration from the operating results of an acquisition in subsequent periods. We believe this approach is useful in understanding the long-term return provided by our acquisitions and that investors benefit from a supplemental non-GAAP financial measure that excludes the impact of this adjustment.
Non-cash interest expense on our Notes. Our Notes may be settled in cash on conversion. We are required to separately account for the liability (debt) and equity (conversion option) components of the Notes in a manner that reflects our non-convertible debt borrowing rate. Accordingly, for GAAP purposes, we are required to amortize a debt discount equal to the fair value of the conversion option as interest expense on our $345 million of 0.75% convertible senior notes that were issued in a private placement in September 2014 over the term of the Notes.
|
|
Usefulness of Non-GAAP Financial Information to Investors
(continued)
Imputed net expenses related to sale of building and land. On November 1, 2012, we sold the 294,000 square foot building located in Foster City, California, which at that time served as our corporate headquarters, along with approximately four acres of land and certain other assets related to the property, for $179.7 million. We used the facility until October 31, 2013, for which period rent was not required to be paid. This constituted a form of continuing involvement that prevented gain recognition until we vacated the facility during the fourth quarter of 2013. Prior to vacating the building, the proceeds from the sale were recognized as deferred proceeds from property transaction on our Consolidated Balance Sheet. Imputed interest expense and depreciation, net of accrued sublease income and capitalized interest, was accrued during the years ended December 31, 2013 and 2012, related to the deferred property transaction
Gain on sale of building and land. On November 1, 2012, we sold the aforementioned building and land for $179.7 million. We used the facility until October 31, 2013, while searching for a new facility, building it out, and relocating our corporate headquarters, for which period rent was not required to be paid. Because we vacated the facility on October 31, 2013, we have no continuing involvement with the property and have accounted for the transaction as a property sale during the fourth quarter of 2013, thereby recognizing a gain of approximately $117.2 million on the sale of the property
Litigation settlements. In conjunction with our acquisition of Cretaprint, we assumed a contingent liability related to the alleged infringement of certain patents. Because the former owners of Cretaprint agreed to indemnify EFI against any potential liability, we accrued a contingent liability based on a reasonable estimate of the legal obligation that was probable as of the acquisition date and we accrued a contingent asset based on the portion of any liability for which the former Cretaprint owners would indemnify EFI. The net obligation accrued in the opening balance sheet on the acquisition date was EU 2.5 million (or approximately $3.3 million). The Spanish Court of Appeal reached a final determination in 2013, which resulted in EFI having no liability related to any potential infringement of the patent. Because this matter is no longer subject to appeal, we reversed this liability by recognizing a credit against general and administrative expense in 2013. In addition, we settled or accrued reserves related to several unrelated litigation claims in the years reported.
Tax effects of non-GAAP adjustments are as follows:\ o Effective in 2014, we use a constant non-GAAP tax rate of 19%, which we believe reflects the long term average tax rate based on our international structure and geographic distribution of revenue and profit. The long-term average tax rate is calculated in accordance with the principles of ASC 740, Income Taxes, after excluding the tax effect of the non-GAAP items described above, to estimate the non-GAAP income tax provision in each jurisdiction in which we operate. o The long-term average tax rate assumes that the U.S. federal research and development tax credit will be retroactively re-enacted as of January 1, 2015. o In addition to excluding the tax effect of the non-GAAP items described above, we have excluded the following from our non-GAAP net income for the year ended December 31, 2013 and 2012: Tax charge of $19.4 million in 2013 resulting from the establishment of a valuation allowance related to the realization of tax benefits from existing California deferred tax assets Tax benefit of $43.6 million in 2012 resulting from a capital loss related to the liquidation of a wholly-owned subsidiary.
Tax benefit of $6.5 million in 2012 resulting from the increase in value of acquired intangibles for tax purposes due to an operational restructuring in Spain
Tax benefit of $2.6, $5.8, and $11.8 million for the years ended December 31, 2014, 2013 and 2012, respectively, resulting from the release of previously unrecognized tax benefits to facilitate comparability of our operating performance between the periods. These tax benefits primarily resulted from the release of previously unrecognized tax benefits resulting from the expiration of U.S. federal statutes of limitations.
Tax benefit of $3.2 million from the retroactive renewal of the 2012 U.S. federal research and development tax credit on January 2, 2013. The tax benefit had been previously recognized in our non-GAAP net income for the year ended December 31, 2012.
Interest expense accrued on prior year tax reserves of $0.4, $0.4, and $0.3 million for the years ended December 31, 2014, 2013, and 2012, respectively.