Attached files
| file | filename |
|---|---|
| 8-K - 8-K - DARLING INGREDIENTS INC. | d27244d8k.htm |
| EX-99.1 - EX-99.1 - DARLING INGREDIENTS INC. | d27244dex991.htm |
|
|
Exhibit 99.2
Third Quarter 2015
Earnings Conference Call
November 13, 2015
Randall C. Stuewe, Chairman and CEO
John O. Muse, EVP Chief Financial Officer
Creating sustainable food, feed and fuel ingredients for a growing population
|
|
2
Safe Harbor Statement
This presentation contains “forward-looking” statements regarding the business operations and prospects of Darling Ingredients Inc. and industry factors affecting it. These statements are identified by words such as “believe,” “anticipate,” “expect,” “estimate,” “intend,” “could,” “may,” “will,” “should,” “planned,” “potential,” “continue,” “momentum,” and other words referring to events that may occur in the future. These statements reflect Darling Ingredient’s current view of future events and are based on its assessment of, and are subject to, a variety of risks and uncertainties beyond its control, each of which could cause actual results to differ materially from those indicated in the forward-looking statements. These factors include, among others, existing and unknown future limitations on the ability of the Company’s direct and indirect subsidiaries to make their cash flow available to the Company for payments on the Company’s indebtedness or other purposes; unanticipated costs or operating problems related to the acquisition and integration of Rothsay and Darling Ingredients International (including transactional costs and integration of the new enterprise resource planning (ERP) system); global demands for bio-fuels and grain and oilseed commodities, which have exhibited volatility, and can impact the cost of feed for cattle, hogs and poultry, thus affecting available rendering feedstock and selling prices for the Company’s products; reductions in raw material volumes available to the Company due to weak margins in the meat production industry as a result of higher feed costs, reduced consumer demand or other factors, reduced volume from food service establishments, reduced demand for animal feed, or otherwise; reduced finished product prices; continued decline in fat and used cooking oil finished product prices; changes to worldwide government policies relating to renewable fuels and greenhouse gas emissions that adversely affect programs like the Renewable Fuel Standards Program (RFS2) and tax credits for biofuels both in the United States and abroad; possible product recall resulting from developments relating to the discovery of unauthorized adulterations to food or food additives; the occurrence of Bird Flu including, but not limited to H5N1 flu, bovine spongiform encephalopathy (or “BSE”), porcine epidemic diarrhea (“PED”) or other diseases associated with animal origin in the United States or elsewhere; unanticipated costs and/or reductions in raw material volumes related to the Company’s compliance with the existing or unforeseen new U.S. or foreign regulations (including, without limitation, China) affecting the industries in which the Company operates or its value added products (including new or modified animal feed, Bird Flu, PED or BSE or similar or unanticipated regulations); risks associated with the renewable diesel plant in Norco, Louisiana owned and operated by a joint venture between Darling Ingredients and Valero Energy Corporation, including possible unanticipated operating disruptions; risks relating to possible third party claims of intellectual property infringement; increased contributions to the Company’s pension and benefit plans, including multiemployer and employer-sponsored defined benefit pension plans as required by legislation, regulation or other applicable U.S. or foreign law or resulting from a U.S. mass withdrawal event; bad debt write-offs; loss of or failure to obtain necessary permits and registrations; continued or escalated conflict in the Middle East, North Korea, Ukraine or elsewhere; and/or unfavorable export or import markets. These factors, coupled with volatile prices for natural gas and diesel fuel, climate conditions, currency exchange fluctuations, general performance of the U.S. and global economies, disturbances in world financial, credit, commodities and stock markets, and any decline in consumer confidence and discretionary spending, including the inability of consumers and companies to obtain credit due to lack of liquidity in the financial markets, among others, could negatively impact the Company’s results of operations.
Among other things, future profitability may be affected by the Company’s ability to grow its business, which faces competition from companies that may have substantially greater resources than the Company. The Company’s announced share repurchase program may be suspended or discontinued at any time and purchases of shares under the program are subject to market conditions and other factors, which are likely to change from time to time. Other risks and uncertainties regarding Darling Ingredients Inc., its business and the industries in which it operates are referenced from time to time in the Company’s filings with the Securities and Exchange Commission. Darling Ingredients Inc. is under no obligation to (and expressly disclaims any such obligation to) update or alter its forward-looking statements whether as a result of new information, future events or otherwise.
Creating sustainable food, feed and fuel ingredients for a growing population
|
|
3
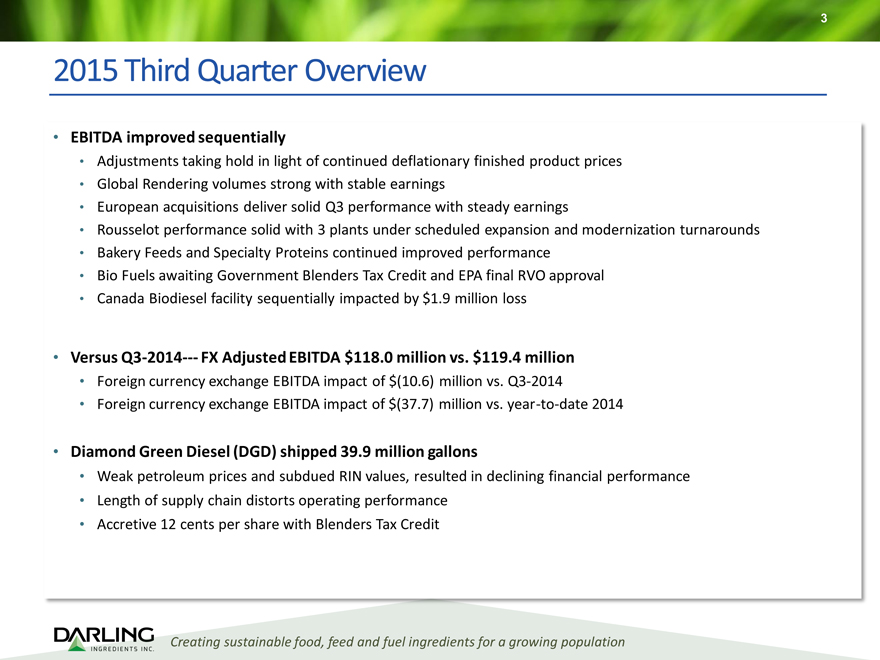
2015 Third Quarter Overview
EBITDA improved sequentially
Adjustments taking hold in light of continued deflationary finished product prices
Global Rendering volumes strong with stable earnings
European acquisitions deliver solid Q3 performance with steady earnings
Rousselot performance solid with 3 plants under scheduled expansion and modernization turnarounds
Bakery Feeds and Specialty Proteins continued improved performance
Bio Fuels awaiting Government Blenders Tax Credit and EPA final RVO approval
Canada Biodiesel facility sequentially impacted by $1.9 million loss
Versus Q3-2014—- FX Adjusted EBITDA $118.0 million vs. $119.4 million
Foreign currency exchange EBITDA impact of $(10.6) million vs. Q3-2014
Foreign currency exchange EBITDA impact of $(37.7) million vs. year-to-date 2014
Diamond Green Diesel (DGD) shipped 39.9 million gallons
Weak petroleum prices and subdued RIN values, resulted in declining financial performance
Length of supply chain distorts operating performance
Accretive 12 cents per share with Blenders Tax Credit
Creating sustainable food, feed and fuel ingredients for a growing population
|
|
4
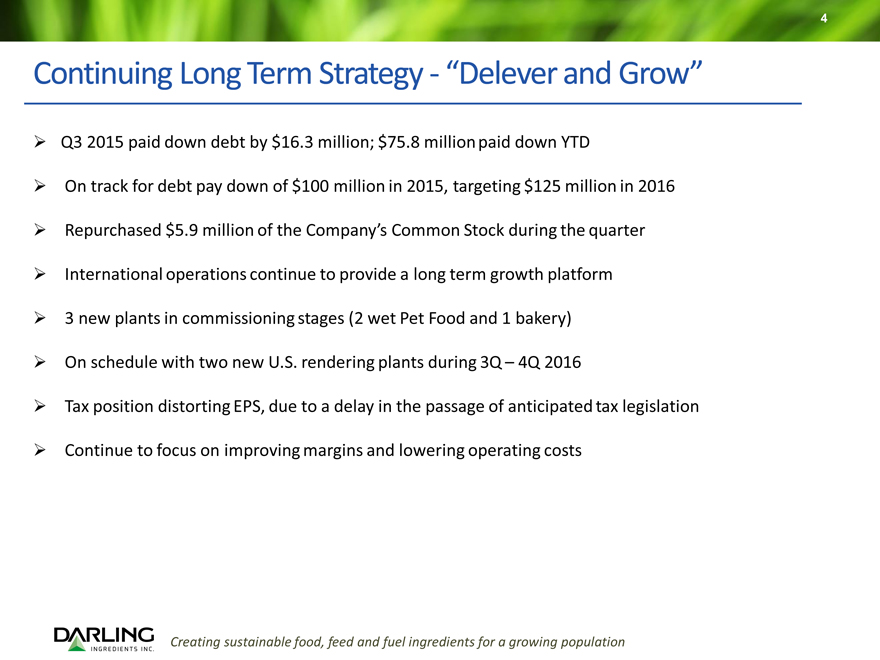
Continuing Long Term Strategy—“Delever and Grow”
Q3 2015 paid down debt by $16.3 million; $75.8 million paid down YTD
On track for debt pay down of $100 million in 2015, targeting $125 million in 2016
Repurchased $5.9 million of the Company’s Common Stock during the quarter
International operations continue to provide a long term growth platform
3 new plants in commissioning stages (2 wet Pet Food and 1 bakery)
On schedule with two new U.S. rendering plants during 3Q – 4Q 2016
Tax position distorting EPS, due to a delay in the passage of anticipated tax legislation
Continue to focus on improving margins and lowering operating costs
Creating sustainable food, feed and fuel ingredients for a growing population
|
|
5
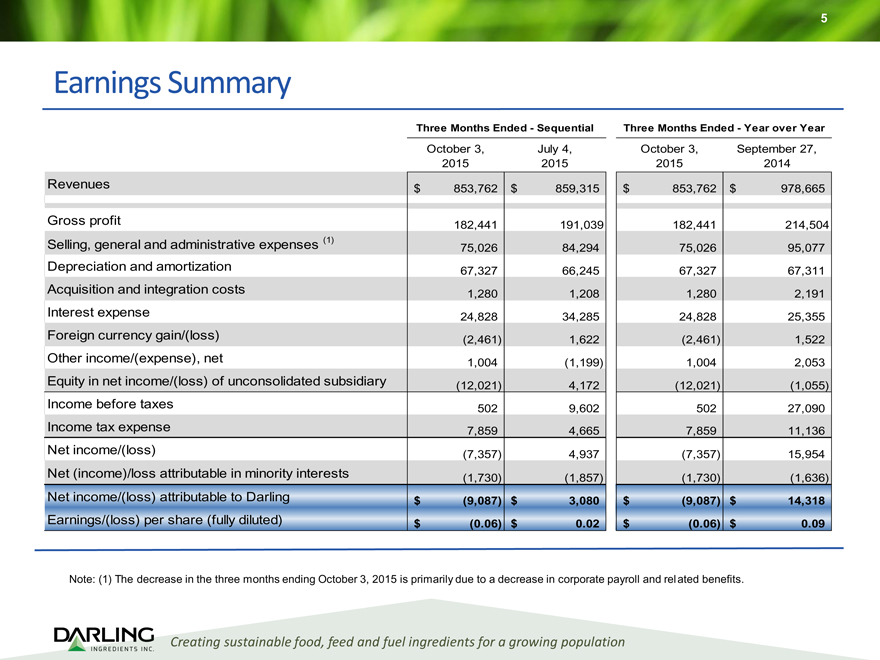
Earnings Summary
Three Months Ended—Sequential Three Months Ended—Year over Year
October 3, July 4, October 3, September 27, 2015 2015 2015 2014
Revenues $ 853,762 $ 859,315 $ 853,762 $ 978,665
Gross profit 182,441 191,039 182,441 214,504
Selling, general and administrative expenses (1)
75,026 84,294 75,026 95,077
Depreciation and amortization 67,327 66,245 67,327 67,311 Acquisition and integration costs 1,280 1,208 1,280 2,191
Interest expense 24,828 34,285 24,828 25,355
Foreign currency gain/(loss) (2,461) 1,622 (2,461) 1,522 Other income/(expense), net 1,004 (1,199) 1,004 2,053 Equity in net income/(loss) of unconsolidated subsidiary (12,021) 4,172 (12,021) (1,055) Income before taxes 502 9,602 502 27,090
Income tax expense 7,859 4,665 7,859 11,136 Net income/(loss) (7,357) 4,937 (7,357) 15,954
Net (income)/loss attributable in minority interests (1,730) (1,857) (1,730) (1,636)
Net income/(loss) attributable to Darling $ (9,087) $ 3,080 $ (9,087) $ 14,318 Earnings/(loss) per share (fully diluted) $ (0.06) $ 0.02 $ (0.06) $ 0.09
Note: (1) The decrease in the three months ending October 3, 2015 is primarily due to a decrease in corporate payroll and rel ated benefits.
Creating sustainable food, feed and fuel ingredients for a growing population
|
|
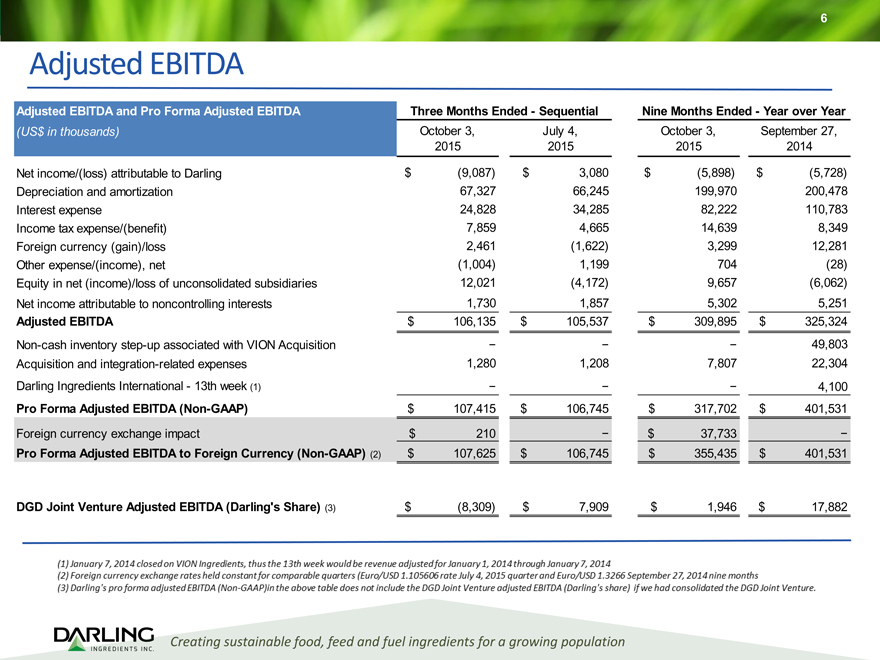
Adjusted EBITDA
Adjusted EBITDA and Pro Forma Adjusted EBITDA Three Months Ended - Sequential Nine Months Ended - Year over Year
(US$ in thousands) October 3, July 4, October 3, September 27,
2015 2015 2015 2014
Net income/(loss) attributable to Darling $ (9,087) $ 3,080 $ (5,898) $ (5,728)
Depreciation and amortization 67,327 66,245 199,970 200,478
Interest expense 24,828 34,285 82,222 110,783
Income tax expense/(benefit) 7,859 4,665 14,639 8,349
Foreign currency (gain)/loss 2,461 (1,622) 3,299 12,281
Other expense/(income), net (1,004) 1,199 704 (28)
Equity in net (income)/loss of unconsolidated subsidiaries 12,021 (4,172) 9,657 (6,062)
Net income attributable to noncontrolling interests 1,730 1,857 5,302 5,251
Adjusted EBITDA $ 106,135 $ 105,537 $ 309,895 $ 325,324
Non-cash inventory step-up associated with VION Acquisition - - - 49,803
Acquisition and integration-related expenses 1,280 1,208 7,807 22,304
Darling Ingredients International - 13th week (1) - - - 4,100
Pro Forma Adjusted EBITDA (Non-GAAP) $ 107,415 $ 106,745 $ 317,702 $ 401,531
Foreign currency exchange impact $ 210 - $ 37,733 -
Pro Forma Adjusted EBITDA to Foreign Currency (Non-GAAP) (2) $ 107,625 $ 106,745 $ 355,435 $ 401,531
DGD Joint Venture Adjusted EBITDA (Darling’s Share) (3) $ (8,309) $ 7,909 $ 1,946 $ 17,882
Creating sustainable food, feed and fuel ingredients for a growing population
(1) January 7, 2014 closed on VION Ingredients, thus the 13th week would be revenue adjusted for January 1, 2014 through January 7, 2014
(2) Foreign currency exchange rates held constant for comparable quarters (Euro/USD 1.105606 rate July 4, 2015 quarter and Euro/USD 1.3266 September 27, 2014 nine months
(3) Darling’s pro forma adjusted EBITDA (Non-GAAP) in the above table does not include the DGD Joint Venture adjusted EBITDA (Darling’s share) if we had consolidated the DGD Joint Venture.
6
|
|
7
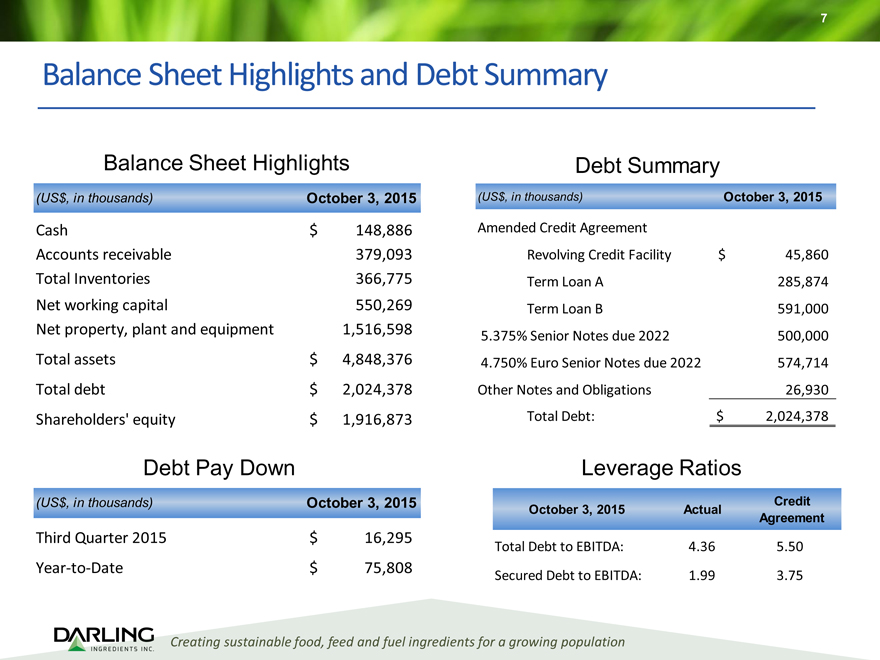
Balance Sheet Highlights and Debt Summary
Balance Sheet Highlights Debt Summary
(US$, in thousands) October 3, 2015 (US$, in thousands) October 3, 2015
Cash $ 148,886 Amended Credit Agreement
Accounts receivable 379,093 Revolving Credit Facility $ 45,860
Total Inventories 366,775 Term Loan A 285,874 Net working capital 550,269 Term Loan B 591,000 Net property, plant and equipment 1,516,598
5.375% Senior Notes due 2022 500,000 Total assets $ 4,848,376 4.750% Euro Senior Notes due 2022 574,714 Total debt $ 2,024,378 Other Notes and Obligations 26,930
Shareholders’ equity $ 1,916,873 Total Debt: $ 2,024,378
Debt Pay Down Leverage Ratios
(US$, in thousands) October 3, 2015 Credit
October 3, 2015 Actual
Agreement
Third Quarter 2015 $ 16,295
Total Debt to EBITDA: 4.36 5.50
Year-to-Date $ 75,808
Secured Debt to EBITDA: 1.99 3.75
Creating sustainable food, feed and fuel ingredients for a growing population
|
|
8
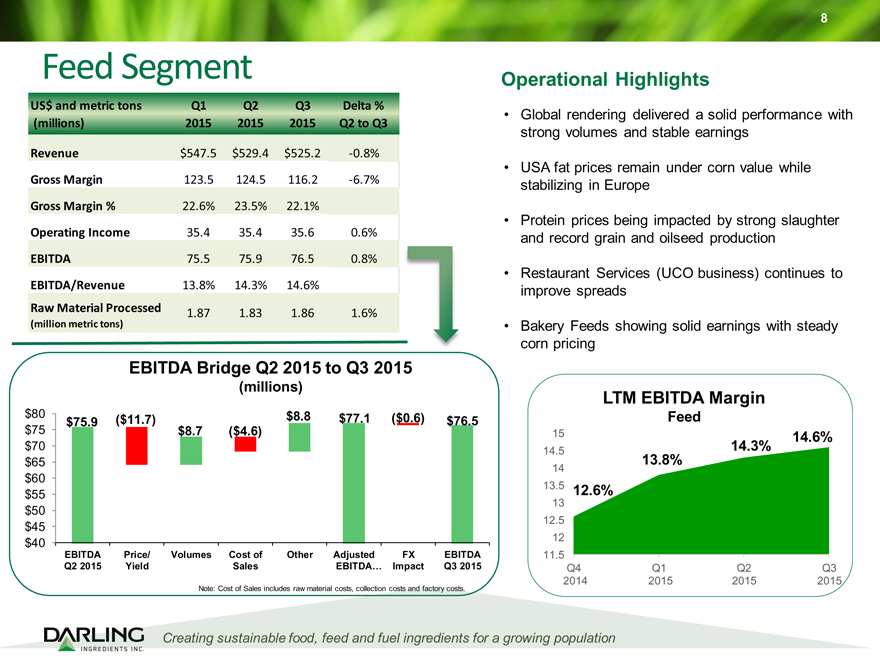
Feed Segment Operational Highlights
US$ and metric tons Q1 Q2 Q3 Delta %
Global rendering delivered a solid performance with
(millions) 2015 2015 2015 Q2 to Q3 strong volumes and stable earnings
Revenue $547.5 $529.4 $525.2 -0.8%
USA fat prices remain under corn value while
Gross Margin 123.5 124.5 116.2 -6.7% stabilizing in Europe Gross Margin % 22.6% 23.5% 22.1%
Protein prices being impacted by strong slaughter Operating Income 35.4 35.4 35.6 0.6% and record grain and oilseed production
EBITDA 75.5 75.9 76.5 0.8%
Restaurant Services (UCO business) continues to
EBITDA/Revenue 13.8% 14.3% 14.6% improve spreads
Raw Material Processed
1.87 1.83 1.86 1.6%
(million metric tons) • Bakery Feeds showing solid earnings with steady corn pricing
EBITDA Bridge Q2 2015 to Q3 2015
(millions)
LTM EBITDA Margin
$80 $8.8 $77.1 ($0.6) Feed $75.9 ($11.7) $76.5
$75 $8.7 ($4.6) 15
14.6%
$70 14.5 14.3%
$65 13.8%
$60 14
13.5 12.6% $55
13
$50 12.5 $45
$40 12
EBITDA Price/ Volumes Cost of Other Adjusted FX EBITDA 11.5
Q2 2015 Yield Sales EBITDA… Impact Q3 2015 Q4 Q1 Q2 Q3
Note: Cost of Sales includes raw material costs, collection costs and factory costs. 2014 2015 2015 2015
Creating sustainable food, feed and fuel ingredients for a growing population
|
|
9
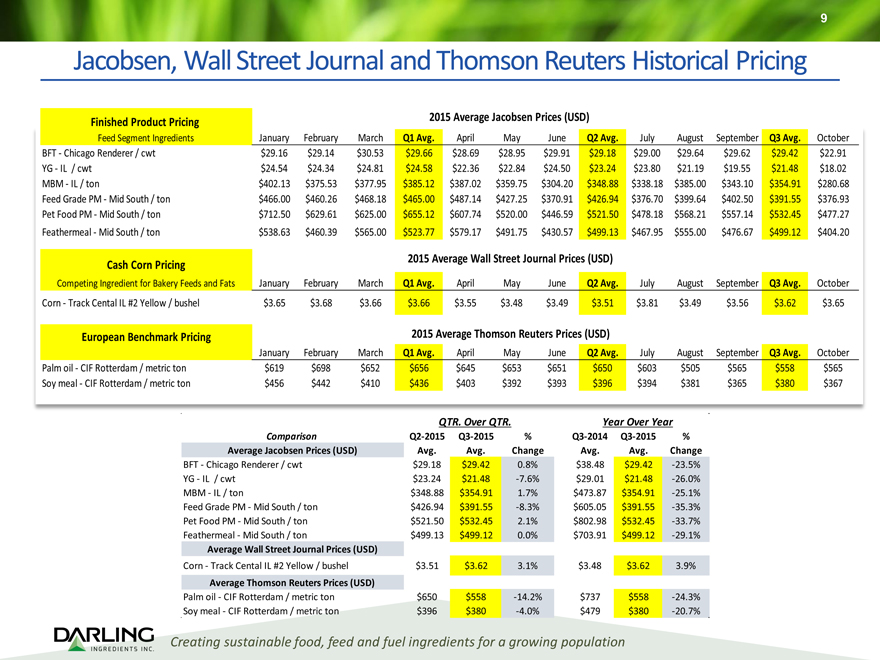
Jacobsen, Wall Street Journal and Thomson Reuters Historical Pricing
2015 Average Jacobsen Prices (USD) Finished Product Pricing
Feed Segment Ingredients January February March Q1 Avg. April May June Q2 Avg. July August September Q3 Avg. October BFT—Chicago Renderer / cwt $29.16 $29.14 $30.53 $29.66 $28.69 $28.95 $29.91 $29.18 $29.00 $29.64 $29.62 $29.42 $22.91 YG—IL / cwt $24.54 $24.34 $24.81 $24.58 $22.36 $22.84 $24.50 $23.24 $23.80 $21.19 $19.55 $21.48 $18.02 MBM—IL / ton $402.13 $375.53 $377.95 $385.12 $387.02 $359.75 $304.20 $348.88 $338.18 $385.00 $343.10 $354.91 $280.68 Feed Grade PM—Mid South / ton $466.00 $460.26 $468.18 $465.00 $487.14 $427.25 $370.91 $426.94 $376.70 $399.64 $402.50 $391.55 $376.93 Pet Food PM—Mid South / ton $712.50 $629.61 $625.00 $655.12 $607.74 $520.00 $446.59 $521.50 $478.18 $568.21 $557.14 $532.45 $477.27 Feathermeal—Mid South / ton $538.63 $460.39 $565.00 $523.77 $579.17 $491.75 $430.57 $499.13 $467.95 $555.00 $476.67 $499.12 $404.20
2015 Average Wall Street Journal Prices (USD) Cash Corn Pricing
Competing Ingredient for Bakery Feeds and Fats January February March Q1 Avg. April May June Q2 Avg. July August September Q3 Avg. October
Corn—Track Cental IL #2 Yellow / bushel $3.65 $3.68 $3.66 $3.66 $3.55 $3.48 $3.49 $3.51 $3.81 $3.49 $3.56 $3.62 $3.65
European Benchmark Pricing 2015 Average Thomson Reuters Prices (USD)
January February March Q1 Avg. April May June Q2 Avg. July August September Q3 Avg. October Palm oil—CIF Rotterdam / metric ton $619 $698 $652 $656 $645 $653 $651 $650 $603 $505 $565 $558 $565 Soy meal—CIF Rotterdam / metric ton $456 $442 $410 $436 $403 $392 $393 $396 $394 $381 $365 $380 $367
QTR. Over QTR. Year Over Year
Comparison Q2-2015 Q3-2015 % Q3-2014 Q3-2015 % Average Jacobsen Prices (USD) Avg. Avg. Change Avg. Avg. Change
BFT—Chicago Renderer / cwt $29.18 $29.42 0.8% $38.48 $29.42 -23.5% YG—IL / cwt $23.24 $21.48 -7.6% $29.01 $21.48 -26.0% MBM—IL / ton $348.88 $354.91 1.7% $473.87 $354.91 -25.1% Feed Grade PM—Mid South / ton $426.94 $391.55 -8.3% $605.05 $391.55 -35.3% Pet Food PM—Mid South / ton $521.50 $532.45 2.1% $802.98 $532.45 -33.7% Feathermeal—Mid South / ton $499.13 $499.12 0.0% $703.91 $499.12 -29.1%
Average Wall Street Journal Prices (USD)
Corn—Track Cental IL #2 Yellow / bushel $3.51 $3.62 3.1% $3.48 $3.62 3.9%
Average Thomson Reuters Prices (USD)
Palm oil—CIF Rotterdam / metric ton $650 $558 -14.2% $737 $558 -24.3% Soy meal—CIF Rotterdam / metric ton $396 $380 -4.0% $479 $380 -20.7%
Creating sustainable food, feed and fuel ingredients for a growing population
|
|
10
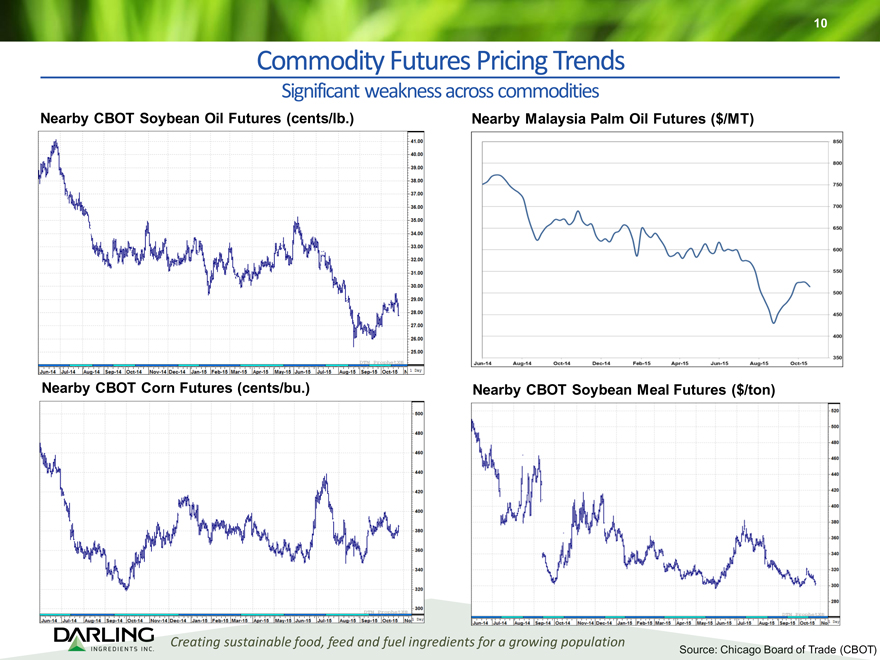
Commodity Futures Pricing Trends
Significant weakness across commodities
Nearby CBOT Soybean Oil Futures (cents/lb.) Nearby Malaysia Palm Oil Futures ($/MT)
Nearby CBOT Corn Futures (cents/bu.) Nearby CBOT Soybean Meal Futures ($/ton)
Creating sustainable food, feed and fuel ingredients for a growing population
Source: Chicago Board of Trade (CBOT)
|
|
11
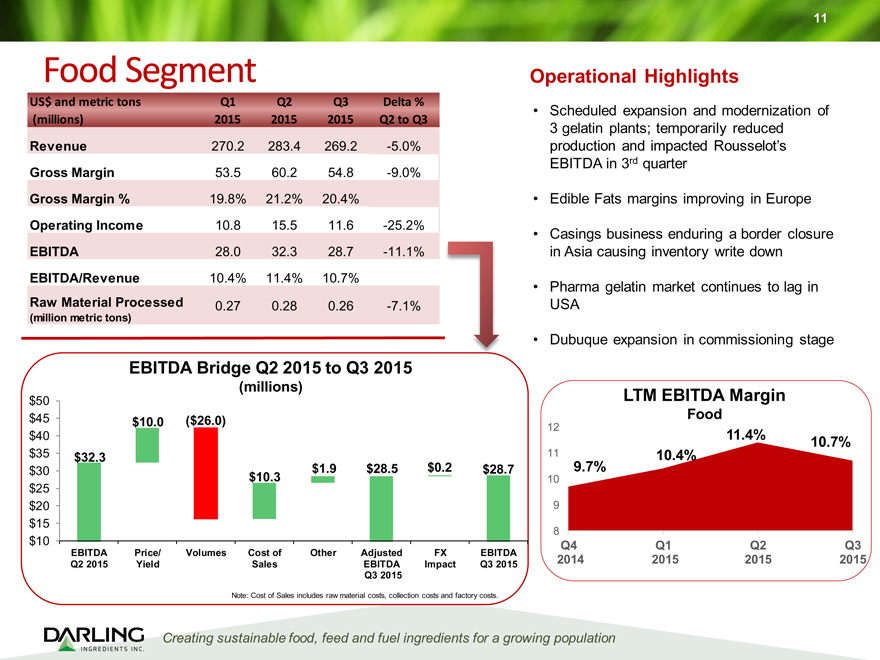
Food Segment Operational Highlights
US$ and metric tons Q1 Q2 Q3 Delta %
Scheduled expansion and modernization of
(millions) 2015 2015 2015 Q2 to Q3
3 gelatin plants; temporarily reduced
Revenue 270.2 283.4 269.2 -5.0% production and impacted Rousselot’s
EBITDA in 3rd quarter
Gross Margin 53.5 60.2 54.8 -9.0%
Gross Margin % 19.8% 21.2% 20.4% • Edible Fats margins improving in Europe
Operating Income 10.8 15.5 11.6 -25.2%
Casings business enduring a border closure EBITDA 28.0 32.3 28.7 -11.1% in Asia causing inventory write down
EBITDA/Revenue 10.4% 11.4% 10.7%
Pharma gelatin market continues to lag in
Raw Material Processed 0.27 0.28 0.26 -7.1% USA
(million metric tons)
Dubuque expansion in commissioning stage
EBITDA Bridge Q2 2015 to Q3 2015
(millions)
$50 LTM EBITDA Margin
$45 Food $10.0 ($26.0)
12
$40 11.4%
$35 11 10.7% $32.3 10.4%
$30 $1.9 $28.5 $0.2 $28.7 9.7%
$25 $10.3 10
$20 9 $15
$10 8
Q4 Q1 Q2 Q3
EBITDA Price/ Volumes Cost of Other Adjusted FX EBITDA
Q2 2015 Yield Sales EBITDA Impact Q3 2015 2014 2015 2015 2015 Q3 2015
Note: Cost of Sales includes raw material costs, collection costs and factory costs.
Creating sustainable food, feed and fuel ingredients for a growing population
|
|
12
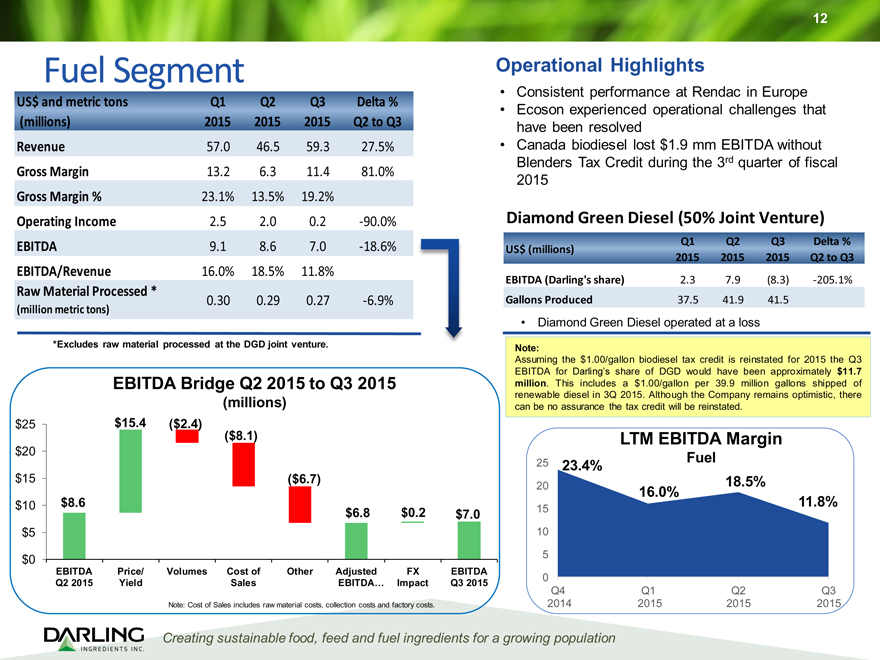
Fuel Segment Operational Highlights
Consistent performance at Rendac in Europe
US$ and metric tons Q1 Q2 Q3 Delta %
Ecoson experienced operational challenges that
(millions) 2015 2015 2015 Q2 to Q3 have been resolved
Revenue 57.0 46.5 59.3 27.5% • Canada biodiesel lost $1.9 mm EBITDA without Blenders Tax Credit during the 3rd quarter of fiscal
Gross Margin 13.2 6.3 11.4 81.0%
2015
Gross Margin % 23.1% 13.5% 19.2%
Operating Income 2.5 2.0 0.2 -90.0% Diamond Green Diesel (50% Joint Venture)
EBITDA 9.1 8.6 7.0 -18.6% Q1 Q2 Q3 Delta %
US$ (millions)
2015 2015 2015 Q2 to Q3
EBITDA/Revenue 16.0% 18.5% 11.8%
EBITDA (Darling’s share) 2.3 7.9 (8.3) -205.1%
Raw Material Processed *
(million metric tons) 0.30 0.29 0.27 -6.9% Gallons Produced 37.5 41.9 41.5
Diamond Green Diesel operated at a loss
*Excludes raw material processed at the DGD joint venture. Note:
Assuming the $1.00/gallon biodiesel tax credit is reinstated for 2015 the Q3 EBITDA for Darling’s share of DGD would have been approximately $11.7 EBITDA Bridge Q2 2015 to Q3 2015 million. This includes a $1.00/gallon per 39.9 million gallons shipped of renewable diesel in 3Q 2015. Although the Company remains optimistic, there (millions) can be no assurance the tax credit will be reinstated.
$25 $15.4 ($2.4)
($8.1) LTM EBITDA Margin
$20 Fuel
25 23.4%
$15 ($6.7) 18.5%
20 16.0%
$10 $8.6 11.8% $6.8 $0.2 $7.0 15
$5 10
$0 5
EBITDA Price/ Volumes Cost of Other Adjusted FX EBITDA
0
Q2 2015 Yield Sales EBITDA… Impact Q3 2015
Q4 Q1 Q2 Q3
Note: Cost of Sales includes raw material costs, collection costs and factory costs. 2014 2015 2015 2015
Creating sustainable food, feed and fuel ingredients for a growing population
|
|
Appendix – Additional Information
13
|
|
14
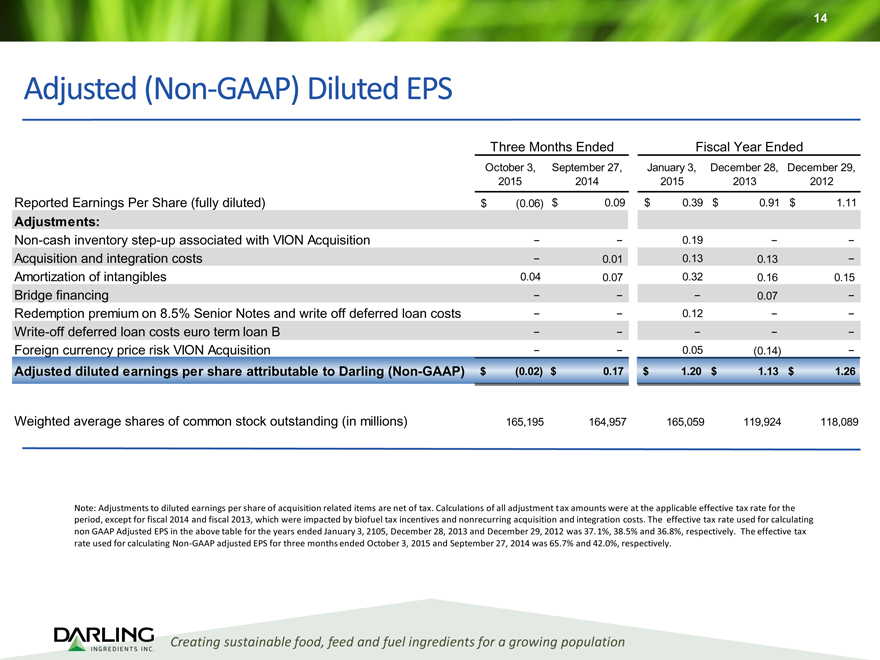
Adjusted (Non-GAAP) Diluted EPS
Three Months Ended Fiscal Year Ended
October 3, September 27, January 3, December 28, December 29, 2015 2014 2015 2013 2012
Reported Earnings Per Share (fully diluted) $ (0.06) $ 0.09 $ 0.39 $ 0.91 $ 1.11
Adjustments:
Non-cash inventory step-up associated with VION Acquisition — 0.19 —
Acquisition and integration costs— 0.01 0.13 0.13 -Amortization of intangibles 0.04 0.07 0.32 0.16 0.15
Bridge financing —— 0.07 -Redemption premium on 8.5% Senior Notes and write off deferred loan costs — 0.12 —Write-off deferred loan costs euro term loan B — — -Foreign currency price risk VION Acquisition — 0.05 (0.14) -
Adjusted diluted earnings per share attributable to Darling (Non-GAAP) $ (0.02) $ 0.17 $ 1.20 $ 1.13 $ 1.26
Weighted average shares of common stock outstanding (in millions) 165,195 164,957 165,059 119,924 118,089
Note: Adjustments to diluted earnings per share of acquisition related items are net of tax. Calculations of all adjustment tax amounts were at the applicable effective tax rate for the period, except for fiscal 2014 and fiscal 2013, which were impacted by biofuel tax incentives and nonrecurring acquisition and integration costs. The effective tax rate used for calculating non GAAP Adjusted EPS in the above table for the years ended January 3, 2105, December 28, 2013 and December 29, 2012 was 37.1%, 38.5% and 36.8%, respectively. The effective tax rate used for calculating Non-GAAP adjusted EPS for three months ended October 3, 2015 and September 27, 2014 was 65.7% and 42.0%, respectively.
Creating sustainable food, feed and fuel ingredients for a growing population
|
|
15
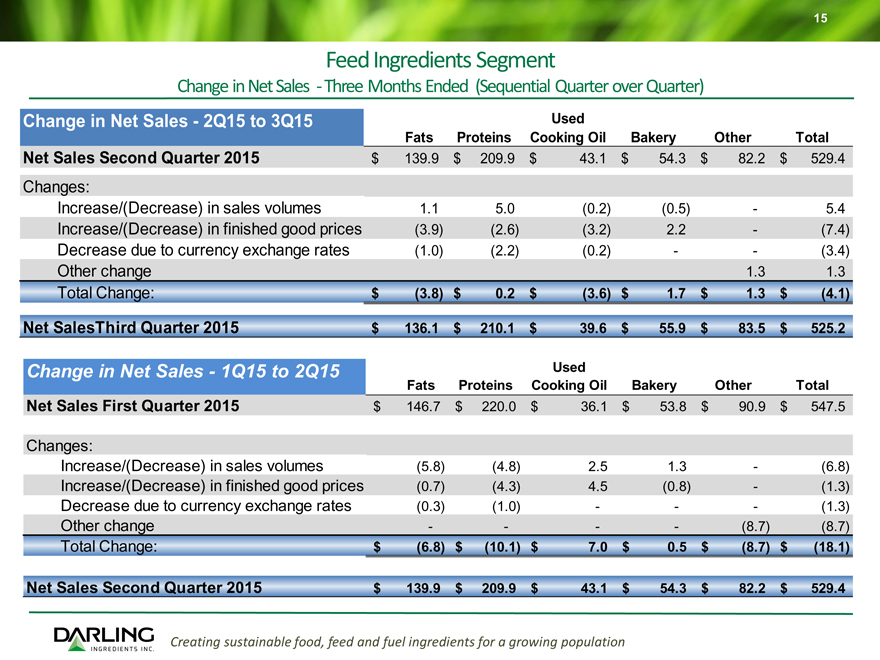
Feed Ingredients Segment
Change in Net Sales —Three Months Ended (Sequential Quarter over Quarter)
Change in Net Sales—2Q15 to 3Q15 Used
Fats Proteins Cooking Oil Bakery Other Total
Net Sales Second Quarter 2015 $ 139.9 $ 209.9 $ 43.1 $ 54.3 $ 82.2 $ 529.4
Changes:
Increase/(Decrease) in sales volumes 1.1 5.0 (0.2) (0.5) — 5.4 Increase/(Decrease) in finished good prices (3.9) (2.6) (3.2) 2.2 — (7.4) Decrease due to currency exchange rates (1.0) (2.2) (0.2) — — (3.4) Other change 1.3 1.3
Total Change: $ (3.8) $ 0.2 $ (3.6) $ 1.7 $ 1.3 $ (4.1)
Net SalesThird Quarter 2015 $ 136.1 $ 210.1 $ 39.6 $ 55.9 $ 83.5 $ 525.2
Change in Net Sales—1Q15 to 2Q15 Used
Fats Proteins Cooking Oil Bakery Other Total
Net Sales First Quarter 2015 $ 146.7 $ 220.0 $ 36.1 $ 53.8 $ 90.9 $ 547.5
Changes:
Increase/(Decrease) in sales volumes (5.8) (4.8) 2.5 1.3 — (6.8) Increase/(Decrease) in finished good prices (0.7) (4.3) 4.5 (0.8) — (1.3) Decrease due to currency exchange rates (0.3) (1.0) — — — (1.3) Other change — — — — (8.7) (8.7)
Total Change: $ (6.8) $ (10.1) $ 7.0 $ 0.5 $ (8.7) $ (18.1)
Net Sales Second Quarter 2015 $ 139.9 $ 209.9 $ 43.1 $ 54.3 $ 82.2 $ 529.4
Creating sustainable food, feed and fuel ingredients for a growing population
|
|
16
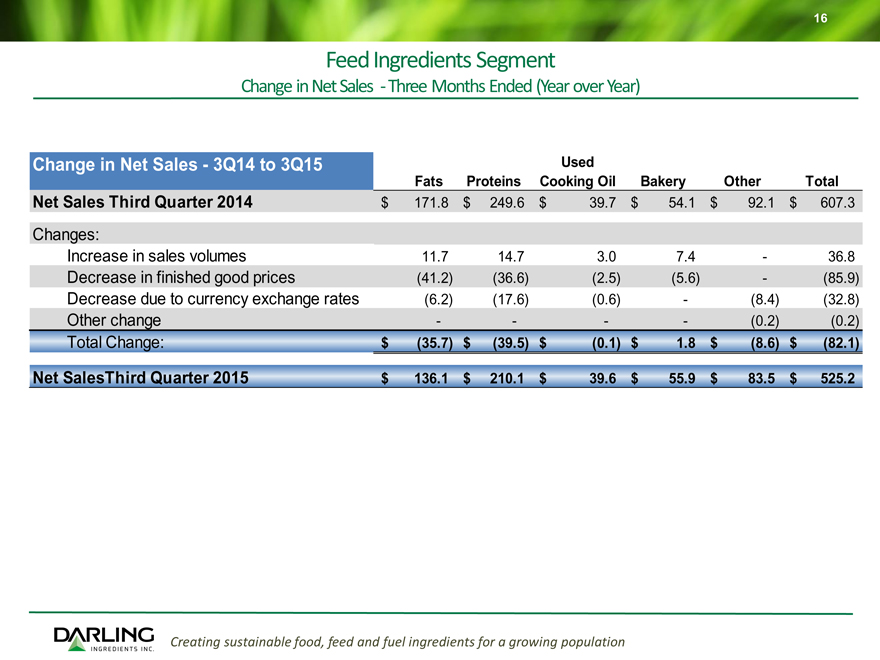
Feed Ingredients Segment
Change in Net Sales —Three Months Ended (Year over Year)
Change in Net Sales—3Q14 to 3Q15 Used
Fats Proteins Cooking Oil Bakery Other Total
Net Sales Third Quarter 2014 $ 171.8 $ 249.6 $ 39.7 $ 54.1 $ 92.1 $ 607.3
Changes:
Increase in sales volumes 11.7 14.7 3.0 7.4 — 36.8 Decrease in finished good prices (41.2) (36.6) (2.5) (5.6) — (85.9) Decrease due to currency exchange rates (6.2) (17.6) (0.6) — (8.4) (32.8) Other change — — — — (0.2) (0.2)
Total Change: $ (35.7) $ (39.5) $ (0.1) $ 1.8 $ (8.6) $ (82.1)
Net SalesThird Quarter 2015 $ 136.1 $ 210.1 $ 39.6 $ 55.9 $ 83.5 $ 525.2
Creating sustainable food, feed and fuel ingredients for a growing population
|
|
17
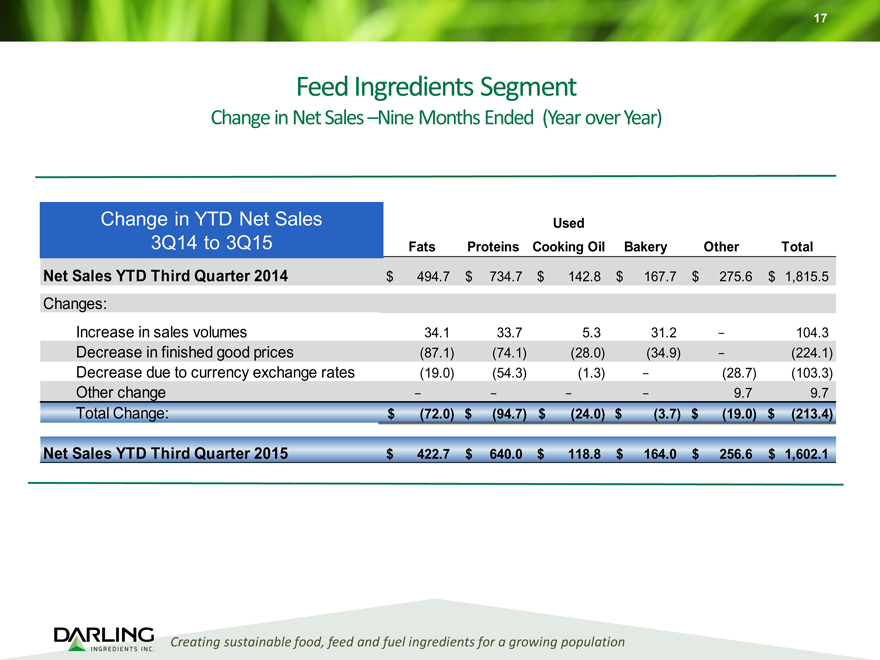
Feed Ingredients Segment
Change in Net Sales –Nine Months Ended (Year over Year)
Change in YTD Net Sales Used
3Q14 to 3Q15 Fats Proteins Cooking Oil Bakery Other Total
Net Sales YTD Third Quarter 2014 $ 494.7 $ 734.7 $ 142.8 $ 167.7 $ 275.6 $ 1,815.5
Changes:
Increase in sales volumes 34.1 33.7 5.3 31.2— 104.3 Decrease in finished good prices (87.1) (74.1) (28.0) (34.9)— (224.1) Decrease due to currency exchange rates (19.0) (54.3) (1.3)— (28.7) (103.3) Other change — — 9.7 9.7
Total Change: $ (72.0) $ (94.7) $ (24.0) $ (3.7) $ (19.0) $ (213.4)
Net Sales YTD Third Quarter 2015 $ 422.7 $ 640.0 $ 118.8 $ 164.0 $ 256.6 $ 1,602.1
Creating sustainable food, feed and fuel ingredients for a growing population
|
|
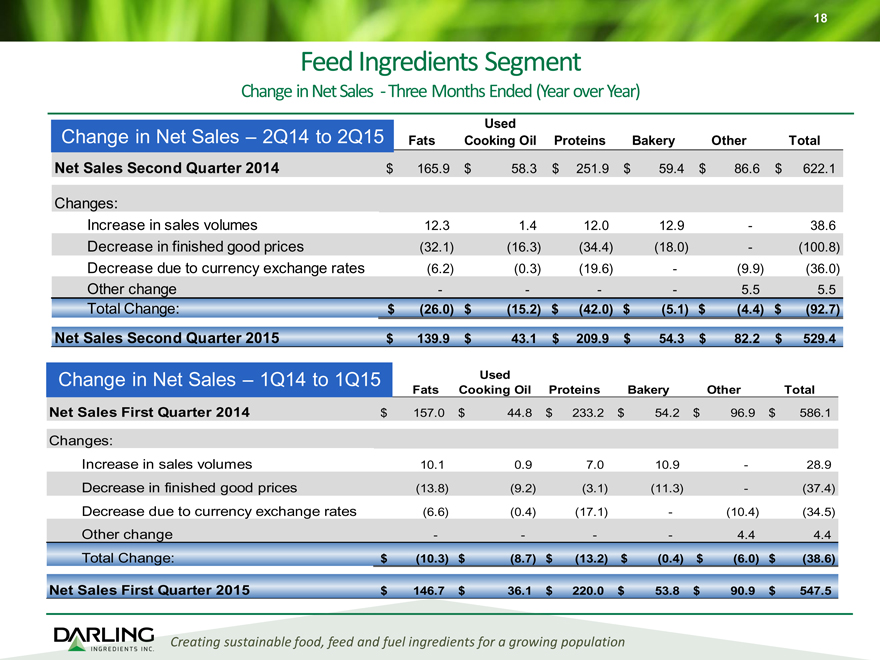
18
Feed Ingredients Segment
Change in Net Sales —Three Months Ended (Year over Year)
Used
Change in Net Sales – 2Q14 to 2Q15 Fats Cooking Oil Proteins Bakery Other Total
Net Sales Second Quarter 2014 $ 165.9 $ 58.3 $ 251.9 $ 59.4 $ 86.6 $ 622.1
Changes:
Increase in sales volumes 12.3 1.4 12.0 12.9 — 38.6 Decrease in finished good prices (32.1) (16.3) (34.4) (18.0) — (100.8) Decrease due to currency exchange rates (6.2) (0.3) (19.6) — (9.9) (36.0) Other change — — — — 5.5 5.5
Total Change: $ (26.0) $ (15.2) $ (42.0) $ (5.1) $ (4.4) $ (92.7) Net Sales Second Quarter 2015 $ 139.9 $ 43.1 $ 209.9 $ 54.3 $ 82.2 $ 529.4
Change in Net Sales – 1Q14 to 1Q15 Used
Fats Cooking Oil Proteins Bakery Other Total
Net Sales First Quarter 2014 $ 157.0 $ 44.8 $ 233.2 $ 54.2 $ 96.9 $ 586.1
Changes:
Increase in sales volumes 10.1 0.9 7.0 10.9 — 28.9 Decrease in finished good prices (13.8) (9.2) (3.1) (11.3) — (37.4) Decrease due to currency exchange rates (6.6) (0.4) (17.1) — (10.4) (34.5) Other change — — — — 4.4 4.4
Total Change: $ (10.3) $ (8.7) $ (13.2) $ (0.4) $ (6.0) $ (38.6)
Net Sales First Quarter 2015 $ 146.7 $ 36.1 $ 220.0 $ 53.8 $ 90.9 $ 547.5
Creating sustainable food, feed and fuel ingredients for a growing population
|
|
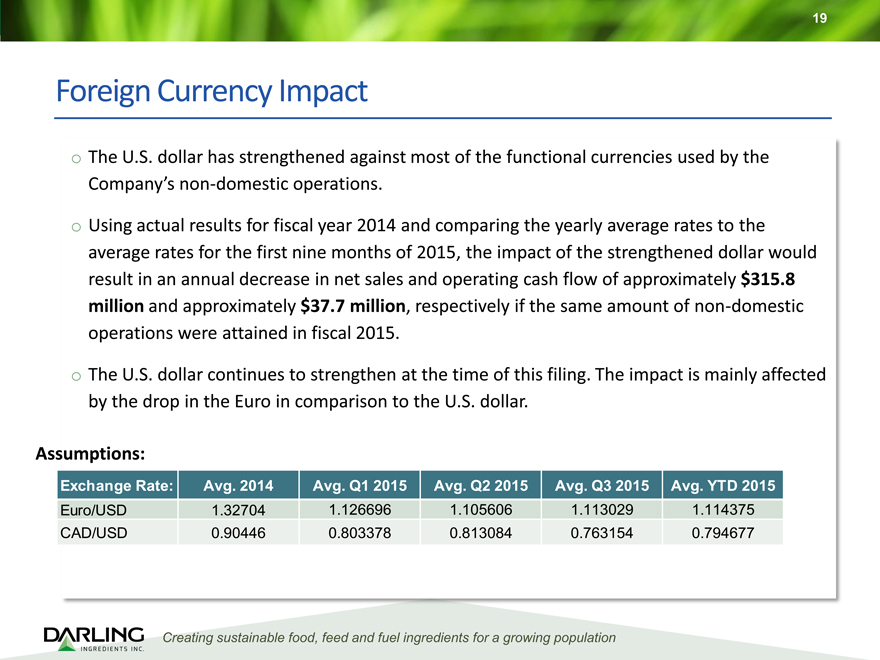
Foreign Currency Impact
The U.S. dollar has strengthened against most of the functional currencies used by the
Company’s non-domestic operations.
Using actual results for fiscal year 2014 and comparing the yearly average rates to the average rates for the first nine months of 2015, the impact of the strengthened dollar would result in an annual decrease in net sales and operating cash flow of approximately $315.8 million and approximately $37.7 million, respectively if the same amount of non-domestic operations were attained in fiscal 2015.
The U.S. dollar continues to strengthen at the time of this filing. The impact is mainly affected by the drop in the Euro in comparison to the U.S. dollar.
Assumptions:
Exchange Rate: Avg. 2014 Avg. Q1 2015 Avg. Q2 2015 Avg. Q3 2015 Avg. YTD 2015
Euro/USD 1.32704 1.126696 1.105606 1.113029 1.114375
CAD/USD 0.90446 0.803378 0.813084 0.763154 0.794677
Creating sustainable food, feed and fuel ingredients for a growing population
19
|
|
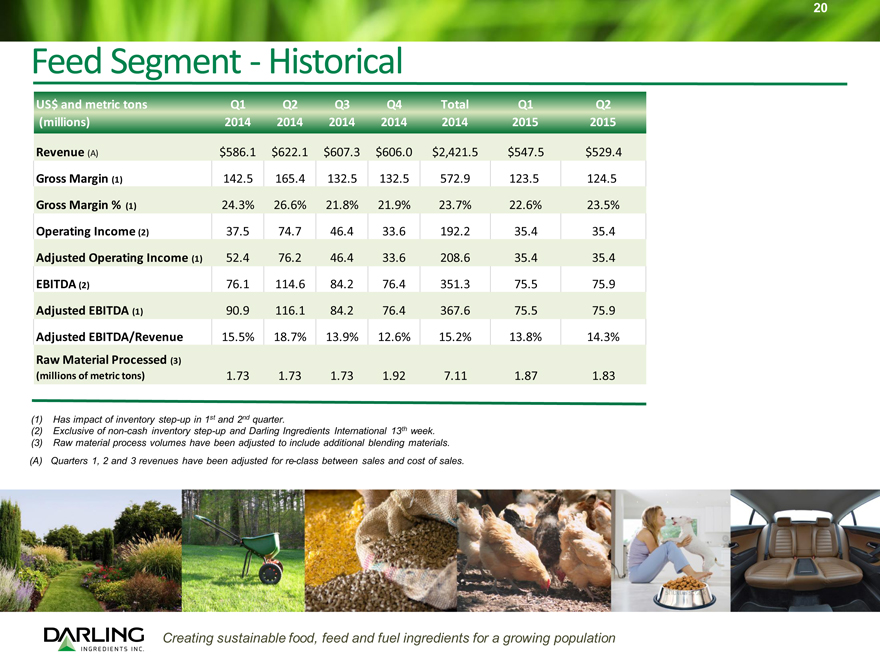
Feed Segment—Historical
US$ and metric tons Q1 Q2 Q3 Q4 Total Q1 Q2 (millions) 2014 2014 2014 2014 2014 2015 2015
Revenue (A) $586.1 $622.1 $607.3 $606.0 $2,421.5 $547.5 $529.4 Gross Margin (1) 142.5 165.4 132.5 132.5 572.9 123.5 124.5 Gross Margin % (1) 24.3% 26.6% 21.8% 21.9% 23.7% 22.6% 23.5% Operating Income (2) 37.5 74.7 46.4 33.6 192.2 35.4 35.4 Adjusted Operating Income (1) 52.4 76.2 46.4 33.6 208.6 35.4 35.4 EBITDA (2) 76.1 114.6 84.2 76.4 351.3 75.5 75.9 Adjusted EBITDA (1) 90.9 116.1 84.2 76.4 367.6 75.5 75.9 Adjusted EBITDA/Revenue 15.5% 18.7% 13.9% 12.6% 15.2% 13.8% 14.3%
Raw Material Processed (3)
(millions of metric tons) 1.73 1.73 1.73 1.92 7.11 1.87 1.83
(1) Has impact of inventory step-up in 1st and 2nd quarter.
(2) Exclusive of non-cash inventory step-up and Darling Ingredients International 13th week. (3) Raw material process volumes have been adjusted to include additional blending materials. (A) Quarters 1, 2 and 3 revenues have been adjusted for re-class between sales and cost of sales.
Creating sustainable food, feed and fuel ingredients for a growing population
20
|
|
21
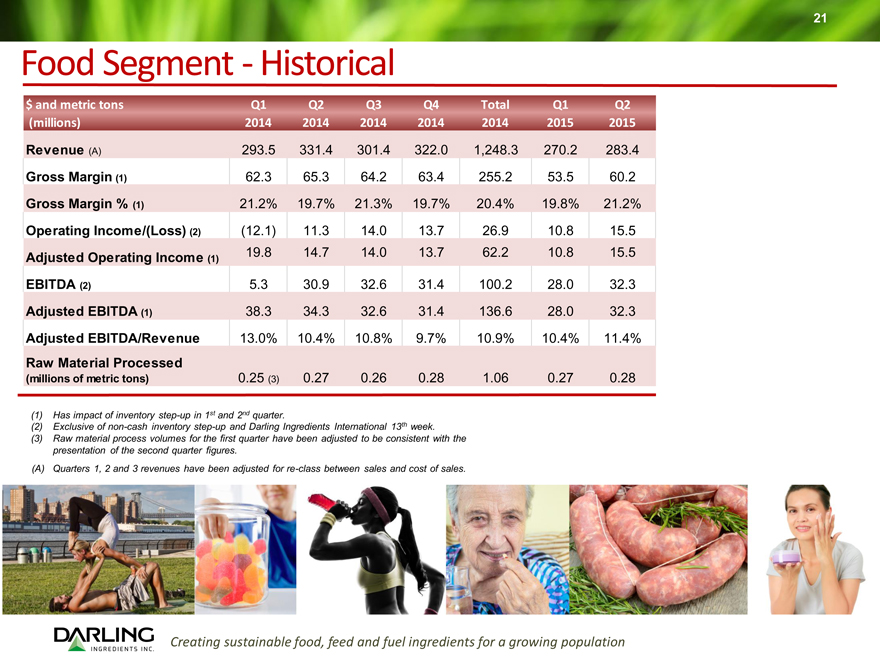
Food Segment—Historical
$ and metric tons Q1 Q2 Q3 Q4 Total Q1 Q2 (millions) 2014 2014 2014 2014 2014 2015 2015
Revenue (A) 293.5 331.4 301.4 322.0 1,248.3 270.2 283.4 Gross Margin (1) 62.3 65.3 64.2 63.4 255.2 53.5 60.2 Gross Margin % (1) 21.2% 19.7% 21.3% 19.7% 20.4% 19.8% 21.2%
Operating Income/(Loss) (2) (12.1) 11.3 14.0 13.7 26.9 10.8 15.5 Adjusted Operating Income 19.8 14.7 14.0 13.7 62.2 10.8 15.5
(1)
EBITDA (2) 5.3 30.9 32.6 31.4 100.2 28.0 32.3
Adjusted EBITDA (1) 38.3 34.3 32.6 31.4 136.6 28.0 32.3
Adjusted EBITDA/Revenue 13.0% 10.4% 10.8% 9.7% 10.9% 10.4% 11.4%
Raw Material Processed
(millions of metric tons) 0.25 (3) 0.27 0.26 0.28 1.06 0.27 0.28
(1) Has impact of inventory step-up in 1st and 2nd quarter.
(2) Exclusive of non-cash inventory step-up and Darling Ingredients International 13th week.
(3) Raw material process volumes for the first quarter have been adjusted to be consistent with the presentation of the second quarter figures.
(A) Quarters 1, 2 and 3 revenues have been adjusted for re-class between sales and cost of sales.
Creating sustainable food, feed and fuel ingredients for a growing population
|
|
22
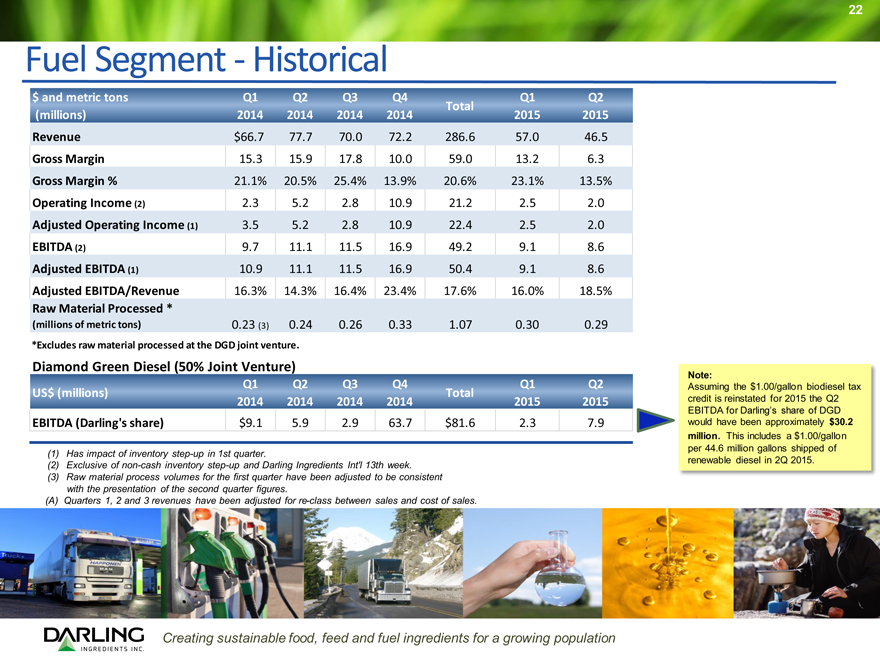
Fuel Segment—Historical
$ and metric tons Q1 Q2 Q3 Q4 Q1 Q2 Total (millions) 2014 2014 2014 2014 2015 2015 Revenue $66.7 77.7 70.0 72.2 286.6 57.0 46.5 Gross Margin 15.3 15.9 17.8 10.0 59.0 13.2 6.3 Gross Margin % 21.1% 20.5% 25.4% 13.9% 20.6% 23.1% 13.5% Operating Income (2) 2.3 5.2 2.8 10.9 21.2 2.5 2.0
Adjusted Operating Income (1) 3.5 5.2 2.8 10.9 22.4 2.5 2.0
EBITDA (2) 9.7 11.1 11.5 16.9 49.2 9.1 8.6 Adjusted EBITDA (1) 10.9 11.1 11.5 16.9 50.4 9.1 8.6 Adjusted EBITDA/Revenue 16.3% 14.3% 16.4% 23.4% 17.6% 16.0% 18.5%
Raw Material Processed *
(millions of metric tons) 0.23 (3) 0.24 0.26 0.33 1.07 0.30 0.29
*Excludes raw material processed at the DGD joint venture.
Diamond Green Diesel (50% Joint Venture)
Q1 Q2 Q3 Q4 Q1 Q2 Note:
Assuming the $1.00/gallon biodiesel tax
US$ (millions) Total
2014 2014 2014 2014 2015 2015 credit is reinstated for 2015 the Q2
EBITDA for Darling’s share of DGD
EBITDA (Darling’s share) $9.1 5.9 2.9 63.7 $81.6 2.3 7.9 would have been approximately $30.2 million. This includes a $1.00/gallon per 44.6 million gallons shipped of
(1) Has impact of inventory step-up in 1st quarter. renewable diesel in 2Q 2015.
(2) Exclusive of non-cash inventory step-up and Darling Ingredients Int’l 13th week.
(3) Raw material process volumes for the first quarter have been adjusted to be consistent with the presentation of the second quarter figures.
(A) Quarters 1, 2 and 3 revenues have been adjusted for re-class between sales and cost of sales.
Creating sustainable food, feed and fuel ingredients for a growing population
|
|
23
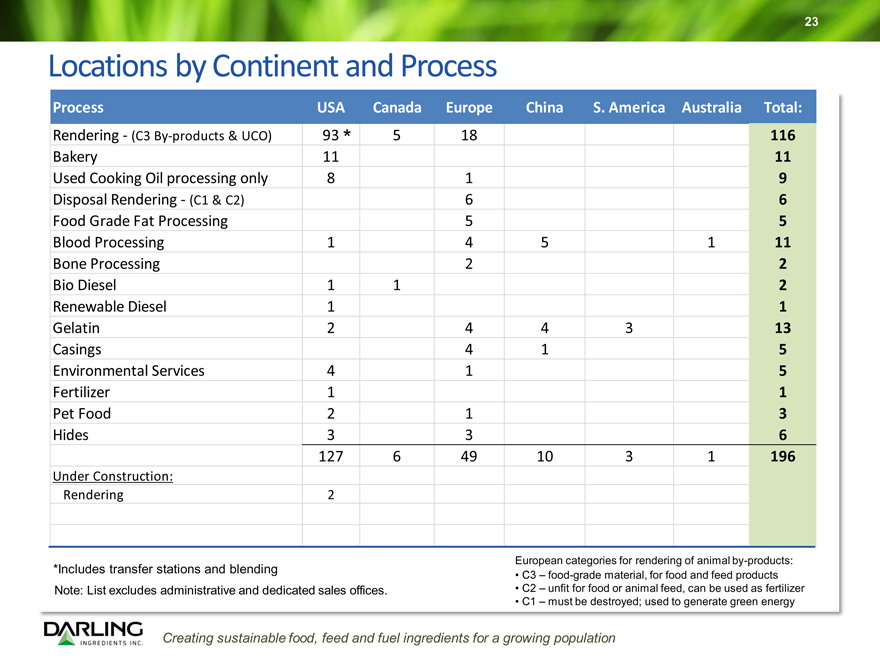
Locations by Continent and Process
Process USA Canada Europe China S. America Australia Total:
Rendering—(C3 By-products & UCO) 93 * 5 18 116
Bakery 11 11 Used Cooking Oil processing only 8 1 9 Disposal Rendering—(C1 & C2) 6 6 Food Grade Fat Processing 5 5 Blood Processing 1 4 5 1 11 Bone Processing 2 2 Bio Diesel 1 1 2 Renewable Diesel 1 1 Gelatin 2 4 4 3 13 Casings 4 1 5 Environmental Services 4 1 5 Fertilizer 1 1 Pet Food 2 1 3 Hides 3 3 6 127 6 49 10 3 1 196
Under Construction:
Rendering 2
European categories for rendering of animal by-products:
*Includes transfer stations and blending
C3 – food-grade material, for food and feed products
Note: List excludes administrative and dedicated sales offices. • C2 – unfit for food or animal feed, can be used as fertilizer
C1 – must be destroyed; used to generate green energy
Creating sustainable food, feed and fuel ingredients for a growing population
|
|
24
Non-U.S. GAAP Measures
Adjusted EBITDA is presented here not as an alternative to net income, but rather as a measure of the Company’s operating performance and is not intended to be a presentation in accordance with GAAP. Since EBITDA (generally, net income plus interest expenses, taxes, depreciation and amortization) is not calculated identically by all companies, this presentation may not be comparable to EBITDA or adjusted EBITDA presentations disclosed by other companies. Adjusted EBITDA is calculated in this presentation and represents, for any relevant period, net income/(loss) plus depreciation and amortization, goodwill and long-lived asset impairment, interest expense, (income)/loss from discontinued operations, net of tax, income tax provision, other income/(expense) and equity in net loss of unconsolidated subsidiary. Management believes that Adjusted EBITDA is useful in evaluating the Company’s operating performance compared to that of other companies in its industry because the calculation of
Adjusted EBITDA generally eliminates the effects of financing income taxes and certain non-cash and other items that may vary for different companies for reasons unrelated to overall operating performance.
As a result, the Company’s management uses Adjusted EBITDA as a measure to evaluate performance and for other discretionary purposes. However, Adjusted EBITDA is not a recognized measurement under GAAP, should not be considered as an alternative to net income as a measure of operating results or to cash flow as a measure of liquidity, and is not intended to be a presentation in accordance with GAAP. In addition to the foregoing, management also uses or will use Adjusted EBITDA to measure compliance with certain financial covenants under the Company’s Senior Secured Credit Facilities and 5.375% Notes and 4.75% Notes that were outstanding at October 3, 2015. However, the amounts shown in this presentation for Adjusted EBITDA differ from the amounts calculated under similarly titled definitions in the Company’s Senior Secured Credit Facilities and 5.375% Notes and 4.75%
Notes, as those definitions permit further adjustments to reflect certain other non-recurring costs and non-cash charges.
In addition, the Company’s management used adjusted diluted earnings per share as a measure of earnings due to the significant merger and acquisition activity of the Company. However, adjusted earnings per share is not a recognized measurement under GAAP and should not be considered as an alternative to diluted earnings per share presented in accordance with GAAP. Adjusted diluted earnings per share is defined as adjusted net income attributable to Darling divided by the weighted average shares of diluted common stock. Adjusted net income attributable to Darling is defined as a reconciliation of net income attributable to Darling, net of tax (i) adjusted for net of tax acquisition and integration costs related to merger and acquisitions, (ii) net of tax amortization of acquisition related intangibles and (iii) net of tax certain non-recurring items that are not part of normal operations. This measure is solely for the purpose of calculating adjusted diluted earnings per share and is not intended to be a substitute of presentation in accordance with GAAP.
Creating sustainable food, feed and fuel ingredients for a growing population