Attached files
| file | filename |
|---|---|
| 8-K - FORM 8-K - BENCHMARK ELECTRONICS INC | form8k_presentation.htm |

design develop deliver advanced technology Strategic Update November 12, 2015

design develop deliver advanced technology 1 Forward - Looking Statements This document contains forward - looking statements within the scope of the Securities Act of 1933 and the Securities Exchange Act of 1934. The words “expect,” “estimate,” “anticipate,” “predict” and similar expressions, and the negatives thereof, often identify forward - looking statements, which are not limited to historical facts. Our forward - looking statements include, among other things: guidance for the fourth quarter of 2015 relating to sales; statements , express or implied, concerning future operating results or margins, the ability to generate sales, income or cash flow; and Benchmark’s business and growth strategies and expected growth and performance. Although Benchmark believes these statements are based upon reasonable assumptions, they involve risks and uncertainties relating to our operations, markets and business environment generally. If one or more of these risks or uncertainties materialize, or underlying assumptions prove incorrect, actual outcomes may vary materially from those indicated. All forward - looking statements included in this document are based upon information available to Benchmark as of the date of this document, and the Company assumes no obligation to update them. Readers are advised to consult further disclosures on related subjects, particularly in Item 1A, “Risk Factors” of the Company’s annual report on Form 10 - K for the year ended December 31, 2014, in its other filings with the Securities and Exchange Commission and in its press releases. Non - GAAP Financial Information This document includes certain financial measures, such as operating margin, that exclude certain items and therefore are not in accordance with generally accepted accounting principles (“GAAP”). A detailed reconciliation between GAAP results and results excluding special items (“non - GAAP”) is included in the Appendix of this document.

design develop deliver advanced technology 2 Founded : 1986 Stock Symbol: NYSE: BHE Employees: 11,000 Locations: 20 facilities 7 countries Sales Mix: 48% United States 52% International Headquarters: Angleton, TX USA Benchmark: Leading global integrated EMS player Who We Are ► G lobal provider of engineering, design, manufacturing and testing solutions ► Solutions provider of choice for customers’ most critical technical problems Our Goals ► Continue to shift portfolio to higher value segments ► >10% annual revenue growth in higher value markets and 6 - 8% revenue CAGR overall ► >5% operating profit ► ~50% FCF returned to shareholders

design develop deliver advanced technology 3 Traditional markets Higher value markets ► Strong Foundation & Diversification ▪ Complex Design and Manufacturing Solutions ▪ Leading Positions in Higher Value Markets ▪ Balanced Global Footprint ▪ Longstanding Customer Relationships ▪ Healthy High - Performing Culture ► Focused on Long - Term Value Creation ▪ Strong Execution & Financial Track Record ▪ Solid Operating Margin Growth Profile ▪ Engineering Led Solutions ▪ Balanced and Effective Capital Deployment Benchmark: Leading with Engineering Solutions Industrials 31% Medical 13% Test & Instrumentation 9 % High - End Computing 21% Telecom 26% % LTM Revenue as of 9/30/15 53% 47%

design develop deliver advanced technology 4 $2.6 LTM 9/30/15 6.3% 8.9% 9.6% 10.1% 2011 2012 2013 2014 $2.3 $2.5 $2.5 $2.8 2011 2012 2013 2014 Revenue ($bn) Strong Track Record and Proven Execution Return on Invested Capital 2011 – Present ► +7% Annual Revenue Growth ► +380bps Annual ROIC improvement ► + 170bps Annual Non - GAAP Operating Margin Expansion 4.1% LTM 9/30/15 Non - GAAP Operating margin 10.2% LTM 9/30/15 2.2% 3.5% 3.5% 3.9% 2011 2012 2013 2014 ROIC = [(Non - GAAP income from operations plus stock compensation )*( 1 - Tax Rate )] ÷ [ Average Invested Capital less Average Cash for last 5 quarters]

design develop deliver advanced technology 5 Strategic Focus Areas Portfolio Management Advancing Our Long - Term Strategy >10% Annual Growth in Higher Value Markets ▪ Focus on expansion in Key End Markets • Industrials (including aerospace & defense) • Medical Technologies • Test & Instrumentation (including semi - capital equipment) Margin Expansion >5% Long - Term Operating Margin ▪ Advancing Engineering - led Solutions ▪ Driving LEAN and Operational Excellence Initiatives ▪ Optimizing Cost Structure and Working Capital Balanced Capital Deployment >50% Free Cash Flow Return to Shareholders ▪ Targeted Strategic Organic Investments ▪ Close - to - Core and Highly Adjacent M&A ▪ Share Repurchases

design develop deliver advanced technology 6 `` Committed to enhancing shareholder value 1. #1 strategic priority: continue shift to higher value business with engineering - led solutions 2. Benchmark is best positioned to capitalize on this opportunity and has managed this transition most effectively 3. Corporate Strategy = Maximize shareholder returns through organic growth and acquisitions 4. Benchmark optimizes the return of capital to enhance shareholder value and invest for the future 5. Best - in - class execution 1 2 3 5 4
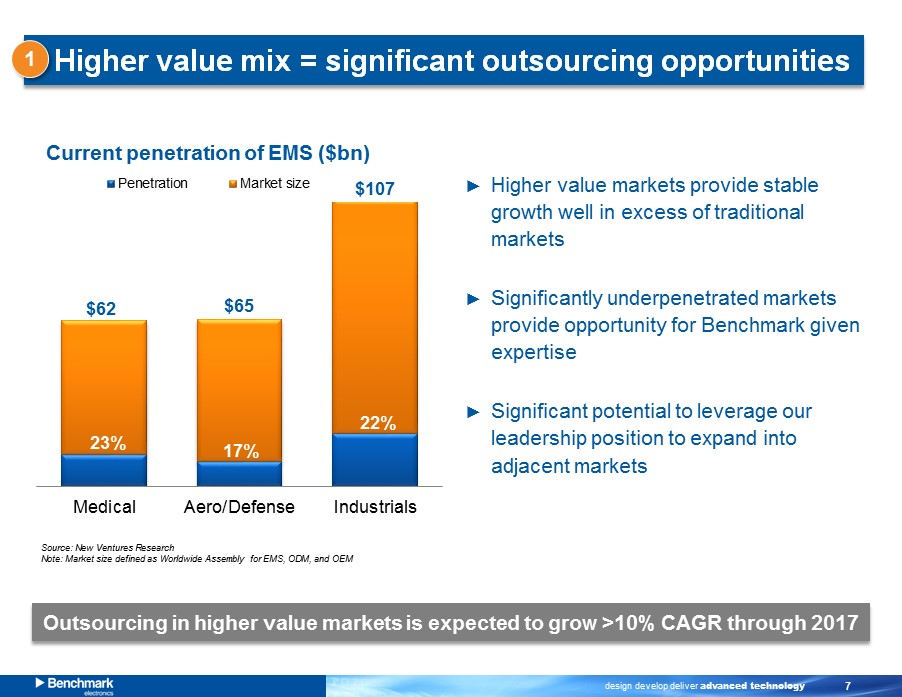
design develop deliver advanced technology 7 Medical Aero/Defense Industrials Outsourcing in higher value markets is expected to grow >10% CAGR through 2017 $62 $65 23% 17% 22% ► Higher value markets provide stable growth well in excess of traditional markets ► Significantly underpenetrated markets provide opportunity for Benchmark given expertise ► Significant potential to leverage our leadership position to expand into adjacent markets Higher value mix = significant outsourcing opportunities Current penetration of EMS ($bn) $107 Source: New Ventures Research Note: Market size defined as Worldwide Assembly for EMS, ODM, and OEM 1 Penetration Market size

design develop deliver advanced technology 8 Shift to higher value mix has driven superior performance Benchmark Peer median Current higher value mix Top 10 customer concentration change 1. TSR 2. Revenue CAGR % 3. Gross margin change 4. Operating margin change 5. FCF margin change 6. Cash conversion cycle 2011 – LTM 9/30/15 Focus on higher value markets = stronger financial performance 2 37% +4.2% +1.9% +3.9% +2.1% 53% 31% + 0.2% (0.3%) ( 0.9%) +0.3% (5.0 %) 36 % +1.7 % - 3 days + 7 days Source: Company filings Note: Peers include Celestica, Flextronics , Jabil, Plexus , and Sanmina
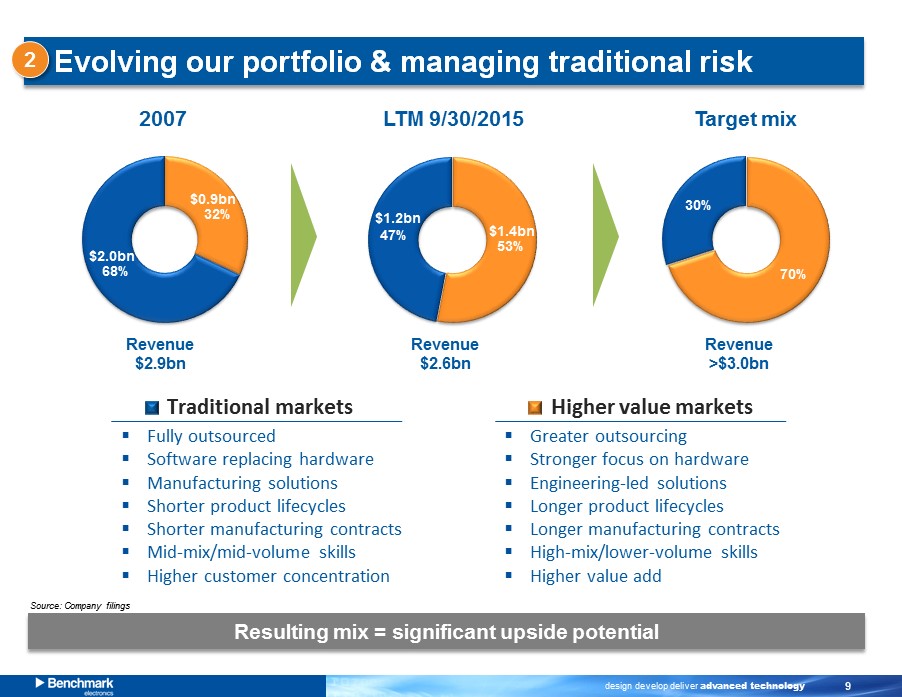
design develop deliver advanced technology 9 Evolving our portfolio & managing traditional risk 32% 68% 2007 LTM 9/30/2015 Target mix 53% 47% 2 70% 30% $1.2bn $1.4bn $2.0bn $0.9bn Revenue $2.9bn Revenue $ 2.6bn Resulting mix = significant upside potential Source: Company filings Revenue >$3.0bn ▪ Fully outsourced ▪ Software replacing hardware ▪ Manufacturing solutions ▪ Shorter product lifecycles ▪ Shorter manufacturing contracts ▪ Mid - mix/mid - volume skills ▪ Higher customer concentration ▪ Greater outsourcing ▪ Stronger focus on hardware ▪ Engineering - led solutions ▪ Longer product lifecycles ▪ Longer manufacturing contracts ▪ High - mix/lower - volume skills ▪ Higher value add Traditional markets Higher value markets

design develop deliver advanced technology 10 Significant progress in higher value markets $1.4bn Q3 - 15 New business wins Q4 - 15 Outlook Industrials ► Up high single digits Medical ► Up high single digits Test & Instrumentation ► Down mid double digits ► Significant new business wins in higher value markets ► Expanding revenue streams towards longer lifecycle products and increasing engineering services ► Significant remaining opportunity Customers Approximately 90% of new program wins in higher value markets 2 Source: Company filings Comp, Telco 13% Industrials 62% Medical 22% T&I 3% Traditional markets Higher value markets

design develop deliver advanced technology 11 2013 ► Aerospace, semi - cap, industrials, instrumentation, medical and communications 2013 ► Industrials, including aerospace and defense, medical and communications 2015 ► Industrials, including aerospace and defense Successful M&A track record supports our strategy 3 Close - to - Core acquisitions have accelerated path to higher value mix Year Close - to - Core - End market focus 2.1% 4.1% 5.0%+ 2011 LTM 9/30/2015 Target Operating margin (%)

design develop deliver advanced technology 12 Key business h ighlights ► LTM Revenue of ~$ 100mm, annual growth >10 % since 2012 ► Sustainable IP protects unique business model and market position ► Diverse portfolio of well - positioned programs and platforms Snapshot ► Encrypted and ruggedized communication systems ► Avionic displays ► Military - grade RF components Secure Technology acquisition = significant growth potential Core Strategic Benefits ► Aligns with higher value segments of industrials including A&D ► Strengthens engineering - led solutions ► Cross - selling opportunities Adjacent Benefits ► Complementary skills in full product design and IP ownership ► New skills in field services management Financial Benefits ► Expands margins towards >5% goal ► Drives greater long - term EPS accretion and return on capital than similar sized share repurchase 3 Scales higher value footprint and will be immediately accretive

design develop deliver advanced technology 13 Capex 29% M&A 41% Repurchases 30% Cumulative capital allocation FY11 – YTD 9/30/15 Balanced capital deployment track record Disciplined, shareholder - friendly and balanced approach to capital allocation ► Continue investing to drive growth and extend business model with Voice - of - Customer inputs aligned for organic growth Capex ► Continue to evaluate and pursue strategic, higher value, complementary businesses that are accretive to financial profile M&A ► Consistently returned capital to shareholders through share repurchases in past 25 consecutive quarters ► Over past 5 years, cumulative $ 240mm + (72% of FCF ) spent on share repurchases Share repurchases 4 1 PF for Secure acquisition 2 Excludes Secure acquisition 3 FCF defined as CFO less capex 1 40% 2 43% 2 17% 2 3

design develop deliver advanced technology 14 94 91 78 74 37 44 2011 LTM 9/30/15 2011 LTM 9/30/15 2011 LTM 9/30/15 Cash conversion cycle BHE Peers High mix peer Continuous working capital improvement 5 Note: Peers include Celestica, Flextronics, Jabil, Plexus, and Sanmina ► CCC is driven by end market exposure – lower volume, higher complexity products have lower velocity ► Continuous focus on improvement has maintained consistency versus peers (1 day change versus 11 days) ► Focus to reach 75 day long - term target: Concentrated initiatives to further improve working capital LT target: 75 days • Alignment of customer and supplier payment terms • Demand and inventory optimization • Strategic sourcing initiatives Note: Cash conversion cycle days = AR days + Inventory days – AP days
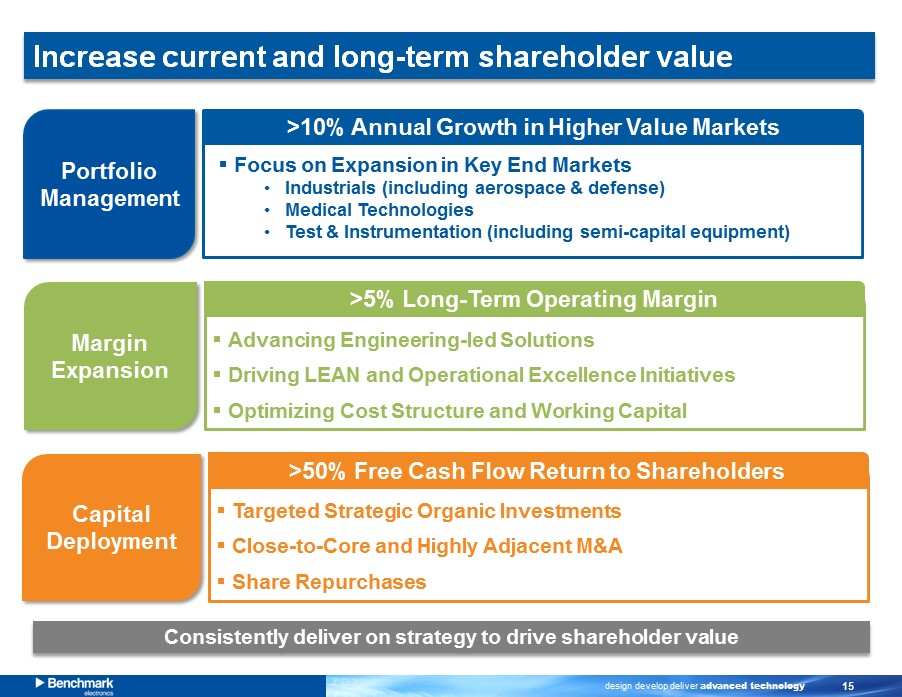
design develop deliver advanced technology 15 Increase current and long - term shareholder value Consistently deliver on strategy to drive shareholder value Portfolio Management >10% Annual Growth in Higher Value Markets ▪ Focus on Expansion in Key End Markets • Industrials (including aerospace & defense) • Medical Technologies • Test & Instrumentation (including semi - capital equipment) Margin Expansion >5% Long - Term Operating Margin ▪ Advancing Engineering - led Solutions ▪ Driving LEAN and Operational Excellence Initiatives ▪ Optimizing Cost Structure and Working Capital Capital Deployment >50% Free Cash Flow Return to Shareholders ▪ Targeted Strategic Organic Investments ▪ Close - to - Core and Highly Adjacent M&A ▪ Share Repurchases

design develop deliver advanced technology 16 Questions ?

design develop deliver advanced technology 17 Appendix

design develop deliver advanced technology 18 GAAP to Non - GAAP reconciliations 18 (In millions) 2007 2008 2009 2010 2011 2012 2013 2014 LTM 2015 Income from operations (GAAP) $ 90.3 ($ 166.5) $ 52.3 $88.4 $ 41.3 $ 75.6 $116.5 $ 100.1 $ 99.7 Goodwill impairment - 247.5 - - - - - - - Restructuring charges and integration costs 2.8 8.3 6.7 4.5 2.2 9.3 7.1 8.5 Asset impairment charge and other - - - - - - 2.6 ( 1.5) ( 1.5) Thailand flood - related items, net of insurance - - - - 3.4 9.0 (41.3) ( 1.6) - Customer bankruptcy - - - - - - - 5.0 - Non - GAAP income from operations $ 101.9 $83.8 $ 60.6 $ 95.2 $ 49.2 $ 86.8 $87.2 $ 109.2 $ 106.7 Net income (GAAP) $ 92.4 ($ 135.6) $53.4 $ 79.8 $ 52.0 $ 56.6 $110.9 $ 81.2 $ 79.3 Goodwill impairement, net of tax - 218.9 - - - - - - - Restructuring charges and integration costs, net of tax 8.3 2.5 7.3 4.7 4.4 1.8 8.3 4.9 5.8 Asset impairment charge and other, net of tax - - - - - - 2.8 ( 1.5) ( 1.5) Thailand flood - related items, net of insurance and tax - - - - 3.2 9.9 (35.6) ( 1.3) - Customer bankruptcy, net of tax - - - - - - - 4.8 - Discrete US tax benefit (6.5) ( 3.4) (2.7) - - - (17.5) - - Non - GAAP net income $94.2 $82.3 $58.0 $ 84.5 $ 59.6 $ 68.3 $69.0 $ 88.1 $ 83.6