Attached files
| file | filename |
|---|---|
| 8-K - FORM 8-K - NEW YORK COMMUNITY BANCORP INC | d57350d8k.htm |
 Investor
Presentation November 2015
Re-Launching our Growth Strategy;
Growing Earnings, Building Capital, and Creating Value
Exhibit 99.1 |
 New York Community Bancorp, Inc. 2 Cautionary Statements These materials do not constitute an offer to sell or a solicitation of an offer to buy any securities or a solicitation of any vote or
approval. New York Community Bancorp, Inc. (“NYCB”) will
file a registration statement on Form S-4 with the SEC in connection with the proposed transaction. The registration statement will include a proxy statement of Astoria Financial and NYCB which also will constitute a prospectus of NYCB that will be
sent to the stockholders of Astoria Financial. Stockholders are advised to read the joint proxy statement/prospectus when it becomes available because it will contain important information about NYCB, Astoria Financial, and the proposed transaction. When filed, this document and
other documents relating to the merger filed by NYCB can be obtained free
of charge from the SEC’s website at www.sec.gov. These documents also can be obtained free of charge by accessing NYCB’s website at www.mynycb.com under the tab “Investor Relations”, then under
“Financial Results”, and then under “SEC Filings.”
Alternatively, these documents, when available, can be obtained free of charge from NYCB upon written request to New York Community Bancorp, Inc., Attn: Corporate Secretary, 615 Merrick Avenue, Westbury, New York 11590 or by calling (516)
683-4100,
or from Astoria Financial upon written request to Astoria Financial Corporation, Attn: Monte N. Redman, President, One Astoria Bank Plaza, Lake Success, New York 11042 or by calling (516) 327-3000. NYCB, Astoria Financial, and certain of their respective directors and executive officers may be deemed to be participants in the solicitation of
proxies from Astoria Financial and NYCB stockholders in connection with
the proposed transaction under the rules of the SEC. Certain information regarding the interests of these participants and a description of their direct and indirect interests, by security holdings or otherwise, will
be included in the joint proxy statement/prospectus regarding the
proposed transaction when it becomes available. Additional information about NYCB and its directors and officers may be found in the definitive proxy statement of NYCB relating to its 2015 Annual Meeting of Stockholders
filed with the SEC on April 24, 2015. Additional information about
Astoria Financial and its directors and officers may be found in the definitive proxy statement of Astoria relating to its 2015 Annual Meeting of Stockholders filed with the SEC on April 17, 2015. This definitive proxy
statement can be obtained free of charge from the SEC’s website at
www.sec.gov. Additional
Information and Where to Find It Participants in Solicitation |
 New York Community Bancorp, Inc. 3 Cautionary Statements Forward-Looking Information The information presented herein, on the webcast, and in other related communications may contain certain “forward-looking
statements” within the meaning of the Private Securities Litigation
Reform Act of 1995. These statements include, but are not limited to, the expected completion date, financial benefits, and other effects of the proposed merger of New York Community Bancorp, Inc. (“New York Community”) and Astoria Financial
Corporation (“Astoria Financial”).
Forward-looking statements can be identified by the use of the words “anticipate,” “expect,” “intend,” “estimate,” “target,” and words of similar import. Forward-looking statements are not historical facts but instead express only management’s beliefs regarding future results or events,
many of which, by their nature, are inherently uncertain and outside of
management’s control. It is possible that actual results and outcomes may differ, possibly materially, from the anticipated results or outcomes indicated in these forward-looking statements.
Factors that may cause such a difference include, but are not limited to, the reaction
to the transaction of the companies’ customers, employees, and
counterparties; customer disintermediation; inflation; expected synergies, cost
savings, and other financial benefits of the proposed transaction might
not be realized within the expected timeframes or might be less than projected; the
requisite stockholder and regulatory approvals for the proposed
transaction might not be obtained; credit and interest rate risks associated with New
York Community’s and Astoria Financial’s respective businesses,
customers, borrowings, repayment, investment, and deposit practices, and general economic conditions, either nationally or in the market areas in which New York Community and Astoria Financial operate or anticipate doing business, are less favorable than expected; new regulatory or legal
requirements or obligations; and other risks and important factors that
could affect New York Community’s and Astoria Financial’s future results are identified in their Annual Reports on Form 10-K for the year ended December 31, 2014 and in other reports filed with the Securities and
Exchange Commission (“SEC”).
Forward-looking statements are made only as of the date of the presentation, and
neither New York Community nor Astoria Financial undertakes any
obligation to update any forward-looking statements contained in the presentation to reflect events or conditions after the date hereof. Our Use of Non-GAAP Financial Measures This presentation may contain certain non-GAAP financial measures which management believes to be useful to investors in understanding the
Company’s performance and financial condition, and in comparing our
performance and financial condition with those of other banks. Such non-GAAP financial measures are not to be considered in isolation or as a substitute for measures calculated in accordance with GAAP. Reconciliations of our GAAP and non-GAAP financial measures are included in the Appendix and may also be found in our earnings releases and under “Strategies
and Results” at ir.myNYCB.com.
|
 New York Community Bancorp, Inc. 4 Note: Except as otherwise indicated, all industry data was provided by SNL Financial as of 11/6/15.
Assets Multi-Family Loans Deposits Deposit Market Share Market Cap $49.0 billion $24.7 billion $28.3 billion # 4 in the NY MSA $8.0 billion With assets of $49.0 billion at
9/30/15, we are
the 22nd largest
U.S. bank holding
company. With a portfolio of $24.7 billion at the
end of September,
we are a leading
producer of multi-
family loans in
New York City. With deposits of $28.3 billion and
269 branches in Metro New York, New Jersey, Ohio, Florida, and Arizona, we currently rank 24th among the nation’s largest depositories. With deposits of $22.3 billion in the NY MSA, we currently rank
4th among regional banks. With a market cap of $8.0
billion at
9/30/15, we rank
20th among the nation’s publicly traded banks and thrifts. NYCB: Where We Are Today |
 New York Community Bancorp, Inc. 5 (a) Pro forma assets, deposits, and multi-family loans are based on our balances and Astoria’s at 9/30/15.
(b) Our pro forma market cap was calculated by multiplying our closing price at 9/30/15 by the sum of our outstanding shares and Astoria’s at
that date. Pro
Forma Assets (a) Pro Forma Multi-Family Loan Portfolio (a) Pro Forma Deposits (a) Pro Forma Deposit Market Share Pro Forma Market Cap (b) $64.1 billion $28.6 billion $37.3 billion #2 in the NY MSA $9.8 billion With pro forma assets of $64.1 billion, we expect
to rank 20th
among U.S. bank
holding companies. With a pro forma portfolio of $28.6 billion,
we expect
to augment our
position as a
leading multi-
family lender in
NYC. With pro forma deposits of $37.3 billion and
over 350
branches in Metro NY, NJ, OH, FL, and AZ, we expect to rank 21st among the nation’s largest depositories. With pro forma deposits of $31.7 billion in the NY MSA, we expect our deposit market share rank among regional banks to rise to #2. With a pro forma market cap of $9.8 billion, we expect
to rank 17th
among the nation’s
publicly traded
banks and thrifts.
NYCB with Astoria Financial: Where We’re Going
|
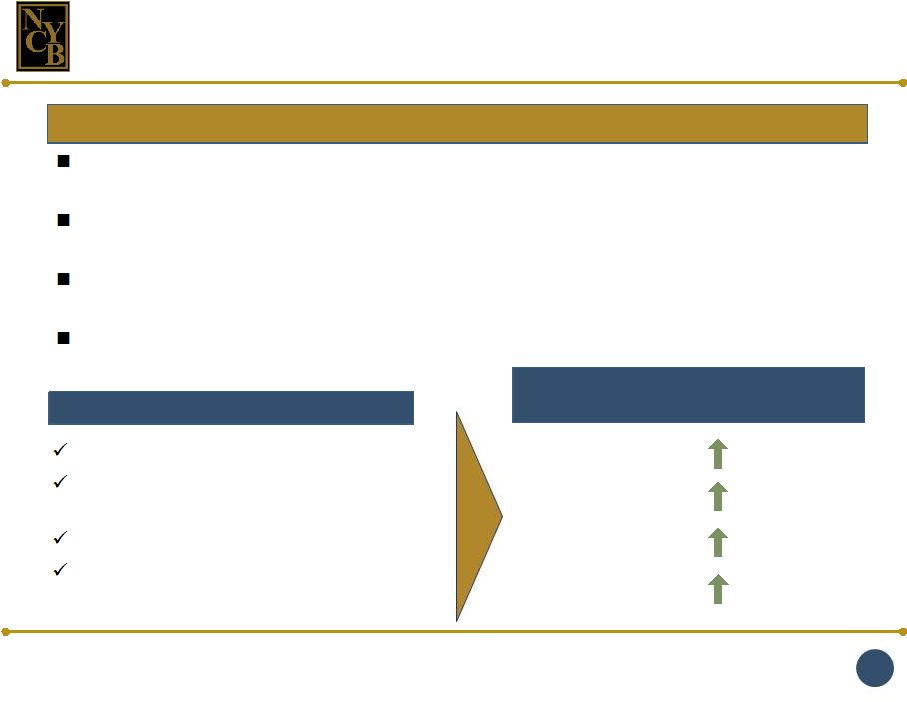
 New York Community Bancorp, Inc. 6 Growth through Acquisitions Multi-Family Lending Strong Credit Standards/ Superior Asset Quality Residential Mortgage Banking Efficient Operation Since our first acquisition in November 2000, our assets have grown from $1.9 billion to $49.0 billion at 9/30/15. The Astoria merger is expected to result in pro forma assets of $64.1 billion. We have originated $63.7 billion of multi-family loans over the course of our public life. The Astoria merger will provide significant liquidity to fund the continued growth of our multi-family loan portfolio. Our net charge-offs have averaged a mere 0.04% since 1993. With the addition of Astoria’s loan portfolio, we expect our long history of superior asset quality to be maintained. Since January 2010, our residential mortgage banking operation has originated $41.9 billion of 1-4 family loans for sale. During that time, Astoria has originated $9.0 billion of 1-4 family loans for portfolio. Our efficiency ratio has consistently ranked in the top 3% of all banks and thrifts. Reflecting anticipated cost savings, our record of efficiency will also be maintained. The Astoria merger is highly consistent with our enduring business model and commitment to building value for investors. |
 New York Community Bancorp, Inc. 7 On October 29, 2015, we announced a highly accretive in- market merger with Astoria Financial Corporation. The Merger Astoria Financial will merge with and into NYCB and Astoria Bank will merge with and into NYCB’s primary bank subsidiary, New York Community Bank. Consideration One-for-one fixed exchange ratio plus $0.50 per share cash payment Cost Savings Approximately 50% of Astoria’s non-interest expense Merger & Integration Costs Approximately $180 million pre-tax Credit Mark Approximately 1% of current portfolio less net charge-offs at close Closing Conditions Contingent on the approval of NYCB’s and Astoria’s regulators and shareholders Other customary closing conditions Expected Closing 4Q 2016, subject to conditions noted above |
 New York Community Bancorp, Inc. 8 The Astoria merger presents substantial upside potential relative to the purchase price. Source: SNL Financial, company disclosure. (a) Time deposits greater than $100k are based on 2Q 2015 regulatory disclosure for Astoria.
(b) Core deposits reflect total deposits less time deposits greater than $100k. (c) Represents average for U.S. bank-to-bank M&A transactions announced since 2013 with deal values between $1 billion - $10 billion. 1.49x 1.80x Price / TBVPS 7.7% 12.9% Core Deposit Premium 20.0% 10.2% EPS Accretion 6.0% TBVPS Accretion / (Dilution) (a) (b) Substantially Higher Financial Returns Attractive Purchase Price Multiples NYCB Bank-to-bank M&A transactions since 2013 (c) (3.8)% |
 Growth Through
Acquisitions |
 New York Community Bancorp, Inc. 10 The Astoria merger represents the re-launch of our growth strategy. Significantly Strengthens our Balance Sheet De-risking strategies greatly enhance our balance sheet profile 6% tangible book value per share (TBVPS) accretion upon closing in 4Q 2016 Boosts deposits by $9 billion and substantially increases our share of deposits in core markets Heightens liquidity while reducing our cost of funds Extends our longstanding record of exceptional asset quality Reduces our interest rate sensitivity Builds capital Significantly Increases our Earnings ~ 20% pro forma earnings accretion ~ 15.5% return on average tangible common equity (ROATCE) Expected cost saves (~ 50% of Astoria’s non- interest expense) maintain our longstanding record of efficiency Expands our margin Increases our revenue stream |
 New York Community Bancorp, Inc. 11 Note: Data from SNL Financial as of 6/30/15. Long Island Brooklyn Queens Westchester % of Astoria branches near an NYCB branch The Astoria merger creates New York’s pre-eminent community bank. NYCB Astoria Financial 52% 85% 92% Within 1 Mile Within 3 Miles Within 5 Miles |
 New York Community Bancorp, Inc. 12 The Astoria merger significantly increases our share of deposits in the NY MSA. Note: Data from SNL Financial as of 6/30/15. (a) Excludes international banks and money centers including: JPMorgan, Bank of New York Mellon, HSBC Holdings, Citigroup, Bank of America, TD, Wells
Fargo, Bank of China, and Banco Santander.
(b) Deposit balances for NYCB based on 6/30/15 regulatory data for New York Community Bank and New York Commercial Bank.
A Stronger Deposit Franchise
Increases our rank among regional banks in the NY MSA from #4 to
#2 Boosts our market share in four attractive Metro NY
markets: Nassau and Suffolk Counties (Long Island), Queens, and Brooklyn Infusion of low-cost core deposits enhances our funding mix Expands our customer base and opportunities to increase non-interest revenues
Potential improvement in deposit pricing power due to increased
scale NYCB Deposits
(b) : $29 billion NYCB Cost of I-B Deposits: 0.62% Pro Forma Deposits (b) : $38 billion Pro Forma Cost of I-B Deposits: 0.57% N-I-B 2% I-B Checking 4% Savg & MM 63% Brokered 10% Retail CDs 19% Jumbo CDs 2% N-I-B 2% I-B Checking 4% Savg & MM 60% Brokered 13% Retail CDs 17% Jumbo CDs 3% 2015 Rank Top Banks in the NY MSA (a) Branches Deposits ($mm) 1 Capital One 302 $55,860 2 NYCB Pro Forma 291 31,703 2 Signature 29 24,444 3 M&T Bank 178 23,149 4 NYCB 204 22,274 5 PNC 237 19,963 6 Valley National 194 12,937 7 Investors 113 11,787 8 Apple Financial 80 10,337 9 Astoria Financial 87 9,429 10 First Republic 9 9,335 12 |
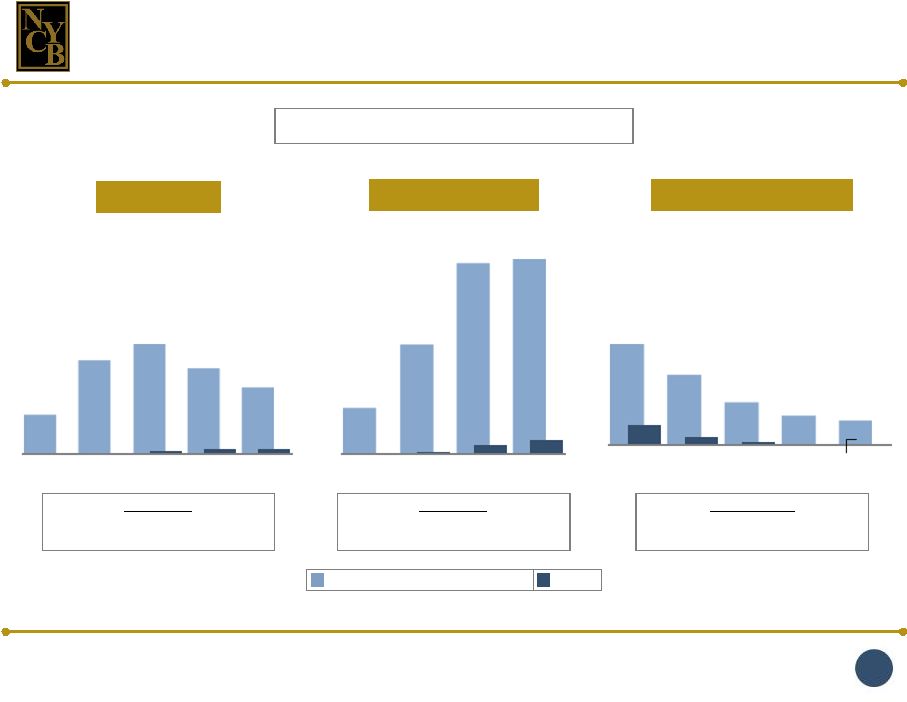
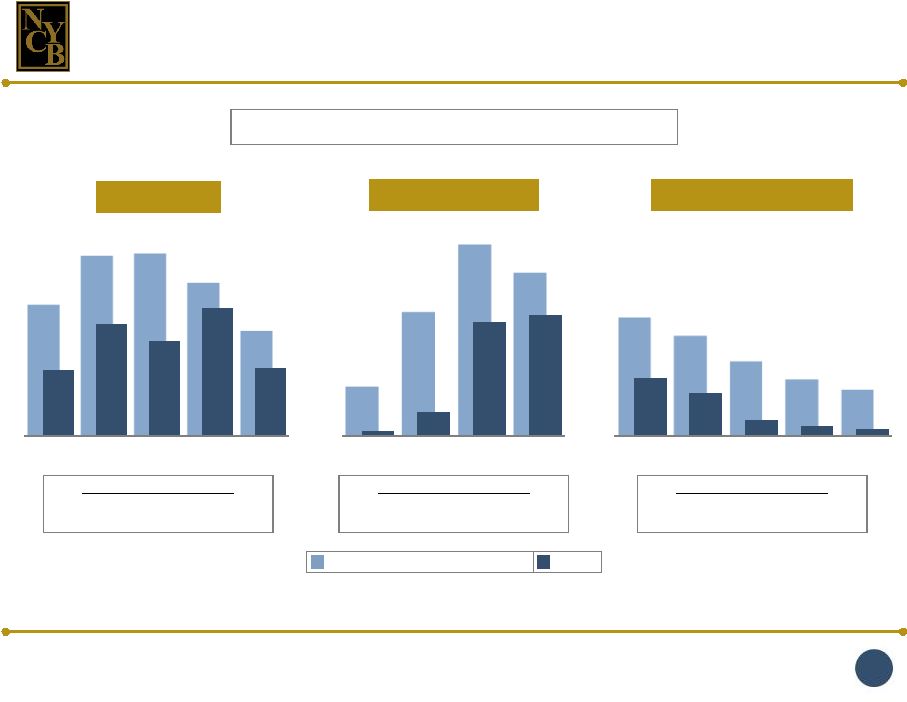
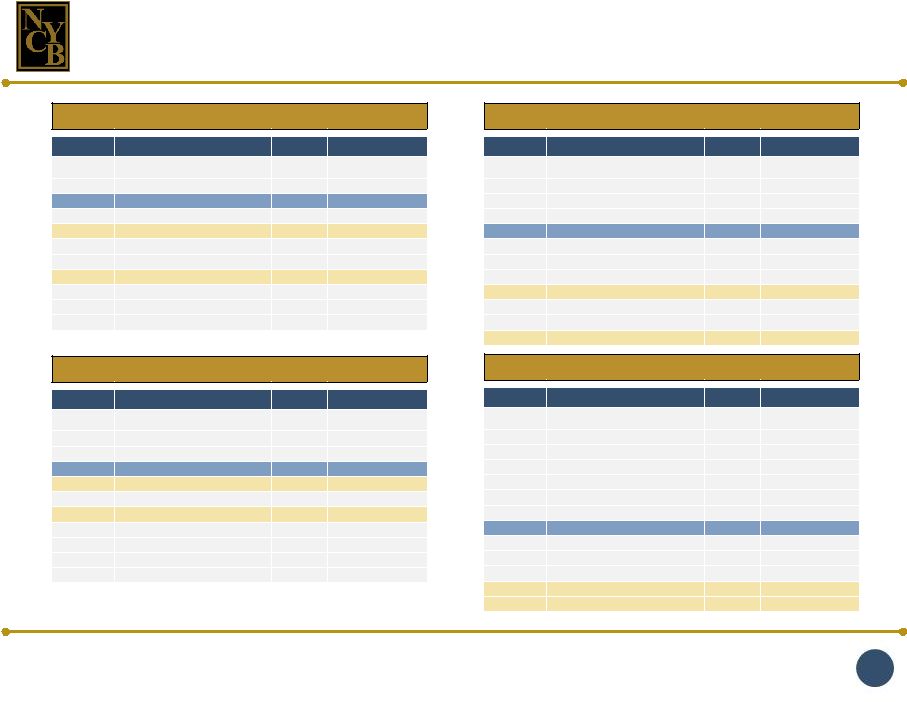 New York Community Bancorp, Inc. 13 The Astoria merger will significantly increase our share of deposits in four highly attractive markets. Nassau 2015 Rank Top Banks Branches Deposits ($000) 1 JPMorgan Chase & Co. 92 $13,964,179 2 Capital One Financial Corp. 49 10,109,533 3 NYCB Pro Forma 65 10,086,758 3 Citigroup Inc. 46 9,455,824 4 NYCB 37 6,534,120 5 Toronto-Dominion Bank 32 4,825,027 6 Bank of America Corp. 41 4,031,542 7 Astoria Financial Corp. 28 3,552,638 8 Signature Bank 5 2,710,436 9 Flushing Financial Corp. 4 2,374,108 10 Apple Financial Holdings 11 1,938,116 Note: Data from SNL Financial as of 6/30/15. Queens 2015 Rank Top Banks Branches Deposits ($000) 1 JPMorgan Chase & Co. 91 $12,396,075 2 Citigroup Inc. 30 7,550,846 3 Capital One Financial Corp. 36 5,773,420 4 NYCB Pro Forma 61 5,641,369 4 NYCB 44 3,406,755 5 Toronto-Dominion Bank 30 3,149,768 6 Astoria Financial Corp. 17 2,234,614 7 HSBC Holdings Plc 17 1,960,130 8 Ridgewood Savings Bank 12 1,866,343 9 Bank of America Corp. 22 1,536,465 10 Maspeth Federal 5 1,080,866 Suffolk 2015 Rank Top Banks Branches Deposits ($000) 1 JPMorgan Chase & Co. 95 $9,911,083 2 Capital One Financial Corp. 52 9,199,284 3 Bank of America Corp. 33 3,796,602 4 Citigroup Inc. 24 3,723,156 5 NYCB Pro Forma 54 3,247,433 5 HSBC Holdings Plc 19 3,113,402 6 Toronto-Dominion Bank 29 2,741,933 7 Bridge Bancorp Inc. 29 2,165,333 8 Astoria Financial Corp. 26 2,062,844 9 Suffolk Bancorp 26 1,699,044 10 People's United 40 1,275,427 12 NYCB 28 1,184,589 Brooklyn 2015 Rank Top Banks Branches Deposits ($000) 1 JPMorgan Chase & Co. 81 $13,084,933 2 Citigroup Inc. 27 5,561,319 3 Banco Santander SA 20 4,674,495 4 Capital One Financial Corp. 31 3,578,731 5 Toronto-Dominion Bank 26 2,906,050 6 HSBC Holdings Plc 20 2,578,225 7 Signature Bank 4 2,209,221 8 NYCB Pro Forma 26 1,974,111 8 Apple Financial Holdings 18 1,792,918 9 Bank of America Corp. 22 1,492,435 10 Dime Community 10 1,263,869 11 Astoria Financial Corp. 12 1,166,054 12 NYCB 14 808,057 |
 New York Community Bancorp, Inc. 14 (a) Represents sum of NYCB and Astoria per 3Q 2015 disclosure. Summary Pro Forma Balance Sheet Increases our share of NYC’s multi-family lending market
Leverages our mortgage banking platform and Astoria’s
residential mortgage lending expertise
Extends our longstanding record of credit quality and capital
strength
(dollars in billions)
3Q 2015 NYCB Pro Forma (a) Change Assets $49.0 $64.1 30.8% Loans, net 36.5 47.6 30.6 Multi-Family Loans 24.7 28.6 15.9 Total Deposits 28.3 37.3 32.0 Wholesale Borrowings 14.4 18.1 26.2 Stockholders’ Equity 5.8 7.5 28.3 Tangible Stockholders’ Equity 3.4 4.8 43.2 Reflecting its in-market nature and our extensive expertise in post-merger
integration and restructuring, the Astoria merger presents maximal
opportunities for revenue enhancement while minimizing risk.
Capitalizes on
Complementary Business Models
Provides immediate scale to absorb compliance-related
costs Expedites our ability to comply with LCR requirements Validates our extensive preparations for D-SIB status Facilitates our Transition to D-SIB Status Provides Ample Opportunities for Continued Earnings and Capital Growth Post-merger sale of $1+ billion of acquired assets to reduce
credit risk, enhance liquidity, and fund investments in
HQLAs Acquired real estate has embedded value
|
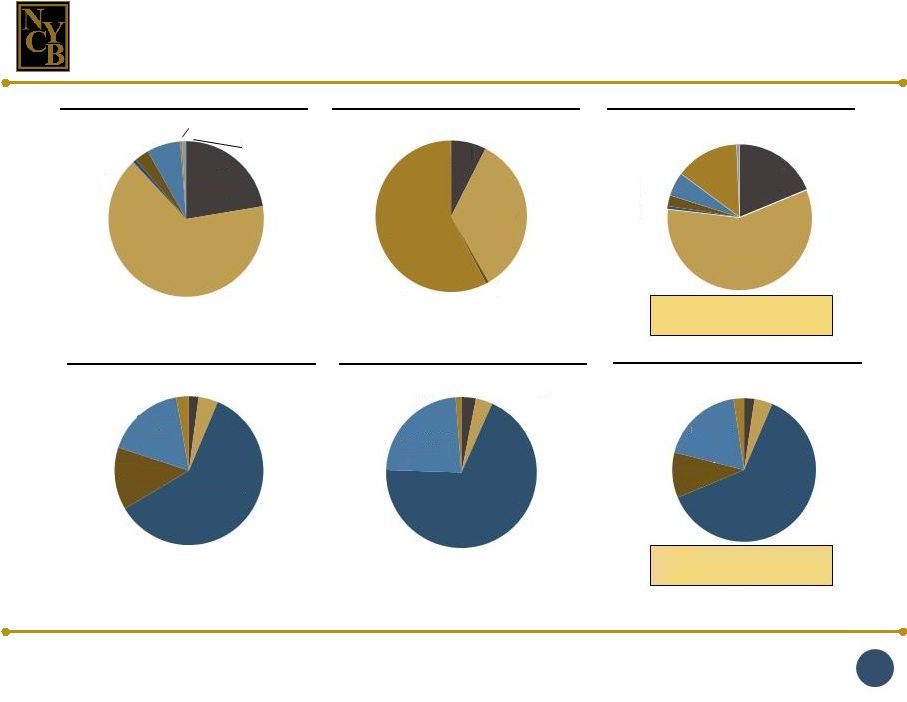 New York Community Bancorp, Inc. 15 Source: Company filings, regulatory data as of 6/30/15. (a) Pro forma based on sum of Astoria and NYCB loans and deposits. The Astoria merger enhances our asset and funding mix. NYCB Astoria Pro Forma (a) Total Loans and Leases: $36.2bn MRQ Yield on Loans: 4.0% Total Loans and Leases: $11.5bn MRQ Yield on Loans: 3.5% Total Loans and Leases: $47.7bn MRQ Yield on Loans: 3.9% Pro Forma (a) NYCB Astoria Total Deposits: $28.6bn MRQ Cost of IB Deposits: 0.62% Total Deposits: $9.4bn MRQ Cost of IB Deposits: 0.43% Total Deposits: $38.0bn MRQ Cost of IB Deposits: 0.57% CRE 22% MF 66% ADC 1% C&I 3% Resi 1-4 7% Resi 1-4 (Non-Covered) 0% Other 1% CRE 7% MF 34% C&I 1% Resi 1-4 (Non- - Covered) 58% CRE 19% MF 58% ADC 1% C&I 2% Resi 1-4 (Covered) 5% Resi 1-4 (Non-Covered) 14% Other 1% NIB 2% IB Checking 4% Savg & MM 60% Brokered 14% Retail CDs 17% Jumbo CDs 3% NIB 3% IB Checking 4% Savg & MM 69% Retail CDs 23% Jumbo CDs 1% NIB 2% IB Checking 4% Savg & MM 62% Brokered 10% Retail CDs 19% Jumbo CDs 2% (Covered) |
 New York Community Bancorp, Inc. The Astoria merger provides multiple opportunities to drive profitable, sustainable, long-term asset growth. More loans to be retained in portfolio once D-SIB threshold is exceeded ($2.3 billion of loans sold from 3Q 2014 through 3Q 2015 to manage our assets under $50 billion) Expected sale of acquired (higher-risk) assets to support loan growth going forward Facilitates the continuation of our growth-through- acquisition strategy Growth Levers Results The Pro Forma Company is Primed for Strong Core Asset Growth Results in greater on-balance sheet capacity to support loan production
Highly liquid residential mortgage loan portfolio provides the
flexibility to manage our asset mix Stronger capital formation and multiple sources of funding and liquidity are available to support growth
Earnings growth
Higher operating leverage
Improved risk profile
Enhanced returns for investors
16 |
 New York Community Bancorp, Inc. 17 De-risking our balance sheet will strengthen our financial performance in 2016. Eliminates puttable uprate risk Improves NPV and NII interest rate sensitivity ratios Reduces exposure to rising interest rates Enhances both liquidity and asset quality Benefits of De-Risking: Financial Benefits Expected in FY 16 from 4Q 15 Repositioning: ~ 10% ~ 35 bps ~ $165 million ~ $100 million Balance Sheet Repositioning Strategies In 4Q 2015, we will replace ~ $10 billion of long-term, higher-cost, puttable
wholesale borrowings with lower-cost wholesale
borrowings featuring more attractive terms. While the
repositioning will result in a one-time after-tax prepayment charge of ~ $614 million in 4Q 2015, it will reduce our annual interest expense by ~
$100 million after-tax beginning in 2016.
Upon completion of the merger, the term on $1.5 billion of
short-term borrowings will be extended, reducing our
interest rate sensitivity. We also expect to sell $1.0
billion of Astoria’s non-performing and higher-risk assets at the close. EPS accretion: Net Interest Margin: Net Interest Income: Net Income: |
 New York Community Bancorp, Inc. 18 Our capital management strategy has been enhanced to strengthen our capital measures and facilitate further growth. Completed on 11/4/15, our common stock offering: — Immediately supported our tangible stockholders’ equity and
Tier 1 common equity; and
— Offset the impact on capital of the one-time after-tax balance
sheet repositioning charge incurred in 4Q 2015.
Adjusting our expected quarterly cash dividend to $0.17 per share
beginning in 1Q 2016 positions us for sustainable
long-term capital growth, while providing investors
with a top-quartile dividend yield of
~4%. —
Builds capital to facilitate execution of our
growth-through- acquisition strategy going
forward —
Capital retention further minimizes dilution from our 4Q 2015
capital raise
— Provides flexibility to maximize value-enhancing capital deployment strategies going forward Enhanced Capital Management Strategy Increased Capital Generation ~ 55 bps ~ 90 bps NYCB Stand-Alone Pro Forma w/ AF 4Q 2016 12-month bps of Capital Generation |
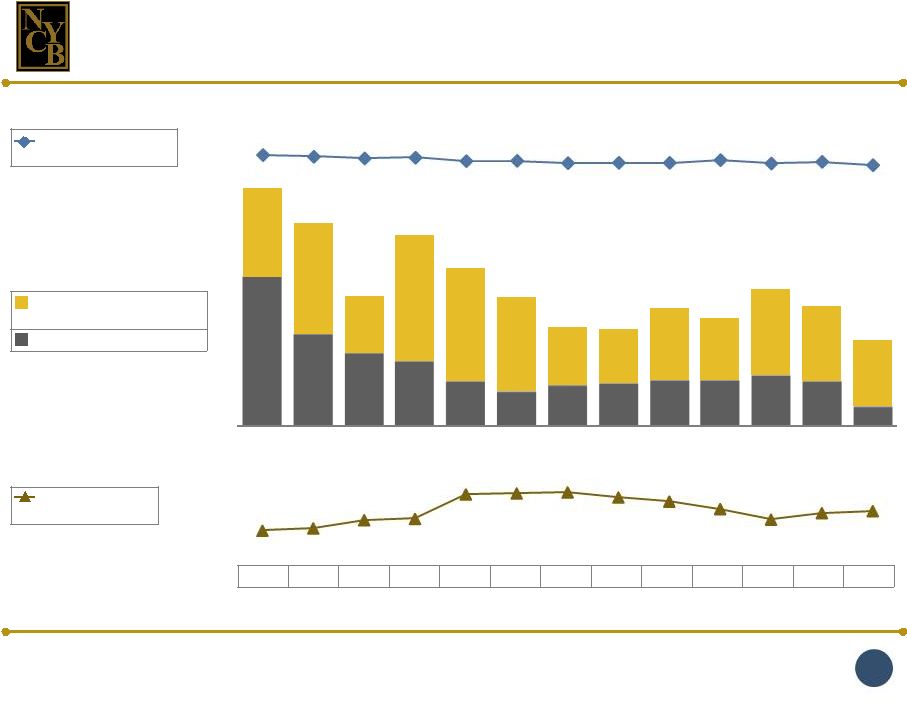
 New York Community Bancorp, Inc. 19 36% 46% 2010 3Q 2015 Following enactment of the Dodd-Frank Act, we began allocating significant resources towards D-SIB
preparedness.
The degree to which we have already absorbed the cost of D-SIB
compliance is reflected in the ~ 1,000- basis point
increase in our efficiency ratio since the enactment of Dodd-Frank. The Astoria merger provides the additional scale to absorb the remaining D-SIB compliance costs.
Key infrastructure investments to date include:
— Enhanced ERM and corporate governance frameworks — Bottom-up capital planning and stress testing capabilities — Substantial expansion of regulatory compliance staff Remaining costs of D-SIB compliance include LCR, CCAR reporting, and Living Will We expect to cross the D-SIB threshold organically in 2Q 2016. Preparing for D-SIB Status NYCB Efficiency Ratio Prior to and Since Dodd-Frank D-SIB Compliance |
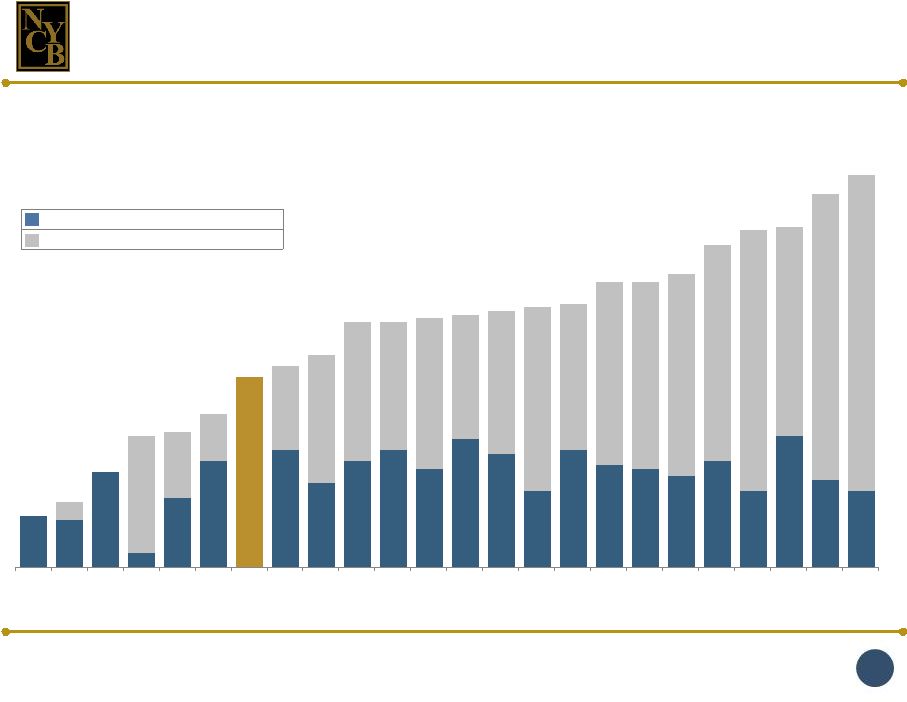 New York Community Bancorp, Inc. 20 14 % 13 % 26 % 4 % 19 % 29 % 52 % 32 % 23 % 29 % 32 % 27 % 35 % 31 % 21 % 32 % 28 % 27 % 25 % 29 % 21 % 36 % 24 % 21 % 5 % 32 % 18 % 13 % 23 % 35 % 38 % 35 % 41 % 34 % 39 % 50 % 40 % 50 % 51 % 55 % 59 % 71 % 57 % 78 % 86 % 14 % 18 % 26 % 36 % 37 % 42 % 55 % 58 % 67 % 67 % 68 % 69 % 70 % 71 % 72 % 78 % 78 % 80 % 88 % 92 % 93 % 102 % 107 % ZION BAC MTB C MS JPM NYCB PF 2017 BBT CFG STI HBAN CMA WFC USB COF FITB PNC KEY STT RF DFS NTRS BK AXP As we continue to grow, we would expect our total payout ratio to be more consistent with the total payout ratio for our D-SIB peers. Dividends Approved in 2015 Share Repurchases Approved in 2015 |
 New York Community Bancorp, Inc. 21 * The Astoria merger was announced in October 2015. All other mergers on this page were completed in the months and years indicated.
The number of branches indicated for our previous transactions is the number of
branches in our current franchise that stemmed from each.
1. Nov. 2000
Haven Bancorp (HAVN) Assets: $2.7 billion Deposits: $2.1 billion Branches: 37
2. July 2001
Richmond County Financial Corp. (RCBK) Assets: $3.7 billion Deposits: $2.5 billion Branches: 24
3. Oct. 2003
Roslyn Bancorp, Inc. (RSLN) Assets: $10.4 billion Deposits: $5.9 billion Branches: 38
4. Dec. 2005
Long Island Financial Corp. (LICB) Assets: $562 million Deposits: $434 million Branches: 9
5. April 2006
Atlantic Bank of New York (ABNY) Assets: $2.8 billion Deposits: $1.8 billion Branches: 14 6. April 2007 PennFed Financial Services, Inc. (PFSB) Assets: $2.3 billion Deposits: $1.6 billion Branches: 22 7. July 2007 NYC branch network of Doral Bank, FSB (Doral- NYC) Assets: $485 million Deposits: $370 million Branches: 11
8. Oct. 2007
Synergy Financial Group, Inc. (SYNF) Assets: $892 million Deposits: $564 million Branches: 16 9. Dec. 2009 AmTrust Bank Assets: $11.0 billion Deposits: $8.2 billion Branches: 64
10. March 2010
Desert Hills Bank Assets: $452 million Deposits: $375 million Branches: 3
11. June 2012
Aurora Bank FSB Assets: None Deposits: $2.2 billion Branches: 0
Payment Received: $24.0 million 12. October 2015* Astoria Financial Corporation (AF) Assets: $15.1 billion Deposits: $9.0 billion Branches:
87 Transaction Type: Savings Bank Commercial Bank Branch FDIC Deposit The Astoria merger leverages our expertise in executing accretive transactions and managing post-merger integrations. |
 New York Community Bancorp, Inc. 22 (in millions) DEPOSITS w/ HAVN w/ RCBK w/ RSLN w/ LICB w/ ABNY w/ PFSB, Doral, & SYNF w/ AmTrust w/ Desert Hills w/ Astoria Total Deposits: $3,268 $5,472 $10,360 $12,168 $12,764 $13,311 $22,418 $21,890 $24,878 $28,329 $28,280 $37,329 Total Branches: 86 120 139 152 166 217 276 276 275 272 269 356 CDs NOW, MMAs, and Savings Demand deposits The Astoria merger, like every other, will enhance our liquidity, reduce our funding costs, and boost our deposit market share. w/ Aurora $1,874 $2,408 $4,362 $5,247 $5,945 $6,913 $9,054 $7,835 $9,121 $6,421 $5,518 $7,618 $1,223 $2,609 $5,278 $6,015 $5,554 $4,975 $11,494 $12,122 $12,998 $19,601 $20,209 $26,590 $171 $455 $720 $906 $1,265 $1,423 $1,870 $1,933 $2,759 $2,307 $2,553 $3,121 12/31/00 12/31/01 12/31/03 12/31/05 12/31/06 12/31/07 12/31/09 12/31/10 12/31/12 12/31/14 9/30/15 9/30/15 Pro Forma |
 New York Community Bancorp, Inc. 23 After HAVN After RCBK After RSLN After LICB After ABNY After PFSB, Doral, & SYNF After AmTrust After Desert Hills HFI Loans Outstanding: $3,636 $5,405 $10,499 $17,029 $19,653 $20,363 $23,377 $23,707 $27,285 $33,025 $34,146 $45,400 HFI Originations: $616 $1,150 $4,330 $6,332 $4,971 $4,853 $4,280 $15,193 $19,894 $14,204 $12,800 $13,304 After Aurora (in millions) The Astoria merger, like every other, will provide funding for the growth of our high-yielding loan portfolio. After Astoria Multi-family CRE All other HFI loans $1,946 $3,255 $7,368 $12,854 $14,529 $14,055 $16,736 $16,802 $18,605 $23,849 $24,653 $28,562 $324 $566 $1,445 $2,888 $3,114 $3,826 $4,987 $5,438 $7,437 $7,637 $7,646 $8,471 $1,366 $1,584 $1,686 $1,287 $2,010 $2,482 $1,654 $1,467 $1,243 $1,539 $1,847 $8,367 12/31/00 12/31/01 12/31/03 12/31/05 12/31/06 12/31/07 12/31/09 12/31/10 12/31/12 12/31/14 9/30/15 9/30/15 Pro Forma HELD-FOR-INVESTMENT LOAN PORTFOLIO |
 Multi-Family
Loan Production |
 New York Community Bancorp, Inc. $17,433 $18,605 $20,714 $23,849 $24,653 $28,562 12/31/11 12/31/12 12/31/13 12/31/14 9/30/15 9/30/15 Pro Forma NYCB PORTFOLIO STATISTICS AT OR FOR THE 9 MOS. ENDED 9/30/15 % of non-covered loans held for investment = 72.2% Average principal balance = $5.1 million Weighted average life = 2.7 years % of our multi-family loans located in Metro New York = 82.2% % of HFI loan originations = 71.9% MULTI-FAMILY LOAN PORTFOLIO (in millions) The Astoria merger will increase our share of NYC’s highly attractive multi-family lending niche. Originations: $5,761 $5,791 $7,417 $7,584 $6,436 $6,940 (b) (a) Includes Astoria’s balance of multi-family loans at 9/30/15. (b) Includes Astoria’s multi-family loan originations in the nine months ended 9/30/15.
(a) 25 |
 Asset Quality |
 New York Community Bancorp, Inc. 27 S & L Crisis NET CHARGE-OFFS / AVERAGE LOANS 5-Year Total NYCB: 17 bp SNL U.S. Bank and Thrift Index: 540 bp 4-Year Total NYCB: 37 bp SNL U.S. Bank and Thrift Index: 803 bp SNL U.S. Bank and Thrift Index NYCB Great Recession Current Credit Cycle 4.75-Year Total NYCB: 50 bp SNL U.S. Bank and Thrift Index: 473 bp We have been distinguished by our low level of net charge- offs in downward credit cycles. * Annualized (0.04)% 0.68% 1.63% 2.83% 2.89% 0.00% 0.03% 0.13% 0.21% 2007 2008 2009 2010 0.54% 1.28% 1.50% 1.17% 0.91% 0.00% 0.00% 0.04% 0.07% 0.06% 1989 1990 1991 1992 1993 1.77% 1.24% 0.76% 0.53% 0.43% 0.35% 0.13% 0.05% 0.01% 2011 2012 2013 2014 9M 2015* |
 New York Community Bancorp, Inc. 28 2.91% 4.00% 4.05% 3.41% 2.35% 1.46% 2.48% 2.10% 2.83% 1.51% 12/31/89 12/31/90 12/31/91 12/31/92 12/31/93 S & L Crisis Great Recession Current Credit Cycle NON-PERFORMING LOANS (a)(b) / TOTAL LOANS (a) (a) Non-performing loans and total loans exclude covered loans and non-covered purchased credit-impaired loans.
(b) Non-performing loans are defined as non-accrual loans and loans 90 days or more past due but still accruing interest.
1.11%
2.71%
4.17%
3.56%
0.11%
0.51%
2.47%
2.63%
12/31/07
12/31/08
12/31/09
12/31/10
2.60%
2.22%
1.66%
1.26%
1.05%
1.28%
0.96%
0.35%
0.23%
0.16%
12/31/11
12/31/12
12/31/13
12/31/14
9/30/15 Average NPLs/Total Loans NYCB: 2.08% SNL U.S. Bank and Thrift Index: 3.34% Average NPLs/Total Loans NYCB: 1.43% SNL U.S. Bank and Thrift Index: 2.89% SNL U.S. Bank and Thrift Index NYCB Average NPLs/Total Loans NYCB: 0.60% SNL U.S. Bank and Thrift Index: 1.76% The quality of our loan portfolio continues to exceed that of our industry. |
 New York Community Bancorp, Inc. 29 Conservative Underwriting Active Board Involvement Multiple Appraisals Risk-Averse Mix of Non-Covered Loans Held for Investment (at 9/30/15) • Conservative loan-to- value ratios • Conservative debt coverage ratios: 120% for multi-family loans, and 130% for CRE loans • Multi-family and CRE loans are based on the lower of economic or market value. • All loans originated for portfolio are reviewed by the Mortgage or Credit Committee (a majority of the Board of Directors). • A member of the Mortgage or Credit Committee participates in inspections on multi- family loans in excess of $7.5 million, and CRE and ADC loans in excess of $4.0 million. • All properties are appraised by independent appraisers. • All independent appraisals are reviewed by in-house appraisal officers. • A second independent appraisal review is performed on loans that are large and complex. • Multi-family: 72.2% • CRE: 22.4 % • One-to-Four Family: 0.3% • ADC: 0.9% • Commercial and Industrial: 4.1% The quality of our assets reflects the nature of our lending niche and our strong underwriting standards. |
 Residential Mortgage Banking |
 New York Community Bancorp, Inc. 31 Features Loans can be originated/purchased in all 50 states and the District of Columbia.
Our 950 approved clients include community banks, credit unions, mortgage
companies, and mortgage brokers.
100% of loans funded are full documentation, prime credit loans.
Credit Quality As of September 30, 2015, 99.8% of all funded loans were current. Limited Repurchase Risk Of the seven loans that were repurchased in the first nine months of 2015, five were
subsequently resolved, and two were placed back into portfolio.
Benefits Since January 2010, our mortgage banking business has originated 1-4 family loans
of $41.9 billion and generated mortgage banking income of $626.3 million.
Our proprietary mortgage banking platform has enabled us to expand our revenues,
market share, and product line.
Over time, mortgage banking income has supported the stability of our return on
average tangible assets, even in times of interest rate
volatility. Our revenue mix has been enhanced since the establishment
of our mortgage banking operation in January 2010.
Loan production is driven by our proprietary real time, web-accessible mortgage
banking technology platform, which securely controls the lending process
while mitigating business and regulatory risks.
|
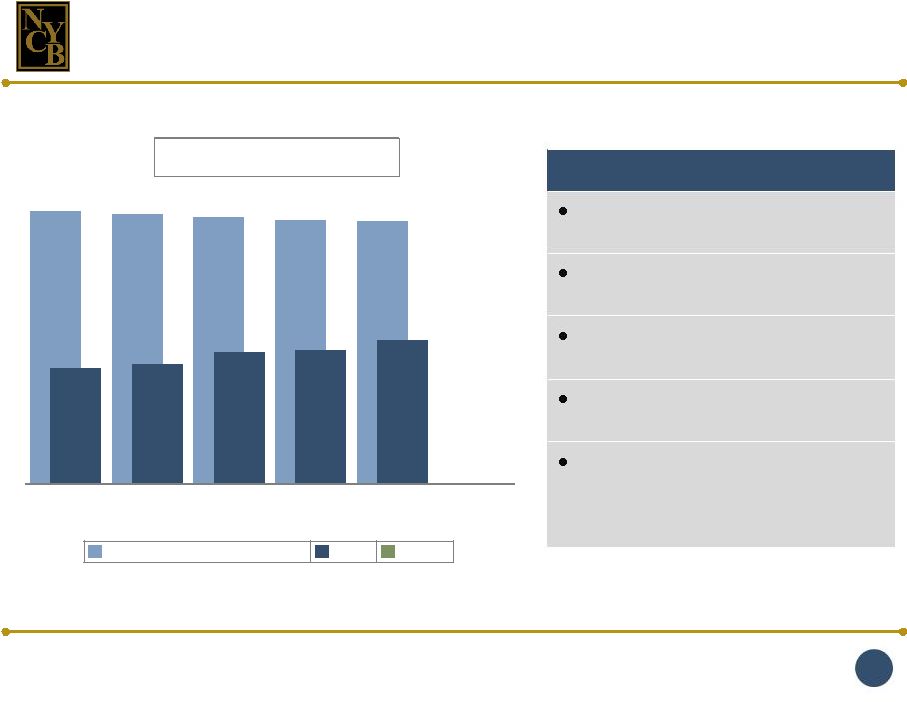
 New York Community Bancorp, Inc. 32 $52.6 $32.6 $26.1 $23.2 $16.2 $12.8 $14.6 $15.3 $16.6 $16.4 $18.4 $16.0 $7.5 $31.5 $39.3 $19.9 $44.4 $39.6 $33.0 $20.4 $19.3 $25.4 $21.8 $30.1 $26.7 $23.1 $84.1 $71.9 $46.0 $67.6 $55.8 $45.8 $35.0 $34.6 $42.0 $38.2 $48.5 $42.7 $30.6 1.64% 1.71% 1.95% 1.99% 2.71% 2.74% 2.77% 2.62% 2.50% 2.28% 1.97% 2.16% 2.22% Average 10-Year Treasury Rate Return on Average Tangible Assets (a) Total: 1.29% 1.24% 1.19% 1.21% 1.11% 1.12% 1.05% 1.06% 1.06% 1.14% 1.04% 1.09% 0.99% Prepayment Penalty Income on Loans Mortgage Banking Income 3Q 2012 4Q 2012 1Q 2013 2Q 2013 3Q 2013 4Q 2013 1Q 2014 2Q 2014 3Q 2014 4Q 2014 1Q 2015 2Q 2015 3Q 2015 (a) ROATA is a non-GAAP financial measure. Please see page 40 for additional information.
(dollars in millions) Prepayment penalty income and mortgage banking income have contributed to the stability of our ROTA. |
 Efficiency |
  New York Community Bancorp, Inc. 34 SNL U.S. Bank and Thrift Index NYCB Astoria The Astoria merger will maintain our record of superior efficiency. 67.12% 66.59% 65.93% 65.41% 65.38% 40.03% 40.75% 42.71% 43.16% 44.78% 2011 2012 2013 2014 9M 2015 9M 2015 EFFICIENCY RATIO Benefits of the Astoria Merger In-market nature of the merger underscores the potential for significant cost savings Estimated cost saves = ~
50% of Astoria’s
non-interest expense
Opportunity to leverage our mortgage platform
and Astoria’s retail origination model Provides immediate scale to absorb higher D- SIB compliance-related costs Expanded customer base represents an opportunity for revenue growth (e.g., through sales of third-party investment products and other financial services) 72.31% |
 Total Return on Investment |
 New York Community Bancorp, Inc. 36 (a) Bloomberg TOTAL RETURN ON INVESTMENT SNL U.S. Bank and Thrift Index NYCB (a) Our commitment to building value for our investors is reflected in our total returns over the course of our public life. 5,111%
244% 213% 209% 245% 168% 260% 393% 450% 428% 717% 2,059% 2,754% 3,843% 2,670% 3,069% 4,265% 4,319% 11/23/93 12/31/99 12/31/08 12/31/09 12/31/10 12/31/11 12/31/12 12/31/13 12/31/14 9/30/15 CAGR since IPO: 27.0% As a result of nine stock splits between 1994 and 2004, our charter shareholders have 2,700
shares of NYCB stock for each 100 shares originally purchased.
|
 Appendix |
 New York Community Bancorp, Inc. 38 NYCB Features Astoria Financial 1859 Established 1888 1993 Year Converted 1993 Westbury, NY Headquarters Lake Success, NY Largest US Thrift Rank by Assets 4th Largest US Thrift NYSE Exchange NYSE 444,319,494 Shares Outstanding at 9/30/15 100,786,186 $8.41 Billion Market Cap at 10/28/15 $1.77 Billion Nassau, Suffolk, Queens, Brooklyn, Manhattan, Westchester, Staten Island, The Bronx Metro NY Markets Nassau, Suffolk, Queens, Brooklyn, Manhattan, Westchester 154 (a) Number of Branches in Metro NY 87 (a) 269 (a)(b) Total Number of Branches 87 (a) 3,468 FTE Number of Employees 1,555 FTE (a) At 9/30/15 (b) Includes 46 branches in NJ, 28 in OH, 27 in FL, and 14 in AZ. NYCB and Astoria Financial at a Glance |
 New York Community Bancorp, Inc. 39 NYCB and Astoria Financial: Earnings Summary For the 3 months ended 9/30/15 For the 9 months ended 9/30/15 (in thousands, except share data) NYCB Astoria Financial NYCB Astoria Financial Net interest income $279,412 $84,734 $857,277 $255,605 (Recovery of) provision for losses on non-covered loans (512) 4,439 (3,254) 7,749 Non-interest income 37,587 12,852 151,722 41,127 Non-interest expense 147,308 72,589 456,074 214,577 Income tax expense 64,031 10,530 203,961 20,260 Net income 114,688 18,906 357,651 69,644 Earnings per share 0.26 0.17 0.80 0.63 Dividend per share 0.25 0.04 0.75 0.12 |
 New York Community Bancorp, Inc. 40 At or for the 3 months ended 9/30/15 At or for the 9 months ended 9/30/15 NYCB Astoria Financial NYCB Astoria Financial ROATE 13.66 % 5.06 % 14.25 % 6.48% ROATA 0.99 0.50 1.04 0.61 Margin 2.56 2.37 2.63 2.35 Efficiency Ratio 46.07 74.38 44.78 72.31 NPAs/Total Assets 0.17 1.00 0.17 1.00 NPLs/Total Loans 0.16 1.17 0.16 1.17 Net (Recoveries) Provisions/ Average Loans (0.01) (0.02)* (0.02) 0.00* Equity/Total Assets 11.88 10.91 11.88 10.91 Tangible Equity/Tangible Assets 7.27 9.80 7.27 9.80 Common Equity Tier 1 Ratio 10.68 19.00 10.68 19.00 Leverage Capital Ratio 7.61 11.00 7.61 11.00 NYCB and Astoria Financial: Profitability, Asset Quality, and Capital Measures * Annualized |
 New York Community Bancorp, Inc. 41 For the Three Months Ended (dollars in thousands) September 30, 2015 June 30, 2015 March 31, 2015 December 31, 2014 September 30, 2014 June 30, 2014 March 31, 2014 December 31, 2013 September 30, 2013 June 30, 2013 March 31, 2013 December 31, 2012 September 30, 2012 Average Assets $48,970,353 $48,329,195 $48,769,552 $48,870,512 $48,484,853 $47,897,289 $46,872,770 $46,107,450 $44,343,284 $43,860,167 $43,243,259 $43,087,846 $43,205,076 Less: Average goodwill and core deposit intangibles (2,440,708) (2,442,007) (2,443,528) (2,445,262) (2,447,277) (2,449,260) (2,451,571) (2,454,191) (2,458,145) (2,462,265) (2,466,622) (2,471,204) (2,476,056) Average tangible assets $46,529,645 $45,887,188 $46,326,024 $46,425,250 $46,037,576 $45,448,029 $44,421,199 $43,653,259 $41,885,139 $41,397,902 $40,776,637 $40,616,642 $40,729,020 Net Income $114,688 $123,704 $119,259 $131,197 $120,258 $118,688 $115,254 $120,155 $114,200 $122,517 $118,675 $122,843 $128,798 Add back: Amortization of core deposit intangibles, net of tax 768 807 950 1,124 1,211 1,249 1,394 1,839 2,470 2,509 2,653 2,826 2,913 Adjusted net income $115,456 $124,511 $120,209 $132,321 $121,469 $119,937 $116,648 $121,994 $116,670 $125,026 $121,328 $125,669 $131,711 Return on average assets 0.94% 1.02% 0.98% 1.07% 0.99% 0.99% 0.98% 1.04% 1.03% 1.12% 1.10% 1.14% 1.19% Return on average tangible assets 0.99 1.09 1.04 1.14 1.06 1.06 1.05 1.12 1.11 1.21 1.19 1.24 1.29 Average tangible assets is a non-GAAP financial measure. The following table presents a reconciliation of this non-GAAP measure with the
related GAAP measure for the three months ended September 30, June 30,
and March 31, 2015; December 31, September 30, June 30, and March 31, 2014;
December 31, September 30, June 30, and March 31, 2013; and December 31, and September
30, 2012. Reconciliations of GAAP and Non-GAAP Financial
Measures |
 New York Community Bancorp, Inc. 42 11/10/15 Visit our website: ir.myNYCB.com E-mail requests to: ir@myNYCB.com Call Investor Relations at: (516) 683-4420 Write to: Investor Relations New York Community Bancorp, Inc. 615 Merrick Avenue Westbury, NY 11590 For More Information |