UNITED STATES
SECURITIES AND EXCHANGE COMMISSION
Washington, D.C. 20549
FORM 8-K
CURRENT REPORT
Pursuant to Section 13 or 15(d) of the
Securities Exchange Act of 1934
Date of Report (Date of earliest event reported): November 10, 2015
MB FINANCIAL, INC. | ||||
(Exact name of registrant as specified in its charter) | ||||
Maryland | 001-36599 | 36-4460265 | ||
(State or other jurisdiction of incorporation) | (Commission File No.) | (IRS Employer Identification No.) | ||
800 West Madison Street, Chicago, Illinois 60607 | ||||
(Address of principal executive offices) (Zip Code) | ||||
Registrant’s telephone number, including area code: (888) 422-6562 | ||||
N/A | ||||
(Former name or former address, if changed since last report) | ||||
Check the appropriate box below if the Form 8-K filing is intended to simultaneously satisfy the filing obligation of the registrant under any of the following provisions:
[ ] Written communications pursuant to Rule 425 under the Securities Act (17 CFR 230.425)
[ ] Soliciting material pursuant to Rule 14a-12 under the Exchange Act (17 CFR 240.14a-12)
[ ] Pre-commencement communications pursuant to Rule 14d-2(b) under the Exchange Act (17 CFR 240.14d-2(b))
[ ] Pre-commencement communications pursuant to Rule 13e-4(c) under the Exchange Act (17CFR 240.13e-4(c))
Item 7.01. Regulation FD Disclosure
Forward-Looking Statements
When used in this Current Report on Form 8-K and in other reports filed with or furnished to the Securities and Exchange Commission (the “SEC”), in press releases or other public stockholder communications, or in oral statements made with the approval of an authorized executive officer, the words or phrases “believe,” “will,” “should,” “will likely result,” “are expected to,” “will continue” “is anticipated,” “estimate,” “project,” “plans,” or similar expressions are intended to identify “forward-looking statements” within the meaning of the Private Securities Litigation Reform Act of 1995. You are cautioned not to place undue reliance on any forward-looking statements, which speak only as of the date made. These statements may relate to our future financial performance, strategic plans or objectives, revenues or earnings projections, or other financial items. By their nature, these statements are subject to numerous uncertainties that could cause actual results to differ materially from those anticipated in the statements.
Important factors that could cause actual results to differ materially from the results anticipated or projected include, but are not limited to, the following: (1) expected revenues, cost savings, synergies and other benefits from the Taylor Capital merger and our other merger and acquisition activities might not be realized within the anticipated time frames or at all; (2) the credit risks of lending activities, including changes in the level and direction of loan delinquencies and write-offs and changes in estimates of the adequacy of the allowance for loan and lease losses, which could necessitate additional provisions for loan losses, resulting both from loans we originate and loans we acquire from other financial institutions; (3) results of examinations by the Office of Comptroller of Currency, the Federal Reserve Board, the Consumer Financial Protection Bureau and other regulatory authorities, including the possibility that any such regulatory authority may, among other things, require us to increase our allowance for loan and lease losses or write-down assets; (4) competitive pressures among depository institutions; (5) interest rate movements and their impact on customer behavior, net interest margin and the value of our mortgage servicing rights; (6) the possibility that our mortgage banking business may increase volatility in our revenues and earnings and the possibility that the profitability of our mortgage banking business could be significantly reduced if we are unable to originate and sell mortgage loans at profitable margins or if changes in interest rates negatively impact the value of our mortgage servicing rights; (7) the impact of repricing and competitors’ pricing initiatives on loan and deposit products; (8) fluctuations in real estate values; (9) the ability to adapt successfully to technological changes to meet customers’ needs and developments in the market-place; (10) the possibility that our security measures might not be sufficient to mitigate the risk of a cyber attack or cyber theft, and that our security measures might not protect us from systems failures or interruptions; (11) our ability to realize the residual values of our direct finance, leveraged, and operating leases; (12) our ability to access cost-effective funding; (13) changes in financial markets; (14) changes in economic conditions in general and in the Chicago metropolitan area in particular; (15) the costs, effects and outcomes of litigation; (16) new legislation or regulatory changes, including but not limited to the Dodd-Frank Wall Street Reform and Consumer Protection Act of 2010 (the “Dodd-Frank Act”) and regulations adopted thereunder, changes in capital requirements pursuant to the Dodd-Frank Act, other governmental initiatives affecting the financial services industry and changes in federal and/or state tax laws or interpretations thereof by taxing authorities; (17) changes in accounting principles, policies or guidelines; (18) our future acquisitions of other depository institutions or lines of business; and (19) future goodwill impairment due to changes in our business, changes in market conditions, or other factors.
MB Financial does not undertake any obligation to update any forward-looking statement to reflect circumstances or events that occur after the date on which the forward-looking statement is made.
Set forth below are investor presentation materials.

November 2015 NASDAQ: MBFI Investor Presentation
Forward-Looking Statements 1 When used in this presentation and in reports filed with or furnished to the Securities and Exchange Commission, in press releases or other public stockholder communications, or in oral statements made with the approval of an authorized executive officer, the words or phrases “believe,” “will,” “should,” “will likely result,” “are expected to,” “will continue” “is anticipated,” “estimate,” “project,” “plans,” or similar expressions are intended to identify “forward-looking statements” within the meaning of the Private Securities Litigation Reform Act of 1995. You are cautioned not to place undue reliance on any forward-looking statements, which speak only as of the date made. These statements may relate to our future financial performance, strategic plans or objectives, revenues or earnings projections, or other financial items. By their nature, these statements are subject to numerous uncertainties that could cause actual results to differ materially from those anticipated in the statements. Important factors that could cause actual results to differ materially from the results anticipated or projected include, but are not limited to, the following: (1) expected revenues, cost savings, synergies and other benefits from the Taylor Capital merger and our other merger and acquisition activities might not be realized within the anticipated time frames or at all; (2) the credit risks of lending activities, including changes in the level and direction of loan delinquencies and write-offs and changes in estimates of the adequacy of the allowance for loan and lease losses, which could necessitate additional provisions for loan losses, resulting both from loans we originate and loans we acquire from other financial institutions; (3) results of examinations by the Office of Comptroller of Currency, the Federal Reserve Board, the Consumer Financial Protection Bureau and other regulatory authorities, including the possibility that any such regulatory authority may, among other things, require us to increase our allowance for loan and lease losses or write-down assets; (4) competitive pressures among depository institutions; (5) interest rate movements and their impact on customer behavior, net interest margin and the value of our mortgage servicing rights; (6) the possibility that our mortgage banking business may increase volatility in our revenues and earnings and the possibility that the profitability of our mortgage banking business could be significantly reduced if we are unable to originate and sell mortgage loans at profitable margins or if changes in interest rates negatively impact the value of our mortgage servicing rights; (7) the impact of repricing and competitors’ pricing initiatives on loan and deposit products; (8) fluctuations in real estate values; (9) the ability to adapt successfully to technological changes to meet customers’ needs and developments in the market-place; (10) the possibility that our security measures might not be sufficient to mitigate the risk of a cyber attack or cyber theft, and that our security measures might not protect us from systems failures or interruptions; (11) our ability to realize the residual values of our direct finance, leveraged, and operating leases; (12) our ability to access cost-effective funding; (13) changes in financial markets; (14) changes in economic conditions in general and in the Chicago metropolitan area in particular; (15) the costs, effects and outcomes of litigation; (16) new legislation or regulatory changes, including but not limited to the Dodd-Frank Wall Street Reform and Consumer Protection Act of 2010 (the “Dodd-Frank Act”) and regulations adopted thereunder, changes in capital requirements pursuant to the Dodd-Frank Act, other governmental initiatives affecting the financial services industry and changes in federal and/or state tax laws or interpretations thereof by taxing authorities; (17) changes in accounting principles, policies or guidelines; (18) our future acquisitions of other depository institutions or lines of business; and (19) future goodwill impairment due to changes in our business, changes in market conditions, or other factors. We do not undertake any obligation to update any forward-looking statement to reflect circumstances or events that occur after the date on which the forward-looking statement is made.
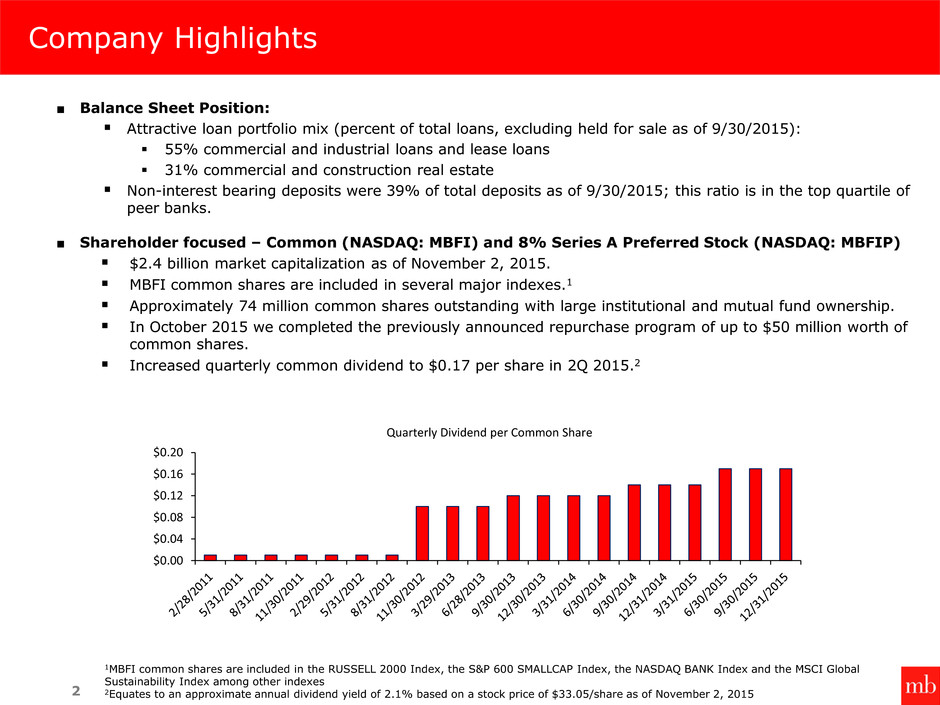
■ Balance Sheet Position: Attractive loan portfolio mix (percent of total loans, excluding held for sale as of 9/30/2015): 55% commercial and industrial loans and lease loans 31% commercial and construction real estate Non-interest bearing deposits were 39% of total deposits as of 9/30/2015; this ratio is in the top quartile of peer banks. ■ Shareholder focused – Common (NASDAQ: MBFI) and 8% Series A Preferred Stock (NASDAQ: MBFIP) $2.4 billion market capitalization as of November 2, 2015. MBFI common shares are included in several major indexes.1 Approximately 74 million common shares outstanding with large institutional and mutual fund ownership. In October 2015 we completed the previously announced repurchase program of up to $50 million worth of common shares. Increased quarterly common dividend to $0.17 per share in 2Q 2015.2 Company Highlights 2 1MBFI common shares are included in the RUSSELL 2000 Index, the S&P 600 SMALLCAP Index, the NASDAQ BANK Index and the MSCI Global Sustainability Index among other indexes 2Equates to an approximate annual dividend yield of 2.1% based on a stock price of $33.05/share as of November 2, 2015 $0.00 $0.04 $0.08 $0.12 $0.16 $0.20 Quarterly Dividend per Common Share
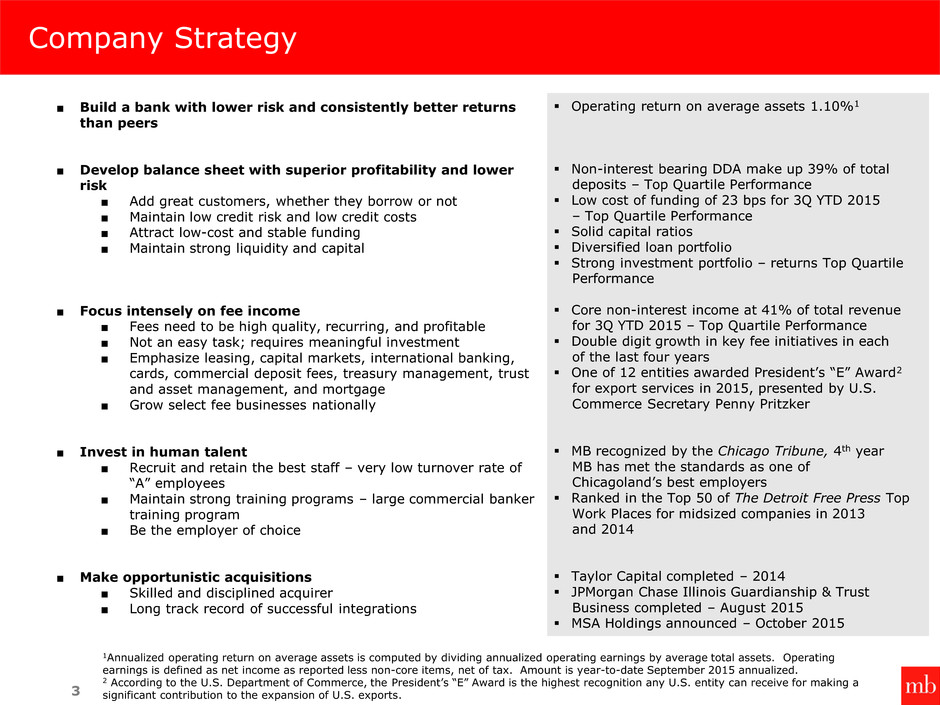
Company Strategy ■ Build a bank with lower risk and consistently better returns than peers ■ Develop balance sheet with superior profitability and lower risk ■ Add great customers, whether they borrow or not ■ Maintain low credit risk and low credit costs ■ Attract low-cost and stable funding ■ Maintain strong liquidity and capital ■ Focus intensely on fee income ■ Fees need to be high quality, recurring, and profitable ■ Not an easy task; requires meaningful investment ■ Emphasize leasing, capital markets, international banking, cards, commercial deposit fees, treasury management, trust and asset management, and mortgage ■ Grow select fee businesses nationally ■ Invest in human talent ■ Recruit and retain the best staff – very low turnover rate of “A” employees ■ Maintain strong training programs – large commercial banker training program ■ Be the employer of choice ■ Make opportunistic acquisitions ■ Skilled and disciplined acquirer ■ Long track record of successful integrations 3 Operating return on average assets 1.10%1 Non-interest bearing DDA make up 39% of total deposits – Top Quartile Performance Low cost of funding of 23 bps for 3Q YTD 2015 – Top Quartile Performance Solid capital ratios Diversified loan portfolio Strong investment portfolio – returns Top Quartile Performance Core non-interest income at 41% of total revenue for 3Q YTD 2015 – Top Quartile Performance Double digit growth in key fee initiatives in each of the last four years One of 12 entities awarded President’s “E” Award2 for export services in 2015, presented by U.S. Commerce Secretary Penny Pritzker MB recognized by the Chicago Tribune, 4th year MB has met the standards as one of Chicagoland’s best employers Ranked in the Top 50 of The Detroit Free Press Top Work Places for midsized companies in 2013 and 2014 Taylor Capital completed – 2014 JPMorgan Chase Illinois Guardianship & Trust Business completed – August 2015 MSA Holdings announced – October 2015 1Annualized operating return on average assets is computed by dividing annualized operating earnings by average total assets. Operating earnings is defined as net income as reported less non-core items, net of tax. Amount is year-to-date September 2015 annualized. 2 According to the U.S. Department of Commerce, the President’s “E” Award is the highest recognition any U.S. entity can receive for making a significant contribution to the expansion of U.S. exports.
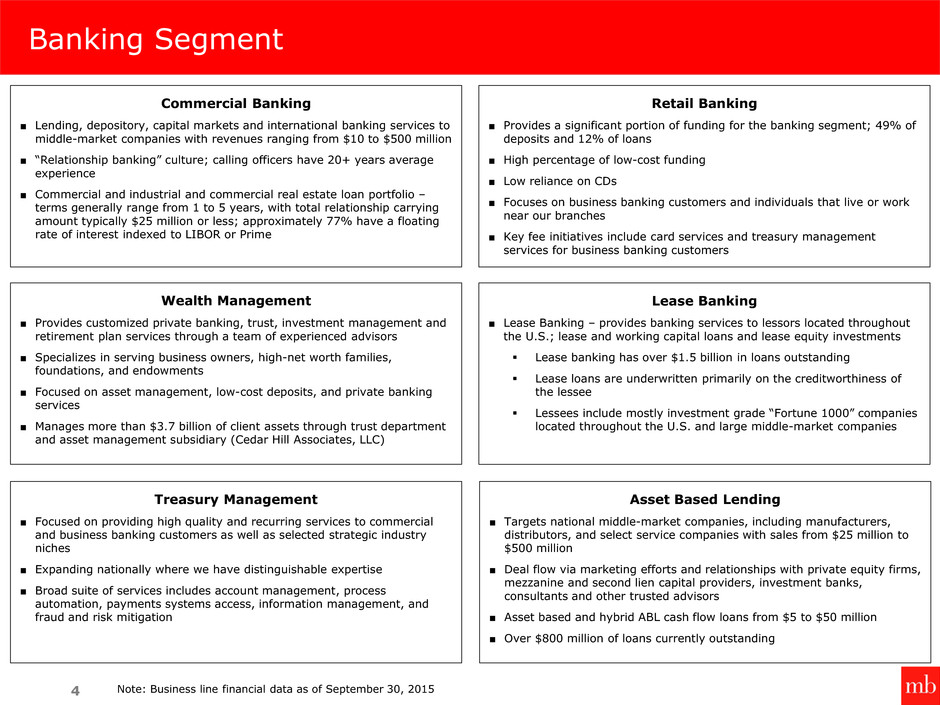
Banking Segment 4 Retail Banking ■ Provides a significant portion of funding for the banking segment; 49% of deposits and 12% of loans ■ High percentage of low-cost funding ■ Low reliance on CDs ■ Focuses on business banking customers and individuals that live or work near our branches ■ Key fee initiatives include card services and treasury management services for business banking customers Wealth Management ■ Provides customized private banking, trust, investment management and retirement plan services through a team of experienced advisors ■ Specializes in serving business owners, high-net worth families, foundations, and endowments ■ Focused on asset management, low-cost deposits, and private banking services ■ Manages more than $3.7 billion of client assets through trust department and asset management subsidiary (Cedar Hill Associates, LLC) Commercial Banking ■ Lending, depository, capital markets and international banking services to middle-market companies with revenues ranging from $10 to $500 million ■ “Relationship banking” culture; calling officers have 20+ years average experience ■ Commercial and industrial and commercial real estate loan portfolio – terms generally range from 1 to 5 years, with total relationship carrying amount typically $25 million or less; approximately 77% have a floating rate of interest indexed to LIBOR or Prime Note: Business line financial data as of September 30, 2015 Lease Banking ■ Lease Banking – provides banking services to lessors located throughout the U.S.; lease and working capital loans and lease equity investments Lease banking has over $1.5 billion in loans outstanding Lease loans are underwritten primarily on the creditworthiness of the lessee Lessees include mostly investment grade “Fortune 1000” companies located throughout the U.S. and large middle-market companies Asset Based Lending ■ Targets national middle-market companies, including manufacturers, distributors, and select service companies with sales from $25 million to $500 million ■ Deal flow via marketing efforts and relationships with private equity firms, mezzanine and second lien capital providers, investment banks, consultants and other trusted advisors ■ Asset based and hybrid ABL cash flow loans from $5 to $50 million ■ Over $800 million of loans currently outstanding Treasury Management ■ Focused on providing high quality and recurring services to commercial and business banking customers as well as selected strategic industry niches ■ Expanding nationally where we have distinguishable expertise ■ Broad suite of services includes account management, process automation, payments systems access, information management, and fraud and risk mitigation
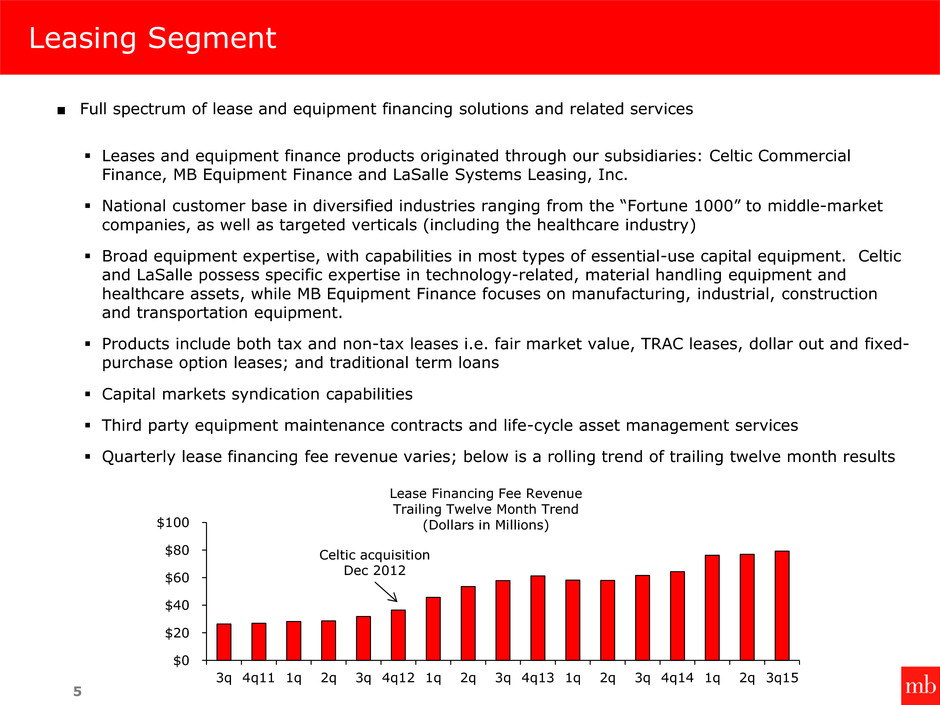
Leasing Segment ■ Full spectrum of lease and equipment financing solutions and related services Leases and equipment finance products originated through our subsidiaries: Celtic Commercial Finance, MB Equipment Finance and LaSalle Systems Leasing, Inc. National customer base in diversified industries ranging from the “Fortune 1000” to middle-market companies, as well as targeted verticals (including the healthcare industry) Broad equipment expertise, with capabilities in most types of essential-use capital equipment. Celtic and LaSalle possess specific expertise in technology-related, material handling equipment and healthcare assets, while MB Equipment Finance focuses on manufacturing, industrial, construction and transportation equipment. Products include both tax and non-tax leases i.e. fair market value, TRAC leases, dollar out and fixed- purchase option leases; and traditional term loans Capital markets syndication capabilities Third party equipment maintenance contracts and life-cycle asset management services Quarterly lease financing fee revenue varies; below is a rolling trend of trailing twelve month results 5 $0 $20 $40 $60 $80 $100 3q 4q11 1q 2q 3q 4q12 1q 2q 3q 4q13 1q 2q 3q 4q14 1q 2q 3q15 Lease Financing Fee Revenue Trailing Twelve Month Trend (Dollars in Millions) Celtic acquisition Dec 2012

Mortgage Segment ■ An integrated and nimble mortgage platform ■ Multiple mortgage origination channels across a national sales footprint Operates in 44 states and DC, with 39 retail branches located in 16 states as of 9/30/2015 Origination mix 66% purchase, 34% refinance for 3Q 2015 Channel mix 82% third party, 18% retail for 3Q 2015 ■ In-house servicing platform ■ Attractive and diversified originating and servicing revenue streams Currently originating over $500 million per month Mortgage Servicing Rights asset = $148.1 million as of 9/30/2015 Servicing portfolio of $15.6 billion of home loans (notional) as of 9/30/2015. Ratio of MSR asset/notional value = 0.95% ■ Strong credit quality since inception ■ Ranked in the Top 50 of The Detroit Free Press Top Work Places for midsized companies in 2013 and 2014 6
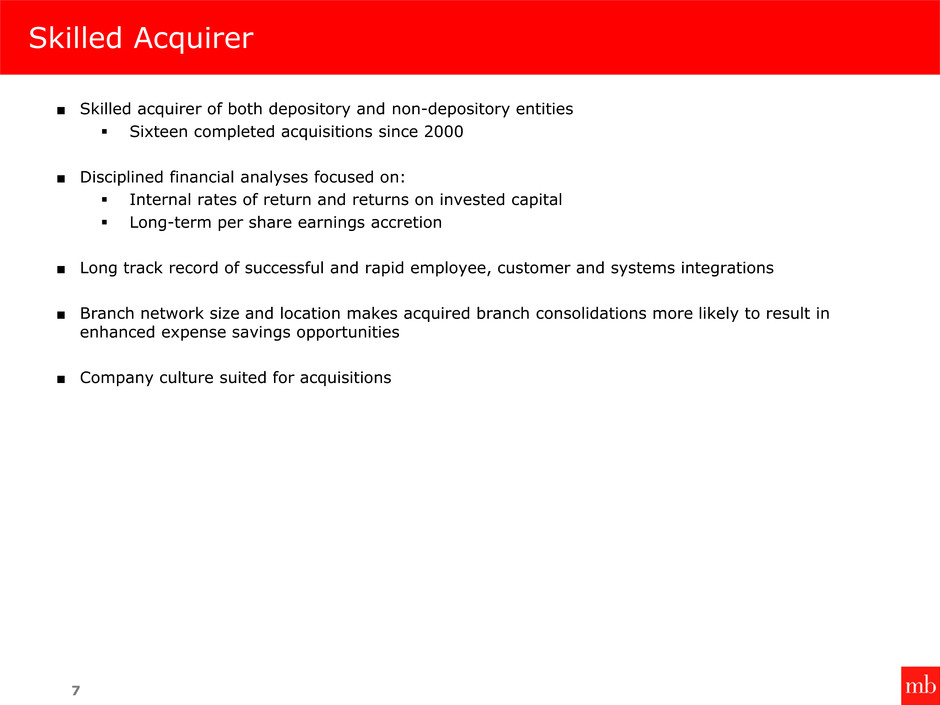
7 Skilled Acquirer ■ Skilled acquirer of both depository and non-depository entities Sixteen completed acquisitions since 2000 ■ Disciplined financial analyses focused on: Internal rates of return and returns on invested capital Long-term per share earnings accretion ■ Long track record of successful and rapid employee, customer and systems integrations ■ Branch network size and location makes acquired branch consolidations more likely to result in enhanced expense savings opportunities ■ Company culture suited for acquisitions
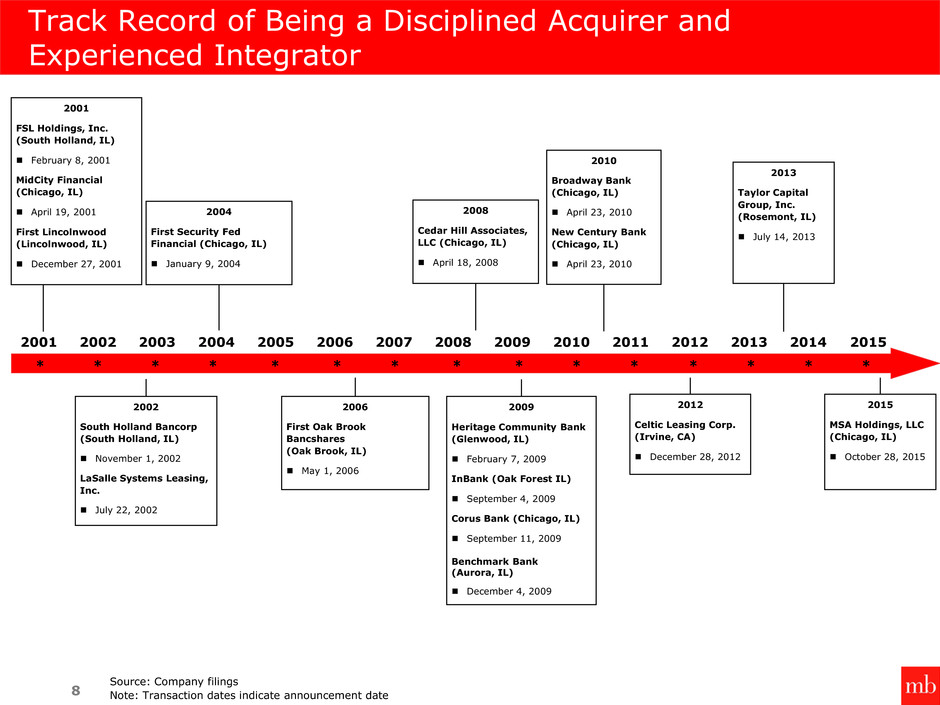
8 2004 First Security Fed Financial (Chicago, IL) January 9, 2004 2002 South Holland Bancorp (South Holland, IL) November 1, 2002 LaSalle Systems Leasing, Inc. July 22, 2002 2006 First Oak Brook Bancshares (Oak Brook, IL) May 1, 2006 2009 Heritage Community Bank (Glenwood, IL) February 7, 2009 InBank (Oak Forest IL) September 4, 2009 Corus Bank (Chicago, IL) September 11, 2009 Benchmark Bank (Aurora, IL) December 4, 2009 Source: Company filings Note: Transaction dates indicate announcement date 2008 Cedar Hill Associates, LLC (Chicago, IL) April 18, 2008 Track Record of Being a Disciplined Acquirer and Experienced Integrator 2010 Broadway Bank (Chicago, IL) April 23, 2010 New Century Bank (Chicago, IL) April 23, 2010 2001 FSL Holdings, Inc. (South Holland, IL) February 8, 2001 MidCity Financial (Chicago, IL) April 19, 2001 First Lincolnwood (Lincolnwood, IL) December 27, 2001 2012 Celtic Leasing Corp. (Irvine, CA) December 28, 2012 2013 Taylor Capital Group, Inc. (Rosemont, IL) July 14, 2013 2001 2002 2003 2004 2005 2006 2007 2008 2009 2010 2011 2012 2013 2014 2015 * * * * * * * * * * * * * * * 2015 MSA Holdings, LLC (Chicago, IL) October 28, 2015
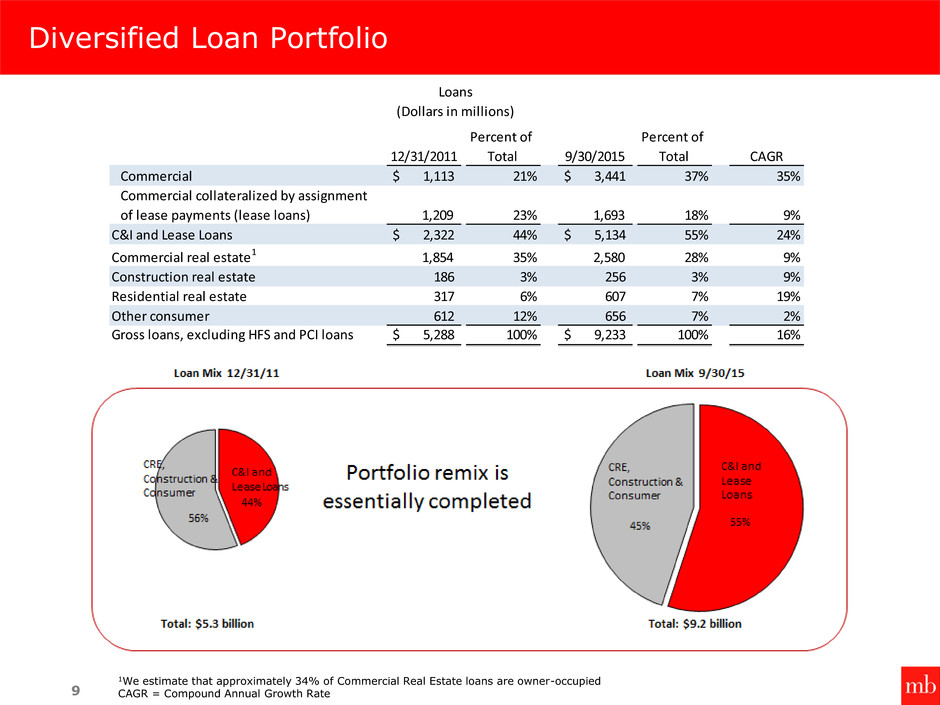
Diversified Loan Portfolio 9 1We estimate that approximately 34% of Commercial Real Estate loans are owner-occupied CAGR = Compound Annual Growth Rate 12/31/2011 Percent of Total 9/30/2015 Percent of Total CAGR Commercial $ 1,113 21% $ 3,441 37% 35% Commercial collateralized by assignment of lease payments (lease loans) 1,209 23% 1,693 18% 9% C&I and Lease Loans $ 2,322 44% $ 5,134 55% 24% Commercial real estate1 1,854 35% 2,580 28% 9% Construction real estate 186 3% 256 3% 9% Residential real estate 317 6% 607 7% 19% Other consumer 612 12% 656 7% 2% Gross loans, excluding HFS and PCI loans $ 5,288 100% $ 9,233 100% 16% Loans (Dollars in millions)

$34.5 $62.1 NPL Composition as of September 30, 2015 (Dollars in millions) Asset Quality Statistics 10 $0 $20 $40 $60 $80 $100 $120 $140 2011 2012 2013 2014 9/30/2015 NPLs less than 30 days past due NPLs more than 30 days past due Payment Status of NPLs (Dollars in millions) C&I and Lease Loans CRE, Construction and Consumer 2011 2012 2013 2014 9/30/2015 ALLL to total loans 2.13% 2.15% 1.96% 1.21% 1.33% NPLs to total loans 2.17% 2.03% 1.87% 0.96% 1.03% ALLL to NPLs 98.00% 106.17% 104.87% 126.34% 129.04% YTD Net charge-offs (recoveries) to average loans (annualized) 2.90% (0.02%) 0.16% 0.18% 0.01% As of 12/31 Asset Quality
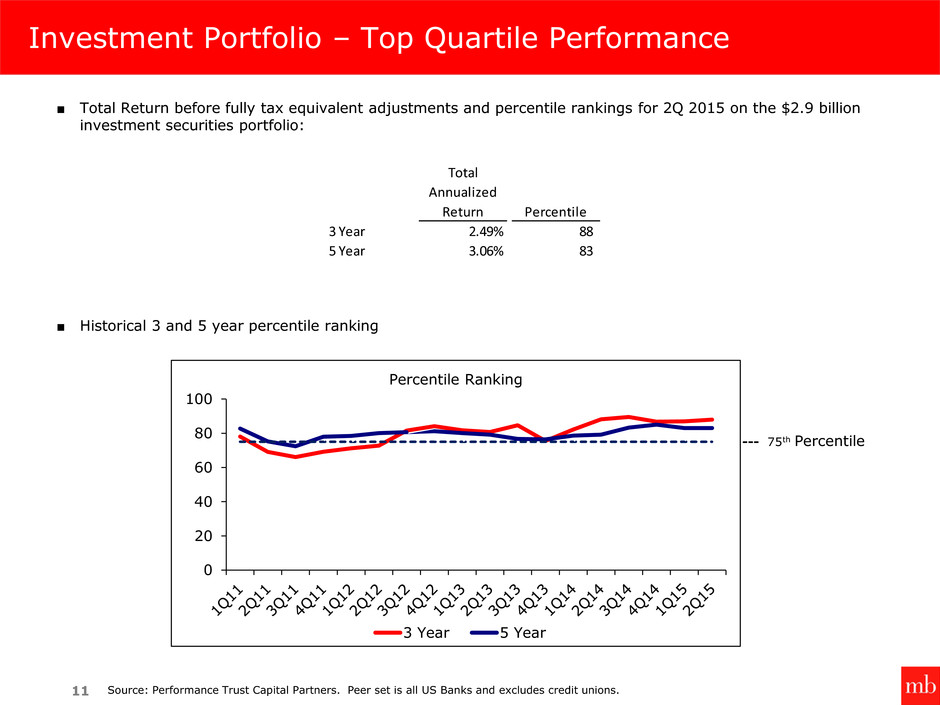
11 ■ Total Return before fully tax equivalent adjustments and percentile rankings for 2Q 2015 on the $2.9 billion investment securities portfolio: ■ Historical 3 and 5 year percentile ranking Source: Performance Trust Capital Partners. Peer set is all US Banks and excludes credit unions. Investment Portfolio – Top Quartile Performance 0 20 40 60 80 100 Percentile Ranking 3 Year 5 Year --- 75th Percentile Total Annualized Return Percentile 3 Year 2.49% 88 5 Year 3.06% 83
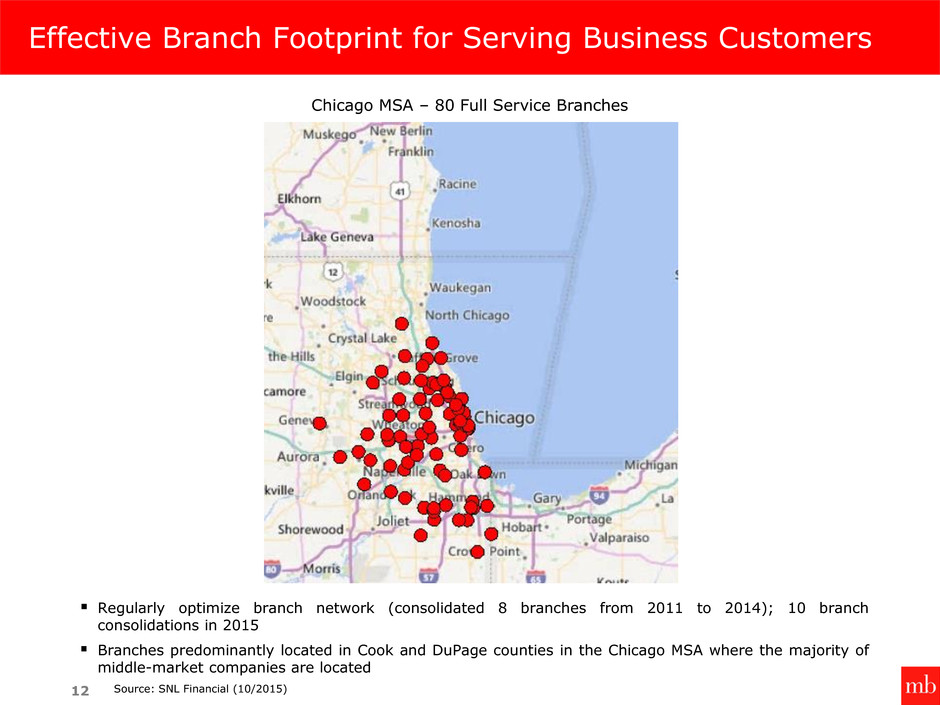
Effective Branch Footprint for Serving Business Customers 12 Chicago MSA – 80 Full Service Branches Regularly optimize branch network (consolidated 8 branches from 2011 to 2014); 10 branch consolidations in 2015 Branches predominantly located in Cook and DuPage counties in the Chicago MSA where the majority of middle-market companies are located Source: SNL Financial (10/2015)

Valuable Position in the Chicago MSA Source: FDIC as of June 30, 2015 13 Rank Parent Company Name Total Active Branches Total Deposits Total Deposit Market Share (%) 1 JPMorgan Chase & Co. 392 $ 87,504 22.8% 2 Bank Of Montreal 219 47,820 12.4% 3 Bank Of America Corporation 165 41,566 10.8% 4 Northern Trust Corporation 11 31,891 8.3% 5 Wintrust Financial Corporation 125 16,175 4.2% 6 Fifth Third Bancorp 172 14,853 3.9% 7 PNC Financial Services Group, Inc., The 153 12,023 3.1% 8 PrivateBancorp, Inc. 20 11,853 3.1% 9 Citigroup Inc. 65 11,740 3.1% 10 U.S. Bancorp 176 11,034 2.9% 11 MB Financial, Inc. 80 10,870 2.8% 12 First Midwest Bancorp, Inc. 92 7,603 2.0% 13 Wells Fargo & Company 11 5,990 1.6% 14 TCF Financial Corporation 160 5,760 1.5% 15 Associated Banc-Corp 26 3,538 0.9% 16 FirstMerit Corporation 39 2,554 0.7% Other Market Participants 1,059 61,846 16.1% Market Total 2,972 $ 384,621 100.0% Current Chicago MSA Rankings (Dollars in millions)

Major MSA Deposit Market Share Concentration Source: FDIC as of June 30, 2015, at the Bank Holding Co and Institution level 14 The table below shows the combined market share for the leading financial institutions within the MSA. Chicago’s leading financial institutions have the lowest market share concentration of these major MSAs, indicating a relatively fragmented market. Rank MSA Total In-Market Deposits Top 3 Market Share (%) Top 3 Rank Top 10 Market Share (%) Top 10 Rank 1 New York $ 1,506 50% 8 77.0% 9 2 Salt Lake City 489 51% 7 82.0% 5 3 Los Angeles 439 47% 9 77.0% 8 4 Philadelphia 437 58% 6 86.0% 3 5 Sioux Falls, SD 434 99% 1 99.0% 1 6 Chicago 385 46% 10 74.0% 10 7 Boston 329 63% 4 82.0% 6 8 San Francisco 311 68% 3 85.0% 4 9 Dallas-Fort Worth 230 60% 5 79.0% 7 10 Charlotte 216 94% 2 97.0% 2 Median $ 409 59% 82.0% Major MSA Deposit Market Share Concentration (Dollars in billions)
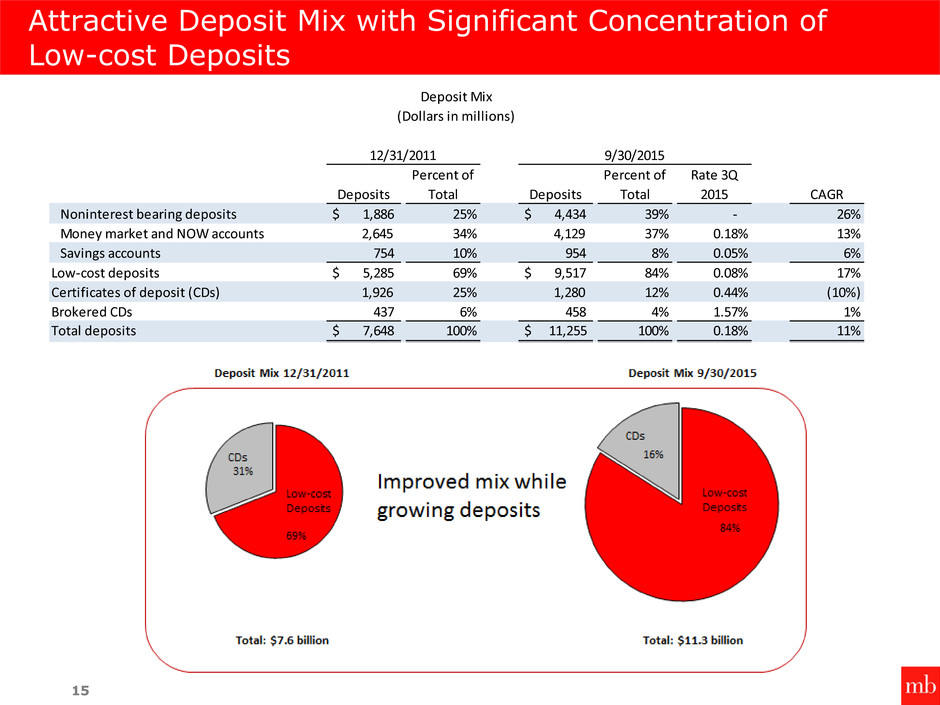
Attractive Deposit Mix with Significant Concentration of Low-cost Deposits 15 Deposits Percent of Total Deposits Percent of Total Rate 3Q 2015 CAGR Noninterest bearing deposits $ 1,886 25% $ 4,434 39% - 26% Money market and NOW accounts 2,645 34% 4,129 37% 0.18% 13% Savings accounts 754 10% 954 8% 0.05% 6% Low-cost deposits $ 5,285 69% $ 9,517 84% 0.08% 17% Certificates of deposit (CDs) 1,926 25% 1,280 12% 0.44% (10%) Brokered CDs 437 6% 458 4% 1.57% 1% Total deposits $ 7,648 100% $ 11,255 100% 0.18% 11% Deposit Mix (Dollars in millions) 12/31/2011 9/30/2015
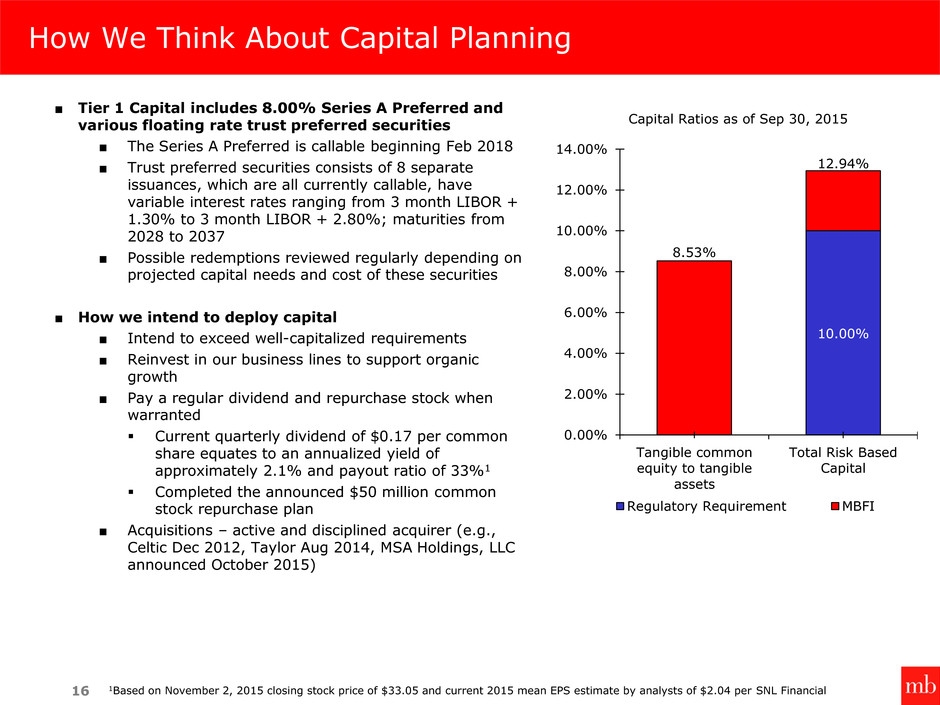
How We Think About Capital Planning 16 1Based on November 2, 2015 closing stock price of $33.05 and current 2015 mean EPS estimate by analysts of $2.04 per SNL Financial ■ Tier 1 Capital includes 8.00% Series A Preferred and various floating rate trust preferred securities ■ The Series A Preferred is callable beginning Feb 2018 ■ Trust preferred securities consists of 8 separate issuances, which are all currently callable, have variable interest rates ranging from 3 month LIBOR + 1.30% to 3 month LIBOR + 2.80%; maturities from 2028 to 2037 ■ Possible redemptions reviewed regularly depending on projected capital needs and cost of these securities ■ How we intend to deploy capital ■ Intend to exceed well-capitalized requirements ■ Reinvest in our business lines to support organic growth ■ Pay a regular dividend and repurchase stock when warranted Current quarterly dividend of $0.17 per common share equates to an annualized yield of approximately 2.1% and payout ratio of 33%1 Completed the announced $50 million common stock repurchase plan ■ Acquisitions – active and disciplined acquirer (e.g., Celtic Dec 2012, Taylor Aug 2014, MSA Holdings, LLC announced October 2015) 10.00% 8.53% 12.94% 0.00% 2.00% 4.00% 6.00% 8.00% 10.00% 12.00% 14.00% Tangible common equity to tangible assets Total Risk Based Capital Capital Ratios as of Sep 30, 2015 Regulatory Requirement MBFI

Summary Income Statement and EPS $0.52 $1.60 $1.79 $1.31 $0.82 $1.45 $0.51 $1.77 $1.83 $1.86 $1.35 $1.53 $0.00 $0.40 $0.80 $1.20 $1.60 $2.00 2011 2012 2013 2014 YTD 9/30/2014YTD 9/30/2015 Fully Diluted Earnings Per Common Share As Reported EPS Operating EPS (excludes non-core items) 17 2011 2012 2013 2014 2014 2015 Interest income $ 385 $ 335 $ 298 $ 375 $ 248 $ 365 Interest expense 59 43 26 24 17 21 Net interest income $ 325 $ 293 $ 272 $ 351 $ 231 $ 344 Provision for credit losses 121 (9) (6) 12 2 15 Net interest income after provision for credit losses $ 205 $ 302 $ 278 $ 339 $ 229 $ 329 Non-interest income 123 129 154 221 137 246 Non-interest expenses 283 304 295 437 296 407 Income before income taxes $ 44 $ 127 $ 138 $ 123 $ 70 $ 168 Applicable income tax expense 5 36 39 37 20 53 Net income $ 39 $ 90 $ 98 $ 86 $ 50 $ 115 Nine Months Ended 9/30Years Ended 12/31 Summary Income Statement (Dollars in millions)

Key Fee Initiatives – Reflect Continued Solid Growth 18 Lease financing Includes fees related to equipment leases as well as brokering third party equipment maintenance contracts Commercial deposit and treasury management fees Includes fees for the following services: account management, payments systems access, information management, and fraud and risk mitigation Expanding nationally where we have expertise Mortgage banking Includes revenue from both originations and servicing Trust and asset management fees Wealth management solutions for individuals, corporations and not-for-profits Includes fees for the following services: investment management, custody, personal trust, financial planning, and wealth advisory services for high net worth individuals Card fees Began offering prepaid and credit cards in 2012 Includes fees for debit, credit, prepaid, incentive and gift cards Capital markets and international banking fees Teams expanded in 2012 Capital markets services includes derivatives and interest rate risk solutions, capital solutions, merger and acquisition advisory and real estate debt placement International banking services includes trade services (letters of credit), export trade finance, and foreign exchange 2011 2012 2013 2014 2014 2015 Lease financing, net $ 26.9 $ 36.4 $ 61.2 $ 64.3 $ 45.8 $ 60.6 Mortgage banking revenue 0.8 2.3 1.7 46.1 17.1 90.9 Commercial deposit and treasury management 23.6 23.6 24.9 34.3 23.6 33.6 Trust and asset management fees 17.3 18.0 19.1 21.8 16.3 17.4 Card fees 7.0 9.4 11.0 13.7 9.8 11.7 Capital markets and international banking 1.9 5.1 3.6 5.5 3.8 5.8 Total key fee initiatives $ 77.5 $ 94.8 $ 121.5 $ 185.8 $ 116.4 $ 220.0 Percent change 15.7% 22.3% 28.2% 53.0% 89.0% Years Ended 12/31 Nine Months Ended 9/30 Key Fee Initiatives (Dollars in millions)
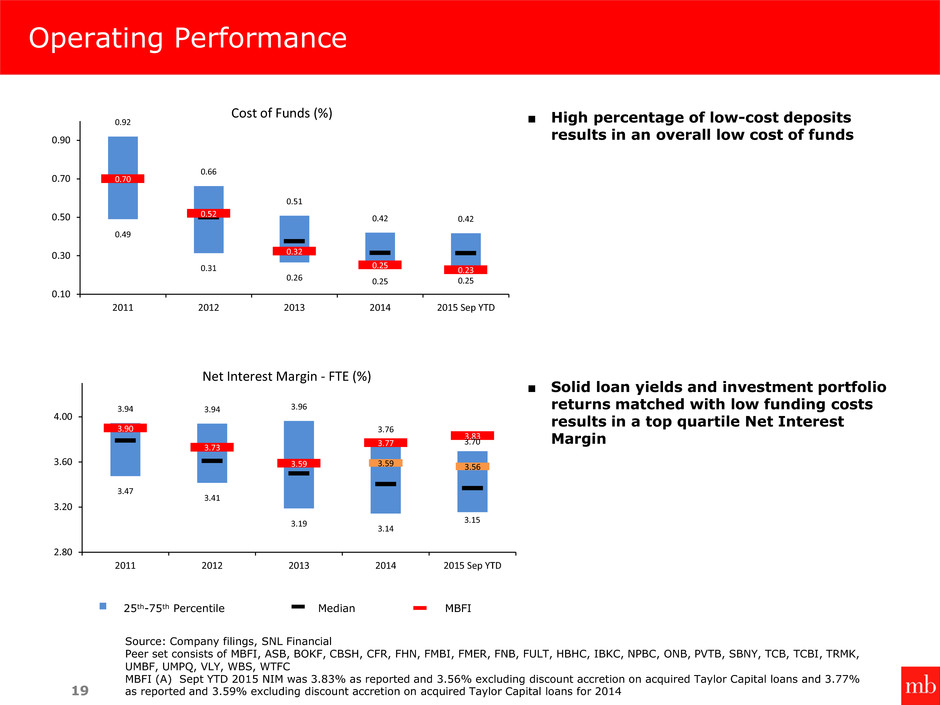
Operating Performance 19 Source: Company filings, SNL Financial Peer set consists of MBFI, ASB, BOKF, CBSH, CFR, FHN, FMBI, FMER, FNB, FULT, HBHC, IBKC, NPBC, ONB, PVTB, SBNY, TCB, TCBI, TRMK, UMBF, UMPQ, VLY, WBS, WTFC MBFI (A) Sept YTD 2015 NIM was 3.83% as reported and 3.56% excluding discount accretion on acquired Taylor Capital loans and 3.77% as reported and 3.59% excluding discount accretion on acquired Taylor Capital loans for 2014 ■ High percentage of low-cost deposits results in an overall low cost of funds ■ Solid loan yields and investment portfolio returns matched with low funding costs results in a top quartile Net Interest Margin 0.49 0.31 0.26 0.25 0.25 0.70 0.52 0.32 0.25 0.23 0.92 0.66 0.51 0.42 0.42 0.10 0.30 0.50 0.70 0.90 2011 2012 2013 2014 2015 Sep YTD Cost of Funds (%) 3.47 3.41 3.19 3.14 3.15 3.90 3.73 3.59 3.77 3.83 3.94 3.94 3.96 3.76 3.70 3.59 3.56 2.80 3.20 3.60 4.00 2011 2012 2013 2014 2015 Sep YTD Net Interest Margin - FTE (%) 25th-75th Percentile Median MBFI
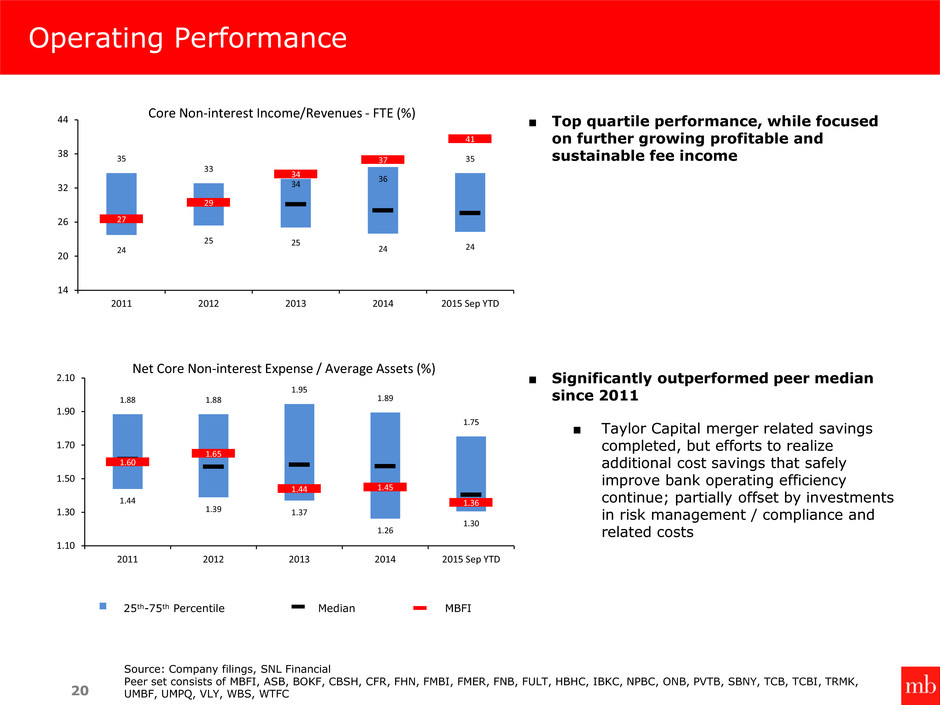
Operating Performance 20 Source: Company filings, SNL Financial Peer set consists of MBFI, ASB, BOKF, CBSH, CFR, FHN, FMBI, FMER, FNB, FULT, HBHC, IBKC, NPBC, ONB, PVTB, SBNY, TCB, TCBI, TRMK, UMBF, UMPQ, VLY, WBS, WTFC ■ Top quartile performance, while focused on further growing profitable and sustainable fee income ■ Significantly outperformed peer median since 2011 ■ Taylor Capital merger related savings completed, but efforts to realize additional cost savings that safely improve bank operating efficiency continue; partially offset by investments in risk management / compliance and related costs 24 25 25 24 24 27 29 34 37 41 35 33 34 36 35 14 20 26 32 38 44 2011 2012 2013 2014 2015 Sep YTD Core Non-interest Income/Revenues - FTE (%) 25th-75th Percentile Median MBFI 1.44 1.39 1.37 1.26 1.30 1.60 1.65 1.44 1.45 1.36 1.88 1.88 1.95 1.89 1.75 1.10 1.30 1.50 1.70 1.90 2.10 2011 2012 2013 2014 2015 Sep YTD Net Core Non-interest Expense / Average Assets (%)
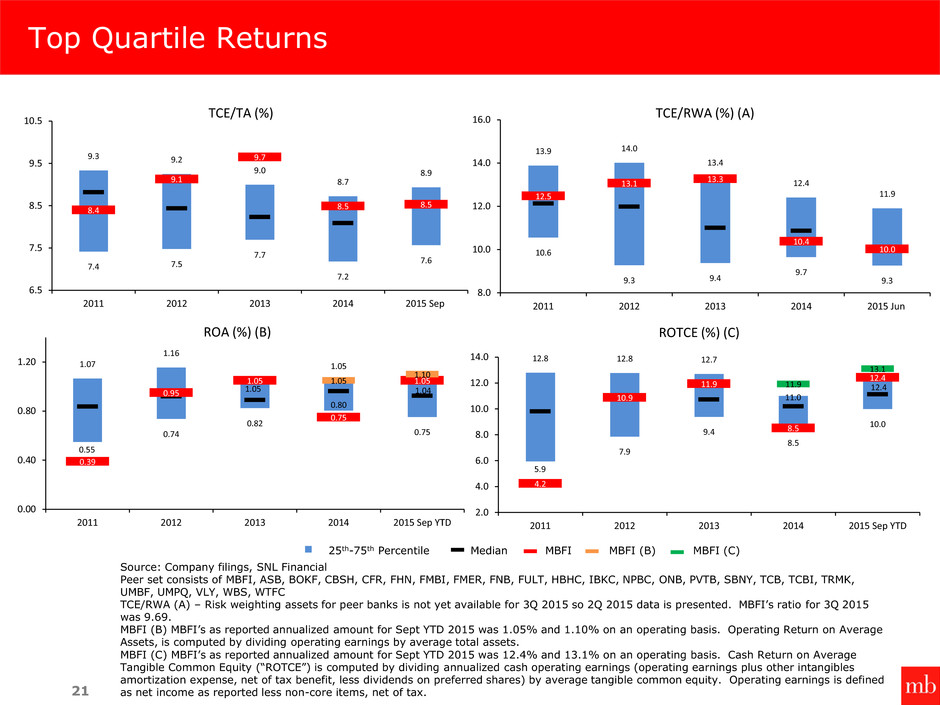
Top Quartile Returns 21 Source: Company filings, SNL Financial Peer set consists of MBFI, ASB, BOKF, CBSH, CFR, FHN, FMBI, FMER, FNB, FULT, HBHC, IBKC, NPBC, ONB, PVTB, SBNY, TCB, TCBI, TRMK, UMBF, UMPQ, VLY, WBS, WTFC TCE/RWA (A) – Risk weighting assets for peer banks is not yet available for 3Q 2015 so 2Q 2015 data is presented. MBFI’s ratio for 3Q 2015 was 9.69. MBFI (B) MBFI’s as reported annualized amount for Sept YTD 2015 was 1.05% and 1.10% on an operating basis. Operating Return on Average Assets, is computed by dividing operating earnings by average total assets. MBFI (C) MBFI’s as reported annualized amount for Sept YTD 2015 was 12.4% and 13.1% on an operating basis. Cash Return on Average Tangible Common Equity (“ROTCE”) is computed by dividing annualized cash operating earnings (operating earnings plus other intangibles amortization expense, net of tax benefit, less dividends on preferred shares) by average tangible common equity. Operating earnings is defined as net income as reported less non-core items, net of tax. 10.6 9.3 9.4 9.7 9.3 12.5 13.1 13.3 10.4 10.0 13.9 14.0 13.4 12.4 11.9 8.0 10.0 12.0 14.0 16.0 2011 2012 2013 2014 2015 Jun TCE/RWA (%) (A) 7.4 7.5 7.7 7.2 7.6 8.4 9.1 9.7 8.5 8.5 9.3 9.2 9.0 8.7 8.9 6.5 7.5 8.5 9.5 10.5 2011 2012 2013 2014 2015 Sep TCE/TA (%) 25th-75th Percentile Median MBFI MBFI (B) MBFI (C) 0.55 0.74 0.82 0.80 0.75 0.39 0.95 1.05 0.75 1.05 1.07 1.16 1.05 1.05 1.04 1.05 1.10 0.00 0.40 0.80 1.20 2011 2012 2013 2014 2015 Sep YTD ROA (%) (B) 5.9 7.9 9.4 8.5 10.0 4.2 10.9 11.9 8.5 12.4 12.8 12.8 12.7 11.0 12.4 11.9 13.1 2.0 4.0 6.0 8.0 10.0 12.0 14.0 2011 2012 2013 2014 2015 Sep YTD ROTCE (%) (C)

22 Reserves/Loans (%) Improved Credit Metrics Source: Company filings, SNL Financial Peer set consists of MBFI, ASB, BOKF, CBSH, CFR, FHN, FMBI, FMER, FNB, FULT, HBHC, IBKC, NPBC, ONB, PVTB, SBNY, TCB, TCBI, TRMK, UMBF, UMPQ, VLY, WBS, WTFC (A) Excludes accruing TDRs 0.67 0.53 0.36 0.31 0.31 2.12 1.62 1.36 0.73 0.85 1.97 1.59 1.11 0.79 0.81 0.00 0.50 1.00 1.50 2.00 2.50 2011 2012 2013 2014 2015 Sep NPAs/Assets (%) 1.03 0.89 0.55 0.47 0.35 2.17 2.03 1.87 0.96 1.03 2.42 1.70 1.20 0.96 1.05 0.00 0.50 1.00 1.50 2.00 2.50 3.00 2011 2012 2013 2014 2015 Sep NPLs/Loans (%) (A) 84.0 90.1 101.4 121.9 105.7 98.0 106.2 104.9 126.3 129.0 143.0 174.2 215.0 233.5 238.6 50.0 90.0 130.0 170.0 210.0 250.0 2011 2012 2013 2014 2015 Sep ALLL/NPLs (%) 1.24 1.10 1.02 0.92 0.82 2.13 2.15 1.96 1.21 1.33 2.19 1.80 1.59 1.35 1.24 0.00 0.50 1.00 1.50 2.00 2.50 2011 2012 2013 2014 2015 Sep ALLL/Loans (%) 25th-75th Percentile Median MBFI

■ Total loans, excluding purchased credit-impaired, grew 3.4% (13.7% annualized) in the 3Q 2015 to $9.2 billion. ■ Total deposits grew 3.6% (14.5% annualized) in the 3Q 2015 to $11.3 billion. ■ Diluted earnings per share were $0.51 in 3Q 2015 as compared to $0.52 in 2Q 2015. ■ Key earnings components comparisons to 2Q 2015: Net interest income on a fully tax equivalent basis increased 1.5% due to an increase in interest earning assets partly offset by lower loan yields. Core non-interest income was $82.8 million in the 3Q 2015 as compared to $83.0 million in the 2Q 2015. The 3Q 2015 card fee income was reduced by approximately $1.2 million due to being subject to the Durbin amendment of the Dodd-Frank Act for the first time this quarter. On a fully tax-equivalent basis, core non-interest income was 40% of revenues in the 3Q 2015 as compared to 41% in the 2Q 2015. The 3Q 2015 ratio was in the top quartile of our peer banks. ■ Annualized Operating Return on Assets was 1.06% in the 3Q 2015. ■ Credit Quality Metrics: The ratio of non-performing loans to total loans of 1.03% at 9/30/2015 decreased from 1.08% at 6/30/2015. Year-to-date September 2015 annualized net loan charge-offs to average loans was 0.01%. ■ In October 2015 we announced an agreement to acquire MSA Holdings, LLC, the parent company of MainStreet Investment Advisors, LLC and Cambium Asset Management, LLC. MainStreet provides investment advisory services for bank and independent trust companies located throughout the United States. Cambium is a wealth management firm dedicated to meeting the investment needs of its clients. Recent Company Highlights – 3Q 2015 23 1Operating earnings is defined as net income as reported less non-core items, net of tax. Non-core items do not pertain to our core business operations. We believe it is useful to exclude these items in assessing our core operating performance and in understanding the primary drivers of our non-interest income and non-interest expense and their exclusion allows for a more meaningful comparison of our operating results from period to period.

Non-GAAP Disclosure Appendix 24
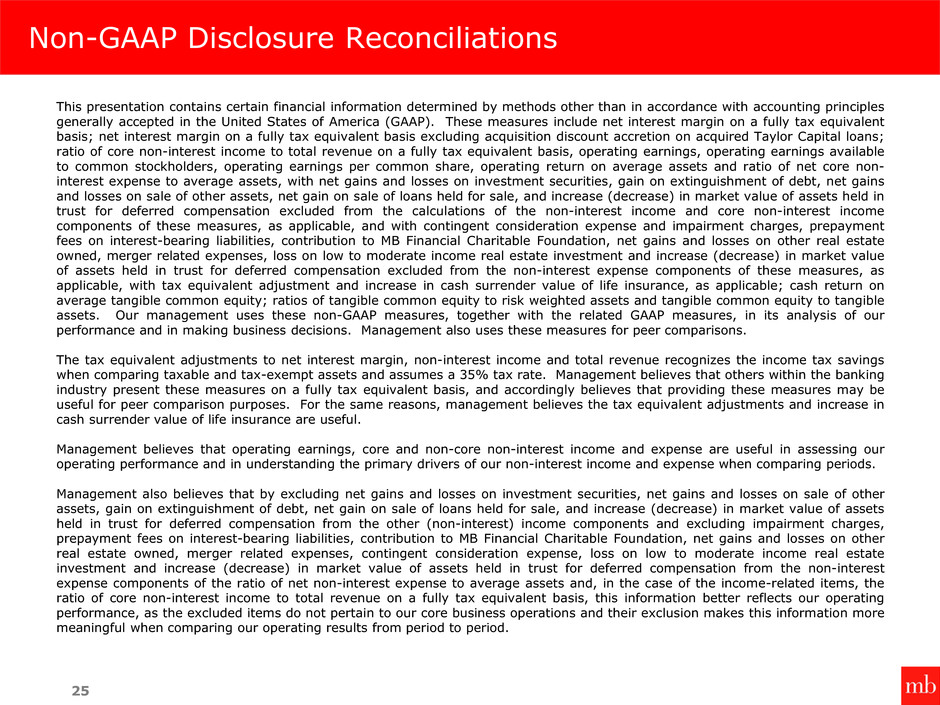
Non-GAAP Disclosure Reconciliations This presentation contains certain financial information determined by methods other than in accordance with accounting principles generally accepted in the United States of America (GAAP). These measures include net interest margin on a fully tax equivalent basis; net interest margin on a fully tax equivalent basis excluding acquisition discount accretion on acquired Taylor Capital loans; ratio of core non-interest income to total revenue on a fully tax equivalent basis, operating earnings, operating earnings available to common stockholders, operating earnings per common share, operating return on average assets and ratio of net core non- interest expense to average assets, with net gains and losses on investment securities, gain on extinguishment of debt, net gains and losses on sale of other assets, net gain on sale of loans held for sale, and increase (decrease) in market value of assets held in trust for deferred compensation excluded from the calculations of the non-interest income and core non-interest income components of these measures, as applicable, and with contingent consideration expense and impairment charges, prepayment fees on interest-bearing liabilities, contribution to MB Financial Charitable Foundation, net gains and losses on other real estate owned, merger related expenses, loss on low to moderate income real estate investment and increase (decrease) in market value of assets held in trust for deferred compensation excluded from the non-interest expense components of these measures, as applicable, with tax equivalent adjustment and increase in cash surrender value of life insurance, as applicable; cash return on average tangible common equity; ratios of tangible common equity to risk weighted assets and tangible common equity to tangible assets. Our management uses these non-GAAP measures, together with the related GAAP measures, in its analysis of our performance and in making business decisions. Management also uses these measures for peer comparisons. The tax equivalent adjustments to net interest margin, non-interest income and total revenue recognizes the income tax savings when comparing taxable and tax-exempt assets and assumes a 35% tax rate. Management believes that others within the banking industry present these measures on a fully tax equivalent basis, and accordingly believes that providing these measures may be useful for peer comparison purposes. For the same reasons, management believes the tax equivalent adjustments and increase in cash surrender value of life insurance are useful. Management believes that operating earnings, core and non-core non-interest income and expense are useful in assessing our operating performance and in understanding the primary drivers of our non-interest income and expense when comparing periods. Management also believes that by excluding net gains and losses on investment securities, net gains and losses on sale of other assets, gain on extinguishment of debt, net gain on sale of loans held for sale, and increase (decrease) in market value of assets held in trust for deferred compensation from the other (non-interest) income components and excluding impairment charges, prepayment fees on interest-bearing liabilities, contribution to MB Financial Charitable Foundation, net gains and losses on other real estate owned, merger related expenses, contingent consideration expense, loss on low to moderate income real estate investment and increase (decrease) in market value of assets held in trust for deferred compensation from the non-interest expense components of the ratio of net non-interest expense to average assets and, in the case of the income-related items, the ratio of core non-interest income to total revenue on a fully tax equivalent basis, this information better reflects our operating performance, as the excluded items do not pertain to our core business operations and their exclusion makes this information more meaningful when comparing our operating results from period to period. 25
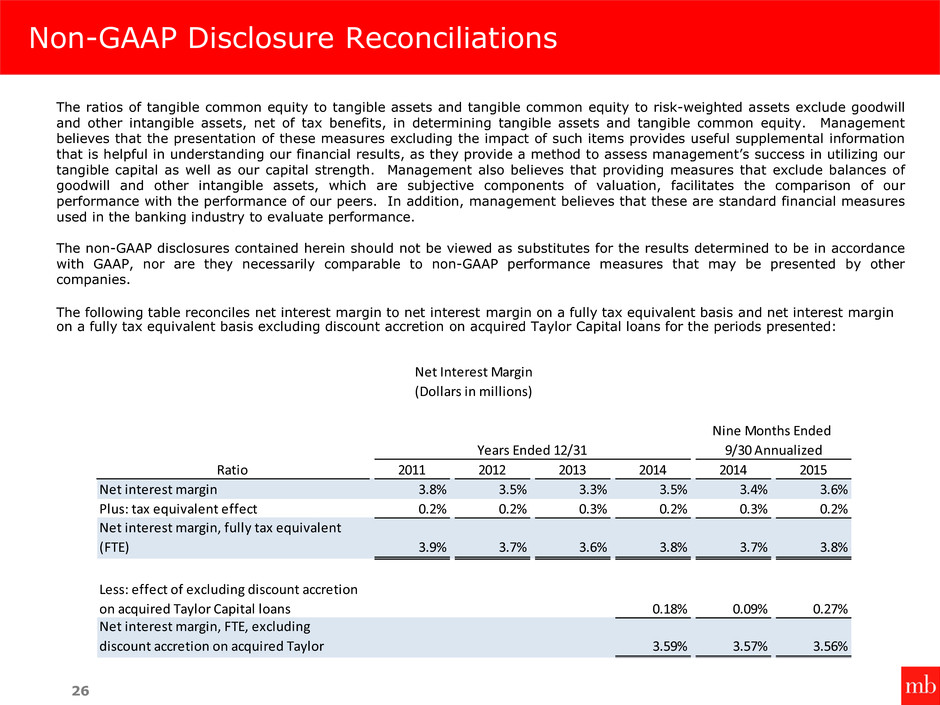
Non-GAAP Disclosure Reconciliations The ratios of tangible common equity to tangible assets and tangible common equity to risk-weighted assets exclude goodwill and other intangible assets, net of tax benefits, in determining tangible assets and tangible common equity. Management believes that the presentation of these measures excluding the impact of such items provides useful supplemental information that is helpful in understanding our financial results, as they provide a method to assess management’s success in utilizing our tangible capital as well as our capital strength. Management also believes that providing measures that exclude balances of goodwill and other intangible assets, which are subjective components of valuation, facilitates the comparison of our performance with the performance of our peers. In addition, management believes that these are standard financial measures used in the banking industry to evaluate performance. The non-GAAP disclosures contained herein should not be viewed as substitutes for the results determined to be in accordance with GAAP, nor are they necessarily comparable to non-GAAP performance measures that may be presented by other companies. The following table reconciles net interest margin to net interest margin on a fully tax equivalent basis and net interest margin on a fully tax equivalent basis excluding discount accretion on acquired Taylor Capital loans for the periods presented: 26 Ratio 2011 2012 2013 2014 2014 2015 N i r t rgin 3.8% 3.5% 3.3% 3.5% 3.4% 3.6% Pl : t x quiv lent effect 0.2% 0.2% 0.3% 0.2% 0.3% 0.2% N i s argin, fully tax equivalent (FTE) 3.9% 3.7% 3.6% 3.8% 3.7% 3.8% Less: effect of excluding discount accretion on acquired Taylor Capital loans 0.18% 0.09% 0.27% Net interest margin, FTE, excluding discount accretion on acquired Taylor 3.59% 3.57% 3.56% Years Ended 12/31 Nine Months Ended 9/30 Annualized Net Interest Margin (Dollars in millions)
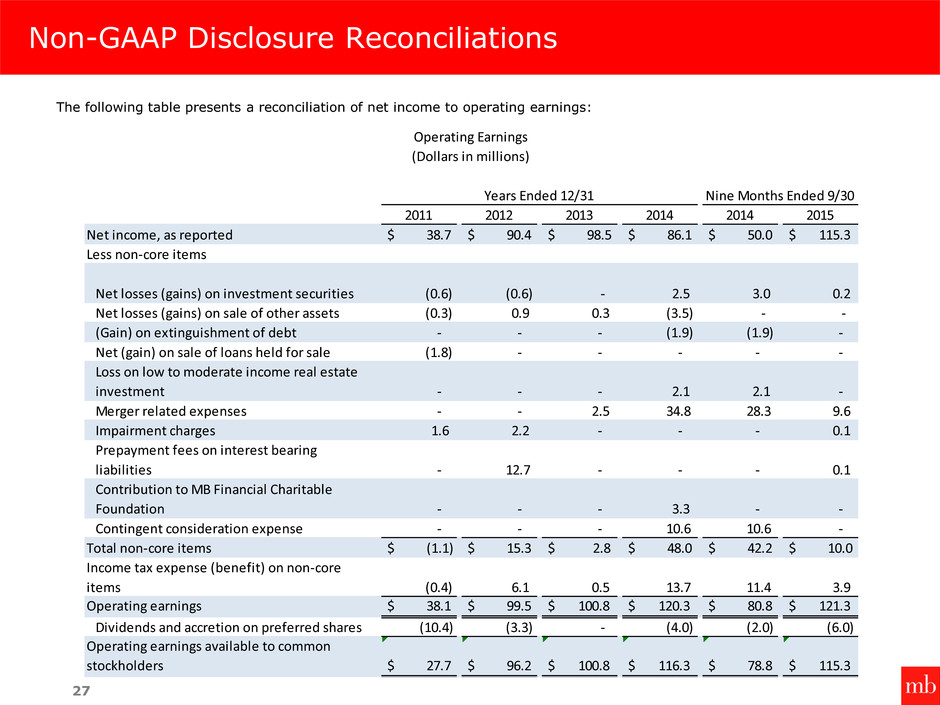
Non-GAAP Disclosure Reconciliations The following table presents a reconciliation of net income to operating earnings: 27 2011 2012 2013 2014 2014 2015 Net income, as reported $ 38.7 $ 90.4 $ 98.5 $ 86.1 $ 50.0 $ 115.3 Less non-core items Net losses (gains) on investment securities (0.6) (0.6) - 2.5 3.0 0.2 Net losses (gains) on sale of other assets (0.3) 0.9 0.3 (3.5) - - (Gain) on extinguishment of debt - - - (1.9) (1.9) - Net (gain) on sale of loans held for sale (1.8) - - - - - Loss on low to moderate income real estate investment - - - 2.1 2.1 - Merger related expenses - - 2.5 34.8 28.3 9.6 Impairment charges 1.6 2.2 - - - 0.1 Prepayment fees on interest bearing liabilities - 12.7 - - - 0.1 Contribution to MB Financial Charitable Foundation - - - 3.3 - - Contingent consideration expense - - - 10.6 10.6 - Total non-core items $ (1.1) $ 15.3 $ 2.8 $ 48.0 $ 42.2 $ 10.0 Inc me tax expense (benefit) on non-core items (0.4) 6.1 0.5 13.7 11.4 3.9 Operating earnings $ 38.1 $ 99.5 $ 100.8 $ 120.3 $ 80.8 $ 121.3 Dividends and accretion on preferred shares (10.4) (3.3) - (4.0) (2.0) (6.0) Operating earnings available to common stockholders $ 27.7 $ 96.2 $ 100.8 $ 116.3 $ 78.8 $ 115.3 Years Ended 12/31 Nine Months Ended 9/30 Operating Earnings (Dollars in millions)

Non-GAAP Disclosure Reconciliations The following table presents a reconciliation of tangible common equity to common stockholders’ equity (in millions): 28 The following table presents a reconciliation of tangible assets to total assets (in millions): 2011 2012 2013 2014 9/30/2015 Common stockholders' equity - as reported $ 1,198 $ 1,276 $ 1,327 $ 1,913 $ 1,948 Less: goodwill 387 423 423 712 712 Less: other intangible, net of tax benefit 19 19 15 25 24 Tangible common equity $ 792 $ 833 $ 888 $ 1,177 $ 1,212 As of 12/31 Tangible Common Equity (Dollars in millions) 2011 2012 2013 2014 9/30/2015 Total assests - as reported $ 9,833 $ 9,572 $ 9,641 $ 14,602 $ 14,950 Less: goodwill 387 423 423 712 712 Less: other intangible, net of tax benefit 19 19 15 25 24 Tangible assets $ 9,427 $ 9,129 $ 9,203 $ 13,866 $ 14,214 As of 12/31 Tangible Assets (Dollars in millions)
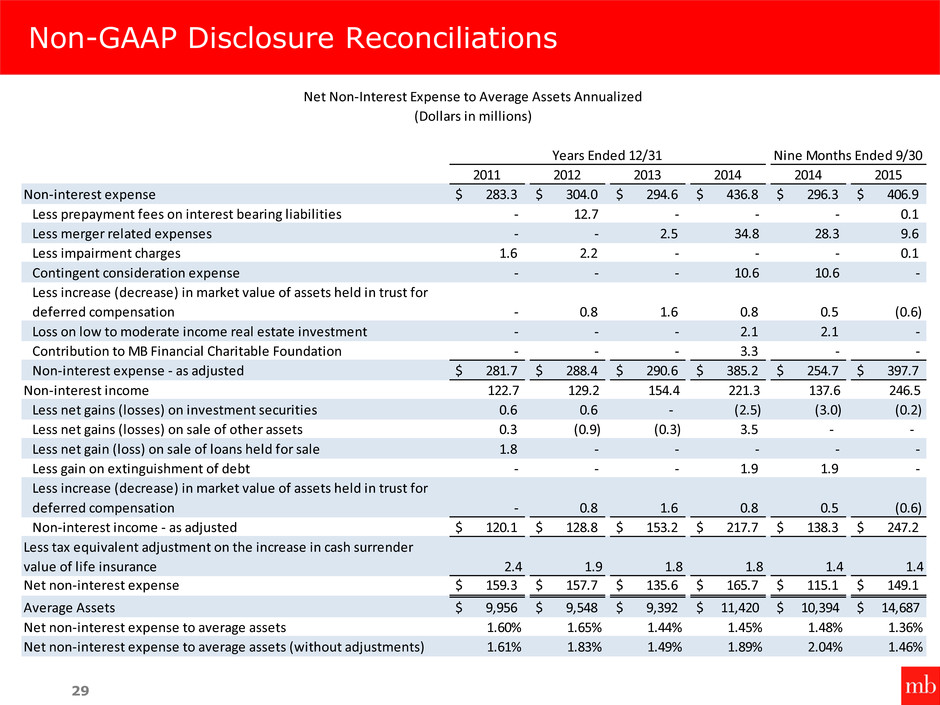
Non-GAAP Disclosure Reconciliations 29 2011 2012 2013 2014 2014 2015 Non-interest expense $ 283.3 $ 304.0 $ 294.6 $ 436.8 $ 296.3 $ 406.9 Less prepayment fees on interest bearing liabilities - 12.7 - - - 0.1 Less merger related expenses - - 2.5 34.8 28.3 9.6 Less impairment charges 1.6 2.2 - - - 0.1 Contingent consideration expense - - - 10.6 10.6 - Less increase (decrease) in market value of assets held in trust for deferred compensation - 0.8 1.6 0.8 0.5 (0.6) Loss on low to moderate income real estate investment - - - 2.1 2.1 - Contribution to MB Financial Charitable Foundation - - - 3.3 - - Non-interest expense - as adjusted $ 281.7 $ 288.4 $ 290.6 $ 385.2 $ 254.7 $ 397.7 Non-interest income 122.7 129.2 154.4 221.3 137.6 246.5 Less net gains (losses) on investment securities 0.6 0.6 - (2.5) (3.0) (0.2) Less net gains (losses) on sale of other assets 0.3 (0.9) (0.3) 3.5 - - Less net gain (loss) on sale of loans held for sale 1.8 - - - - - Less gain on extinguishment of debt - - - 1.9 1.9 - Less increase (decrease) in market value of assets held in trust for deferred compensation - 0.8 1.6 0.8 0.5 (0.6) Non-interest income - as adjusted $ 120.1 $ 128.8 $ 153.2 $ 217.7 $ 138.3 $ 247.2 Less tax equivalent adjustment on the increase in cash surrender value of life insurance 2.4 1.9 1.8 1.8 1.4 1.4 Net non-interest expense $ 159.3 $ 157.7 $ 135.6 $ 165.7 $ 115.1 $ 149.1 Average Assets $ 9,956 $ 9,548 $ 9,392 $ 11,420 $ 10,394 $ 14,687 Net non-interest expense to average assets 1.60% 1.65% 1.44% 1.45% 1.48% 1.36% Net non-interest expense to average assets (without adjustments) 1.61% 1.83% 1.49% 1.89% 2.04% 1.46% Years Ended 12/31 Nine Months Ended 9/30 Net Non-Interest Expense to Average Assets Annualized (Dollars in millions)
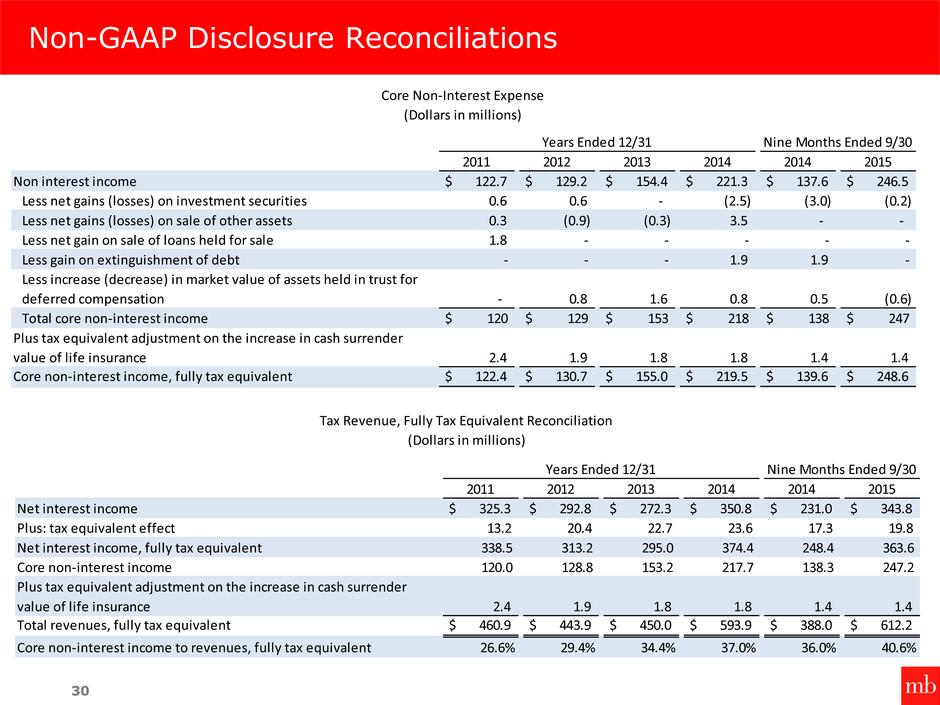
Non-GAAP Disclosure Reconciliations 30 2011 2012 2013 2014 2014 2015 Non interest income $ 122.7 $ 129.2 $ 154.4 $ 221.3 $ 137.6 $ 246.5 Less net gains (losses) on investment securities 0.6 0.6 - (2.5) (3.0) (0.2) Less net gains (losses) on sale of other assets 0.3 (0.9) (0.3) 3.5 - - Less net gain on sale of loans held for sale 1.8 - - - - - Less gain on extinguishment of debt - - - 1.9 1.9 - Le s increase (decrease) in market value of assets held in trust for deferred compensation - 0.8 1.6 0.8 0.5 (0.6) Total core non-interest income $ 120 $ 129 $ 153 $ 218 $ 138 $ 247 Plus tax equivalent adjustment on the increase in cash surrender value of life insurance 2.4 1.9 1.8 1.8 1.4 1.4 Core non-interest income, fully tax equivalent $ 122.4 $ 130.7 $ 155.0 $ 219.5 $ 139.6 $ 248.6 Core Non-Interest Expense (Dollars in millions) Years Ended 12/31 Nine Months Ended 9/30 2011 2012 2013 2014 2014 2015 Net interest income $ 325.3 $ 292.8 $ 272.3 $ 350.8 $ 231.0 $ 343.8 Plus: tax equivalent effect 13.2 20.4 22.7 23.6 17.3 19.8 Net i terest income, fully tax equivalent 338.5 313.2 29 . 374.4 248.4 363. Core non-interest income 120.0 128.8 153.2 217.7 138.3 247.2 Plus tax equivalent adjustment on the increase in cash surrender value of life insurance 2.4 1.9 1.8 1.8 1.4 1.4 Total revenues, fully tax equivalent $ 460.9 $ 443.9 $ 450.0 $ 593.9 $ 388.0 $ 612.2 Core non-interest income to revenues, fully tax equivalent 26.6% 29.4% 34.4% 37.0% 36.0% 40.6% Tax Reven e, Fully Tax Equivalent Reconciliation (Dollars in millions) Years Ended 12/31 Nine Months Ended 9/30

November 2015 NASDAQ: MBFI Investor Presentation
SIGNATURES
Pursuant to the requirements of the Securities Exchange Act of 1934, MB Financial, Inc. has duly caused this report to be signed on its behalf by the undersigned, thereunto duly authorized, on the 10th day of November 2015.
MB FINANCIAL, INC.
By: /s/Jill E. York
Jill E. York
Vice President and Chief Financial Officer
(Principal Financial and Principal Accounting Officer)
