Attached files
| file | filename |
|---|---|
| 8-K - 8-K - IRON MOUNTAIN INC | a15-22677_18k.htm |
Exhibit 99.1 Durable Business Drives Cash Flow and Supports Dividend Growth November 2015

Safe Harbor Language and Reconciliation of Non-GAAP Measures Safe Harbor Statement Under the Private Securities Litigation Reform Act of 1995: This presentation contains certain forward-looking statements within the meaning of the Private Securities Litigation Reform Act of 1995 and other securities laws and is subject to the safe-harbor created by such Act. Forward-looking statements include, but are not limited to, our financial performance outlook and shareholder returns in 2015 and through 2020, including after giving effect to our proposed acquisition of Recall Holdings Limited (“Recall”), and statements regardi ng our operations, economic performance, financial condition, goals, beliefs, future growth strategies, investment objectives, plans and current expectations, such as expected cost savings from our Transformation program, our proposed acquisition of Crozier Fine Arts (“Crozier”), projected revenues from our emerging market acquisition pipeline, valuation creation and returns associated with our data center business and other adjacent businesses, and the benefits associated with increasing the percentage of real estate that we own. These forward-looking statements are subject to various known and unknown risks, uncertainties and other factors. When we use words such as "believes," "expects," "anticipates," "estimates" or similar expressions, we are making forward-looking statements. You should not rely upon forward-looking statements except as statements of our present intentions and of our present expectations, which may or may not occur. Although we believe that our forward-looking statements are based on reasonable assumptions, our expected results may not be achieved, and actual results may differ materially from our expectations. Important factors that could cause actual results to differ from our other expectations include, among others: (i) our expected dividends may be materially different than our estimates; (ii) the cost to comply with current and future laws, regulations and customer demands relating to privacy issues; (iii) the impact of litigation or disputes that may arise in connection with incidents in which we fail to protect our customers' information; (iv) changes in the price for our storage and information management services relative to the cost of providing such storage and information management services; (v) changes in customer preferences and demand for our storage and information management services; (vi) the adoption of alternative technologies and shifts by our customers to storage of data through non-paper based technologies; (vii) the cost or potential liabilities associated with real estate necessary for our business; (viii) the performance of business partners upon whom we depend for technical assistance or management expertise outside the U.S.; (ix) changes in the political and economic environments in the countries in which our international subsidiaries operate; (x) changes in the cost of our debt; (xi) changes in the amount of our capital expenditures; (xii) our ability to remain qualified for taxation as a real estate investment trust; (xiii) our ability or inability to complete acquisitions on satisfactory terms and to integrate acquired companies efficiently, including Crozier; and (xiv) other trends in competitive or economic conditions affecting our financial condition or results of operations not presently contemplated. In addition, with respect to the potential Recall transaction, our ability to close the proposed transaction in accordance with its terms and within the anticipated time period, or at all, is dependent on our and Recall's ability to satisfy the closing conditions for the transaction, including the receipt of governmental and shareholder approvals, and the benefits of the potential Recall transaction, including potential cost synergies and other synergies (including tax synergies), may not be fully realized or may take longer to realize than expected. Additional risks and factors that may affect results are set forth in our filings with the Securities and Exchange Commission, including our Annual Report on Form 10-K for the fiscal year ending December 31, 2014, our current report on Form 8-K, filed with the SEC on October 307, 2015 and our quarterly report on From 10-Q for the fiscal quarter ending September 30, 2015 and in Recall’s filings with the Australian Stock Exchange, including Recall’s Annual Report for the fiscal year ending June 30, 2015. Except as required by law, we undertake no obligation to release publicly the result of any revision to these forward-looking statements that may be made to reflect events or circumstances after the date hereof or to reflect the occurrence of unanticipated events. Reconciliation of Non-GAAP Measures: Throughout this presentation, Iron Mountain will be discussing Adjusted Operating Income Before Depreciation, Amortization and Intangible Impairments (Adjusted OIBDA), which does not conform to accounting principles generally accepted in the United States (GAAP). For additional information and the reconciliation of these measures to the appropriate GAAP measure, , as required by Securities and Exchange Commission Regulation G, please see the appendix of this presentation. 2
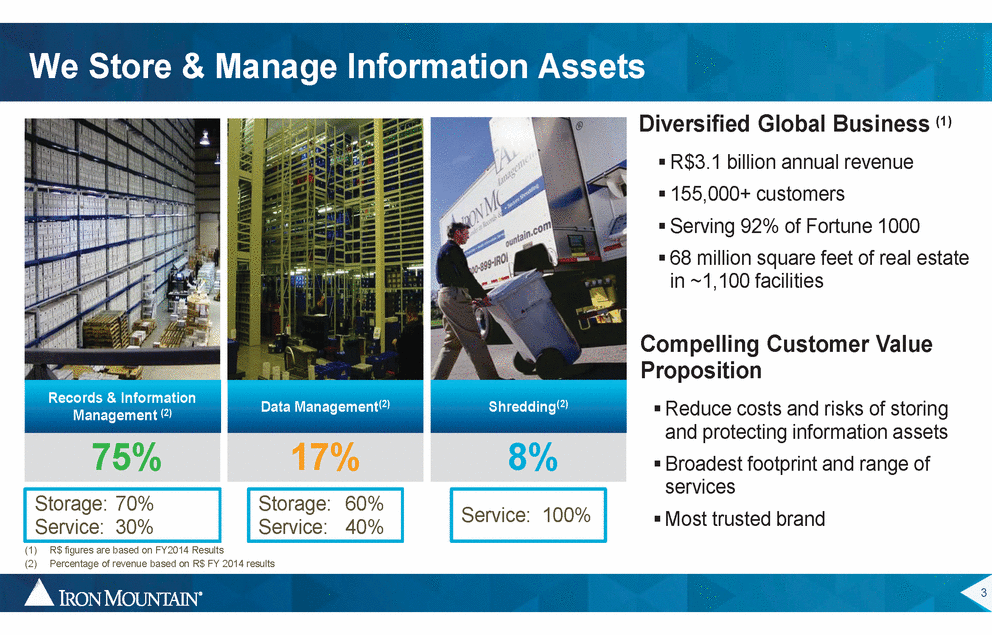
We Store & Manage Information Assets Diversified Global Business ƒ R$3.1 billion annual revenue ƒ 155,000+ customers ƒ Serving 92% of Fortune 1000 (1) ƒ 68 million square feet of real estate in ~1,100 facilities Compelling Customer Value Proposition ƒ Reduce costs and risks of storing and protecting information assets ƒ Broadest footprint and range of services ƒ Most trusted brand Records & Information Management (2) Data Management(2) Shredding(2) 75% 17% (1) (2) R$ figures are based on FY2014 Results Percentage of revenue based on R$ FY 2014 results 3 Service:100% Storage:60% Service:40% Storage: 70% Service:30% 8%
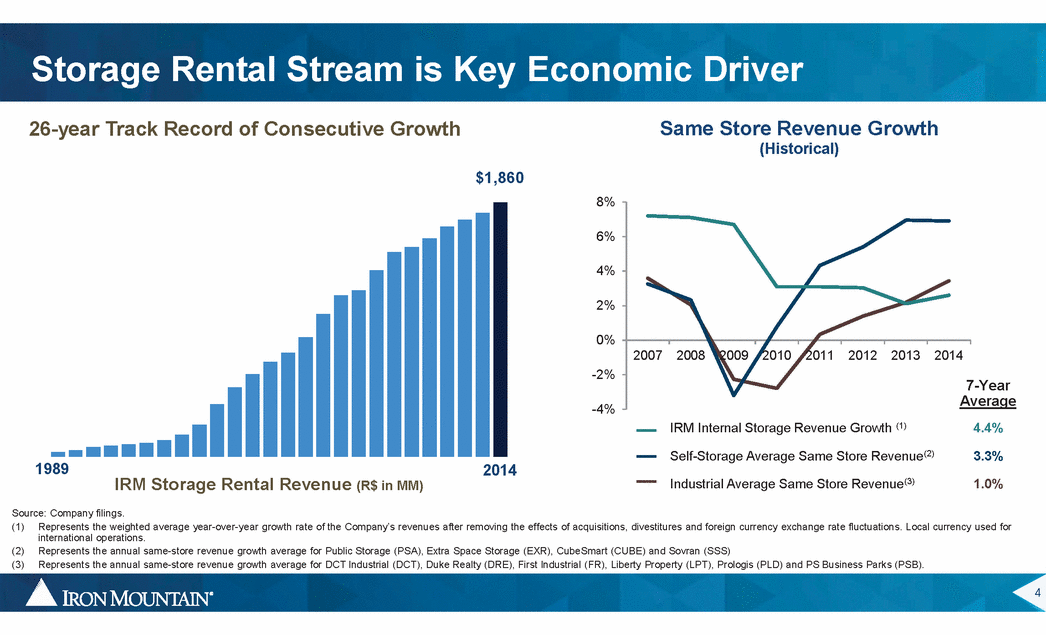
Storage Rental Stream is Key Economic Driver Same Store Revenue (Historical) Growth 26-year Track Record of Consecutive Growth $1,860 8% 6% 4% 2% 0% 2008 2009 2010 2011 2012 2013 2014 -2% 7-Year Average 4.4% -4% IRM Internal Storage Revenue Growth (1) Self-Storage Average Same Store Revenue(2) 3.3% 1989 2014 IRM Storage Rental Revenue (R$ in MM) Industrial Average Same Store Revenue(3) 1.0% Source: Company filings. (1) Represents the weighted average year-over-year growth rate of the Company’s revenues after removing the effects of acquisitions, divestitures and foreign currency exchange rate fluctuations. Local currency used for international operations. Represents the annual same-store revenue growth average for Public Storage (PSA), Extra Space Storage (EXR), CubeSmart (CUBE) and Sovran (SSS) Represents the annual same-store revenue growth average for DCT Industrial (DCT), Duke Realty (DRE), First Industrial (FR), Liberty Property (LPT), Prologis (PLD) and PS Business Parks (PSB). (2) (3) 4 2007
Strategic Plan Delivering Expected Results OUR PLAN FOR GROWTH DEVELOPED MARKETS EMERGING MARKETS ADJACENT BUSINESSES 7M cu. ft. Net RM Volume prior to Acquisitions* Emerging Markets = 14% of Total Revenues on a C$ basis* New Data Center Customers and Expanded into Art Storage TRANSFORMATION, INTEGRATION AND TALENT Drive process improvements, simplification, efficiencies. develop and enable talent to support business strategy INCREASING OWNERSHIP OF OPERATING PROPERTIES Leverage our Real Estate Investment Trust status to create long-term value *Reflects data from Jan 2014 through Q3 2015 5 ENABLERS GROWTH and VALUE PILLARS
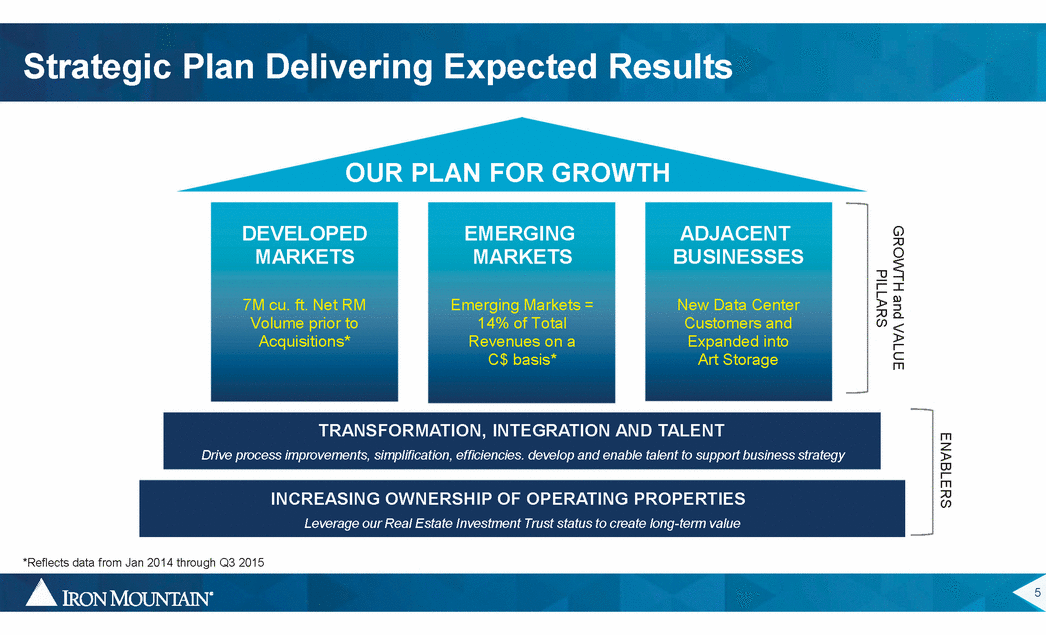
Strategic Plan has Driven Since Year-end 2013 Performance Turnaround STRATEGIC PLAN EMERGING MARKETS DEVELOPED MARKETS ADJACENT BUSINESSES 2013 -2015F Revenue C$ CAGR 1% 33% 20% Worldwide Revenue (C$ in MM) Adjusted OIBDA (C$ in MM) $3,050 - $3,110 $3,011 $2,894 2013 2014 2015E 2013 2014 2015E 2013 2015 Delivered 25% TSR through October 2, 2015 6 $1.91 $1.08 $925-$945 $861 $898 Regular Dividend per Share
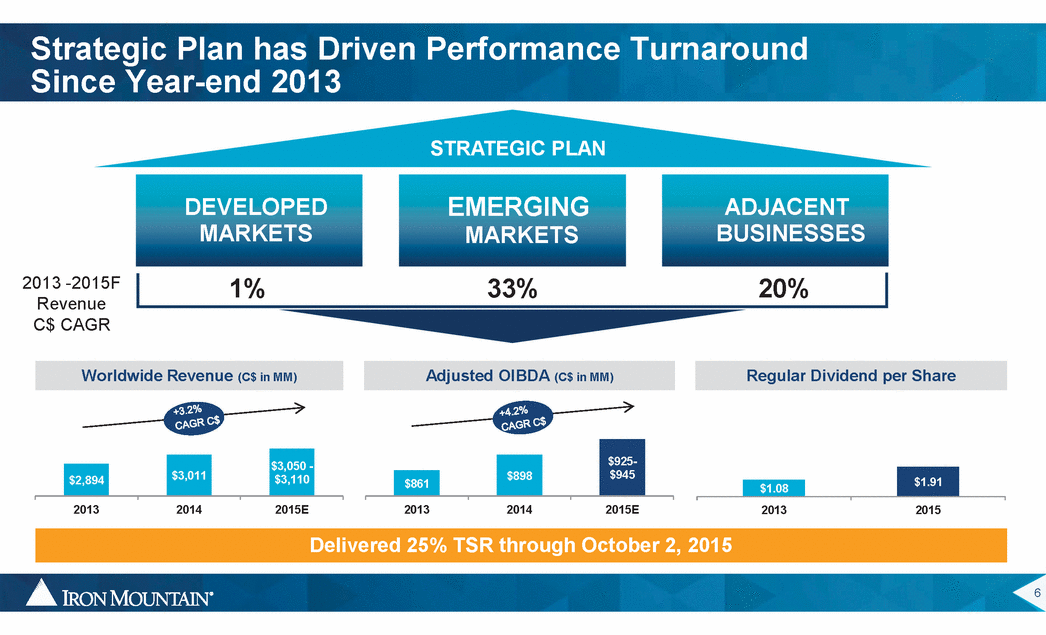
Solid Execution on Performance Drivers KEY DRIVERS 9 Sales force excellence 9 Customer Segmentation 9 Customer Acquisitions STORAGE VOLUME GROWTH 9 9 9 9 9 Customer Retention Value Based Selling REVENUE MANAGEMENT Align and Package + Expanding services+ New revenue streams SERVICEREVENUE & MARGIN ManageEfficiencies and Costs Capital Allocation ROIC 7 GOALS
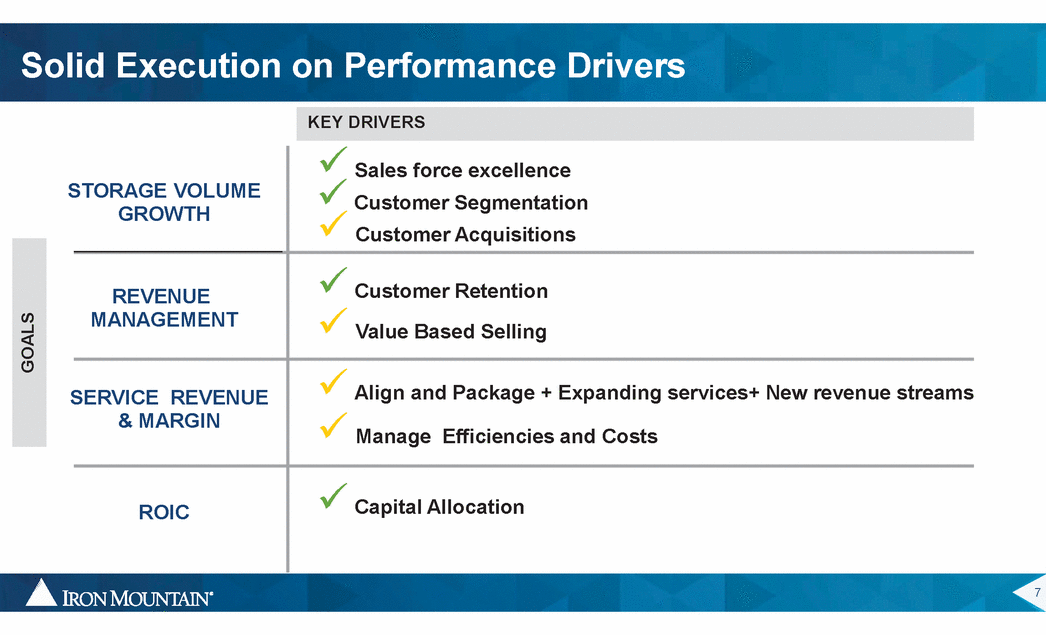
Organic Document Storage Continues Strong, Steady Growth to Demonstrate Developed Markets ƒ 50-year average customer retention 6% ƒ Less than 2% annual volume loss from terminations 3% ƒ Boxes stay with us for an average 15.2 years(1) Net volume before acquisition growing in every major market No single customer represents greater than 2% of total revenue of 0% Q4-12 Q1-13 Q2-13 Q3-13 Q4-13 Q1-14 Q2-14 Q3-14 Q4-14 Q1-15 Q2-15 Q3-15 New Volume From Existing Customers ƒ Emerging Markets 12% 8% 4% 0% ƒ Q4-12 Q1-13 Q2-13 Q3-13 Q4-13 Q1-14 Q2-14 Q3-14 Q4-14 Q1-15 Q2-15 Q3-15 New Volume From Existing Customers (1) Based on annual volume churn rate of 6.6% as of Q3 2015 8
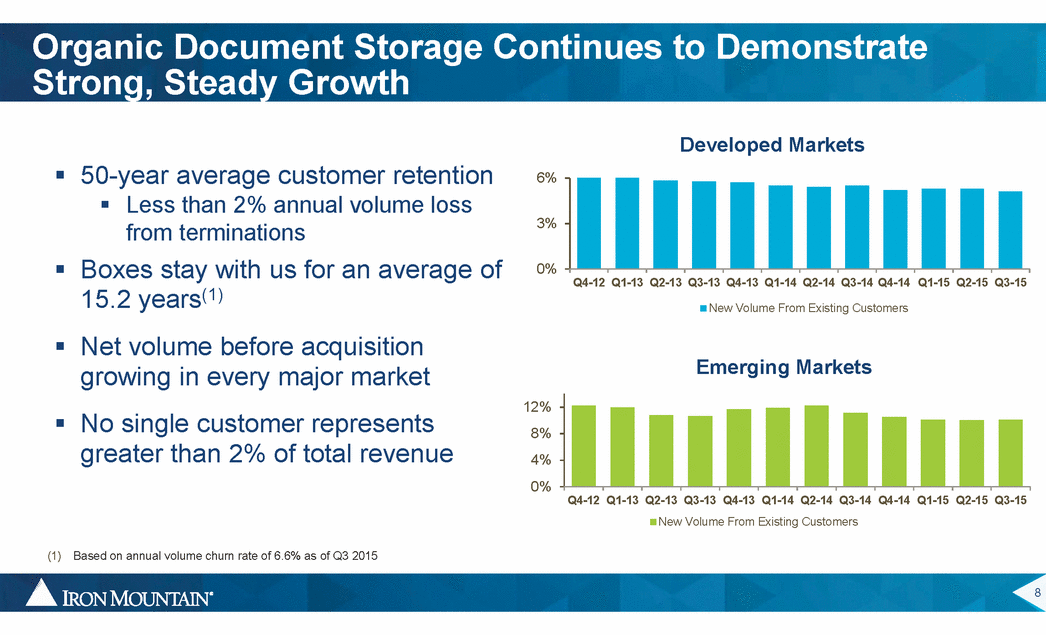
Standalone Plan to Extend Performance with 2020 Vision 2020 TODAY 85% Developed Core 15% Growth Portfolio Emerging Markets = 14% Adjacent Businesses = 1% 75% Developed Core 25% Growth Portfolio Emerging Markets = 20% Adjacent Businesses = 5% 2% Adj. OIBDA 10% Adj. OIBDA 3% Adj. OIBDA 10% Adj. OIBDA ~5% Internal Growth ROIC = 14% ~3% Internal Growth ROIC = 12% Prior to Recall acquisition 9
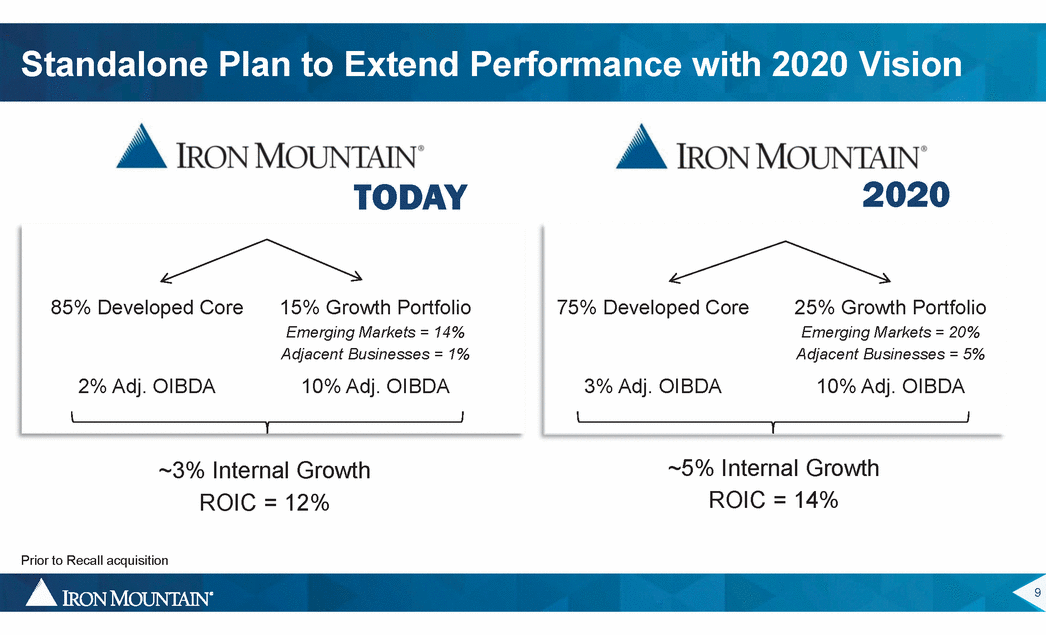
2020 Vision Extends Strategic Plan and Will Continue to Deliver Strong C$ Growth Worldwide Revenue (C$ in MM) $3,770 – $3,870 $3,165 – $3,265 $3,050 – $3,110 2015 2016 2017 2018 2020 2015E 2016E 2020E Adjusted OIBDA (C$ in MM) $1,330 – $1,410 2015E 2020E $990 – $1030 $925 – $945 2015E 2016E 2020E 2015E 2020E 10 5.7x 5.3x Lease Adjusted Leverage Ratio 82% 67% Dividend as % of AFFO $2.18 4% growth through 2020 $2.10 $1.98 $1.91 Projected Minimum Dividend Per Share
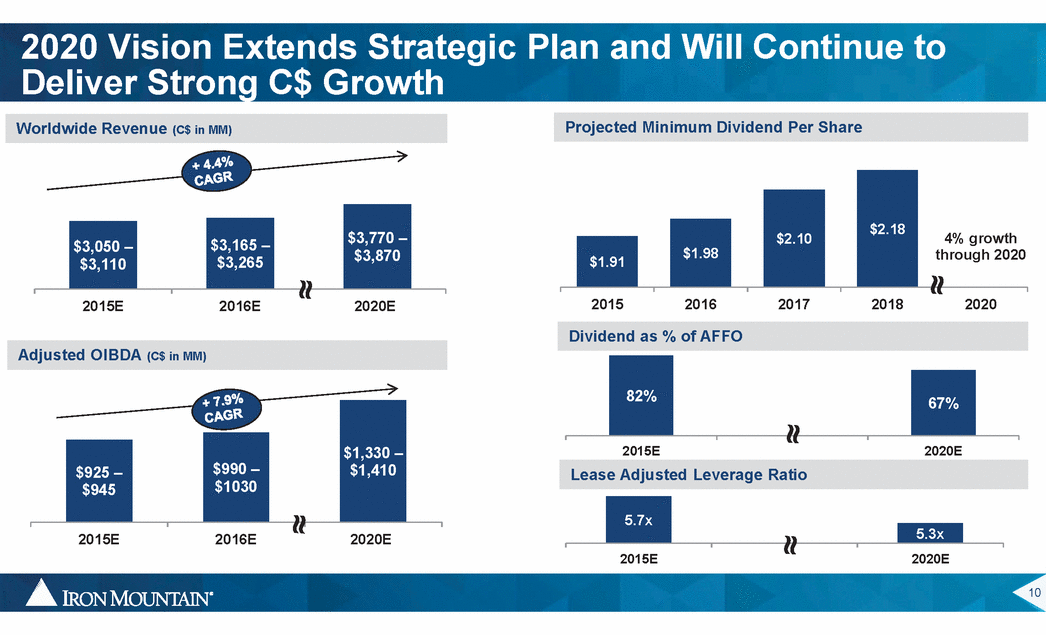
Recall Acquisition on Track Regulatory review underway ƒ Confident of achieving satisfactory outcome Targeted closing in Q1 2016 • • Significantly enhances financial performance ƒ Total expected synergies of $155M $110M to be recognized in 2017 Potential synergy upside primarily from real estate consolidation • • • 11
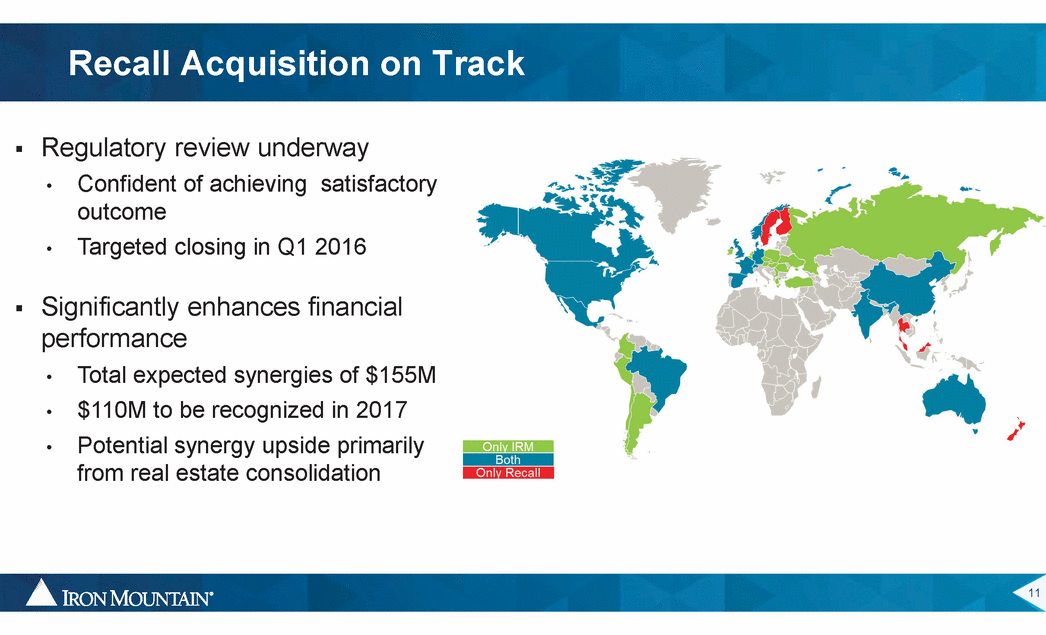
Recall Acquisition Performance Significantly Enhances Financial Worldwide Revenue (C$ in MM) 20 $1.91 $4,670 – $3,950 – $4,810 2015 2016 2017 2018 2020 $3,050 – $4,050 $3,110 2015 2016 2020 Adjusted OIBDA (C$ in MM) 2015E 2020E $1,725 – $1,825 $1,220 – $1270 $925 – $945 2015 2016 2020 2015E 2020E Assumes close on 01/01/2016 for Recall transaction 12 5.7x 4.9x Lease Adjusted Leverage Ratio 82% 69% Dividend as % of AFFO $2.35 4% Growth through 20 $2.20 $1.94 Projected Minimum Dividend per Share
Summary of Financial Roadmap 2015 – 2020 Disciplined Capital Spend on Maintenance, Non-Real Estate Investment and Racking Stabilized Service Gross Margin Improved SG&A Efficiency Growing Storage Revenues And Margins Consistent Contribution and Cash Flow Improvement Accretive Acquisitions, Real Estate and Adjacent Businesses Dividend Growth Per Share 13
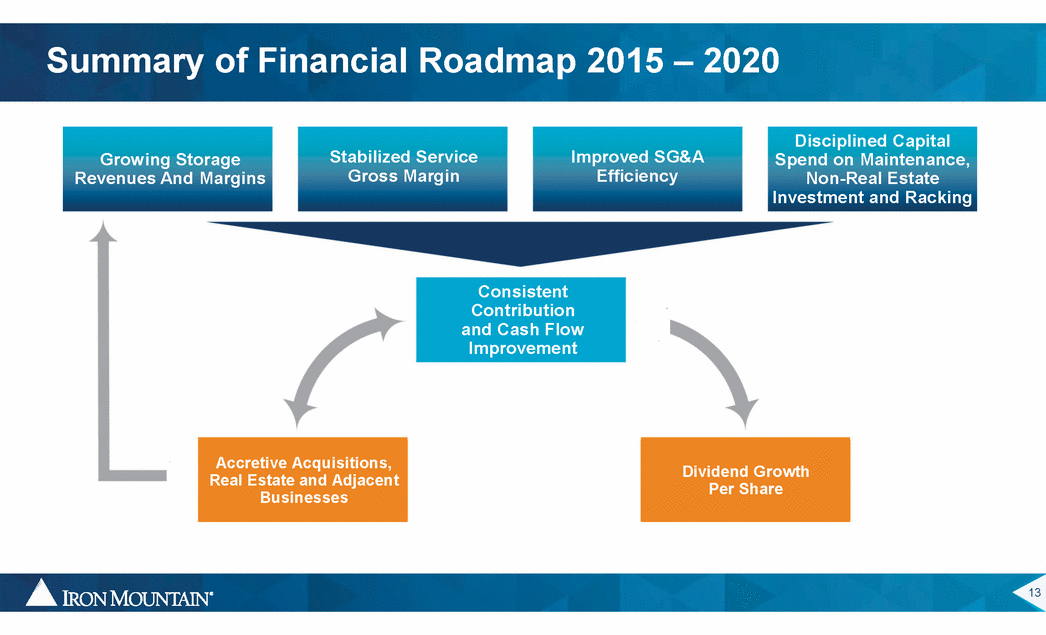
Growing Storage Revenues and Margins Total Internal Storage Rental Growth 3.1% 3.0% 2.8% Storage 61% of Total Revenue(1) Maintain annual growth of 2.5% to 3% through 2020 2011 2012 2013 2014 YTD Q3-15 Margin(2) Storage Gross 77.1% Storage 82% of Total Gross Profit(1) 76.6% 75.3% Modest annual growth, reach 79% by 2020 2011 2012 2013 2014 YTD Q3-15 (1) Data as of Q3-15 YTD (2) Includes rent expense and doesn’t include termination and permanent withdrawal fees. YTD Q3-15 Storage Gross Margin normalized for accounting adjustments made in Q3 2015 14 72.8%73.6% 2.1%2.2%
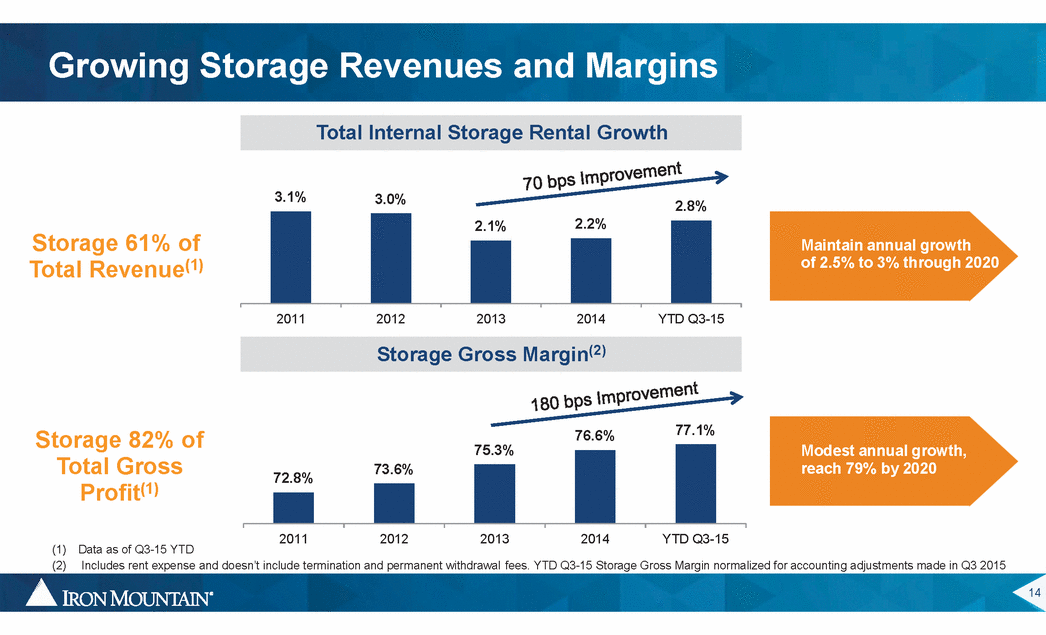
Stabilized Service Gross Margins Total Internal Service Revenue Growth Service 39% of Total Revenue(1) Improve growth to 1% - 2% annually 2016 through 2020 0.4% (0.7%) (0.6%) ƒ ƒ Archival trends moderate Maintain progress in scanning, projects and shredding (3.4%) (4.4%) 2012 2011 2013 2014 Q3-15 YTD Service 18% of Total Gross Profit(1) 2011 Service Gross Margin 2014 Service Gross Margin 2015E Service Gross Margin (1) Data as of Q3-15 YTD (2) 2015E Gross Margin represents exit rate for the year 15 40.9% 27.7% ~27%(2) Stabilization Drivers ƒLabor management ƒTransport efficiencies ƒUse of technology Primary Drivers of Decline ƒCosts not reduced in line with activity ƒMix shift to lower margin revenue ƒLower paper price
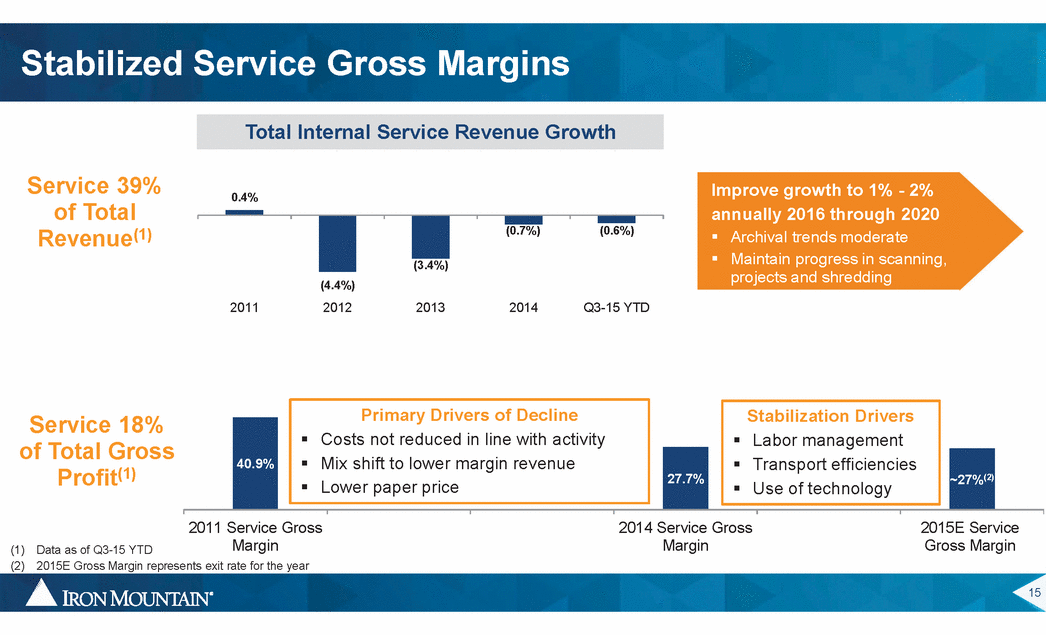
Worldwide Service Gross Margin Improvement Total Company Service Revenue (C$ in MM) Area / CAGR $1,181 $1,209 $1,195 - $1,205 $310 - $374 $310 - $335 Comp Service +4% Shred Paper +2% Shred Non-Paper -3% DMS +13% FY13 FY14 FY15E FY16E DM Core -9% RM Core 0% Total Service Gross Margin 2015(1) 27.0 – 27.5% 26.8% 26.1% 24.6% 2013 2014 2015E Q1 2015 Q2 2015 Q3 2015 Q4 2015E Note: Examples of Core Service include retrieval refile; complementary services include library moves and (1) Q3-15 service gross margins normalized for accounting adjustments Secure IT Asset Disposition 16 $320$350 17% 17% 19% 6% 7% 7% 15% 14% 14% 7% 9% 10% 16% 15% 13% 39% 39% 39% Total Service Gross Profit (C$ in MM)
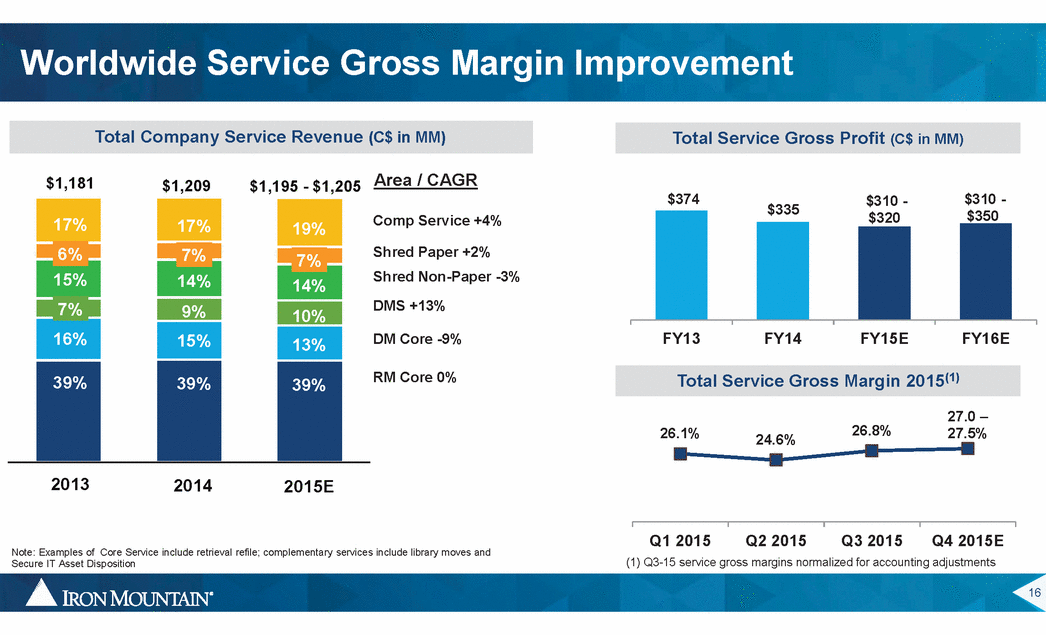
Improved SG&A Efficiencies – Transformation Cumulative SG&A Savings 30.0% $125 $100 28.0% $50 26.0% 2016 2017 2018 24.0% 22.0% ƒ Improvement driven by offshoring, outsourcing, reducing complexity, automation and procurement effectiveness Target levels of SG&A consistent with median level benchmarks for companies of similar scale Actions taken in Q3’15 generate run-rate savings in 2016 20.0% 2013 2014 2015E 2016E 2017E 2018E 2019E 2020E ƒ ƒ (1) Excludes REIT and Recall Costs 17 IRM Trend Transformation SG&A(1) as % of Revenue
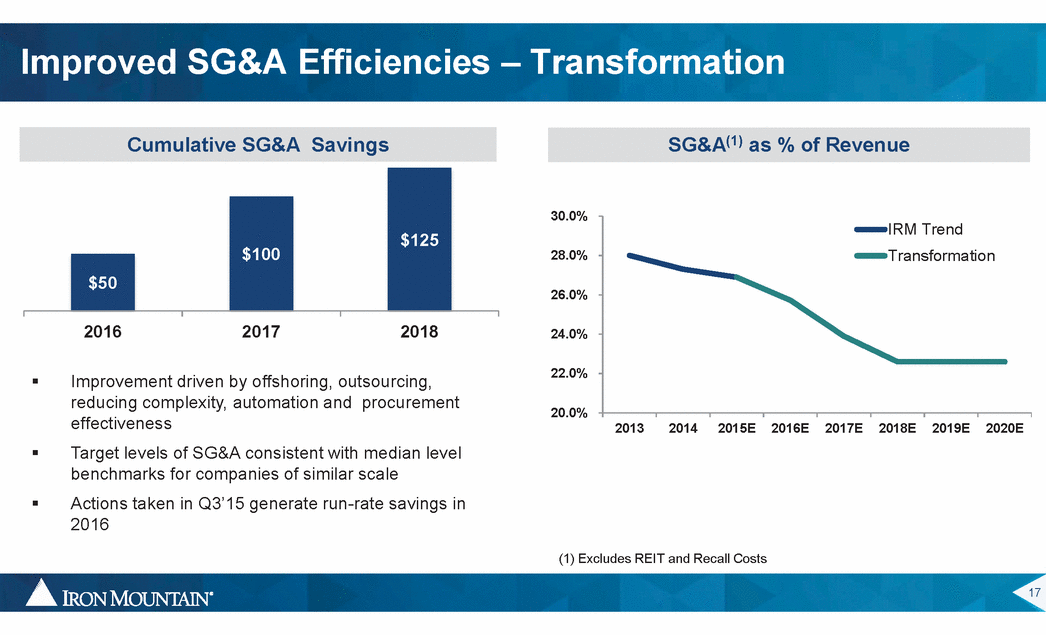
Attractive Discretionary Investment Opportunities DISCRETIONARY INVESTMENTS DEVELOPED AND EMERGING MARKETS BUSINESS ACQUISITIONS ADJACENT BUSINESSES REAL ESTATE Strong Stabilized Returns 18
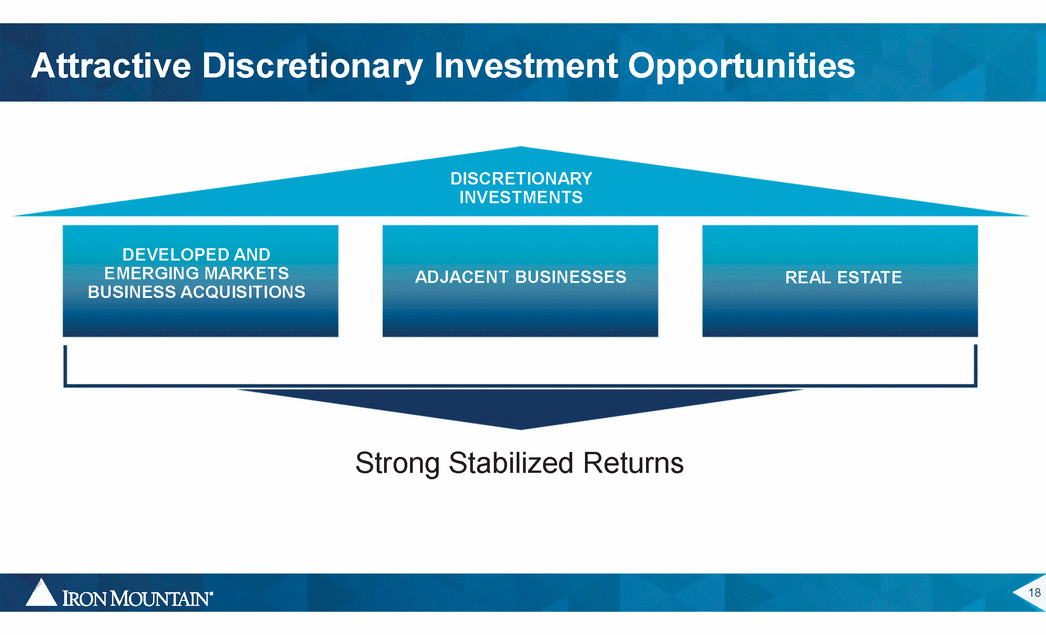
M&A in Emerging and Developed Growth and Returns Emerging Markets Acquisition Economics Markets Deliver Solid Strong returns, supports progress to increase exposure to higher growth markets Acquisition Spend/Yr. $100 MM Ongoing Topline Growth 10% + Storage Rental IRR 13% – 14% Developed Markets Acquisition Economics Acquisition Spend/Yr. $50 MM Tuck-in deals offer predictable return and quickly synergize Ongoing Topline Growth 2 -3% + Storage Rental IRR 11% – 13% Data reflects assumptions for 2016 - 2020 19
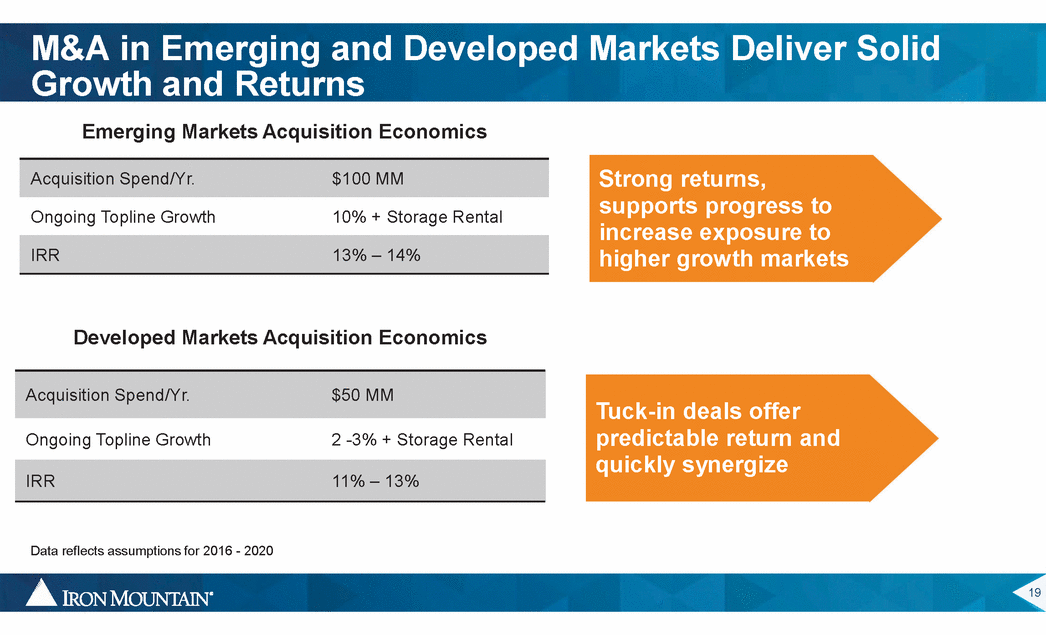
Investing for Profitable Growth: Emerging Markets ƒ Build high performance leadership teams ƒ Drive organic growth ƒ Invest in real estate and infrastructure ƒ Rapid execution M&A pipeline of rich 20 Cube Growth 14% Adj. OIBDA % 9% ROIC 4% Cube Growth 7% Adj. OIBDA % 33% ROIC 12%
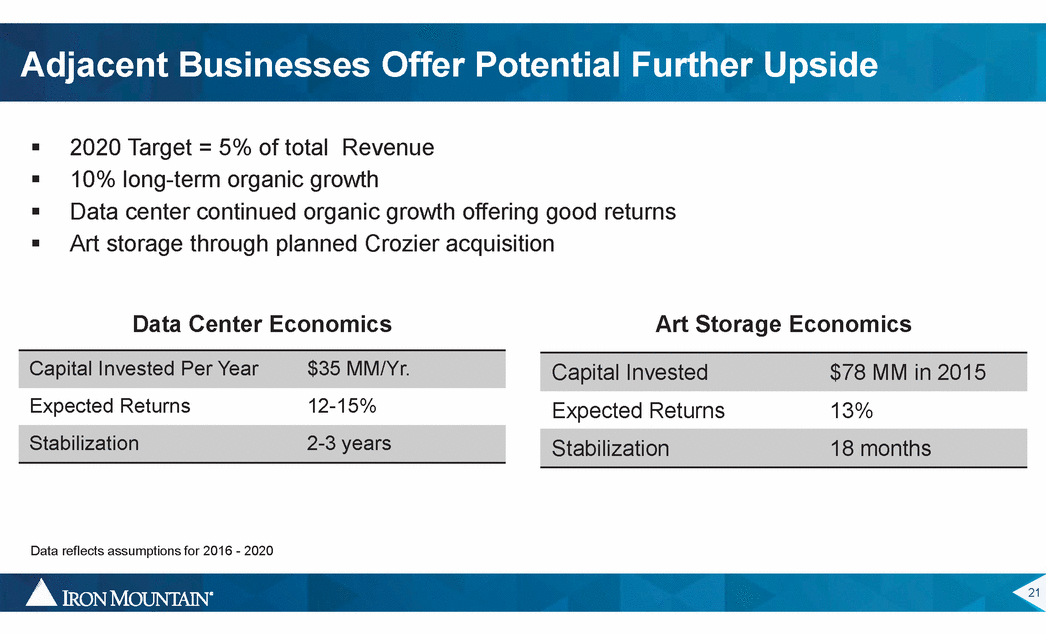
Adjacent Businesses Offer Potential Further Upside ƒ ƒ ƒ ƒ 2020 Target = 5% of total Revenue 10% long-term organic growth Data center continued organic growth offering good returns Art storage through planned Crozier acquisition Data Center Economics Art Storage Economics Capital Invested Per Year $35 MM/Yr. Expected Returns 12-15% Expected Returns 13% Stabilization 2-3 years Data reflects assumptions for 2016 - 2020 21 Stabilization18 months Capital Invested$78 MM in 2015
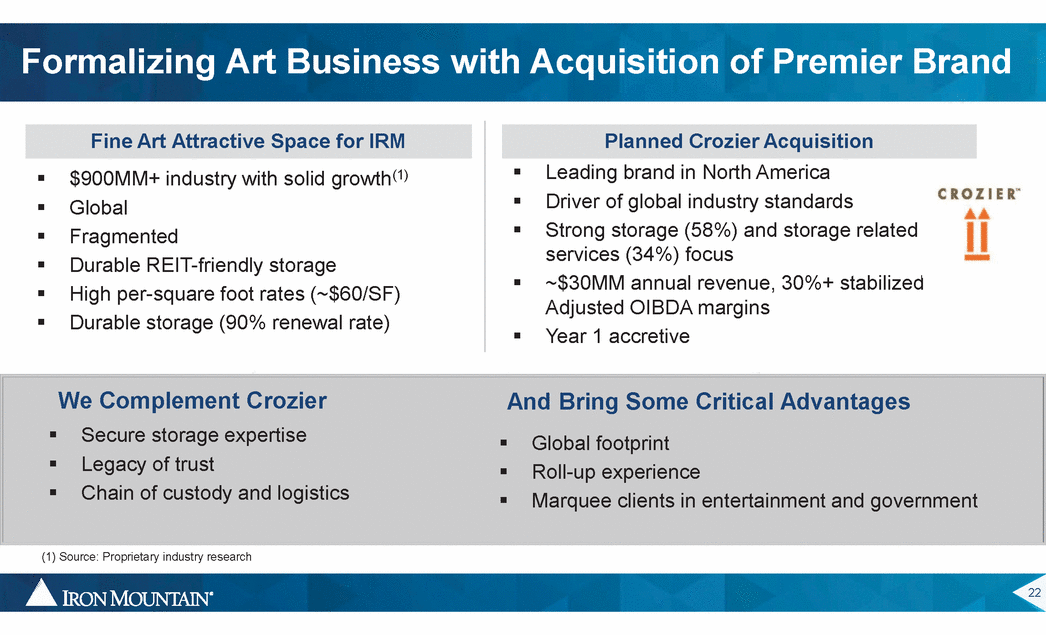
Formalizing Art Business with Acquisition of Premier Brand Fine Art Attractive Space for IRM ƒ ƒ ƒ Leading brand in North America Driver of global industry standards Strong storage (58%) and storage related services (34%) focus ~$30MM annual revenue, 30%+ stabilized Adjusted OIBDA margins Year 1 accretive $900MM+ industry with solid growth(1) Global Fragmented Durable REIT-friendly storage High per-square foot rates (~$60/SF) ƒ ƒ ƒ ƒ ƒ ƒ ƒ Durable storage (90% renewal rate) ƒ We Complement Crozier Secure storage expertise Legacy of trust Chain of custody and logistics And Bring Some Critical Advantages ƒ ƒ ƒ ƒ ƒ ƒ Global footprint Roll-up experience Marquee clients in entertainment and government (1) Source: Proprietary industry research 22 Planned Crozier Acquisition
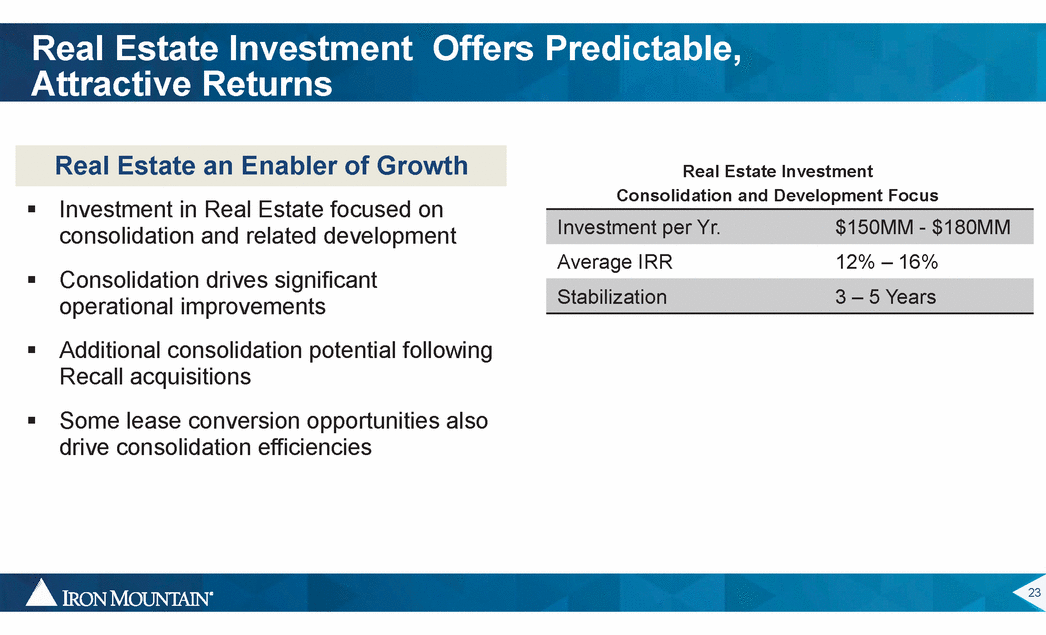
Real Estate Investment Attractive Returns Offers Predictable, Real Estate an Enabler of Growth Real Estate Investment Consolidation and Development Focus ƒ Investment in Real Estate focused on consolidation and related development Consolidation drives significant operational improvements Additional consolidation potential following Recall acquisitions Some lease conversion opportunities also drive consolidation efficiencies Average IRR 12% – 16% ƒ ƒ ƒ 23 Stabilization3 – 5 Years Investment per Yr.$150MM - $180MM
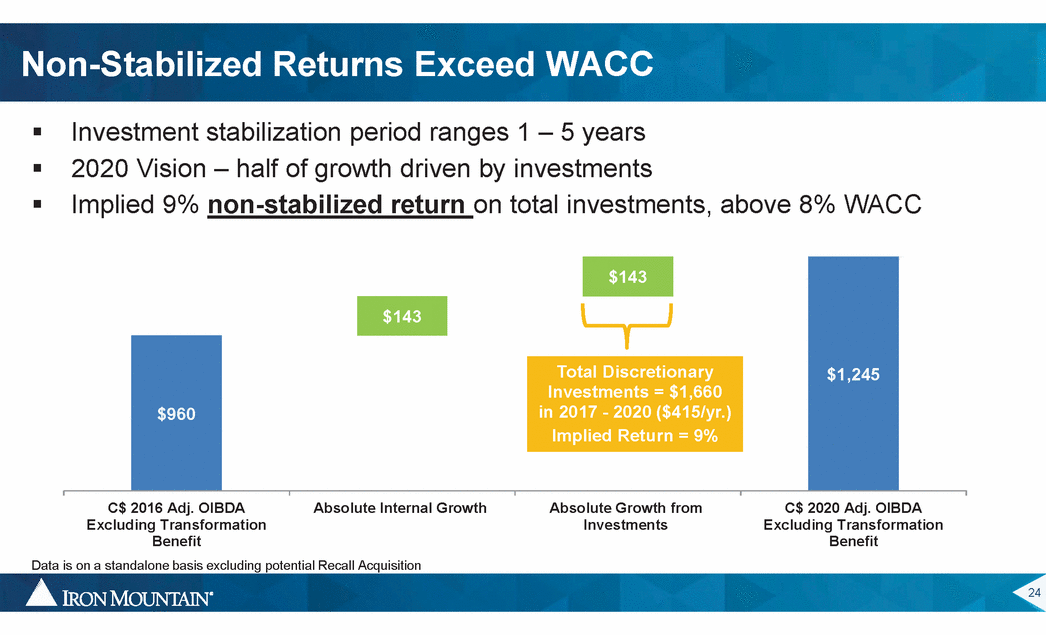
Non-Stabilized Returns Exceed WACC ƒ ƒ ƒ Investment stabilization period ranges 1 – 5 years 2020 Vision – half of growth driven by investments Implied 9% non-stabilized return on total investments, above 8% WACC C$ 2016 Adj. OIBDA Excluding Transformation Benefit Absolute Internal Growth Absolute Growth from Investments C$ 2020 Adj. OIBDA Excluding Transformation Benefit Data is on a standalone basis excluding potential Recall Acquisition 24 $143 $960 $1,245 Total Discretionary Investments = $1,660 in 2017 - 2020 ($415/yr.) Implied Return = 9% $143
Illustrative Benefit Flow Through from Acquisitions Year 1 Year 2 ~$17 Million / 50% benefit flow through ~$34 Million / 100% benefit flow through $34 MM in Revenues + Internal Growth at ~3% $13 MM in Adj. OIBDA (Stabilized) ~$3 Million / 15% Adj. OIBDA Margin ~$9 Million / 25% Adj. OIBDA Margin + Internal Growth at 35% Margin Assumptions: ƒ ƒ ƒ $100 MM investment in Year 1 (Jan 1 Investment) Assuming ~3X Rev Multiple Benefit flow through on a cumulative basis 25 ~$13 Million / 35% Adj. OIBDA Margin ~$11 Million / 30% Adj. OIBDA Margin Year 5 Year 4 Year 3
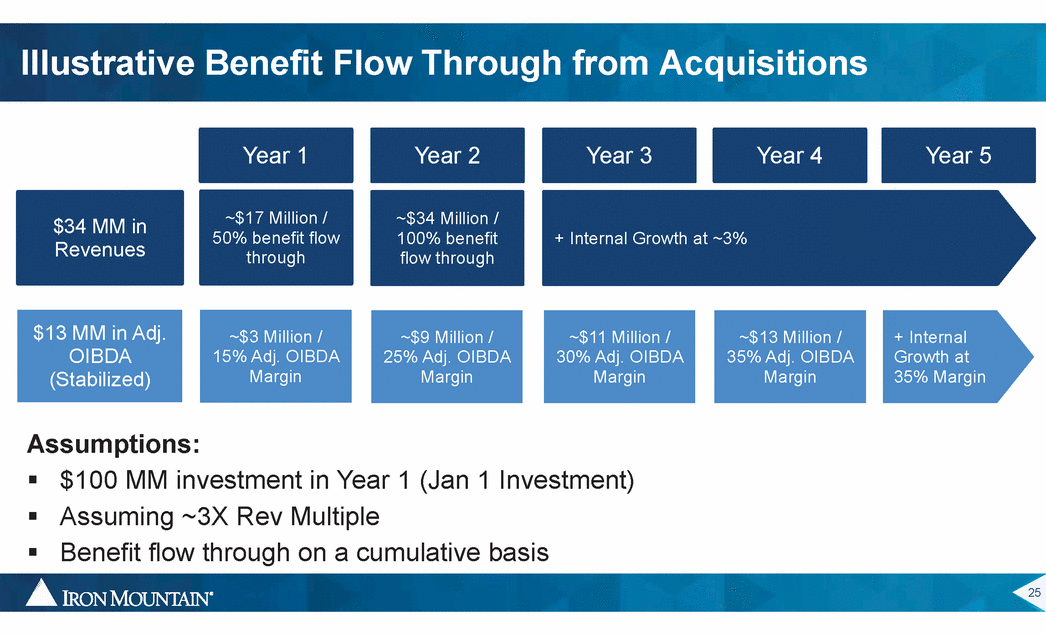
IRM Standalone Cash Available for Dividend and Discretionary Growth Investments Enhanced by 2020 Vision Cash Available for Dividends and Discretionary Growth Investments – Standalone $760 $485 $15 $405 $(5) 2015E Cash for Investment 2016E Organic Growth Racking 2020E Dividend R$ Adjustment Numbers represent midpoint of guidance range 26 $45 $545 $520 $35 $420 $90 $105 $15
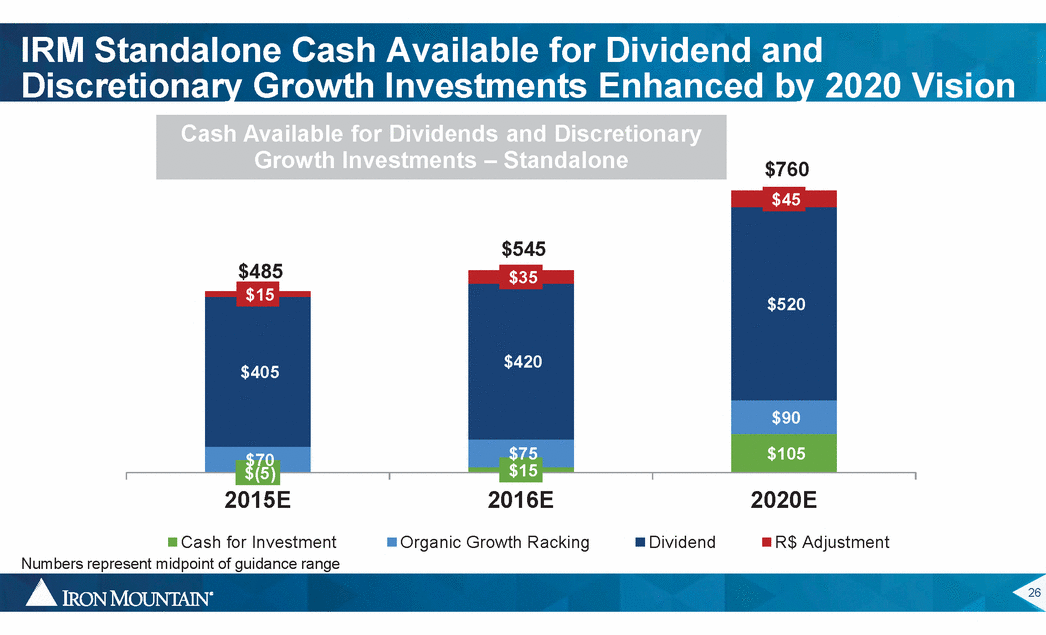
IRM Standalone with Investments Drives Good Dividend Growth Minimum Projected Dividend Per Share (Standalone) $2.18 $2.10 2015E 2016E 2017E 2018E 2020E Dividend/ AFFO 82% 77% 72% 67% 67% Shares Outstanding 213 214 215 216 218 Lease Adjusted Leverage Ratio 5.7X 5.7X 5.5X 5.3X 5.3X Total Discretionary Investments – Debt Financed ~$250 ~$365 ~$415 ~$415 ~$415 27 4% Growth Through 2020 $1.98 $1.91
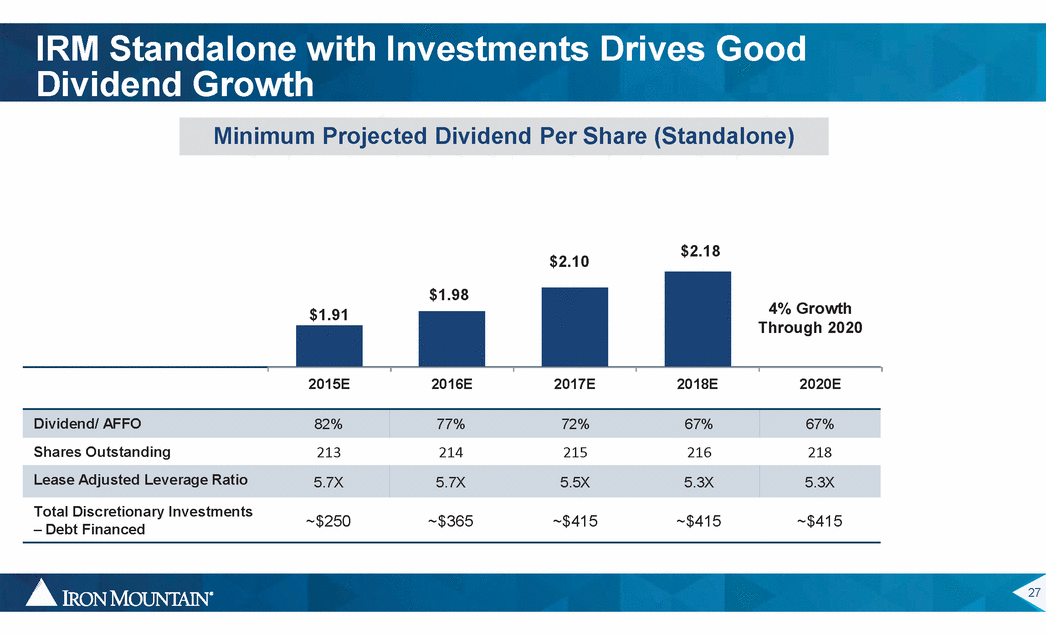
Cash Flow Including Recall Supports Further Increases in Dividends Per Share and Partially Funds Discretionary Growth Investments Cash Available for Dividends and Discretionary Growth Investments – Standalone $1,000 $760 $45 $545 $485 $35 $15 $15 $520 $420 $405 $90 $105 $15 $(5) 2015E 2016E 2020E 2015E 2016E 2020E Numbers represent midpoint of guidance range (1) Assumes 01/01/2016 close of Recall transaction. Excludes one-time costs associated with transaction but includes interest expense associated with financing of these costs 28 $45 $680 $700 $35 $485 $528 $405 $105 $150 $90 $70 $27 $(5) Cash Available for Dividends and Discretionary Growth Investments – With Recall(1)
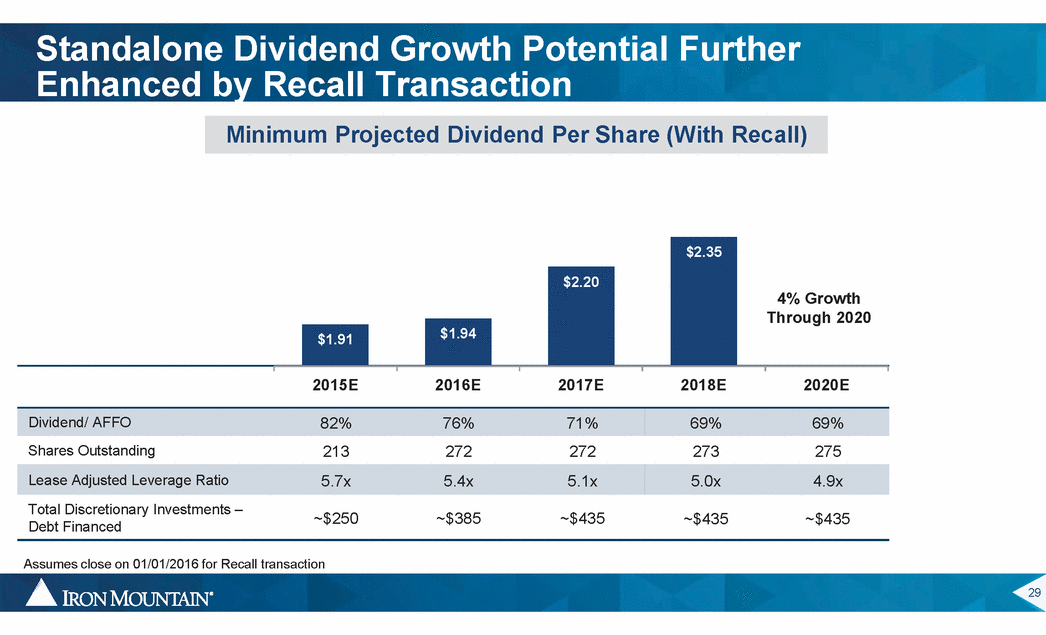
Standalone Dividend Growth Potential Further Enhanced by Recall Transaction Minimum Projected Dividend Per Share (With Recall) 2015E 2016E 2017E 2018E 2020E Dividend/ AFFO 82% 76% 71% 69% 69% Shares Outstanding 213 272 272 273 275 Lease Adjusted Leverage Ratio 5.7x 5.4x 5.1x 5.0x 4.9x Total Discretionary Investments – Debt Financed ~$250 ~$385 ~$435 ~$435 ~$435 Assumes close on 01/01/2016 for Recall transaction 29 $2.35 4% Growth Through 2020 $2.20 $1.91 $1.94
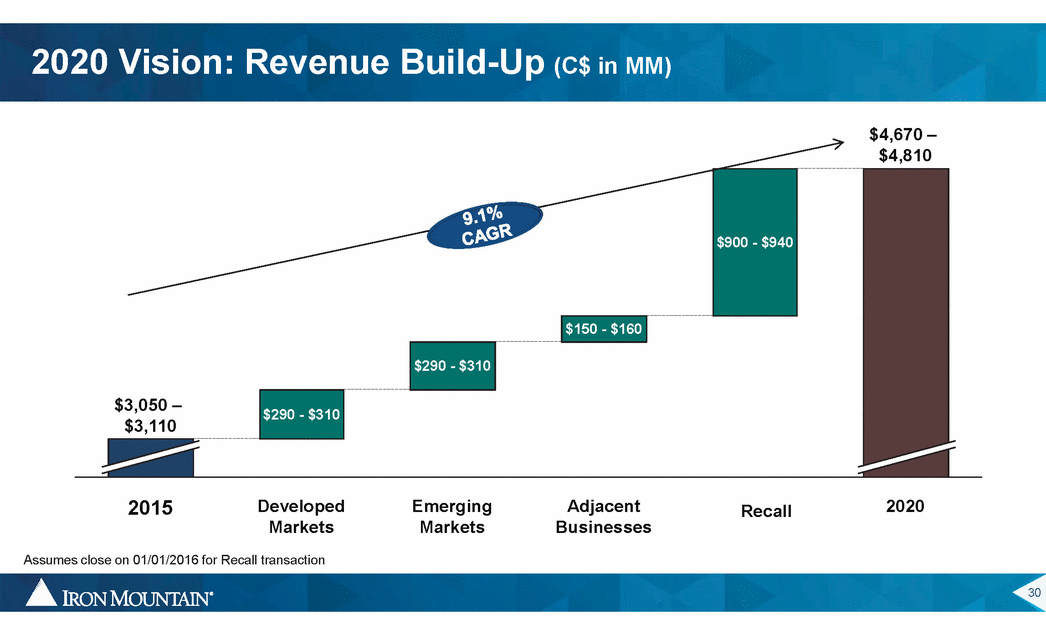
2020 Vision: Revenue Build-Up (C$ in MM) $4,670 – $4,810 2015 Developed Markets Emerging Markets Adjacent Businesses 2020 Recall Assumes close on 01/01/2016 for Recall transaction 30 $900 - $940 $150 - $160 $290 - $310 $3,050 – $3,110 $290 - $310
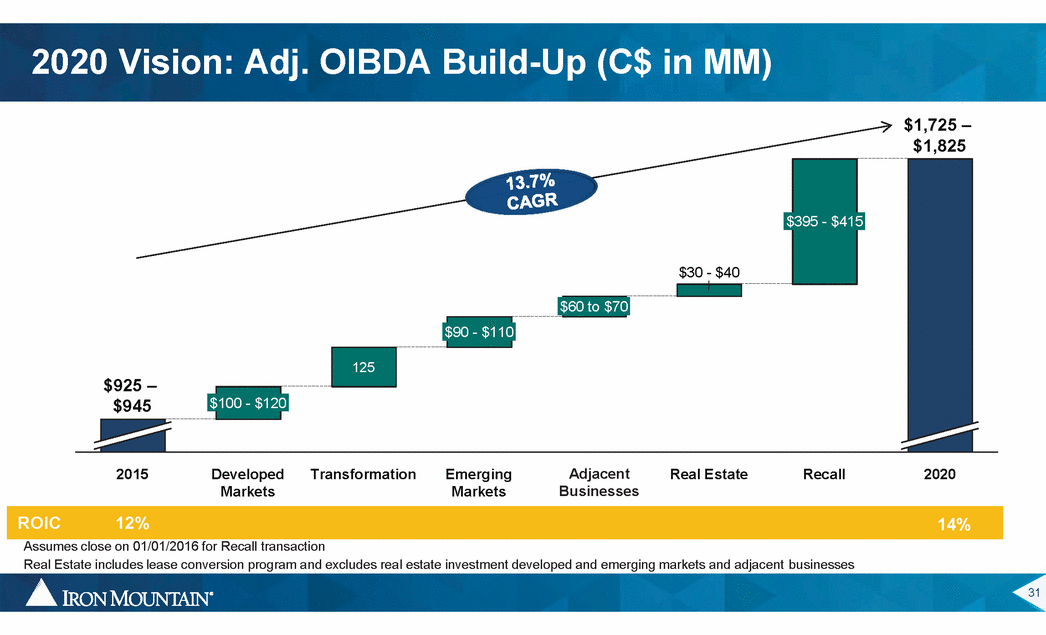
2020 Vision: Adj. OIBDA Build-Up (C$ in MM) $1,725 – $1,825 $415 $60 to $70 $90 - $110 $925 – $120 Adjacent Businesses 2015 Developed Markets Transformation Emerging Markets Real Estate Recall 2020 ROIC 12% 14% Assumes close on 01/01/2016 for Recall transaction Real Estate includes lease conversion program and excludes real estate investment developed and emerging markets and adjacent businesses 31 $ 395 - $30 - $40 125 $945 $ 100 -
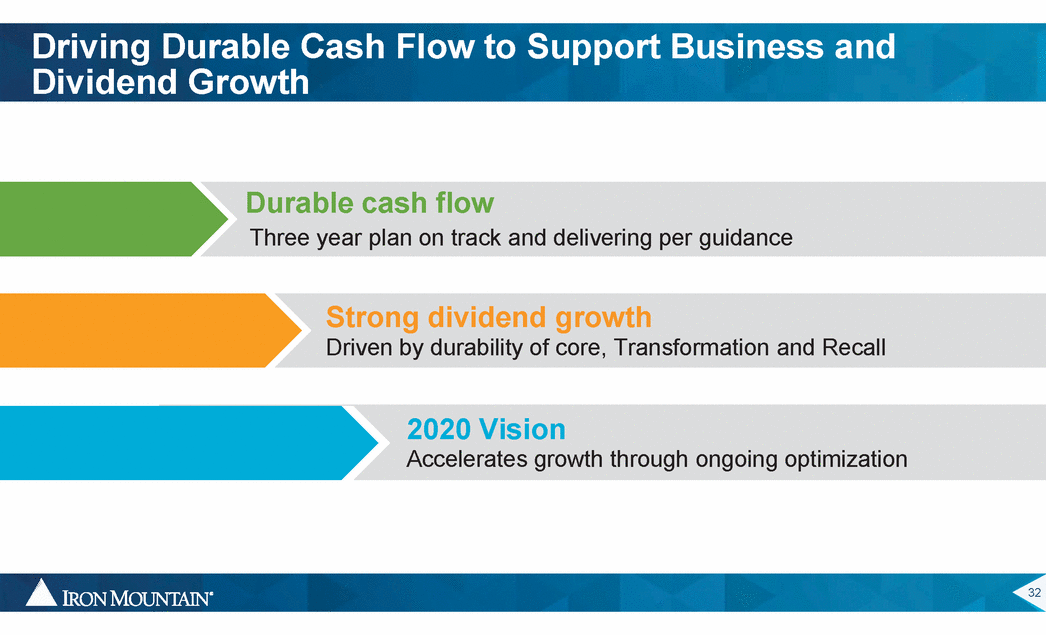
Driving Durable Cash Flow to Support Business and Dividend Growth Durable cash flow Three year plan on track and delivering per guidance Strong dividend growth Driven by durability of core, Transformation and Recall 2020 Vision Accelerates growth through ongoing optimization 32
Appendix © 2015 Iron Mountain Incorporated. All rights reserved. Iron Mountain and the design of the mountain are registered trademarks of Iron Mountain Incorporated. All other trademarks and registered trademarks are the property of their respective owners.

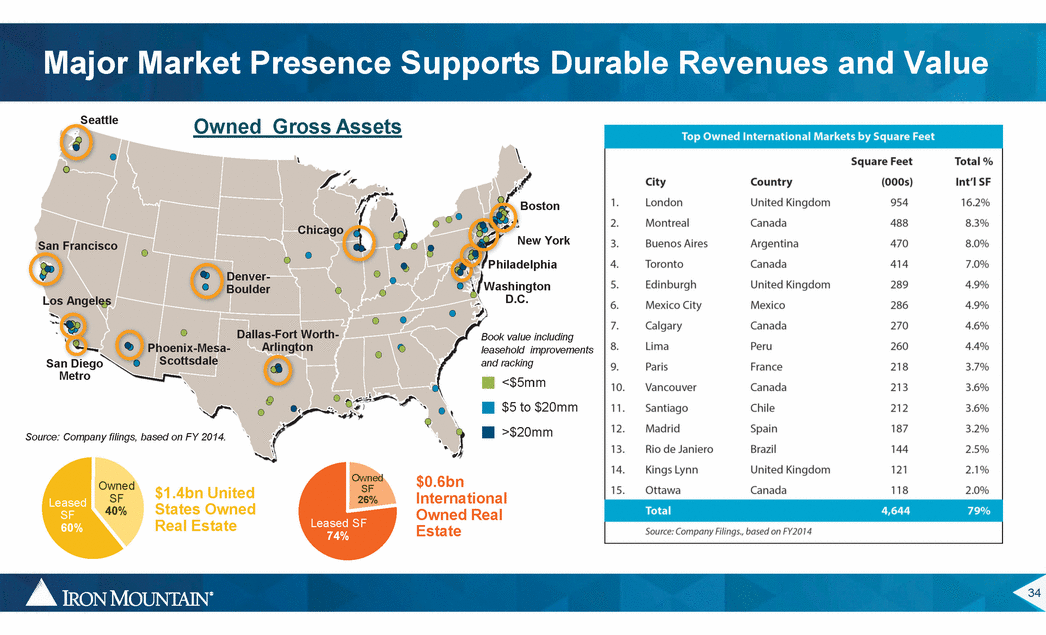
Major Market Presence Supports Durable Revenues and Value Seattle OwnedGross Assets Boston Chicago New York San Francisco Philadelphia Washington D.C. Denver-Boulder Los Angeles Dallas-Fort Worth-Book value including leasehold improvements and racking Arlington Phoenix-Mesa-Scottsdale San Diego Metro <$5mm $5 to $20mm >$20mm Source: Company filings, based on FY 2014. Owned SF 26% $0.6bn International Owned Real Estate Owned SF 40% $1.4bn United States Owned Real Estate 34
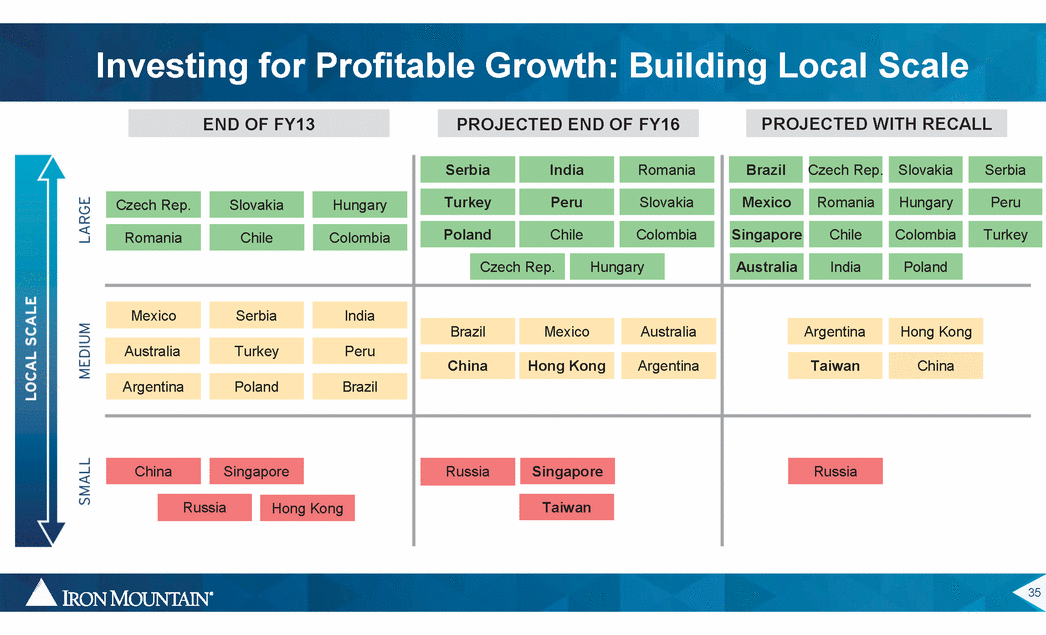
Investing for Profitable Growth: Building Local Scale END OF FY13 Serbia India Romania Brazil Czech Rep. Slovakia Serbia Turkey Peru Slovakia Mexico Romania Hungary Peru Czech Rep. Slovakia Hungary Poland Chile Colombia Singapore Chile Colombia Turkey Romania Chile Colombia Czech Rep. Hungary Australia India Poland Mexico Serbia India Brazil Mexico Australia Argentina Hong Kong Australia Turkey Peru China Hong Kong Argentina Taiwan China Argentina Poland Brazil China Singapore Russia Singapore Russia Russia Taiwan Hong Kong 35 PROJECTED END OF FY16 PROJECTED WITH RECALL
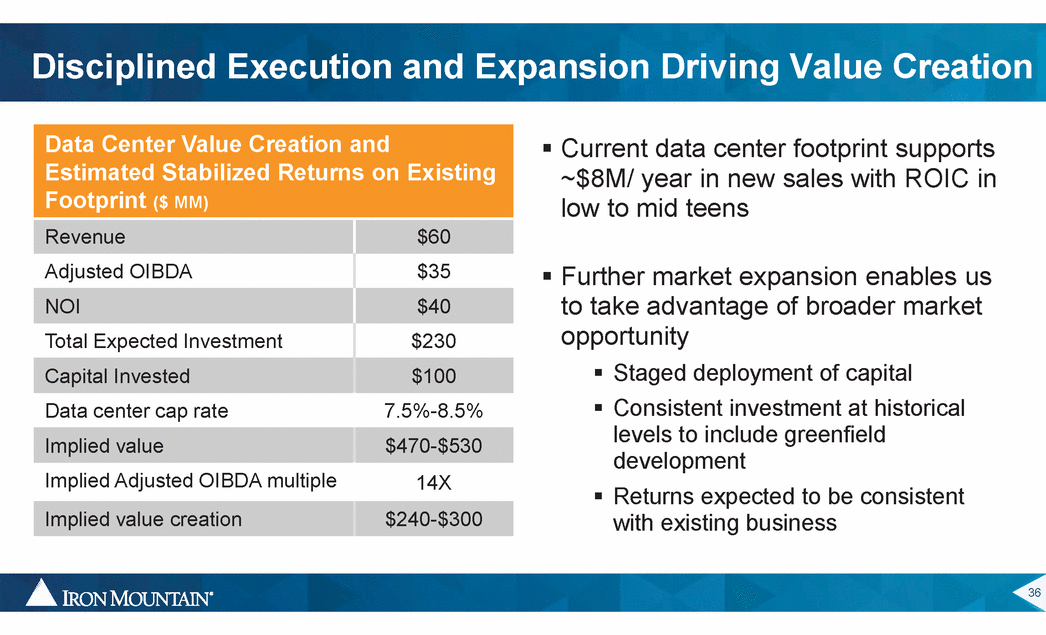
Disciplined Execution and Expansion Driving Value Creation Data Center Value Creation and ƒ Current data center footprint supports ~$8M/ year in new sales with ROIC in low to mid teens Estimated Stabilized Returns on Existing Footprint ($ MM) ƒ Further market expansion enables us to take advantage of broader market opportunity ƒ ƒ Staged deployment of capital Consistent investment at historical levels to include greenfield development Returns expected to be consistent with existing business ƒ 36 Revenue Adjusted OIBDA NOI Total Expected Investment Capital Invested Data center cap rate Implied value Implied Adjusted OIBDA multiple Implied value creation $60 $35 $40 $230 $100 7.5%-8.5% $470-$530 14X $240-$300
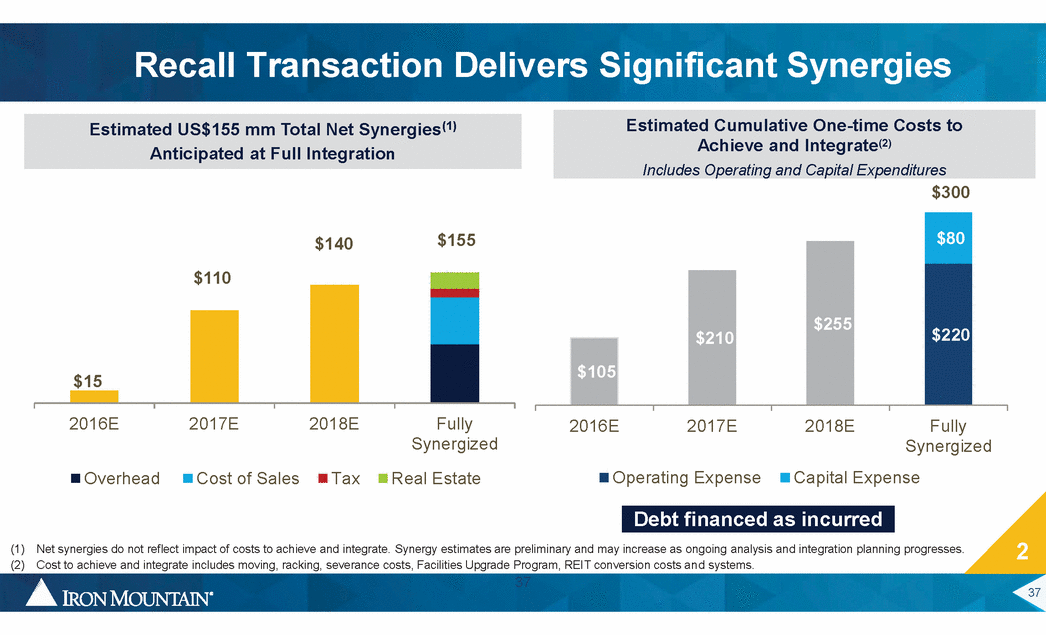
Recall Transaction Delivers Significant Synergies Estimated US$155 mm Total Net Synergies(1) Anticipated at Full Integration $300 $155 $140 2016E 2017E 2018E Fully Synergized Real Estate 2016E 2017E 2018E Fully Synergized Operating Expense Capital Expense Overhead Cost of Sales Tax 2 37 (1) Net synergies do not reflect impact of costs to achieve and integrate. Synergy estimates are preliminary and may increase as ongoing analysis and integration planning progresses. (2) Cost to achieve and integrate includes moving, racking, severance costs, Facilities Upgrade Program, REIT conversion costs and systems. 37 Debt financed as incurred $110 $15 $80 $255 $220 $210 $105 Estimated Cumulative One-time Costs to Achieve and Integrate(2) Includes Operating and Capital Expenditures
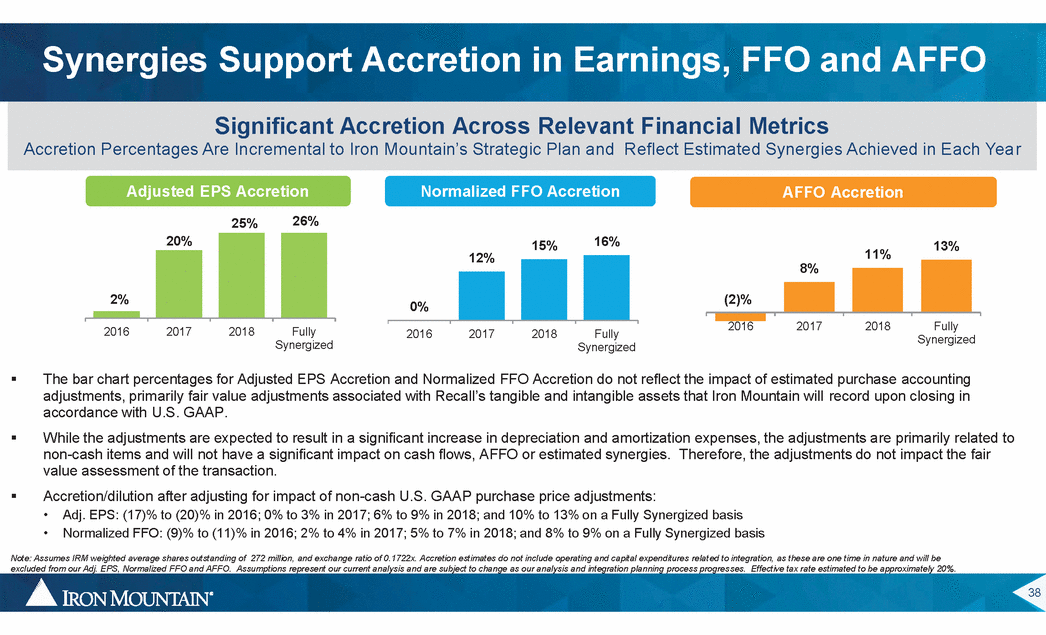
Synergies Support Accretion in Earnings, FFO and AFFO Significant Accretion Across Relevant Financial Metrics Accretion Percentages Are Incremental to Iron Mountain’s Strategic Plan and Reflect Estimated Synergies Achieved in Each Year Adjusted EPS Accretion Normalized FFO Accretion AFFO Accretion 26% 25% 20% 16% 15% 13% 11% 12% 8% 2% 2016 2017 2018 Fully Synergized 2016 2017 2018 Fully Synergized 2016 2017 2018 Fully Synergized ƒ The bar chart percentages for Adjusted EPS Accretion and Normalized FFO Accretion do not reflect the impact of estimated purchase accounting adjustments, primarily fair value adjustments associated with Recall’s tangible and intangible assets that Iron Mountain will record upon closing in accordance with U.S. GAAP. While the adjustments are expected to result in a significant increase in depreciation and amortization expenses, the adjustments are primarily related to non-cash items and will not have a significant impact on cash flows, AFFO or estimated synergies. Therefore, the adjustments do not impact the fair value assessment of the transaction. Accretion/dilution after adjusting for impact of non-cash U.S. GAAP purchase price adjustments: ƒ ƒ • • Adj. EPS: (17)% to (20)% in 2016; 0% to 3% in 2017; 6% to 9% in 2018; and 10% to 13% on a Fully Synergized basis Normalized FFO: (9)% to (11)% in 2016; 2% to 4% in 2017; 5% to 7% in 2018; and 8% to 9% on a Fully Synergized basis Note: Assumes IRM weighted average shares outstanding of 272 million, and exchange ratio of 0.1722x. Accretion estimates do not include operating and capital expenditures relat ed to integration, as these are one time in nature and will be excluded from our Adj. EPS, Normalized FFO and AFFO. Assumptions represent our current analysis and are subject to change as our analysis and integration planning process progres ses. Effective tax rate estimated to be approximately 20%. 38 (2)% 0%
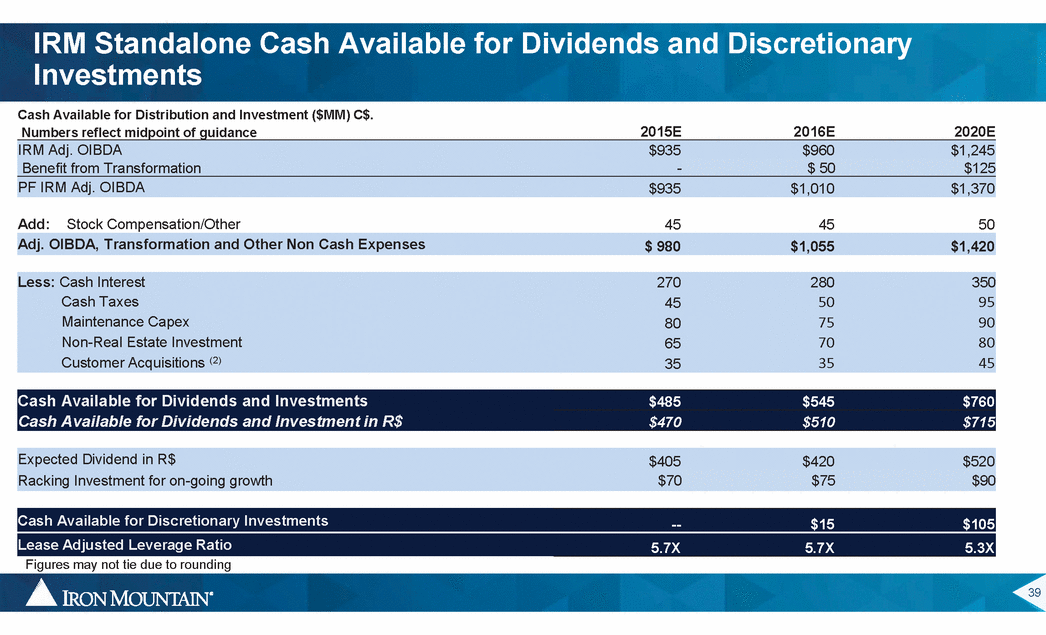
IRM Standalone Cash Available Investments Cash Available for Distribution and Investment ($MM) C$. Numbers reflect midpoint of guidance for Dividends and Discretionary 2015E 2016E 2020E IRM Adj. OIBDA $935 $960 $1,245 Add: Stock Compensation/Other 45 45 50 Adj. OIBDA, Transformation and Other Non Cash Expenses $ 980 $1,055 $1,420 Less: Cash Interest Cash Taxes Maintenance Capex Non-Real Estate Investment Customer Acquisitions (2) 270 45 80 65 35 280 50 75 70 35 350 95 90 80 45 Cash Available for Dividends and Investments Cash Available for Dividends and Investment in R$ $485 $545 $760 $470 $510 $715 Expected Dividend in R$ $405 $420 $520 Racking Investment for on-going growth $70 Cash Available for Discretionary Investments --$15 $105 Lease Adjusted Leverage Ratio 5.7X 5.7X 5.3X Figures may not tie due to rounding 39 $75$90 Benefit from Transformation-$ 50$125 PF IRM Adj. OIBDA$935 $1,010$1,370
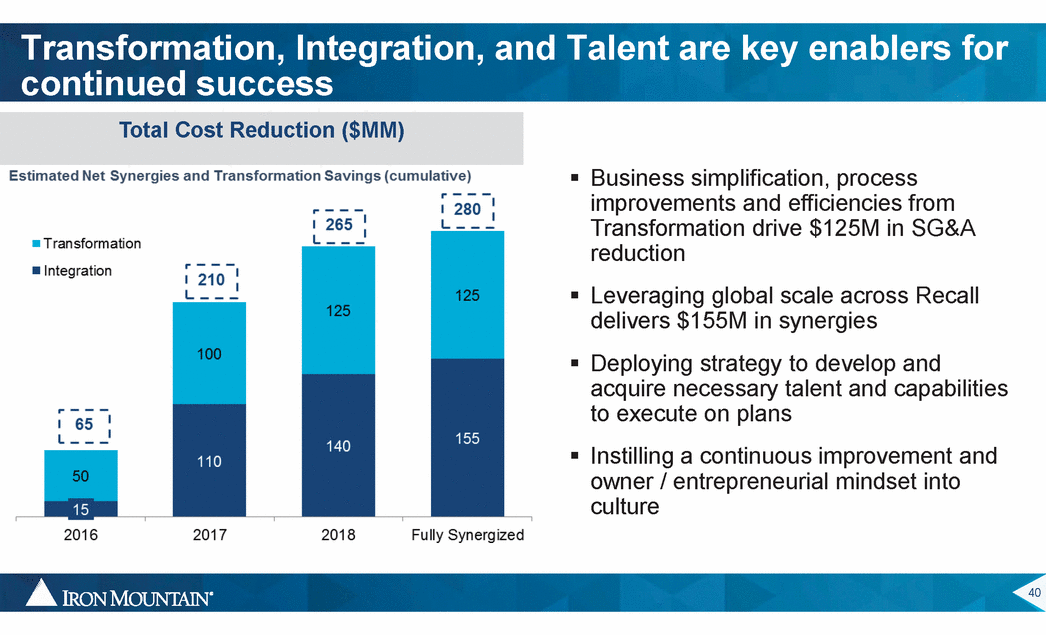
Transformation, Integration, continued success and Talent are key enablers for Total Cost Reduction ($MM) ƒ Business simplification, process improvements and efficiencies from Transform reductio tion drive $125M in SG&A ƒ Leveraging global scale across Recall delivers $ Deploying acquire n 55M in synergies strategy to develop and cessary talent and capabilities ƒ to execute on plans Instilling a continuous improvement and owner / entrepreneurial mindset into culture ƒ 40
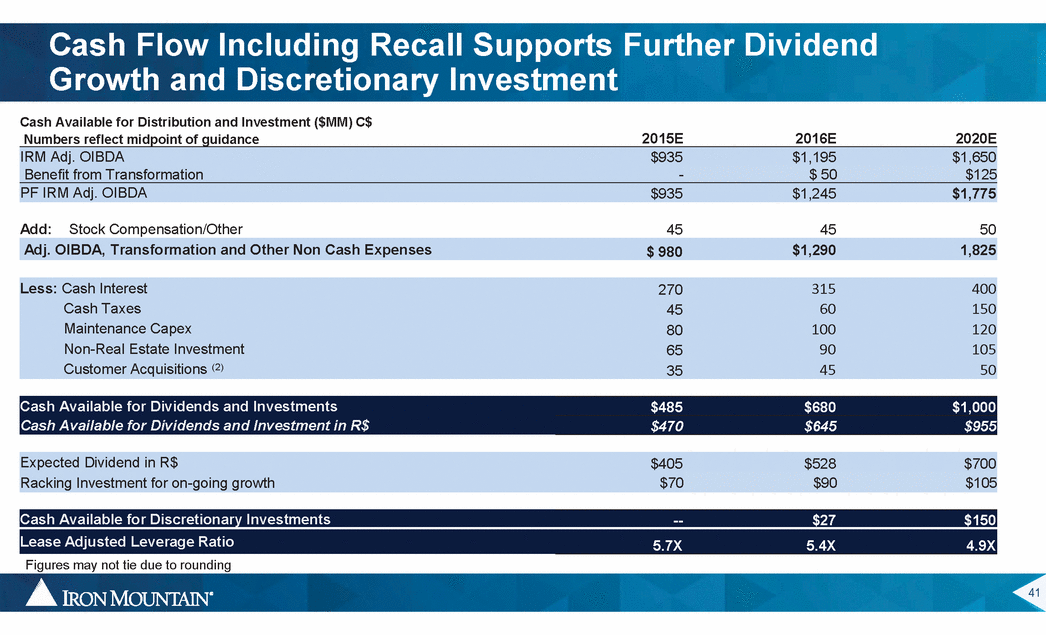
Cash Flow Including Recall Supports Further Dividend Growth and Discretionary Cash Available for Distribution and Investment ($MM) C$ Numbers reflect midpoint of guidance Investment 2015E 2016E 2020E IRM Adj. OIBDA $935 $1,195 $1,650 PF IRM Adj. OIBDA $935 $1,245 $1,775 Add: Stock Compensation/Other 45 45 50 Adj. OIBDA, Transformation and Other Non Cash Expenses $1,290 1,825 $ 980 Less: Cash Interest 315 60 100 90 45 400 150 120 105 50 270 45 80 65 35 Cash Taxes Maintenance Capex Non-Real Estate Investment Customer Acquisitions (2) Cash Available for Dividends and Investments Cash Available for Dividends and Investment in R$ $485 $680 $1,000 $470 $645 $955 Expected Dividend in R$ $405 $528 $700 Racking Investment for on-going growth $70 $90 $105 Cash Available for Discretionary Investments --$27 $150 Lease Adjusted Leverage Ratio 5.7X 5.4X 4.9X Figures may not tie due to rounding 41 Benefit from Transformation-$ 50$125
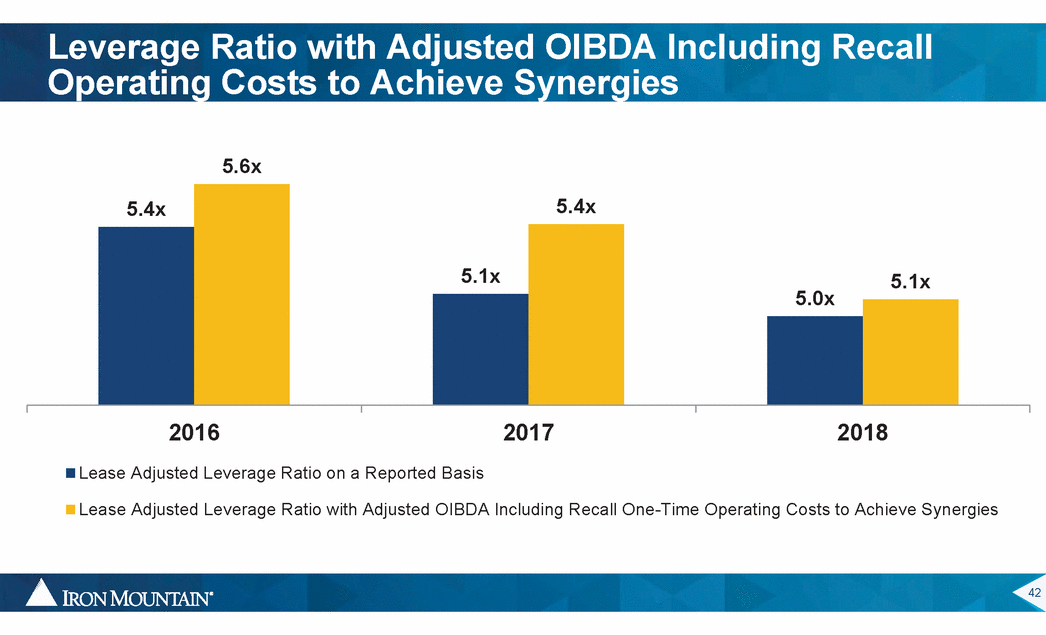
Leverage Ratio with Adjusted OIBDA Including Recall Operating Costs to Achieve Synergies 5.6x 5.4x 5.4x 5.0x 2016 Lease Adjusted Leverage Ratio on a Reported Basis 2017 2018 Lease Adjusted Leverage Ratio with Adjusted OIBDA Including Recall One-Time Operating Costs to Achieve Synergies 42 5.1x 5.1x
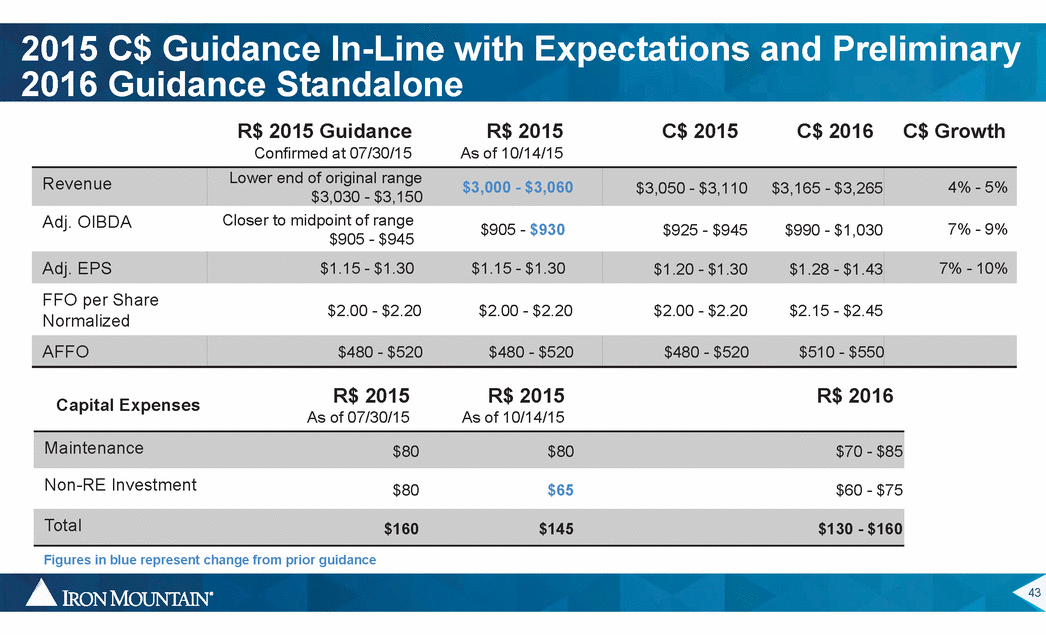
2015 C$ Guidance In-Line with Expectations 2016 Guidance Standalone and Preliminary R$ 2015 Guidance Confirmed at 07/30/15 R$ 2015 As of 10/14/15 C$ 2015 C$ 2016 C$ Growth Lower end of original range $3,030 - $3,150 Revenue $3,000 - $3,060 4% - 5% $3,050 - $3,110 $3,165 - $3,265 Closer to midpoint of range $905 - $945 Adj. OIBDA $905 - $930 7% - 9% $925 - $945 $990 - $1,030 Adj. EPS $1.15 - $1.30 $1.15 - $1.30 7% - 10% $1.20 - $1.30 $1.28 - $1.43 FFO per Share Normalized $2.00 - $2.20 $2.00 - $2.20 $2.00 - $2.20 $2.15 - $2.45 AFFO $480 - $520 $480 - $520 $480 - $520 $510 - $550 R$ 2015 As of 07/30/15 R$ 2015 As of 10/14/15 R$ 2016 Capital Expenses Maintenance $80 $80 $70 - $85 Non-RE Investment $80 $65 $60 - $75 Total $160 $145 $130 - $160 Figures in blue represent change from prior guidance 43
