Attached files
| file | filename |
|---|---|
| 8-K - 8-K - Conifer Holdings, Inc. | a15-22783_18k.htm |
Exhibit 99.1
Third Quarter 2015 Investor Conference Call November 11, 2015 Nasdaq: CNFR
Safe Harbor Statement This presentation contains “forward-looking” statements within the meaning of Section 27A of the Securities Act of 1933, as amended, and Section 21E of the Securities Exchange Act of 1934, as amended, that are based on our management’s beliefs and assumptions and on information currently available to management. These forward-looking statements include, without limitation, statements regarding our industry, business strategy, plans, goals and expectations concerning our market position, product expansion, future operations, margins, profitability, future efficiencies, and other financial and operating information. When used in this discussion, the words “may,” “believes,” “intends,” “seeks,” “anticipates,” “plans,” “estimates,” “expects,” “should,” “assumes,” “continues,” “potential,” “could,” “will,” “future” and the negative of these or similar terms and phrases are intended to identify forward-looking statements. Forward-looking statements involve known and unknown risks, uncertainties, inherent risks and other factors that may cause our actual results, performance or achievements to be materially different from any future results, performance or achievements expressed or implied by the forward-looking statements. Forward-looking statements represent our management’s beliefs and assumptions only as of the date of this presentation. Our actual future results may be materially different from what we expect due to factors largely outside our control, including the occurrence of severe weather conditions and other catastrophes, the cyclical nature of the insurance industry, future actions by regulators, our ability to obtain reinsurance coverage at reasonable rates and the effects of competition. These and other risks and uncertainties associated with our business are described in the prospectus included in our registration statement on Form S-1 filed with the Securities and Exchange Commission (SEC) on August 12, 2015, including under the heading “Risk Factors,” which should be read in conjunction with this presentation. The company and subsidiaries operate in a dynamic business environment, and therefore the risks identified are not meant to be exhaustive. Risk factors change and new risks emerge frequently. Except as required by law, we assume no obligation to update these forward-looking statements publicly, or to update the reasons actual results could differ materially from those anticipated in the forward-looking statements, even if new information becomes available in the future. 1
Welcome to Our Third Quarter Call: Introduction Broad & Flexible Underwriting Platform Poised for Growth Experienced Management Team & Underwriters with Deep Industry Knowledge Specialty Products to Drive Growth in Underserved Niche Markets Execution of the Business Plan 2
Poised for Growth Broad & Flexible Underwriting Platform Poised for Growth Experienced Management Team & Underwriters with Deep Industry Knowledge Specialty Products to Drive Growth in Underserved Niche Markets Execution of the Business Plan 3
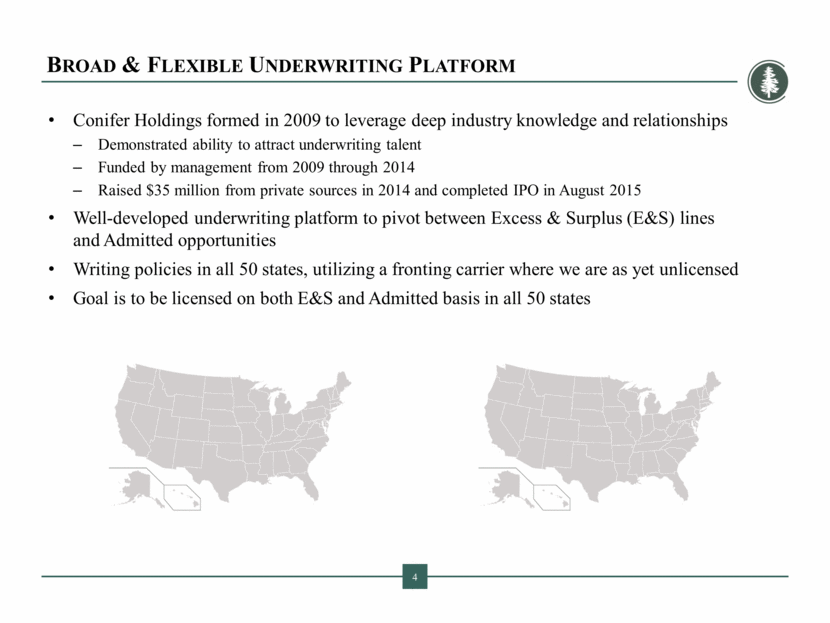
Broad & Flexible Underwriting Platform Conifer Holdings formed in 2009 to leverage deep industry knowledge and relationships Demonstrated ability to attract underwriting talent Funded by management from 2009 through 2014 Raised $35 million from private sources in 2014 and completed IPO in August 2015 Well-developed underwriting platform to pivot between Excess & Surplus (E&S) lines and Admitted opportunities Writing policies in all 50 states, utilizing a fronting carrier where we are as yet unlicensed Goal is to be licensed on both E&S and Admitted basis in all 50 states 4
Broad & Flexible Underwriting Platform Poised for Growth Experienced Management Team & Underwriters with Deep Industry Knowledge Specialty Products to Drive Growth in Underserved Niche Markets Execution of the Business Plan Experienced Management Team 5
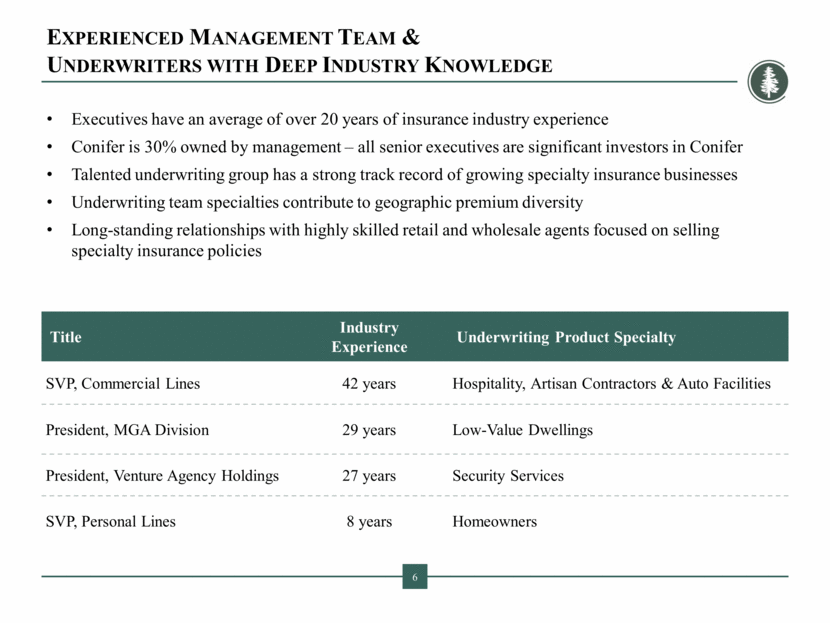
Experienced Management Team & Underwriters with Deep Industry Knowledge Executives have an average of over 20 years of insurance industry experience Conifer is 30% owned by management – all senior executives are significant investors in Conifer Talented underwriting group has a strong track record of growing specialty insurance businesses Underwriting team specialties contribute to geographic premium diversity Long-standing relationships with highly skilled retail and wholesale agents focused on selling specialty insurance policies Title Industry Experience Underwriting Product Specialty SVP, Commercial Lines 42 years Hospitality, Artisan Contractors & Auto Facilities President, MGA Division 29 years Low-Value Dwellings President, Venture Agency Holdings 27 years Security Services SVP, Personal Lines 8 years Homeowners 6
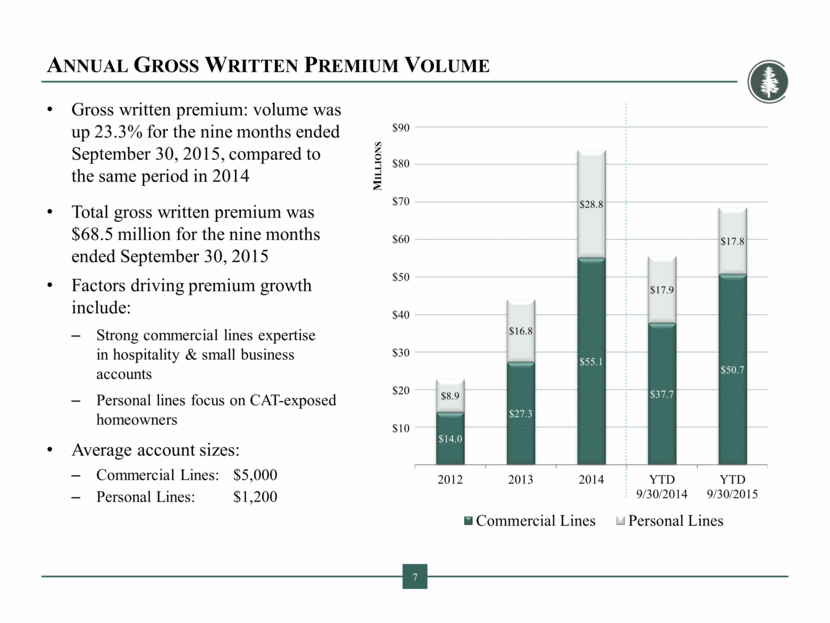
Annual Gross Written Premium Volume Gross written premium: volume was up 23.3% for the nine months ended September 30, 2015, compared to the same period in 2014 Total gross written premium was $68.5 million for the nine months ended September 30, 2015 Factors driving premium growth include: Strong commercial lines expertise in hospitality & small business accounts Personal lines focus on CAT-exposed homeowners Average account sizes: Commercial Lines: $5,000 Personal Lines: $1,200 7 Millions $90 $80 $70 $60 $50 $40 $30 $20 $10 $14.0 $27.3 $55.1 $37.7 $50.7 $8.9 $16.8 $28.8 $17.9 $17.8 2012 2013 2014 YTD 9/30/2014 YTD 9/30/2015 Commercial Lines Personal Lines
Broad & Flexible Underwriting Platform Poised for Growth Experienced Management Team & Underwriters with Deep Industry Knowledge Specialty Products to Drive Growth in Underserved Niche Markets Execution of the Business Plan Driving Growth: Specialty Products in Niche Markets 8
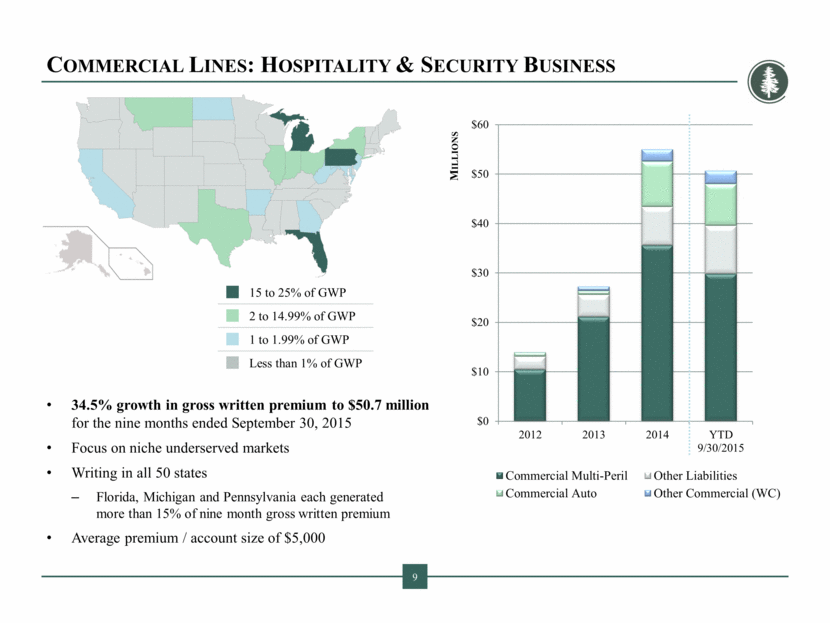
Commercial Lines: Hospitality & Security Business 34.5% growth in gross written premium to $50.7 million for the nine months ended September 30, 2015 Focus on niche underserved markets Writing in all 50 states Florida, Michigan and Pennsylvania each generated more than 15% of nine month gross written premium Average premium / account size of $5,000 9 15 to 25% of GWP 2 to 14.99% of GWP 1 to 1.99% of GWP Less than 1% of GWP
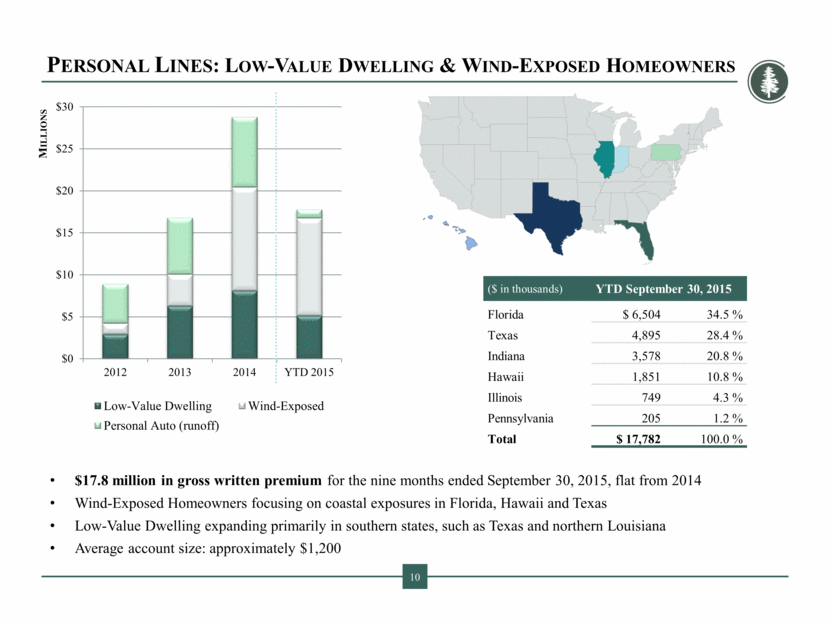
Personal Lines: Low-Value Dwelling & Wind-Exposed Homeowners ($ in thousands) YTD September 30, 2015 Florida $ 6,504 34.5 % Texas 4,895 28.4 % Indiana 3,578 20.8 % Hawaii 1,851 10.8 % Illinois 749 4.3 % Pennsylvania 205 1.2 % Total $ 17,782 100.0 % 10 $17.8 million in gross written premium for the nine months ended September 30, 2015, flat from 2014 Wind-Exposed Homeowners focusing on coastal exposures in Florida, Hawaii and Texas Low-Value Dwelling expanding primarily in southern states, such as Texas and northern Louisiana Average account size: approximately $1,200
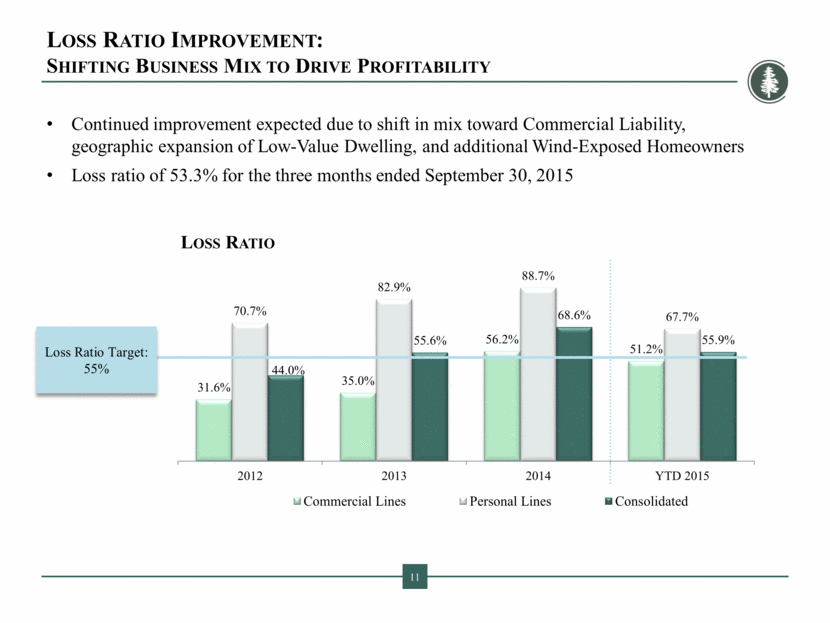
Loss Ratio Improvement: Shifting Business Mix to Drive Profitability Continued improvement expected due to shift in mix toward Commercial Liability, geographic expansion of Low-Value Dwelling, and additional Wind-Exposed Homeowners Loss ratio of 53.3% for the three months ended September 30, 2015 11 Loss Ratio Target: 55%
Broad & Flexible Underwriting Platform Poised for Growth Experienced Management Team & Underwriters with Deep Industry Knowledge Specialty Products to Drive Growth in Underserved Niche Markets Execution of the Business Plan Execution of Business Plan 12
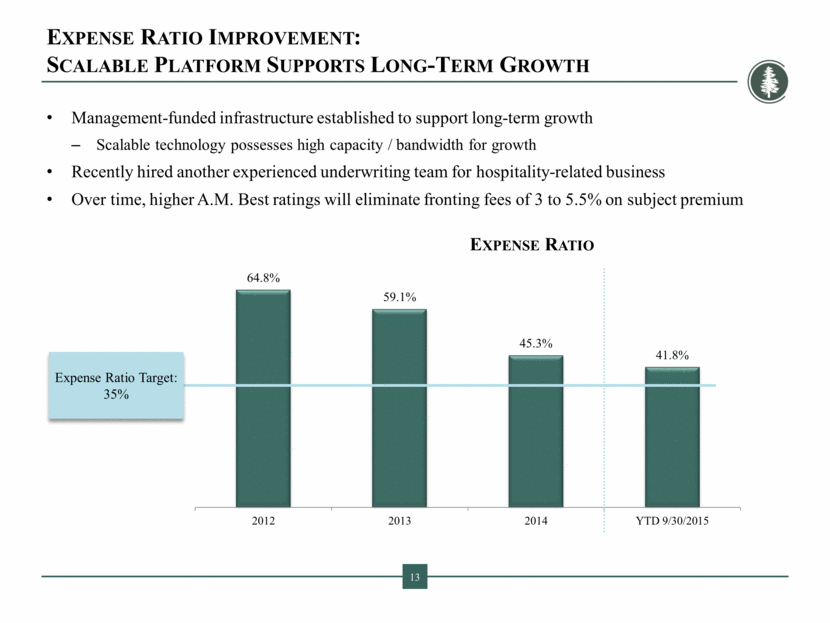
Expense Ratio Improvement: Scalable Platform Supports Long-Term Growth Management-funded infrastructure established to support long-term growth Scalable technology possesses high capacity / bandwidth for growth Recently hired another experienced underwriting team for hospitality-related business Over time, higher A.M. Best ratings will eliminate fronting fees of 3 to 5.5% on subject premium 13 Expense Ratio Target: 35% Expense Ratio 64.8% 59.1% 45.3% 41.8% 2012 2013 2014 YTD 9/30/2015
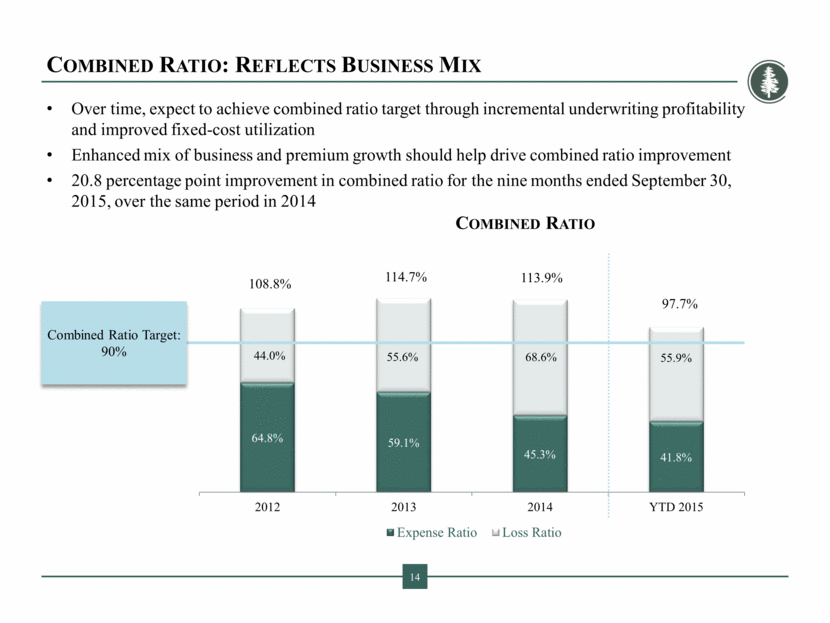
Combined Ratio: Reflects Business Mix Over time, expect to achieve combined ratio target through incremental underwriting profitability and improved fixed-cost utilization Enhanced mix of business and premium growth should help drive combined ratio improvement 20.8 percentage point improvement in combined ratio for the nine months ended September 30, 2015, over the same period in 2014 14 Combined Ratio Target: 90% 108.8% 114.7% 113.9% 97.7% Combined Ratio 64.8% 59.1% 45.3% 41.8% 44.0% 55.6% 68.6% 55.9% 2012 2013 2014 YTD 2015 Expense Ratio Loss Ratio
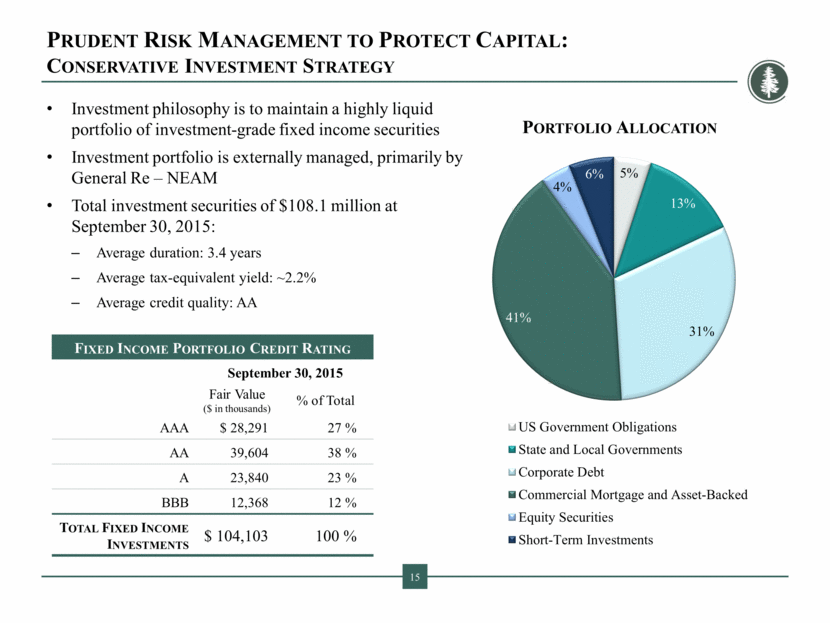
Prudent Risk Management to Protect Capital: Conservative Investment Strategy Fixed Income Portfolio Credit Rating September 30, 2015 Fair Value ($ in thousands) % of Total AAA $ 28,291 27 % AA 39,604 38 % A 23,840 23 % BBB 12,368 12 % Total Fixed Income Investments $ 104,103 100 % 15 Investment philosophy is to maintain a highly liquid portfolio of investment-grade fixed income securities Investment portfolio is externally managed, primarily by General Re – NEAM Total investment securities of $108.1 million at September 30, 2015: Average duration: 3.4 years Average tax-equivalent yield: ~2.2% Average credit quality: AA
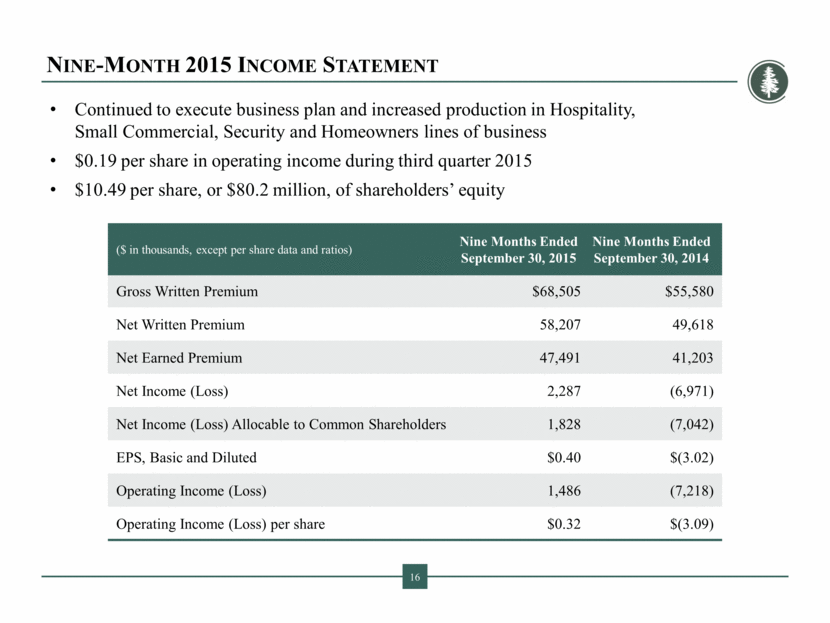
Nine-Month 2015 Income Statement Continued to execute business plan and increased production in Hospitality, Small Commercial, Security and Homeowners lines of business $0.19 per share in operating income during third quarter 2015 $10.49 per share, or $80.2 million, of shareholders’ equity ($ in thousands, except per share data and ratios) Nine Months Ended September 30, 2015 Nine Months Ended September 30, 2014 Gross Written Premium $68,505 $55,580 Net Written Premium 58,207 49,618 Net Earned Premium 47,491 41,203 Net Income (Loss) 2,287 (6,971) Net Income (Loss) Allocable to Common Shareholders 1,828 (7,042) EPS, Basic and Diluted $0.40 $(3.02) Operating Income (Loss) 1,486 (7,218) Operating Income (Loss) per share $0.32 $(3.09) 16
CNFR Third Quarter Conference Call Broad & Flexible Underwriting Platform Poised for Growth Experienced Management Team & Underwriters with Deep Industry Knowledge Specialty Products to Drive Growth in Underserved Niche Markets Execution of the Business Plan 17
[LOGO]

Appendix
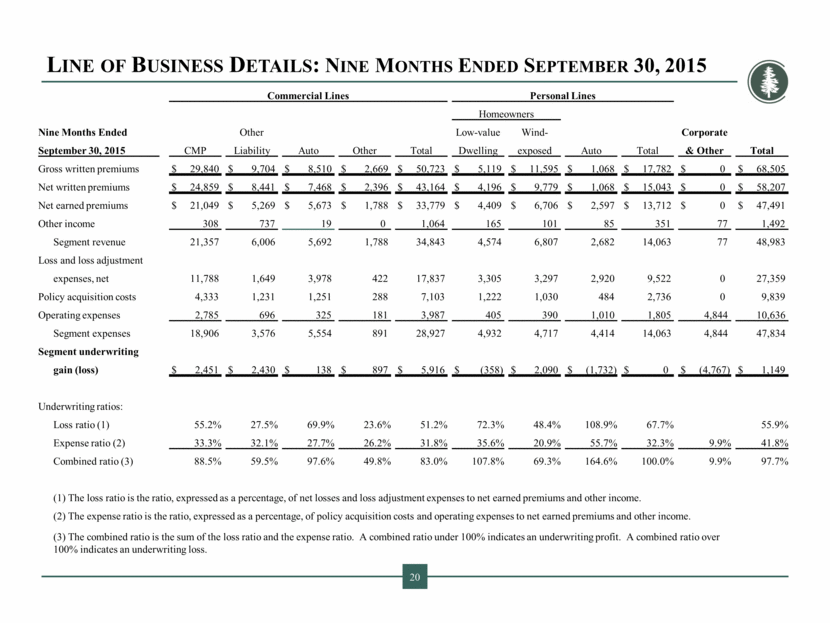
Line of Business Details: Nine Months Ended September 30, 2015 20 Commercial Lines Personal Lines Homeowners Nine Months Ended Other Low-value Wind- Corporate September 30, 2015 CMP Liability Auto Other Total Dwelling exposed Auto Total & Other Total Gross written premiums $ 29,840 $ 9,704 $ 8,510 $ 2,669 $ 50,723 $ 5,119 $ 11,595 $ 1,068 $ 17,782 $ 0 $ 68,505 Net written premiums $ 24,859 $ 8,441 $ 7,468 $ 2,396 $ 43,164 $ 4,196 $ 9,779 $ 1,068 $ 15,043 $ 0 $ 58,207 Net earned premiums $ 21,049 $ 5,269 $ 5,673 $ 1,788 $ 33,779 $ 4,409 $ 6,706 $ 2,597 $ 13,712 $ 0 $ 47,491 Other income 308 737 19 0 1,064 165 101 85 351 77 1,492 Segment revenue 21,357 6,006 5,692 1,788 34,843 4,574 6,807 2,682 14,063 77 48,983 Loss and loss adjustment expenses, net 11,788 1,649 3,978 422 17,837 3,305 3,297 2,920 9,522 0 27,359 Policy acquisition costs 4,333 1,231 1,251 288 7,103 1,222 1,030 484 2,736 0 9,839 Operating expenses 2,785 696 325 181 3,987 405 390 1,010 1,805 4,844 10,636 Segment expenses 18,906 3,576 5,554 891 28,927 4,932 4,717 4,414 14,063 4,844 47,834 Segment underwriting gain (loss) $ 2,451 $ 2,430 $ 138 $ 897 $ 5,916 $ (358) $ 2,090 $ (1,732) $ 0 $ (4,767) $ 1,149 Underwriting ratios: Loss ratio (1) 55.2% 27.5% 69.9% 23.6% 51.2% 72.3% 48.4% 108.9% 67.7% 55.9% Expense ratio (2) 33.3% 32.1% 27.7% 26.2% 31.8% 35.6% 20.9% 55.7% 32.3% 9.9% 41.8% Combined ratio (3) 88.5% 59.5% 97.6% 49.8% 83.0% 107.8% 69.3% 164.6% 100.0% 9.9% 97.7% (1) The loss ratio is the ratio, expressed as a percentage, of net losses and loss adjustment expenses to net earned premiums and other income. (2) The expense ratio is the ratio, expressed as a percentage, of policy acquisition costs and operating expenses to net earned premiums and other income. (3) The combined ratio is the sum of the loss ratio and the expense ratio. A combined ratio under 100% indicates an underwriting profit. A combined ratio over 100% indicates an underwriting loss.
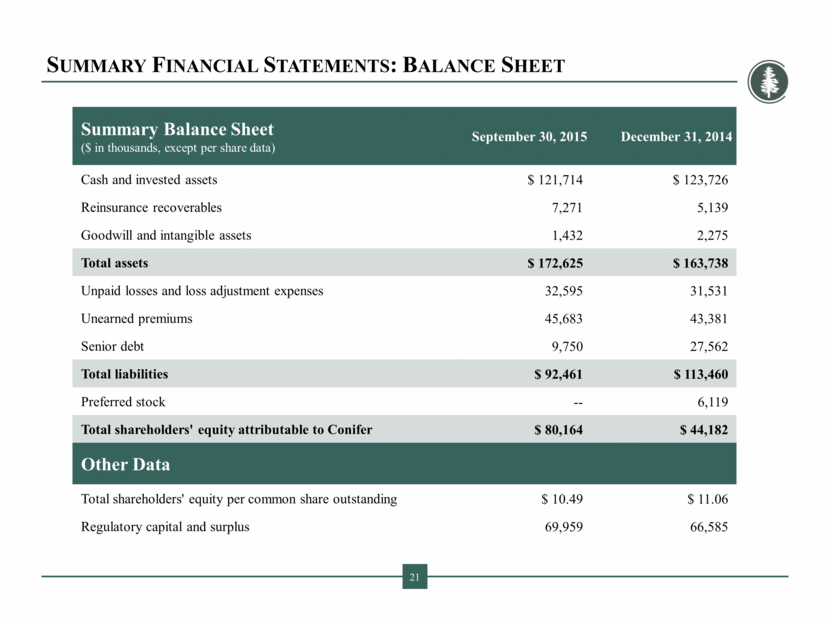
Summary Financial Statements: Balance Sheet Summary Balance Sheet ($ in thousands, except per share data) September 30, 2015 December 31, 2014 Cash and invested assets $ 121,714 $ 123,726 Reinsurance recoverables 7,271 5,139 Goodwill and intangible assets 1,432 2,275 Total assets $ 172,625 $ 163,738 Unpaid losses and loss adjustment expenses 32,595 31,531 Unearned premiums 45,683 43,381 Senior debt 9,750 27,562 Total liabilities $ 92,461 $ 113,460 Preferred stock -- 6,119 Total shareholders' equity attributable to Conifer $ 80,164 $ 44,182 Other Data Total shareholders' equity per common share outstanding $ 10.49 $ 11.06 Regulatory capital and surplus 69,959 66,585 21
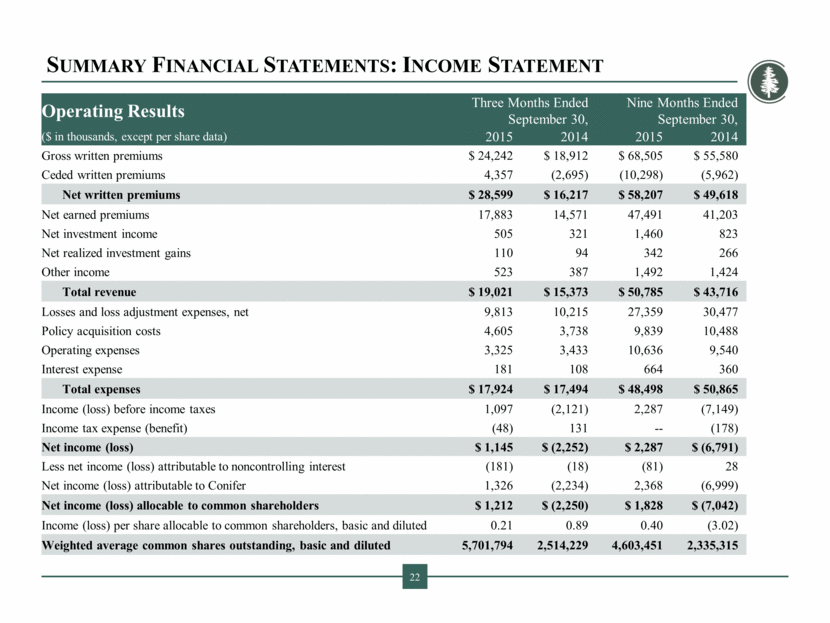
Summary Financial Statements: Income Statement Operating Results Three Months Ended September 30, Nine Months Ended September 30, ($ in thousands, except per share data) 2015 2014 2015 2014 Gross written premiums $ 24,242 $ 18,912 $ 68,505 $ 55,580 Ceded written premiums 4,357 (2,695) (10,298) (5,962) Net written premiums $ 28,599 $ 16,217 $ 58,207 $ 49,618 Net earned premiums 17,883 14,571 47,491 41,203 Net investment income 505 321 1,460 823 Net realized investment gains 110 94 342 266 Other income 523 387 1,492 1,424 Total revenue $ 19,021 $ 15,373 $ 50,785 $ 43,716 Losses and loss adjustment expenses, net 9,813 10,215 27,359 30,477 Policy acquisition costs 4,605 3,738 9,839 10,488 Operating expenses 3,325 3,433 10,636 9,540 Interest expense 181 108 664 360 Total expenses $ 17,924 $ 17,494 $ 48,498 $ 50,865 Income (loss) before income taxes 1,097 (2,121) 2,287 (7,149) Income tax expense (benefit) (48) 131 -- (178) Net income (loss) $ 1,145 $ (2,252) $ 2,287 $ (6,791) Less net income (loss) attributable to noncontrolling interest (181) (18) (81) 28 Net income (loss) attributable to Conifer 1,326 (2,234) 2,368 (6,999) Net income (loss) allocable to common shareholders $ 1,212 $ (2,250) $ 1,828 $ (7,042) Income (loss) per share allocable to common shareholders, basic and diluted 0.21 0.89 0.40 (3.02) Weighted average common shares outstanding, basic and diluted 5,701,794 2,514,229 4,603,451 2,335,315 22
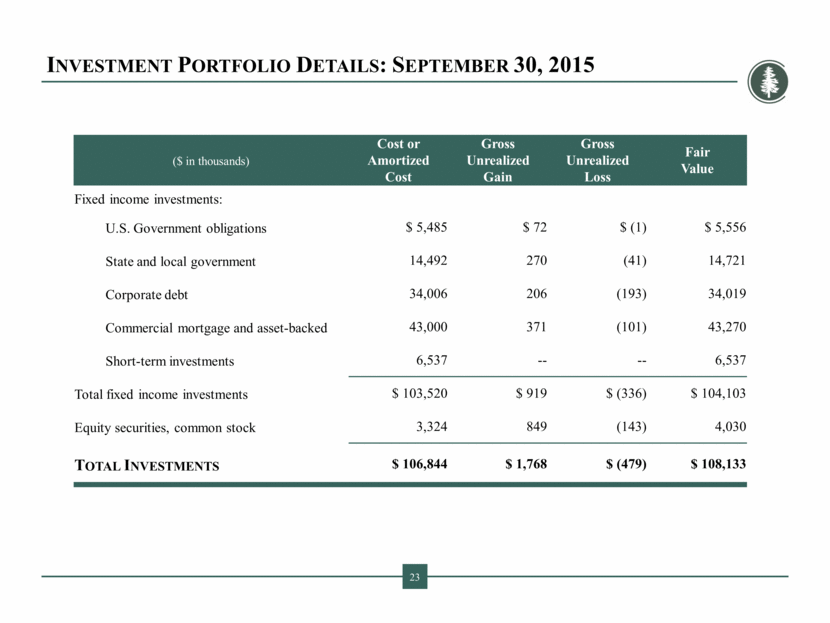
($ in thousands) Cost or Amortized Cost Gross Unrealized Gain Gross Unrealized Loss Fair Value Fixed income investments: U.S. Government obligations $ 5,485 $ 72 $ (1) $ 5,556 State and local government 14,492 270 (41) 14,721 Corporate debt 34,006 206 (193) 34,019 Commercial mortgage and asset-backed 43,000 371 (101) 43,270 Short-term investments 6,537 -- -- 6,537 Total fixed income investments $ 103,520 $ 919 $ (336) $ 104,103 Equity securities, common stock 3,324 849 (143) 4,030 Total Investments $ 106,844 $ 1,768 $ (479) $ 108,133 Investment Portfolio Details: September 30, 2015 23
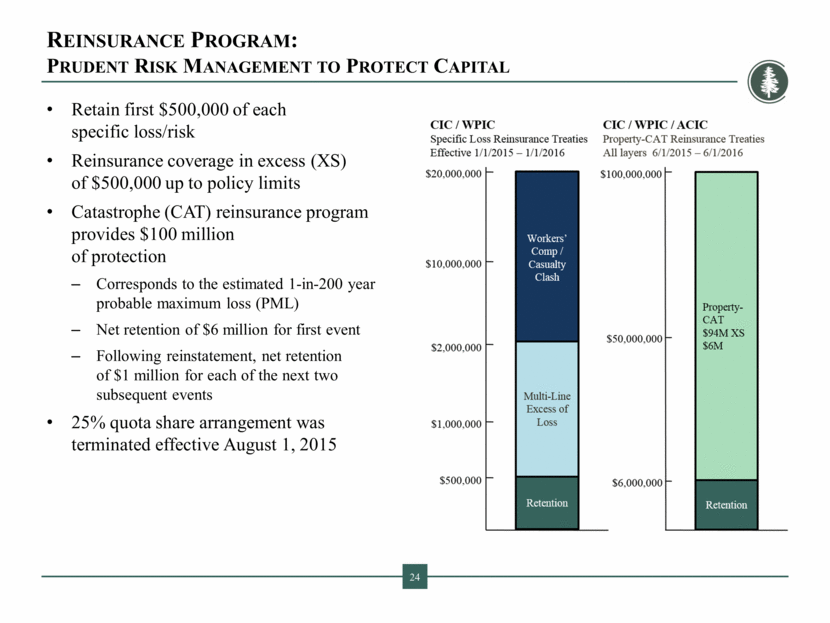
Reinsurance Program: Prudent Risk Management to Protect Capital Retain first $500,000 of each specific loss/risk Reinsurance coverage in excess (XS) of $500,000 up to policy limits Catastrophe (CAT) reinsurance program provides $100 million of protection Corresponds to the estimated 1-in-200 year probable maximum loss (PML) Net retention of $6 million for first event Following reinstatement, net retention of $1 million for each of the next two subsequent events 25% quota share arrangement was terminated effective August 1, 2015 24