Attached files
| file | filename |
|---|---|
| 8-K - 8-K - 2U, Inc. | a15-22640_28k.htm |
Exhibit 99.1
Q4 2015 In vestor Presen ta2on 2U 1

Safe Harbor This presenta2on contains forward-‐looking statements. All statements other than statements of historical facts contained in this presenta2on, including statements regarding future results of the opera2ons and financial posi2on of 2U, Inc. (“2U” or the “Company”), including financial targets, business strategy, and plans and objec2ves for future opera2ons, are forward-‐looking statements. 2U has based these forward-‐looking statements largely on its es2mates of its financial results and its current expecta2ons and projec2ons about future events and financial trends that it believes may affect its financial condi2on, results of opera2ons, business strategy, short term and long-‐term business opera2ons and objec2ves, and financial needs as of the date of this presenta2on. These forward-‐looking statements are subject to a number of risks, uncertain2es and assump2ons, including those described under the heading “Risk Factors” in our form 10-‐K filed with the Securi2es and Exchange Commission (the “SEC”) on February 26, 2015, and other filings with the SEC. Moreover, 2U operates in a very compe22ve and rapidly changing environment. New risks emerge from 2me to 2me. It is not possible for 2U management to predict all risks, nor can 2U assess the impact of all factors on its business or the extent to which any factor, or combina2on of factors, may cause actual results to differ materially from those contained in any forward-‐looking statements 2U may make. In light of these risks, uncertain2es and assump2ons, the forward-‐looking events and circumstances discussed in this presenta2on may not occur and actual results could differ materially and adversely from those an2cipated or implied in the forward-‐looking statements. You should not rely upon forward-‐looking statements as predic2ons of future events. Although 2U believes that the expecta2ons reflected in the forward-‐looking statements are reasonable, 2U cannot guarantee that the future results, levels of ac2vity, performance or events and circumstances reflected in the forward-‐looking statements will be achieved or occur. Moreover, neither 2U nor any other person assumes responsibility for the accuracy and completeness of the forward-‐looking statements. Except as required by law, 2U undertakes no obliga2on to update publicly any forward-‐looking statements for any reason a[er the date of this presenta2on, to conform these statements to actual results or to changes in 2U’s expecta2ons. In addi2on to U.S. GAAP financial measures, this presenta2on includes certain non-‐GAAP financial measures. These non-‐GAAP measures are in addi2on to, not a subs2tute for or superior to, measures of financial performance prepared in accordance with U.S. GAAP. We have provided a reconcilia2on of those measures to the most directly comparable GAAP measures in the appendix a_ached hereto. 2U 2
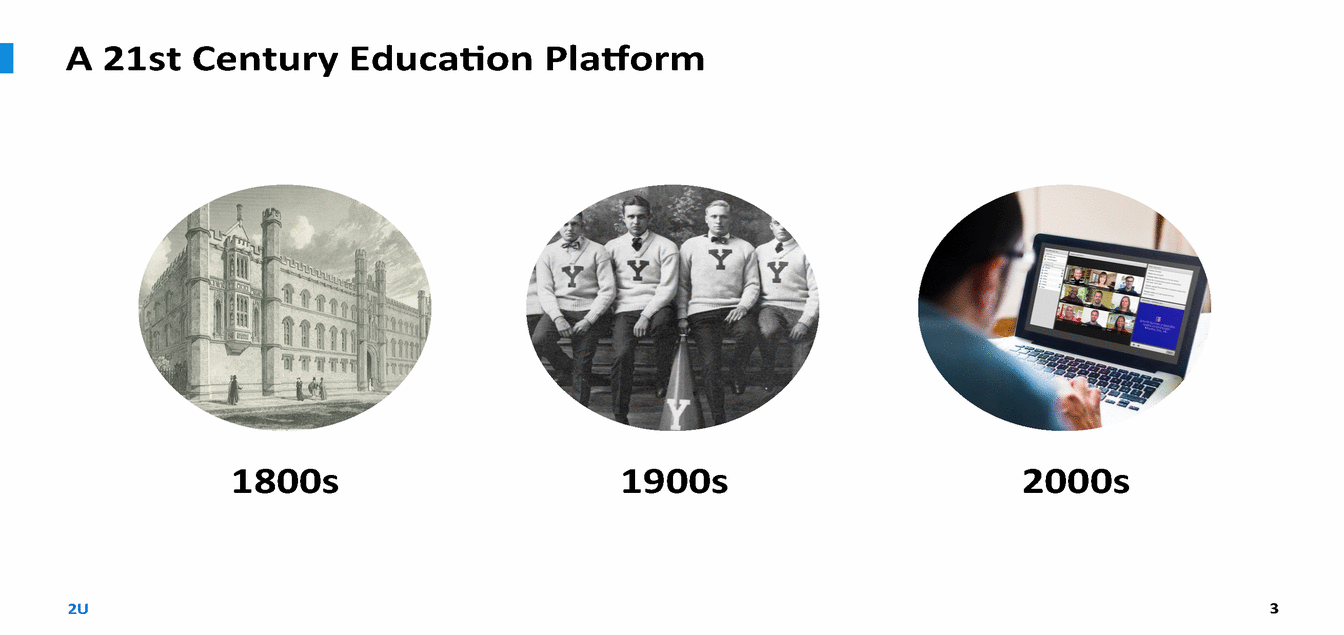
A 21st Century Educa;on Pla>orm 1800s 1900s 2000s 2U 3
·..·..·.... ·..·.............· ..· .: .: .' - • • .. ..••• •• .J,..

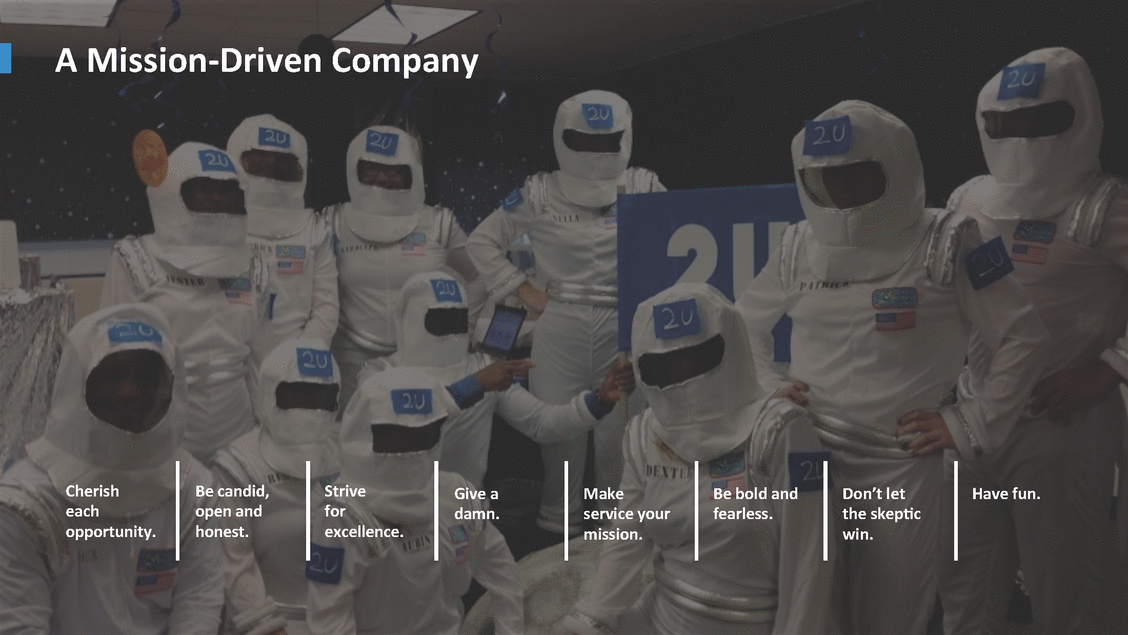
A Mission-‐Driven Company Cherish each opportunity. Be candid, open and honest. Strive for excellence. Give a damn. Make service your mission. Be bold and fearless. Don’t let the skep;c win. Have fun. 2U 5
Outcomes MaTer Straight A’s Access Achievement Advancement Affilia;on Aspira;on 2U 6
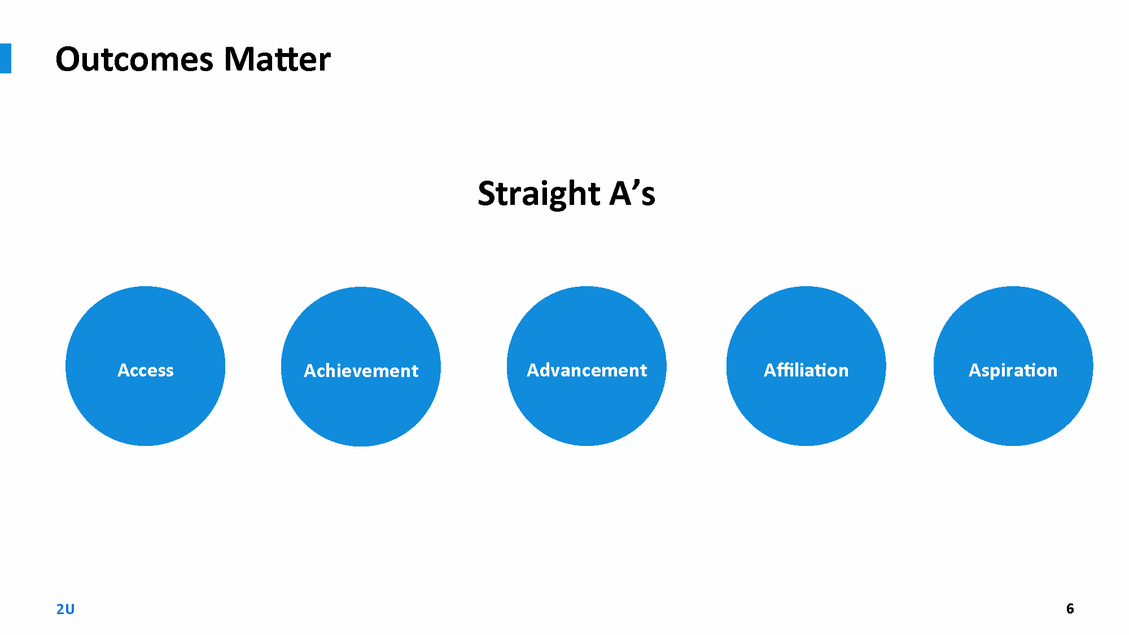
Outcomes MaTer ACCESS 17,260 Students enrolled since incep2on QUALITY 11.8 Average number of students per live session SUCCESS 84% of students who have enrolled in 2U-‐powered programs are either graduated or s2ll enrolled Data as of September 30, 2015 2U 7
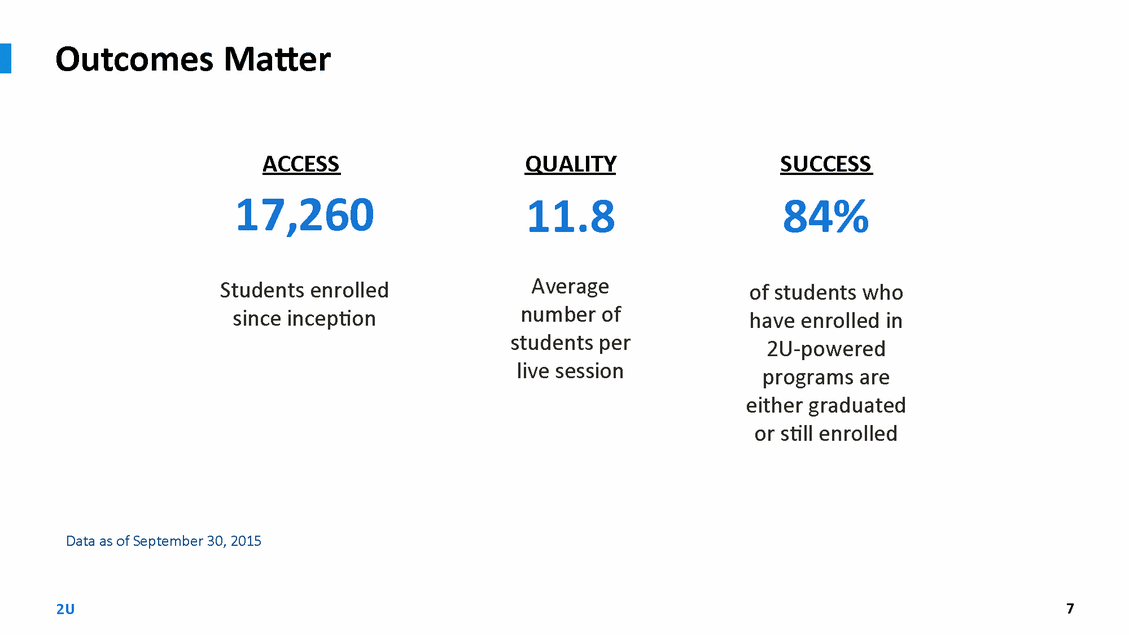
Roles and Responsibili;es 2U Joint University 2U 8
The 2U Pla>orm: Enabling great universi;es to create the best digital versions of themselves Innova;ve Cloud-‐based SaaS Technology Bundled Tech-‐Enabled Services 2U 9
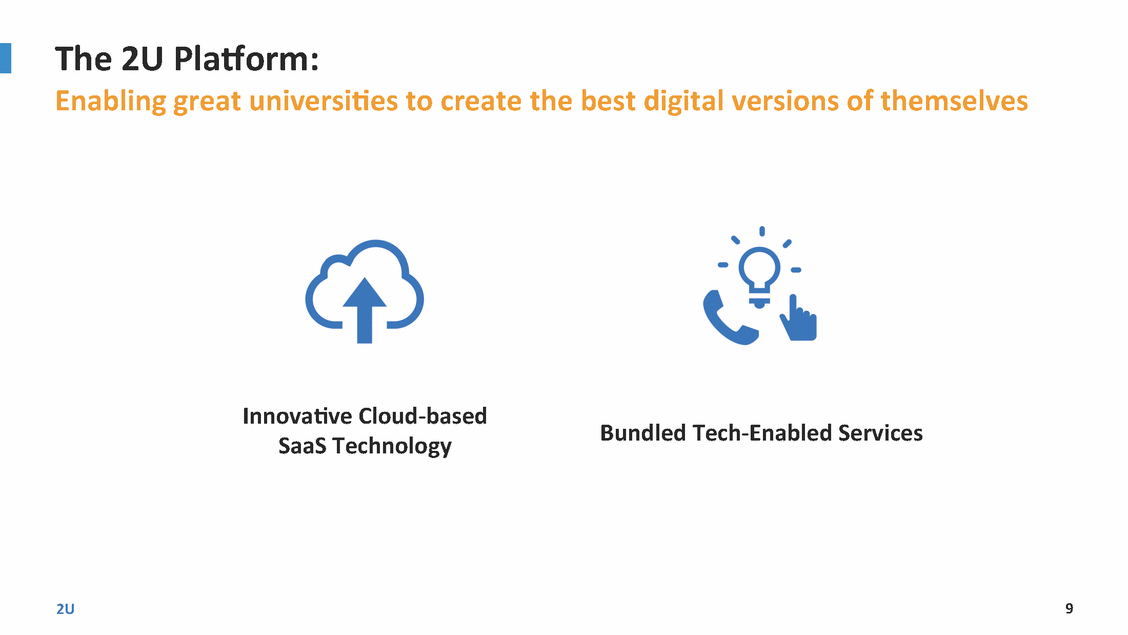
Innova;ve SaaS Online Campus Technology: High-‐quality, engaging content Live classes and groups Dynamic social networking 2U 10

Innova;ve SaaS Technology: OARS Online student applica2on management Back-‐End Solu;ons CRM Student rela2onship database and student lifecycle data Content Management Back-‐end support for course management Geo-‐loca;on Database Field placement network and database 2U 11

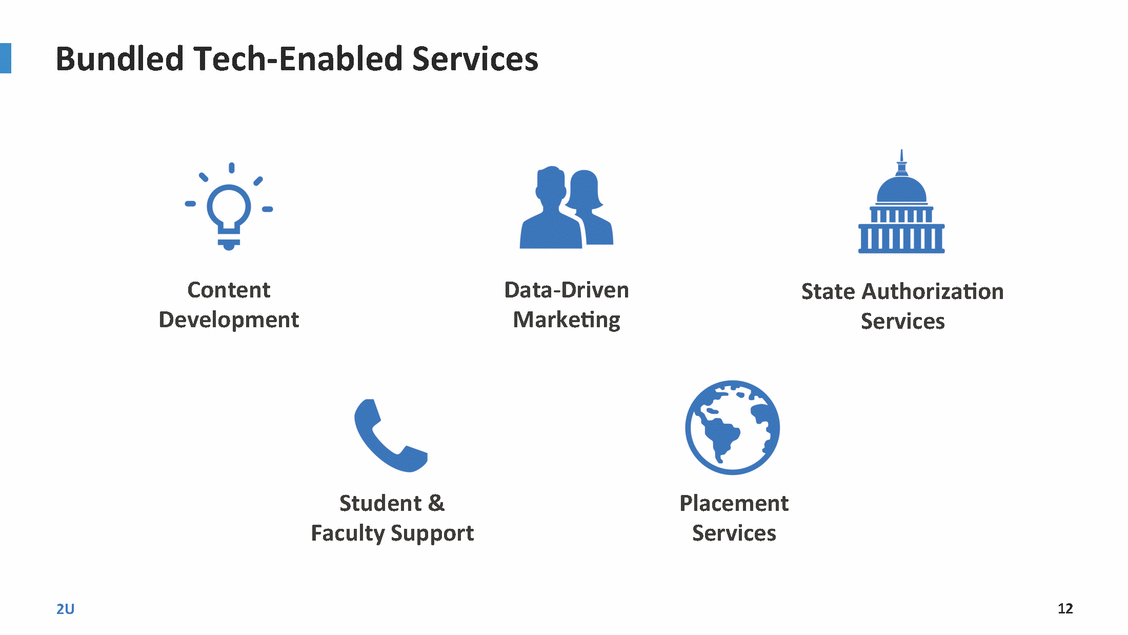
Bundled Tech-‐Enabled Services Content Development Data-‐Driven Marke;ng State Authoriza;on Services Student & Faculty Support Placement Services 2U 12
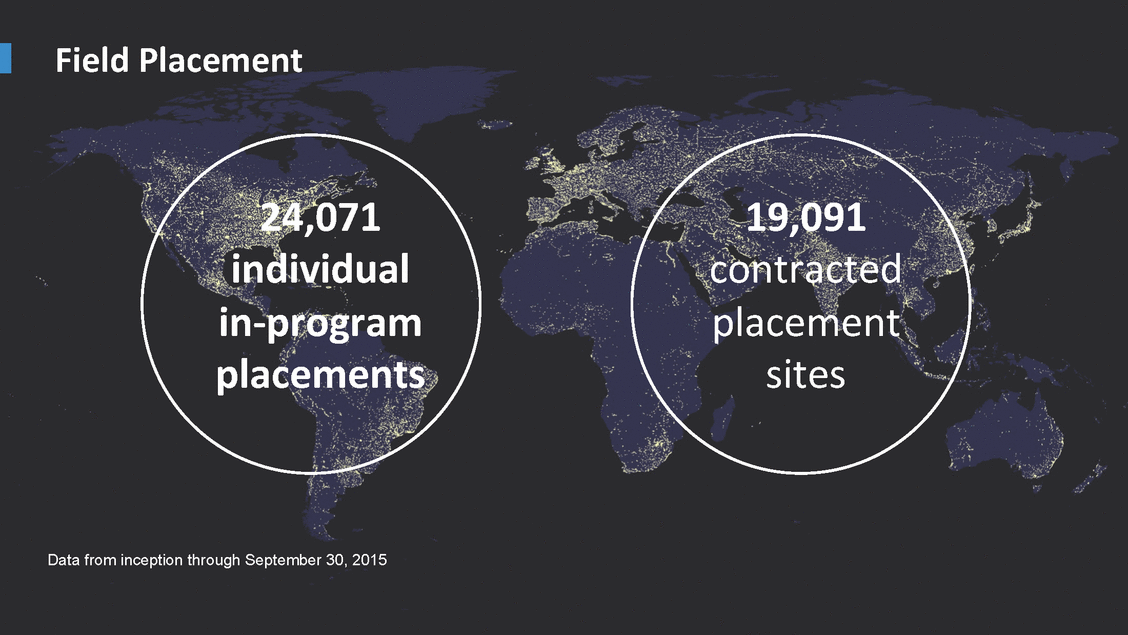
Field Placement 24,071 individual in-‐program placements 19,091 contracted placement sites Data from inception through September 30, 2015 2U 13
Defensible Posi;on 2U 14

I Elite University Mindshare Yale SYRACUSE UNIVERSITY USCUniversityof Southern Califurnia IINYU NORTHWESTERN UNIVERSITY THE GEORGE WASHINGTON UNIVERSITY THE UNIVERSITY of NORTH CAROLINA 111 CHAPEL HILL 2U 15
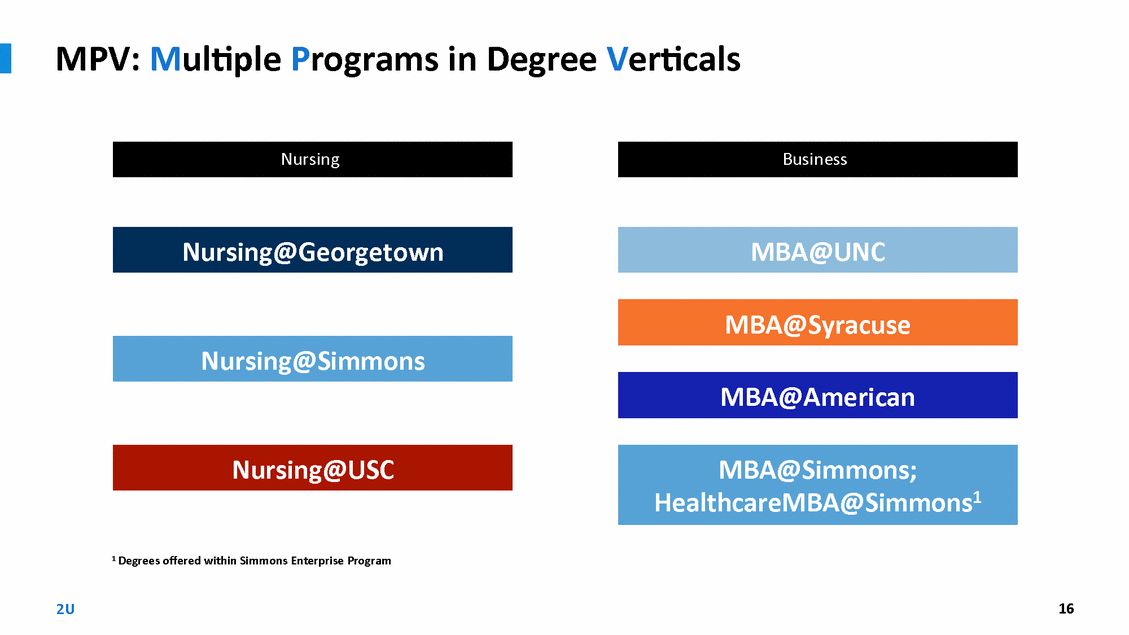
MPV: Mul;ple Programs in Degree Ver;cals 1 Degrees offered within Simmons Enterprise Program 2U 16 MBA@Simmons; HealthcareMBA@Simmons1 Nursing@USC MBA@American Nursing@Simmons MBA@Syracuse MBA@UNC Nursing@Georgetown Business Nursing
Leverage From MPV Strategy -‐ENABLES-‐ Increased Marke;ng Investment in Both Programs -‐LEADING TO-‐ Larger Overall Ver;cal Reduced Student Acquisi2on Costs 1st Program Marke;ng 1st Program Students 2nd Program Marke;ng 2nd Program Students Same level of spend drives incremental students, lowering the per student acquisi;on cost (TCA)

Leverage From MPV Strategy 1st Program Marke;ng 2nd Program Marke;ng -‐ENABLES-‐ Increased Marke;ng Investment in Both Programs -‐LEADING TO-‐ Students Students Larger Overall Ver;cal Same level of spend drives incremental students, lowering the per student acquisi;on cost (TCA) 2U 17 2nd Program 1st Program Reduced Student Acquisi2on Costs
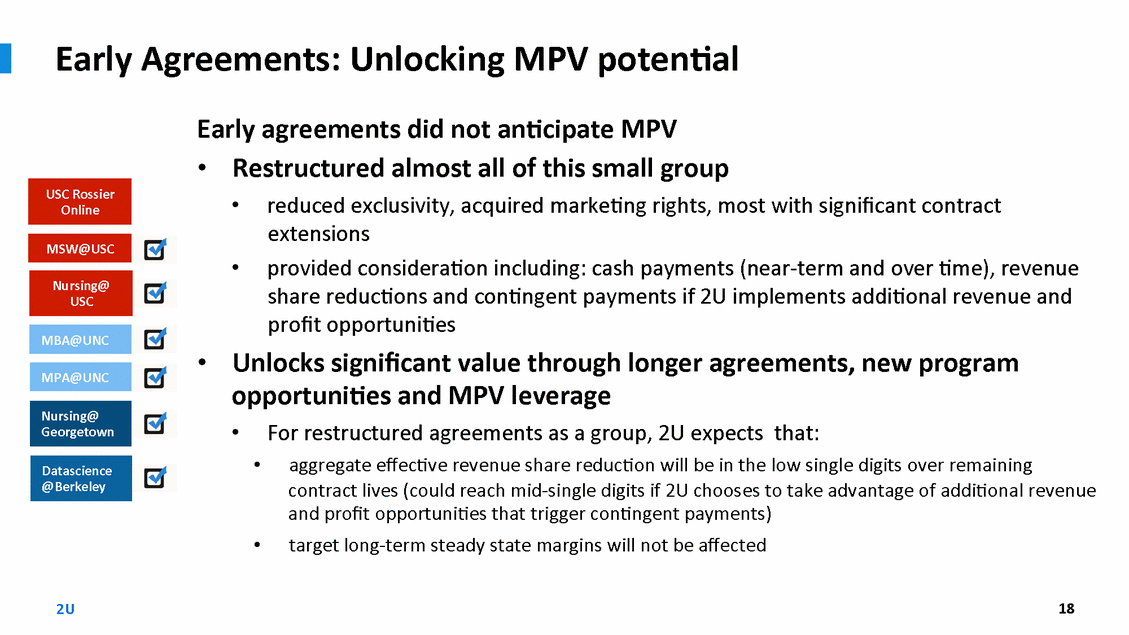
Early Agreements: Unlocking MPV poten;al Early agreements did not an;cipate MPV • Restructured almost all of this small group • reduced exclusivity, acquired marke2ng rights, most with significant contract extensions provided considera2on including: cash payments (near-‐term and over 2me), revenue share reduc2ons and con2ngent payments if 2U implements addi2onal revenue and profit opportuni2es • • Unlocks significant value through longer agreements, new program opportuni;es and MPV leverage • For restructured agreements as a group, 2U expects that: • aggregate effec2ve revenue share reduc2on will be in the low single digits over remaining contract lives (could reach mid-‐single digits if 2U chooses to take advantage of addi2onal revenue and profit opportuni2es that trigger con2ngent payments) target long-‐term steady state margins will not be affected • 2U 18 Datascience @Berkeley Nursing@ Georgetown MPA@UNC MBA@UNC Nursing@ USC MSW@USC USC Rossier Online
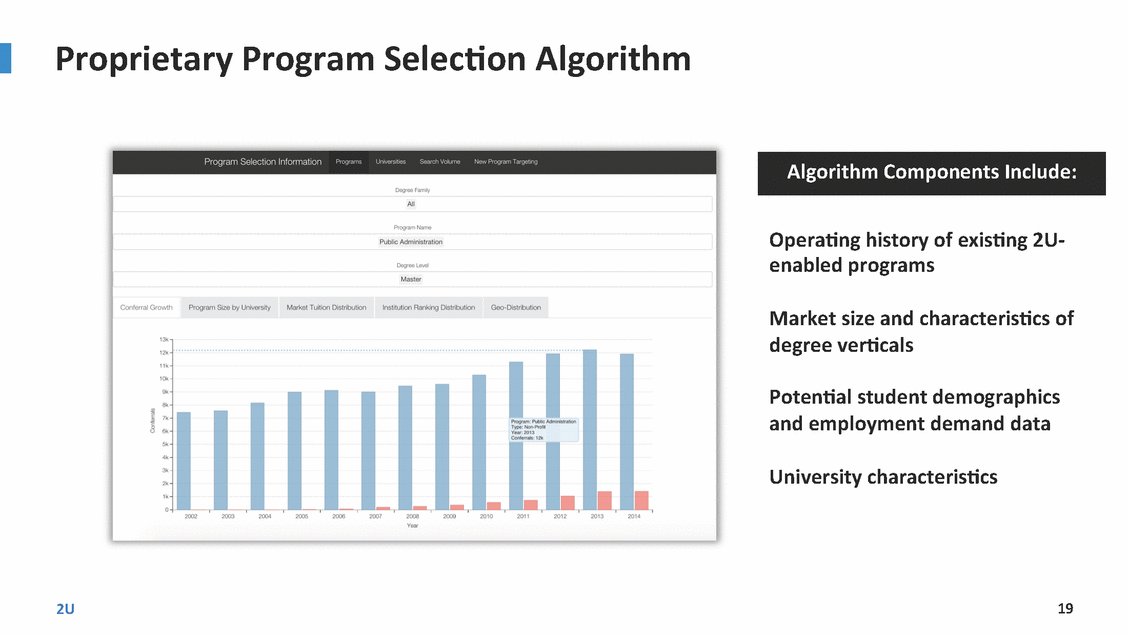
Proprietary Program Selec;on Algorithm Opera;ng history of exis;ng 2U-‐ enabled programs Market size and characteris;cs of degree ver;cals Poten;al student demographics and employment demand data University characteris;cs 2U 19 Algorithm Components Include:
Market Opportunity 2U Serving or under contract to serve 17 graduate academic disciplines U.S. Graduate Educa;on1 $80B across ~1,000 academic disciplines Total U.S. Higher Educa;on1 $550B+ Global Higher Educa;on 1 Source: U.S. Na2onal Center for Educa2on Sta2s2cs, May 2013 Report

Iden;fying University Clients: Data & Experience Drive Success Regionality Demand in the Ver;cal FORMULA FOR A SUCCESSFUL PARTNERSHIP Brand Iden;ty School Leadership 2U 20
Es;mate of Long-‐term Market Poten;al Programs Per Ver;cal Degree Ver;cals At IPO Current 30 2 3 Improved & Expanded 60 Targe1ng Capability MPV Strategy Proving Out 2014 – 4 new programs launched 2015 – 5 new programs launched 2016 – expec2ng 6 new programs launching 2017-‐ targe2ng increase to 9 new programs launching 2018 -‐ targe2ng at least the same level of year over year increase

Market Opportunity Global Higher Educa;on Total U.S. Higher Educa;on1 $550B+ U.S. Graduate Educa;on1 $80B across ~1,000 academic disciplines 2U Serving or under contract to serve 17 graduate academic disciplines 1 Source: U.S. Na2onal Center for Educa2on Sta2s2cs, May 2013 Report 2U 21
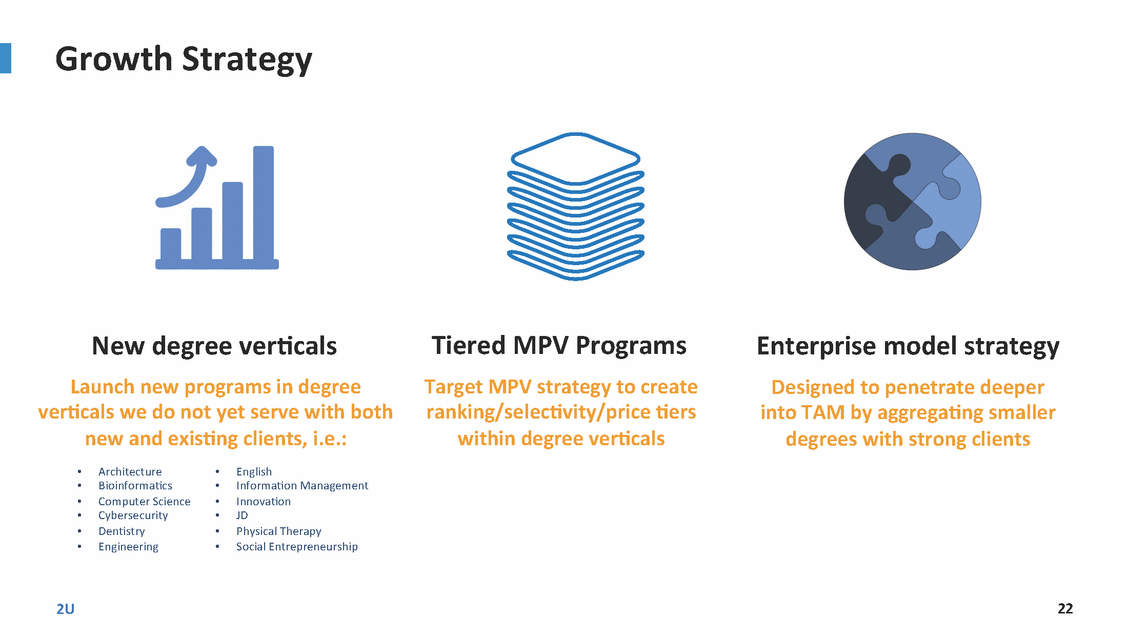
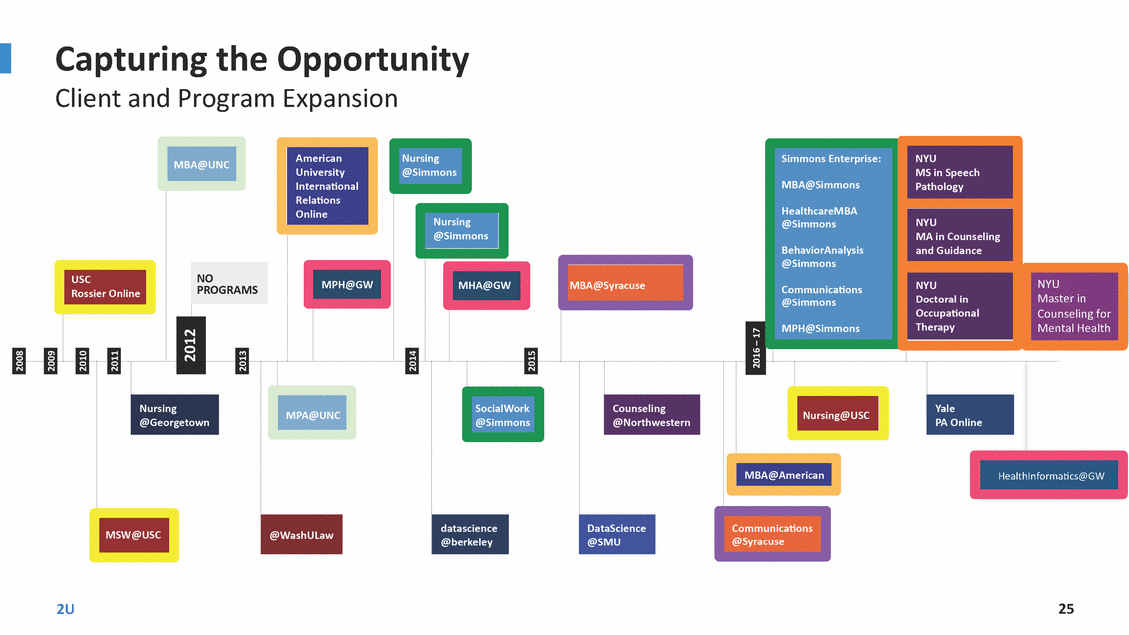
Growth Strategy New degree ver;cals Launch new programs in degree ver;cals we do not yet serve with both new and exis;ng clients, i.e.: Tiered MPV Programs Target MPV strategy to create ranking/selec;vity/price ;ers within degree ver;cals Enterprise model strategy Designed to penetrate deeper into TAM by aggrega;ng smaller degrees with strong clients • • • • • • Architecture Bioinforma2cs Computer Science Cybersecurity Den2stry Engineering • • • • • • English Informa2on Management Innova2on JD Physical Therapy Social Entrepreneurship 2U 22
Es;mate of Long-‐term Market Poten;al At IPO Current Degree Ver;cals 30 Improved & Expanded Targe1ng Capability 60 MPV Strategy Proving Out Programs Per Ver;cal 2 3 2014 – 4 new programs launched 2015 – 5 new programs launched 2016 – expec2ng 6 new programs launching 2017-‐ targe2ng increase to 9 new programs launching 2018 -‐ targe2ng at least the same level of year over year increase 2U 23
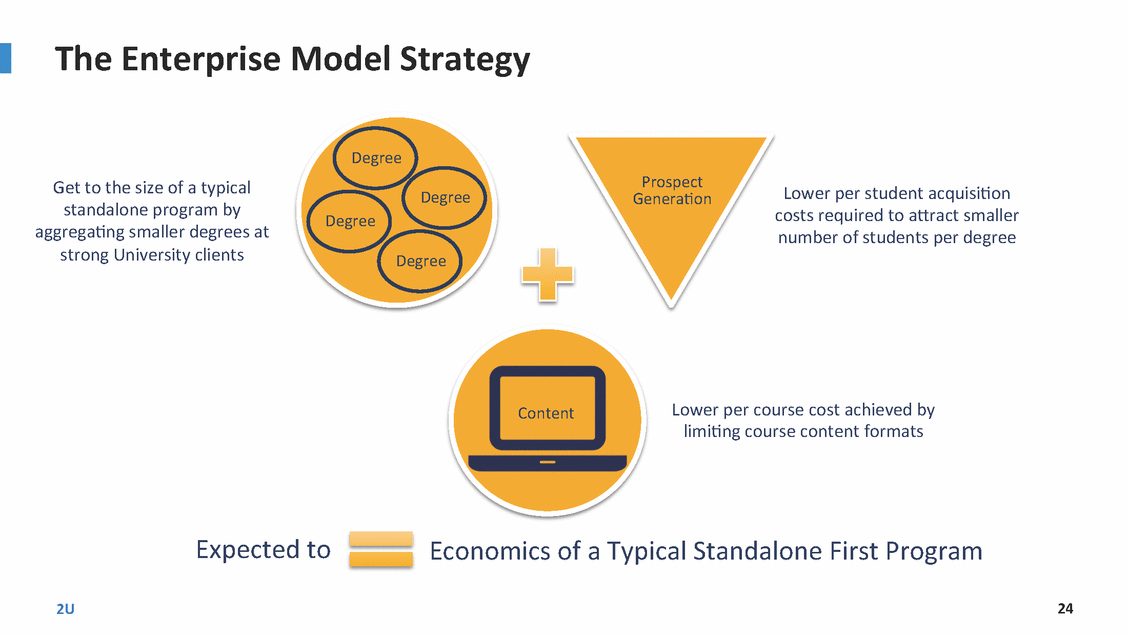
The Enterprise Model Strategy Degree Prospect Genera2on Get to the size of a typical standalone program by aggrega2ng smaller degrees at strong University clients Lower per student acquisi2on costs required to a_ract smaller number of students per degree Degree Degree Degree Lower per course cost achieved by limi2ng course content formats Expected to Economics of a Typical Standalone First Program 2U 24 Content
I Capturing the Opportunity Client and Program Expansion -------NO PROGRAMS 25 2U Communications @Syracuse Healthlnformancs@GW NYU Doctoral in Occupational Therapy -------MBA@Syracuse NYU MAin Counseling and Guidance NYU MS in Speech Pathology
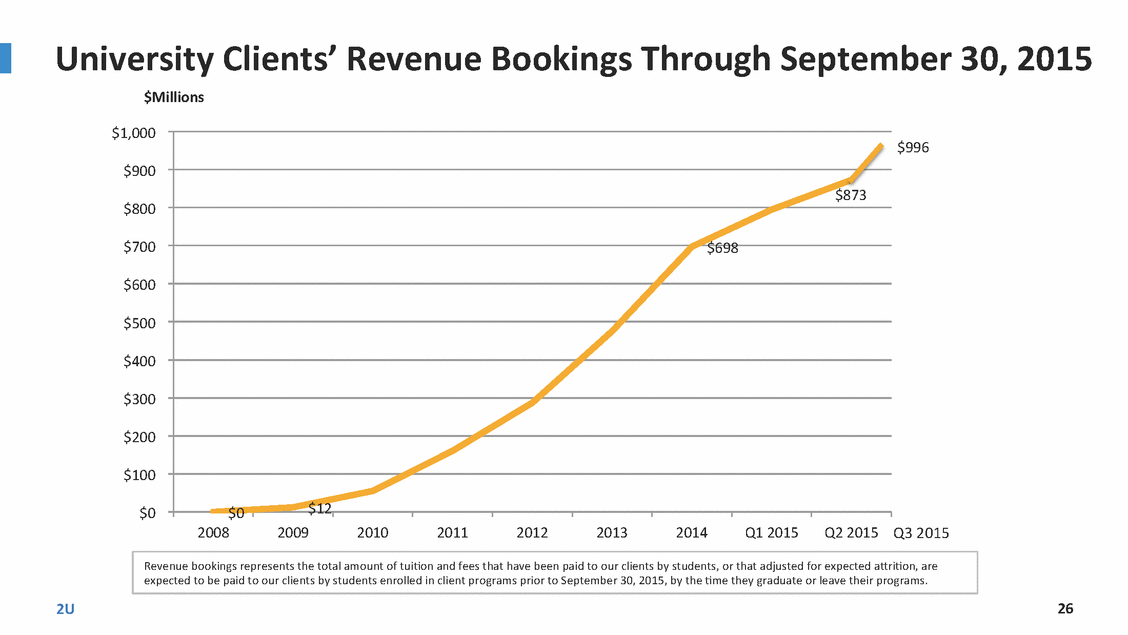
University $Millions Clients’ Revenue Bookings Through September 30, 2015 $1,000 $996 $900 $873 $800 ITD Bookings ($Millions) $700 $698 $600 $500 $400 $300 $200 $100 $12 0 2008 2009 2010 2011 2012 2013 2014 Q1 2015 Q2 2015 Q3 2015 Revenue bookings represents the total amount of tui2on and fees that have been paid to our clients by students, or that adjusted for expected a_ri2on, are expected to be paid to our clients by students enrolled in client programs prior to September 30, 2015, by the 2me they graduate or leave their programs. 2U 26 $0 $
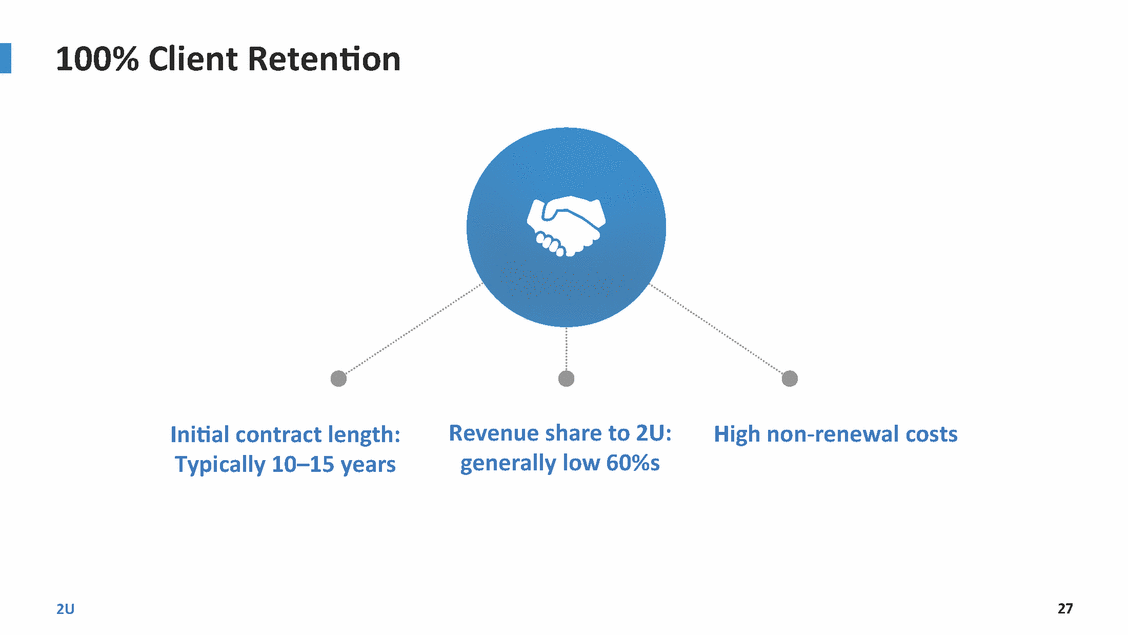
100% Client Reten;on Revenue share to 2U: generally low 60%s Ini;al contract length: Typically 10–15 years High non-‐renewal costs 2U 27
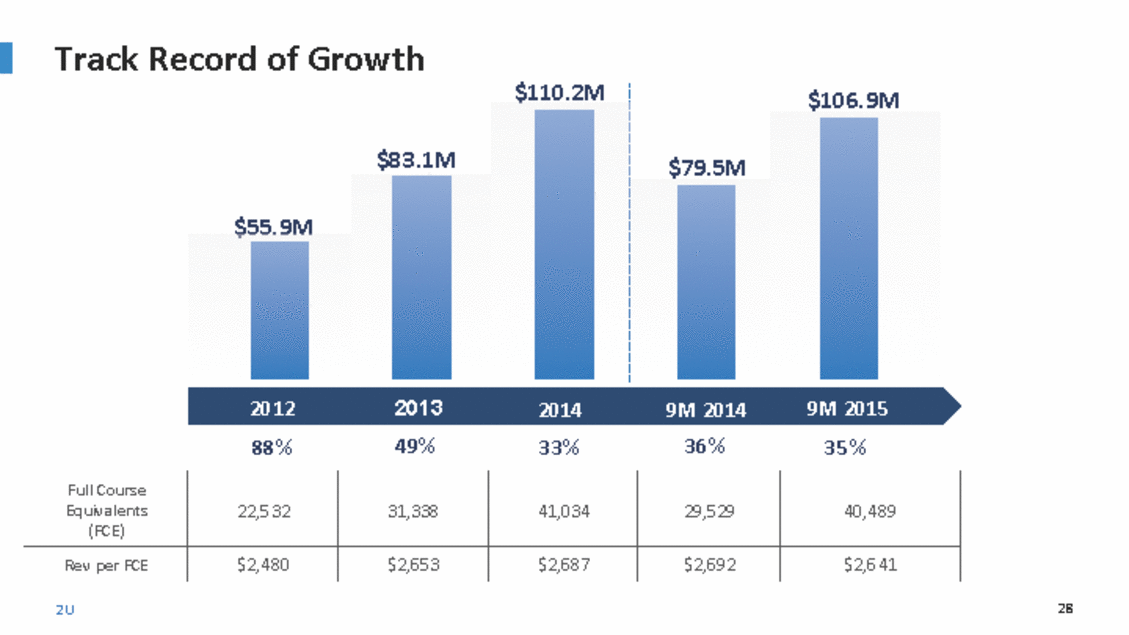
Track Record of Growth $110.2M $106.9M $83.1M $79.5M $55.9M 2013 49% 2012 88% 9M 2015 35% 2014 33% 9M 2014 36% Full Course Equivalents (FCE) Rev per FCE 22,532 31,338 41,034 29,529 40,489 $2,480 $2,653 $2,687 $2,692 $2,641 2U 28
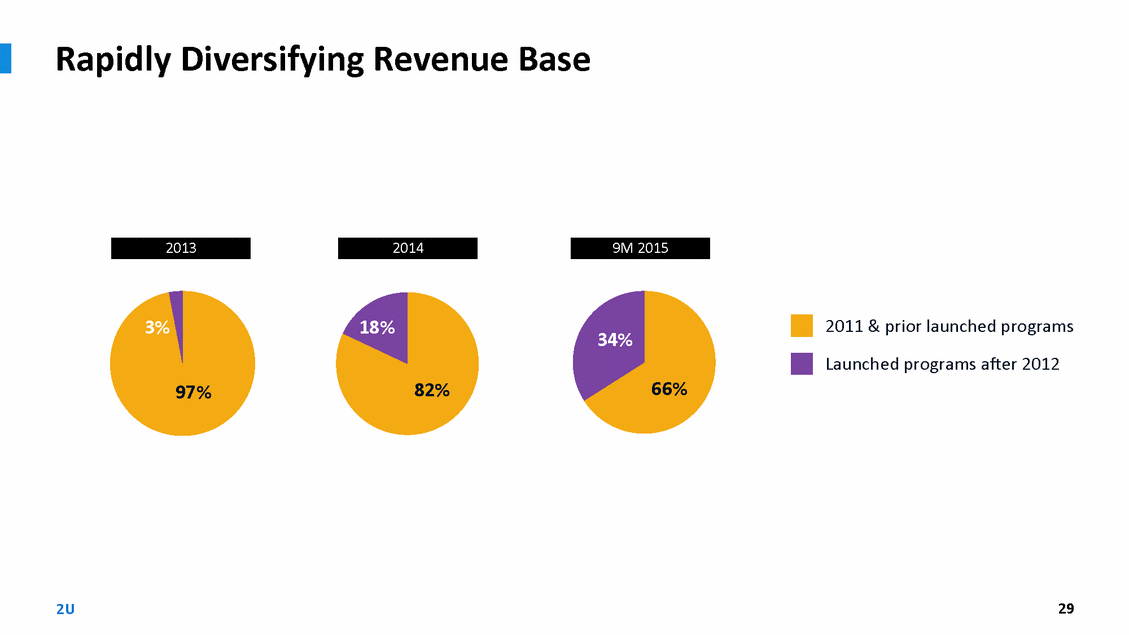
Rapidly Diversifying Revenue Base 2013 2014 9M 2015 2011 & prior launched programs 3% 18% 34% Launched programs a[er 2012 66% 82% 97% 2U 29
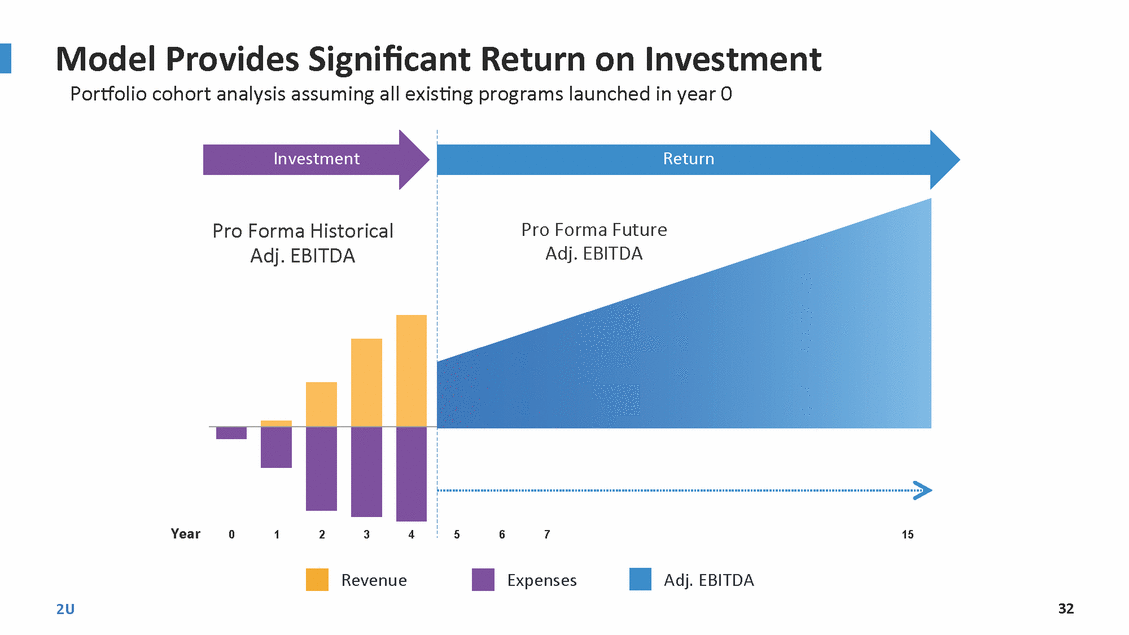
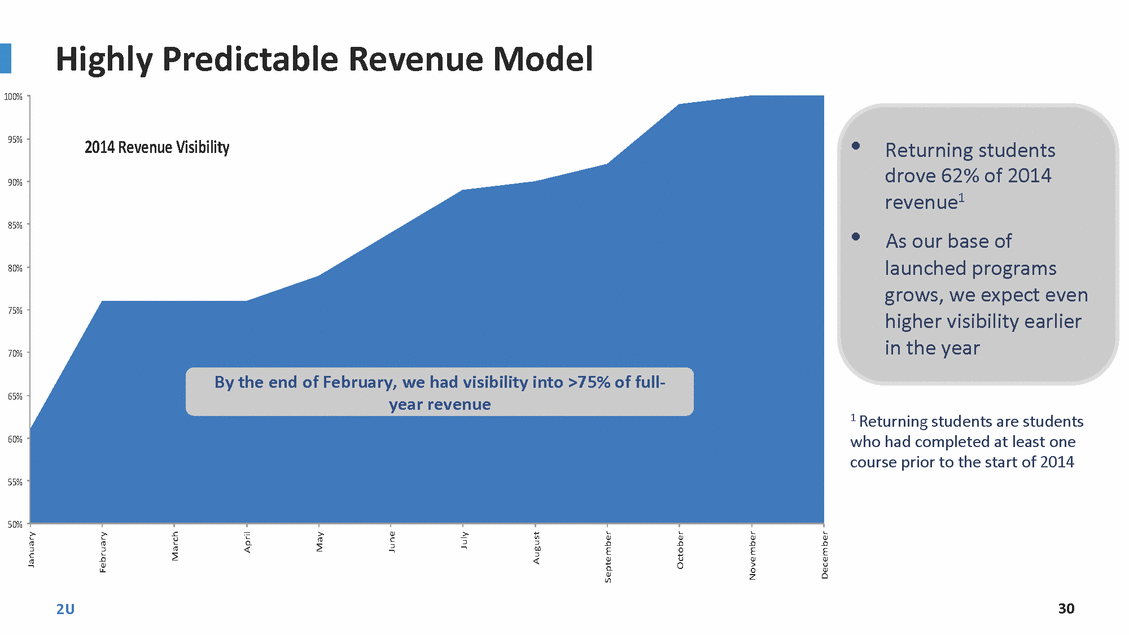
Highly Predictable Revenue Model 100%$ • 95%$ 2014%Revenue%Visibility% Returning students drove 62% of 2014 revenue1 As our base of launched programs grows, we expect even higher visibility earlier in the year 90%$ 85%$ • 80%$ 75%$ 70%$ By the end of February, we had visibility into >75% of full-‐ year revenue 65%$ 1 Returning students are students who had completed at least one course prior to the start of 2014 60%$ 55%$ 50%$ 2U 30 January$ February$ March$ April$ May$ June$ July$ August$ September$ October$ November$ December$
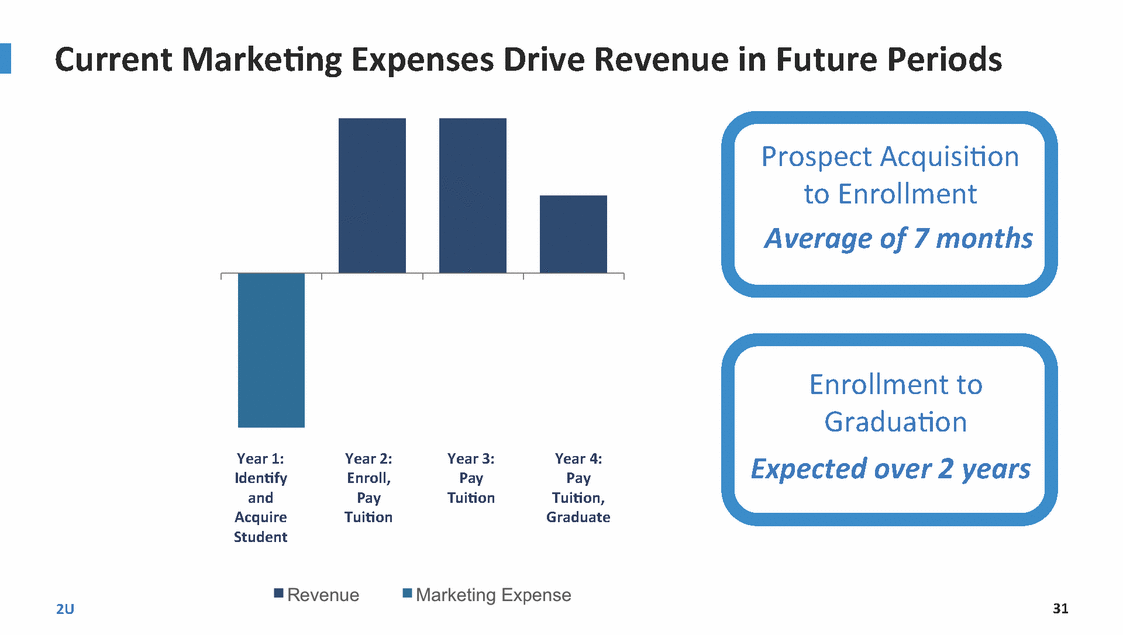
Current Marke;ng Expenses Drive Revenue in Future Periods Prospect Acquisi2on to Enrollment Average of 7 months Enrollment to Gradua2on Expected over 2 years Year 1: Iden;fy and Acquire Student Year 2: Enroll, Pay Tui;on Year 3: Pay Tui;on Year 4: Pay Tui;on, Graduate 2U 31
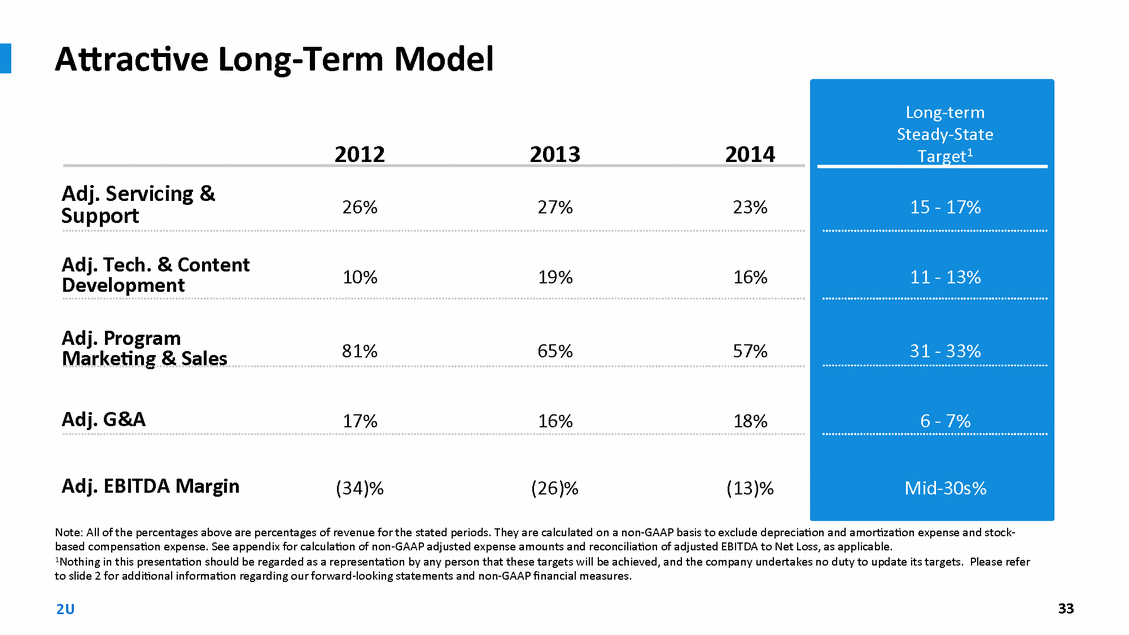
Model Provides Significant Return on Investment Porsolio cohort analysis assuming all exis2ng programs launched in year 0 Investment Return Pro Forma Future Adj. EBITDA Pro Forma Historical Adj. EBITDA Year 6 7 15 Revenue Expenses Adj. EBITDA 2U 32 0123 45

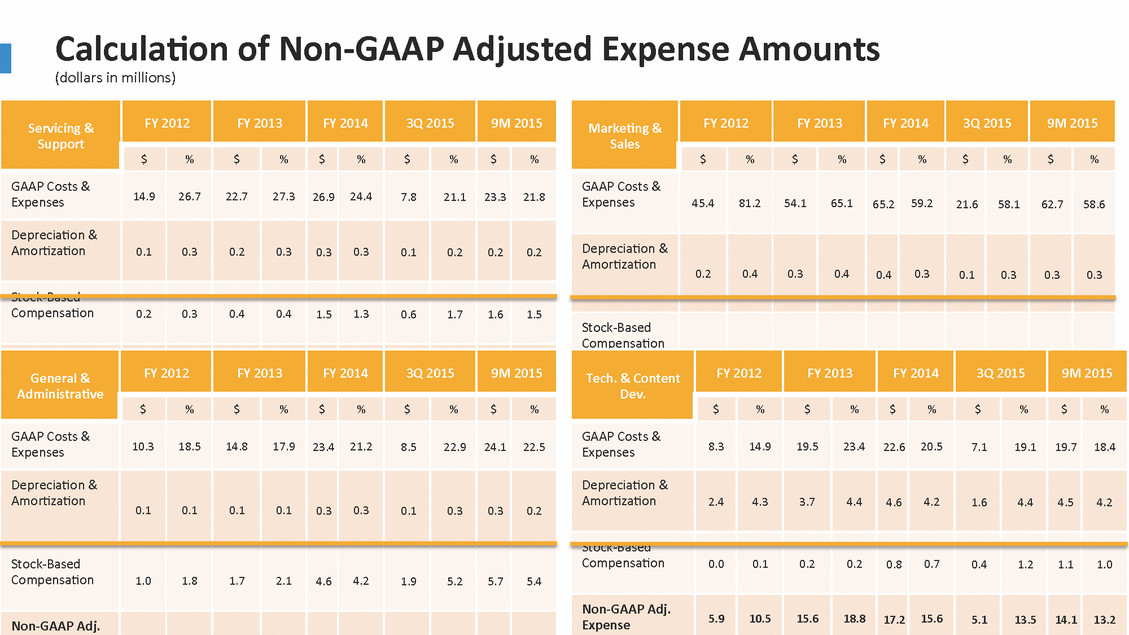
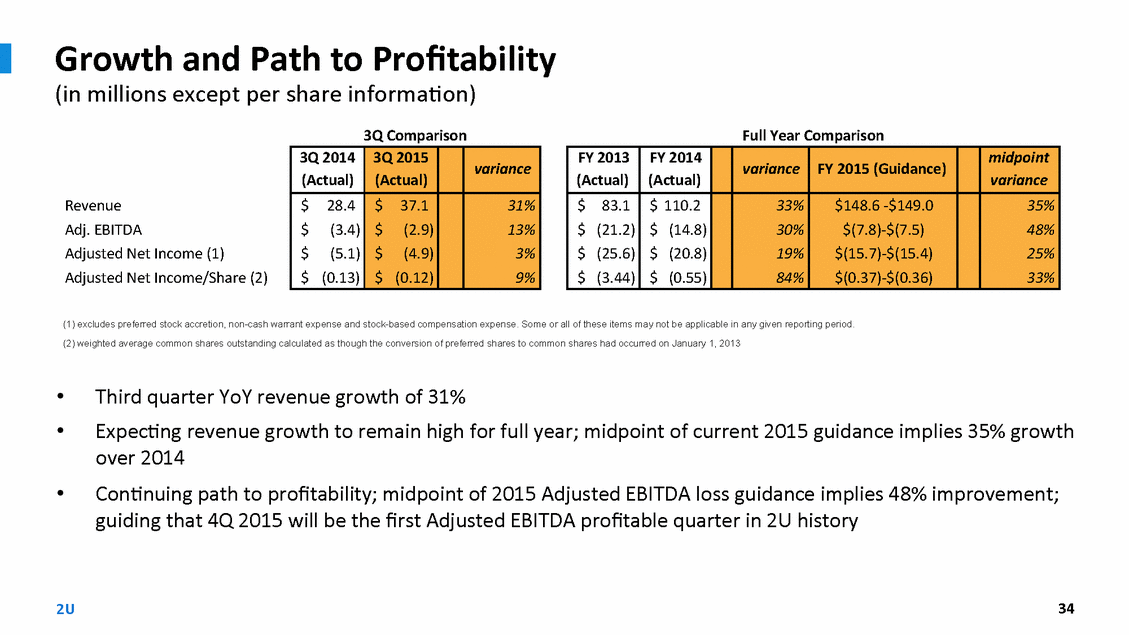
ATrac;ve Long-‐Term Model Long-‐term Steady-‐State Target1 15 -‐ 17% 11 -‐ 13% 31 -‐ 33% 6 -‐ 7% Mid-‐30s% Note: All of the percentages above are percentages of revenue for the stated periods. They are calculated on a non-‐GAAP basis to exclude deprecia2on and amor2za2on expense and stock-‐ based compensa2on expense. See appendix for calcula2on of non-‐GAAP adjusted expense amounts and reconcilia2on of adjusted EBITDA to Net Loss, as applicable. 1Nothing in this presenta2on should be regarded as a representa2on by any person that these targets will be achieved, and the company undertakes no duty to update its targets. Please refer to slide 2 for addi2onal informa2on regarding our forward-‐looking statements and non-‐GAAP financial measures. 2U 33 201220132014 Adj. Servicing & Support26%27%23% Adj. Tech. & Content Development10%19%16% Adj. Program Marke;ng & Sales81%65%57% Adj. G&A17%16%18% Adj. EBITDA Margin(34)%(26)%(13)%

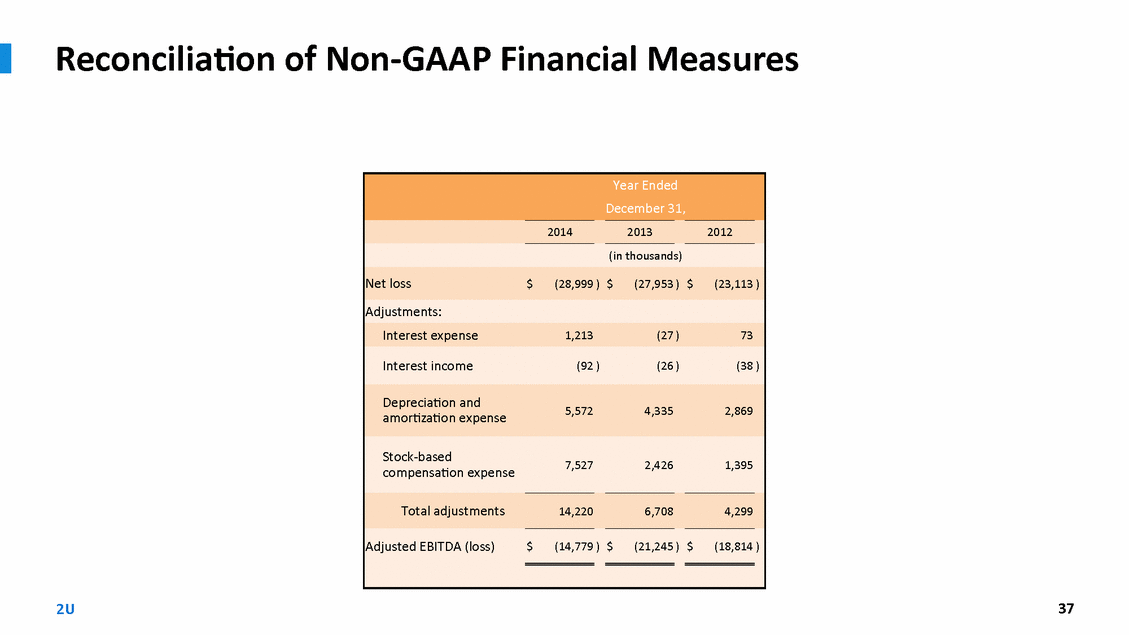
Growth and Path to Profitability (in millions except per share informa2on) 3Q#Comparison Full#Year#Comparison Revenue Adj.+EBITDA Adjusted+Net+Income+(1) Adjusted+Net+Income/Share+(2) (1) excludes preferred stock accretion, non-cash warrant expense and stock-based compensation expense. Some or all of these items may not be applicable in any given reporting period. (2) weighted average common shares outstanding calculated as though the conversion of preferred shares to common shares had occurred on January 1, 2013 • • Third quarter YoY revenue growth of 31% Expec2ng revenue growth to remain high for full year; midpoint of current 2015 guidance implies 35% growth over 2014 Con2nuing path to profitability; midpoint of 2015 Adjusted EBITDA loss guidance implies 48% improvement; guiding that 4Q 2015 will be the first Adjusted EBITDA profitable quarter in 2U history • 2U 34 FY#2013# (Actual) FY#2014# (Actual) variance FY#2015#(Guidance) midpoint-variance $+++++83.1 $+++(+ 21.2) $+++(+ 25.6) $+++(+ 3.44) $+++110.2 $+++(+ 14.8) $+++(+ 20.8) $+++(+ 0.55) 33% 30% 19% 84% $148.6+1$149.0 $(7.8)1$(7.5) $(15.7)1$(15.4) $(0.37)1$(0.36) 35% 48% 25% 33% 3Q#2014# (Actual) 3Q#2015# (Actual) variance $+++++28.4 $++++++(3.4) $++++++(5.1) $++++(0.13) $+++++37.1 $++++++(2.9) $++++++(4.9) $++++(0.12) 31% 13% 3% 9%
Thank y ou. 2U 35
APPE NDIX 2U 36
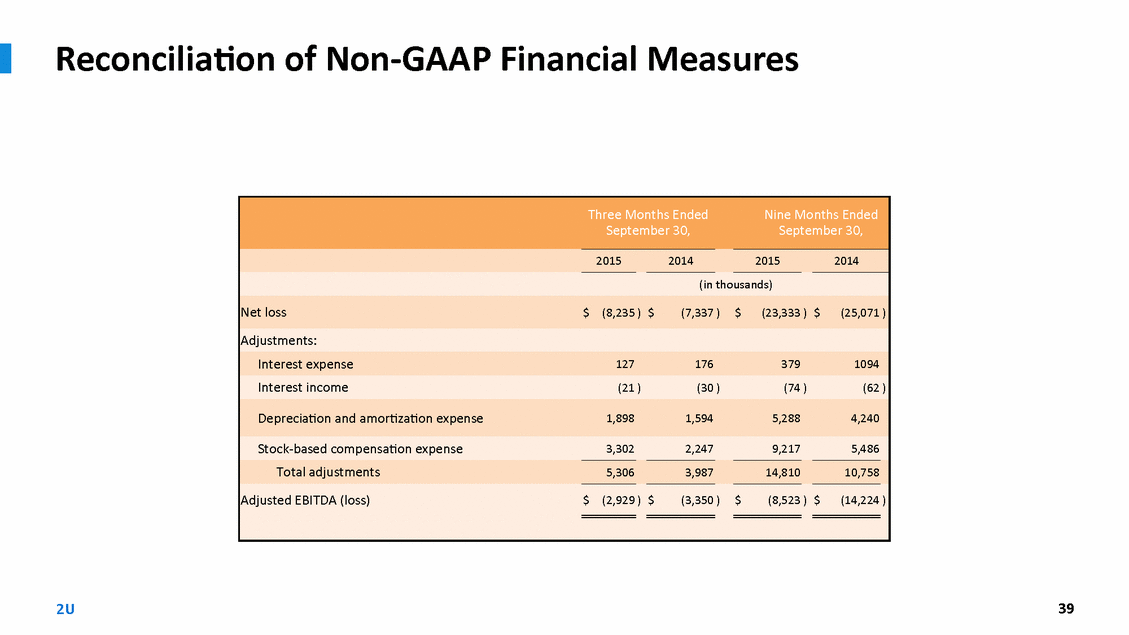
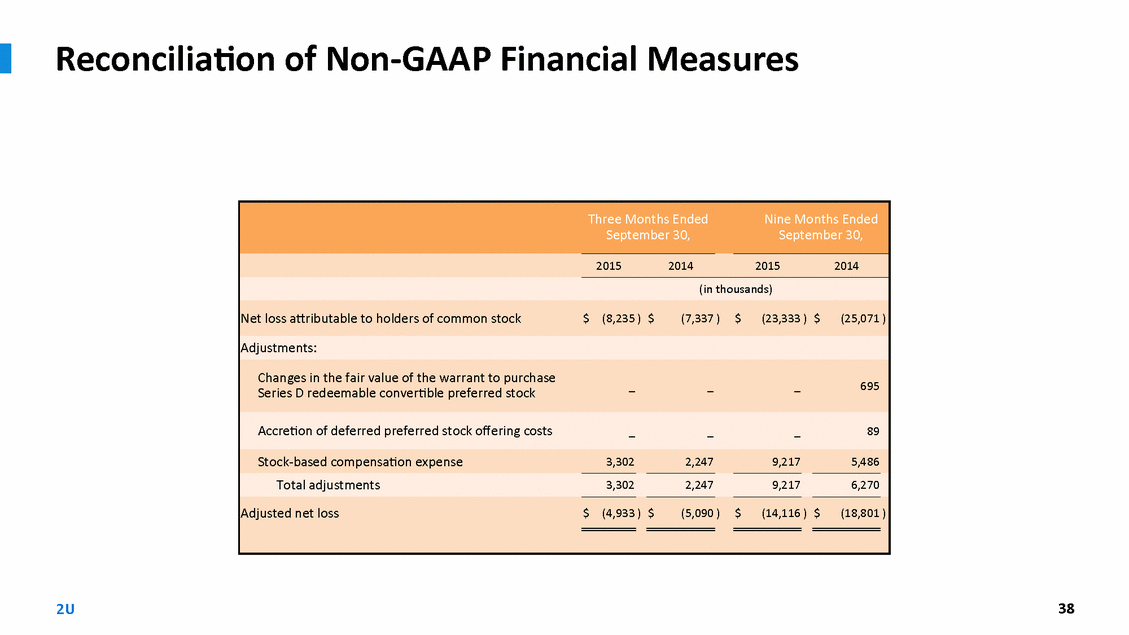
Reconcilia;on of Non-‐GAAP Financial Measures 5,572 4,335 2,869 amor2za2on expense 7,527 2,426 1,395 compensa2on expense 2U 37 Year Ended December 31, 201420132012 (in thousands) Net loss$(28,999 ) $(27,953 ) $(23,113 ) Adjustments: Interest expense1,213(27 )73 Interest income(92 )(26 )(38 ) Deprecia2on and Stock-‐based Total adjustments14,2206,7084,299 Adjusted EBITDA (loss)$(14,779 ) $(21,245 ) $(18,814 )
