Attached files
| file | filename |
|---|---|
| 8-K - FORM 8-K 11-9-15 - Piedmont Office Realty Trust, Inc. | pdm930158kq32015erandsupps.htm |
| EX-99.1 - Q3 2015 EARNINGS RELEASE - Piedmont Office Realty Trust, Inc. | pdm93015ex991q32015earning.htm |
EXHIBIT 99.2

Quarterly Supplemental Information
September 30, 2015
Corporate Headquarters | Institutional Analyst Contact | Investor Relations |
11695 Johns Creek Parkway, Suite 350 | Telephone: 770.418.8592 | Telephone: 866.354.3485 |
Johns Creek, GA 30097 | research.analysts@piedmontreit.com | investor.services@piedmontreit.com |
Telephone: 770.418.8800 | www.piedmontreit.com | |
Piedmont Office Realty Trust, Inc.
Quarterly Supplemental Information
Index
Page | Page | |||
Introduction | Other Investments | |||
Corporate Data | Other Investments Detail | |||
Investor Information | Supporting Information | |||
Financial Highlights | Definitions | |||
Key Performance Indicators | Research Coverage | |||
Financials | Non-GAAP Reconciliations & Other Detail | |||
Balance Sheets | Property Detail | |||
Income Statements | Company Metrics after Aon Center Sale | |||
Funds From Operations / Adjusted Funds From Operations | Risks, Uncertainties and Limitations | |||
Same Store Analysis | ||||
Capitalization Analysis | ||||
Debt Summary | ||||
Debt Detail | ||||
Debt Analysis | ||||
Operational & Portfolio Information - Office Investments | ||||
Tenant Diversification | ||||
Tenant Credit Rating & Lease Distribution Information | ||||
Leased Percentage Information | ||||
Rental Rate Roll Up / Roll Down Analysis | ||||
Lease Expiration Schedule | ||||
Quarterly Lease Expirations | ||||
Annual Lease Expirations | ||||
Capital Expenditures & Commitments | ||||
Contractual Tenant Improvements & Leasing Commissions | ||||
Geographic Diversification | ||||
Geographic Diversification by Location Type | ||||
Industry Diversification | ||||
Property Investment Activity | ||||
Notice to Readers: |
Please refer to page 50 for a discussion of important risks related to the business of Piedmont Office Realty Trust, Inc., as well as an investment in its securities, including risks that could cause actual results and events to differ materially from results and events referred to in the forward-looking information. Considering these risks, uncertainties, assumptions, and limitations, the forward-looking statements about leasing, financial operations, leasing prospects, etc. contained in this quarterly supplemental information report might not occur. |
Certain prior period amounts have been reclassified to conform to the current period financial statement presentation. In addition, many of the schedules herein contain rounding to the nearest thousands or millions and, therefore, the schedules may not total due to this rounding convention. Prior to the second quarter of 2014, when the Company sold properties or was under a binding contract to sell properties, it restated historical income statements with the financial results of the sold or under contract assets presented in discontinued operations. |
Piedmont Office Realty Trust, Inc.
Corporate Data
Piedmont Office Realty Trust, Inc. (also referred to herein as "Piedmont" or the "Company") (NYSE: PDM) is an owner, manager, developer and operator of high-quality, Class A office properties located in select sub-markets of major U.S. cities. Its geographically-diversified, over $5 billion portfolio is comprised of 19 million square feet (as of the date of release of this report). The Company is a fully-integrated, self-managed real estate investment trust ("REIT") with local management offices in each of its major markets and is investment-grade rated by Standard & Poor’s and Moody’s. Piedmont is headquartered in Atlanta, GA.
This data supplements the information provided in our reports filed with the Securities and Exchange Commission and should be reviewed in conjunction with such filings.
As of | As of | ||||
September 30, 2015 | December 31, 2014 | ||||
Number of consolidated office properties (1) | 68 | 74 | |||
Rentable square footage (in thousands) (1) | 20,697 | 21,471 | |||
Percent leased (2) | 90.6 | % | 87.7 | % | |
Capitalization (in thousands): | |||||
Total debt - principal amount outstanding | $2,433,247 | $2,279,787 | |||
Equity market capitalization (3) | $2,605,390 | $2,907,466 | |||
Total market capitalization (3) | $5,038,637 | $5,187,253 | |||
Total debt / Total market capitalization (3) | 48.3 | % | 43.9 | % | |
Total debt / Total gross assets | 40.8 | % | 38.2 | % | |
Common stock data: | |||||
High closing price during quarter | $18.86 | $20.00 | |||
Low closing price during quarter | $16.74 | $17.61 | |||
Closing price of common stock at period end | $17.89 | $18.84 | |||
Weighted average fully diluted shares outstanding during quarter (in thousands) | 149,176 | 154,420 | |||
Shares of common stock issued and outstanding (in thousands) at period end | 145,634 | 154,324 | |||
Annual dividend per share (4) | $0.84 | $0.81 | |||
Rating / outlook | |||||
Standard & Poor's | BBB / Stable | BBB / Stable | |||
Moody's | Baa2 / Stable | Baa2 / Stable | |||
Employees | 136 | 130 | |||
(1) | As of September 30, 2015, our consolidated office portfolio consisted of 68 properties (exclusive of our equity interest in one property owned through an unconsolidated joint venture, two properties under development, and one property that was taken out of service for redevelopment on January 1, 2014, 3100 Clarendon Boulevard in Arlington, VA). During the first quarter of 2015, we sold 3900 Dallas Parkway, a 120,000 square foot office building located in Plano, TX, and acquired Park Place on Turtle Creek, a 178,000 square foot office building located in Dallas, TX. During the second quarter of 2015, we sold 5601 Headquarters Drive, a 166,000 square foot office building located in Plano, TX, River Corporate Center, a 133,000 square foot office building located in Tempe, AZ, and Copper Ridge Center, a 268,000 square foot office building located in Lyndhurst, NJ. During the third quarter of 2015, we sold Eastpoint I and II, two office buildings consisting of 170,000 square feet located in Mayfield Heights, OH, 3750 Brookside Parkway, a 105,000 square foot office building located in Alpharetta, GA, and Chandler Forum, a 150,000 square foot office building located in Chandler, AZ, and acquired 80 Central Street, a 150,000 square foot office building located in Boxborough, MA. For additional detail on asset transactions, please refer to page 37. |
(2) | Calculated as leased square footage plus square footage associated with executed new leases for currently vacant spaces divided by total rentable square footage, all as of the relevant date, expressed as a percentage. This measure is presented for our consolidated office properties and excludes unconsolidated joint venture properties, two development properties, and one out of service property. Please refer to page 27 for additional analyses regarding Piedmont's leased percentage. |
(3) | Reflects common stock closing price as of the end of the reporting period. |
(4) | Total of the per share dividends paid over the prior four quarters. |
3
Piedmont Office Realty Trust, Inc.
Investor Information
Corporate |
11695 Johns Creek Parkway, Suite 350 |
Johns Creek, Georgia 30097 |
770.418.8800 |
www.piedmontreit.com |
Executive Management | |||
Donald A. Miller, CFA | Robert E. Bowers | Laura P. Moon | Raymond L. Owens |
Chief Executive Officer, President | Chief Financial Officer and Executive | Chief Accounting Officer and | Executive Vice President, |
and Director | Vice President | Senior Vice President | Capital Markets |
Joseph H. Pangburn | Thomas R. Prescott | Carroll A. Reddic, IV | C. Brent Smith |
Executive Vice President, | Executive Vice President, | Executive Vice President, | Executive Vice President, |
Southwest Region | Midwest Region | Real Estate Operations and Assistant | New York Region and Strategic |
Secretary | Investments | ||
George Wells | Robert K. Wiberg | ||
Executive Vice President, | Executive Vice President, | ||
Southeast Region | Mid-Atlantic Region and | ||
Head of Development | |||
Board of Directors | |||
Michael R. Buchanan | Wesley E. Cantrell | Barbara B. Lang | Frank C. McDowell |
Director and Chairman of the | Director and Chairman of | Director | Director, Vice Chairman of the |
Board of Directors | Governance Committee | Board of Directors and Chairman | |
of Compensation Committee | |||
Donald A. Miller, CFA | Raymond G. Milnes, Jr. | Jeffery L. Swope | Dale H. Taysom |
Chief Executive Officer, President | Director and Chairman of | Director and Chairman of | Director |
and Director | Audit Committee | Capital Committee | |
Transfer Agent | Corporate Counsel |
Computershare | King & Spalding |
P.O. Box 30170 | 1180 Peachtree Street, NE |
College Station, TX 77842-3170 | Atlanta, GA 30309 |
Phone: 866.354.3485 | Phone: 404.572.4600 |
4
Piedmont Office Realty Trust, Inc.
Financial Highlights
As of September 30, 2015
Financial Results (1)
Funds from operations (FFO) for the quarter ended September 30, 2015 was $60.9 million, or $0.41 per share (diluted), compared to $58.7 million, or $0.38 per share (diluted), for the same quarter in 2014. FFO for the nine months ended September 30, 2015 was $180.5 million, or $1.19 per share (diluted), compared to $174.5 million, or $1.13 per share (diluted), for the same period in 2014. The increase in FFO for the three months and the nine months ended September 30, 2015 as compared to the same periods in 2014 was primarily attributable to operating income contributions from 1) the commencement of leases representing net absorption of available space in the portfolio, and 2) new or renewal leases under which operating expense recovery abatements have expired, both of which were partially offset by 3) increased general and administrative expense in 2015 primarily related to higher accrued potential performance-based compensation expense as a result of the Company's stock performance relative to peers. The increase in FFO for the nine months ended September 30, 2015 as compared to the same period in 2014 was also partially offset by non-recurring insurance recoveries included in 2014 results.
Core funds from operations (Core FFO) for the quarter ended September 30, 2015 was $61.1 million, or $0.41 per share (diluted), compared to $58.8 million, or $0.38 per share (diluted), for the same quarter in 2014. Core FFO for the nine months ended September 30, 2015 was $180.9 million, or $1.19 per share (diluted), compared to $170.5 million, or $1.10 per share (diluted), for the same period in 2014. Core FFO is defined as FFO with incremental adjustments for certain non-recurring items such as net insurance recoveries or losses, acquisition-related costs and other significant non-recurring items. The change in Core FFO for the three months and the nine months ended September 30, 2015 as compared to the same periods in 2014 was primarily attributable to the items described above for changes in FFO, with the exception of non-recurring insurance recoveries, which are excluded from Core FFO.
Adjusted funds from operations (AFFO) for the quarter ended September 30, 2015 was $52.4 million, or $0.35 per share (diluted), compared to $21.8 million, or $0.14 per share (diluted), for the same quarter in 2014. AFFO for the nine months ended September 30, 2015 was $143.8 million, or $0.94 per share (diluted), compared to $77.0 million, or $0.50 per share (diluted), for the same period in 2014. The increase in AFFO for the three months and the nine months ended September 30, 2015 as compared to the same periods in 2014 was primarily related to the items described above for changes in FFO and Core FFO, as well as lesser amounts of straight line rent adjustments and non-incremental capital expenditures in 2015 when compared to 2014. Piedmont experienced a period of high lease expirations from 2011 to 2013. Given the competitive leasing environment over the last several years, many of the leases that the Company entered into during that period included rental abatements, which typically occur at the beginning of a new lease's term. Most of the new or renewal leases with rental abatements are in the early stages of the new leases' terms, resulting in temporarily higher straight line rent adjustments for Piedmont. As the rental abatement periods continue to expire, the straight line rent adjustments will continue to decrease. The higher non-incremental capital expenditures in 2014 when compared to 2015 were also related to the high volume of lease transactions completed during the period from 2011 to 2013.
The changes in per share amounts of FFO, Core FFO and AFFO for the three months and the nine months ended September 30, 2015 as compared to the same periods in 2014 were also impacted by the reduced weighted average shares outstanding in 2015 as a result of the Company's stock repurchase program. Since the beginning of 2014, Piedmont has repurchased 12.0 million shares at an average price of $17.37 per share.
Operations & Leasing
On a square footage leased basis, our total office portfolio was 90.6% leased as of September 30, 2015, as compared to 88.8% in the prior quarter and 87.5% a year earlier. Please refer to page 27 for additional leased percentage information.
The weighted average remaining lease term of our portfolio was 7.1 years(2) as of September 30, 2015 as compared to 7.1 years at December 31, 2014.
(1) | |
(2) | Remaining lease term (after taking into account leases for vacant spaces which had been executed but not commenced as of September 30, 2015) is weighted based on Annualized Lease Revenue, as defined on page 39. |
5
As previously disclosed, Piedmont commenced the redevelopment of its 3100 Clarendon Boulevard property, a 262,000 square foot office and retail property located in Arlington, VA, during the first quarter of 2014. The building's retail tenants have remained in occupancy during the redevelopment. Therefore, from an accounting standpoint, the office component of the building was taken out of service and the retail portion of the building, comprised of approximately 28,000 square feet, remained in service during the redevelopment. However, for the purposes of statistical reporting throughout this supplemental report, the entire building has been removed from Piedmont's operating portfolio. For additional information regarding the redevelopment of 3100 Clarendon Boulevard, please refer to the Financing and Capital Activity section within the Financial Highlights of this report.
During the three months ended September 30, 2015, the Company completed 901,000 square feet of total leasing. Of the total leasing activity during the quarter, we signed renewal leases for approximately 303,000 square feet and new tenant leases for approximately 598,000 square feet. During the nine months ended September 30, 2015, we completed 2,290,000 square feet of leasing for our consolidated office properties, consisting of 992,000 square feet of renewal leases and 1,298,000 square feet of new tenant leases. The average committed tenant improvement cost per square foot per year of lease term for renewal leases signed at our consolidated office properties during the nine months ended September 30, 2015 was $2.58 and the same measure for new leases was $5.53 (see page 33).
During the three months ended September 30, 2015, we executed seven leases greater than 20,000 square feet with lengths of term of more than one year at our consolidated office properties. Information on those leases is set forth below.
Tenant | Property | Property Location | Square Feet Leased | Expiration Year | Lease Type |
Kraft Heinz Foods Company | Aon Center | Chicago, IL | 169,717 | 2029 | New |
Motorola Solutions, Inc. | 500 West Monroe Street | Chicago, IL | 150,345 | 2028 | New |
International Food Policy Research Institute | 1201 Eye Street | Washington, DC | 101,937 | 2029 | New |
Greensky Trade Credit, LLC | Glenridge Highlands Two | Atlanta, GA | 36,347 | 2021 | New |
NCH Management Systems, Inc. | Fairway Center II | Brea, CA | 34,574 | 2022 | Renewal / Expansion |
KPMG, LLP | Aon Center | Chicago, IL | 31,611 | 2027 | Expansion |
PlainsCapital Bank | Park Place on Turtle Creek | Dallas, TX | 31,550 | 2025 | Renewal |
As of September 30, 2015, there were two tenants whose leases were scheduled to expire during the eighteen month period following the end of the third quarter of 2015 which individually contributed greater than 1% in net Annualized Lease Revenue ("ALR"). Information regarding the leasing status of the spaces associated with these tenants' leases is presented below.
Tenant | Property | Property Location | Net Square Footage Expiring | Net Percentage of Current Quarter Annualized Lease Revenue Expiring (%) | Expiration | Current Leasing Status |
KeyBank | 2 Gatehall Drive | Parsippany, NJ | 200,000 | 1.0% | Q1 2016 | The tenant is not expected to renew its lease. The space is actively being marketed, and discussions are underway with prospective tenants to lease portions of the space. |
Harcourt | Braker Pointe III | Austin, TX | 195,230 | 1.1% | Q2 2016 | The primary tenant will vacate upon lease expiration. Discussions with current subtenants for direct leases are ongoing. The Company is actively marketing the remainder of the space for lease. |
Future Lease Commencements and Abatements
As of September 30, 2015, our overall leased percentage was 90.6% and our economic leased percentage was 83.0%. The difference between overall leased percentage and economic leased percentage is attributable to two factors:
1. | leases which have been contractually entered into for currently vacant spaces but have not yet commenced (amounting to approximately 674,000 square feet of leases as of September 30, 2015, or 3.2% of the office portfolio); and |
2. | leases which have commenced but the tenants have not commenced paying full rent due to rental abatements (amounting to 1.1 million square feet of leases as of September 30, 2015, or a 4.4% impact to leased percentage on an economic basis). |
6
Piedmont has leases with many large corporate office space users. The average size of lease in the Company's portfolio is approximately 27,000 square feet. Due to the large size and length of term of new leases, Piedmont typically signs leases several months in advance of their anticipated lease commencement dates. Presented below is a schedule of uncommenced leases greater than 50,000 square feet and their anticipated commencement dates. Lease renewals are excluded from this schedule.
Tenant | Property | Property Location | Square Feet Leased | Space Status | Estimated Commencement Date | New / Expansion |
United States of America (Corporation for National and Community Service) | One Independence Square | Washington, DC | 84,606 | Vacant | Q4 2015 | New |
Motorola Solutions, Inc. | 500 West Monroe Street | Chicago, IL | 150,345 | Vacant | Q3 2016 | New |
Norris, McLaughlin & Marcus, P.A. | 400 Bridgewater Crossing | Bridgewater, NJ | 61,642 | Not Vacant | Q4 2016 | New |
Kraft Heinz Foods Company | Aon Center | Chicago, IL | 169,717 | Vacant | Q1 2017 | New |
Continental Casualty Company | 500 TownPark | Lake Mary, FL | 108,000 | Under Development | Q1 2017 | New |
International Food Policy Research Institute (1) | 1201 Eye Street | Washington, DC | 101,937 | Partially Vacant | Q2 2017 / Q2 2018 | New |
Due to the current economic environment, many recently negotiated leases provide for rental abatement concessions to tenants. Rental abatements typically occur at the beginning of a new lease's term. Since the Company's IPO in 2010, Piedmont has signed approximately 16.8 million square feet of leases within its consolidated office portfolio. Due to the large number of new leases in the Company's portfolio, abatements provided under those new leases have temporarily impacted the Company's current cash net operating income and AFFO.
Presented below is a schedule of leases with abatements of greater than 50,000 square feet that are either currently under abatement or will be so within the next twelve months.
Tenant | Property | Property Location | Square Feet | Remaining Abatement Schedule | Lease Expiration |
Advanced Micro Devices | 90 Central Street | Boxborough, MA | 107,244 | March through November 2015 | Q4 2020 |
Catamaran | Windy Point II | Schaumburg, IL | 50,686 | March 2015 through April 2016 | Q1 2025 |
Integrys | Aon Center | Chicago, IL | 160,423 | May through September 2015 and 2016 | Q2 2029 |
AT&T Illinois | Aon Center | Chicago, IL | 75,113 | July through December 2015; August 2017 through January 2018 | Q3 2029 |
Liberty Mutual Insurance Company | Suwanee Gateway One | Suwanee, GA | 59,579 | July through October 2015 | Q4 2020 |
Lockton Companies | 500 West Monroe Street | Chicago, IL | 52,201 | August 2015 through July 2016 | Q3 2026 |
Comcast | Windy Point I | Schaumburg, IL | 72,513 | October 2015 through February 2016 | Q1 2023 |
Nestle | 800 North Brand Boulevard | Glendale, CA | 400,892 | December 2015 through March 2016 | Q1 2021 |
Aon | Aon Center | Chicago, IL | 382,076 | January through May 2016 | Q4 2028 |
DDB Needham | Aon Center | Chicago, IL | 187,000 | January 2016 through June 2018 | Q2 2018 |
United States of America (Corporation for National and Community Service) | One Independence Square | Washington, DC | 84,606 | January 2016 through June 2017 | Q4 2030 |
Miller Canfield | 150 West Jefferson | Detroit, MI | 69,974 | January 2016 | Q2 2026 |
Thoughtworks | Aon Center | Chicago, IL | 52,529 | January through March 2016 and 2017 | Q4 2023 |
Mitsubishi Hitachi Power Systems | 400 TownPark | Lake Mary, FL | 75,321 | February and March 2016, 2017 and 2018 | Q1 2026 |
Motorola Solutions, Inc. | 500 West Monroe Street | Chicago, IL | 150,345 | July 2016 through June 2017 | Q2 2028 |
(1) | Approximately 45,000 square feet of space associated with the lease is vacant; the tenant will take the currently vacant space in Q2 2017. |
7
Financing and Capital Activity
Among Piedmont's strategic objectives is to harvest capital through the disposition of non-core assets, assets where returns have been maximized, and assets located in non-strategic submarkets and to use the sale proceeds to:
• | invest in real estate assets with higher overall return prospects in selected markets in which we have, or plan to have, a significant operating presence and that otherwise meet our strategic criteria; |
• | reduce leverage levels by repaying outstanding debt; and/or |
• | repurchase Company stock. |
During the third quarter of 2015, the Company continued to execute on its strategic plan, the details of which are provided below.
Dispositions (1)
• | On July 28, 2015, Piedmont completed the sale of Eastpoint I and II, the 91% leased, 170,000 square foot sister buildings located in Mayfield Heights, OH, for $18.5 million, or $108 per square foot. The sale of the properties marks Piedmont’s exit from the Cleveland, OH market. Piedmont recorded an impairment loss on the assets of approximately $5.4 million during the second quarter of 2015 as a result of changing the holding period assumptions for the properties and a $0.2 million loss on the sale of the assets. |
• | On August 10, 2015, Piedmont completed the sale of 3750 Brookside Parkway, a 105,000 square foot, 91% leased office building located in Alpharetta, GA, for $14.1 million, or $134 per square foot. Piedmont recorded a $1.4 million gain on the sale of the asset. |
• | On September 1, 2015, Piedmont completed the sale of Chandler Forum, a 150,000 square foot, single-tenant, 100% leased office building located in Chandler, AZ, for $33.9 million, or $226 per square foot. Piedmont recorded a $15.5 million gain on the sale of the asset. The sale leaves the Company with one remaining asset in the Phoenix market. |
Acquisitions
• | On July 24, 2015, Piedmont completed the purchase of 80 Central Street, a three-story, 93% leased, 150,000 square foot office building located in the Boston submarket of Boxborough, MA. The property is located adjacent to the Company's 90 Central Street property, with which it shares certain building systems and amenities, and its acquisition allows Piedmont to realize marketing and operational synergies. The purchase price was $13.5 million, or $90 per square foot, which is significantly below the estimated replacement cost of $275 per square foot. |
For additional information on acquisitions and dispositions, please refer to page 37.
Development
During the first quarter of 2014, Piedmont commenced the redevelopment of its 3100 Clarendon Boulevard property, a 262,000 square foot office and retail property located adjacent to the Clarendon Metrorail Station in Arlington, VA. Until the end of 2013, the property had been predominantly leased to the United States of America (Defense Intelligence Agency) for the previous 15+ years. The expiration of the U.S. Government's lease afforded Piedmont the opportunity to upgrade and reposition the property in order to attract private sector tenants and to capture the incremental value potential for the location (attributable primarily to nearby amenities desirable to tenants, including housing, retail, and Metrorail transportation). The project remains on schedule; a majority of the redevelopment relates to the office tower and is complete. The retail facade portion of the redevelopment is underway and should be completed in 2015. From an accounting standpoint, during the redevelopment, the office component of the building has been out of service and the retail portion of the building, comprised of approximately 28,000 square feet, has remained in service. However, for the purposes of statistical reporting on the Company's assets in this supplemental report, the entire building has been removed from Piedmont's operating portfolio. It is anticipated that the total costs to redevelop the building (exclusive of capitalized implied financing costs) will be approximately $33 million, approximately $27.2 million of which had been recorded in work in progress as of September 30, 2015. Following the completion of the redevelopment, the Company anticipates incurring additional re-leasing costs.
During the fourth quarter of 2013, Piedmont announced the development of Enclave Place, a 301,000 square foot office building located in Houston, TX. The eleven-story building is being constructed on Piedmont's 4.7 acre development site adjacent to its 1430 Enclave Parkway property and located within a deed-restricted and architecturally-controlled office park in Houston's Energy Corridor. Ground was broken in April 2014, and physical construction was completed during the third quarter of 2015. The development costs are anticipated to be approximately $85 million to $90 million, inclusive of leasing costs. Approximately $58.8 million had been recorded in work in progress as of September 30, 2015.
(1) | On April 1, 2014, Piedmont early-adopted the provisions of Financial Accounting Standards Board ASU 2014-08. As such, Piedmont will no longer reclassify to discontinued operations the operating income associated with newly-sold single assets or small portfolios which do not represent a strategic shift or significant impact on Piedmont's future operations. There will be no restatement for prior periods and all operating income associated with assets either sold or under binding contract to sell as of the end of the first quarter of 2014 will continue to be reflected in discontinued operations. Assuming future sales do not meet the new criteria for reclassification as discontinued operations, such future sales will not be presented in discontinued operations. |
8
During the second quarter of 2015, Piedmont executed a 108,000 square foot, thirteen-year anchor-tenant lease with Continental Casualty Company at 500 TownPark in Lake Mary, FL. 500 TownPark will be a ground-up development comprised of a 135,000 square foot, four-story office building to be built on a portion of the Company's 25.2 acres of developable land in Lake Mary. With the signing of the Continental Casualty lease, the building is 80% pre-leased. Currently in the design and permitting phase, the Company plans to begin physical construction in late fourth quarter 2015. The development costs are anticipated to be $28 million to $30 million, inclusive of leasing costs. The site is situated at the intersection of Interstate 4 and Highway 417 and is well located within a development consisting of office, retail, residential and hotel uses. After the completion of 500 TownPark, the Company's remaining land holdings in the urban development could accommodate up to 1,200,000 square feet of additional, multi-use development.
For additional information on Piedmont's development projects, please refer to page 38.
Finance
As of September 30, 2015, our ratio of debt to total gross assets was 40.8%. This debt ratio is based on total principal amount outstanding for our various loans at September 30, 2015. Refer to page 48 for additional information on the sale of Aon Center and its impact on the Company.
In anticipation of paying off two maturing mortgages and considering the historically-low interest rate environment, Piedmont entered into several ten-year forward-starting swaps during the first quarter of 2015 for a total notional amount of $250 million for a planned 2016 financing. Through the swaps, the Company has effectively locked the treasury interest rate component of the targeted future financing. At current swap spread levels, the treasury component for a possible future ten-year debt issuance was effectively locked at approximately 2.2% to 2.3%.
Stock Repurchase Program
During the third quarter of 2015, the Company repurchased approximately 6.2 million shares of common stock under its share repurchase program at an average price of $17.76 per share, or approximately $110.2 million (before consideration of transaction costs). Since the stock repurchase program began in December 2011, the Company has repurchased a total of 27.7 million shares at an average price of $17.16 per share, or approximately $476.0 million in aggregate (before consideration of transaction costs). As of quarter end, Board-approved capacity remaining for additional repurchases totaled approximately $80.6 million under the stock repurchase plan. Repurchases of stock under the program will be made at the Company's discretion and will depend on market conditions, other investment opportunities and other factors that the Company deems relevant.
Dividend
On July 29, 2015, the Board of Directors of Piedmont declared a dividend for the third quarter of 2015 in the amount of $0.21 per common share outstanding to stockholders of record as of the close of business on August 28, 2015. The dividend was paid on September 18, 2015. The Company's dividend payout percentage for the nine months ended September 30, 2015 was 53% of Core FFO and 68% of AFFO.
Subsequent Events
On October 2, 2015, Piedmont entered into a binding contract to sell 2 Gatehall Drive, a 405,000 square foot, 100% leased office building located in Parsippany, NJ. The sale price is $51 million, or $126 per square foot, with an anticipated closing date in December 2015. As part of the transaction, Piedmont will provide 60% loan-to-value short-term seller financing at an interest rate of 7.0%. The interest-only loan will mature on June 30, 2016; however, there is one six-month extension option available to the borrower, the exercise of which requires the payment of an extension fee and the giving of proper notice. In connection with the receipt of the unsolicited offer to purchase the building, the Company reassessed its holding period assumptions and recorded an impairment loss of $34.8 million during the third quarter of 2015.
On October 29, 2015, Piedmont completed the sale of Aon Center, a 2.7 million square foot office building located in the East Loop of downtown Chicago, IL, for $712 million, or approximately $260 per square foot. Since purchasing the office tower in 2003 for $465.2 million, Piedmont implemented best-in-class management operations, helping it to secure Energy Star ratings, LEED accreditation, and the BOMA 360 designation for the property. The appeal of the asset and its amenity base is evidenced in its high-quality tenant roster, which includes the addition of a 170,000 square foot lease with Kraft Heinz Foods Company commencing in January 2017, bringing the building's leased percentage to approximately 87%. During its ownership, Piedmont was able to attract to the building other well-known companies, such as KPMG, Microsoft, United Health Group, Integrys, and Federal Home Loan Bank of Chicago, in addition to securing the renewals of Aon, JLL and Edelman. The Company successfully positioned the property as one of Chicago's most distinguished business addresses, helping it to realize significant value for its shareholders. Net sales proceeds from the transaction were approximately $646 million after deducting closing costs, buyer-assumed lease abatements and contractual tenant capital improvements and leasing commissions. The sale of the asset, which was the largest individual property in the portfolio, allowed the Company to accomplish the following subsequent to quarter end:
• | Decrease the concentration of its revenues and NOI in one asset, which represented 14% of ALR and 10% of cash NOI at September 30, 2015; |
• | Enhance its balance sheet through the payoff of the balance outstanding under its revolving line of credit; |
• | Increase shareholder value through $110.2 million in stock repurchases completed during the third quarter of 2015 (the funds for which had been drawn on the Company's revolving line of credit during the third quarter of 2015); and |
9
• | Redeploy $259.1 million of proceeds into two real assets that are consistent with the Company’s target market strategy and accretive to earnings (see below for additional information). |
Please see page 48 for a presentation of key metrics at September 30, 2015 for Piedmont, with and without the sale of Aon Center and the related use of proceeds.
On November 4, 2015, utilizing proceeds from the disposition of Aon Center, Piedmont completed the strategic acquisition of a two-property portfolio for a combined purchase price of $259.1 million: SunTrust Center in downtown Orlando, FL, for $170.8 million, or $261 per square foot, and Galleria 300 in Atlanta, GA, for $88.3 million, or $204 per square foot.
• | SunTrust Center is 89% leased and consists of a 30-story, 571,000 square foot, trophy office tower, an adjacent seven-story, 84,000 square foot, Class A office building, and a five-level, 1,292 space parking structure. Located in the heart of Orlando's central business district and the tallest office tower in the city, SunTrust Center offers its tenants an excellent amenity base, including abundant nearby hotel, retail, housing, and transportation options, in addition to several entertainment venues. The purchase was completed at an estimated discount to replacement cost of approximately 30%. |
• | Galleria 300 consists of a 20-story, 433,000 square foot, Class A office building with an attached, seven-story, 1,152 space parking structure. The building is part of the master-planned Galleria development, considered the best Class A office park in the Northwest submarket of Atlanta, with superior accessibility and visibility to two of Atlanta's major thoroughfares, Interstates 285 and 75. There are numerous retail, housing and hotel options proximate to the property, affording the tenancy a compelling amenity base. Additionally, the building is located across Interstate 285 from the new Atlanta Braves ballpark, SunTrust Park, which is bringing additional retail, hotel and residential infill development. At 89% leased, the building offers earnings growth and value accretion potential through leasing up existing vacancies as the area benefits from additional growth and urbanization. The purchase was completed at an estimated discount to replacement cost of approximately 37%. |
The acquisition of both projects is consistent with Piedmont’s strategy to invest in high-quality assets at attractive bases within select submarkets of its strategic operating footprint.
On November 9, 2015, the Board of Directors of Piedmont declared a dividend for the fourth quarter of 2015 in the amount of $0.21 per common share outstanding to stockholders of record as of the close of business on November 27, 2015. The dividend is to be paid on December 18, 2015.
Guidance for 2015
The Company is slightly raising the midpoint and narrowing its financial guidance for calendar year 2015 to reflect the revised outlook for the year based upon current operational circumstances, including the disposition of Aon Center in Chicago, IL and the acquisitions of SunTrust Center in Orlando, FL and Galleria 300 in Atlanta, GA. This guidance is based upon management's expectations at this time.
Low | High | ||
Core Funds from Operations | $240 million | $244 million | |
Core Funds from Operations per diluted share | $1.59 | $1.62 | |
These estimates reflect management’s view of current market conditions and incorporate certain economic and operational assumptions and projections. Actual results could differ from these estimates. Note that individual quarters may fluctuate on both a cash basis and an accrual basis due to the timing of lease commencements and expirations, repairs and maintenance, capital expenditures, capital markets activities, seasonal general and administrative expenses, accrued potential performance-based compensation expenses, and one-time revenue or expense events. In addition, the Company’s guidance is based on information available to management as of the date of this supplemental report.
10
Piedmont Office Realty Trust, Inc.
Key Performance Indicators
Unaudited (in thousands except for per share data)
This section of our supplemental report includes non-GAAP financial measures, including, but not limited to, Core Earnings Before Interest, Taxes, Depreciation, and Amortization (Core EBITDA), Funds from Operations (FFO), Core Funds from Operations (Core FFO), and Adjusted Funds from Operations (AFFO). Definitions of these non-GAAP measures are provided on page 39 and reconciliations are provided beginning on page 41. |
Three Months Ended | ||||||||||||||
9/30/2015 | 6/30/2015 | 3/31/2015 | 12/31/2014 | 9/30/2014 | ||||||||||
Selected Operating Data | ||||||||||||||
Percent leased (1) | 90.6 | % | 88.8 | % | 88.8 | % | 87.7 | % | 87.5 | % | ||||
Percent leased - economic (1) (2) | 83.0 | % | 82.4 | % | 80.6 | % | 81.3 | % | 78.7 | % | ||||
Rental income | $117,994 | $117,454 | $117,807 | $115,915 | $114,529 | |||||||||
Total revenues | $148,815 | $146,734 | $149,759 | $146,711 | $144,641 | |||||||||
Total operating expenses | $149,948 | (3) | $125,910 | $121,545 | $117,922 | $117,442 | ||||||||
Core EBITDA | $80,062 | $77,969 | $79,314 | $78,613 | $77,613 | |||||||||
Core FFO applicable to common stock | $61,058 | $59,760 | $60,099 | $59,618 | $58,814 | |||||||||
Core FFO per share - diluted | $0.41 | $0.39 | $0.39 | $0.39 | $0.38 | |||||||||
AFFO applicable to common stock | $52,433 | $45,734 | $45,608 | $41,205 | $21,829 | |||||||||
AFFO per share - diluted | $0.35 | $0.30 | $0.30 | $0.27 | $0.14 | |||||||||
Gross dividends | $31,036 | $32,268 | $32,411 | $32,408 | $30,865 | |||||||||
Dividends per share | $0.210 | $0.210 | $0.210 | $0.210 | $0.200 | |||||||||
Selected Balance Sheet Data | ||||||||||||||
Total real estate assets | $3,934,113 | $4,005,824 | $4,094,942 | $4,075,092 | $4,058,414 | |||||||||
Total gross real estate assets | $5,153,613 | $5,215,938 | $5,297,481 | $5,253,356 | $5,197,338 | |||||||||
Total assets | $4,739,874 | $4,781,302 | $4,819,862 | $4,795,501 | $4,778,302 | |||||||||
Net debt (4) | $2,387,840 | $2,315,934 | $2,320,504 | $2,261,802 | $2,226,326 | |||||||||
Total liabilities | $2,647,136 | $2,525,451 | $2,533,939 | $2,483,486 | $2,439,456 | |||||||||
Ratios | ||||||||||||||
Core EBITDA margin (5) | 53.8 | % | 53.1 | % | 53.0 | % | 53.6 | % | 53.7 | % | ||||
Fixed charge coverage ratio (6) | 4.0 x | 4.0 x | 4.0 x | 4.0 x | 4.0 x | |||||||||
Average net debt to Core EBITDA (7) | 7.3 x | 7.4 x | 7.2 x | 7.1 x | 6.9 x | |||||||||
(1) | Please refer to page 27 for additional leased percentage information. |
(2) | Economic leased percentage excludes the square footage associated with executed but not commenced leases for currently vacant spaces and the square footage associated with tenants receiving rental abatements (after proportional adjustments for tenants receiving only partial rental abatements). Due to variations in rental abatement structures whereby some abatements are provided for the first few months of each lease year as opposed to being provided entirely at the beginning of the lease, there will be variability to the economic leased percentage over time as abatements commence and expire. Please see the Future Lease Commencements and Abatements section of Financial Highlights for details on near-term abatements for large leases. |
(3) | Amount includes a $34.8 million impairment loss associated with 2 Gatehall Drive located in Parsippany, NJ. Please refer to the Subsequent Events section of Financial Highlights for additional information. |
(4) | Net debt is calculated as the total principal amount of debt outstanding minus cash and cash equivalents and escrow deposits and restricted cash. The increase in net debt over the last year is primarily attributable to capital expenditures and stock repurchases in excess of net dispositions during that time period, the shortfall of which was largely funded with debt. |
(5) | Core EBITDA margin is calculated as Core EBITDA divided by total revenues (including revenues associated with discontinued operations). |
(6) | The fixed charge coverage ratio is calculated as Core EBITDA divided by the sum of interest expense, principal amortization, capitalized interest and preferred dividends. The Company had no preferred dividends during any of the periods presented; the Company had capitalized interest of $954,086 for the quarter ended September 30, 2015, $885,576 for the quarter ended June 30, 2015, $823,770 for the quarter ended March 31, 2015, $688,177 for the quarter ended December 31, 2014, and $541,349 for the quarter ended September 30, 2014; the Company had principal amortization of $204,580 for the quarter ended September 30, 2015, $201,768 for the quarter ended June 30, 2015, $132,969 for the quarter ended March 31, 2015, $262,284 for the quarter ended December 31, 2014, and $193,560 for the quarter ended September 30, 2014. |
(7) | Core EBITDA is annualized for the purposes of this calculation. The average net debt to Core EBITDA ratios presented are higher than our historical performance on this measure primarily as a result of capital expenditures and stock repurchases in excess of net dispositions, the shortfall of which was largely funded with debt. This measure has also been impacted by downtime associated with recent re-tenanting efforts, as well as rent roll downs. For the purposes of this calculation, we use the average daily balance of debt outstanding during the period, less cash and cash equivalents and escrow deposits and restricted cash as of the end of the period. |
11
Piedmont Office Realty Trust, Inc.
Consolidated Balance Sheets
Unaudited (in thousands)
September 30, 2015 | June 30, 2015 | March 31, 2015 | December 31, 2014 | September 30, 2014 | |||||||||||||||
Assets: | |||||||||||||||||||
Real estate, at cost: | |||||||||||||||||||
Land assets | $ | 671,832 | $ | 672,747 | $ | 679,094 | $ | 674,554 | $ | 666,666 | |||||||||
Buildings and improvements | 3,589,298 | 3,620,647 | 3,671,925 | 3,631,580 | 3,608,540 | ||||||||||||||
Buildings and improvements, accumulated depreciation | (933,717 | ) | (911,168 | ) | (914,551 | ) | (889,997 | ) | (861,347 | ) | |||||||||
Intangible lease asset | 148,403 | 153,106 | 153,465 | 150,037 | 150,336 | ||||||||||||||
Intangible lease asset, accumulated amortization | (87,633 | ) | (88,954 | ) | (84,212 | ) | (79,860 | ) | (75,409 | ) | |||||||||
Construction in progress | 75,083 | 63,211 | 82,246 | 61,891 | 42,479 | ||||||||||||||
Real estate assets held for sale, gross | 668,997 | 706,227 | 710,751 | 735,295 | 729,318 | ||||||||||||||
Real estate assets held for sale, accumulated depreciation & amortization | (198,150 | ) | (209,992 | ) | (203,776 | ) | (208,408 | ) | (202,169 | ) | |||||||||
Total real estate assets | 3,934,113 | 4,005,824 | 4,094,942 | 4,075,092 | 4,058,414 | ||||||||||||||
Investments in and amounts due from unconsolidated joint ventures | 7,652 | 7,714 | 7,820 | 7,798 | 7,638 | ||||||||||||||
Cash and cash equivalents | 7,702 | 8,997 | 7,479 | 12,306 | 8,815 | ||||||||||||||
Tenant receivables, net of allowance for doubtful accounts | 26,748 | 25,474 | 30,132 | 27,711 | 28,403 | ||||||||||||||
Straight line rent receivable | 149,060 | 146,632 | 150,511 | 146,836 | 141,219 | ||||||||||||||
Notes receivable | 45,400 | 45,400 | — | — | — | ||||||||||||||
Escrow deposits and restricted cash | 37,705 | 521 | 671 | 5,679 | 908 | ||||||||||||||
Prepaid expenses and other assets | 31,764 | 31,070 | 24,941 | 25,656 | 34,626 | ||||||||||||||
Goodwill | 180,097 | 180,097 | 180,097 | 180,097 | 180,097 | ||||||||||||||
Interest rate swap | — | 8,290 | 520 | 430 | 434 | ||||||||||||||
Deferred financing costs, less accumulated amortization | 7,220 | 7,491 | 7,391 | 7,667 | 7,969 | ||||||||||||||
Deferred lease costs, less accumulated amortization | 231,379 | 234,127 | 238,085 | 228,953 | 232,236 | ||||||||||||||
Other assets held for sale | 81,034 | 79,665 | 77,273 | 77,276 | 77,543 | ||||||||||||||
Total assets | $ | 4,739,874 | $ | 4,781,302 | $ | 4,819,862 | $ | 4,795,501 | $ | 4,778,302 | |||||||||
Liabilities: | |||||||||||||||||||
Unsecured debt, net of discount | $ | 1,925,863 | $ | 1,817,538 | $ | 1,877,318 | $ | 1,828,544 | $ | 1,784,412 | |||||||||
Secured debt | 502,456 | 502,757 | 448,791 | 449,045 | 449,427 | ||||||||||||||
Accounts payable, accrued expenses, and accrued capital expenditures | 132,741 | 128,898 | 119,466 | 133,988 | 135,320 | ||||||||||||||
Deferred income | 26,087 | 26,633 | 25,970 | 22,215 | 21,958 | ||||||||||||||
Intangible lease liabilities, less accumulated amortization | 38,896 | 40,597 | 42,311 | 42,560 | 44,214 | ||||||||||||||
Interest rate swaps | 20,526 | 8,411 | 19,416 | 6,417 | 3,358 | ||||||||||||||
Notes Payable and other liabilities held for sale | 567 | 617 | 667 | 717 | 767 | ||||||||||||||
Total liabilities | $ | 2,647,136 | $ | 2,525,451 | $ | 2,533,939 | $ | 2,483,486 | $ | 2,439,456 | |||||||||
Stockholders' equity: | |||||||||||||||||||
Common stock | 1,456 | 1,518 | 1,543 | 1,543 | 1,543 | ||||||||||||||
Additional paid in capital | 3,669,154 | 3,668,378 | 3,667,574 | 3,666,182 | 3,669,541 | ||||||||||||||
Cumulative distributions in excess of earnings | (1,570,377 | ) | (1,427,312 | ) | (1,378,786 | ) | (1,365,620 | ) | (1,345,609 | ) | |||||||||
Other comprehensive loss | (8,524 | ) | 12,242 | (5,437 | ) | 8,301 | 11,758 | ||||||||||||
Piedmont stockholders' equity | 2,091,709 | 2,254,826 | 2,284,894 | 2,310,406 | 2,337,233 | ||||||||||||||
Non-controlling interest | 1,029 | 1,025 | 1,029 | 1,609 | 1,613 | ||||||||||||||
Total stockholders' equity | 2,092,738 | 2,255,851 | 2,285,923 | 2,312,015 | 2,338,846 | ||||||||||||||
Total liabilities, redeemable common stock and stockholders' equity | $ | 4,739,874 | $ | 4,781,302 | $ | 4,819,862 | $ | 4,795,501 | $ | 4,778,302 | |||||||||
Common stock outstanding at end of period | 145,634 | 151,833 | 154,340 | 154,324 | 154,325 | ||||||||||||||
12
Piedmont Office Realty Trust, Inc.
Consolidated Statements of Income
Unaudited (in thousands except for per share data)
Three Months Ended | ||||||||||||||||||||
9/30/2015 | 6/30/2015 | 3/31/2015 | 12/31/2014 | 9/30/2014 | ||||||||||||||||
Revenues: | ||||||||||||||||||||
Rental income | $ | 117,994 | $ | 117,454 | $ | 117,807 | $ | 115,915 | $ | 114,529 | ||||||||||
Tenant reimbursements | 30,273 | 28,813 | 31,390 | 30,295 | 29,579 | |||||||||||||||
Property management fee revenue | 548 | 467 | 562 | 501 | 533 | |||||||||||||||
148,815 | 146,734 | 149,759 | 146,711 | 144,641 | ||||||||||||||||
Expenses: | ||||||||||||||||||||
Property operating costs | 61,677 | 61,479 | 64,236 | 62,002 | 62,027 | |||||||||||||||
Depreciation | 31,199 | 36,039 | 36,232 | 35,442 | 35,366 | |||||||||||||||
Amortization | 14,021 | 14,955 | 14,670 | 14,172 | 14,235 | |||||||||||||||
Impairment losses on real estate assets | 34,815 | 5,354 | — | — | — | |||||||||||||||
General and administrative | 8,236 | 8,083 | 6,407 | 6,306 | 5,814 | |||||||||||||||
149,948 | 125,910 | 121,545 | 117,922 | 117,442 | ||||||||||||||||
Real estate operating income | (1,133 | ) | 20,824 | 28,214 | 28,789 | 27,199 | ||||||||||||||
Other income / (expense): | ||||||||||||||||||||
Interest expense | (18,832 | ) | (18,172 | ) | (19,016 | ) | (18,854 | ) | (18,654 | ) | ||||||||||
Other income / (expense) | 803 | 596 | (181 | ) | (6 | ) | 524 | |||||||||||||
Net recoveries / (loss) from casualty events and litigation settlements (1) | — | — | — | 2,478 | (8 | ) | ||||||||||||||
Equity in income / (loss) of unconsolidated joint ventures | 135 | 124 | 159 | 160 | 89 | |||||||||||||||
(17,894 | ) | (17,452 | ) | (19,038 | ) | (16,222 | ) | (18,049 | ) | |||||||||||
Income from continuing operations | (19,027 | ) | 3,372 | 9,176 | 12,567 | 9,150 | ||||||||||||||
Discontinued operations: | ||||||||||||||||||||
Operating income, excluding impairment loss | 16 | (3 | ) | — | (42 | ) | 16 | |||||||||||||
Gain / (loss) on sale of properties | (2 | ) | — | — | — | — | ||||||||||||||
Income / (loss) from discontinued operations | 14 | (3 | ) | — | (42 | ) | 16 | |||||||||||||
Gain on sale of real estate (2) | 17,142 | 26,611 | 10,073 | (8 | ) | — | ||||||||||||||
Net income | (1,871 | ) | 29,980 | 19,249 | 12,517 | 9,166 | ||||||||||||||
Less: Net income attributable to noncontrolling interest | (4 | ) | (4 | ) | (4 | ) | (3 | ) | (4 | ) | ||||||||||
Net income attributable to Piedmont | $ | (1,875 | ) | $ | 29,976 | $ | 19,245 | $ | 12,514 | $ | 9,162 | |||||||||
Weighted average common shares outstanding - diluted | 149,176 | 153,757 | 154,580 | 154,520 | 154,561 | |||||||||||||||
Net income per share available to common stockholders - diluted | $ | (0.01 | ) | $ | 0.20 | $ | 0.12 | $ | 0.08 | $ | 0.06 | |||||||||
(1) | Presented on this line are net expenses and insurance reimbursements related to 1) lawsuits settled in 2013 and 2) damage caused by Hurricane Sandy in October 2012. |
(2) | The gain on sale of real estate reflected in the third quarter of 2015 was primarily related to the sale of Chandler Forum in Chandler, AZ, on which we recorded a $15.5 million gain, that in the second quarter of 2015 was primarily related to the sale of Copper Ridge Center in Lyndhurst, NJ, on which we recorded a $13.3 million gain, and 5601 Headquarters Drive in Plano, TX, on which we recorded an $8.0 million gain, and that in the first quarter of 2015 was primarily related to the sale of 3900 Dallas Parkway in Plano, TX, on which we recorded a $10.1 million gain. |
13
Piedmont Office Realty Trust, Inc.
Consolidated Statements of Income
Unaudited (in thousands except for per share data)
Three Months Ended | Nine Months Ended | ||||||||||||||||||||||||
9/30/2015 | 9/30/2014 | Change ($) | Change (%) | 9/30/2015 | 9/30/2014 | Change ($) | Change (%) | ||||||||||||||||||
Revenues: | |||||||||||||||||||||||||
Rental income | $ | 117,994 | $ | 114,529 | $ | 3,465 | 3.0 | % | $ | 353,255 | $ | 338,720 | $ | 14,535 | 4.3 | % | |||||||||
Tenant reimbursements | 30,273 | 29,579 | 694 | 2.3 | % | 90,476 | 79,253 | 11,223 | 14.2 | % | |||||||||||||||
Property management fee revenue | 548 | 533 | 15 | 2.8 | % | 1,577 | 1,568 | 9 | 0.6 | % | |||||||||||||||
148,815 | 144,641 | 4,174 | 2.9 | % | 445,308 | 419,541 | 25,767 | 6.1 | % | ||||||||||||||||
Expenses: | |||||||||||||||||||||||||
Property operating costs | 61,677 | 62,027 | 350 | 0.6 | % | 187,392 | 177,434 | (9,958 | ) | (5.6 | )% | ||||||||||||||
Depreciation | 31,199 | 35,366 | 4,167 | 11.8 | % | 103,470 | 103,154 | (316 | ) | (0.3 | )% | ||||||||||||||
Amortization | 14,021 | 14,235 | 214 | 1.5 | % | 43,646 | 42,407 | (1,239 | ) | (2.9 | )% | ||||||||||||||
Impairment losses on real estate assets | 34,815 | — | (34,815 | ) | — | % | 40,169 | — | (40,169 | ) | — | % | |||||||||||||
General and administrative | 8,236 | 5,814 | (2,422 | ) | (41.7 | )% | 22,726 | 17,514 | (5,212 | ) | (29.8 | )% | |||||||||||||
149,948 | 117,442 | (32,506 | ) | (27.7 | )% | 397,403 | 340,509 | (56,894 | ) | (16.7 | )% | ||||||||||||||
Real estate operating income | (1,133 | ) | 27,199 | (28,332 | ) | (104.2 | )% | 47,905 | 79,032 | (31,127 | ) | (39.4 | )% | ||||||||||||
Other income / (expense): | |||||||||||||||||||||||||
Interest expense | (18,832 | ) | (18,654 | ) | (178 | ) | (1.0 | )% | (56,020 | ) | (55,592 | ) | (428 | ) | (0.8 | )% | |||||||||
Other income / (expense) | 803 | 524 | 279 | 53.2 | % | 1,218 | 68 | 1,150 | 1,691.2 | % | |||||||||||||||
Net recoveries / (loss) from casualty events and litigation settlements (1) | — | (8 | ) | 8 | 100.0 | % | — | 4,514 | (4,514 | ) | (100.0 | )% | |||||||||||||
Equity in income / (loss) of unconsolidated joint ventures | 135 | 89 | 46 | 51.7 | % | 418 | (510 | ) | 928 | 182.0 | % | ||||||||||||||
(17,894 | ) | (18,049 | ) | 155 | 0.9 | % | (54,384 | ) | (51,520 | ) | (2,864 | ) | (5.6 | )% | |||||||||||
Income from continuing operations | (19,027 | ) | 9,150 | (28,177 | ) | (307.9 | )% | (6,479 | ) | 27,512 | (33,991 | ) | (123.5 | )% | |||||||||||
Discontinued operations: | |||||||||||||||||||||||||
Operating income, excluding impairment loss | 16 | 16 | — | — | % | 13 | 996 | (983 | ) | (98.7 | )% | ||||||||||||||
Gain / (loss) on sale of properties | (2 | ) | — | (2 | ) | — | % | (2 | ) | 1,198 | (1,200 | ) | (100.2 | )% | |||||||||||
Income / (loss) from discontinued operations (2) | 14 | 16 | (2 | ) | (12.5 | )% | 11 | 2,194 | (2,183 | ) | (99.5 | )% | |||||||||||||
Gain on sale of real estate (3) | 17,142 | — | 17,142 | — | % | 53,826 | 1,140 | 52,686 | 4,621.6 | % | |||||||||||||||
Net income | (1,871 | ) | 9,166 | (11,037 | ) | (120.4 | )% | 47,358 | 30,846 | 16,512 | 53.5 | % | |||||||||||||
Less: Net income attributable to noncontrolling interest | (4 | ) | (4 | ) | — | — | % | (12 | ) | (12 | ) | — | — | % | |||||||||||
Net income attributable to Piedmont | $ | (1,875 | ) | $ | 9,162 | $ | (11,037 | ) | (120.5 | )% | $ | 47,346 | $ | 30,834 | $ | 16,512 | 53.6 | % | |||||||
Weighted average common shares outstanding - diluted | 149,176 | 154,561 | 152,499 | 154,665 | |||||||||||||||||||||
Net income per share available to common stockholders - diluted | $ | (0.01 | ) | $ | 0.06 | $ | 0.31 | $ | 0.20 | ||||||||||||||||
(1) | Presented on this line are net expenses and insurance reimbursements related to 1) lawsuits settled in 2013 and 2) damage caused by Hurricane Sandy in October 2012. |
(2) | Reflects operating results for 11107 and 11109 Sunset Hills Road in Reston, VA, which were sold on March 19, 2014; and 1441 West Long Lake Road and 4685 Investment Drive in Troy, MI, which were sold on April 30, 2014. In the future, it is less likely that single-asset or small portfolio dispositions will be reclassed to discontinued operations; please find additional information on this change in the Financing and Capital Activity section of Financial Highlights. |
(3) | The gain on sale of real estate for the nine months ended September 30, 2015 was primarily related to a $15.5 million gain recorded on the sale of Chandler Forum in Chandler, AZ, in the third quarter of 2015, a $13.8 million gain recorded on the sale of Copper Ridge Center in Lyndhurst, NJ, in the second and third quarters of 2015, an $8.0 million gain recorded on the sale of 5601 Headquarters Drive in Plano, TX, in the second quarter of 2015, and a $10.1 million gain recorded on the sale of 3900 Dallas Parkway in Plano, TX, in the first quarter of 2015. |
14
Piedmont Office Realty Trust, Inc.
Funds From Operations, Core Funds From Operations and Adjusted Funds From Operations
Unaudited (in thousands except for per share data)
Three Months Ended | Nine Months Ended | |||||||||||||||
9/30/2015 | 9/30/2014 | 9/30/2015 | 9/30/2014 | |||||||||||||
GAAP net income applicable to common stock | $ | (1,875 | ) | $ | 9,162 | $ | 47,346 | $ | 30,834 | |||||||
Depreciation (1) (2) | 31,093 | 35,286 | 103,125 | 103,132 | ||||||||||||
Amortization (1) | 14,037 | 14,248 | 43,694 | 42,660 | ||||||||||||
Impairment loss (1) | 34,815 | — | 40,169 | — | ||||||||||||
Loss / (gain) on sale of properties (1) | (17,140 | ) | — | (53,824 | ) | (2,169 | ) | |||||||||
NAREIT funds from operations applicable to common stock | 60,930 | 58,696 | 180,510 | 174,457 | ||||||||||||
Adjustments: | ||||||||||||||||
Acquisition costs | 128 | 110 | 275 | 539 | ||||||||||||
Loss / (gain) on extinguishment of swaps | — | — | 132 | — | ||||||||||||
Net (recoveries) / loss from casualty events and litigation settlements (1) | — | 8 | — | (4,514 | ) | |||||||||||
Core funds from operations applicable to common stock | 61,058 | 58,814 | 180,917 | 170,482 | ||||||||||||
Adjustments: | ||||||||||||||||
Deferred financing cost amortization | 718 | 598 | 2,122 | 2,076 | ||||||||||||
Amortization of note payable step-up | (121 | ) | (120 | ) | (363 | ) | (126 | ) | ||||||||
Amortization of discount on senior notes | 49 | 47 | 146 | 128 | ||||||||||||
Depreciation of non real estate assets | 168 | 141 | 529 | 370 | ||||||||||||
Straight-line effects of lease revenue (1) | (2,519 | ) | (6,780 | ) | (10,774 | ) | (23,950 | ) | ||||||||
Stock-based and other non-cash compensation expense | 2,622 | 1,139 | 5,039 | 3,046 | ||||||||||||
Amortization of lease-related intangibles (1) | (1,145 | ) | (1,010 | ) | (3,369 | ) | (3,653 | ) | ||||||||
Acquisition costs | (128 | ) | (110 | ) | (275 | ) | (539 | ) | ||||||||
Non-incremental capital expenditures (3) | (8,269 | ) | (30,890 | ) | (30,197 | ) | (70,862 | ) | ||||||||
Adjusted funds from operations applicable to common stock | $ | 52,433 | $ | 21,829 | $ | 143,775 | $ | 76,972 | ||||||||
Weighted average common shares outstanding - diluted | 149,176 | 154,561 | 152,499 | 154,665 | ||||||||||||
Funds from operations per share (diluted) | $ | 0.41 | $ | 0.38 | $ | 1.19 | $ | 1.13 | ||||||||
Core funds from operations per share (diluted) | $ | 0.41 | $ | 0.38 | $ | 1.19 | $ | 1.10 | ||||||||
Adjusted funds from operations per share (diluted) | $ | 0.35 | $ | 0.14 | $ | 0.94 | $ | 0.50 | ||||||||
(1) | Includes adjustments for consolidated properties, including discontinued operations, and for our proportionate share of amounts attributable to unconsolidated joint ventures. |
(2) | Excludes depreciation of non real estate assets. |
(3) | Non-incremental capital expenditures are defined on page 39. |
15
Piedmont Office Realty Trust, Inc.
Same Store Net Operating Income (Cash Basis)
Unaudited (in thousands)
Three Months Ended | Nine Months Ended | ||||||||||||||
9/30/2015 | 9/30/2014 | 9/30/2015 | 9/30/2014 | ||||||||||||
Net income attributable to Piedmont | $ | (1,875 | ) | $ | 9,162 | $ | 47,346 | $ | 30,834 | ||||||
Net income attributable to noncontrolling interest | 4 | 4 | 12 | 12 | |||||||||||
Interest expense (1) | 18,832 | 18,654 | 56,020 | 55,592 | |||||||||||
Depreciation (1) | 31,261 | 35,427 | 103,654 | 103,502 | |||||||||||
Amortization (1) | 14,037 | 14,248 | 43,694 | 42,660 | |||||||||||
Acquisition costs | 128 | 110 | 275 | 539 | |||||||||||
Impairment loss (1) | 34,815 | — | 40,169 | — | |||||||||||
Net (recoveries) / loss from casualty events and litigation settlements (1) | — | 8 | — | (4,514 | ) | ||||||||||
Loss / (gain) on sale of properties (1) | (17,140 | ) | — | (53,824 | ) | (2,169 | ) | ||||||||
Core EBITDA | 80,062 | 77,613 | 237,346 | 226,456 | |||||||||||
General & administrative expenses (1) | 8,246 | 5,808 | 22,764 | 17,550 | |||||||||||
Management fee revenue (2) | (329 | ) | (299 | ) | (891 | ) | (839 | ) | |||||||
Other (income) / expense (1) (3) | (931 | ) | 21 | (1,493 | ) | 54 | |||||||||
Straight-line effects of lease revenue (1) | (2,519 | ) | (6,780 | ) | (10,774 | ) | (23,950 | ) | |||||||
Amortization of lease-related intangibles (1) | (1,145 | ) | (1,010 | ) | (3,369 | ) | (3,653 | ) | |||||||
Property net operating income (cash basis) | 83,384 | 75,353 | 243,583 | 215,618 | |||||||||||
Change period over period | 10.7 | % | N/A | 13.0 | % | N/A | |||||||||
Deduct net operating (income) / loss from: | |||||||||||||||
Acquisitions (4) | (3,190 | ) | (1,387 | ) | (8,698 | ) | (1,442 | ) | |||||||
Dispositions (5) | (429 | ) | (2,885 | ) | (5,153 | ) | (10,366 | ) | |||||||
Other investments (6) | (276 | ) | (214 | ) | (822 | ) | 258 | ||||||||
Same store net operating income (cash basis) | $ | 79,489 | $ | 70,867 | $ | 228,910 | $ | 204,068 | |||||||
Change period over period | 12.2 | % | N/A | 12.2 | % | N/A | |||||||||
(1) | Includes amounts attributable to consolidated properties, including discontinued operations, and our proportionate share of amounts attributable to unconsolidated joint ventures. |
(2) | Presented net of related operating expenses incurred to earn the revenue; therefore, the information presented on this line will not tie to the data presented on the income statements. |
(3) | Figures presented on this line may not tie back to the relevant sources as some activity is attributable to property operations and is, therefore, presented in property net operating income. |
(4) | Acquisitions consist of 5 Wall Street in Burlington, MA, purchased on June 27, 2014; 1155 Perimeter Center West in Atlanta, GA, purchased on August 28, 2014; TownPark Land in Lake Mary, FL, purchased on November 21, 2014; Park Place on Turtle Creek in Dallas, TX, purchased on January 16, 2015; and 80 Central Street in Boxborough, MA, purchased on July 24, 2015. |
(5) | Dispositions consist of 11107 and 11109 Sunset Hills Road in Reston, VA, sold on March 19, 2014; 1441 West Long Lake Road and 4685 Investment Drive in Troy, MI, sold on April 30, 2014; 2020 West 89th Street in Leawood, KS, sold on May 19, 2014; 3900 Dallas Parkway in Plano, TX, sold on January 30, 2015; 5601 Headquarters Drive in Plano, TX, sold on April 28, 2015; River Corporate Center in Tempe, AZ, sold on April 29, 2015; Copper Ridge Center in Lyndhurst, NJ, sold on May 1, 2015; Eastpoint I and II in Mayfield Heights, OH, sold on July 28, 2015; 3750 Brookside Parkway in Alpharetta, GA, sold on August 10, 2015; and Chandler Forum in Chandler, AZ, sold on September 1, 2015. |
(6) | Other investments consist of operating results from our investments in unconsolidated joint ventures and redevelopment and development projects. Additional information on our unconsolidated joint ventures and redevelopment and development projects can be found on page 38. The operating results from both the office and retail portions of 3100 Clarendon Boulevard in Arlington, VA, are included in this line item. |
16
Piedmont Office Realty Trust, Inc.
Same Store Net Operating Income (Cash Basis)
Unaudited (in thousands)
Same Store Net Operating Income (Cash Basis) | |||||||||||||||||||||||
Contributions from Seven of the Largest Markets | Three Months Ended | Nine Months Ended | |||||||||||||||||||||
9/30/2015 | 9/30/2014 | 9/30/2015 | 9/30/2014 | ||||||||||||||||||||
$ | % | $ | % | $ | % | $ | % | ||||||||||||||||
Washington, D.C. (1) | $ | 13,163 | 16.6 | $ | 12,907 | 18.2 | $ | 38,485 | 16.8 | $ | 41,508 | 20.3 | |||||||||||
Chicago (2) (3) | 13,687 | 17.2 | 10,261 | 14.5 | 35,382 | 15.4 | 21,223 | 10.4 | |||||||||||||||
New York | 11,219 | 14.1 | 11,605 | 16.4 | 33,404 | 14.6 | 32,770 | 16.1 | |||||||||||||||
Dallas (4) | 5,875 | 7.4 | 3,505 | 4.9 | 17,250 | 7.5 | 11,067 | 5.4 | |||||||||||||||
Boston | 5,524 | 6.9 | 5,979 | 8.4 | 16,874 | 7.4 | 17,727 | 8.7 | |||||||||||||||
Minneapolis | 5,161 | 6.5 | 4,507 | 6.4 | 14,586 | 6.4 | 15,204 | 7.5 | |||||||||||||||
Los Angeles (5) | 4,152 | 5.2 | 2,697 | 3.8 | 12,493 | 5.5 | 9,573 | 4.7 | |||||||||||||||
Other (6) | 20,708 | 26.1 | 19,406 | 27.4 | 60,436 | 26.4 | 54,996 | 26.9 | |||||||||||||||
Total | $ | 79,489 | 100.0 | $ | 70,867 | 100.0 | $ | 228,910 | 100.0 | $ | 204,068 | 100.0 | |||||||||||
(1) | The decrease in Washington, D.C. Same Store Net Operating Income for the nine months ended September 30, 2015 as compared to the same period in 2014 was primarily attributable to a lease expiration at 9200 Corporate Boulevard in Rockville, MD, and a one-time, $1.1 million rental income true-up in 2014 associated with the increased rental rate under the renewed National Park Service lease along with a 45,000 square foot contraction under that lease in 2015 at 1201 Eye Street in Washington, D.C. Partially offsetting the decrease in Washington, D.C. Same Store Net Operating Income was $1.5 million in lease termination income from Lockheed Martin related to the exercise of its early termination option, the termination payment for which is being amortized for 13 months beginning in April 2015 and concluding at the termination of the lease in the second quarter of 2016, at 9221 Corporate Boulevard in Rockville, MD. |
(2) | The increase in Chicago Same Store Net Operating Income for the three months and the nine months ended September 30, 2015 as compared to the same periods in 2014 was primarily related to the expiration of rental abatement periods associated with several leases at 500 West Monroe Street in Chicago, IL, Aon Center in Chicago, IL, and Windy Point II in Schaumburg, IL. |
(3) | The percentage contribution from Chicago to our total Same Store Net Operating Income is smaller than our geographic concentration percentage in Chicago, which is presented on an ALR basis (see page #SectionPage#), primarily because of the large number of leases with gross rent abatements and a number of leases yet to commence for currently vacant spaces (the projected gross rents for which are included in our ALR calculation). As the gross rent abatements burn off and as the executed but not commenced leases begin, the Same Store Net Operating Income percentage contribution from Chicago should increase and should be more closely aligned with our Chicago concentration percentage as presented on page #SectionPage#. |
(4) | The increase in Dallas Same Store Net Operating Income for the three months and the nine months ended September 30, 2015 as compared to the same periods in 2014 was primarily related to: 1) the expiration of the rental abatement period for a new lease with Epsilon Data Management at 6021 Connection Drive in Irving, TX, 2) the expirations of the rental abatement periods associated with several new-tenant leases at Las Colinas Corporate Center II in Irving, TX, and 3) increased economic occupancy associated with recent leasing activity at One Lincoln Park in Dallas, TX. |
(5) | The increase in Los Angeles Same Store Net Operating Income for the three months and the nine months ended September 30, 2015 as compared to the same periods in 2014 was primarily related to the expiration of rental abatement periods associated with several new leases as well as the expansion of an existing tenant's lease at 800 North Brand Boulevard in Glendale, CA, in addition to the expiration of a rental abatement period associated with a lease at 1055 East Colorado Boulevard in Pasadena, CA. |
(6) | The increase in Other Same Store Net Operating Income for the three months and the nine months ended September 30, 2015 as compared to the same periods in 2014 was primarily attributable to increased rental income as a result of: 1) increased economic occupancy associated with new-tenant leasing activity at 400 TownPark in Lake Mary, FL, The Medici in Atlanta, GA, and Glenridge Highlands II in Atlanta, GA, and 2) the restructured lease with Independence Blue Cross at 1901 Market Street in Philadelphia, PA. |
17
Piedmont Office Realty Trust, Inc.
Same Store Net Operating Income (Accrual Basis)
Unaudited (in thousands)
Three Months Ended | Nine Months Ended | ||||||||||||||
9/30/2015 | 9/30/2014 | 9/30/2015 | 9/30/2014 | ||||||||||||
Net income attributable to Piedmont | $ | (1,875 | ) | $ | 9,162 | $ | 47,346 | $ | 30,834 | ||||||
Net income attributable to noncontrolling interest | 4 | 4 | 12 | 12 | |||||||||||
Interest expense (1) | 18,832 | 18,654 | 56,020 | 55,592 | |||||||||||
Depreciation (1) | 31,261 | 35,427 | 103,654 | 103,502 | |||||||||||
Amortization (1) | 14,037 | 14,248 | 43,694 | 42,660 | |||||||||||
Acquisition costs | 128 | 110 | 275 | 539 | |||||||||||
Impairment loss (1) | 34,815 | — | 40,169 | — | |||||||||||
Net (recoveries) / loss from casualty events and litigation settlements (1) | — | 8 | — | (4,514 | ) | ||||||||||
Loss / (gain) on sale of properties (1) | (17,140 | ) | — | (53,824 | ) | (2,169 | ) | ||||||||
Core EBITDA | 80,062 | 77,613 | 237,346 | 226,456 | |||||||||||
General & administrative expenses (1) | 8,246 | 5,808 | 22,764 | 17,550 | |||||||||||
Management fee revenue (2) | (329 | ) | (299 | ) | (891 | ) | (839 | ) | |||||||
Other (income) / expense (1) (3) | (931 | ) | 21 | (1,493 | ) | 54 | |||||||||
Property net operating income (accrual basis) | 87,048 | 83,143 | 257,726 | 243,221 | |||||||||||
Change period over period | 4.7 | % | N/A | 6.0 | % | N/A | |||||||||
Deduct net operating (income) / loss from: | |||||||||||||||
Acquisitions (4) | (3,341 | ) | (1,429 | ) | (9,283 | ) | (1,490 | ) | |||||||
Dispositions (5) | (442 | ) | (3,017 | ) | (5,065 | ) | (10,713 | ) | |||||||
Other investments (6) | (279 | ) | (222 | ) | (878 | ) | 230 | ||||||||
Same store net operating income (accrual basis) | $ | 82,986 | $ | 78,475 | $ | 242,500 | $ | 231,248 | |||||||
Change period over period | 5.7 | % | N/A | 4.9 | % | N/A | |||||||||
(1) | Includes amounts attributable to consolidated properties, including discontinued operations, and our proportionate share of amounts attributable to unconsolidated joint ventures. |
(2) | Presented net of related operating expenses incurred to earn the revenue; therefore, the information presented on this line will not tie to the data presented on the income statements. |
(3) | Figures presented on this line may not tie back to the relevant sources as some activity is attributable to property operations and is, therefore, presented in property net operating income. |
(4) | Acquisitions consist of 5 Wall Street in Burlington, MA, purchased on June 27, 2014; 1155 Perimeter Center West in Atlanta, GA, purchased on August 28, 2014; TownPark Land in Lake Mary, FL, purchased on November 21, 2014; Park Place on Turtle Creek in Dallas, TX, purchased on January 16, 2015; and 80 Central Street in Boxborough, MA, purchased on July 24, 2015. |
(5) | Dispositions consist of 11107 and 11109 Sunset Hills Road in Reston, VA, sold on March 19, 2014; 1441 West Long Lake Road and 4685 Investment Drive in Troy, MI, sold on April 30, 2014; 2020 West 89th Street in Leawood, KS, sold on May 19, 2014; 3900 Dallas Parkway in Plano, TX, sold on January 30, 2015; 5601 Headquarters Drive in Plano, TX, sold on April 28, 2015; River Corporate Center in Tempe, AZ, sold on April 29, 2015; Copper Ridge Center in Lyndhurst, NJ, sold on May 1, 2015; Eastpoint I and II in Mayfield Heights, OH, sold on July 28, 2015; 3750 Brookside Parkway in Alpharetta, GA, sold on August 10, 2015; and Chandler Forum in Chandler, AZ, sold on September 1, 2015. |
(6) | Other investments consist of operating results from our investments in unconsolidated joint ventures and redevelopment and development projects. Additional information on our unconsolidated joint ventures and redevelopment and development projects can be found on page 38. The operating results from both the office and retail portions of 3100 Clarendon Boulevard in Arlington, VA, are included in this line item. |
18
Piedmont Office Realty Trust, Inc.
Same Store Net Operating Income (Accrual Basis)
Unaudited (in thousands)
Same Store Net Operating Income (Accrual Basis) | |||||||||||||||||||||||
Contributions from Seven of the Largest Markets | Three Months Ended | Nine Months Ended | |||||||||||||||||||||
9/30/2015 | 9/30/2014 | 9/30/2015 | 9/30/2014 | ||||||||||||||||||||
$ | % | $ | % | $ | % | $ | % | ||||||||||||||||
Chicago (1) (2) | $ | 15,646 | 18.9 | $ | 12,768 | 16.3 | $ | 42,080 | 17.3 | $ | 33,289 | 14.4 | |||||||||||
Washington, D.C. (3) | 13,493 | 16.3 | 13,544 | 17.3 | 40,192 | 16.6 | 43,455 | 18.8 | |||||||||||||||
New York (4) | 10,858 | 13.1 | 11,076 | 14.1 | 31,948 | 13.2 | 34,490 | 14.9 | |||||||||||||||
Boston | 5,924 | 7.1 | 6,157 | 7.8 | 17,912 | 7.4 | 18,445 | 8.0 | |||||||||||||||
Dallas (5) | 5,962 | 7.2 | 5,698 | 7.3 | 17,728 | 7.3 | 14,101 | 6.1 | |||||||||||||||
Minneapolis (6) | 5,134 | 6.2 | 4,970 | 6.3 | 15,268 | 6.3 | 16,467 | 7.1 | |||||||||||||||
Los Angeles | 3,942 | 4.7 | 3,650 | 4.6 | 12,446 | 5.1 | 11,729 | 5.1 | |||||||||||||||
Other (7) | 22,027 | 26.5 | 20,612 | 26.3 | 64,926 | 26.8 | 59,272 | 25.6 | |||||||||||||||
Total | $ | 82,986 | 100.0 | $ | 78,475 | 100.0 | $ | 242,500 | 100.0 | $ | 231,248 | 100.0 | |||||||||||
(1) | The increase in Chicago Same Store Net Operating Income for the three months and the nine months ended September 30, 2015 as compared to the same periods in 2014 was primarily related to increased rental income due to the commencement of several leases and/or the expiration of operating expense recovery abatement periods associated with several leases at 500 West Monroe Street in Chicago, IL, Aon Center in Chicago, IL, and Windy Point II in Schaumburg, IL. |
(2) | The percentage contribution from Chicago to our total Same Store Net Operating Income is smaller than our geographic concentration percentage in Chicago, which is presented on an ALR basis (see page 34), primarily because of the large number of leases with operating expense recovery abatements (which abatements are not included in straight line rent adjustments) and a number of leases yet to commence for currently vacant spaces (the projected gross rents for which are included in our ALR calculation). As the operating expense recovery abatements burn off and as the executed but not commenced leases begin, the Same Store Net Operating Income percentage contribution from Chicago should increase and should be more closely aligned with our Chicago concentration percentage as presented on page 34. |
(3) | The decrease in Washington, D.C. Same Store Net Operating Income for the nine months ended September 30, 2015 as compared to the same period in 2014 was primarily attributable to a lease expiration at 9200 Corporate Boulevard in Rockville, MD, and a one-time, $1.1 million rental income true-up in 2014 associated with the increased rental rate under the renewed National Park Service lease along with a 45,000 square foot contraction under that lease in 2015 at 1201 Eye Street in Washington, D.C. Partially offsetting the decrease in Washington, D.C. Same Store Net Operating Income was $1.5 million in lease termination income from Lockheed Martin related to the exercise of its early termination option, the termination payment for which is being amortized for 13 months beginning in April 2015 and concluding at the termination of the lease in the second quarter of 2016, at 9221 Corporate Boulevard in Rockville, MD. |
(4) | The decrease in New York Same Store Net Operating Income for the nine months ended September 30, 2015 as compared to the same period in 2014 was primarily attributable to the downtime between the expiration of several leases and the commencement of replacement leases at 60 Broad Street in New York, NY, along with lease termination income received in 2014 at 400 Bridgewater Crossing in Bridgewater, NJ. |
(5) | The increase in Dallas Same Store Net Operating Income for the nine months ended September 30, 2015 as compared to the same period in 2014 was primarily related to the commencement of a new lease with Epsilon Data Management at 6021 Connection Drive in Irving, TX, in addition to increased rental income associated with new leasing activity at One Lincoln Park in Dallas, TX. |
(6) | The decrease in Minneapolis Same Store Net Operating Income for the nine months ended September 30, 2015 as compared to the same period in 2014 was primarily due to a renewal-related contraction by US Bancorp and downtime associated with several replacement leases for spaces formerly occupied by US Bancorp at US Bancorp Center in Minneapolis, MN. |
(7) | The increase in Other Same Store Net Operating Income for the three months and the nine months ended September 30, 2015 as compared to the same periods in 2014 was primarily attributable to increased rental income as a result of: 1) recent new-tenant leasing activity at The Medici in Atlanta, GA, Glenridge Highlands II in Atlanta, GA, 400 TownPark in Lake Mary, FL, and 150 West Jefferson in Detroit, MI, and 2) the restructured lease with Independence Blue Cross at 1901 Market Street in Philadelphia, PA. |
19
Piedmont Office Realty Trust, Inc.
Capitalization Analysis
Unaudited (in thousands except for per share data)
As of | As of | |||||||
September 30, 2015 | December 31, 2014 | |||||||
Common stock price (1) | $ | 17.89 | $ | 18.84 | ||||
Total shares outstanding | 145,634 | 154,324 | ||||||
Equity market capitalization (1) | $ | 2,605,390 | $ | 2,907,466 | ||||
Total debt - principal amount outstanding | $ | 2,433,247 | $ | 2,279,787 | ||||
Total market capitalization (1) | $ | 5,038,637 | $ | 5,187,253 | ||||
Total debt / Total market capitalization (1) | 48.3 | % | 43.9 | % | ||||
Total gross real estate assets | $ | 5,153,613 | $ | 5,253,356 | ||||
Total debt / Total gross real estate assets (2) | 47.2 | % | 43.4 | % | ||||
Total debt / Total gross assets (3) | 40.8 | % | 38.2 | % | ||||
(1) | Reflects common stock closing price as of the end of the reporting period. |
(2) | Gross real estate assets is defined as total real estate assets with the add back of accumulated depreciation and accumulated amortization related to real estate assets. |
(3) | Gross assets is defined as total assets with the add back of accumulated depreciation and accumulated amortization related to real estate assets. |
20
Piedmont Office Realty Trust, Inc.
Debt Summary
As of September 30, 2015
Unaudited ($ in thousands)
Floating Rate & Fixed Rate Debt | |||||
Debt (1) | Principal Amount Outstanding | Weighted Average Stated Interest Rate (2) | Weighted Average Maturity | ||
Floating Rate | $583,000 | (3) | 1.25% | 49.3 months | |
Fixed Rate | 1,850,247 | 3.78% | 65.1 months | ||
Total | $2,433,247 | 3.17% | 61.3 months | ||
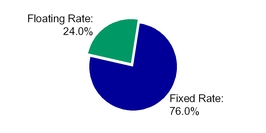
Unsecured & Secured Debt | ||||||
Debt (1) | Principal Amount Outstanding | Weighted Average Stated Interest Rate (2) | Weighted Average Maturity | |||
Unsecured | $1,933,000 | 2.71% | (4) | 66.8 months | ||
Secured | 500,247 | 4.95% | 40.2 months | |||
Total | $2,433,247 | 3.17% | 61.3 months | |||

Debt Maturities | |||||
Maturity Year | Secured Debt - Principal Amount Outstanding (1) | Unsecured Debt - Principal Amount Outstanding (1) | Weighted Average Stated Interest Rate (2) | Percentage of Total | |
2015 | $— | $— | —% | —% | |
2016 | 167,525 | — | 5.55% | 6.9% | |
2017 | 140,000 | — | 5.76% | 5.8% | |
2018 | — | 170,000 | 1.34% | 7.0% | |
2019 | — | 300,000 | 2.78% | 12.3% | |
2020 + | 192,722 | 1,463,000 | (5) | 2.97% | 68.0% |
Total | $500,247 | $1,933,000 | 3.17% | 100.0% | |
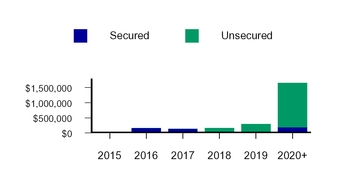
(1) | All of Piedmont's outstanding debt as of September 30, 2015, was interest-only debt with the exception of the $32.7 million of debt associated with 5 Wall Street located in Burlington, MA. |
(2) | Weighted average stated interest rate is calculated based upon the principal amounts outstanding. |
(3) | Amount represents the outstanding balance as of September 30, 2015, on the $500 million unsecured revolving credit facility and the $170 million unsecured term loan. Two other loans, the $300 million unsecured term loan that closed in 2011 and the $300 million unsecured term loan that closed in 2013, have stated variable rates. However, Piedmont entered into $300 million in notional amount of interest rate swap agreements which effectively fix the interest rate on the 2011 unsecured term loan at 2.39% through November 22, 2016 (please see page 22 for information on additional swap agreements for this loan that will become effective after November 22, 2016), assuming no credit rating change for the Company, and $300 million in notional amount of interest rate swap agreements which effectively fix the interest rate on the 2013 unsecured term loan at 2.78% through its maturity date of January 31, 2019, assuming no credit rating change for the Company. The 2011 unsecured term loan and the 2013 unsecured term loan, therefore, are reflected as fixed rate debt. |
(4) | The weighted average interest rate is a weighted average rate for amounts outstanding under our $500 million unsecured revolving credit facility, our unsecured senior notes and our unsecured term loans. |
(5) | The initial maturity date of the $500 million unsecured revolving credit facility is June 18, 2019; however, there are two, six-month extension options available under the facility providing for a final extended maturity date of June 18, 2020. For the purposes of this schedule, we reflect the maturity date of the facility as the final extended maturity date of June 2020. |
21
Piedmont Office Realty Trust, Inc.
Debt Detail
Unaudited ($ in thousands)
Facility (1) | Property | Stated Rate | Maturity | Principal Amount Outstanding as of September 30, 2015 | ||||
Secured | ||||||||
$125.0 Million Fixed-Rate Loan | Four Property Collateralized Pool (2) | 5.50 | % | 4/1/2016 | 125,000 | |||
$42.5 Million Fixed-Rate Loan | Las Colinas Corporate Center I & II | 5.70 | % | 10/11/2016 | 42,525 | |||
$140.0 Million WDC Fixed-Rate Loans | 1201 & 1225 Eye Street | 5.76 | % | 11/1/2017 | 140,000 | |||
$35.0 Million Fixed-Rate Loan (3) | 5 Wall Street | 5.55 | % | 9/1/2021 | 32,722 | |||
$160.0 Million Fixed-Rate Loan | 1901 Market Street | 3.48 | % | (4) | 7/5/2022 | 160,000 | ||
Subtotal / Weighted Average (5) | 4.95 | % | $ | 500,247 | ||||
Unsecured | ||||||||
$170.0 Million Unsecured 2015 Term Loan | N/A | 1.34 | % | (6) | 5/15/2018 | $ | 170,000 | |
$300.0 Million Unsecured 2013 Term Loan | N/A | 2.78 | % | (7) | 1/31/2019 | 300,000 | ||
$300.0 Million Unsecured 2011 Term Loan | N/A | 2.39 | % | (8) | 1/15/2020 | 300,000 | ||
$500.0 Million Unsecured Line of Credit (9) | N/A | 1.21 | % | (10) | 6/18/2020 | 413,000 | ||
$350.0 Million Unsecured Senior Notes | N/A | 3.40 | % | (11) | 6/1/2023 | 350,000 | ||
$400.0 Million Unsecured Senior Notes | N/A | 4.45 | % | (12) | 3/15/2024 | 400,000 | ||
Subtotal / Weighted Average (5) | 2.71 | % | $ | 1,933,000 | ||||
Total Debt - Principal Amount Outstanding / Weighted Average Stated Rate (5) | 3.17 | % | $ | 2,433,247 | ||||
GAAP Accounting Adjustments (13) | (4,928 | ) | ||||||
Total Debt - GAAP Amount Outstanding | $ | 2,428,319 | ||||||
(1) | All of Piedmont’s outstanding debt as of September 30, 2015, was interest-only debt with the exception of the $32.7 million of debt associated with 5 Wall Street located in Burlington, MA. |
(2) | The four property collateralized pool includes 1430 Enclave Parkway, Windy Point I and II, and 1055 East Colorado Boulevard. |
(3) | The loan is amortizing based on a 25-year amortization schedule. |
(4) | The stated interest rate on the $160 million fixed-rate loan is 3.48%. After the application of interest rate hedges, the effective cost of the financing is approximately 3.58%. |
(5) | Weighted average is based on the principal amount outstanding and interest rate at September 30, 2015. |
(6) | The $170 million unsecured term loan has a variable interest rate. Piedmont may select from multiple interest rate options under the facility, including the prime rate and various length LIBOR locks. All LIBOR selections are subject to an additional spread (1.125% as of September 30, 2015) over the selected rate based on Piedmont’s current credit rating. |
(7) | The $300 million unsecured term loan that closed in 2013 has a stated variable rate; however, Piedmont entered into interest rate swap agreements which effectively fix the interest rate on this loan at 2.78% through its maturity date of January 31, 2019, assuming no credit rating change for the Company. |
(8) | The $300 million unsecured term loan that closed in 2011 has a stated variable rate; however, Piedmont entered into interest rate swap agreements which effectively fix the interest rate on this loan at 2.39% until November 22, 2016, assuming no credit rating change for the Company. Additionally, for the period from November 22, 2016 to January 15, 2020, Piedmont has entered into interest rate swap agreements which effectively fix the interest rate on this loan at 3.35%, assuming no credit rating change for the Company. |
(9) | All of Piedmont’s outstanding debt as of September 30, 2015, was term debt with the exception of $413 million outstanding on our unsecured revolving credit facility. The $500 million unsecured revolving credit facility has an initial maturity date of June 18, 2019; however, there are two, six-month extension options available under the facility providing for a total extension of up to one year to June 18, 2020. The final extended maturity date is presented on this schedule. |
(10) | The interest rate presented for the $500 million unsecured revolving credit facility is the weighted average interest rate for all outstanding draws as of September 30, 2015. Piedmont may select from multiple interest rate options with each draw under the facility, including the prime rate and various length LIBOR locks. All LIBOR selections are subject to an additional spread (1.00% as of September 30, 2015) over the selected rate based on Piedmont’s current credit rating. |
(11) | The $350 million unsecured senior notes were offered for sale at 99.601% of the principal amount. The resulting effective cost of the financing is approximately 3.45% before the consideration of transaction costs and proceeds from interest rate hedges. After the application of proceeds from interest rate hedges, the effective cost of the financing is approximately 3.43%. |
(12) | The $400 million unsecured senior notes were offered for sale at 99.791% of the principal amount. The resulting effective cost of the financing is approximately 4.48% before the consideration of transaction costs and proceeds from interest rate hedges. After the application of proceeds from interest rate hedges, the effective cost of the financing is approximately 4.10%. |
(13) | The GAAP accounting adjustments relate to the original issue discounts and fees associated with the $350 million unsecured senior notes, the $400 million unsecured senior notes, the $300 million unsecured 2011 term loan, the $170 million unsecured 2015 term loan, the $500 million unsecured line of credit and the $160 million fixed-rate loan, along with debt fair value adjustments associated with the assumed 5 Wall Street debt. The original issue discounts and fees, along with the debt fair value adjustments, are amortized as a net offset to interest expense over the contractual term of the related debt. |
22
Piedmont Office Realty Trust, Inc.
Debt Analysis
As of September 30, 2015
Unaudited
Bank Debt Covenant Compliance (1) | Required | Actual |
Maximum Leverage Ratio | 0.60 | 0.46 |
Minimum Fixed Charge Coverage Ratio (2) | 1.50 | 3.79 |
Maximum Secured Indebtedness Ratio | 0.40 | 0.10 |
Minimum Unencumbered Leverage Ratio | 1.60 | 2.22 |
Minimum Unencumbered Interest Coverage Ratio (3) | 1.75 | 4.53 |
Bond Covenant Compliance (4) | Required | Actual |
Total Debt to Total Assets | 60% or less | 46.5% |
Secured Debt to Total Assets | 40% or less | 9.6% |
Ratio of Consolidated EBITDA to Interest Expense | 1.50 or greater | 4.37 |
Unencumbered Assets to Unsecured Debt | 150% or greater | 233% |
Three Months Ended | Nine Months Ended | Year Ended | |
Other Debt Coverage Ratios | September 30, 2015 | September 30, 2015 | December 31, 2014 |
Average net debt to core EBITDA (5) | 7.3 x | 7.3 x | 6.9 x |
Fixed charge coverage ratio (6) | 4.0 x | 4.0 x | 4.0 x |
Interest coverage ratio (7) | 4.0 x | 4.0 x | 4.0 x |
(1) | Debt covenant compliance calculations relate to specific calculations detailed in the relevant credit agreements. |
(2) | Defined as EBITDA for the trailing four quarters (including the Company's share of EBITDA from unconsolidated interests), less one-time or non-recurring gains or losses, less a $0.15 per square foot capital reserve, and excluding the impact of straight line rent leveling adjustments and amortization of intangibles divided by the Company's share of fixed charges, as more particularly described in the credit agreements. This definition of fixed charge coverage ratio as prescribed by our credit agreements is different from the fixed charge coverage ratio definition employed elsewhere within this report. |
(3) | Defined as net operating income for the trailing four quarters for unencumbered assets (including the Company's share of net operating income from partially-owned entities and subsidiaries that are deemed to be unencumbered) less a $0.15 per square foot capital reserve divided by the Company's share of interest expense associated with unsecured financings only, as more particularly described in the credit agreements. |
(4) | Please refer to the Indenture dated May 9, 2013, and the Indenture and the Supplemental Indenture dated March 6, 2014, for additional information on the relevant calculations. |
(5) | For the purposes of this calculation, we use the average daily balance of debt outstanding during the period, less cash and cash equivalents and escrow deposits and restricted cash as of the end of the period. |
(6) | Fixed charge coverage ratio is calculated as Core EBITDA divided by the sum of interest expense, principal amortization, capitalized interest and preferred dividends. The Company had no preferred dividends during the periods ended September 30, 2015 and December 31, 2014. The Company had capitalized interest of $954,086 for the three months ended September 30, 2015, $2,663,432 for the nine months ended September 30, 2015, and $2,074,620 for the twelve months ended December 31, 2014. The Company had principal amortization of $204,580 for the three months ended September 30, 2015, $539,317 for the nine months ended September 30, 2015, and $520,067 for the twelve months ended December 31, 2014. |
(7) | Interest coverage ratio is calculated as Core EBITDA divided by the sum of interest expense and capitalized interest. The Company had capitalized interest of $954,086 for the three months ended September 30, 2015, $2,663,432 for the nine months ended September 30, 2015, and $2,074,620 for the twelve months ended December 31, 2014. |
23
Piedmont Office Realty Trust, Inc.
Tenant Diversification (1)
As of September 30, 2015
(in thousands except for number of properties)
Tenant | Credit Rating (2) | Number of Properties | Lease Expiration (3) | Annualized Lease Revenue | Percentage of Annualized Lease Revenue (%) | Leased Square Footage | Percentage of Leased Square Footage (%) | |
U.S. Government | AA+ / Aaa | 7 | (4) | $46,765 | 7.7 | 937 | 5.0 | |
State of New York | AA+ / Aa1 | 1 | 2019 | 24,689 | 4.1 | 481 | 2.6 | |
US Bancorp | A+ / A1 | 3 | 2023 / 2024 | 21,760 | 3.6 | 733 | 3.9 | |
Independence Blue Cross | No rating available | 1 | 2033 | 18,016 | 3.0 | 801 | 4.3 | |
GE | AA+ / A1 | 2 | 2027 | 16,699 | 2.7 | 480 | 2.6 | |
Aon | A- / Baa2 | 2 | 2028 | 15,037 | 2.5 | 455 | 2.4 | |
Nestle | AA / Aa2 | 1 | 2021 | 12,117 | 2.0 | 401 | 2.1 | |
City of New York | AA / Aa2 | 1 | 2020 | 10,723 | 1.8 | 313 | 1.7 | |
KPMG | No rating available | 2 | 2020 / 2027 | 10,534 | 1.7 | 313 | 1.7 | |
Gallagher | No rating available | 1 | 2018 | 8,923 | 1.5 | 307 | 1.6 | |
Catamaran | A+ / A3 | 1 | 2025 | 8,252 | 1.3 | 301 | 1.6 | |
Caterpillar Financial | A / A2 | 1 | 2022 | 7,968 | 1.3 | 312 | 1.7 | |
DDB Needham | BBB+ / Baa1 | 1 | 2018 | 7,805 | 1.3 | 212 | 1.1 | |
Harvard University | AAA / Aaa | 2 | 2017 / 2018 | 7,267 | 1.2 | 110 | 0.6 | |
Jones Lang LaSalle | BBB+ / Baa2 | 1 | 2032 | 7,212 | 1.2 | 199 | 1.1 | |
Raytheon | A / A3 | 2 | 2019 | 6,870 | 1.1 | 440 | 2.3 | |
Gemini | BBB+ / A3 | 1 | 2021 | 6,767 | 1.1 | 205 | 1.1 | |
Kraft Heinz | BBB- | 1 | 2029 | 6,664 | 1.1 | 170 | 0.9 | |
Edelman | No rating available | 1 | 2024 | 6,660 | 1.1 | 184 | 1.0 | |
Harcourt | BBB+ | 1 | 2016 | 6,654 | 1.1 | 195 | 1.0 | |
Technip | BBB+ | 1 | 2018 | 6,591 | 1.1 | 150 | 0.8 | |
Key Bank | A- / A3 | 1 | 2016 | 6,302 | 1.0 | 200 | 1.1 | |
Epsilon Data Management | No rating available | 2 | 2026 | 6,232 | 1.0 | 250 | 1.3 | |
First Data Corporation | B / B3 | 1 | 2020 | 6,132 | 1.0 | 195 | 1.0 | |
Archon Group | A- / A3 | 2 | 2018 | 5,996 | 1.0 | 235 | 1.2 | |
Towers Watson | No rating available | 1 | 2017 | 5,856 | 1.0 | 123 | 0.7 | |
Henry M. Jackson Foundation | No rating available | 2 | 2022 | 5,817 | 1.0 | 145 | 0.8 | |
Integrys | A- / A3 | 1 | 2029 | 5,780 | 1.0 | 174 | 0.9 | |
Other | Various | 301,527 | 49.5 | 9,731 | 51.9 | |||
Total | $607,615 | 100.0 | 18,752 | 100.0 | ||||
24
Tenant Diversification
Percentage of Annualized Leased Revenue (%)
September 30, 2015 as compared to December 31, 2014
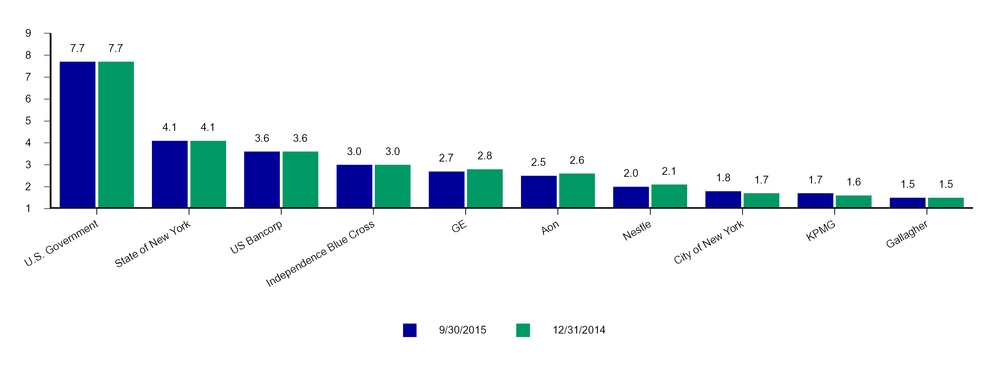
(1) | This schedule presents all tenants contributing 1.0% or more to Annualized Lease Revenue. |
(2) | Credit rating may reflect the credit rating of the parent or a guarantor. When available, both the Standard & Poor's credit rating and the Moody's credit rating are provided. The absence of a credit rating for a tenant is no indication of the credit worthiness of the tenant; in most cases, the lack of a credit rating reflects that a tenant has not sought such a rating. |
(3) | Unless otherwise indicated, Lease Expiration represents the expiration year of the majority of the square footage leased by the tenant. |
(4) | There are several leases with several different agencies of the U.S. Government with expiration years ranging from 2016 to 2030. |
25
Piedmont Office Realty Trust, Inc.
Tenant Credit Rating & Lease Distribution Information
As of September 30, 2015
Tenant Credit Rating (1)
Rating Level | Annualized Lease Revenue (in thousands) | Percentage of Annualized Lease Revenue (%) | |
AAA / Aaa | $58,058 | 9.6 | |
AA / Aa | 93,056 | 15.3 | |
A / A | 123,555 | 20.3 | |
BBB / Baa | 59,339 | 9.8 | |
BB / Ba | 26,384 | 4.3 | |
B / B | 21,880 | 3.6 | |
Below | — | — | |
Not rated (2) | 225,343 | 37.1 | |
Total | $607,615 | 100.0 | |
Lease Distribution
Lease Size | Number of Leases | Percentage of Leases (%) | Annualized Lease Revenue (in thousands) | Percentage of Annualized Lease Revenue (%) | Leased Square Footage (in thousands) | Percentage of Leased Square Footage (%) | |
2,500 or Less | 219 | 31.6 | $21,667 | 3.6 | 210 | 1.1 | |
2,501 - 10,000 | 212 | 30.6 | 37,903 | 6.2 | 1,125 | 6.0 | |
10,001 - 20,000 | 85 | 12.3 | 36,346 | 6.0 | 1,188 | 6.3 | |
20,001 - 40,000 | 68 | 9.8 | 62,970 | 10.3 | 1,987 | 10.6 | |
40,001 - 100,000 | 60 | 8.6 | 112,889 | 18.6 | 3,535 | 18.9 | |
Greater than 100,000 | 49 | 7.1 | 335,840 | 55.3 | 10,707 | 57.1 | |
Total | 693 | 100.0 | $607,615 | 100.0 | 18,752 | 100.0 | |
(1) | Credit rating may reflect the credit rating of the parent or a guarantor. Where differences exist between the Standard & Poor's credit rating for a tenant and the Moody's credit rating for a tenant, the higher credit rating is selected for this analysis. |
(2) | The classification of a tenant as "not rated" does not indicate that the tenant is of poor credit quality, but can indicate that the tenant or the tenant's debt, if any, has not been rated. Included in this category are such tenants as Independence Blue Cross, McKinsey & Company and KPMG. |
26
Piedmont Office Realty Trust, Inc.
Leased Percentage Information
(in thousands)
Three Months Ended | Three Months Ended | ||||||||||||||
September 30, 2015 | September 30, 2014 | ||||||||||||||
Leased Square Footage | Rentable Square Footage | Percent Leased (1) | Leased Square Footage | Rentable Square Footage | Percent Leased (1) | ||||||||||
As of June 30, 20xx | 18,612 | 20,966 | 88.8 | % | 18,352 | 21,086 | 87.0 | % | |||||||
New leases | 844 | 1,110 | |||||||||||||
Expired leases | (445 | ) | (1,060 | ) | |||||||||||
Other | 3 | 6 | — | 9 | |||||||||||
Subtotal | 19,014 | 20,972 | 90.7 | % | 18,402 | 21,095 | 87.2 | % | |||||||
Acquisitions during period | 139 | 150 | 377 | 377 | |||||||||||
Dispositions during period | (401 | ) | (425 | ) | — | — | |||||||||
As of September 30, 20xx (2) | 18,752 | 20,697 | 90.6 | % | 18,779 | 21,472 | 87.5 | % | |||||||
Nine Months Ended | Nine Months Ended | ||||||||||||||
September 30, 2015 | September 30, 2014 | ||||||||||||||
Leased Square Footage | Rentable Square Footage | Percent Leased (1) | Leased Square Footage | Rentable Square Footage | Percent Leased (1) | ||||||||||
As of December 31, 20xx | 18,828 | 21,471 | 87.7 | % | 18,737 | 21,490 | 87.2 | % | |||||||
New leases | 1,899 | 3,377 | |||||||||||||
Expired leases | (1,222 | ) | (3,313 | ) | |||||||||||
Other (3) | 5 | 10 | (247 | ) | (182 | ) | |||||||||
Subtotal | 19,510 | 21,481 | 90.8 | % | 18,554 | 21,308 | 87.1 | % | |||||||
Acquisitions during period | 295 | 328 | 559 | 559 | |||||||||||
Dispositions during period | (1,053 | ) | (1,112 | ) | (334 | ) | (395 | ) | |||||||
As of September 30, 20xx (2) | 18,752 | 20,697 | 90.6 | % | 18,779 | 21,472 | 87.5 | % | |||||||
Same Store Analysis | |||||||||||||||
Less acquisitions / dispositions after September 30, 2014 and redevelopments (4) (5) | (301 | ) | (328 | ) | 91.8 | % | (1,001 | ) | (1,112 | ) | 90.0 | % | |||
Same Store Leased Percentage (2) | 18,451 | 20,369 | 90.6 | % | 17,778 | 20,360 | 87.3 | % | |||||||
(1) | Calculated as leased square footage as of period end with the addition of square footage associated with uncommenced leases for spaces vacant as of period end, divided by total rentable square footage as of period end, expressed as a percentage. |
(2) | The square footage associated with leases with end of period expiration dates is included in the end of the period leased square footage. |
(3) | Effective January 1, 2014, 3100 Clarendon Boulevard was taken out of service due to the redevelopment of the property. The adjustments to square footage presented on this line in 2014 primarily relate to the removal of 3100 Clarendon Boulevard from our operating portfolio. For additional information regarding the redevelopment of 3100 Clarendon Boulevard, please refer to the Financing and Capital Activity section of Financial Highlights. |
(4) | |
(5) | Dispositions completed during the previous twelve months are deducted from the previous period data and acquisitions completed during the previous twelve months are deducted from the current period data. Redevelopments commenced during the previous twelve months are deducted from the previous period data. |
27
Piedmont Office Realty Trust, Inc.
Rental Rate Roll Up / Roll Down Analysis (1)
(in thousands)
Three Months Ended | ||||||
September 30, 2015 | ||||||
Square Feet | % of Total Signed During Period | % of Rentable Square Footage | % Change Cash Rents (2) | % Change Accrual Rents (3) (4) | ||
Leases executed for spaces vacant one year or less | 204 | 22.6% | 1.0% | 4.3% | 9.7% | |
Leases executed for spaces excluded from analysis (5) (6) | 697 | 77.4% | ||||
Nine Months Ended | ||||||
September 30, 2015 | ||||||
Square Feet | % of Total Signed During Period | % of Rentable Square Footage | % Change Cash Rents (2) | % Change Accrual Rents (3) (4) | ||
Leases executed for spaces vacant one year or less | 894 | 39.0% | 4.3% | 1.8% | 10.8% | |
Leases executed for spaces excluded from analysis (5) (6) | 1,396 | 61.0% | ||||
(1) | The population analyzed consists of consolidated office leases executed during the period with lease terms of one year or greater. Retail leases, as well as leases associated with storage spaces, management offices, and unconsolidated joint venture assets, are excluded from this analysis. |
(2) | For the purposes of this analysis, the last twelve months of cash rents for the previous leases are compared to the first twelve months of cash rents for the new leases in order to calculate the percentage change. |
(3) | For the purposes of this analysis, the accrual basis rents for the previous leases are compared to the accrual basis rents of the new leases in order to calculate the percentage change. For newly signed leases which have variations in accrual basis rents, whether because of known future expansions, contractions, lease expense recovery structure changes, or other similar reasons, the weighted average of such accrual basis rents is used for the purposes of this analysis. |
(4) | For leases under which a tenant may use, at its discretion, a portion of its tenant improvement allowance for expenses other than those related to improvements to its space, an assumption is made that the tenant elects to use any such portion of its tenant improvement allowance for improvements to its space prior to the commencement of its lease, unless the Company is notified otherwise by the tenant. This assumption is made based upon historical usage patterns of tenant improvement allowances by the Company's tenants. |
(5) | Represents leases signed at our consolidated office assets that do not qualify for inclusion in the analysis primarily because the spaces for which the new leases were signed had been vacant for greater than one year. |
(6) | Excluded from these analyses is a 201,000 square foot, one-year renewal with Comdata at 5301 Maryland Way in Brentwood, TN. The lease has been excluded from the analyses as the Company anticipates completing a longer-term extension with the tenant. The Company, in an effort to not misrepresent the results of its leasing activity, has elected to not report the one-year transaction. The rental rates (both cash and accrual) under the renewal lease are higher than those under the expiring lease. Had the Company elected to include the transaction in these analyses, the percent change in cash rents would have been 10.8% and 4.0% for the three months and the nine months ended September 30, 2015, respectively, and the percent change in accrual rents would have been 15.1% and 12.4% for the three months and the nine months ended September 30, 2015, respectively. The Company expects a similar effect on these analyses from the impending longer-term renewal transaction. |
28
Piedmont Office Realty Trust, Inc.
Lease Expiration Schedule
As of September 30, 2015
(in thousands)
Expiration Year | Annualized Lease Revenue (1) | Percentage of Annualized Lease Revenue (%) | Rentable Square Footage | Percentage of Rentable Square Footage (%) | |
Vacant | $— | — | 1,945 | 9.4 | |
2015 (2) | 3,055 | 0.5 | 112 | 0.5 | |
2016 (3) | 36,039 | 5.9 | 1,098 | 5.3 | |
2017 | 51,371 | 8.5 | 1,324 | 6.4 | |
2018 | 51,465 | 8.5 | 1,580 | 7.6 | |
2019 | 66,129 | 10.9 | 2,161 | 10.4 | |
2020 | 55,163 | 9.1 | 1,937 | 9.4 | |
2021 | 39,695 | 6.5 | 1,268 | 6.1 | |
2022 | 37,479 | 6.2 | 1,211 | 5.9 | |
2023 | 34,792 | 5.7 | 1,182 | 5.7 | |
2024 | 46,930 | 7.7 | 1,464 | 7.1 | |
2025 | 23,996 | 3.9 | 793 | 3.8 | |
2026 | 20,275 | 3.3 | 709 | 3.4 | |
2027 | 33,742 | 5.6 | 934 | 4.5 | |
Thereafter | 107,484 | 17.7 | 2,979 | 14.5 | |
Total / Weighted Average | $607,615 | 100.0 | 20,697 | 100.0 | |
Average Lease Term Remaining | |
9/30/2015 | 7.1 years |
12/31/2014 | 7.1 years |
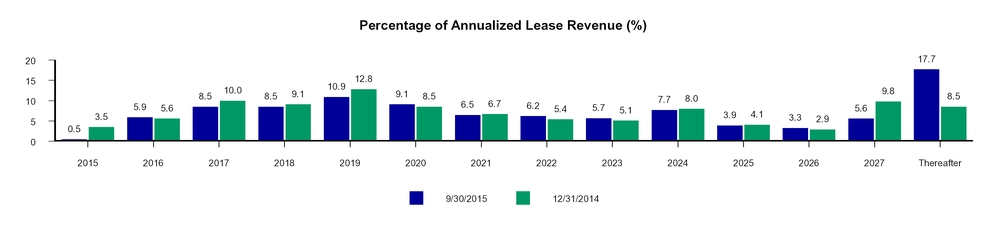
(1) | Annualized rental income associated with each newly executed lease for currently occupied space is incorporated herein only at the expiration date for the current lease. Annualized rental income associated with each such new lease is removed from the expiry year of the current lease and added to the expiry year of the new lease. These adjustments effectively incorporate known roll ups and roll downs into the expiration schedule. |
(2) | Includes leases with an expiration date of September 30, 2015, comprised of 6,000 square feet and Annualized Lease Revenue of $0.3 million. |
(3) | Leases and other revenue-producing agreements on a month-to-month basis, comprised of 8,000 square feet and Annualized Lease Revenue of $0.3 million, are assigned a lease expiration date of a year and a day beyond the period end date. |
29
Piedmont Office Realty Trust, Inc.
Lease Expirations by Quarter
As of September 30, 2015
(in thousands)
Q4 2015 (1) | Q1 2016 | Q2 2016 | Q3 2016 | |||||||||
Location | Expiring Square Footage | Expiring Lease Revenue (2) | Expiring Square Footage | Expiring Lease Revenue (2) | Expiring Square Footage | Expiring Lease Revenue (2) | Expiring Square Footage | Expiring Lease Revenue (2) | ||||
Atlanta | 1 | $— | — | $— | — | $— | — | $— | ||||
Austin | — | — | — | — | 195 | 6,655 | — | 4 | ||||
Boston | — | — | — | — | 2 | 32 | 26 | 471 | ||||
Central & South Florida | — | — | — | — | 17 | 462 | — | — | ||||
Chicago | 39 | 994 | 6 | 246 | 45 | 1,468 | 32 | 1,050 | ||||
Dallas | 27 | 744 | 17 | 452 | 35 | 902 | 11 | 346 | ||||
Detroit | 22 | 450 | 2 | 41 | — | — | 6 | 111 | ||||
Houston | — | — | — | — | — | — | — | — | ||||
Los Angeles | — | 6 | 30 | 860 | 5 | 951 | 16 | 508 | ||||
Minneapolis | 5 | 170 | — | — | 7 | 216 | 1 | 47 | ||||
Nashville | — | — | — | — | — | — | — | — | ||||
New York | 6 | 189 | 202 | 6,434 | 13 | 451 | — | 19 | ||||
Philadelphia | — | — | — | — | — | — | — | — | ||||
Phoenix | — | — | — | — | 46 | 1,138 | — | — | ||||
Washington, D.C. | 12 | 288 | 56 | 2,963 | 119 | 2,916 | 23 | 996 | ||||
Total / Weighted Average (3) | 112 | $2,841 | 313 | $10,996 | 484 | $15,191 | 115 | $3,552 | ||||
(1) | Includes leases with an expiration date of September 30, 2015, comprised of 6,000 square feet and expiring lease revenue of $0.2 million. No such adjustments are made to other periods presented. |
(2) | Expiring Lease Revenue is calculated as expiring square footage multiplied by the gross rent per square foot of the tenant currently leasing the space. |
(3) | Total expiring lease revenue in any given year will not tie to the expiring Annualized Lease Revenue presented on the Lease Expiration Schedule on the previous page as the Lease Expiration Schedule accounts for the revenue effects of newly signed leases. Reflected herein are expiring revenues based on in-place rental rates. |
30
Piedmont Office Realty Trust, Inc.
Lease Expirations by Year
As of September 30, 2015
(in thousands)
12/31/2015 (1) | 12/31/2016 | 12/31/2017 | 12/31/2018 | 12/31/2019 | ||||||||||
Location | Expiring Square Footage | Expiring Lease Revenue (2) | Expiring Square Footage | Expiring Lease Revenue (2) | Expiring Square Footage | Expiring Lease Revenue (2) | Expiring Square Footage | Expiring Lease Revenue (2) | Expiring Square Footage | Expiring Lease Revenue (2) | ||||
Atlanta | 1 | $— | 19 | $381 | 41 | $1,009 | 55 | $1,133 | 380 | $9,819 | ||||
Austin | — | — | 195 | 6,659 | — | — | — | — | — | — | ||||
Boston | — | — | 29 | 673 | 171 | 7,646 | 150 | 6,514 | 569 | 10,959 | ||||
Central & South Florida | — | — | 71 | 1,916 | 158 | 4,013 | 49 | 1,237 | — | — | ||||
Chicago | 39 | 994 | 101 | 3,338 | 33 | 8,598 | (3) | 613 | 20,450 | 24 | 631 | |||
Dallas | 27 | 744 | 84 | 2,261 | 175 | 4,821 | 384 | 9,885 | 193 | 5,238 | ||||
Detroit | 22 | 450 | 28 | 673 | 63 | 1,315 | — | — | 229 | 4,763 | ||||
Houston | — | — | — | — | — | 2 | 150 | 6,609 | — | — | ||||
Los Angeles | — | 6 | 72 | 3,226 | 54 | 1,976 | 23 | 647 | 75 | 2,061 | ||||
Minneapolis | 5 | 170 | 20 | 669 | 36 | 1,254 | 35 | 1,199 | 145 | 4,205 | ||||
Nashville | — | — | — | — | 201 | 2,579 | — | — | — | — | ||||
New York | 6 | 189 | 233 | 7,826 | 50 | 1,651 | 79 | 2,066 | 490 | 25,349 | ||||
Philadelphia | — | — | — | — | — | — | — | — | — | — | ||||
Phoenix | — | — | 46 | 1,138 | — | — | — | — | — | — | ||||
Washington, D.C. | 12 | 288 | 200 | 7,112 | 342 | 17,666 | 42 | 1,819 | 56 | 3,138 | ||||
Total / Weighted Average (4) | 112 | $2,841 | 1,098 | $35,872 | 1,324 | $52,530 | 1,580 | $51,559 | 2,161 | $66,163 | ||||
(1) | Includes leases with an expiration date of September 30, 2015, comprised of 6,000 square feet and expiring lease revenue of $0.2 million. No such adjustments are made to other periods presented. |
(2) | Expiring Lease Revenue is calculated as expiring square footage multiplied by the gross rent per square foot of the tenant currently leasing the space. |
(3) | Chicago expirations in 2017 include two parking garage agreements with annualized lease revenue of $7.3 million. The parking garage revenue will continue beyond 2017 despite the expiration of the current parking garage agreements at that time. |
(4) | Total expiring lease revenue in any given year will not tie to the expiring Annualized Lease Revenue presented on the Lease Expiration Schedule on page 29 as the Lease Expiration Schedule accounts for the revenue effects of newly signed leases. Reflected herein are expiring revenues based on in-place rental rates. |
31
Piedmont Office Realty Trust, Inc.
Capital Expenditures & Commitments
For the quarter ended September 30, 2015
Unaudited (in thousands)
For the Three Months Ended | |||||||||||||||||||
9/30/2015 | 6/30/2015 | 3/31/2015 | 12/31/2014 | 9/30/2014 | |||||||||||||||
Non-incremental | |||||||||||||||||||
Building / construction / development | $ | 1,824 | $ | 441 | $ | 1,704 | $ | 1,657 | $ | 6,135 | |||||||||
Tenant improvements | 3,483 | 4,226 | 6,717 | 10,420 | 18,209 | ||||||||||||||
Leasing costs | 2,962 | 6,974 | 1,866 | 1,691 | 6,546 | ||||||||||||||
Total non-incremental | 8,269 | 11,641 | 10,287 | 13,768 | 30,890 | ||||||||||||||
Incremental | |||||||||||||||||||
Building / construction / development | 11,248 | 14,019 | 19,949 | 23,172 | 23,390 | ||||||||||||||
Tenant improvements | 2,621 | 3,960 | 11,106 | 11,455 | 7,802 | ||||||||||||||
Leasing costs | 10,449 | 3,296 | 2,593 | 4,596 | 2,400 | ||||||||||||||
Total incremental | 24,318 | 21,275 | 33,648 | 39,223 | 33,592 | ||||||||||||||
Total capital expenditures | $ | 32,587 | $ | 32,916 | $ | 43,935 | $ | 52,991 | $ | 64,482 | |||||||||
Non-incremental tenant improvement commitments (1) | |||||||
Non-incremental tenant improvement commitments outstanding as of June 30, 2015 | $ | 49,108 | |||||
New non-incremental tenant improvement commitments related to leases executed during period | 7,669 | ||||||
Non-incremental tenant improvement expenditures | (3,483 | ) | |||||
Less: Tenant improvement expenditures fulfilled through accrued liabilities already presented on Piedmont's balance sheet, expired commitments or other adjustments | (966 | ) | |||||
Non-incremental tenant improvement commitments fulfilled, expired or other adjustments | (4,449 | ) | |||||
Total as of September 30, 2015 | $ | 52,328 | |||||
NOTE: | The information presented on this page is for all consolidated assets. |
(1) | Commitments are unexpired contractual non-incremental tenant improvement obligations for leases executed in current and prior periods that have not yet been incurred, are due over the next five years, and have not otherwise been presented on Piedmont's financial statements. The four largest commitments total approximately $31.4 million, or 60% of the total outstanding commitments. |
32
Piedmont Office Realty Trust, Inc.
Contractual Tenant Improvements and Leasing Commissions
For the Three Months Ended September 30, 2015 | For the Nine Months Ended September 30, 2015 | For the Year Ended | |||||||||
2014 | 2013 | 2012 | |||||||||
Renewal Leases | |||||||||||
Number of leases | 18 | 58 | 56 | 56 | 45 | ||||||
Square feet | 302,761 | 990,937 | 959,424 | 2,376,177 | 1,150,934 | ||||||
Tenant improvements per square foot (1) | $5.15 | $10.57 | $19.02 | $14.24 | $19.12 | ||||||
Leasing commissions per square foot | $3.49 | $7.10 | $8.33 | $4.66 | $6.64 | ||||||
Total per square foot | $8.64 | $17.67 | $27.35 | $18.90 | $25.76 | ||||||
Tenant improvements per square foot per year of lease term | $2.02 | $2.58 | $2.97 | $1.88 | $2.90 | ||||||
Leasing commissions per square foot per year of lease term | $1.37 | $1.73 | $1.30 | $0.62 | $1.01 | ||||||
Total per square foot per year of lease term | $3.39 | (2) | $4.31 | (2) | $4.27 | (3) | $2.50 | $3.91 | (4) | ||
New Leases (5) | |||||||||||
Number of leases | 23 | 70 | 98 | 87 | 92 | ||||||
Square feet | 597,750 | 1,296,268 | 1,142,743 | 1,050,428 | 1,765,510 | ||||||
Tenant improvements per square foot (1) | $74.70 | $58.55 | $34.46 | $35.74 | $47.64 | ||||||
Leasing commissions per square foot | $21.89 | $19.82 | $15.19 | $12.94 | $18.49 | ||||||
Total per square foot | $96.59 | $78.37 | $49.65 | $48.68 | $66.13 | ||||||
Tenant improvements per square foot per year of lease term | $6.99 | $5.53 | $3.78 | $4.17 | $4.30 | ||||||
Leasing commissions per square foot per year of lease term | $2.05 | $1.87 | $1.66 | $1.51 | $1.67 | ||||||
Total per square foot per year of lease term | $9.04 | (6) | $7.40 | (6) | $5.44 | $5.68 | $5.97 | ||||
Total | |||||||||||
Number of leases | 41 | 128 | 154 | 143 | 137 | ||||||
Square feet | 900,511 | 2,287,205 | 2,102,167 | 3,426,605 | 2,916,444 | ||||||
Tenant improvements per square foot (1) | $51.32 | $37.76 | $27.41 | $20.83 | $36.39 | ||||||
Leasing commissions per square foot | $15.71 | $14.31 | $12.06 | $7.20 | $13.81 | ||||||
Total per square foot | $67.03 | $52.07 | $39.47 | $28.03 | $50.20 | ||||||
Tenant improvements per square foot per year of lease term | $6.45 | $4.86 | $3.48 | $2.64 | $3.91 | ||||||
Leasing commissions per square foot per year of lease term | $1.98 | $1.84 | $1.53 | $0.91 | $1.48 | ||||||
Total per square foot per year of lease term | $8.43 | (6) | $6.70 | (6) | $5.01 | (3) | $3.55 | $5.39 | |||
NOTE: | This information is presented for our consolidated office assets only and excludes activity associated with storage and licensed spaces. |
(1) | For leases under which a tenant may use, at its discretion, a portion of its tenant improvement allowance for expenses other than those related to improvements to its space, an assumption is made that the tenant elects to use any such portion of its tenant improvement allowance for improvements to its space prior to the commencement of its lease, unless the Company is notified otherwise by the tenant. This assumption is made based upon historical usage patterns of tenant improvement allowances by the Company's tenants. |
(2) | The average committed capital cost per square foot per year of lease term for renewal leases completed during the third quarter of 2015 was higher than our historical performance on this measure primarily as a result of several lease renewals that involved relocating renewing tenants to new spaces; in addition to those relocations, the average committed capital cost per square foot per year of lease term for renewal leases completed during the nine months ended September 30, 2015, was higher than our historical performance on this measure primarily as a result of two long-term lease renewals completed in Washington, D.C. If the costs associated with these items were to be removed from the average committed capital cost calculation, the average committed capital cost per square foot per year of lease term for renewal leases completed during the nine months ended September 30, 2015, would be $2.53. |
(3) | During 2014, we completed one large, 15-year lease renewal and expansion with a significant capital commitment with Jones Lang LaSalle at Aon Center in Chicago, IL. If the costs associated with this lease were to be removed from the average committed capital cost calculation, the average committed capital cost per square foot per year of lease term for renewal leases and total leases completed during the twelve months ended December 31, 2014 would be $2.12 and $4.47, respectively. |
(4) | During 2012, we completed one large, long-term lease renewal with an above-average capital commitment with US Bancorp at US Bancorp Center in Minneapolis, MN. If the costs associated with this renewal were to be removed from the average committed capital cost calculation, the average committed capital cost per square foot per year of lease term for renewal leases in 2012 would be $2.73. |
(5) | In prior years, Piedmont opportunistically employed a value-add strategy for new property acquisitions. Piedmont defines value-add properties as those acquired with low occupancies at attractive bases with earnings growth and value appreciation potential achievable through leasing up such assets to stabilized occupancies. Because most of the value-add properties acquired by the Company had large vacancies, many of which had not previously been leased (first generation spaces), the leasing of those vacancies has negatively affected Piedmont’s contractual tenant improvements on a per square foot and a per square foot per year basis for new leases. |
(6) | During 2015, we completed five new leases in Washington, D.C., and Chicago, IL, comprising 538,216 square feet with above-average capital commitments. If the costs associated with these new leases were to be removed from the average committed capital cost calculation, the average committed capital cost per square foot per year of lease term for new leases and total leases completed during the three months ended September 30, 2015, would be $5.19 and $4.38, respectively, and those for the nine months ended September 30, 2015, would be $5.41 and $5.01, respectively. |
33
Piedmont Office Realty Trust, Inc.
Geographic Diversification
As of September 30, 2015
($ and square footage in thousands)
Location | Number of Properties | Annualized Lease Revenue | Percentage of Annualized Lease Revenue (%) | Rentable Square Footage | Percentage of Rentable Square Footage (%) | Leased Square Footage | Percent Leased (%) |
Chicago | 6 | $148,546 | 24.4 | 4,832 | 23.3 | 4,246 | 87.9 |
Washington, D.C. | 12 | 101,642 | 16.7 | 3,039 | 14.7 | 2,165 | 71.2 |
New York | 5 | 79,474 | 13.1 | 2,171 | 10.5 | 2,129 | 98.1 |
Minneapolis | 4 | 45,958 | 7.6 | 1,618 | 7.8 | 1,459 | 90.2 |
Dallas | 9 | 45,552 | 7.5 | 1,798 | 8.7 | 1,754 | 97.6 |
Boston | 9 | 45,265 | 7.5 | 1,626 | 7.9 | 1,615 | 99.3 |
Atlanta | 6 | 32,348 | 5.3 | 1,342 | 6.5 | 1,247 | 92.9 |
Los Angeles | 4 | 31,106 | 5.1 | 1,010 | 4.9 | 1,008 | 99.8 |
Philadelphia | 1 | 18,016 | 3.0 | 801 | 3.9 | 801 | 100.0 |
Detroit | 3 | 17,007 | 2.8 | 817 | 3.9 | 724 | 88.6 |
Houston | 1 | 11,231 | 1.8 | 313 | 1.5 | 313 | 100.0 |
Central & South Florida | 4 | 10,715 | 1.8 | 473 | 2.3 | 434 | 91.8 |
Nashville | 2 | 10,547 | 1.7 | 513 | 2.5 | 513 | 100.0 |
Austin | 1 | 6,659 | 1.1 | 195 | 0.9 | 195 | 100.0 |
Phoenix | 1 | 3,549 | 0.6 | 149 | 0.7 | 149 | 100.0 |
Total / Weighted Average | 68 | $607,615 | 100.0 | 20,697 | 100.0 | 18,752 | 90.6 |
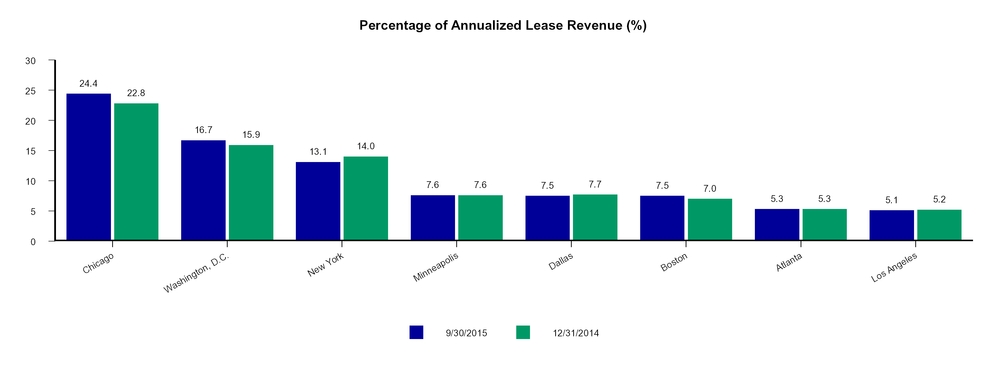
34
Piedmont Office Realty Trust, Inc.
Geographic Diversification by Location Type
As of September 30, 2015
(square footage in thousands)
CBD / URBAN INFILL | SUBURBAN | TOTAL | ||||||||||||||
Location | State | Number of Properties | Percentage of Annualized Lease Revenue (%) | Rentable Square Footage | Percentage of Rentable Square Footage (%) | Number of Properties | Percentage of Annualized Lease Revenue (%) | Rentable Square Footage | Percentage of Rentable Square Footage (%) | Number of Properties | Percentage of Annualized Lease Revenue (%) | Rentable Square Footage | Percentage of Rentable Square Footage (%) | |||
Chicago | IL | 2 | 19.9 | 3,705 | 17.9 | 4 | 4.5 | 1,127 | 5.4 | 6 | 24.4 | 4,832 | 23.3 | |||
Washington, D.C. | DC, VA, MD | 9 | 16.1 | 2,699 | 13.1 | 3 | 0.6 | 340 | 1.6 | 12 | 16.7 | 3,039 | 14.7 | |||
New York | NY, NJ | 1 | 7.8 | 1,033 | 5.0 | 4 | 5.3 | 1,138 | 5.5 | 5 | 13.1 | 2,171 | 10.5 | |||
Minneapolis | MN | 1 | 4.5 | 933 | 4.5 | 3 | 3.1 | 685 | 3.3 | 4 | 7.6 | 1,618 | 7.8 | |||
Dallas | TX | 2 | 2.0 | 440 | 2.1 | 7 | 5.5 | 1,358 | 6.6 | 9 | 7.5 | 1,798 | 8.7 | |||
Boston | MA | 2 | 2.1 | 173 | 0.9 | 7 | 5.4 | 1,453 | 7.0 | 9 | 7.5 | 1,626 | 7.9 | |||
Atlanta | GA | 3 | 4.2 | 960 | 4.6 | 3 | 1.1 | 382 | 1.9 | 6 | 5.3 | 1,342 | 6.5 | |||
Los Angeles | CA | 3 | 4.5 | 876 | 4.2 | 1 | 0.6 | 134 | 0.7 | 4 | 5.1 | 1,010 | 4.9 | |||
Philadelphia | PA | 1 | 3.0 | 801 | 3.9 | — | — | — | — | 1 | 3.0 | 801 | 3.9 | |||
Detroit | MI | 1 | 1.7 | 487 | 2.3 | 2 | 1.1 | 330 | 1.6 | 3 | 2.8 | 817 | 3.9 | |||
Houston | TX | — | — | — | — | 1 | 1.8 | 313 | 1.5 | 1 | 1.8 | 313 | 1.5 | |||
Central & South Florida | FL | — | — | — | — | 4 | 1.8 | 473 | 2.3 | 4 | 1.8 | 473 | 2.3 | |||
Nashville | TN | 1 | 1.3 | 312 | 1.5 | 1 | 0.4 | 201 | 1.0 | 2 | 1.7 | 513 | 2.5 | |||
Austin | TX | — | — | — | — | 1 | 1.1 | 195 | 0.9 | 1 | 1.1 | 195 | 0.9 | |||
Phoenix | AZ | — | — | — | — | 1 | 0.6 | 149 | 0.7 | 1 | 0.6 | 149 | 0.7 | |||
Total / Weighted Average | 26 | 67.1 | 12,419 | 60.0 | 42 | 32.9 | 8,278 | 40.0 | 68 | 100.0 | 20,697 | 100.0 | ||||
35
Piedmont Office Realty Trust, Inc.
Industry Diversification
As of September 30, 2015
($ and square footage in thousands)
Percentage of | ||||||
Number of | Percentage of Total | Annualized Lease | Annualized Lease | Leased Square | Percentage of Leased | |
Industry | Tenants | Tenants (%) | Revenue | Revenue (%) | Footage | Square Footage (%) |
Governmental Entity | 5 | 0.9 | $82,526 | 13.6 | 1,674 | 8.9 |
Business Services | 91 | 16.4 | 62,318 | 10.3 | 2,219 | 11.8 |
Engineering, Accounting, Research, Management & Related Services | 52 | 9.3 | 50,567 | 8.3 | 1,332 | 7.1 |
Depository Institutions | 19 | 3.4 | 47,836 | 7.9 | 1,629 | 8.7 |
Insurance Agents, Brokers & Services | 19 | 3.4 | 40,297 | 6.6 | 1,338 | 7.1 |
Nondepository Credit Institutions | 17 | 3.1 | 37,901 | 6.2 | 1,235 | 6.6 |
Insurance Carriers | 19 | 3.4 | 32,520 | 5.4 | 1,278 | 6.8 |
Security & Commodity Brokers, Dealers, Exchanges & Services | 32 | 5.8 | 23,307 | 3.8 | 780 | 4.2 |
Communications | 37 | 6.6 | 22,038 | 3.6 | 683 | 3.7 |
Food & Kindred Products | 4 | 0.7 | 19,011 | 3.1 | 577 | 3.1 |
Real Estate | 22 | 4.0 | 18,696 | 3.1 | 548 | 2.9 |
Electronic & Other Electrical Equipment & Components, Except Computer | 12 | 2.2 | 18,208 | 3.0 | 582 | 3.1 |
Educational Services | 8 | 1.4 | 15,092 | 2.5 | 395 | 2.1 |
Automotive Repair, Services & Parking | 6 | 1.1 | 13,605 | 2.2 | 45 | 0.2 |
Legal Services | 27 | 4.9 | 10,957 | 1.8 | 350 | 1.9 |
Other | 186 | 33.4 | 112,736 | 18.6 | 4,087 | 21.8 |
Total | 556 | 100.0 | $607,615 | 100.0 | 18,752 | 100.0 |
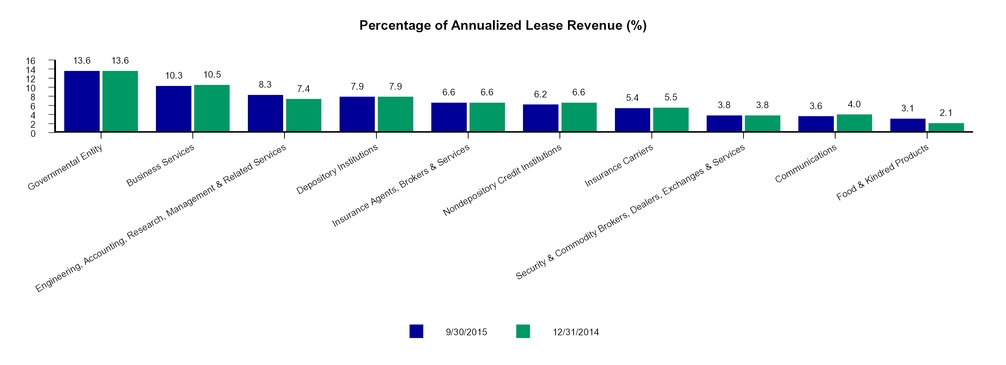
36
Piedmont Office Realty Trust, Inc.
Property Investment Activity
As of September 30, 2015
($ and square footage in thousands)
Acquisitions Over Previous Eighteen Months
Property | Location | Acquisition Date | Percent Ownership (%) | Year Built | Purchase Price | Rentable Square Footage | Percent Leased at Acquisition (%) | |
5 Wall Street | Burlington, MA | 6/27/2014 | 100 | 2008 | $62,498 | 182 | 100 | |
1155 Perimeter Center West | Atlanta, GA | 8/28/2014 | 100 | 2000 | 80,750 | 377 | 100 | |
TownPark Land | Lake Mary, FL | 11/21/2014 | 100 | N/A | 7,700 | N/A | N/A | |
Park Place on Turtle Creek | Dallas, TX | 1/16/2015 | 100 | 1986 | 46,600 | 178 | 88 | |
Two Pierce Place Land | Itasca, IL | 6/2/2015 | 100 | N/A | 3,709 | N/A | N/A | |
80 Central Street | Boxborough, MA | 7/24/2015 | 100 | 1988 | 13,500 | 150 | 93 | |
Total / Weighted Average | $214,757 | 887 | 96 | |||||
Dispositions Over Previous Eighteen Months
Property | Location | Disposition Date | Percent Ownership (%) | Year Built | Sale Price | Rentable Square Footage | Percent Leased at Disposition (%) | |
1441 West Long Lake Road | Troy, MI | 4/30/2014 | 100 | 1999 | $7,850 | 108 | 88 | |
4685 Investment Drive | Troy, MI | 4/30/2014 | 100 | 2000 | 11,500 | 77 | 100 | |
2020 West 89th Street | Leawood, KS | 5/19/2014 | 100 | 1992 | 5,800 | 68 | 90 | |
Two Park Center | (1) | Hoffman Estates, IL | 5/29/2014 | 72 | 1999 | 8,825 | 194 | 0 (1) |
3900 Dallas Parkway | Plano, TX | 1/30/2015 | 100 | 1999 | 26,167 | 120 | 100 | |
5601 Headquarters Drive | Plano, TX | 4/28/2015 | 100 | 2001 | 33,700 | 166 | 100 | |
River Corporate Center | Tempe, AZ | 4/29/2015 | 100 | 1998 | 24,600 | 133 | 100 | |
Copper Ridge Center | Lyndhurst, NJ | 5/1/2015 | 100 | 1989 | 51,025 | 268 | 87 | |
Eastpoint I & Eastpoint II | Mayfield Heights, OH | 7/28/2015 | 100 | 2000 | 18,500 | 170 | 91 | |
3750 Brookside Parkway | Alpharetta, GA | 8/10/2015 | 100 | 2001 | 14,086 | 105 | 91 | |
Chandler Forum | Chandler, AZ | 9/1/2015 | 100 | 2003 | 33,900 | 150 | 100 | |
Total / Weighted Average | $235,953 | 1,559 | 94 | |||||
Acquisitions Subsequent to Quarter End
Property | Location | Acquisition Date | Percent Ownership (%) | Year Built | Purchase Price | Rentable Square Footage | Percent Leased at Acquisition (%) | |
SunTrust Center | Orlando, FL | 11/4/2015 | 100 | 1988 | $170,804 | 655 | 89 | |
Galleria 300 | Atlanta, GA | 11/4/2015 | 100 | 1987 | 88,317 | 433 | 89 | |
Total / Weighted Average | $259,121 | 1,088 | 89 | |||||
Dispositions Subsequent to Quarter End
Property | Location | Disposition Date | Percent Ownership (%) | Year Built | Sale Price | Rentable Square Footage | Percent Leased at Disposition (%) | |
Aon Center | Chicago, IL | 10/29/2015 | 100 | 1972 | $712,000 | 2,738 | 87 | |
(1) | The sale price and rentable square footage presented are gross figures and have not been adjusted for Piedmont's ownership percentage. Average Percent Leased at Disposition for dispositions completed during the previous eighteen months excludes this joint venture property, which was sold to an owner-occupant. |
37
Piedmont Office Realty Trust, Inc.
Other Investments
As of September 30, 2015
($ and square footage in thousands)
Unconsolidated Joint Venture Properties
Property | Location | Percent Ownership (%) | Year Built | Piedmont Share of Real Estate Net Book Value | Real Estate Net Book Value | Rentable Square Footage | Percent Leased (%) |
8560 Upland Drive | Parker, CO | 72 | 2001 | $6,982 | $9,711 | 148.6 | 100 |
Land Parcels
Property | Location | Adjacent Piedmont Property | Acres | Real Estate Book Value |
Gavitello | Atlanta, GA | The Medici | 2.0 | $2,500 |
Glenridge Highlands Three | Atlanta, GA | Glenridge Highlands Two | 3.0 | 1,725 |
State Highway 161 | Irving, TX | Las Colinas Corporate Center II | 4.5 | 3,320 |
Royal Lane | Irving, TX | 6011, 6021 and 6031 Connection Drive | 10.6 | 2,628 |
TownPark | Lake Mary, FL | 400 and 500 TownPark | 18.9 | 5,741 |
Total | 39.0 | $15,914 | ||
Development and Redevelopment
Property | Location | Adjacent Piedmont Property | Construction Type | Actual or Targeted Completion Date | Percent Leased (%) | Square Feet | Current Asset Basis (Accrual) | Project Capital Expended (Cash) | Estimated Additional Capital Required (1) (Cash) |
Enclave Place | Houston, TX | 1430 Enclave Parkway | Development | Q3 2015 | N/A | 300.9 | $60,765 | $52,373 | $33 to $38 million |
3100 Clarendon Boulevard (2) | Arlington, VA | Not Applicable | Redevelopment | Q4 2015 (3) | 12 | 261.8 | 81,374 | 28,722 | $25 to $27 million |
500 TownPark | Lake Mary, FL | 400 TownPark | Development | Q1 2017 | 80 | 135.0 | 3,912 | 1,005 | $27 to $29 million |
Total | 697.7 | $146,051 | $82,100 | $85 to $94 million | |||||
(1) | Amount includes anticipated development costs as well as estimated lease-up costs. |
(2) | The Current Asset Basis presented is that of the office portion of the property only. The retail portion of the property remains in service and retail tenants will remain in occupancy during the redevelopment. |
(3) | The redevelopment of the office tower is complete; the retail facade portion of the redevelopment will be completed during the fourth quarter of 2015. |
38
Piedmont Office Realty Trust, Inc.
Supplemental Definitions
Included in this section are management's statements regarding certain non-GAAP financial measures provided in this supplemental report and reasons why management believes that these measures provide useful information to investors about the Company's financial condition and results of operations. Reconciliations of these non-GAAP measures are included beginning on page 41. |
Adjusted Funds From Operations ("AFFO"): AFFO is calculated by deducting from Core FFO non-incremental capital expenditures and acquisition-related costs and adding back non-cash items including non-real estate depreciation, straight lined rents and fair value lease revenue, non-cash components of interest expense and compensation expense, and by making similar adjustments for unconsolidated partnerships and joint ventures. Although AFFO may not be comparable to that of other REITs, we believe it provides a meaningful indicator of our ability to fund cash needs and to make cash distributions to equity owners. AFFO is a non-GAAP financial measure and should not be viewed as an alternative measurement of our operating performance to net income, as an alternative to net cash flows from operating activities or as a measure of our liquidity. |
Annualized Lease Revenue ("ALR"): ALR is calculated by multiplying (i) rental payments (defined as base rent plus operating expense reimbursements, if payable by the tenant on a monthly basis under the terms of a lease that has been executed, but excluding a) rental abatements and b) rental payments related to executed but not commenced leases for space that was covered by an existing lease), by (ii) 12. In instances in which contractual rents or operating expense reimbursements are collected on an annual, semi-annual, or quarterly basis, such amounts are multiplied by a factor of 1, 2, or 4, respectively, to calculate the annualized figure. For leases that have been executed but not commenced relating to un-leased space, ALR is calculated by multiplying (i) the monthly base rental payment (excluding abatements) plus any operating expense reimbursements for the initial month of the lease term, by (ii) 12. Unless stated otherwise, this measure excludes our unconsolidated joint venture interests. |
Core EBITDA: Core EBITDA is defined as net income before interest, taxes, depreciation and amortization and incrementally removing any impairment losses, gains or losses from sales of property, or other significant non-recurring items. We do not include impairment losses in this measure, because we feel these types of losses create volatility in our earnings and make it difficult to determine the earnings generated by our ongoing business. We believe Core EBITDA is a reasonable measure of our liquidity. Core EBITDA is a non-GAAP financial measure and should not be viewed as an alternative measurement of cash flows from operating activities or other GAAP basis liquidity measures. Other REITs may calculate Core EBITDA differently and our calculation should not be compared to that of other REITs. |
Core Funds From Operations ("Core FFO"): We calculate Core FFO by starting with FFO, as defined by NAREIT, and adjusting for certain non-recurring items such as gains or losses on the extinguishment of swaps, acquisition-related costs and other significant non-recurring items. Such items create significant earnings volatility. We believe Core FFO provides a meaningful measure of our operating performance and more predictability regarding future earnings potential. Core FFO is a non-GAAP financial measure and should not be viewed as an alternative measurement of our operating performance to net income; therefore, it should not be compared to other REITs' equivalent to Core FFO. |
EBITDA: EBITDA is defined as net income before interest, taxes, depreciation and amortization. We believe EBITDA is an appropriate measure of our ability to incur and service debt. EBITDA should not be considered as an alternative to cash flows from operating activities, as a measure of our liquidity or as an alternative to net income as an indicator of our operating activities. Other REITs may calculate EBITDA differently and our calculation should not be compared to that of other REITs. |
Funds From Operations ("FFO"): FFO is calculated in accordance with the current National Association of Real Estate Investment Trusts ("NAREIT") definition. NAREIT currently defines FFO as net income (computed in accordance with GAAP), excluding gains or losses from sales of property, impairment losses, and gains or losses on consolidation, adding back depreciation and amortization on real estate assets, and after the same adjustments for unconsolidated partnerships and joint ventures. These adjustments can vary among owners of identical assets in similar conditions based on historical cost accounting and useful-life estimates. FFO may provide valuable comparisons of operating performance between periods and with other REITs. FFO is a non-GAAP financial measure and should not be viewed as an alternative measurement of our operating performance to net income. We believe that FFO is a beneficial indicator of the performance of an equity REIT. However, other REITs may not define FFO in accordance with the NAREIT definition, or may interpret the current NAREIT definition differently than we do; therefore, our computation of FFO may not be comparable to that of such other REITs. |
Gross Assets: Gross assets is defined as total assets with the add back of accumulated depreciation and accumulated amortization related to real estate assets. |
Gross Real Estate Assets: Gross real estate assets is defined as total real estate assets with the add back of accumulated depreciation and accumulated amortization related to real estate assets. |
Incremental Capital Expenditures: Incremental Capital Expenditures are defined as capital expenditures of a non-recurring nature that incrementally enhance the underlying assets' income generating capacity. Tenant improvements, leasing commissions, building capital and deferred lease incentives ("Leasing Costs") incurred to lease space that was vacant at acquisition, Leasing Costs for spaces vacant for greater than one year, Leasing Costs for spaces at newly acquired properties for which in-place leases expire shortly after acquisition, improvements associated with the expansion of a building and renovations that change the underlying classification of a building are included in this measure. |
NOI from Unconsolidated Joint Ventures: NOI from Unconsolidated Joint Ventures is defined as Property NOI attributable to our interests in properties owned through unconsolidated partnerships. We present this measure on an accrual basis and a cash basis, which eliminates the effects of straight lined rents and fair value lease revenue. NOI from Unconsolidated Joint Ventures is a non-GAAP measure and therefore may not be comparable to similarly defined data provided by other REITs. |
Non-Incremental Capital Expenditures: Non-Incremental Capital Expenditures are defined as capital expenditures of a recurring nature related to tenant improvements and leasing commissions that do not incrementally enhance the underlying assets' income generating capacity. We exclude first generation tenant improvements and leasing commissions from this measure, in addition to other capital expenditures that qualify as Incremental Capital Expenditures, as defined above. |
Property Net Operating Income ("Property NOI"): Property NOI is defined as real estate operating income with the add-back of corporate general and administrative expense, depreciation and amortization, and impairment losses and the deduction of net operating income associated with property management performed by Piedmont for other organizations. We may present this measure on an accrual basis or a cash basis. When presented on a cash basis, the effects of straight lined rents and fair value lease revenue are eliminated. The Company uses this measure to assess its operating results and believes it is important in assessing operating performance. Property NOI is a non-GAAP measure which does not have any standard meaning prescribed by GAAP and therefore may not be comparable to similar measures presented by other companies. |
Same Store Net Operating Income ("Same Store NOI"): Same Store NOI is calculated as the Property NOI attributable to the properties owned or placed in service during the entire span of the current and prior year reporting periods. Same Store NOI excludes amounts attributable to unconsolidated joint venture assets. We may present this measure on an accrual basis or a cash basis. When presented on a cash basis, the effects of straight lined rents and fair value lease revenue are eliminated. We believe Same Store NOI is an important measure of comparison of our properties' operating performance from one period to another. Other REITs may calculate Same Store NOI differently and our calculation should not be compared to that of other REITs. |
Same Store Properties: Same Store Properties is defined as properties owned or placed in service during the entire span of the current and prior year reporting periods. Same Store Properties excludes unconsolidated joint venture assets. We believe Same Store Properties is an important measure of comparison of our stabilized portfolio performance. |
39
Piedmont Office Realty Trust, Inc.
Research Coverage
Equity Research Coverage
Barry Oxford | Jed Reagan | Anthony Paolone, CFA | Vance H. Edelson |
D.A. Davidson & Company | Green Street Advisors | JP Morgan | Morgan Stanley |
260 Madison Avenue, 8th Floor | 660 Newport Center Drive, Suite 800 | 383 Madison Avenue | 1585 Broadway, 38th Floor |
New York, NY 10016 | Newport Beach, CA 92660 | 34th Floor | New York, NY 10036 |
Phone: (212) 240-9871 | Phone: (949) 640-8780 | New York, NY 10179 | Phone: (212) 761-0078 |
Phone: (212) 622-6682 | |||
Steve Manaker, CFA | David Rodgers, CFA | John W. Guinee, III | Michael Lewis, CFA |
Oppenheimer & Co. | Robert W. Baird & Co. | Erin Aslakson | SunTrust Robinson Humphrey |
85 Broad Street | 200 Public Square | Stifel, Nicolaus & Company | 711 Fifth Avenue, 14th Floor |
New York, NY 10004 | Suite 1650 | One South Street | New York, NY 10022 |
Phone: (212) 667-5950 | Cleveland, OH 44139 | 16th Floor | Phone: (212) 319-5659 |
Phone: (216) 737-7341 | Baltimore, MD 21202 | ||
Phone: (443) 224-1307 | |||
Brendan Maiorana | |||
Wells Fargo | |||
7 St. Paul Street | |||
MAC R1230-011 | |||
Baltimore, MD 21202 | |||
Phone: (443) 263-6516 | |||
Fixed Income Research Coverage
Mark S. Streeter, CFA | ||
JP Morgan | ||
383 Madison Avenue | ||
3rd Floor | ||
New York, NY 10179 | ||
Phone: (212) 834-5086 | ||
40
Piedmont Office Realty Trust, Inc.
Funds From Operations, Core Funds From Operations, and Adjusted Funds From Operations Reconciliations
Unaudited (in thousands)
Three Months Ended | Nine Months Ended | ||||||||||||||||||||||||||
9/30/2015 | 6/30/2015 | 3/31/2015 | 12/31/2014 | 9/30/2014 | 9/30/2015 | 9/30/2014 | |||||||||||||||||||||
GAAP net income applicable to common stock | $ | (1,875 | ) | $ | 29,976 | $ | 19,245 | $ | 12,514 | $ | 9,162 | $ | 47,346 | $ | 30,834 | ||||||||||||
Depreciation | 31,093 | 35,935 | 36,097 | 35,365 | 35,286 | 103,125 | 103,132 | ||||||||||||||||||||
Amortization | 14,037 | 14,971 | 14,686 | 14,188 | 14,248 | 43,694 | 42,660 | ||||||||||||||||||||
Impairment loss | 34,815 | 5,354 | — | — | — | 40,169 | — | ||||||||||||||||||||
Loss / (gain) on sale of properties | (17,140 | ) | (26,611 | ) | (10,073 | ) | 8 | — | (53,824 | ) | (2,169 | ) | |||||||||||||||
NAREIT funds from operations applicable to common stock | 60,930 | 59,625 | 59,955 | 62,075 | 58,696 | 180,510 | 174,457 | ||||||||||||||||||||
Adjustments: | |||||||||||||||||||||||||||
Acquisition costs | 128 | 3 | 144 | 21 | 110 | 275 | 539 | ||||||||||||||||||||
Loss / (gain) on extinguishment of swaps | — | 132 | — | — | — | 132 | — | ||||||||||||||||||||
Net (recoveries) / loss from casualty events and litigation settlements | — | — | — | (2,478 | ) | 8 | — | (4,514 | ) | ||||||||||||||||||
Core funds from operations applicable to common stock | 61,058 | 59,760 | 60,099 | 59,618 | 58,814 | 180,917 | 170,482 | ||||||||||||||||||||
Adjustments: | |||||||||||||||||||||||||||
Deferred financing cost amortization | 718 | 680 | 724 | 627 | 598 | 2,122 | 2,076 | ||||||||||||||||||||
Amortization of note payable step-up | (121 | ) | (121 | ) | (121 | ) | (120 | ) | (120 | ) | (363 | ) | (126 | ) | |||||||||||||
Amortization of discount on senior notes | 49 | 49 | 48 | 47 | 47 | 146 | 128 | ||||||||||||||||||||
Depreciation of non real estate assets | 168 | 165 | 196 | 138 | 141 | 529 | 370 | ||||||||||||||||||||
Straight-line effects of lease revenue | (2,519 | ) | (3,745 | ) | (4,510 | ) | (5,171 | ) | (6,780 | ) | (10,774 | ) | (23,950 | ) | |||||||||||||
Stock-based and other non-cash compensation expense | 2,622 | 1,692 | 725 | 929 | 1,139 | 5,039 | 3,046 | ||||||||||||||||||||
Amortization of lease-related intangibles | (1,145 | ) | (1,102 | ) | (1,122 | ) | (1,074 | ) | (1,010 | ) | (3,369 | ) | (3,653 | ) | |||||||||||||
Acquisition costs | (128 | ) | (3 | ) | (144 | ) | (21 | ) | (110 | ) | (275 | ) | (539 | ) | |||||||||||||
Non-incremental capital expenditures | (8,269 | ) | (11,641 | ) | (10,287 | ) | (13,768 | ) | (30,890 | ) | (30,197 | ) | (70,862 | ) | |||||||||||||
Adjusted funds from operations applicable to common stock | $ | 52,433 | $ | 45,734 | $ | 45,608 | $ | 41,205 | $ | 21,829 | $ | 143,775 | $ | 76,972 | |||||||||||||
41
Piedmont Office Realty Trust, Inc.
Same Store Net Operating Income (Cash Basis)
Unaudited (in thousands)
Three Months Ended | Nine Months Ended | ||||||||||||||||||||||||||
9/30/2015 | 6/30/2015 | 3/31/2015 | 12/31/2014 | 9/30/2014 | 9/30/2015 | 9/30/2014 | |||||||||||||||||||||
Net income attributable to Piedmont | $ | (1,875 | ) | $ | 29,976 | $ | 19,245 | $ | 12,514 | $ | 9,162 | $ | 47,346 | $ | 30,834 | ||||||||||||
Net income attributable to noncontrolling interest | 4 | 4 | 4 | 3 | 4 | 12 | 12 | ||||||||||||||||||||
Interest expense | 18,832 | 18,172 | 19,016 | 18,854 | 18,654 | 56,020 | 55,592 | ||||||||||||||||||||
Depreciation | 31,261 | 36,100 | 36,292 | 35,503 | 35,427 | 103,654 | 103,502 | ||||||||||||||||||||
Amortization | 14,037 | 14,971 | 14,686 | 14,188 | 14,248 | 43,694 | 42,660 | ||||||||||||||||||||
Acquisition costs | 128 | 3 | 144 | 21 | 110 | 275 | 539 | ||||||||||||||||||||
Impairment loss | 34,815 | 5,354 | — | — | — | 40,169 | — | ||||||||||||||||||||
Net (recoveries) / loss from casualty events and litigation settlements | — | — | — | (2,478 | ) | 8 | — | (4,514 | ) | ||||||||||||||||||
Loss / (gain) on sale of properties | (17,140 | ) | (26,611 | ) | (10,073 | ) | 8 | — | (53,824 | ) | (2,169 | ) | |||||||||||||||
Core EBITDA | 80,062 | 77,969 | 79,314 | 78,613 | 77,613 | 237,346 | 226,456 | ||||||||||||||||||||
General & administrative expenses | 8,246 | 8,102 | 6,416 | 6,313 | 5,808 | 22,764 | 17,550 | ||||||||||||||||||||
Management fee revenue | (329 | ) | (232 | ) | (330 | ) | (272 | ) | (299 | ) | (891 | ) | (839 | ) | |||||||||||||
Other (income) / expense | (931 | ) | (599 | ) | 38 | (15 | ) | 21 | (1,493 | ) | 54 | ||||||||||||||||
Straight-line effects of lease revenue | (2,519 | ) | (3,745 | ) | (4,510 | ) | (5,171 | ) | (6,780 | ) | (10,774 | ) | (23,950 | ) | |||||||||||||
Amortization of lease-related intangibles | (1,145 | ) | (1,102 | ) | (1,122 | ) | (1,074 | ) | (1,010 | ) | (3,369 | ) | (3,653 | ) | |||||||||||||
Property net operating income (cash basis) | 83,384 | 80,393 | 79,806 | 78,394 | 75,353 | 243,583 | 215,618 | ||||||||||||||||||||
Deduct net operating (income) / loss from: | |||||||||||||||||||||||||||
Acquisitions | (3,190 | ) | (2,842 | ) | (2,665 | ) | (2,314 | ) | (1,387 | ) | (8,698 | ) | (1,442 | ) | |||||||||||||
Dispositions | (429 | ) | (1,647 | ) | (3,077 | ) | (2,888 | ) | (2,885 | ) | (5,153 | ) | (10,366 | ) | |||||||||||||
Other investments | (276 | ) | (251 | ) | (296 | ) | (277 | ) | (214 | ) | (822 | ) | 258 | ||||||||||||||
Same store net operating income (cash basis) | $ | 79,489 | $ | 75,653 | $ | 73,768 | $ | 72,915 | $ | 70,867 | $ | 228,910 | $ | 204,068 | |||||||||||||
42
Piedmont Office Realty Trust, Inc.
Unconsolidated Joint Venture Net Operating Income Reconciliations
Pro rata and unaudited (in thousands)
Three Months Ended | Nine Months Ended | ||||||||||||||||||||||||||
9/30/2015 | 6/30/2015 | 3/31/2015 | 12/31/2014 | 9/30/2014 | 9/30/2015 | 9/30/2014 | |||||||||||||||||||||
Equity in income of unconsolidated joint ventures | $ | 135 | $ | 124 | $ | 159 | $ | 160 | $ | 89 | $ | 418 | $ | (510 | ) | ||||||||||||
Interest expense | — | — | — | — | — | — | — | ||||||||||||||||||||
Depreciation | 61 | 62 | 62 | 61 | 61 | 184 | 264 | ||||||||||||||||||||
Amortization | 16 | 16 | 16 | 16 | 13 | 49 | 30 | ||||||||||||||||||||
Impairment loss | — | — | — | — | — | — | — | ||||||||||||||||||||
Loss / (gain) on sale of properties | — | — | — | — | — | — | 169 | ||||||||||||||||||||
Core EBITDA | 212 | 202 | 237 | 237 | 163 | 651 | (47 | ) | |||||||||||||||||||
General and administrative expenses | 10 | 18 | 8 | 6 | 2 | 37 | 38 | ||||||||||||||||||||
Other (income) / expense | — | — | — | — | — | — | — | ||||||||||||||||||||
Property net operating income (accrual basis) | 222 | 220 | 245 | 243 | 165 | 688 | (9 | ) | |||||||||||||||||||
Straight-line effects of lease revenue | (3 | ) | (5 | ) | (5 | ) | (8 | ) | (7 | ) | (14 | ) | (20 | ) | |||||||||||||
Amortization of lease-related intangibles | — | — | — | — | — | — | — | ||||||||||||||||||||
Property net operating income (cash basis) | $ | 219 | $ | 215 | $ | 240 | $ | 235 | $ | 158 | $ | 674 | $ | (29 | ) | ||||||||||||
43
Piedmont Office Realty Trust, Inc.
Discontinued Operations
Unaudited (in thousands)
Three Months Ended | Nine Months Ended | ||||||||||||||||||||||||||
9/30/2015 | 6/30/2015 | 3/31/2015 | 12/31/2014 | 9/30/2014 | 9/30/2015 | 9/30/2014 | |||||||||||||||||||||
Revenues: | |||||||||||||||||||||||||||
Rental income | $ | 19 | $ | — | $ | — | $ | — | $ | — | $ | 19 | $ | 1,365 | |||||||||||||
Tenant reimbursements | — | (3 | ) | — | (1 | ) | 12 | (3 | ) | 126 | |||||||||||||||||
Property management fee revenue | — | — | — | — | — | — | 1 | ||||||||||||||||||||
Other rental income | — | — | — | — | — | — | — | ||||||||||||||||||||
19 | (3 | ) | — | (1 | ) | 12 | 16 | 1,492 | |||||||||||||||||||
Expenses: | |||||||||||||||||||||||||||
Property operating costs | 3 | (1 | ) | — | 40 | 3 | 2 | 185 | |||||||||||||||||||
Depreciation | — | — | — | — | — | — | 83 | ||||||||||||||||||||
Amortization | — | — | — | — | — | — | 223 | ||||||||||||||||||||
General and administrative | — | 1 | — | 1 | (7 | ) | 1 | (1 | ) | ||||||||||||||||||
3 | — | — | 41 | (4 | ) | 3 | 490 | ||||||||||||||||||||
Other income / (expense): | |||||||||||||||||||||||||||
Interest expense | — | — | — | — | — | — | — | ||||||||||||||||||||
Other income / (expense) | — | — | — | — | — | — | (6 | ) | |||||||||||||||||||
Net recoveries / (loss) from casualty events and litigation settlements | — | — | — | — | — | — | — | ||||||||||||||||||||
Net income attributable to noncontrolling interest | — | — | — | — | — | — | — | ||||||||||||||||||||
— | — | — | — | — | — | (6 | ) | ||||||||||||||||||||
Operating income, excluding impairment loss and gain / (loss) on sale | 16 | (3 | ) | — | (42 | ) | 16 | 13 | 996 | ||||||||||||||||||
Impairment loss | — | — | — | — | — | — | — | ||||||||||||||||||||
Gain / (loss) on sale of properties | (2 | ) | — | — | — | — | (2 | ) | 1,198 | ||||||||||||||||||
Income from discontinued operations | $ | 14 | $ | (3 | ) | $ | — | $ | (42 | ) | $ | 16 | $ | 11 | $ | 2,194 | |||||||||||
44
Piedmont Office Realty Trust, Inc.
Property Detail
As of September 30, 2015
(in thousands)
Property | City | State | Percent Ownership | Year Built | Rentable Square Footage Owned | Leased Percentage | Commenced Leased Percentage | Economic Leased Percentage (1) | |||
Atlanta | |||||||||||
11695 Johns Creek Parkway | Johns Creek | GA | 100.0% | 2001 | 101 | 92.1 | % | 92.1 | % | 92.1 | % |
Glenridge Highlands Two | Atlanta | GA | 100.0% | 2000 | 427 | 100.0 | % | 100.0 | % | 89.5 | % |
Suwanee Gateway One | Suwanee | GA | 100.0% | 2008 | 143 | 42.0 | % | 42.0 | % | — | % |
The Dupree | Atlanta | GA | 100.0% | 1997 | 138 | 100.0 | % | 100.0 | % | 97.8 | % |
The Medici | Atlanta | GA | 100.0% | 2008 | 156 | 97.4 | % | 86.5 | % | 80.8 | % |
1155 Perimeter Center West | Atlanta | GA | 100.0% | 2000 | 377 | 100.0 | % | 100.0 | % | 100.0 | % |
Metropolitan Area Subtotal / Weighted Average | 1,342 | 92.9 | % | 91.7 | % | 82.9 | % | ||||
Austin | |||||||||||
Braker Pointe III | Austin | TX | 100.0% | 2001 | 195 | 100.0 | % | 100.0 | % | 100.0 | % |
Metropolitan Area Subtotal / Weighted Average | 195 | 100.0 | % | 100.0 | % | 100.0 | % | ||||
Boston | |||||||||||
1200 Crown Colony Drive | Quincy | MA | 100.0% | 1990 | 235 | 100.0 | % | 100.0 | % | 100.0 | % |
80 Central Street | Boxborough | MA | 100.0% | 1988 | 150 | 92.7 | % | 92.7 | % | 92.7 | % |
90 Central Street | Boxborough | MA | 100.0% | 2001 | 175 | 100.0 | % | 100.0 | % | 38.9 | % |
1414 Massachusetts Avenue | Cambridge | MA | 100.0% | 1873 | 78 | 100.0 | % | 100.0 | % | 100.0 | % |
One Brattle Square | Cambridge | MA | 100.0% | 1991 | 95 | 100.0 | % | 100.0 | % | 100.0 | % |
225 Presidential Way | Woburn | MA | 100.0% | 2001 | 202 | 100.0 | % | 100.0 | % | 100.0 | % |
235 Presidential Way | Woburn | MA | 100.0% | 2000 | 238 | 100.0 | % | 100.0 | % | 100.0 | % |
5 & 15 Wayside Road | Burlington | MA | 100.0% | 1999 / 2001 | 271 | 100.0 | % | 100.0 | % | 100.0 | % |
5 Wall Street | Burlington | MA | 100.0% | 2008 | 182 | 100.0 | % | 100.0 | % | 100.0 | % |
Metropolitan Area Subtotal / Weighted Average | 1,626 | 99.3 | % | 99.3 | % | 92.7 | % | ||||
Chicago | |||||||||||
Windy Point I | Schaumburg | IL | 100.0% | 1999 | 187 | 66.3 | % | 66.3 | % | 66.3 | % |
Windy Point II | Schaumburg | IL | 100.0% | 2001 | 301 | 100.0 | % | 100.0 | % | 83.1 | % |
Aon Center | Chicago | IL | 100.0% | 1972 | 2,738 | 87.3 | % | 78.6 | % | 70.3 | % |
Two Pierce Place | Itasca | IL | 100.0% | 1991 | 486 | 96.7 | % | 96.7 | % | 88.5 | % |
2300 Cabot Drive | Lisle | IL | 100.0% | 1998 | 153 | 77.1 | % | 77.1 | % | 77.1 | % |
500 West Monroe Street | Chicago | IL | 100.0% | 1991 | 967 | 87.3 | % | 71.8 | % | 60.1 | % |
Metropolitan Area Subtotal / Weighted Average | 4,832 | 87.9 | % | 79.9 | % | 71.0 | % | ||||
45
Property | City | State | Percent Ownership | Year Built | Rentable Square Footage Owned | Leased Percentage | Commenced Leased Percentage | Economic Leased Percentage (1) | |||
Dallas | |||||||||||
6031 Connection Drive | Irving | TX | 100.0% | 1999 | 232 | 100.0 | % | 100.0 | % | 100.0 | % |
6021 Connection Drive | Irving | TX | 100.0% | 2000 | 222 | 100.0 | % | 100.0 | % | 100.0 | % |
6011 Connection Drive | Irving | TX | 100.0% | 1999 | 152 | 100.0 | % | 100.0 | % | 100.0 | % |
Las Colinas Corporate Center I | Irving | TX | 100.0% | 1998 | 159 | 100.0 | % | 100.0 | % | 100.0 | % |
Las Colinas Corporate Center II | Irving | TX | 100.0% | 1998 | 228 | 99.1 | % | 99.1 | % | 97.8 | % |
6565 North MacArthur Boulevard | Irving | TX | 100.0% | 1998 | 260 | 98.5 | % | 97.7 | % | 95.8 | % |
One Lincoln Park | Dallas | TX | 100.0% | 1999 | 262 | 91.6 | % | 91.6 | % | 88.9 | % |
161 Corporate Center | Irving | TX | 100.0% | 1998 | 105 | 100.0 | % | 100.0 | % | 100.0 | % |
Park Place on Turtle Creek | Dallas | TX | 100.0% | 1986 | 178 | 91.0 | % | 85.4 | % | 85.4 | % |
Metropolitan Area Subtotal / Weighted Average | 1,798 | 97.6 | % | 96.9 | % | 96.1 | % | ||||
Detroit | |||||||||||
150 West Jefferson | Detroit | MI | 100.0% | 1989 | 487 | 80.9 | % | 77.0 | % | 68.0 | % |
Auburn Hills Corporate Center | Auburn Hills | MI | 100.0% | 2001 | 120 | 100.0 | % | 100.0 | % | 100.0 | % |
1075 West Entrance Drive | Auburn Hills | MI | 100.0% | 2001 | 210 | 100.0 | % | 100.0 | % | 100.0 | % |
Metropolitan Area Subtotal / Weighted Average | 817 | 88.6 | % | 86.3 | % | 80.9 | % | ||||
Central & South Florida | |||||||||||
Sarasota Commerce Center II | Sarasota | FL | 100.0% | 1999 | 149 | 85.9 | % | 85.9 | % | 85.2 | % |
5601 Hiatus Road | Tamarac | FL | 100.0% | 2001 | 100 | 100.0 | % | 100.0 | % | 100.0 | % |
2001 NW 64th Street | Ft. Lauderdale | FL | 100.0% | 2001 | 48 | 100.0 | % | 100.0 | % | 100.0 | % |
400 TownPark | Lake Mary | FL | 100.0% | 2008 | 176 | 89.8 | % | 88.1 | % | 85.8 | % |
Metropolitan Area Subtotal / Weighted Average | 473 | 91.8 | % | 91.1 | % | 90.1 | % | ||||
Houston | |||||||||||
1430 Enclave Parkway | Houston | TX | 100.0% | 1994 | 313 | 100.0 | % | 100.0 | % | 100.0 | % |
Metropolitan Area Subtotal / Weighted Average | 313 | 100.0 | % | 100.0 | % | 100.0 | % | ||||
Los Angeles | |||||||||||
800 North Brand Boulevard | Glendale | CA | 100.0% | 1990 | 527 | 100.0 | % | 99.2 | % | 98.7 | % |
1055 East Colorado Boulevard | Pasadena | CA | 100.0% | 2001 | 176 | 98.9 | % | 94.9 | % | 94.9 | % |
Fairway Center II | Brea | CA | 100.0% | 2002 | 134 | 100.0 | % | 100.0 | % | 100.0 | % |
1901 Main Street | Irvine | CA | 100.0% | 2001 | 173 | 100.0 | % | 93.1 | % | 93.1 | % |
Metropolitan Area Subtotal / Weighted Average | 1,010 | 99.8 | % | 97.5 | % | 97.2 | % | ||||
Minneapolis | |||||||||||
Crescent Ridge II | Minnetonka | MN | 100.0% | 2000 | 301 | 83.4 | % | 83.4 | % | 77.1 | % |
US Bancorp Center | Minneapolis | MN | 100.0% | 2000 | 933 | 88.5 | % | 87.1 | % | 85.7 | % |
One Meridian Crossings | Richfield | MN | 100.0% | 1997 | 195 | 100.0 | % | 100.0 | % | 100.0 | % |
Two Meridian Crossings | Richfield | MN | 100.0% | 1998 | 189 | 98.9 | % | 98.4 | % | 94.2 | % |
Metropolitan Area Subtotal / Weighted Average | 1,618 | 90.2 | % | 89.3 | % | 86.8 | % | ||||
46
Property | City | State | Percent Ownership | Year Built | Rentable Square Footage Owned | Leased Percentage | Commenced Leased Percentage | Economic Leased Percentage (1) | |||
Nashville | |||||||||||
2120 West End Avenue | Nashville | TN | 100.0% | 2000 | 312 | 100.0 | % | 100.0 | % | 100.0 | % |
5301 Maryland Way | Brentwood | TN | 100.0% | 1989 | 201 | 100.0 | % | 100.0 | % | 100.0 | % |
Metropolitan Area Subtotal / Weighted Average | 513 | 100.0 | % | 100.0 | % | 100.0 | % | ||||
New York | |||||||||||
2 Gatehall Drive | Parsippany | NJ | 100.0% | 1985 | 405 | 100.0 | % | 100.0 | % | 100.0 | % |
200 Bridgewater Crossing | Bridgewater | NJ | 100.0% | 2002 | 309 | 93.9 | % | 93.9 | % | 91.9 | % |
60 Broad Street | New York | NY | 100.0% | 1962 | 1,033 | 100.0 | % | 99.1 | % | 94.0 | % |
600 Corporate Drive | Lebanon | NJ | 100.0% | 2005 | 125 | 100.0 | % | 100.0 | % | 100.0 | % |
400 Bridgewater Crossing | Bridgewater | NJ | 100.0% | 2002 | 299 | 92.3 | % | 92.3 | % | 92.3 | % |
Metropolitan Area Subtotal / Weighted Average | 2,171 | 98.1 | % | 97.7 | % | 94.9 | % | ||||
Philadelphia | |||||||||||
1901 Market Street | Philadelphia | PA | 100.0% | 1987 | 801 | 100.0 | % | 100.0 | % | 100.0 | % |
Metropolitan Area Subtotal / Weighted Average | 801 | 100.0 | % | 100.0 | % | 100.0 | % | ||||
Phoenix | |||||||||||
Desert Canyon 300 | Phoenix | AZ | 100.0% | 2001 | 149 | 100.0 | % | 100.0 | % | 100.0 | % |
Metropolitan Area Subtotal / Weighted Average | 149 | 100.0 | % | 100.0 | % | 100.0 | % | ||||
Washington, D.C. | |||||||||||
1201 Eye Street | Washington | DC | 49.5% (2) | 2001 | 269 | 82.2 | % | 65.4 | % | 65.4 | % |
1225 Eye Street | Washington | DC | 49.5% (2) | 1986 | 225 | 88.9 | % | 72.0 | % | 70.7 | % |
400 Virginia Avenue | Washington | DC | 100.0% | 1985 | 224 | 83.5 | % | 80.8 | % | 80.8 | % |
4250 North Fairfax Drive | Arlington | VA | 100.0% | 1998 | 306 | 46.7 | % | 44.1 | % | 32.7 | % |
9211 Corporate Boulevard | Rockville | MD | 100.0% | 1989 | 116 | 27.6 | % | 27.6 | % | — | % |
9221 Corporate Boulevard | Rockville | MD | 100.0% | 1989 | 115 | 100.0 | % | 100.0 | % | 100.0 | % |
One Independence Square | Washington | DC | 100.0% | 1991 | 334 | 25.4 | % | — | % | — | % |
9200 Corporate Boulevard | Rockville | MD | 100.0% | 1982 | 109 | — | % | — | % | — | % |
Two Independence Square | Washington | DC | 100.0% | 1991 | 606 | 100.0 | % | 100.0 | % | 100.0 | % |
Piedmont Pointe I | Bethesda | MD | 100.0% | 2007 | 186 | 68.8 | % | 68.8 | % | 68.8 | % |
Piedmont Pointe II | Bethesda | MD | 100.0% | 2008 | 223 | 60.5 | % | 60.5 | % | 55.6 | % |
Arlington Gateway | Arlington | VA | 100.0% | 2005 | 326 | 96.0 | % | 94.2 | % | 94.2 | % |
Metropolitan Area Subtotal / Weighted Average | 3,039 | 71.2 | % | 65.1 | % | 62.4 | % | ||||
Grand Total | 20,697 | 90.6 | % | 87.4 | % | 83.0 | % | ||||
(1) | Economic leased percentage excludes the square footage associated with executed but not commenced leases for currently vacant spaces and the square footage associated with tenants receiving rental abatements (after proportional adjustments for tenants receiving only partial rental abatements). |
(2) | Although Piedmont owns 49.5% of the asset, it is entitled to 100% of the cash flows under the terms of the property ownership entity's joint venture agreement. |
47
Piedmont Office Realty Trust, Inc.
Company Metrics After Aon Center Sale
As of September 30, 2015
($ and square footage in thousands)
The below information on pages 48 and 49 presents certain financial information about the Company as of September 30, 2015 on an actual basis and a pro forma basis giving effect to the completion of the sale of Aon Center in Chicago, IL for $646 million in net proceeds and the use of the net proceeds from that sale to: (1) purchase SunTrust Center in Orlando, FL and Galleria 300 in Atlanta, GA for an aggregate approximately $219 million (exclusive of approximately $17 million in previously deposited earnest money and $20 million in 1031 exchange escrow funds, both of which were outstanding as of September 30, 2015, along with approximately $3 million in seller credits), and (2) repay the outstanding indebtedness under the Company’s revolving line of credit. The information below has been presented to show the impact of these transactions on certain of the Company’s statistical measures; however, the information below is not intended to present the Company’s operating results on a pro forma basis giving effect to the actions listed above and does not contain all of the information required in connection with pro forma financial statements prepared pursuant to Article 11 of Regulation S-X.
Additional information on the disposition and acquisition transactions can be found in the Subsequent Events section of Financial Highlights and on page 37.
As of September 30, 2015 | ||||||||
As of September 30, 2015 | with Pro Forma Adjustments for the Sale of Aon Center and the Acquisition of SunTrust Center & Galleria 300 | |||||||
Debt Metrics | ||||||||
Total debt / Total gross assets | 40.8 | % | approximately 37% | |||||
Average net debt to Core EBITDA (1) (2) | 7.3 x | mid 6x's (estimated) | ||||||
Fixed charge coverage ratio (3) | 4.0 x | approximately 4x | ||||||
Principal amount of debt - fixed rate | $1,850,247 | 76.0 | % | $1,850,247 | 91.6 | % | ||
Principal amount of debt - floating rate | $583,000 | 24.0 | % | $170,000 | 8.4 | % | ||
Principal amount of debt - unsecured | $1,933,000 | 79.4 | % | $1,520,000 | 75.2 | % | ||
Principal amount of debt - secured | $500,247 | 20.6 | % | $500,247 | 24.8 | % | ||
General Statistical Metrics | ||||||||
Number of consolidated office properties | 68 | 69 | ||||||
Rentable square footage | 20,697 | 19,047 | ||||||
Percent leased | 90.6 | % | 91.0 | % | ||||
Percent leased - commenced | 87.4 | % | 88.6 | % | ||||
Percent leased - economic | 83.0 | % | 84.3 | % | ||||
Non-incremental tenant improvement commitments | $52,328 | $35,547 | ||||||
Weighted average lease term remaining | 7.1 | 6.6 | ||||||
(1) | Average net debt as of September 30, 2015 on a pro forma basis is calculated as the Company’s average net debt for the quarter ended September 30, 2015 (i) adjusted for $110 million of stock repurchases occurring during the third quarter of 2015 which were intended to be funded through the expected net proceeds from the sale of Aon Center (rather than through the incurrence of additional long-term indebtedness), and (ii) reduced further for the repayment of the remaining balance under the Company’s revolving line of credit. |
(2) | Core EBITDA as of September 30, 2015 on a pro forma basis is calculated as Core EBITDA for the quarter ended September 30, 2015, adjusted to (i) remove contributions from properties sold during the third quarter of 2015, including Eastpoint I & II, 3750 Brookside Parkway and Chandler Forum, (ii) remove the contribution from Aon Center, and (iii) add estimated contributions from SunTrust Center and Galleria 300. The resultant figure is then annualized for the purposes of this calculation. |
(3) | Fixed charges as of September 30, 2015 on a pro forma basis are calculated as the Company’s fixed charges for the quarter ended September 30, 2015, adjusted to remove interest expense associated with the Company's unsecured line of credit. |
48
Piedmont Office Realty Trust, Inc.
Company Metrics After Aon Center Sale
As of September 30, 2015
($ and square footage in thousands)
Lease Expiration Schedule Geographic Diversification
As Reported | Pro Forma for Sale of Aon Center and Acquisition of SunTrust Center & Galleria 300 (1) | ||||
Expiration Year | Annualized Lease Revenue | Percentage of Annualized Lease Revenue (%) | Annualized Lease Revenue | Percentage of Annualized Lease Revenue (%) | |
Vacant | $— | — | $— | — | |
2015 | 3,055 | 0.5 | 2,366 | 0.4 | |
2016 | 36,039 | 5.9 | 35,664 | 6.5 | |
2017 | 51,371 | 8.5 | 49,710 | 9.0 | |
2018 | 51,465 | 8.5 | 45,269 | 8.2 | |
2019 | 66,129 | 10.9 | 72,469 | 13.2 | |
2020 | 55,163 | 9.1 | 56,329 | 10.3 | |
2021 | 39,695 | 6.5 | 39,894 | 7.3 | |
2022 | 37,479 | 6.2 | 36,133 | 6.6 | |
2023 | 34,792 | 5.7 | 30,720 | 5.6 | |
2024 | 46,930 | 7.7 | 39,843 | 7.2 | |
2025 | 23,996 | 3.9 | 22,917 | 4.2 | |
2026 | 20,275 | 3.3 | 20,040 | 3.6 | |
2027 | 33,742 | 5.6 | 23,908 | 4.3 | |
Thereafter | 107,484 | 17.7 | 74,724 | 13.6 | |
Total | $607,615 | 100.0 | $549,986 | 100.0 | |
As Reported | Pro Forma for Sale of Aon Center and Acquisition of SunTrust Center & Galleria 300 (1) | ||||||
Location | Annualized Lease Revenue | Percentage of Annualized Lease Revenue (%) | Percent Leased (%) | Annualized Lease Revenue | Percentage of Annualized Lease Revenue (%) | Percent Leased (%) | |
Chicago | $148,546 | 24.4 | 87.9 | $62,285 | 11.3 | 88.7 | |
Washington, D.C. | 101,642 | 16.7 | 71.2 | 101,642 | 18.5 | 71.2 | |
New York | 79,474 | 13.1 | 98.1 | 79,474 | 14.5 | 98.1 | |
Minneapolis | 45,958 | 7.6 | 90.2 | 45,958 | 8.4 | 90.2 | |
Dallas | 45,552 | 7.5 | 97.6 | 45,552 | 8.3 | 97.6 | |
Boston | 45,265 | 7.5 | 99.3 | 45,265 | 8.2 | 99.3 | |
Atlanta | 32,348 | 5.3 | 92.9 | 41,282 | 7.5 | 92.0 | |
Los Angeles | 31,106 | 5.1 | 99.8 | 31,106 | 5.7 | 99.8 | |
Philadelphia | 18,016 | 3.0 | 100.0 | 18,016 | 3.3 | 100.0 | |
Detroit | 17,007 | 2.8 | 88.6 | 17,007 | 3.1 | 88.6 | |
Houston | 11,231 | 1.8 | 100.0 | 11,231 | 2.0 | 100.0 | |
Central & South Florida | 10,715 | 1.8 | 91.8 | 30,413 | 5.5 | 90.2 | |
Nashville | 10,547 | 1.7 | 100.0 | 10,547 | 1.9 | 100.0 | |
Austin | 6,659 | 1.1 | 100.0 | 6,659 | 1.2 | 100.0 | |
Phoenix | 3,549 | 0.6 | 100.0 | 3,549 | 0.6 | 100.0 | |
Total | $607,615 | 100.0 | 90.6 | $549,986 | 100.0 | 91.0 | |
(1) | Pro forma Annualized Lease Revenue is calculated by starting with the Company's Annualized Lease Revenue as of September 30, 2015, and deducting therefrom the contribution provided by Aon Center and adding thereto the expected contributions from SunTrust Center and Galleria 300. |
49
Piedmont Office Realty Trust, Inc.
Supplemental Operating & Financial Data
Risks, Uncertainties and Limitations
Certain statements contained in this supplemental package constitute forward-looking statements within the meaning of Section 27A of the Securities Act of 1933, as amended (the “Securities Act”) and Section 21E of the Securities Exchange Act of 1934, as amended (the “Exchange Act”). We intend for all such forward-looking statements to be covered by the safe-harbor provisions for forward-looking statements contained in Section 27A of the Securities Act and Section 21E of the Exchange Act, as applicable. Such information is subject to certain risks and uncertainties, as well as known and unknown risks, which could cause actual results to differ materially from those projected or anticipated. Therefore, such statements are not intended to be a guarantee of our performance in future periods. Such forward-looking statements can generally be identified by our use of forward-looking terminology such as “may,” “will,” “expect,” “intend,” “anticipate,” “believe,” “continue” or similar words or phrases that are predictions of future events or trends and which do not relate solely to historical matters. Examples of such statements in this supplemental package include our estimated Core FFO and Core FFO per diluted share for calendar year 2015 and our anticipated use of net sales proceeds of Aon Center.
The following are some of the factors that could cause our actual results and expectations to differ materially from those described in our forward-looking statements: market and economic conditions remain challenging in some markets we operate in and the demand for office space, rental rates and property values may continue to lag the general economic recovery causing our business, results of operations, cash flows, financial condition and access to capital to be adversely affected or otherwise impact performance, including the potential recognition of impairment charges; the success of our real estate strategies and investment objectives, including our ability to identify and consummate suitable acquisitions and divestitures; lease terminations or lease defaults, particularly by one of our large lead tenants; the impact of competition on our efforts to renew existing leases or re-let space on terms similar to existing leases; changes in the economies and other conditions of the office market in general and of the specific markets in which we operate, particularly in Chicago, Washington, D.C., and the New York metropolitan area; economic and regulatory changes, including accounting standards, that impact the real estate market generally; additional risks and costs associated with directly managing properties occupied by government tenants; adverse market and economic conditions may continue to adversely affect us and could cause us to recognize impairment charges or otherwise impact our performance; availability of financing and our lending banks' ability to honor existing line of credit commitments; costs of complying with governmental laws and regulations; uncertainties associated with environmental and other regulatory matters; potential changes in political environment and reduction in federal and/or state funding of our governmental tenants; we may be subject to litigation, which could have a material adverse effect on our financial condition; our ability to continue to qualify as a real estate investment trust under the Internal Revenue Code; and other factors detailed in our most recent Annual Report on Form 10-K and other documents we file with the Securities and Exchange Commission.
Readers are cautioned not to place undue reliance on these forward-looking statements, which speak only as of the date of this supplemental report. We cannot guarantee the accuracy of any such forward-looking statements contained in this supplemental report, and we do not intend to publicly update or revise any forward-looking statements, whether as a result of new information, future events, or otherwise.
50