Attached files
| file | filename |
|---|---|
| EX-23.1 - CONSENT OF ERNST & YOUNG LLP, INDEPENDENT REGISTERED PUBLIC ACCOUNTING FIRM. - INSTRUCTURE INC | d932934dex231.htm |
Table of Contents
Index to Financial Statements
As filed with the U.S. Securities and Exchange Commission on November 9, 2015
Registration No. 333-207349
UNITED STATES
SECURITIES AND EXCHANGE COMMISSION
Washington, D.C. 20549
Amendment No. 4
to
FORM S-1
REGISTRATION STATEMENT
UNDER
THE SECURITIES ACT OF 1933
INSTRUCTURE, INC.
(Exact Name of Registrant as Specified in Its Charter)
| Delaware | 7372 | 26-3505687 | ||
| (State or other Jurisdiction of Incorporation or Organization) |
(Primary Standard Industrial Classification Code Number) |
(I.R.S. Employer Identification Number) |
6330 South 3000 East, Suite 700
Salt Lake City, UT 84121
(800) 203-6755
(Address, Including Zip Code, and Telephone Number, Including Area Code, of Registrant’s Principal Executive Offices)
Joshua L. Coates
Chief Executive Officer
6330 South 3000 East, Suite 700
Salt Lake City, UT 84121
(800) 203-6755
(Name, Address, Including Zip Code, and Telephone Number, Including Area Code, of Agent for Service)
Copies to:
| John T. McKenna Alan Hambelton Cooley LLP 3175 Hanover Street Palo Alto, CA 94304 (650) 843-5000 |
Matthew A. Kaminer Senior Vice President, General Counsel and Secretary Instructure, Inc. 6330 South 3000 East, Suite 700 Salt Lake City, UT 84121 (800) 203-6755 |
Tony Jeffries Michael Nordtvedt Wilson Sonsini Goodrich & Rosati, Professional Corporation 650 Page Mill Road Palo Alto, CA 94304 (650) 493-9300 |
Approximate date of commencement of proposed sale to the public: As soon as practicable after the effective date of this registration statement.
If any of the securities being registered on this Form are to be offered on a delayed or continuous basis pursuant to Rule 415 under the Securities Act of 1933 check the following box. ¨
If this Form is filed to register additional securities for an offering pursuant to Rule 462(b) under the Securities Act, check the following box and list the Securities Act registration statement number of the earlier effective registration statement for the same offering. ¨
If this Form is a post-effective amendment filed pursuant to Rule 462(c) under the Securities Act, check the following box and list the Securities Act registration statement number of the earlier effective registration statement for the same offering. ¨
If this Form is a post-effective amendment filed pursuant to Rule 462(d) under the Securities Act, check the following box and list the Securities Act registration statement number of the earlier effective registration statement for the same offering. ¨
Indicate by check mark whether the registrant is a large accelerated filer, an accelerated filer, a non-accelerated filer, or a smaller reporting company. See the definitions of “large accelerated filer,” “accelerated filer” and “smaller reporting company” in Rule 12b-2 of the Exchange Act.
| Large accelerated filer ¨ | Accelerated filer ¨ | Non-accelerated filer þ | Smaller reporting company ¨ | |||
| (Do not check if a smaller reporting company) | ||||||
The Registrant hereby amends this registration statement on such date or dates as may be necessary to delay its effective date until the Registrant shall file a further amendment that specifically states that this registration statement shall thereafter become effective in accordance with Section 8(a) of the Securities Act of 1933 or until the registration statement shall become effective on such date as the Securities and Exchange Commission, acting pursuant to said Section 8(a), may determine.
Table of Contents
Index to Financial Statements
The information in this prospectus is not complete and may be changed. We may not sell these securities until the registration statement filed with the Securities and Exchange Commission is effective. This prospectus is not an offer to sell these securities and we are not soliciting offers to buy these securities in any jurisdiction where the offer or sale is not permitted.
PROSPECTUS (Subject to Completion)
Issued November 9, 2015
4,400,000 Shares

COMMON STOCK
Instructure, Inc. is offering 4,400,000 shares of its common stock. This is our initial public offering and no public market currently exists for our shares. We anticipate that the initial public offering price of our common stock will be between $16.00 and $18.00 per share.
Our common stock has been approved for listing on the New York Stock Exchange under the symbol “INST.”
We are an “emerging growth company” as defined under the federal securities laws. Investing in our common stock involves risks. See “Risk Factors” beginning on page 11.
PRICE $ A SHARE
| Price to |
Underwriting |
Proceeds to |
||||||||||
| Per Share |
$ | $ | $ | |||||||||
| Total |
$ | $ | $ | |||||||||
| (1) | See “Underwriters” for a description of the compensation payable to the underwriters. |
Entities affiliated with Insight Venture Partners, an existing stockholder, have indicated an interest in purchasing up to an aggregate of $15 million of shares of our common stock in this offering at the initial public offering price. In addition, certain of our directors, executive officers and key employees have indicated an interest in purchasing up to an aggregate of approximately $3.3 million of shares of our common stock in this offering at the initial public offering price. Because these indications of interest are not binding agreements or commitments to purchase, these parties may elect not to purchase shares in this offering or the underwriters may elect not to sell any shares in this offering to such parties. The underwriters will receive the same discount from any shares of our common stock purchased by these parties as they will from any other shares of our common stock sold to the public in this offering.
We have granted the underwriters the right to purchase up to an additional 660,000 shares of common stock to cover over-allotments.
The Securities and Exchange Commission and state securities regulators have not approved or disapproved of these securities, or determined if this prospectus is truthful or complete. Any representation to the contrary is a criminal offense.
The underwriters expect to deliver the shares of common stock to purchasers on , 2015.
| MORGAN STANLEY | GOLDMAN, SACHS & CO. | |||
| JEFFERIES | ||||
| NEEDHAM & COMPANY | OPPENHEIMER & CO. | RAYMOND JAMES | ||
, 2015
Table of Contents
Index to Financial Statements

INSTRUCTURE
Software that makes people smarter
Focused on
Higher Education, K12, and Corporate learning
700+ employees worldwide
Over 1,600 institutions, districts and companies
More than 10 million users1
1 Measured over the 12 months ended September 30, 2015.
Table of Contents
Index to Financial Statements

INSTRUCTURE
OUR PRODUCT
56 92 find import share
INSIDE INSTRUCTURE
INNOVATIVE TECHNOLOGY
POWERFUL MISSION
OPENNESS
OUR CUSTOMER CONFERENCE
OUR OFFICE
COMPANY CULTURE
Table of Contents
Index to Financial Statements
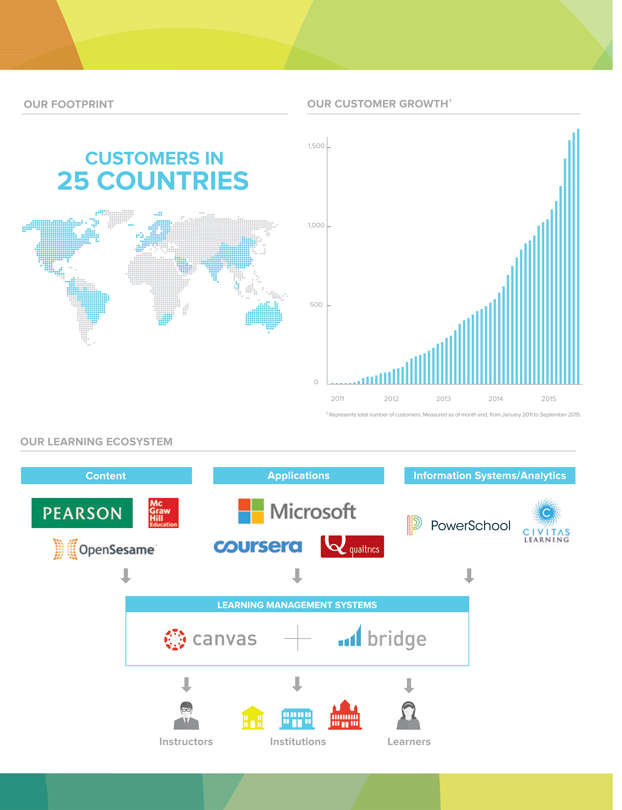
OUR FOOTPRINT
OUR CUSTOMER GROWTH1
CUSTOMERS IN 25 COUNTRIES
1,500 1,000 500 0
2011 2012 2013 2014 2015
1 Represents total number of customers. Measured as of month end,
from January 2011 to September 2015.
OUR LEARNING ECOSYSTEM
Content
PEARSON
Mc Graw Hill Education
OpenSesame
Applications
Microsoft coursera Q qualtrics
Information Systems/Analytics
PowerSchool
CIVITAS LEARNING
LEARNING MANAGEMENT SYSTEMS
Canvas bridge
Instructors Institutions Learners
Table of Contents
Index to Financial Statements
We are responsible for the information contained in this prospectus and in any free writing prospectus we prepare and authorize. Neither we nor any of the underwriters have authorized anyone to provide you with different information, and we take no responsibility for any other information others may give you. Neither we nor the underwriters are making an offer to sell these securities in any jurisdictions where the offer and sale is not permitted. You should not assume that the information contained in this prospectus is accurate as of any date other than the date on the cover of this prospectus. Our business, financial condition, results of operations and future growth prospects may have changed since that date.
Persons who come into possession of this prospectus and any applicable free writing prospectus in jurisdictions outside the United States are required to inform themselves about and to observe any restrictions as to this offering and the distribution of this prospectus and any such free writing prospectus applicable to that jurisdiction.
Until , 2015 (the 25th day after the date of this prospectus), all dealers that buy, sell or trade shares of our common stock, whether or not participating in this offering, may be required to deliver a prospectus. This is in addition to a dealer’s obligation to deliver a prospectus when acting as an underwriter and with respect to their unsold allotments or subscriptions.
Table of Contents
Index to Financial Statements
This summary highlights information contained in other parts of this prospectus. Because it is only a summary, it does not contain all of the information that you should consider before investing in shares of our common stock and it is qualified in its entirety by, and should be read in conjunction with, the more detailed information appearing elsewhere in this prospectus. You should read the entire prospectus carefully, especially “Risk Factors” and “Management’s Discussion and Analysis of Financial Condition and Results of Operations” and our consolidated financial statements and the related notes, before deciding to buy shares of our common stock. Unless the context requires otherwise, references in this prospectus to “Instructure,” the “company,” “we,” “us” and “our” refer to Instructure, Inc. and its wholly-owned subsidiaries.
INSTRUCTURE, INC.
Mission and Vision
Instructure’s mission is to make software that makes people smarter. Our vision is to help organizations everywhere leverage technology to maximize the potential of their people.
Overview
We provide an innovative, cloud-based learning management platform for academic institutions and companies worldwide. We built our learning management applications, Canvas, for the education market, and Bridge, for the corporate market, to enable our customers to easily develop, deliver and manage engaging face-to-face and online learning experiences. Our platform combines powerful, elegant and easy-to-use functionality with the reliability, security, scalability and support required by our customers.
In today’s dynamic, knowledge-driven economy, quality education and constant learning are critical to compete and succeed. Academic institutions recognize that for students to reach their maximum potential, they require a learning environment that is interactive and accessible. Similarly, companies need to deliver seamless and easy learning experiences to better attract, develop and retain talent and compete more effectively.
We develop software that millions of students, teachers and employees use to help achieve their education and learning goals. Our applications enhance academic and corporate learning by providing an engaging, easy-to-use platform for instructors and learners, enabling frequent and open interactions, streamlining workflow, and allowing the creation and sharing of content with anytime, anywhere access to information. Our open standards allow for integration with third-party publishers and software providers to deliver additional learning content and applications. Our platform also provides data analytics capabilities enabling real-time reaction to information and benchmarking in order to personalize curricula and increase the efficacy of the learning process.
We offer our platform through a Software-as-a-Service, or SaaS, business model. Customers can rapidly deploy our applications with minimal upfront implementation. Customers also benefit from automatic software updates with virtually no downtime.
We launched Canvas in February 2011 and have experienced rapid customer adoption in the education market. In addition, more than 100 corporate customers have implemented Canvas in order to deliver a more effective, simple way for their employees to learn. To better meet the needs of the corporate market, we leveraged our platform to develop Bridge, which launched in February 2015. As of September 30, 2015, we had more than 1,600 customers, representing colleges, universities, K-12 school districts, and companies in more than 25 countries.
1
Table of Contents
Index to Financial Statements
For 2012, 2013 and 2014, revenue was $8.8 million, $26.1 million and $44.4 million, respectively, representing year-over-year growth of 197% and 70%. We have experienced net revenue retention rates of over 100% at each of December 31, 2012, 2013 and 2014. For 2012, 2013 and 2014, our net losses were $18.5 million, $22.5 million and $41.4 million, respectively, as we focused on growing our business. For the nine months ended September 30, 2015, revenue was $51.4 million and we incurred a net loss of $40.9 million.
Industry Background
The Markets for Learning are Large, Growing and Highly Strategic
The market for academic and corporate learning management software is estimated to be $4.1 billion in 2015, and projected to grow to $7.8 billion in 2018, according to MarketsandMarkets. We attribute the rapid growth of this market, in part, to the migration of instructor-led training to online learning, which we believe will increase the adoption of learning management systems.
Corporate learning management software is part of the broader human capital management market, which also includes the recruiting, workforce management, performance management and compensation management software markets. IDC estimates that these additional markets will be $5.1 billion in 2015, and projected to grow to $6.4 billion in 2018. We believe these additional markets may present opportunities for us to develop additional applications on our platform over time.
Consumerization of Technology is Changing How People Interact, Learn, Train and Work
Recent innovations in consumer-oriented technology are changing how people expect to interact, learn, train and work. In particular, the ubiquity of social media and highly intuitive consumer and mobile applications have led instructors, students and employees to expect the same rich functionality, availability and usability from a learning platform.
Strong User Engagement Leads to Robust Data Analytics
A learning management system has the potential to provide significant insight to educators and administrators on their students’ and employees’ progress toward meeting learning objectives and the factors impacting performance. High utilization enables the learning management system to capture more data and leads to more insightful analyses on user behavior, quality of individual courses and effectiveness of digital content. Better analytics enables instructors and administrators to make more informed decisions about instruction and materials that in turn drive improved learning outcomes and performance for individuals and companies.
Legacy Learning Management Systems Do Not Meet the Needs of Today’s Instructors, Students and Employees
Many traditional learning management systems are based on legacy technology architectures that do not meet the expectations of today’s users. We believe legacy learning management systems face the following key challenges:
| • | Poor User Experience. Learning management systems were first introduced over a decade ago. These systems often lack the features and interfaces to deliver a personalized, collaborative, engaging, mobile and always-on experience that users expect today. |
| • | Not Mobile. Legacy learning management systems were not built for mobility and efforts to retrofit for use with mobile devices have often resulted in a poor user experience. |
| • | Unreliable with Poor Uptime. Legacy learning management systems were not designed for cloud-based deployment. Traditional on-premise systems require downtime for maintenance, upgrades and unforeseen bug fixes, which can adversely impact instructors and students during critical times. |
2
Table of Contents
Index to Financial Statements
| • | Low Utilization. Legacy learning management systems have historically been plagued by user dissatisfaction resulting in low utilization rates. Lack of utilization adversely affects the investments these institutions have made in their learning management systems. 48% of users are looking to leave their current learning management system and move to a new provider, according to the Brandon Hall Group. |
| • | Expensive. Legacy learning management systems require substantial upfront and ongoing investments in IT infrastructure to implement and maintain an on-premise solution. Organizations often choose not to deploy software or to delay upgrades to newer versions due to concerns regarding costs, lengthy implementation and customization cycles, and potential business disruptions. |
| • | Limited Reach and Complexity of Data Analytics. While legacy learning management systems have historically enabled the capture of data, access has been generally limited to administrators and teachers and not to students. Further, analytics tools currently offered in existing on-premise solutions can be limited in capabilities making it difficult to translate the data into useful actionable information. |
| • | Closed Ecosystem. Legacy learning management solutions are often closed systems, which can limit the number of third-party integrations into a platform. Customers are forced to spend time and often money to obtain separate integration contracts with third-party publishers and software providers. |
Our Platform
We designed our platform to enable users to teach, learn and collaborate anytime, anywhere, across a wide variety of application environments, operating systems, devices and locations. We believe our platform offers the following key benefits:
| • | Intuitive User Experience. We provide elegant and intuitive user interfaces that leverage familiar, consumer web navigation techniques, such as drag and drop, to make it easy to use our platform. We designed our system from the ground up, with modern, web-based design features, to create a differentiated user experience. We enable seamless collaboration among instructors and learners to share feedback and encourage online discussion forums. |
| • | Optimized for Mobile. Our mobile-optimized platform allows users to access their applications anytime and anywhere. We offer a “mobile first” responsive design to ensure an optimal experience on most devices and, for Canvas, we also have iOS and Android native mobile applications available for free download on both phones and tablets. |
| • | High Availability and Uptime. Our software is mission-critical for our users and customers and we focus on maintaining enterprise-grade reliability at all times. Our standard contracts provide for guaranteed 99.9% annual uptime. We achieved 99.9% uptime during 2014 while our customer base grew over 75%. |
| • | High Utilization. Over ten million instructors, students and employees have used our software over the 12 months ended September 30, 2015. According to self-reported data in an ECAR 2014 survey, 58% of faculty in higher education use a learning management system to share content with students, while our internal analysis of higher education institutions using Canvas shows that 71% of faculty use Canvas to share content with students. |
| • | Native Cloud-based Software. Our cloud-based delivery model enables customers to rapidly deploy our applications to experience immediate benefit. Software updates are implemented regularly and transparently. Our single-instance, multi-tenant architecture is designed to scale to support our rapid growth. |
3
Table of Contents
Index to Financial Statements
| • | Open Access to Data Analytics. Our platform provides users with open API access to data analytics. We deliver the analytics in an easy to understand and consumable way, that is optimized for independent analysis. This open visibility allows learners to view their own progress in real-time, educators to adjust programs and personalize curricula for maximum effectiveness and organizations to benchmark user data internally and respond to patterns observed. |
| • | Open Platform. We are committed to collaboration and openness. Our open standards allow organizations to easily deliver additional learning content and applications from third-party publishers and software providers through our EduAppCenter.com’s growing catalog of approximately 200 integrations or through open APIs. |
Our Growth Strategy
We are pursuing the following strategies to grow our business:
| • | Grow our U.S. Customer Base. We believe there is opportunity to substantially expand our base of U.S. academic and corporate customers. K-12 academic institutions have yet to widely adopt learning management systems, while most higher education institutions have adopted legacy systems with which they are often unsatisfied. In the corporate market, there are both greenfield opportunities and opportunities to displace legacy solutions that do not meet customer needs. |
| • | Further Maximize our Existing Customer Base. The majority of our academic customers implement Canvas widely within their institutions and across school districts. We plan to increase revenue from this customer base by selling additional applications and services. We plan to further penetrate our existing corporate customer base by growing the number of users on our platform and expanding enterprise wide. We believe our user-based pricing model and innovative applications provide us with a substantial opportunity to increase the value of our existing customer base. |
| • | Continue to Expand Internationally. We intend to expand our direct and indirect sales force to further penetrate international markets. We opened our international headquarters in London in June 2014, and for the nine months ended September 30, 2015, international customers accounted for 6% of our revenue. |
| • | Continue to Innovate and Offer New Applications. We will continue to make significant investments to further enhance the functionality of our existing applications, expand the number of applications on our extensible learning platform and develop into adjacent markets that will benefit our customers. |
Risks Associated with Our Business
Our business is subject to numerous risks and uncertainties including those highlighted in the section titled “Risk Factors” immediately following this prospectus summary. These risks include, among others, the following:
| • | We have a history of losses and anticipate that we will continue to incur losses for the foreseeable future and may not achieve or maintain profitability in the future. |
| • | We have a limited operating history, which makes it difficult to evaluate our prospects and future operating results. |
| • | We depend on new customer acquisition and expansion and customer renewals and given our limited operating history, we do not have a long history on which to base forecasts of customer renewal rates or future operating results. |
| • | If our efforts to further increase the use and adoption of Canvas do not succeed, or if Bridge does not gain widespread market acceptance, our revenue will be harmed. |
| • | We may experience quarterly fluctuations in our operating results due to a number of factors, which makes our future results difficult to predict and could cause our operating results to fall below expectations or our guidance. |
4
Table of Contents
Index to Financial Statements
| • | If we fail to manage our growth effectively or our business does not grow as we expect, our operating results may suffer. |
| • | We face significant competition from both established and new companies offering learning management systems. |
| • | The success of our business depends in part on our ability to protect and enforce our intellectual property rights. |
| • | Our executive officers, directors and holders of more than 5% of our outstanding common stock will beneficially own approximately 73.3% of our common stock upon the closing of this offering and will continue to have substantial control over us. |
If we are unable to adequately address these and other risks we face, our business, financial condition, operating results and prospects may be adversely affected.
Emerging Growth Company Status
We are an “emerging growth company” as defined in the Jumpstart Our Business Startups Act, or the JOBS Act, enacted in April 2012, and therefore we intend to take advantage of certain exemptions from various public company reporting requirements, including not being required to have our internal control over financial reporting audited by our independent registered public accounting firm pursuant to Section 404(b) of the Sarbanes-Oxley Act of 2002, reduced disclosure obligations regarding executive compensation in our periodic reports and proxy statements, and exemptions from the requirements of holding a nonbinding advisory vote on executive compensation and any golden parachute payments not previously approved. We may take advantage of these exemptions for up to five years or until we are no longer an “emerging growth company,” whichever is earlier.
Corporate Information
We were incorporated in Delaware in September 2008. Our principal executive offices are located at 6330 South 3000 East, Suite 700, Salt Lake City, UT 84121 and our telephone number is (800) 203-6755. Our corporate website address is www.instructure.com. Information contained on or accessible through our website is not a part of this prospectus, and the inclusion of our website address in this prospectus is an inactive textual reference only.
Instructure, Canvas, the Instructure logo, Canvas logo and Bridge logo are trademarks of Instructure, Inc. We do not intend our use or display of other companies’ trade names or trademarks to imply a relationship with, or endorsement or sponsorship of us by, any other companies.
5
Table of Contents
Index to Financial Statements
THE OFFERING
| Common stock offered |
4,400,000 shares | |
| Common stock to be outstanding after this offering |
26,388,514 shares | |
| Over-allotment option |
660,000 shares | |
| Use of proceeds |
We estimate that the net proceeds from this offering will be approximately $66.4 million (or approximately $76.8 million if the underwriters exercise their over-allotment option in full), based on an assumed initial public offering price of $17.00 per share, the midpoint of the price range set forth on the cover page of this prospectus, after deducting underwriting discounts and commissions and estimated offering expenses payable by us.
We intend to use the net proceeds to us from this offering primarily for general corporate purposes, including working capital, sales and marketing activities, research and development activities, general and administrative matters and capital expenditures. We may also use a portion of the net proceeds from this offering for acquisitions of, or investments in, technologies, solutions or businesses that complement our business, although we have no present commitments or agreements to enter into any such acquisitions or investments. See “Use of Proceeds” for additional information. | |
| New York Stock Exchange symbol |
“INST” | |
Entities affiliated with Insight Venture Partners, an existing stockholder, have indicated an interest in purchasing up to an aggregate of $15 million of shares of our common stock in this offering at the initial public offering price. In addition, certain of our directors, executive officers and key employees have indicated an interest in purchasing up to an aggregate of approximately $3.3 million of shares of our common stock in this offering at the initial public offering price. Because these indications of interest are not binding agreements or commitments to purchase, these parties may elect not to purchase shares in this offering or the underwriters may elect not to sell any shares in this offering to such parties. The underwriters will receive the same discount from any shares of our common stock purchased by these parties as they will from any other shares of our common stock sold to the public in this offering.
The number of shares of common stock to be outstanding after this offering is based on 21,988,514 shares of common stock outstanding as of September 30, 2015, and excludes:
| • | 3,909,871 shares of common stock issuable upon the exercise of outstanding stock options as of September 30, 2015, with a weighted-average exercise price of $5.95 per share; |
| • | 103,332 shares of common stock issuable upon the exercise of outstanding warrants as of September 30, 2015, with a weighted-average exercise price of $2.11 per share; |
| • | 373,985 shares of common stock reserved for future issuance under our 2010 Equity Incentive Plan as of September 30, 2015, of which stock options to purchase an aggregate of 313,661 shares of common stock were granted subsequent to September 30, 2015, with an exercise price of $14.25 per share; all |
6
Table of Contents
Index to Financial Statements
| shares reserved for future issuance and not subject to an outstanding stock option will cease to be available for issuance at the time our 2015 Equity Incentive Plan becomes effective in connection with this offering; |
| • | 2,000,000 shares of common stock reserved for future issuance under our 2015 Equity Incentive Plan, as well as any automatic increases in the number of shares of common stock reserved for future issuance under this plan, which will become effective upon the execution of the underwriting agreement for this offering; and |
| • | 333,333 shares of common stock reserved for future issuance under our 2015 Employee Stock Purchase Plan, as well as any automatic increases in the number of shares of common stock reserved for future issuance under this plan, which will become effective upon the execution of the underwriting agreement for this offering. |
In addition, unless we specifically state otherwise, all information in this prospectus assumes:
| • | a 1-for-1.5 reverse stock split of our common stock and preferred stock effected on October 30, 2015; |
| • | the filing of our amended and restated certificate of incorporation and the adoption of our amended and restated bylaws in connection with the closing of this offering; |
| • | the conversion of all outstanding shares of our preferred stock into an aggregate of 15,505,330 shares of common stock upon the closing of this offering (assuming a conversion ratio equal to approximately 1.2895 shares of common stock for each share of Series E preferred stock based on an assumed initial public offering price of $17.00 per share, the midpoint of the price range set forth on the cover page of this prospectus); |
| • | no exercise of outstanding stock options or warrants; and |
| • | no exercise by the underwriters of their option to purchase up to an additional 660,000 shares of common stock to cover over-allotments. |
The number of shares of our common stock to be issued upon the conversion of all outstanding shares of our Series E preferred stock depends in part on the initial public offering price of our common stock. The terms of our Series E preferred stock provide that the ratio at which each share of such series converts into shares of our common stock in connection with this offering will increase if the initial public offering price is below $21.921 per share, which would result in additional shares of our common stock being issued upon conversion of our Series E preferred stock upon the closing of this offering. Based upon an assumed initial public offering price of $17.00 per share, the midpoint of the price range set forth on the cover page of this prospectus, the outstanding shares of our Series E preferred stock will convert into an aggregate of 2,352,938 shares of our common stock upon the closing of this offering. For illustrative purposes only, the table below shows the number of shares of our common stock that would be issuable upon conversion of the Series E preferred stock at various initial public offering prices and the resulting total number of outstanding shares of our common stock as a result:
| Assumed Initial Public |
Approximate Series E Preferred Stock Conversion Ratio (#) |
Shares of Common Stock Issuable upon Conversion of Series E Preferred Stock (#) |
Total Shares of Common Stock Outstanding After this Offering (#) | |||
| $16.00 | 1.3701 |
2,499,997 |
26,535,573 | |||
| 16.50 | 1.3285 |
2,424,239 |
26,459,815 | |||
| 17.00 | 1.2895 |
2,352,938 |
26,388,514 | |||
| 17.50 | 1.2526 |
2,285,711 |
26,321,287 | |||
| 18.00 | 1.2178 |
2,222,219 |
26,257,795 |
7
Table of Contents
Index to Financial Statements
SUMMARY CONSOLIDATED FINANCIAL DATA
The following tables summarize our consolidated financial data. We have derived the summary consolidated statements of operations data for the years ended December 31, 2013 and 2014 from our audited consolidated financial statements included elsewhere in this prospectus. The consolidated statement of operations data for the year ended December 31, 2012 has been derived from our audited financial statements not included in this prospectus. The consolidated statements of operations data for the nine months ended September 30, 2014 and 2015 and the consolidated balance sheet data as of September 30, 2015 are derived from our unaudited interim consolidated financial statements included elsewhere in this prospectus. Our unaudited interim consolidated financial statements were prepared on a basis consistent with our audited consolidated financial statements and include, in our opinion, all adjustments, consisting only of normal recurring adjustments, that we consider necessary for a fair presentation of the financial information set forth in those statements included elsewhere in this prospectus. Our historical results are not necessarily indicative of the results that may be expected in the future.
You should read this data together with our consolidated financial statements and related notes appearing elsewhere in this prospectus and the sections titled “Selected Consolidated Financial Data” and “Management’s Discussion and Analysis of Financial Condition and Results of Operations.”
| Year Ended December 31, | Nine Months Ended September 30, |
|||||||||||||||||||
| 2012 | 2013 | 2014 | 2014 | 2015 | ||||||||||||||||
| (unaudited) | ||||||||||||||||||||
| (in thousands, except per share data) | ||||||||||||||||||||
| Consolidated Statements of Operations Data: |
||||||||||||||||||||
| Revenue: |
||||||||||||||||||||
| Subscription and support |
$ | 7,403 | $ | 22,456 | $ | 38,093 | $ | 26,328 | $ | 43,557 | ||||||||||
| Professional services and other |
1,371 | 3,599 | 6,259 | 4,288 | 7,839 | |||||||||||||||
|
|
|
|
|
|
|
|
|
|
|
|||||||||||
| Total revenue |
8,774 | 26,055 | 44,352 | 30,616 | 51,396 | |||||||||||||||
|
|
|
|
|
|
|
|
|
|
|
|||||||||||
| Cost of revenue: |
||||||||||||||||||||
| Subscription and support(1) |
4,346 | 8,581 | 12,131 | 8,331 | 12,520 | |||||||||||||||
| Professional services and other(1) |
2,748 | 2,039 | 2,982 | 1,979 | 4,717 | |||||||||||||||
|
|
|
|
|
|
|
|
|
|
|
|||||||||||
| Total cost of revenue(1) |
7,094 | 10,620 | 15,113 | 10,310 | 17,237 | |||||||||||||||
|
|
|
|
|
|
|
|
|
|
|
|||||||||||
| Gross profit |
1,680 | 15,435 | 29,239 | 20,306 | 34,159 | |||||||||||||||
|
|
|
|
|
|
|
|
|
|
|
|||||||||||
| Operating expenses: |
||||||||||||||||||||
| Sales and marketing(1) |
11,912 | 20,702 | 35,390 | 22,335 | 38,303 | |||||||||||||||
| Research and development(1) |
4,698 | 11,242 | 21,290 | 12,184 | 17,441 | |||||||||||||||
| General and administrative(1) |
3,411 | 5,321 | 11,268 | 6,890 | 18,475 | |||||||||||||||
|
|
|
|
|
|
|
|
|
|
|
|||||||||||
| Total operating expenses |
20,021 | 37,265 | 67,948 | 41,409 | 74,219 | |||||||||||||||
|
|
|
|
|
|
|
|
|
|
|
|||||||||||
| Loss from operations |
(18,341 | ) | (21,830 | ) | (38,709 | ) | (21,103 | ) | (40,060 | ) | ||||||||||
|
|
|
|
|
|
|
|
|
|
|
|||||||||||
| Other income (expense): |
||||||||||||||||||||
| Interest income |
8 | 22 | 32 | 30 | 13 | |||||||||||||||
| Interest expense |
(7 | ) | (150 | ) | (136 | ) | (96 | ) | (72 | ) | ||||||||||
| Change in fair value of warrant liability |
(199 | ) | (545 | ) | (2,518 | ) | (2,219 | ) | (536 | ) | ||||||||||
| Other income (expense), net |
3 | 4 | (39 | ) | 12 | (161 | ) | |||||||||||||
|
|
|
|
|
|
|
|
|
|
|
|||||||||||
| Total other expense, net |
(195 | ) | (669 | ) | (2,661 | ) | (2,273 | ) | (756 | ) | ||||||||||
|
|
|
|
|
|
|
|
|
|
|
|||||||||||
| Loss before income taxes |
(18,536 | ) | (22,499 | ) | (41,370 | ) | (23,376 | ) | (40,816 | ) | ||||||||||
| Income tax expense |
— | — | (57 | ) | (7 | ) | (40 | ) | ||||||||||||
|
|
|
|
|
|
|
|
|
|
|
|||||||||||
| Net loss |
$ | (18,536 | ) | $ | (22,499 | ) | $ | (41,427 | ) | $ | (23,383 | ) | $ | (40,856 | ) | |||||
|
|
|
|
|
|
|
|
|
|
|
|||||||||||
| Deemed dividends to investors |
$ | — | $ | (353 | ) | $ | — | $ | — | $ | (632 | ) | ||||||||
|
|
|
|
|
|
|
|
|
|
|
|||||||||||
| Net loss attributable to common stockholders |
$ | (18,536 | ) | $ | (22,852 | ) | $ | (41,427 | ) | $ | (23,383 | ) | $ | (41,488 | ) | |||||
|
|
|
|
|
|
|
|
|
|
|
|||||||||||
| Net loss per common share attributable to common stockholders, basic and diluted(2) |
$ | (5.36 | ) | $ | (6.26 | ) | $ | (7.50 | ) | $ | (4.37 | ) | $ | (6.61 | ) | |||||
|
|
|
|
|
|
|
|
|
|
|
|||||||||||
| Weighted average common shares used in computing basic and diluted net loss per common share attributable to common stockholders(2) |
3,456 | 3,650 | 5,525 | 5,356 | 6,279 | |||||||||||||||
|
|
|
|
|
|
|
|
|
|
|
|||||||||||
| Pro forma net loss per common share attributable to common stockholders, basic and diluted (unaudited)(2) |
$ | (2.01 | ) | $ | (1.90 | ) | ||||||||||||||
|
|
|
|
|
|||||||||||||||||
| Pro forma weighted average common shares used in computing basic and diluted net loss per common share attributable to common stockholders (unaudited)(2) |
20,657 | 21,784 | ||||||||||||||||||
|
|
|
|
|
|||||||||||||||||
8
Table of Contents
Index to Financial Statements
| (1) | Includes stock-based compensation as follows: |
| Year Ended December 31, |
Nine Months Ended September 30, |
|||||||||||||||||||
| 2012 | 2013 | 2014 | 2014 | 2015 | ||||||||||||||||
| (unaudited) | ||||||||||||||||||||
| (in thousands) | ||||||||||||||||||||
| Cost of revenue: |
||||||||||||||||||||
| Subscription and support |
$ | 7 | $ | 28 | $ | 258 | $ | 24 | $ | 106 | ||||||||||
| Professional services and other |
5 | 8 | 39 | 24 | 103 | |||||||||||||||
| Sales and marketing |
473 | 1,597 | 2,877 | 174 | 768 | |||||||||||||||
| Research and development |
442 | 1,585 | 3,971 | 307 | 871 | |||||||||||||||
| General and administrative |
910 | 374 | 1,053 | 327 | 5,851 | |||||||||||||||
|
|
|
|
|
|
|
|
|
|
|
|||||||||||
| Total stock-based compensation |
$ | 1,837 | $ | 3,592 | $ | 8,198 | $ | 856 | $ | 7,699 | ||||||||||
|
|
|
|
|
|
|
|
|
|
|
|||||||||||
| (2) | See Note 1 to our consolidated financial statements for an explanation of the method used to calculate basic and diluted and pro forma net loss per common share attributable to common stockholders. |
| As of September 30, 2015 | ||||||||||||
| Actual | Pro Forma(1) |
Pro Forma As Adjusted(2)(3) |
||||||||||
| (unaudited) | ||||||||||||
| (in thousands) | ||||||||||||
| Consolidated Balance Sheet Data: |
||||||||||||
| Cash and cash equivalents |
$ | 31,770 | $ | 31,770 | $ | 98,134 | ||||||
| Working capital, excluding current deferred revenue |
38,298 | 38,298 | 104,662 | |||||||||
| Total assets |
64,204 | 64,204 | 130,568 | |||||||||
| Deferred revenue |
57,750 | 57,750 | 57,750 | |||||||||
| Total liabilities |
79,469 | 79,469 | 79,469 | |||||||||
| Redeemable convertible preferred stock |
93,770 | — | — | |||||||||
| Total stockholders’ (deficit) equity |
(109,035 | ) | (15,265 | ) | 51,099 | |||||||
| (1) | The pro forma column reflects the conversion of all outstanding shares of redeemable convertible preferred stock into 15,505,330 shares of common stock upon the closing of this offering (assuming a conversion ratio equal to approximately 1.2895 shares of common stock for each share of Series E preferred stock based on an assumed initial public offering price of $17.00 per share, the midpoint of the price range set forth on the cover page of this prospectus). |
| (2) | The pro forma as adjusted column further reflects the sale of 4,400,000 shares of our common stock in this offering at an assumed initial public offering price of $17.00 per share, the midpoint of the price range set forth on the cover page of this prospectus, after deducting underwriting discounts and commissions and estimated offering expenses payable by us. |
| (3) | Each $1.00 increase (decrease) in the assumed initial public offering price of $17.00 per share, the midpoint of the price range set forth on the cover page of this prospectus, would increase (decrease) each of cash and cash equivalents, working capital, excluding current deferred revenue, total assets and total stockholders’ (deficit) equity on a pro forma as adjusted basis by $4.1 million, assuming that the number of shares offered by us, as set forth on the cover page of this prospectus remains the same, after deducting underwriting discounts and commissions and estimated offering expenses payable by us. Similarly, each increase (decrease) by 1,000,000 shares in the number of shares offered by us would increase (decrease) each of cash and cash equivalents, working capital, excluding current deferred revenue, total assets and total stockholders’ (deficit) equity on a pro forma as adjusted basis by $15.8 million, assuming that the assumed initial public offering price remains the same, after deducting underwriting discounts and commissions. The pro forma as adjusted information discussed above is illustrative only and will be adjusted based on the actual initial public offering price and other terms of this offering determined at pricing. |
9
Table of Contents
Index to Financial Statements
| Year Ended December 31, |
Nine Months Ended September 30, |
|||||||||||||||||||
| 2012 | 2013 | 2014 | 2014 | 2015 | ||||||||||||||||
| (unaudited) | ||||||||||||||||||||
| (in thousands) | ||||||||||||||||||||
| Other Financial Data: |
||||||||||||||||||||
| Non-GAAP operating loss(1) |
$ | (16,286 | ) | $ | (17,704 | ) | $ | (29,280 | ) | $ | (20,243 | ) | $ | (31,027 | ) | |||||
| Free cash flow(2) |
(8,945 | ) | (9,631 | ) | (22,798 | ) | (8,281 | ) | (11,446 | ) | ||||||||||
| (1) | We define non-GAAP operating loss as operating loss before stock-based compensation, payroll tax expense on secondary stock purchase transactions and amortization of acquisition-related intangibles. For more information about non-GAAP operating loss and a reconciliation of non-GAAP operating loss to loss from operations, the most directly comparable financial measure calculated and presented in accordance with U.S. generally accepted accounting principles, or GAAP, see the section titled “Selected Consolidated Financial Data—Non-GAAP Financial Measures.” |
| (2) | Free cash flow is a non-GAAP financial measure that we calculate as net cash provided by (used in) operating activities less purchases of property and equipment, net of proceeds from disposals of property and equipment. For more information about free cash flow, see the section titled “Selected Consolidated Financial Data—Non-GAAP Financial Measures.” |
10
Table of Contents
Index to Financial Statements
Investing in our common stock involves a high degree of risk. You should consider carefully the risks and uncertainties described below, together with all of the other information in this prospectus, including our consolidated financial statements and related notes, before deciding whether to purchase shares of our common stock. If any of the following risks actually occur, it could harm our business, prospects, operating results and financial condition. In such event, the market price of our common stock could decline and you could lose part or all of your investment.
Risks Related to Our Business and Industry
We have a history of losses and anticipate that we will continue to incur losses for the foreseeable future and may not achieve or maintain profitability in the future.
We have incurred net losses of $18.5 million, $22.5 million and $41.4 million in 2012, 2013 and 2014, respectively, and $23.4 million and $40.9 million in the nine months ended September 30, 2014 and 2015, respectively. We had an accumulated deficit of $130.8 million at September 30, 2015. We must generate and sustain higher revenue levels in future periods to become profitable, and, even if we do, we may not be able to maintain or increase our profitability. We expect to continue to incur losses for the foreseeable future as we expend substantial financial and other resources on, among other things:
| • | sales and marketing, including expanding our direct sales organization and marketing programs, particularly for larger customers; |
| • | investments in our research and development team, and the development of new applications and new features for, and enhancements of, our existing applications; |
| • | expansion of our operations and infrastructure, both domestically and internationally; and |
| • | general administration, including legal, accounting, and other expenses related to being a public company. |
These expenditures may not result in additional revenue or the growth of our business. We also expect that our revenue growth rate will decline over time. Accordingly, we may not be able to generate sufficient revenue to offset our expected cost increases and achieve and sustain profitability. If we fail to achieve and sustain profitability, the market price of our common stock could decline.
We have a limited operating history, which makes it difficult to evaluate our prospects and future operating results.
We launched Canvas in February 2011 and launched Bridge in February 2015. Our limited operating history makes our ability to forecast future operating results difficult and subjects us to a number of uncertainties, including our ability to plan and model future growth. Our revenue grew 197% and 70% in 2013 and 2014, respectively, compared to the prior year; however, our historical revenue growth is not necessarily indicative of our future performance. We expect our revenue growth rates to slow in future periods due to a number of reasons, which may include the maturation of our business, slowing demand for our platform and applications, increasing competition, a decrease in the growth of our overall markets, or if we fail, for any reason, to continue to capitalize on growth opportunities, our relative lack of experience with renewals or a decline in available opportunities as a result of our increased market penetration in one or more of our markets.
We have encountered and will encounter risks and uncertainties frequently experienced by growing companies in rapidly changing industries, such as determining appropriate investments of our limited resources, market adoption of our current and future applications, competition from other companies, acquiring and retaining customers, hiring, integrating, training and retaining skilled personnel, developing new applications,
11
Table of Contents
Index to Financial Statements
determining prices and contract terms for our applications, unforeseen expenses and challenges in forecasting accuracy. If our assumptions regarding these risks and uncertainties, which we use to plan our business, are incorrect or change, or if we do not address these risks successfully, our prospects, operating results and business could be harmed.
We depend on new customer acquisition and expansion and customer renewals to grow our business.
We derive, and expect to continue to derive, a substantial majority of our revenue from the sale of new subscriptions or renewals of subscriptions to our learning management platform and applications. Our growth today is primarily driven by new subscriptions. Our contracts typically vary in length between one and five years and our customers have no obligation to renew their subscriptions after the expiration of their initial subscription periods. Our customers may elect not to renew or may seek to renew for lower subscription amounts or for shorter contract lengths. Our renewal rates may decline or fluctuate as a result of a number of factors, including limited customer resources, pricing changes, adoption and utilization of our applications and services by our customers, customer satisfaction with our learning management platform and applications, the acquisition of our customers by other companies, procurement or budgetary decisions from legislative or other regulatory bodies, and deteriorating general economic conditions. As our customer base continues to grow, renewals will become an increasingly important part of our results. If our customers do not renew their subscriptions for our learning management platform and applications, or decrease the amount they spend with us, our revenue will decline and our business will be harmed.
Because our recent growth has resulted in the rapid expansion of our business, we do not have a long history upon which to base forecasts of customer renewal rates or future revenue. As a result, our future operating results may be significantly below the expectations of investors, which could harm the market price of our common stock.
We have a limited history with our subscription and pricing models and changes in our models could adversely affect our revenue, gross profit and financial position.
We have limited experience with respect to determining the optimal prices and contract length for our learning management platform and applications, in particular with Bridge, and as a result, we have in the past and expect in the future that we will need to change our pricing model or contract length from time to time. For example, in May 2015, we raised our subscription prices for Canvas for higher education institutions. As the market for our learning management platform and applications grows, as new competitors introduce new competitive applications or services, or as we enter into new international markets, we may be unable to attract new customers at the same price or based on the same pricing models we have historically used, or for contract lengths consistent with our historical averages. Pricing and contract length decisions may also impact the mix of adoption among our applications and negatively impact our overall revenue. Moreover, larger organizations may demand substantial price concessions or shorter contract duration. As a result, in the future we may be required to reduce our prices or offer shorter contract durations, which could adversely affect our revenue, gross profit and financial position.
We may experience quarterly fluctuations in our operating results due to a number of factors, which makes our future results difficult to predict and could cause our operating results to fall below expectations.
Our quarterly operating results have fluctuated in the past and we expect them to fluctuate in the future due to a variety of factors, many of which are outside of our control. As a result, our past results may not be indicative of our future performance, and comparing our operating results on a period-to-period basis may not be meaningful. In addition to the other risks described in this prospectus, factors that may affect our quarterly operating results include:
| • | changes in spending on learning management systems by our current or prospective customers; |
12
Table of Contents
Index to Financial Statements
| • | pricing our applications effectively so that we are able to attract and retain customers without compromising our operating results; |
| • | attracting new customers and increasing our existing customers’ use of our applications; |
| • | customer renewal rates and the amounts for which agreements are renewed; |
| • | awareness of our brands; |
| • | changes in the competitive dynamics of our market, including consolidation among competitors or customers and the introduction of new applications or application enhancements; |
| • | changes to the commission plans, quotas and other compensation-related metrics for our sales representatives; |
| • | the amount and timing of payment for operating expenses, particularly research and development, sales and marketing expenses and employee benefit expenses; |
| • | our ability to manage our existing business and future growth, including increases in the number of customers on our platform and the introduction and adoption of our platform in new markets outside of the United States; |
| • | unforeseen costs and expenses related to the expansion of our business, operations and infrastructure, including disruptions in our hosting network infrastructure and privacy and data security; |
| • | foreign currency exchange rate fluctuations; and |
| • | general economic and political conditions in our domestic and international markets. |
We may not be able to accurately forecast the amount and mix of future subscriptions, size or duration of contracts, revenue and expenses and, as a result, our operating results may fall below our estimates or the expectations of public market analysts and investors. If our revenue or operating results fall below the expectations of investors, or below any estimates we may provide, the market price of our common stock could decline.
Our business is subject to seasonal sales and customer growth fluctuations which could result in volatility in our operating results.
We have historically experienced a pattern of higher sales and new academic customers in the second and third quarters, as a result of school procurement periods, which are typically based on a fiscal year ending June 30. This has resulted in lower sequential sales and customer growth in the other quarters of the year. As we attempt to expand the number of our corporate customers, we may see changes to this pattern of seasonality. Seasonality may cause our sales and customer growth to vary from quarter-to-quarter depending on the variability in the volume and timing of sales and renewals. These factors, among other things, make forecasting more difficult and may adversely affect our ability to predict financial results accurately, which could result in volatility or adversely affect the market price of our common stock.
We could lose revenue if there are changes in the spending policies or budget priorities for government funding of colleges, universities, schools and other education providers.
Our Canvas customers include colleges, universities, K-12 schools and other education providers, many of which depend substantially on government funding. Accordingly, any general decrease, delay or change in federal, state or local funding for colleges, universities, schools and other education providers could cause our current and potential customers to reduce their purchases of Canvas and related services, or decide not to renew their subscriptions, any of which could cause us to lose customers and revenue. In addition, a specific reduction in governmental funding support for learning management systems could also cause us to lose customers and revenue.
13
Table of Contents
Index to Financial Statements
Because we generally recognize revenue from subscriptions ratably over the term of the agreement, near term changes in sales may not be reflected immediately in our operating results.
We offer our learning management platform and applications primarily through multi-year subscription agreements and generally recognize revenue ratably over the related subscription period. As a result, much of the revenue we report in each quarter is derived from agreements entered into during prior quarters or years. A decline in new or renewed subscriptions in any one quarter is not likely to be reflected immediately in our revenue results for that quarter. However, declines would negatively affect our revenue and deferred revenue balances in future periods, and the effect of significant downturns in sales and market acceptance of our platform and applications, and potential changes in our rate of renewals, may not be fully reflected in our results of operations until future periods. Our subscription model also makes it difficult for us to rapidly increase our total revenue and deferred revenue balance through additional sales in any period, as revenue from new customers is recognized over the applicable subscription term.
Because we expense commissions associated with sales of our applications immediately upon the execution of a subscription agreement with a customer, our operating income in any period may not be indicative of our financial health and future performance.
We expense commissions paid to our sales personnel in the period in which we enter into an agreement for the sale of our applications. In contrast, we generally recognize the revenue associated with a sale of our applications ratably over the related subscription period. Although we believe higher sales is a positive indicator of the long-term health of our business, higher sales increases our operating expenses and could decrease earnings in any particular period. Thus, we may report poor operating results due to higher sales commissions in a period in which we experience strong sales of our applications. Alternatively, we may report better operating results due to the reduction of sales commissions in a period in which we experience a slowdown in sales. Therefore, you should not necessarily rely on our operating income during any one quarter as an indication of our financial health and potential future performance.
If the market for our applications develops more slowly than we expect, our growth may slow or stall, and our operating results would be harmed.
The market for learning management systems is still evolving, and we depend on continued growth of this market. We do not know whether the trend of adoption of cloud-based learning management systems we have experienced with our academic customers in the past will continue in the future. To date, we have derived a substantial majority of our revenue from Canvas. A critical factor for our continued growth is our ability to sell Canvas to new customers in K-12 and higher education. The adoption trend for our academic customers is subject to influence from federal, state and local policymakers. Historically, our corporate customers have licensed our Canvas application. To better meet the needs of the corporate market, we launched Bridge in February 2015. Given our limited history with corporate customers, we do not know whether companies will adopt cloud-based learning management systems, or what prices or contract terms to which they will agree. We will incur substantial operating costs, particularly in sales and marketing and research and development, in attempting to develop these markets. If the market for Canvas does not continue to grow, or grows more slowly than we expect, or if the market for Bridge does not develop as we anticipate, our operating results would be harmed.
If we fail to effectively develop and expand our sales and marketing capabilities, our ability to increase our customer base and increase the market share of our learning management platform and applications could be harmed.
To increase the number of customers and increase the market share of our learning management platform and applications, we will need to expand our sales and marketing operations, including our domestic and international sales force and international resellers. We will continue to dedicate significant resources to sales and marketing programs. The effectiveness of our inbound sales and marketing has varied over time and, together with the effectiveness of any international resellers we may engage, may vary in the future. Our business
14
Table of Contents
Index to Financial Statements
will be harmed if our efforts do not generate a correspondingly significant increase in revenue. We may not achieve anticipated revenue growth from expanding our sales force if we are unable to hire, develop and retain talented sales personnel, if our new sales personnel are unable to achieve desired productivity levels in a reasonable period of time or if our sales and marketing programs are not effective.
We face significant competition from both established and new companies offering learning management systems, which may harm our ability to gain new customers, retain existing customers and grow our business.
The learning management systems market is evolving, highly competitive and significantly fragmented, particularly in the K-12 and corporate markets. With the introduction of new technologies and the potential entry of new competitors into the market, we expect competition to persist and intensify in the future, which could harm our ability to increase sales, maintain or increase renewals and maintain our prices.
We face intense competition from other software companies that develop learning management systems. Canvas primarily competes with systems offered by Blackboard, Desire2Learn and Moodle in the education market. Bridge primarily competes with systems offered by Cornerstone OnDemand, Saba Software and SumTotal Systems (owned by Skillsoft) along with dozens of small, specialized systems for specific industries to large, generalized systems provided as part of a larger human resources management suite. Competition could significantly impede our ability to sell or renew subscriptions to our learning management platform and applications on terms favorable to us. Our current and potential competitors may develop and market new technologies that render our existing or future applications less competitive, unmarketable or obsolete. In addition, if these competitors develop applications with similar or superior functionality to our software, we may need to decrease the prices or accept less favorable terms for our subscriptions in order to remain competitive. If we are unable to maintain our pricing due to competitive pressures, margins will be reduced and operating results will be negatively affected.
Current competitors have, and potential competitors may have, significantly more financial, technical, marketing and other resources than us, and may be able to devote greater resources to the development, promotion, sale and support of their applications and services, have more extensive customer bases and broader customer relationships, and longer operating histories and greater name recognition than us. As a result, these competitors may be better able to respond quickly to new technologies and to undertake more extensive marketing campaigns. In a few cases, these vendors may also be able to offer additional software at little or no additional cost by bundling them with their existing suite of applications. To the extent any competitor has existing relationships with potential customers for other applications, those customers may be unwilling to purchase our software because of their existing relationships with the competitor. If we are unable to compete with such companies, the demand for our platform and applications could be adversely affected.
In addition, if one or more competitors were to merge or partner with another competitor, our ability to compete effectively could be adversely affected. Competitors may also establish or strengthen cooperative relationships with current or future distribution or technology partners or other parties with whom we have relationships, thereby limiting our ability to sell our applications. We may not be able to compete successfully against current or future competitors, and competitive pressures may harm our business, operating results and financial condition.
If we fail to adapt and respond effectively to rapidly changing technology, evolving industry standards and changing customer needs or requirements, our learning management platform and applications may become less competitive.
Our future success depends on our ability to adapt and enhance our learning management platform and applications. To attract new customers and increase revenue from existing customers, we need to continue to enhance and improve our application offerings, features and enhancements to meet customer needs at prices that our customers are willing to pay. Such efforts will require adding new functionality and responding to technological advancements, which will increase our research and development costs. If we are unable to develop
15
Table of Contents
Index to Financial Statements
applications that address customers’ needs, or enhance and improve our platform in a timely manner, we may not be able to maintain or increase market acceptance of our platform and applications. Further, many of our competitors expend a considerably greater amount of funds on their research and development programs, and those that do not may be acquired by larger companies that would allocate greater resources to our competitors’ research and development programs. If we fail to maintain adequate research and development resources or compete effectively with the research and development programs of our competitors our business could be harmed. Our ability to grow is also subject to the risk of future disruptive technologies. Access and use of our learning management platform and applications is provided via the internet, which, itself, was disruptive to the previous enterprise software model. If new technologies emerge that are able to deliver learning management software and related applications at lower prices, more efficiently, more conveniently or more securely, such technologies could adversely affect our ability to compete.
The length and unpredictability of the sales cycle for our platform and applications could delay new sales and cause our revenue for any given quarter to fail to meet our estimates or market expectations.
The sales cycle between our initial contact with a potential customer and the signing of a license varies. As a result of the variability and length of the sales cycle, we have only a limited ability to forecast the timing of sales. A delay in or failure to complete sales could harm our business and financial results, and could cause our financial results to vary significantly from period to period. Our sales cycle varies widely, reflecting differences in potential customers’ decision-making processes, procurement requirements and budget cycles, and is subject to significant risks over which we have little or no control, including:
| • | customers’ budgetary constraints and priorities; |
| • | the timing of customers’ budget cycles; |
| • | the need by some customers for lengthy evaluations that often include both their administrators and faculties; and |
| • | the length and timing of customers’ approval processes. |
Potential customers typically conduct extensive and lengthy evaluations before committing to our applications and services and generally require us to expend substantial time, effort and money educating them as to the value of our offerings.
Our planned further expansion of our business outside the United States exposes us to risks associated with international operations.
Our growth strategy involves the further expansion of our operations and customer base internationally. For the nine months ended September 30, 2015, 6% of our revenue was derived from outside the United States. We opened our international headquarters in London, England in June 2014 and have offices in Sydney, Australia and Hong Kong. Our current international operations and future initiatives will involve a variety of risks, including:
| • | more stringent regulations relating to data security and the unauthorized use of, or access to, commercial and personal information, particularly in the European Union; |
| • | technical or latency issues in delivering our platform and applications; |
| • | dependence on certain third parties, including resellers with whom we do not have extensive experience; |
| • | unexpected changes in regulatory requirements, taxes or trade laws; |
| • | differing labor regulations, especially in the European Union, where labor laws are generally more advantageous to employees as compared to the United States, including deemed hourly wage and overtime regulations in these locations; |
16
Table of Contents
Index to Financial Statements
| • | challenges inherent in efficiently managing an increased number of employees over large geographic distances, including the need to implement appropriate systems, policies, benefits and compliance programs; |
| • | difficulties in maintaining our company culture with a dispersed and distant workforce; |
| • | difficulties in managing a business in new markets with diverse cultures, languages, customs, legal systems, alternative dispute systems and regulatory systems; |
| • | currency exchange rate fluctuations and the resulting effect on our revenue and expenses, and the cost and risk of entering into hedging transactions if we choose to do so in the future; |
| • | limitations on our ability to reinvest earnings from operations in one country to fund the capital needs of our operations in other countries; |
| • | limited or insufficient intellectual property protection; |
| • | political instability or terrorist activities; |
| • | requirements to comply with foreign privacy and information security laws and regulations and the risks and costs of non-compliance; |
| • | likelihood of potential or actual violations of domestic and international anticorruption laws, such as the U.S. Foreign Corrupt Practices Act and the U.K. Bribery Act, or of U.S. and international export control and sanctions regulations, which likelihood may increase with an increase of sales or operations in foreign jurisdictions and operations in certain industries; and |
| • | adverse tax burdens and foreign exchange controls that could make it difficult to repatriate earnings and cash. |
Our limited experience in operating our business internationally increases the risk that any potential future expansion efforts that we may undertake will not be successful. If we invest substantial time and resources to expand our international operations and are unable to do so successfully and in a timely manner, our business and operating results will be harmed.
If we fail to offer high-quality professional services and support, our business and reputation may suffer.
High-quality professional services and support, including training, implementation and consulting services, are important for the successful marketing, sale and use of our learning management platform and applications and for the renewal of existing customers. The importance of high-quality professional services and support will increase as we expand our business and pursue new customers. If we do not provide effective ongoing support, our ability to sell additional functionality and services to, or to retain, existing customers may suffer and our reputation with existing or potential customers may be harmed.
If we fail to manage our growth effectively or our business does not grow as we expect, our operating results may suffer.
Our employee base and operations have grown substantially in a relatively short period of time. Our full-time employee base grew from 446 employees as of September 30, 2014 to 709 employees as of September 30, 2015. Our growth has placed, and will continue to place, a significant strain on our operational, financial and management infrastructure. We anticipate further increases in headcount will be required to support increases in our application offerings and continued expansion. To manage this growth effectively, we must continue to improve our operational, financial and management systems and controls by, among other things:
| • | effectively attracting, training and integrating a large number of new employees, particularly technical personnel and members of our management and sales teams; |
17
Table of Contents
Index to Financial Statements
| • | further improving our key business systems, processes and information technology infrastructure to support our business needs; |
| • | enhancing our information and communication systems to ensure that our employees are well-coordinated and can effectively communicate with each other and our customers; and |
| • | improving our internal control over financial reporting and disclosure controls and procedures to ensure timely and accurate reporting of our operational and financial results. |
If we fail to manage our expansion or implement new systems, or if we fail to implement improvements or maintain effective internal controls and procedures, costs and expenses may increase more than expected and we may not expand our customer base, increase renewal rates, enhance existing applications, develop new applications, satisfy customers, respond to competitive pressures, or otherwise execute our business plan. If we are unable to effectively manage our growth, our operating results will be harmed.
We rely on our management team and other key employees, and the loss of one or more key employees could harm our business.
Our success and future growth depend upon the continued services of our management team, including Joshua Coates, our Chief Executive Officer, and other key employees in the areas of engineering, marketing, sales, services and general and administrative functions. From time to time, there may be changes in our management team resulting from the hiring or departure of executives, which could disrupt our business. We also are dependent on the continued service of our existing software engineers and information technology personnel because of the complexity of our software, technologies and infrastructure. We may terminate any employee’s employment at any time, with or without cause, and any employee may resign at any time, with or without cause. We do not maintain any “key man” insurance for any employee. The loss of one or more of our key employees could harm our business.
If we fail to attract and retain additional qualified personnel we may be unable to execute our business strategy.
To execute our business strategy, we must attract and retain highly qualified personnel. In particular, we compete with many other companies for software developers with high levels of experience in designing, developing and managing cloud-based software, as well as for skilled information technology, marketing, sales and operations professionals, and we may not be successful in attracting and retaining the professionals we need, in particular in Utah, where we are headquartered. We have from time to time experienced, and we expect to continue to experience, difficulty in hiring and retaining highly skilled employees with appropriate qualifications which may, among other things, impede our ability to execute our software development and sales strategies. Many of the companies with which we compete for experienced personnel have greater resources than we do. In addition, in making employment decisions, particularly in the software industry, job candidates often consider the value of the stock options or other equity incentives they are to receive in connection with their employment. If the price of our stock declines, or experiences significant volatility, our ability to attract or retain qualified employees will be adversely affected. If we fail to attract new personnel or fail to retain and motivate our current personnel, our growth prospects could be harmed.
If we cannot maintain our company culture as we grow, we could lose the innovation, teamwork, passion and focus on execution that we believe contribute to our success and our business may be harmed.
We believe that a critical component to our success has been our company culture, which is based on dedication to customer experience, openness, ownership, trust, integrity, excellence and simplicity. We have invested substantial time and resources in building our team within this company culture. If we fail to preserve our culture our ability to retain and recruit personnel and to effectively focus on and pursue our corporate objectives could be harmed. As we grow and develop the infrastructure of a public company, we may find it
18
Table of Contents
Index to Financial Statements
difficult to maintain these important aspects of our company culture. If we fail to maintain our company culture, our business may be harmed.
If we do not maintain the compatibility of our learning management platform with third-party applications that our customers use in their businesses or schools, our revenue will decline.
A significant percentage of our customers choose to integrate our learning management platform with certain capabilities of third-party publishers and software providers using application programming interfaces, or APIs. The functionality and popularity of our platform depends, in part, on our ability to integrate our platform with third-party applications and software. Third-party providers of applications may change the features of their applications and software, restrict our access to their applications and software or alter the terms governing use of their applications and access to those applications and software in an adverse manner. Such changes could functionally limit or terminate our ability to use these third-party applications and software in conjunction with our learning management platform, which could negatively impact our offerings and harm our business. If we fail to integrate our platform with new third-party applications and software that our customers utilize, we may not be able to offer the functionality that our customers need, which would negatively impact our ability to generate revenue and adversely impact our business.
If our network or computer systems are breached or unauthorized access to customer data is otherwise obtained, our learning management platform and applications may be perceived as insecure and we may lose existing customers or fail to attract new customers, our reputation may be damaged and we may incur significant liabilities.
Use of our learning management platform and applications involve the storage, transmission and processing of our customers’ data, including personal or identifying information regarding their students or employees. Cyber attacks and other malicious internet-based activity continue to increase generally, and cloud-based platform providers of software and services have been targeted. If any unauthorized access to or security breaches of our platform, or those of our service providers, occurs, or is believed to have occurred, such an event or perceived event could result in the loss of data, loss of intellectual property or trade secrets, loss of business, severe reputational or brand damage adversely affecting customer or investor confidence, regulatory investigations and orders, litigation, indemnity obligations, damages for contract breach, penalties for violation of applicable laws, regulations, or contractual obligations, and significant costs for remediation that may include liability for stolen assets or information and repair of system damage that may have been caused, incentives offered to customers or other business partners in an effort to maintain business relationships after a breach, and other liabilities. Additionally, any such event or perceived event could impact our reputation, harm customer confidence, hurt our sales and expansion into existing and new markets, or cause us to lose existing customers. We could be required to expend significant capital and other resources to alleviate problems caused by such actual or perceived breaches and to remediate our systems, we could be exposed to a risk of loss, litigation or regulatory action and possible liability, and our ability to operate our business may be impaired. Additionally, actual, potential or anticipated attacks may cause us to incur increasing costs, including costs to deploy additional personnel and protection technologies, train employees and engage third-party experts and consultants.
In addition, if the security measures of our customers are compromised, even without any actual compromise of our own systems, we may face negative publicity or reputational harm if our customers or anyone else incorrectly attributes the blame for such security breaches to us or our systems. If customers believe that our platform and applications do not provide adequate security for the storage of personal or other sensitive information or its transmission over the internet, our business will be harmed. Customers’ concerns about security or privacy may deter them from using our platform for activities that involve personal or other sensitive information.
Our errors and omissions insurance covering certain security and privacy damages and claim expenses may not be sufficient to compensate for all liability. Although we maintain liability insurance for liabilities incurred as
19
Table of Contents
Index to Financial Statements
a result of some security and privacy damages, we cannot be certain that our coverage will be adequate for liabilities actually incurred or that insurance will continue to be available to us on economically reasonable terms, or at all. Because the techniques used and vulnerabilities exploited to obtain unauthorized access or to sabotage systems change frequently and generally are not identified until they are launched against a target, we may be unable to anticipate these techniques or vulnerabilities or implement adequate preventative measures. We may also experience security breaches that may remain undetected for an extended period.
Because data security is a critical competitive factor in our industry, we make public statements in our privacy policies describing the security of our platform. Should any of these statements be untrue, become untrue, or be perceived to be untrue, even if through circumstances beyond our reasonable control, we may face claims, including claims of unfair or deceptive trade practices, brought by the U.S. Federal Trade Commission, state, local, or foreign regulators, and private litigants.
Interruptions or performance problems associated with our technology and infrastructure may adversely affect our business and operating results.
Our continued growth depends in part on the ability of our existing and potential customers to access our applications at any time. We have experienced, and may in the future experience, disruptions, outages, and other performance problems due to a variety of factors, including infrastructure changes, introductions of new functionality, human or software errors, distributed denial of service attacks, or other security related incidents. In some instances, we may not be able to identify the cause or causes of these performance problems within an acceptable period of time. It may become increasingly difficult to maintain and improve our performance, especially during peak usage times and as our platform becomes more complex and our user traffic increases. If our learning management platform and applications are unavailable or if our users are unable to access our applications within a reasonable amount of time or at all, our business will be harmed.
Moreover, our standard customer agreements include performance guarantees and service level standards that obligate us to provide credits or termination rights in the event of a significant disruption in our platform. To the extent that our third-party service providers experience outages, or to the extent we do not effectively address capacity constraints, upgrade our systems as needed, and continually develop our technology and network architecture to accommodate actual and anticipated changes in technology, our business and operating results may be adversely affected.
Our use of “open source” software could negatively affect our ability to offer our learning management platform and applications and subject us to possible litigation.
Our applications, in particular a substantial portion of Canvas, use “open source” software that we, in some cases, have obtained from third parties. Open source software is generally freely accessible, usable and modifiable, and is made available to the general public on an “as-is” basis under the terms of a non-negotiable license. Use and distribution of open source software may entail greater risks than use of third-party commercial software. Open source licensors generally do not provide warranties or other contractual protections regarding infringement claims or the quality of the code. In addition, certain open source licenses, like the GNU Affero General Public License, or AGPL, may require us to offer for no cost the components of our software that incorporate the open source software, to make available source code for modifications or derivative works we create based upon incorporating or using the open source software, or to license our modifications or derivative works under the terms of the particular open source license. If we are required, under the terms of an open source license, to release the source code of our proprietary software to the public, our competitors could create similar applications with lower development effort and time, which ultimately could result in a loss of sales for us.
We may also face claims alleging noncompliance with open source license terms or infringement or misappropriation of proprietary software. These claims could result in litigation, require us to purchase a costly license or require us to devote additional research and development resources to change our software, any of
20
Table of Contents
Index to Financial Statements
which would have a negative effect on our business and operating results, including being enjoined from the offering of the components of our software that contained the open source software. In addition, if the license terms for open source software that we use change, and we cannot continue to use the version of such software that we had been using, we may be forced to re-engineer our applications, incur additional costs, or discontinue the sale of applications or services if re-engineering could not be accomplished on a timely basis.
We could also be subject to suits by parties claiming ownership of what we believe to be open source software. Litigation could be costly for us to defend, have a negative effect on our operating results and financial condition and require us to devote additional research and development resources to change our applications. Although we monitor our use of open source software to avoid subjecting our applications to unintended conditions, few courts have interpreted open source licenses, and there is a risk that these licenses could be construed in a way that could impose unanticipated conditions or restrictions on our ability to commercialize our applications. We cannot guarantee that we have incorporated open source software in our software in a manner that will not subject us to liability, or in a manner that is consistent with our current policies and procedures.
We make a substantial portion of the source code for Canvas available under the terms of an open source license, and accept contributions of modifications to that source code, each of which could negatively affect our ability to offer our learning management platform and applications and subject us to possible litigation.
To promote our open platform philosophy, we make available a substantial portion of the source code for Canvas available to the public on the “GitHub” platform for no charge, under the terms of the AGPL. An individual or entity with the appropriate technical and human resources may choose to use this open source version of Canvas to try to self-host the platform to avoid paying any fees to us. In addition, some individuals or entities may try to use the open source version of Canvas for commercial purposes and directly compete with us for customers. We are aware of a few entities that currently self-host the platform and are aware of some entities that are currently selling hosting and support services. If more customers decide to self-host or other entities use the base code to compete with us, we may experience lower revenue and our business may be harmed.
We accept modifications of the source code for Canvas from contributors who agree to the terms of our contributor agreement. Our contributor agreement provides for assignment of joint ownership in the copyright to the contribution, and a license to any patent rights of the contributor. Contributors must also represent that it is an original work and that the contribution does not violate any third-party intellectual property right. However, we cannot ensure that any of these contributions is free of all third-party rights and claims of intellectual property infringement or misappropriation. By incorporating any contribution into our code base, we may be subject to intellectual property infringement or misappropriation claims, which as discussed elsewhere, are costly to defend and could require costly re-writing of our code base or licensing of replacement third-party solutions. Third party alternatives may not be available to us on commercially reasonable terms.
Our business is dependent upon our brand recognition and reputation, and if we fail to maintain or enhance our brand recognition or reputation, our business could be harmed.
We believe that maintaining and enhancing our brands and our reputation are critical to our relationships with our customers and to our ability to attract new customers. We also believe that our brands and reputation will be increasingly important as competition in our market continues to develop. Our success in this area will depend on a wide range of factors, some of which are beyond our control, including the following:
| • | the efficacy of our marketing efforts; |
| • | our ability to continue to offer high-quality, innovative and error- and bug-free applications; |
| • | our ability to retain existing customers and obtain new customers; |
| • | our ability to maintain high customer satisfaction; |
| • | the quality and perceived value of our applications; |
21
Table of Contents
Index to Financial Statements
| • | our ability to successfully differentiate our applications from those of our competitors; |
| • | actions of competitors and other third parties; |
| • | our ability to provide customer support and professional services; |
| • | any misuse or perceived misuse of our applications; |
| • | positive or negative publicity; |
| • | interruptions, delays or attacks on our platform or applications; and |
| • | litigation, legislative or regulatory-related developments. |
If our brand promotion activities are not successful, our operating results and growth may be harmed.
Furthermore, negative publicity, whether or not justified, relating to events or activities attributed to us, our employees, our partners or others associated with any of these parties, may tarnish our reputation and reduce the value of our brand. Damage to our reputation and loss of brand equity may reduce demand for our applications and have an adverse effect on our business, operating results and financial condition. Moreover, any attempts to rebuild our reputation and restore the value of our brands may be costly and time consuming, and such efforts may not ultimately be successful.
We rely upon Amazon Web Services to operate certain aspects of our service and any disruption of or interference with our use of Amazon Web Services could impair our ability to deliver our learning management platform and applications to our customers, resulting in customer dissatisfaction, damage to our reputation, loss of customers and harm to our business.
Amazon Web Services, or AWS, provides a distributed computing infrastructure platform for business operations, or what is commonly referred to as a cloud computing service. We have architected our software and computer systems to use data processing, storage capabilities and other services provided by AWS. Currently, our cloud service infrastructure is run on AWS. Given this, we cannot easily switch our AWS operations to another cloud provider, so any disruption of or interference with our use of AWS would impact our operations and our business would be adversely impacted. AWS provides us with computing and storage capacity pursuant to an agreement that continues until terminated by either party. AWS may terminate the agreement without cause by providing 90 days prior written notice, and may terminate the agreement with 30 days prior written notice for cause, including any material default or breach of the agreement by us that we do not cure within the 30 day period. The agreement requires AWS to provide us their standard computing and storage capacity and related support in exchange for timely payment by us. If any of our arrangements with AWS is terminated, we could experience interruptions in our software as well as delays and additional expenses in arranging new facilities and services.
We utilize third-party data center hosting facilities operated by AWS, located in various sites within the states of Virginia and Oregon. For international customers, we utilize third-party data center hosting facilities operated by AWS located in Dublin, Ireland, Sydney, Australia and Singapore.
Our operations depend, in part, on AWS’s abilities to protect these facilities against damage or interruption from natural disasters, power or telecommunications failures, criminal acts and similar events. Despite precautions taken at our data centers, the occurrence of spikes in usage volume, a natural disaster, an act of terrorism, vandalism or sabotage, a decision to close a facility without adequate notice, or other unanticipated problems at a facility could result in lengthy interruptions in the availability of our platform. Even with current and planned disaster recovery arrangements, our business could be harmed. Also, in the event of damage or interruption, our insurance policies may not adequately compensate us for any losses that we may incur. These factors in turn could further reduce our revenue, subject us to liability and cause us to issue credits or cause customers to fail to renew their subscriptions, any of which could harm our business.
22
Table of Contents
Index to Financial Statements
We are dependent on the continued availability of the internet and third-party computer and communications systems.
Our ability to provide our platform and applications to our customers depends on our ability to communicate with our customers through the public internet and third-party computer and communications systems. A severe disruption of one or more of these systems could impair our ability to process information, which could impede our ability to provide services to our customers, harm our reputation, result in a loss of customers harm our business and operating results.
Real or perceived errors, failures, or bugs in our learning management platform or applications could adversely affect our operating results and growth prospects.
We push updates to our platform on a frequent basis. Despite testing by us, errors, failures or bugs may not be found in our learning management platform or applications until after they are deployed to our customers. We have discovered and expect we will continue to discover software errors, failures and bugs in our learning management platform or applications and anticipate that certain of these errors, failures and bugs will only be discovered and remediated after deployment to customers. Real or perceived errors, failures or bugs in our platform and applications could result in negative publicity, loss of or delay in market acceptance of our platform and applications, loss of competitive position, or claims by customers for losses sustained by them. In such an event, we may be required, or may choose, for customer relations or other reasons, to expend additional resources in order to help correct the problem.
We implement bug fixes and upgrades as part of our regular system maintenance, which may lead to system downtime. Even if we are able to implement the bug fixes and upgrades in a timely manner, any history of defects or inaccuracies in the data we collect for our customers, or the loss, damage or inadvertent release of confidential data could cause our reputation to be harmed, and customers may elect not to purchase or renew their agreements with us or we may incur increased insurance costs. The costs associated with any material defects or errors in our software or other performance problems may be substantial and could harm our operating results.
Because many of our customers use our applications to store and retrieve critical information, we may be subject to liability claims if our applications do not work properly. We cannot be certain that the limitations of liability set forth in our licenses and agreements would be enforceable or would otherwise protect us from liability for damages. A material liability claim against us, regardless of its merit or its outcome, could result in substantial costs, significantly harm our business reputation and divert management’s attention from our operations.
We are subject to governmental laws, regulation and other legal obligations, particularly related to privacy, data protection and information security, and any actual or perceived failure to comply with such obligations could harm our business.
Personal privacy and information security are significant issues in the United States and the other jurisdictions where we offer our applications. The legislative and regulatory framework for privacy and security issues worldwide is rapidly evolving and is likely to remain uncertain for the foreseeable future. Our handling of data is subject to a variety of laws and regulations, including regulation by various government agencies, including the U.S. Federal Trade Commission, or FTC, and various state, local and foreign agencies. We collect personally identifiable information, or PII, and other data from our customers and users. We use this information to provide services to our customers and users and to support, expand and improve our business. We may also share customers’ or users’ PII with third parties as allowed by applicable law and agreements and authorized by the customer or as described in our privacy policy.
The U.S. federal and various state and foreign governments have adopted or proposed limitations on the collection, distribution, use and storage of PII. In the United States, the FTC and many state attorneys general are applying federal and state consumer protection laws as imposing standards for the online collection, use and
23
Table of Contents
Index to Financial Statements
dissemination of data. Furthermore, many states have recently enacted laws that apply directly to the operators of online services that are intended for K-12 school purposes that limit the collection, distribution, use and storage of student information that go beyond what may be applicable to other individuals. Many foreign countries and governmental bodies, including the European Union, Canada, Australia and other relevant jurisdictions, have laws and regulations concerning the collection and use of PII obtained from their residents or by businesses operating within their jurisdiction. These laws and regulations often are more restrictive than those in the United States. Laws and regulations in these jurisdictions apply broadly to the collection, use, storage, disclosure and security of data that identifies or may be used to identify or locate an individual, such as names, email addresses and, in some jurisdictions, Internet Protocol, or IP, addresses. In the European Union, where companies must meet specified privacy and security standards, Directive 95/46/EC of the European Parliament and of the Council of 24 October 1995 on the protection of individuals with regard to the processing of personal data and on the free movement of such data, commonly referenced as the Data Protection Directive, and EU member state implementations of the Data Protection Directive, require comprehensive information privacy and security protections for consumers with respect to PII, collected about them.
We have in the past relied on adherence to the U.S. Department of Commerce’s Safe Harbor Privacy Principles and compliance with the U.S.-EU and U.S.-Swiss Safe Harbor Frameworks as agreed to and set forth by the U.S. Department of Commerce, and the European Union and Switzerland, which established a means for legitimating the transfer of PII by U.S. companies doing business in Europe from the European Economic Area to the U.S. As a result of the October 6, 2015 European Union Court of Justice, or ECJ, opinion in Case C-362/14 (Schrems v. Data Protection Commissioner) regarding the adequacy of the U.S.-EU Safe Harbor Framework, the U.S. – EU Safe Harbor Framework is no longer deemed to be a valid method of compliance with restrictions set forth in the Data Protection Directive (and member states’ implementations thereof) regarding the transfer of data outside of the European Economic Area. In light of the ECJ opinion in Case C-362/14, we anticipate engaging in efforts to legitimize data transfers from the European Economic Area. We may be unsuccessful in establishing legitimate means of transferring data from the European Economic Area, we may experience hesitancy, reluctance, or refusal by European or multi-national customers to continue to use our services due to the potential risk exposure to such customers as a result of the ECJ ruling, and we and our customers are at risk of enforcement actions taken by an EU data protection authority until such point in time that we ensure that all data transfers to us from the European Economic Area are legitimized. We may find it necessary to establish systems to maintain EU-origin data in the European Economic Area, which may involve substantial expense and distraction from other aspects of our business. We publicly post our privacy policies and practices concerning our processing, use and disclosure of PII. Our publication of our privacy policy and other statements we publish that provide promises and assurances about privacy and security can subject us to potential state and federal action if they are found to be deceptive or misrepresentative of our practices.
Although we are working to comply with those federal, state, and foreign laws and regulations, industry standards, contractual obligations and other legal obligations that apply to us, those laws, regulations, standards and obligations are evolving and may be modified, interpreted and applied in an inconsistent manner from one jurisdiction to another, and may conflict with one another, other requirements or legal obligations, our practices or the features of our applications or platform. Any failure or perceived failure by us to comply with federal, state or foreign laws or regulations, industry standards, contractual obligations or other legal obligations, or any actual or suspected security incident, whether or not resulting in unauthorized access to, or acquisition, release or transfer of PII or other data, may result in governmental enforcement actions and prosecutions, private litigation, fines and penalties or adverse publicity and could cause our customers to lose trust in us, which could have an adverse effect on our reputation and business. Any inability to adequately address privacy and security concerns, even if unfounded, or comply with applicable laws, regulations, policies, industry standards, contractual obligations, or other legal obligations could result in additional cost and liability to us, damage our reputation, inhibit sales, and adversely affect our business.
We also expect that there will continue to be new proposed laws, regulations and industry standards concerning privacy, data protection and information security in the United States, the European Union and other
24
Table of Contents
Index to Financial Statements
jurisdictions, and we cannot yet determine the impact such future laws, regulations and standards may have on our business. Future laws, regulations, standards and other obligations, and changes in the interpretation of existing laws, regulations, standards and other obligations could impair our or our customers’ ability to collect, use or disclose information relating to consumers, which could decrease demand for our applications, increase our costs and impair our ability to maintain and grow our customer base and increase our revenue. New laws, amendments to or re-interpretations of existing laws and regulations, industry standards, contractual obligations and other obligations may require us to incur additional costs and restrict our business operations. Such laws and regulations may require companies to implement privacy and security policies, permit users to access, correct and delete personal information stored or maintained by such companies, inform individuals of security breaches that affect their personal information, and, in some cases, obtain individuals’ consent to use PII for certain purposes. In addition, a foreign government could require that any PII collected in a country not be disseminated outside of that country, and we are not currently equipped to comply with such a requirement. Other proposed legislation could, if enacted, impose additional requirements and prohibit the use of certain technologies that track individuals’ activities on web pages or that record when individuals click through to an internet address contained in an email message. Such laws and regulations could require us to change features of our software or restrict our customers’ ability to collect and use email addresses, page viewing data and personal information, which may reduce demand for our software. If we fail to comply with federal, state and international data privacy laws and regulations our ability to successfully operate our business and pursue our business goals could be harmed.
We also may find it necessary or desirable to join industry or other self-regulatory bodies or other privacy- or data protection-related organizations that require compliance with their rules pertaining to privacy and data protection. We also may be bound by additional, more stringent contractual obligations relating to our collection, use and disclosure of personal, financial and other data.
We are subject to contractual clauses that require us to comply with certain provisions of the Family Educational Rights and Privacy Act and we are subject to the Children’s Online Privacy Protection Act, and if we fail to comply with these laws, our reputation and business could be harmed.
The Family Educational Rights and Privacy Act, or FERPA, generally prohibits educational institutions that receive federal funding from disclosing PII from a student’s education records without the student’s consent. Through Canvas, our academic learning management application, our customers and users disclose to us certain information that may originate from or comprise a student education record, as the term is defined under FERPA. As an entity that provides services to institutions, we are often subject to contractual clauses that impose restrictions derived from FERPA on our ability to collect, process, transfer, disclose, and store student data, under which we may not transfer or otherwise disclose any PII from a student record to another party other than in a manner permitted under the statute. If we violate our obligations to any of our educational institution customers relating to the privacy of student records subject to FERPA, such a violation could constitute material breach of contract with one or more of our customers and could harm our reputation. Further, in the event that we disclose student information in a manner that results in a violation of FERPA by one of our educational customers, the U.S. Department of Education could require that customer to suspend our access to the customer’s student information that is covered under FERPA for a period of at least five years.
We are subject to the Children’s Online Privacy Protection Act, or COPPA, which applies to operators of commercial websites and online services directed to U.S. children under the age of 13 that collect personal information from children, and to operators of general audience websites with actual knowledge that they are collecting information from U.S. children under the age of 13. Canvas is directed, in part, at children under the age of 13. Through Canvas and other means, we collect certain personal information, including names and email addresses from children. COPPA is subject to interpretation by courts and other governmental authorities, including the FTC, and the FTC is authorized to promulgate, and has promulgated, revisions to regulations implementing provisions of COPPA, and provides non-binding interpretive guidance regarding COPPA that changes periodically with little or no public notice. Although we strive to ensure that our platform and applications are compliant with applicable COPPA provisions, these provisions may be modified, interpreted, or
25
Table of Contents
Index to Financial Statements
applied in new manners that we may be unable to anticipate or prepare for appropriately, and we may incur substantial costs or expenses in attempting to modify our systems, platform, applications, or other technology to address changes in COPPA or interpretations thereof. If we fail to accurately anticipate the application, interpretation or legislative expansion of COPPA we could be subject to governmental enforcement actions, litigation, fines and penalties or adverse publicity and we could be in breach of our customer contracts and our customers could lose trust in us, which could harm our reputation and business.
Third-party claims that we are infringing the intellectual property rights of others, whether successful or not, could subject us to costly and time-consuming litigation or require us to expensive licenses, and our business could be harmed.
The software industry is characterized by the existence of a large number of patents, copyrights, trademarks, trade secrets and other intellectual property rights. Companies in the software industry must often defend against litigation claims based on allegations of infringement or other violations of intellectual property rights. Third parties, including our competitors, may own patents or other intellectual property rights that cover aspects of our technology or business methods and may assert patent or other intellectual property rights within the industry. Moreover, in recent years, individuals and groups that are non-practicing entities, commonly referred to as “patent trolls,” have purchased patents and other intellectual property assets for the purpose of making claims of infringement in order to extract settlements. From time to time, we may receive threatening letters, notices or “invitations to license,” or may be the subject of claims that our services or software and underlying technology infringe or violate the intellectual property rights of others. Responding to such claims, regardless of their merit, can be time consuming, costly to defend in litigation, divert management’s attention and resources, damage our reputation and brand and cause us to incur significant expenses. Our technologies may not be able to withstand any third-party claims against their use. Claims of intellectual property infringement might require us to stop using technology found to be in violation of a third party’s rights, redesign our application, which could require significant effort and expense, and cause delays of releases, enter into costly settlement or license agreements or pay costly damage awards, or face a temporary or permanent injunction prohibiting us from marketing or selling our software. If we cannot or do not license the infringed technology on reasonable terms or at all, or substitute similar technology from another source, we could be forced to limit or stop selling our software, we may not be able to meet our obligations to customers under our customer contracts, our revenue and operating results could be adversely impacted, and we may be unable to compete effectively. Additionally, our customers may not purchase our learning management applications if they are concerned that they may infringe third-party intellectual property rights. The occurrence of any of these events may harm our business.
In our subscription agreements with our customers, we generally agree to indemnify our customers against any losses or costs incurred in connection with claims by a third party alleging that the customer’s use of our services or software infringes the intellectual property rights of the third party. Our customers who are accused of intellectual property infringement may seek indemnification from us. If any claim is successful, or if we are required to indemnify or defend our customers from any of these or other claims, these matters could be disruptive to our business and management and result in additional legal expenses.
The success of our business depends in part on our ability to protect and enforce our intellectual property rights.
Our success is dependent, in part, upon protecting our proprietary technology. We do not own any patents and we rely on a combination of copyrights, trademarks, service marks, trade secret laws and contractual restrictions to establish and protect our proprietary rights in our applications and services. However, the steps we take to protect our intellectual property may be inadequate. We will not be able to protect our intellectual property if we are unable to enforce our rights or if we do not detect unauthorized use of our intellectual property. Any of our trademarks or other intellectual property rights may be challenged by others or invalidated through administrative process or litigation. Furthermore, legal standards relating to the validity, enforceability and scope of protection of intellectual property rights are uncertain. Despite our precautions, it may be possible for unauthorized third parties to copy our technology and use information that we regard as proprietary to create
26
Table of Contents
Index to Financial Statements
applications and services that compete with ours. Some license provisions protecting against unauthorized use, copying, transfer and disclosure of our offerings may be unenforceable under the laws of certain jurisdictions and foreign countries. Our corporate name and the name of our platform and applications have not been trademarked in each market where we operate and plan to operate. If we do not secure registrations for our trademarks, we may encounter more difficulty in enforcing them against third parties. Effective copyright, trademark and trade secret protection may not be available in every country in which our platform and applications are available. The laws of some foreign countries may not be as protective of intellectual property rights as those in the United States, and mechanisms for enforcement of intellectual property rights may be inadequate. To the extent we expand our international operations, our exposure to unauthorized copying and use of our technology and proprietary information may increase. Accordingly, despite our efforts, we may be unable to prevent third parties from infringing upon or misappropriating our technology and intellectual property.
Although we enter into confidentiality and invention assignment agreements with our employees and consultants and enter into confidentiality agreements with the parties with whom we have strategic relationships and business alliances, no assurance can be given that these agreements will be effective in controlling access to and distribution of our applications and proprietary information or prevent reverse engineering. Further, these agreements may not prevent our competitors from independently developing technologies that are substantially equivalent or superior to our software and offerings, and we may be unable to prevent this competition.
We may be required to spend significant resources to monitor and protect our intellectual property rights. Litigation may be necessary in the future to enforce our intellectual property rights and to protect our trade secrets. Such litigation could be costly, time consuming and distracting to management and could result in the impairment or loss of portions of our intellectual property. Furthermore, our efforts to enforce our intellectual property rights may be met with defenses, counterclaims and countersuits attacking the validity and enforceability of our intellectual property rights. We may not prevail in any lawsuits that we initiate. Any litigation, whether or not resolved in our favor, could subject us to substantial costs, divert resources and the attention of management and technical personnel from our business and adversely affect our business. Our inability to protect our proprietary technology against unauthorized copying or use, as well as any costly litigation, could delay further sales or the implementation of our software and offerings, impair the functionality of our software and offerings, delay introductions of new features or enhancements, result in our substituting inferior or more costly technologies into our software and offerings, or injure our reputation.
We could face liability, or our reputation might be harmed, as a result of the activities of our customers or users, the content in our platform or the data they store on our servers.
As a provider of cloud-based learning management software, we may be subject to potential liability for the activities of our customers or users on or in connection with the data they store on our servers. Although our customer terms of use prohibit illegal use of our services by our customers and permit us to take down content or take other appropriate actions for illegal use, customers may nonetheless engage in prohibited activities or upload or store content with us in violation of applicable law or the customer’s own policies, which could subject us to liability or harm our reputation.
Various U.S. federal statutes may apply to us with respect to various customer activities. The Digital Millennium Copyright Act of 1998, or DMCA, provides recourse for owners of copyrighted material who believe that their rights under U.S. copyright law have been infringed on the internet. Under the DMCA, based on our current business activity as an internet service provider that does not own or control website content posted by our customers, we generally are not liable for infringing content posted by our customers or other third parties, provided that we follow the procedures for handling copyright infringement claims set forth in the DMCA. Generally, if we receive a proper notice from, or on behalf, of a copyright owner alleging infringement of copyrighted material located on websites we host, and we fail to expeditiously remove or disable access to the allegedly infringing material or otherwise fail to meet the requirements of the safe harbor provided by the DMCA, the copyright owner may seek to impose liability on us. Technical mistakes in complying with the
27
Table of Contents
Index to Financial Statements
detailed DMCA take-down procedures, or if we fail to otherwise comply with the other requirements of the safe harbor, could subject us to liability for copyright infringement.
Although statutes and case law in the United States have generally shielded us from liability for customer activities to date, court rulings in pending or future litigation may narrow the scope of protection afforded us under these laws. In addition, laws governing these activities are unsettled in many international jurisdictions, or may prove difficult or impossible for us to comply with in some international jurisdictions. Also, notwithstanding the exculpatory language of these bodies of law, we may become involved in complaints and lawsuits which, even if ultimately resolved in our favor, add cost to our doing business and may divert management’s time and attention. Finally, other existing bodies of law, including the criminal laws of various states, may be deemed to apply or new statutes or regulations may be adopted in the future, any of which could expose us to further liability and increase our costs of doing business.
Additionally, our customers could use our platform or applications to store or process PII, including sensitive PII, without our knowledge of such storage or processing. In the event that our systems experience a data security incident, or an individual or entity accesses information without, or in excess of, proper authorization, we could be subject to data security incident notification laws, as described elsewhere, which may require prompt remediation and notification to individuals. If we are unaware of the data and information stored on our systems, we may be unable to appropriately comply with all legal obligations, and we may be exposed to governmental enforcement or prosecution actions, private litigation, fines and penalties or adverse publicity and these incidents could cause our customers to lose trust in us, which could harm our reputation and business.
Future acquisitions could disrupt our business and may divert management’s attention and if unsuccessful, harm our business.
We may choose to expand by making acquisitions that could be material to our business. To date, we have only completed one acquisition and our ability as an organization to successfully acquire and integrate technologies or businesses is unproven and limited. Acquisitions involve many risks, including the following:
| • | an acquisition may negatively affect our results of operations and financial condition because it may require us to incur charges or assume substantial debt or other liabilities, may cause adverse tax consequences or unfavorable accounting treatment, may expose us to claims and disputes by third parties, including intellectual property claims and disputes, or may not generate sufficient financial return to offset additional costs and expenses related to the acquisition; |
| • | we may encounter difficulties or unforeseen expenditures in integrating the business, technologies, products, personnel or operations of any company that we acquire, particularly if key personnel of the acquired company decide not to work for us; |
| • | an acquisition may disrupt our ongoing business, divert resources, increase our expenses and distract our management; |
| • | an acquisition may result in a delay or reduction of customer purchases for both us and the company we acquired due to customer uncertainty about continuity and effectiveness of service from either company; |
| • | we may encounter difficulties in, or may be unable to, successfully sell any acquired products; |
| • | an acquisition may involve the entry into geographic or business markets in which we have little or no prior experience or where competitors have stronger market positions; |
| • | challenges inherent in effectively managing an increased number of employees in diverse locations; |
| • | the potential strain on our financial and managerial controls and reporting systems and procedures; |
| • | potential known and unknown liabilities associated with an acquired company; |
| • | our use of cash to pay for acquisitions would limit other potential uses for our cash; |
28
Table of Contents
Index to Financial Statements
| • | if we incur debt to fund such acquisitions, such debt may subject us to material restrictions on our ability to conduct our business as well as financial maintenance covenants; |
| • | the risk of impairment charges related to potential write-downs of acquired assets or goodwill in future acquisitions; |
| • | to the extent that we issue a significant amount of equity or equity-linked securities in connection with future acquisitions, existing stockholders may be diluted and earnings per share may decrease; and |
| • | managing the varying intellectual property protection strategies and other activities of an acquired company. |
We may not succeed in addressing these or other risks or any other problems encountered in connection with the integration of any acquired business. The inability to integrate successfully the business, technologies, products, personnel or operations of any acquired business, or any significant delay in achieving integration, could harm our business and operating results.
Our ability to raise capital in the future may be limited, and if we fail to raise capital when needed, we could be prevented from growing.
Our business and operations may consume resources faster than we anticipate. While we believe our cash and cash equivalents, cash flows from operations and available borrowings under our credit facility will be sufficient to support our planned operations for at least the next 12 months, in the future, we may need to raise additional funds to invest in future growth opportunities. Additional financing may not be available on favorable terms, if at all. If adequate funds are not available on acceptable terms, we may be unable to invest in future growth opportunities, which could harm our business and operating results. If we incur debt, the debt holders would have rights senior to common stockholders to make claims on our assets. In addition, our credit facility imposes, and future debt instruments may impose, restrictions on our ability to dispose property, make changes in our business, engage in mergers or acquisitions, incur additional indebtedness, and make investments and distributions. Furthermore, if we issue additional equity securities, stockholders will experience dilution, and the new equity securities could have rights senior to those of our common stock. Because our decision to issue securities in any future offering will depend on market conditions and other factors beyond our control, we cannot predict or estimate the amount, timing or nature of our future offerings. As a result, stockholders bear the risk that future securities offerings reduce the market price of our common stock and dilute their interest.
We may be subject to additional obligations to collect and remit sales tax and other taxes, and we may be subject to tax liability for past sales, which could harm our business.
State, local and foreign jurisdictions have differing rules and regulations governing sales, use, value added and other taxes, and these rules and regulations are subject to varying interpretations that may change over time. In particular, the applicability of such taxes to our learning management software in various jurisdictions is unclear. Further, these jurisdictions’ rules regarding tax nexus are complex and vary significantly. As a result, we could face the possibility of tax assessments and audits, and our liability for these taxes and associated penalties could exceed our original estimates. A successful assertion that we should be collecting additional sales, use, value added or other taxes in those jurisdictions where we have not historically done so and do not accrue for such taxes could result in substantial tax liabilities and related penalties for past sales, discourage customers from purchasing our application or otherwise harm our business and operating results.
Changes in tax laws or regulations that are applied adversely to us or our customers could increase the costs of learning management software and adversely impact our business.
New income, sales, use or other tax laws, statutes, rules, regulations or ordinances could be enacted at any time. Any new taxes could adversely affect our domestic and international business operations, and our business and financial performance. Further, existing tax laws, statutes, rules, regulations or ordinances could be
29
Table of Contents
Index to Financial Statements
interpreted, changed, modified or applied adversely to us. These events could require us or our customers to pay additional tax amounts on a prospective or retroactive basis, as well as require us or our customers to pay fines or penalties and interest for past amounts deemed to be due. If we raise our prices to offset the costs of these changes, existing and potential future customers may elect not to continue or purchase our learning management platform or applications in the future. Additionally, new, changed, modified or newly interpreted or applied tax laws could increase our customers’ and our compliance, operating and other costs, as well as the costs of our software. Any or all of these events could harm our business and operating results.
We are a multinational organization faced with increasingly complex tax issues in many jurisdictions, and we could be obligated to pay additional taxes in various jurisdictions.
As a multinational organization, we may be subject to taxation in several jurisdictions around the world with increasingly complex tax laws, the application of which can be uncertain. The amount of taxes we pay in these jurisdictions could increase substantially as a result of changes in the applicable tax principles, including increased tax rates, new tax laws or revised interpretations of existing tax laws and precedents, which could harm our liquidity and operating results. In addition, the authorities in these jurisdictions could review our tax returns and impose additional tax, interest and penalties, and the authorities could claim that various withholding requirements apply to us or our subsidiaries or assert that benefits of tax treaties are not available to us or our subsidiaries, any of which could adversely affect our operating results.
Risks Related to Our Common Stock
There has been no prior market for our common stock and an active market may not develop or be sustained, and you may not be able to resell your shares at or above the initial public offering price, if at all.
Prior to this offering, there has been no public market for our common stock. The initial public offering price for our common stock will be determined through negotiations between the underwriters and us and may vary from the market price of our common stock following this offering. If you purchase shares of our common stock in this offering, you may not be able to resell those shares at or above the initial public offering price. An active or liquid market in our common stock may not develop upon closing of this offering or, if it does develop, it may not be sustainable, which could adversely affect your ability to sell your shares and could depress the market price of our common stock.
Our stock price may be volatile and may decline regardless of our operating performance.
Our stock price is likely to be volatile. The trading prices of the securities of technology companies, including providers of cloud-based software, have been highly volatile. As a result of this volatility, investors may not be able to sell their common stock at or above the initial public offering price. The market price of our common stock may fluctuate significantly in response to numerous factors, many of which are beyond our control, including:
| • | actual or anticipated fluctuations in our revenue and other operating results, including as a result of the addition or loss of any number of customers; |
| • | announcements by us or our competitors of significant technical innovations, acquisitions, strategic partnerships, joint ventures or capital commitments; |
| • | the financial projections we may provide to the public, any changes in these projections or our failure to meet these projections; |
| • | failure of securities analysts to initiate or maintain coverage of us, changes in ratings and financial estimates and the publication of other news by any securities analysts who follow our company, or our failure to meet these estimates or the expectations of investors; |
30
Table of Contents
Index to Financial Statements
| • | changes in operating performance and stock market valuations of cloud-based software or other technology companies, or those in our industry in particular; |
| • | the size of our public float; |
| • | price and volume fluctuations in the trading of our common stock and in the overall stock market, including as a result of trends in the economy as a whole; |
| • | new laws or regulations or new interpretations of existing laws or regulations applicable to our business or industry, including data privacy and data security; |
| • | lawsuits threatened or filed against us for claims relating to intellectual property, employment issues or otherwise; |
| • | changes in our board of directors or management; |
| • | short sales, hedging and other derivative transactions involving our common stock; |
| • | sales of large blocks of our common stock including sales by our executive officers, directors and significant stockholders; and |
| • | other events or factors, including changes in general economic, industry and market conditions and trends, as well as any natural disasters that may affect our operations. |
In addition, the stock markets have experienced extreme price and volume fluctuations that have affected and continue to affect the market prices of equity securities of many technology companies. Stock prices of many technology companies have fluctuated in a manner unrelated or disproportionate to the operating performance of those companies.
In the past, stockholders have instituted securities class action litigation following periods of market volatility. If we were to become involved in securities litigation, it could subject us to substantial costs, divert resources and the attention of management and harm our business.
Future sales of shares by existing stockholders could cause our stock price to decline.
Sales of a substantial number of shares of our common stock in the public market could occur at any time. If our stockholders sell, or the market perceives that our stockholders intend to sell, substantial amounts of our common stock in the public market following this offering, the market price of our common stock could decline.
Immediately after this offering, based on the number of shares outstanding as of September 30, 2015, we will have 26,388,514 outstanding shares (assuming a conversion ratio equal to approximately 1.2895 shares of common stock for each share of Series E preferred stock based on an assumed initial public offering price of $17.00 per share, the midpoint of the price range set forth on the cover page of this prospectus) of common stock, assuming no exercise of outstanding options or warrants. Of these shares, the 4,400,000 shares sold in this offering will be immediately freely tradable, unless held by an affiliate, and all of the remaining shares of common stock will be restricted as a result of securities laws or lock-up agreements but will be able to be sold after the offering as described in the section of this prospectus titled “Shares Eligible for Future Sale.”
In addition, in connection with this offering, we intend to file one or more registration statements on Form S-8 registering the issuance of all of the shares of common stock subject to options or other equity awards issued or reserved for future issuance under our equity incentive plans. Shares registered under these registration statements on Form S-8 will be available for sale in the public market subject to vesting arrangements and exercise of options, the lock-up agreements described above and the restrictions of Rule 144 under the Securities Act in the case of our affiliates.
31
Table of Contents
Index to Financial Statements
Moreover, after this offering, the holders of 18,692,752 shares of common stock (assuming a conversion ratio equal to approximately 1.2895 shares of common stock for each share of Series E preferred stock based on an assumed initial public offering price of $17.00 per share, the midpoint of the price range set forth on the cover page of this prospectus) will have rights, subject to some conditions, to require us to file one or more registration statements covering their shares or to include their shares in registration statements that we may file for ourselves or other stockholders. If we were to register these shares for resale, they could be freely sold in the public market. If these additional shares are sold, or if it is perceived that they will be sold, in the public market, the market price of our common stock could decline.
The concentration of our stock ownership will likely limit your ability to influence corporate matters, including the ability to influence the outcome of director elections and other matters requiring stockholder approval.
Based upon shares outstanding as of September 30, 2015 prior to this offering, our executive officers, directors and the holders of more than 5% of our outstanding common stock, in the aggregate, beneficially owned approximately 87.8% of our common stock, and upon the closing of this offering, that same group, in the aggregate, will beneficially own approximately 73.3% of our common stock, assuming no exercise by the underwriters of their over-allotment option, no exercise of outstanding options or warrants, and after giving effect to the issuance of shares in this offering. Entities affiliated with Insight Venture Partners, an existing stockholder, have indicated an interest in purchasing up to an aggregate of $15 million of shares of our common stock in this offering at the initial public offering price. In addition, certain of our directors and executive officers have indicated an interest in purchasing up to an aggregate of approximately $3.2 million of shares of our common stock in this offering at the initial public offering price. If these parties purchase all such shares of common stock in this offering at an assumed initial public offering price of $17.00 per share, the aggregate beneficial ownership of these parties would increase by approximately 4.0%. As a result, these stockholders, acting together, will have significant influence over all matters that require approval by our stockholders, including the election of directors and approval of significant corporate transactions. Corporate actions might be taken even if other stockholders, including those who purchase shares in this offering, oppose them. This concentration of ownership might also have the effect of delaying or preventing a change of control of our company that other stockholders may view as beneficial.
If securities or industry analysts do not publish research or reports about our business, or if they downgrade our common stock, the price of our common stock could decline.
The trading market for our common stock depends, in part, on the research and reports that securities or industry analysts publish about us or our business. We do not have any control over these analysts. If one or more of the analysts who cover us downgrade our stock or publish inaccurate or unfavorable research about our business, our stock price would likely decline. In addition, if our operating results fail to meet the forecast of analysts, our stock price would likely decline. If one or more of these analysts cease coverage of our company or fail to publish reports on us regularly, demand for our common stock could decrease, which might cause our stock price and trading volume to decline.
Our management will have broad discretion over the use of the proceeds we receive in this offering and might not apply the proceeds in ways that increase the value of your investment.
Our management will have broad discretion to use the net proceeds from this offering and you will be relying on the judgment of our management regarding the application of these proceeds. Our management might not apply the net proceeds in ways that increase the value of your investment. We intend to use the net proceeds for general corporate purposes, including working capital, sales and marketing activities, research and development activities, general and administrative matters and capital expenditures. We may also use a portion of the net proceeds from this offering for acquisitions of, or investments in, technologies, solutions or businesses that complement our business, although we have no present commitments or agreements to enter into any such acquisitions or investments. Until we use the net proceeds from this offering, we plan to invest them, and these
32
Table of Contents
Index to Financial Statements
investments may not yield a favorable rate of return. If we do not invest or apply the net proceeds from this offering in ways that enhance stockholder value, we may fail to achieve expected financial results, which could cause our stock price to decline.
We are an “emerging growth company” and the reduced disclosure requirements applicable to emerging growth companies may make our common stock less attractive to investors.
We are an “emerging growth company,” as defined in the JOBS Act, and we may take advantage of certain exemptions from various reporting requirements that are applicable to other public companies that are not “emerging growth companies” including, but not limited to, not being required to comply with the auditor attestation requirements of Section 404 of the Sarbanes-Oxley Act, reduced financial disclosure obligations, reduced disclosure obligations regarding executive compensation in our periodic reports and proxy statements, and exemptions from the requirements of holding a nonbinding advisory vote on executive compensation and any golden parachute payments not previously approved. As an “emerging growth company” under the JOBS Act, we are permitted to delay the adoption of new or revised accounting pronouncements applicable to public companies until such pronouncements are made applicable to private companies. However, we are electing not to take advantage of such extended transition period, and as a result, we will comply with new or revised accounting standards on the relevant dates on which adoption of such standards is required for non-emerging growth companies. Section 107 of the JOBS Act provides that our decision to not take advantage of the extended transition period for complying with new or revised accounting standards is irrevocable.
We may take advantage of these provisions until we are no longer an “emerging growth company.” We would cease to be an “emerging growth company” upon the earliest to occur of: the last day of the fiscal year in which we have more than $1.0 billion in annual revenue; the date we qualify as a “large accelerated filer,” with at least $700 million of equity securities held by non-affiliates; the issuance, in any three-year period, by us of more than $1.0 billion in non-convertible debt securities; and the last day of the fiscal year ending after the fifth anniversary of this offering. If we take advantage of any of these reduced reporting burdens in future filings, the information that we provide our security holders may be different than you might get from other public companies in which you hold equity interests. We cannot predict if investors will find our common stock less attractive because we may rely on these exemptions. If some investors find our common stock less attractive as a result, there may be a less active trading market for our common stock and our stock price may be more volatile.
We will incur increased costs and demands upon management as a result of complying with the laws and regulations affecting public companies, particularly after we are no longer an “emerging growth company,” which could adversely affect our business, operating results and financial condition.
As a public company, and particularly after we cease to be an “emerging growth company,” we will incur greater legal, accounting and other expenses than we incurred as a private company. We are subject to the reporting requirements of the Securities Exchange Act of 1934, as amended, or the Exchange Act, the Sarbanes-Oxley Act of 2002, or the Sarbanes-Oxley Act, the Dodd-Frank Wall Street Reform and Consumer Protection Act, or the Dodd-Frank Act, and the rules and regulations of the New York Stock Exchange, or NYSE. These requirements have increased and will continue to increase our legal, accounting and financial compliance costs and have made and will continue to make some activities more time consuming and costly. For example, we expect these rules and regulations to make it more difficult and more expensive for us to obtain director and officer liability insurance, and we may be required to accept reduced policy limits and coverage or incur substantially higher costs to maintain the same or similar coverage. As a result, it may be more difficult for us to attract and retain qualified individuals to serve on our board of directors or as our executive officers. After we are no longer an emerging growth company, or sooner if we choose not to take advantage of certain exemptions set forth in the JOBS Act, we expect to incur significant expenses and devote substantial management effort toward ensuring compliance with the auditor attestation requirements of Section 404 of the Sarbanes-Oxley Act. In that regard, we will need to hire additional accounting and financial staff with appropriate public company experience and technical accounting knowledge.
33
Table of Contents
Index to Financial Statements
If we do not continue to develop effective internal controls, we may not be able to accurately report our financial results and our business could be harmed.
We and our independent registered public accounting firm identified a material weakness in our internal control over financial reporting as of and for the years ended December 31, 2012 and 2013. A material weakness is a deficiency, or combination of control deficiencies, in internal control over financial reporting, such that there is a reasonable possibility that a material misstatement of the annual or interim consolidated financial statements will not be prevented or detected on a timely basis. Specifically, it was determined that we did not have adequate processes and resources to evaluate significant or unusual transactions. As a result, we were required to make post-closing adjustments to record stock-based compensation and deemed dividends, resulting from the sale of stock by current and former employees and an investor to other holders of preferred stock for a price that exceeded the fair value. Furthermore, we were required to make post-closing adjustments to record leasehold improvements and lease incentives that were improperly netted on the balance sheets.
We subsequently took steps to remediate this material weakness, including increasing the depth and experience within our accounting and finance organization, designing and implementing improved processes and internal controls, and retaining outside consultants with deep technical expertise. While we believe that we have remediated the material weakness as of December 31, 2014, and did not identify any material weaknesses in the course of preparing our consolidated financial statements as of and for the year ended December 31, 2014, our efforts to remediate may not be effective or prevent any future material weakness or significant deficiency in our internal control over financial reporting.
The Sarbanes-Oxley Act requires, among other things, that we assess the effectiveness of our internal control over financial reporting annually and the effectiveness of our disclosure controls and procedures quarterly. In particular, beginning in 2016, Section 404 of the Sarbanes-Oxley Act, or Section 404, will require us to perform system and process evaluation and testing of our internal control over financial reporting to allow management to report on, and our independent registered public accounting firm potentially to attest to, the effectiveness of our internal control over financial reporting. As an emerging growth company, we expect to avail ourselves of the exemption from the requirement that our independent registered public accounting firm attest to the effectiveness of our internal control over financial reporting under Section 404. However, we may no longer avail ourselves of this exemption when we cease to be an emerging growth company. When our independent registered public accounting firm is required to undertake an assessment of our internal control over financial reporting, the cost of our compliance with Section 404 will correspondingly increase. Our compliance with applicable provisions of Section 404 will require that we incur substantial accounting expense and expend significant management time on compliance-related issues as we implement additional corporate governance practices and comply with reporting requirements. Moreover, if we are not able to comply with the requirements of Section 404 applicable to us in a timely manner, or if we or our independent registered public accounting firm identifies deficiencies in our internal control over financial reporting that are deemed to be material weaknesses, the market price of our stock could decline and we could be subject to sanctions or investigations by the SEC or other regulatory authorities, which would require additional financial and management resources.
Investor perceptions of our company may suffer if material weaknesses are found, and this could cause a decline in the market price of our common stock. Irrespective of compliance with Section 404, any failure of our internal control over financial reporting could harm our operating results and reputation. If we are unable to implement these requirements effectively or efficiently, it could harm our operations, financial reporting, or financial results and could result in an adverse opinion on our internal controls from our independent registered public accounting firm.
34
Table of Contents
Index to Financial Statements
Provisions in our amended and restated certificate of incorporation and amended and restated bylaws and under Delaware law might discourage, delay or prevent a change of control of our company or changes in our management and, therefore, depress the trading price of our common stock.
Our amended and restated certificate of incorporation and amended and restated bylaws contain provisions that could depress the trading price of our common stock by acting to discourage, delay or prevent a change of control of our company or changes in our management that the stockholders of our company may deem advantageous. These provisions:
| • | authorize the issuance of “blank check” preferred stock that our board of directors could issue to increase the number of outstanding shares to discourage a takeover attempt; |
| • | prohibit stockholder action by written consent, which requires all stockholder actions to be taken at a meeting of our stockholders; |
| • | prohibit stockholders from calling a special meeting of our stockholders; |
| • | provide that the board of directors is expressly authorized to make, alter or repeal our bylaws; and |
| • | establish advance notice requirements for nominations for elections to our board of directors or for proposing matters that can be acted upon by stockholders at stockholder meetings. |
Additionally, we are subject to Section 203 of the Delaware General Corporation Law, which generally prohibits a Delaware corporation from engaging in any of a broad range of business combinations with any “interested” stockholder for a period of three years following the date on which the stockholder became an “interested” stockholder and which may discourage, delay or prevent a change of control of our company.
Any provision of our amended and restated certificate of incorporation, bylaws or Delaware law that has the effect of delaying or deterring a change in control could limit the opportunity for our stockholders to receive a premium for their shares of our common stock, and could also affect the price that some investors are willing to pay for our common stock.
Our amended and restated certificate of incorporation will provide that the Court of Chancery of the State of Delaware will be the exclusive forum for substantially all disputes between us and our stockholders, which could limit our stockholders’ ability to obtain a favorable judicial forum for disputes with us or our directors, officers or employees.
Our amended and restated certificate of incorporation provides that the Court of Chancery of the State of Delaware is the exclusive forum for: any derivative action or proceeding brought on our behalf; any action asserting a breach of fiduciary duty; any action asserting a claim against us arising pursuant to the Delaware General Corporation Law, our amended and restated certificate of incorporation or our bylaws; or any action asserting a claim against us that is governed by the internal affairs doctrine. The choice of forum provision may limit a stockholder’s ability to bring a claim in a judicial forum that it finds favorable for disputes with us or our directors, officers or other employees, which may discourage such lawsuits against us and our directors, officer and other employees. If a court were to find the choice of forum provision contained in our amended and restated certificate of incorporation to be inapplicable or unenforceable in an action, we may incur additional costs associated with resolving such action in other jurisdictions, which could harm our business and financial condition.
35
Table of Contents
Index to Financial Statements
SPECIAL NOTE REGARDING FORWARD-LOOKING STATEMENTS
This prospectus contains forward-looking statements that involve substantial risks and uncertainties. All statements other than statements of historical facts contained in this prospectus, including statements regarding our future financial condition, business strategy and plans and objectives of management for future operations, are forward-looking statements. In some cases, you can identify forward-looking statements by terminology such as “anticipate,” “believe,” “continue,” “could,” “design,” “estimate,” “expect,” “intend,” “may,” “plan,” “potentially,” “predict,” “project,” “should,” “will” or the negative of these terms or other similar expressions.
We have based these forward-looking statements largely on our current expectations and projections about future events and financial trends that we believe may affect our financial condition, results of operations, business strategy and financial needs. These forward-looking statements are subject to a number of risks, uncertainties and assumptions described in the section titled “Risk Factors.” These risks are not exhaustive. Other sections of this prospectus include additional factors that could adversely impact our business and financial performance. Moreover, we operate in a very competitive and rapidly changing environment. New risk factors emerge from time to time, and it is not possible for our management to predict all risk factors nor can we assess the impact of all factors on our business or the extent to which any factor, or combination of factors, may cause actual results to differ materially from those contained in, or implied by, any forward-looking statements.
These forward-looking statements include, but are not limited to, statements concerning the following:
| • | our ability to grow and retain our customer base, both domestically and internationally; |
| • | our ability to provide effective customer support and induce our customers to renew and upgrade their subscriptions; |
| • | our ability to expand our sales organization to address effectively the new industries, geographies and types of organizations we intend to target; |
| • | our ability to forecast and maintain an adequate rate of revenue growth and appropriately plan our expenses; |
| • | our ability to displace existing products addressing learning management applications, along with continued acceptance of SaaS as an effective method for delivering our applications; |
| • | the effects of seasonal and cyclical trends on our results of operations; |
| • | the attraction and retention of qualified employees and key personnel; |
| • | our ability to protect and enhance our brands and intellectual property; |
| • | costs related to defending intellectual property infringement and other claims; |
| • | the effects of increased competition and alternatives to our platform and applications and our ability to successfully differentiate our platform and applications; |
| • | our expectations concerning our relationships and actions with third parties; |
| • | future regulatory, judicial and legislative changes in our industry; and |
| • | future arrangements with, or investments in, other entities or associations, products, services or technologies. |
You should not rely upon forward-looking statements as predictions of future events. We cannot assure you that the events and circumstances reflected in the forward-looking statements will be achieved or occur. Although we believe that the expectations reflected in the forward-looking statements are reasonable, we cannot guarantee future results, levels of activity, performance or achievements. Except as required by law, we undertake no obligation to update publicly any forward-looking statements for any reason after the date of this prospectus or to conform these statements to actual results or to changes in our expectations.
36
Table of Contents
Index to Financial Statements
In addition, statements that “we believe” and similar statements reflect our beliefs and opinions on the relevant subject. These statements are based upon information available to us as of the date of this prospectus, and while we believe such information forms a reasonable basis for such statements, such information may be limited or incomplete, and our statements should not be read to indicate that we have conducted an exhaustive inquiry into, or review of, all potentially available relevant information. These statements are inherently uncertain and investors are cautioned not to unduly rely upon these statements.
You should read this prospectus and the documents that we reference in this prospectus and have filed as exhibits to the registration statement of which this prospectus forms a part with the understanding that our actual future results, levels of activity, performance and achievements may be materially different from what we expect. We qualify all of our forward-looking statements by these cautionary statements.
37
Table of Contents
Index to Financial Statements
Unless otherwise indicated, information contained in this prospectus concerning our industry and the market in which we operate, including our general expectations and market position, market opportunity and market size, is based on information from various sources including the independent industry publications set forth below, and is subject to a number of assumptions and limitations. Although we are responsible for all of the disclosure contained in this prospectus and we believe the information from the industry publication and other third-party sources included in this prospectus is reliable, such information is inherently imprecise. The content of the below sources, except to the extent specifically set forth in this prospectus, does not constitute a portion of this prospectus and are not incorporated herein.
| • | ECAR The Current Ecosystem of Learning Management Systems in Higher Education: Student, Faculty, and IT Perspectives (September 2014) |
| • | IDC Worldwide and U.S. Human Capital Management Applications 2015-2019 Forecast (June 2015) |
| • | MarketsandMarkets Learning Management Systems (LMS) Market: Worldwide Market Forecasts and Analysis (2013-2018) (October 2013) |
| • | Brandon Hall Group LMS Trends 2014: Satisfaction and Spending (February 2014) |
The industry in which we operate is subject to a high degree of uncertainty and risk due to a variety of factors, including those described in the section titled “Risk Factors” and elsewhere in this prospectus. These and other factors could cause results to differ materially from those expressed in the estimates made by the independent parties and by us.
38
Table of Contents
Index to Financial Statements
We estimate that the net proceeds from the sale of 4,400,000 shares of common stock in this offering will be approximately $66.4 million, based on an assumed initial public offering price of $17.00 per share, the midpoint of the price range set forth on the cover page of this prospectus, after deducting underwriting discounts and commissions and estimated offering expenses payable by us. If the underwriters exercise in full their over-allotment option to purchase additional shares, we estimate that the net proceeds will be approximately $76.8 million, after deducting underwriting discounts and commissions and estimated offering expenses payable by us.
Each $1.00 increase (decrease) in the assumed initial public offering price of $17.00 per share would increase (decrease) our net proceeds by $4.1 million, assuming the number of shares offered by us, as set forth on the cover page of this prospectus, remains the same, after deducting underwriting discounts and commissions and estimated offering expenses payable by us. Each increase (decrease) by 1,000,000 shares in the number of shares offered by us would increase (decrease) the net proceeds from this offering by $15.8 million, assuming the assumed initial public offering price remains the same, after deducting underwriting discounts and commissions.
The principal purposes of this offering are to increase our capitalization and financial flexibility, increase our visibility in the marketplace and create a public market for our common stock. As of the date of this prospectus, we cannot specify with certainty all of the particular uses for the net proceeds to us from this offering. However, we currently intend to use the net proceeds to us from this offering primarily for general corporate purposes, including working capital, sales and marketing activities, research and development activities, general and administrative matters and capital expenditures. We expect to use a significant portion of the net proceeds from this offering to fund the expansion of our business, including expanding our direct sales organization and marketing programs, particularly for corporate customers, and making investments in our research and development teams to support the development of new applications and new features for, and enhancements of, our existing applications. We may also use a portion of the net proceeds from this offering for the acquisition of, or investment in, technologies, solutions or businesses that complement our business, although we have no present commitments or agreements to enter into any such acquisitions or investments. We will have broad discretion over the uses of the net proceeds from this offering and investors will be relying on the judgment of our management regarding the application of the net proceeds from this offering. Pending these uses, we plan to invest the net proceeds that we receive in this offering in short-term and intermediate-term interest-bearing obligations, investment-grade investments, certificates of deposit, or direct or guaranteed obligations of the U.S. government.
We have never declared or paid cash dividends on our capital stock. We intend to retain all available funds and future earnings, if any, to fund the development and expansion of our business and we do not anticipate paying any cash dividends in the foreseeable future. The terms of our credit facility also restrict our ability to pay dividends, and we may also enter into debt instruments in the future that will restrict our ability to declare or pay cash dividends on our common stock. Any future determination related to dividend policy will be made at the discretion of our board of directors and will be dependent on a number of factors, including our earnings, capital requirements and overall financial condition.
39
Table of Contents
Index to Financial Statements
The following table sets forth our cash and cash equivalents and capitalization as of September 30, 2015:
| • | on an actual basis; |
| • | on a pro forma basis, to reflect (1) the conversion of all outstanding shares of our preferred stock into an aggregate of 15,505,330 shares of common stock upon the closing of this offering and (2) the filing and effectiveness of our amended and restated certificate of incorporation; and |
| • | on a pro forma as adjusted basis, to further reflect the sale by us of 4,400,000 shares of common stock in this offering at an assumed initial public offering price of $17.00 per share, the midpoint of the price range set forth on the cover page of this prospectus, after deducting underwriting discounts and commissions and estimated offering expenses payable by us. |
You should read the information in this table together with our consolidated financial statements and related notes included elsewhere in this prospectus and the sections titled “Selected Consolidated Financial Data,” and “Management’s Discussion and Analysis of Financial Condition and Results of Operations.”
| As of September 30, 2015 | ||||||||||||
| Actual | Pro Forma |
Pro Forma As Adjusted(1) |
||||||||||
| (unaudited) | ||||||||||||
| (in thousands, except share and per share data) |
||||||||||||
| Cash and cash equivalents |
$ | 31,770 | $ | 31,770 | $ | 98,134 | ||||||
|
|
|
|
|
|
|
|||||||
| Redeemable convertible preferred stock, $0.0001 par value: 15,086,624 shares authorized and 14,977,124 shares issued and outstanding, actual; no shares authorized, issued or outstanding, pro forma and pro forma as adjusted |
$ | 93,770 | $ | — | $ | — | ||||||
| Stockholders’ (deficit) equity: |
||||||||||||
| Preferred stock, $0.0001 par value: no shares authorized, issued or outstanding, actual; and 10,000,000 shares authorized and no shares issued or outstanding, pro forma and pro forma as adjusted |
— | — | — | |||||||||
| Common stock, $0.0001 par value: 26,600,000 shares authorized, 7,611,656 shares issued and 6,483,184 shares outstanding, actual; 26,600,000 shares authorized and 23,116,986 shares issued and 21,988,514 shares outstanding, pro forma; and 200,000,000 shares authorized and 27,516,986 shares issued and 26,388,514 shares outstanding, pro forma as adjusted(2) |
1 | 2 | 3 | |||||||||
| Treasury stock, 1,128,472 common shares, at cost |
(1 | ) | (1 | ) | (1 | ) | ||||||
| Additional paid-in capital(2) |
21,745 | 115,514 | 181,877 | |||||||||
| Accumulated other comprehensive income |
(1 | ) | (1 | ) | (1 | ) | ||||||
| Accumulated deficit |
(130,779 | ) | (130,779 | ) | (130,779 | ) | ||||||
|
|
|
|
|
|
|
|||||||
| Total stockholders’ (deficit) equity |
(109,035 | ) | (15,265 | ) | 51,099 | |||||||
|
|
|
|
|
|
|
|||||||
| Total capitalization |
$ | (15,265 | ) | $ | (15,265 | ) | $ | 51,099 | ||||
|
|
|
|
|
|
|
|||||||
| (1) | Each $1.00 increase (decrease) in the assumed initial public offering price of $17.00 per share, the midpoint of the price range set forth on the cover page of this prospectus, would increase (decrease) each of cash and cash equivalents, additional paid-in capital, total stockholders’ (deficit) equity and total capitalization by $4.1 million, assuming that the number of shares offered by us, as set forth on the cover page of this prospectus, remains the same, after deducting underwriting discounts and commissions and estimated offering expenses payable by us. We may also increase or decrease the number of shares we are offering. Each increase (decrease) of 1,000,000 shares in the number of shares offered by us would increase (decrease) cash and cash equivalents, additional paid-in capital, total stockholders’ (deficit) equity and total capitalization by $15.8 million, assuming the assumed initial public offering price remains the |
40
Table of Contents
Index to Financial Statements
| same, after deducting underwriting discounts and commissions. The pro forma as adjusted information discussed above is illustrative only and will be adjusted based on the actual initial public offering price and other terms of this offering determined at pricing. |
| (2) | The number of shares of our common stock to be issued upon the conversion of all outstanding shares of our Series E preferred stock depends in part on the initial public offering price of our common stock. The terms of our Series E preferred stock provide that the ratio at which each share will convert into shares of our common stock in connection with this offering will increase if the initial public offering price is below $21.921 per share. Based upon an assumed initial public offering price of $17.00 per share, the midpoint of the price range set forth on the cover page of this prospectus, the outstanding shares of our Series E preferred stock will convert into an aggregate of 2,352,938 shares of our common stock upon the closing of this offering. See the section titled “Prospectus Summary—Offering” for further discussion. |
The number of shares of common stock to be outstanding after this offering is based on 21,988,514 shares of common stock outstanding as of September 30, 2015, and excludes:
| • | 3,909,871 shares of common stock issuable upon the exercise of outstanding stock options as of September 30, 2015, with a weighted-average exercise price of $5.95 per share; |
| • | 103,332 shares of common stock issuable upon the exercise of outstanding warrants as of September 30, 2015, with a weighted-average exercise price of $2.11 per share; |
| • | 373,985 shares of common stock reserved for future issuance under our 2010 Equity Incentive Plan as of September 30, 2015, of which stock options to purchase an aggregate of 313,661 shares of common stock were granted subsequent to September 30, 2015, with an exercise price of $14.25 per share; all shares reserved for future issuance and not subject to an outstanding stock option will cease to be available for issuance at the time our 2015 Equity Incentive Plan becomes effective in connection with this offering; |
| • | 2,000,000 shares of common stock reserved for future issuance under our 2015 Equity Incentive Plan, as well as any automatic increases in the number of shares of common stock reserved for future issuance under this plan, which will become effective upon the execution of the underwriting agreement for this offering; and |
| • | 333,333 shares of common stock reserved for future issuance under our 2015 Employee Stock Purchase Plan, as well as any automatic increases in the number of shares of common stock reserved for future issuance under this benefit plan, which will become effective upon the execution of the underwriting agreement for this offering. |
41
Table of Contents
Index to Financial Statements
If you invest in our common stock in this offering, your interest will be diluted to the extent of the difference between the initial public offering price per share of common stock and the pro forma as adjusted net tangible book value per share of our common stock after the closing of the offering.
Our pro forma net tangible book value as of September 30, 2015 was $(16.8) million, or $(0.76) per share, which gives effect to the conversion of all outstanding shares of our preferred stock into an aggregate of 15,505,330 shares of common stock upon the closing of this offering (assuming a conversion ratio equal to approximately 1.2895 shares of common stock for each share of Series E preferred stock based on an assumed initial public offering price of $17.00 per share, the midpoint of the price range set forth on the cover page of this prospectus). Pro forma net tangible book value per share is determined by subtracting our total liabilities from the total book value of our tangible assets and dividing the difference by the number of shares of common stock deemed to be outstanding at that date.
After giving effect to the sale of 4,400,000 shares of common stock in this offering at an assumed initial public offering price of $17.00 per share, the midpoint of the price range set forth on the cover page of this prospectus, after deducting underwriting discounts and commissions and estimated offering expenses payable by us, our pro forma as adjusted net tangible book value as of September 30, 2015, would have been $49.6 million, or $1.88 per share. This represents an immediate increase in pro forma as adjusted net tangible book value of $2.64 per share to our existing stockholders and immediate dilution of $15.12 per share to new investors purchasing common stock in this offering.
The following table illustrates this dilution on a per share basis to new investors:
| Assumed initial public offering price per share |
$ | 17.00 | ||||||
| Pro forma net tangible book value per share as of September 30, 2015 |
$ | (0.76 | ) | |||||
| Increase in pro forma net tangible book value per share attributable to new investors in this offering |
2.64 | |||||||
|
|
|
|||||||
| Pro forma as adjusted net tangible book value per share after this offering |
1.88 | |||||||
|
|
|
|||||||
| Dilution in net tangible book value per share to new investors in this offering |
$ | 15.12 | ||||||
|
|
|
Each $1.00 increase in the assumed initial public offering price of $17.00 per share would increase our pro forma as adjusted net tangible book value per share after this offering by $0.17 per share and the dilution to new investors by $0.83 per share, assuming the number of shares offered by us, as set forth on the cover page of this prospectus, remains the same and after deducting underwriting discounts and commissions and estimated offering expenses payable by us. Similarly, each $1.00 decrease in the assumed initial public offering price of $17.00 per share would decrease our pro forma as adjusted net tangible book value per share after this offering by $0.16 per share and the dilution to new investors by $0.84 per share, assuming the number of shares offered by us, as set forth on the cover page of this prospectus, remains the same and after deducting underwriting discounts and commissions and estimated offering expenses payable by us. Similarly, each increase of 1,000,000 shares in the number of shares of common stock offered by us would increase the pro forma as adjusted net tangible book value by $0.51 per share and decrease the dilution to new investors by $0.51 per share, assuming the assumed initial public offering price remains the same and after deducting underwriting discounts and commissions. Similarly, each decrease of 1,000,000 shares in the number of shares of common stock offered by us would decrease the pro forma as adjusted net tangible book value by $0.55 per share and increase the dilution to new investors by $0.55 per share, assuming the assumed initial public offering price remains the same and after deducting underwriting discounts and commissions.
If the underwriters’ option to purchase 660,000 additional shares to cover over-allotments is exercised in full, the pro forma as adjusted net tangible book value per share after giving effect to this offering would be $2.22 per share, representing an immediate increase to existing stockholders of $2.98 per share, and immediate dilution to new investors in this offering of $14.78 per share.
42
Table of Contents
Index to Financial Statements
The following table summarizes, as of September 30, 2015, on the pro forma as adjusted basis described above:
| • | the total number of shares of common stock purchased from us by our existing stockholders and by new investors purchasing shares in this offering; |
| • | the total consideration paid to us by our existing stockholders and by new investors purchasing common stock in this offering, assuming an initial public offering price of $17.00 per share, the midpoint of the range set forth on the cover page of this prospectus, before deducting underwriting discounts and commissions and estimated offering expenses payable by us in connection with this offering; and |
| • | the average price per share paid by existing stockholders and by new investors purchasing shares in this offering. |
| Shares Purchased | Total Consideration | Average Price Per Share |
||||||||||||||||||
| Number | Percent | Amount | Percent | |||||||||||||||||
| Existing stockholders |
21,988,514 | 83.3 | % | $ | 91,071,385 | 54.9 | % | $ | 4.14 | |||||||||||
| New investors |
4,400,000 | 16.7 | 74,800,000 | 45.1 | 17.00 | |||||||||||||||
|
|
|
|
|
|
|
|
|
|||||||||||||
| Total |
26,388,514 | 100.0 | % | $ | 165,871,385 | 100.0 | % | |||||||||||||
|
|
|
|
|
|
|
|
|
|||||||||||||
The tables and calculations above are based on 21,988,514 shares of common stock outstanding as of September 30, 2015, and exclude:
| • | 3,909,871 shares of common stock issuable upon the exercise of outstanding stock options as of September 30, 2015, with a weighted-average exercise price of $5.95 per share; |
| • | 103,332 shares of common stock issuable upon the exercise of outstanding warrants as of September 30, 2015, with a weighted-average exercise price of $2.11 per share; |
| • | 373,985 shares of common stock reserved for future issuance under our 2010 Equity Incentive Plan as of September 30, 2015, of which stock options to purchase an aggregate of 313,661 shares of common stock were granted subsequent to September 30, 2015, with an exercise price of $14.25 per share; all shares reserved for future issuance and not subject to an outstanding stock option will cease to be available for issuance at the time our 2015 Equity Incentive Plan becomes effective in connection with this offering; |
| • | 2,000,000 shares of common stock reserved for future issuance under our 2015 Equity Incentive Plan, as well as any automatic increases in the number of shares of common stock reserved for future issuance under this plan, which will become effective upon the execution of the underwriting agreement for this offering; and |
| • | 333,333 shares of common stock reserved for future issuance under our 2015 Employee Stock Purchase Plan, as well as any automatic increases in the number of shares of common stock reserved for future issuance under this plan, which will become effective upon the execution of the underwriting agreement for this offering. |
A $1.00 increase (decrease) in the assumed initial public offering price of $17.00 per share would increase (decrease) the total consideration paid to us by new investors by $4.1 million assuming the number of shares offered by us, as set forth on the cover page of this prospectus, remains the same and before deducting underwriting discounts and commissions and estimated expenses payable by us.
To the extent any outstanding options or warrants are exercised, new options are issued under our equity incentive plans, or we issue additional shares of common stock in the future, there will be further dilution to investors participating in this offering. If all outstanding options and warrants as of September 30, 2015 were exercised, then our existing stockholders, including the holders of these options and warrants, would own 85.5% and new investors would own 14.5% of the total number of shares of common stock outstanding upon the closing of this offering.
43
Table of Contents
Index to Financial Statements
SELECTED CONSOLIDATED FINANCIAL DATA
You should read the selected consolidated financial data below in conjunction with “Management’s Discussion and Analysis of Financial Condition and Results of Operations” and the consolidated financial statements, related notes and other financial information included elsewhere in this prospectus. The selected consolidated financial data in this section are not intended to replace the consolidated financial statements and are qualified in their entirety by the consolidated financial statements and related notes included elsewhere in this prospectus.
The following selected consolidated statements of operations data for the years ended December 31, 2013 and 2014 and the consolidated balance sheet data as of December 31, 2013 and 2014 have been derived from our audited consolidated financial statements included elsewhere in this prospectus. The consolidated statement of operations data for the year ended December 31, 2012 has been derived from our audited financial statements not included in this prospectus. The consolidated statements of operations data for the nine months ended September 30, 2014 and 2015 and the consolidated balance sheet data as of September 30, 2015 are derived from our unaudited interim consolidated financial statements included elsewhere in this prospectus. Our unaudited interim consolidated financial statements were prepared on a basis consistent with our audited consolidated financial statements and include, in our opinion, all adjustments, consisting only of normal recurring adjustments, that we consider necessary for a fair presentation of the financial information set forth in those statements included elsewhere in this prospectus. Our historical results are not necessarily indicative of the results that may be expected in the future.
| Year Ended December 31, | Nine Months Ended September 30, |
|||||||||||||||||||
| 2012 | 2013 | 2014 | 2014 | 2015 | ||||||||||||||||
| (unaudited) | ||||||||||||||||||||
| (in thousands, except per share data) | ||||||||||||||||||||
| Consolidated Statements of Operations Data: |
||||||||||||||||||||
| Revenue: |
||||||||||||||||||||
| Subscription and support |
$ | 7,403 | $ | 22,456 | $ | 38,093 | $ | 26,328 | $ | 43,557 | ||||||||||
| Professional services and other |
1,371 | 3,599 | 6,259 | 4,288 | 7,839 | |||||||||||||||
|
|
|
|
|
|
|
|
|
|
|
|||||||||||
| Total revenue |
8,774 | 26,055 | 44,352 | 30,616 | 51,396 | |||||||||||||||
|
|
|
|
|
|
|
|
|
|
|
|||||||||||
| Cost of revenue: |
||||||||||||||||||||
| Subscription and support(1)(2) |
4,346 | 8,581 | 12,131 | 8,331 | 12,520 | |||||||||||||||
| Professional services and other(1) |
2,748 | 2,039 | 2,982 | 1,979 | 4,717 | |||||||||||||||
|
|
|
|
|
|
|
|
|
|
|
|||||||||||
| Total cost of revenue |
7,094 | 10,620 | 15,113 | 10,310 | 17,237 | |||||||||||||||
|
|
|
|
|
|
|
|
|
|
|
|||||||||||
| Gross profit |
1,680 | 15,435 | 29,239 | 20,306 | 34,159 | |||||||||||||||
|
|
|
|
|
|
|
|
|
|
|
|||||||||||
| Operating expenses: |
||||||||||||||||||||
| Sales and marketing(1)(2) |
11,912 | 20,702 | 35,390 | 22,335 | 38,303 | |||||||||||||||
| Research and development(1)(2)(3) |
4,698 | 11,242 | 21,290 | 12,184 | 17,441 | |||||||||||||||
| General and administrative(1)(2) |
3,411 | 5,321 | 11,268 | 6,890 | 18,475 | |||||||||||||||
|
|
|
|
|
|
|
|
|
|
|
|||||||||||
| Total operating expenses |
20,021 | 37,265 | 67,948 | 41,409 | 74,219 | |||||||||||||||
|
|
|
|
|
|
|
|
|
|
|
|||||||||||
| Loss from operations |
(18,341 | ) | (21,830 | ) | (38,709 | ) | (21,103 | ) | (40,060 | ) | ||||||||||
|
|
|
|
|
|
|
|
|
|
|
|||||||||||
| Other income (expense): |
||||||||||||||||||||
| Interest income |
8 | 22 | 32 | 30 | 13 | |||||||||||||||
| Interest expense |
(7 | ) | (150 | ) | (136 | ) | (96 | ) | (72 | ) | ||||||||||
| Change in fair value of warrant liability |
(199 | ) | (545 | ) | (2,518 | ) | (2,219 | ) | (536 | ) | ||||||||||
| Other income (expense), net |
3 | 4 | (39 | ) | 12 | (161 | ) | |||||||||||||
|
|
|
|
|
|
|
|
|
|
|
|||||||||||
| Total other expense, net |
(195 | ) | (669 | ) | (2,661 | ) | (2,273 | ) | (756 | ) | ||||||||||
|
|
|
|
|
|
|
|
|
|
|
|||||||||||
| Loss before income taxes |
(18,536 | ) | (22,499 | ) | (41,370 | ) | (23,376 | ) | (40,816 | ) | ||||||||||
| Income tax expense |
— | — | (57 | ) | (7 | ) | (40 | ) | ||||||||||||
|
|
|
|
|
|
|
|
|
|
|
|||||||||||
| Net loss |
$ | (18,536 | ) | $ | (22,499 | ) | $ | (41,427 | ) | $ | (23,383 | ) | $ | (40,856 | ) | |||||
|
|
|
|
|
|
|
|
|
|
|
|||||||||||
44
Table of Contents
Index to Financial Statements
| Year Ended December 31, | Nine Months Ended September 30, |
|||||||||||||||||||
| 2012 | 2013 | 2014 | 2014 | 2015 | ||||||||||||||||
| (unaudited) | ||||||||||||||||||||
| (in thousands, except per share data) | ||||||||||||||||||||
| Deemed dividends to investors |
$ | — | $ | (353 | ) | $ | — | $ | — | $ | (632 | ) | ||||||||
|
|
|
|
|
|
|
|
|
|
|
|||||||||||
| Net loss attributable to common stockholders |
$ | (18,536 | ) | $ | (22,852 | ) | $ | (41,427 | ) | $ | (23,383 | ) | $ | (41,488 | ) | |||||
|
|
|
|
|
|
|
|
|
|
|
|||||||||||
| Net loss per common share attributable to common stockholders, basic and diluted(4) |
$ | (5.36 | ) | $ | (6.26 | ) | $ | (7.50 | ) | $ | (4.37 | ) | $ | (6.61 | ) | |||||
|
|
|
|
|
|
|
|
|
|
|
|||||||||||
| Weighted average common shares used in computing basic and diluted net loss per common share attributable to common stockholders(4) |
3,456 | 3,650 | 5,525 | 5,356 | 6,279 | |||||||||||||||
|
|
|
|
|
|
|
|
|
|
|
|||||||||||
| Pro forma net loss per common share attributable to common stockholders, basic and diluted (unaudited)(4) |
$ | (2.01 | ) | $ | (1.90 | ) | ||||||||||||||
|
|
|
|
|
|||||||||||||||||
| Pro forma weighted average common shares used in computing basic and diluted net loss per common share attributable to common stockholders (unaudited)(4) |
20,657 | 21,784 | ||||||||||||||||||
|
|
|
|
|
|||||||||||||||||
| (1) | Includes stock-based compensation as follows: |
| Year Ended December 31, |
Nine Months Ended September 30, |
|||||||||||||||||||
| 2012 | 2013 | 2014 | 2014 | 2015 | ||||||||||||||||
| (unaudited) | ||||||||||||||||||||
| (in thousands) | ||||||||||||||||||||
| Cost of revenue: |
||||||||||||||||||||
| Subscription and support |
$ | 7 | $ | 28 | $ | 258 | $ | 24 | $ | 106 | ||||||||||
| Professional services and other |
5 | 8 | 39 | 24 | 103 | |||||||||||||||
| Sales and marketing |
473 | 1,597 | 2,877 | 174 | 768 | |||||||||||||||
| Research and development |
442 | 1,585 | 3,971 | 307 | 871 | |||||||||||||||
| General and administrative |
910 | 374 | 1,053 | 327 | 5,851 | |||||||||||||||
|
|
|
|
|
|
|
|
|
|
|
|||||||||||
| Total stock-based compensation |
$ | 1,837 | $ | 3,592 | $ | 8,198 | $ | 856 | $ | 7,699 | ||||||||||
|
|
|
|
|
|
|
|
|
|
|
|||||||||||
| (2) | Includes payroll tax expense on secondary stock purchase transactions as follows: |
| Year Ended December 31, |
Nine Months Ended September 30, |
|||||||||||||||||||
| 2012 | 2013 | 2014 | 2014 | 2015 | ||||||||||||||||
| (unaudited) | ||||||||||||||||||||
| (in thousands) | ||||||||||||||||||||
| Cost of revenue: |
||||||||||||||||||||
| Subscription and support |
$ | — | $ | — | $ | 30 | $ | — | $ | — | ||||||||||
| Professional services and other |
— | — | — | — | — | |||||||||||||||
| Sales and marketing |
57 | 267 | 461 | — | — | |||||||||||||||
| Research and development |
57 | 267 | 653 | — | — | |||||||||||||||
| General and administrative |
104 | — | 81 | — | 1,327 | |||||||||||||||
|
|
|
|
|
|
|
|
|
|
|
|||||||||||
| Total payroll tax expense on secondary stock purchase transactions |
$ | 218 | $ | 534 | $ | 1,225 | $ | — | $ | 1,327 | ||||||||||
|
|
|
|
|
|
|
|
|
|
|
|||||||||||
45
Table of Contents
Index to Financial Statements
| (3) | Includes amortization of acquisition-related intangibles as follows: |
| Year Ended December 31, |
Nine Months Ended September 30, 2015 |
|||||||||||||||||||
| 2012 | 2013 | 2014 | 2014 | 2015 | ||||||||||||||||
| (unaudited) | ||||||||||||||||||||
| (in thousands) | ||||||||||||||||||||
| Cost of revenue: |
||||||||||||||||||||
| Subscription and support |
$ | — | $ | — | $ | — | $ | — | $ | — | ||||||||||
| Professional services and other |
— | — | — | — | — | |||||||||||||||
| Sales and marketing |
— | — | — | — | — | |||||||||||||||
| Research and development |
— | — | 6 | 4 | 7 | |||||||||||||||
| General and administrative |
— | — | — | — | — | |||||||||||||||
|
|
|
|
|
|
|
|
|
|
|
|||||||||||
| Total amortization of acquisition-related intangibles |
$ | — | $ | — | $ | 6 | $ | 4 | $ | 7 | ||||||||||
|
|
|
|
|
|
|
|
|
|
|
|||||||||||
| (4) | See Note 1 to our consolidated financial statements for an explanation of the method used to calculate basic, diluted and pro forma net loss per common share attributable to common stockholders. |
| As of December 31, | As of September 30, 2015 |
|||||||||||
| 2013 | 2014 | |||||||||||
| (unaudited) | ||||||||||||
| (in thousands) | ||||||||||||
| Consolidated Balance Sheet Data: |
||||||||||||
| Cash and cash equivalents |
$ | 13,138 | $ | 43,915 | $ | 31,770 | ||||||
| Working capital, excluding deferred revenue |
22,023 | 47,440 | 38,298 | |||||||||
| Total assets |
41,169 | 67,026 | 64,204 | |||||||||
| Deferred revenue |
19,466 | 31,954 | 57,750 | |||||||||
| Total liabilities |
35,155 | 53,568 | 79,469 | |||||||||
| Redeemable convertible preferred stock |
49,092 | 88,989 | 93,770 | |||||||||
| Total stockholders’ deficit |
(43,078 | ) | (75,531 | ) | (109,035 | ) | ||||||
Non-GAAP Financial Measures
In addition to our results determined in accordance with U.S. generally accepted accounting principles, or GAAP, we believe the following non-GAAP measures are useful in evaluating our operating performance. We regularly review the measures set forth below as we evaluate our business.
| Year Ended December 31, | Nine Months Ended September 30, |
|||||||||||||||||||
| 2012 | 2013 | 2014 | 2014 | 2015 | ||||||||||||||||
| (unaudited) | ||||||||||||||||||||
| (in thousands) | ||||||||||||||||||||
| Other Financial Data: |
||||||||||||||||||||
| Non-GAAP operating loss (1) |
$ | (16,286 | ) | $ | (17,704 | ) | $ | (29,280 | ) | $ | (20,243 | ) | $ | (31,027 | ) | |||||
| Free cash flow(2) |
(8,945 | ) | (9,631 | ) | (22,798 | ) | (8,281 | ) | (11,446 | ) | ||||||||||
| (1) | We define non-GAAP operating loss as operating loss before stock-based compensation, payroll tax expense on secondary stock purchase transactions and amortization of acquisition-related intangibles. |
| (2) | We define free cash flow as net cash provided by (used in) operating activities less purchases of property and equipment, net of proceeds from disposals of property and equipment. |
We believe non-GAAP operating loss and free cash flow provide investors and other users of our financial information consistency and comparability with our past financial performance and facilitates period-to-period comparisons of operations. We believe non-GAAP operating loss is useful in evaluating our operating performance compared to that of other companies in our industry, as this metric generally eliminates the effects of certain items that may vary for different companies for reasons unrelated to overall operating performance. We consider free cash flow to be an important measure because it measures the amount of cash we generate and
46
Table of Contents
Index to Financial Statements
reflects changes in working capital. While our free cash flow is expected to be largely negative in the near future, we manage our business to it by employing a conservative operating philosophy in terms of the use of cash. We have raised approximately $90 million in cash to capitalize our business since inception. We use non-GAAP operating loss and free cash flow in conjunction with traditional GAAP measures as part of our overall assessment of our performance, including the preparation of our annual operating budget and quarterly forecasts, to evaluate the effectiveness of our business strategies and to communicate with our board of directors concerning our financial performance.
Our definitions may differ from the definitions used by other companies and therefore comparability may be limited. In addition, other companies may not publish these or similar metrics. Thus, our non-GAAP operating loss and free cash flow should be considered in addition to, not as substitutes for, or in isolation from, measures prepared in accordance with GAAP.
We compensate for these limitations by providing investors and other users of our financial information, reconciliations of non-GAAP operating loss to the related GAAP financial measure, loss from operations and reconciliations of free cash flow to the related GAAP financial measure net cash provided by (used in) operating activities. We encourage investors and others to review our financial information in its entirety, not to rely on any single financial measure and to view non-GAAP operating loss and free cash flow in conjunction with the related GAAP financial measure.
The following table provides a reconciliation of loss from operations to non-GAAP operating loss:
| Year Ended December 31, | Nine Months Ended September 30, |
|||||||||||||||||||
| 2012 | 2013 | 2014 | 2014 | 2015 | ||||||||||||||||
| (unaudited) (in thousands) |
||||||||||||||||||||
| Loss from operations |
$ | (18,341 | ) | $ | (21,830 | ) | $ | (38,709 | ) | $ | (21,103 | ) | $ | (40,060 | ) | |||||
| Stock-based compensation |
1,837 | 3,592 | 8,198 | 856 | 7,699 | |||||||||||||||
| Payroll tax expense on secondary stock purchase transactions |
218 | 534 | 1,225 | — | 1,327 | |||||||||||||||
| Amortization of acquisition-related intangibles |
— | — | 6 | 4 | 7 | |||||||||||||||
|
|
|
|
|
|
|
|
|
|
|
|||||||||||
| Non-GAAP operating loss |
$ | (16,286 | ) | $ | (17,704 | ) | $ | (29,280 | ) | $ | (20,243 | ) | $ | (31,027 | ) | |||||
|
|
|
|
|
|
|
|
|
|
|
|||||||||||
The following table provides a reconciliation of net cash provided by operating activities to free cash flow.
| Year Ended December 31, | Nine Months Ended September 30, |
|||||||||||||||||||
| 2012 | 2013 | 2014 | 2014 | 2015 | ||||||||||||||||
| (unaudited) (in thousands) |
||||||||||||||||||||
| Net cash provided by (used in) operating activities |
$ | (7,946 | ) | $ | (8,634 | ) | $ | (20,395 | ) | $ | (6,468 | ) | $ | (7,036 | ) | |||||
| Less: purchases of property and equipment |
999 | 997 | 2,440 | 1,828 | 4,463 | |||||||||||||||
| Plus: proceeds from disposals of property and equipment |
— | — | 37 | 15 | 53 | |||||||||||||||
|
|
|
|
|
|
|
|
|
|
|
|||||||||||
| Free cash flow |
$ | (8,945 | ) | $ | (9,631 | ) | $ | (22,798 | ) | $ | (8,281 | ) | $ | (11,446 | ) | |||||
|
|
|
|
|
|
|
|
|
|
|
|||||||||||
47
Table of Contents
Index to Financial Statements
MANAGEMENT’S DISCUSSION AND ANALYSIS OF FINANCIAL CONDITION AND RESULTS OF OPERATIONS
The following discussion and analysis of our financial condition and results of operations should be read in conjunction with our consolidated financial statements and related notes that appear elsewhere in this prospectus. In addition to historical consolidated financial information, the following discussion contains forward-looking statements that reflect our plans, estimates and beliefs. Our actual results could differ materially from those discussed in the forward-looking statements. Factors that could cause or contribute to these differences include those discussed below and elsewhere particularly in the section titled “Risk Factors” and elsewhere in this prospectus.
Overview
We provide an innovative, cloud-based learning management platform for academic institutions and companies worldwide. We built our learning management applications, Canvas, for the education market, and Bridge, for the corporate market, to enable our customers to easily develop, deliver and manage engaging face-to-face and online learning experiences. Our platform combines powerful, elegant and easy-to-use functionality with the reliability, security, scalability and support required by our customers.
We offer our platform through a Software-as-a-Service, or SaaS, business model. Customers can rapidly deploy our applications with minimal upfront implementation. Customers also benefit from automatic software updates with virtually no downtime. Our SaaS business model substantially reduces the need for our customers to buy and support a broad range of IT infrastructure, and significantly reduces the cost, complexity and disruptions associated with implementations and upgrades of on-premise software.
We were founded in 2008, and in 2011, we launched Canvas, with the goal to make teaching and learning easier. Initially, we focused on the U.S. education market, targeting colleges and universities. In 2012, we expanded our focus to include the K-12 market in the United States. We opened our international headquarters in London, England in June 2014 and have offices in Sydney, Australia and Hong Kong. To date, a substantial majority of our revenue has been derived from our sales of Canvas to the U.S. education market. While our initial efforts were focused on the education market, we discovered that companies also needed a cloud-based learning management platform to enable them to better train their employees. Our initial corporate customers licensed Canvas for this purpose. In February 2015, we launched Bridge to enable companies to further realize the benefits of our cloud-based platform with an application specifically designed to address their needs. As a result of its recent launch, we have not yet generated significant sales of Bridge.
We sell our applications and services primarily through a direct sales force and we engage in a variety of traditional and online marketing activities designed to provide sales lead generation, sales support and market awareness. A majority of our academic customers implement Canvas widely within their institutions and across school districts. This approach to wide initial deployments allows us to efficiently and broadly promote adoption and utilization of Canvas by students and faculty. Our corporate customers generally implement Canvas, and now Bridge, by way of initial deployments across a functional area, before purchasing additional seats and expanding within the organization. We believe there is a significant opportunity to continue to penetrate our existing corporate customers and expand the use of Bridge within these customers.
As of September 30, 2015, we have grown to serve more than 1,600 customers, representing colleges, universities, K-12 school districts, and companies in more than 25 countries. Our customers range from a single school to large corporations and academic institutions and accordingly our total contract values range from thousands of dollars to several million dollars. We generally define a customer as an entity with a subscription contract as of the measurement date. In situations where there is a single contract that applies to entities with multiple subsidiaries or divisions, universities, or governmental organizations, only the entity that has contracted for our platform is counted as a customer. For example, a contracting school district is counted as a single
48
Table of Contents
Index to Financial Statements
customer even though the school district encompasses multiple schools. In 2014, no single customer represented more than 10% of our revenue.
Our subscription fee includes the use of our platform and our technical support and is based on the number of users. We also generate revenue from training, implementation services and other types of professional services. We have experienced net revenue retention rates of over 100% at each of December 31, 2012, 2013 and 2014. For 2012, 2013 and 2014, our revenue was $8.8 million, $26.1 million and $44.4 million, respectively, representing year-over-year growth of 197% and 70%. For 2012, 2013 and 2014, our net losses were $18.5 million, $22.5 million and $41.4 million, respectively. For the nine months ended September 30, 2015, our revenue was $51.4 million and we incurred a net loss of $40.9 million.
Our Business Model
Since we introduced Canvas in February 2011, we have grown to over 1,600 customers as of September 30, 2015. Our business model focuses on maximizing the lifetime value of a customer relationship and we continue to make significant investments in order to grow our customer base. These investments include significant upfront costs, including direct sales and marketing expenses, such as sales commissions, and costs related to initial training, implementation and consulting services, which are generally expensed in the period incurred. The majority of our sales and marketing costs are related to the acquisition of new customers. However, due to our subscription model, we recognize revenue ratably over the term of the subscription period. As a result, the profitability of a customer to our business in any particular period, depends in part upon how long a customer has been a subscriber. In general, the associated upfront costs with respect to new customers is higher in the first year than the aggregate revenue we recognize from those new customers in the first year, even after the recognition of professional services revenue. We believe that, over time, as our customer base grows and a relatively higher percentage of our revenue is attributable to renewals versus new customers or upsells to existing customers, associated sales and marketing and other allocated upfront costs as a percentage of revenue will decrease.
To provide a better understanding of our business model, we are providing our calculation of contribution margin percentage for the nine months ended September 30, 2015 for a set of customer cohorts. Each cohort is comprised of the customers who commenced their application subscriptions in a particular year. As we introduced Canvas in February 2011, 2011 comprises the earliest customer cohort. We believe this cohort analysis will help investors understand the potential long-term value of our customers.
We define contribution margin for a period as the revenue recognized from the customer cohort in such period less the estimated, allocated variable costs for the period associated with such revenue. The costs allocated to customers include personnel costs associated with the sales and marketing teams that support the customer, such as salaries, commissions and allocated management overhead expenses. As the majority of our sales and marketing costs are related to the acquisition of new customers, these costs are mainly allocated to the newest cohort in a given period, with the exception for commissions relating to upsells, which are matched to the applicable cohort. Costs allocated to customers also include the costs associated with use of our technology infrastructure and web hosting, and personnel costs associated with operations, professional services and customer success teams that support the customer. These costs are allocated based on usage, number of support tickets and overall support provided. Personnel costs exclude stock-based compensation expense. In addition, we exclude all research and development and general and administrative expenses from this analysis because these expenses support the growth of our business generally. We define contribution margin percentage as contribution margin divided by revenue associated with such cohort in a given period.
The following table shows contribution margin percentage of each customer cohort during the nine months ended September 30, 2015:
| Customer Cohort | ||||||||||||||||||||
| 2011 | 2012 | 2013 | 2014 | 2015 | ||||||||||||||||
| Contribution margin |
57 | % | 65 | % | 65 | % | 53 | % | (182 | )% | ||||||||||
49
Table of Contents
Index to Financial Statements
Contribution margin percentage for the 2012 and 2013 cohorts was higher for the nine months ended September 30, 2015 relative to the 2011 cohort primarily due to price increases we implemented for Canvas customers with application subscription commencement dates in 2012 and 2013. Contribution margin percentage for the 2014 cohort was lower for the nine months ended September 30, 2015 relative to the 2012 and 2013 cohorts primarily due to a higher portion of the 2014 cohort revenue being professional service revenue. Our professional service offerings have a lower gross margin than our subscription offering. Contribution margin percentage for the 2015 cohort was lower for the nine months ended September 30, 2015 relative to all other cohorts primarily due to the allocation of sales and marketing costs related to customer acquisition.
The contribution margin of our customer cohorts will fluctuate from one period to another depending upon the number of customers remaining in each cohort, upsells of additional features and applications, and changes in customer subscription fees, as well as changes in our variable costs. We may not experience similar financial outcomes from new future customers who subscribe to our applications. We do not yet have enough operating history to measure the lifetime of our customer relationships. Therefore, we cannot predict the average duration of a customer relationship in any of the above cohorts.
The allocated expenses or relationship of revenue to variable costs is not necessarily indicative of future performance and we cannot predict whether future contribution margin analyses will be similar to the above analysis. Other companies may calculate contribution margin differently than our chosen method and, therefore, may not be directly comparable. We have not yet achieved profitability, and even if our revenue exceeds these variable costs over time, we may not be able to achieve and maintain profitability.
Key Factors Affecting Our Performance
Investment in Sales and Marketing Organization
We continue to invest in our sales and marketing organization to drive additional revenue and support the growth of our customer base. Any investments we make in our sales and marketing organization will occur in advance of experiencing any benefits from such investments, so it may be difficult for us to determine if we are efficiently allocating our resources in these areas. We plan to continue to expand sales and marketing to grow our customer base and increase sales to existing customers. This expansion is expected to include adding sales personnel and expanding our marketing activities to continue to generate additional leads and build brand awareness.
We intend to expand and continue to invest in our international sales and marketing organization, which we believe will be an important factor in our continued growth. As we grow internationally, we may use reseller partnerships as needed to penetrate new markets. In 2014 and the nine months ended September 30, 2015, 4% and 6%, respectively, of our revenue was derived from outside the United States. Our international operations are relatively new and we have limited experience operating in international markets, which increases the risk that our international expansion efforts may not be successful.
Investment in Technology
We have aggressively invested, and intend to continue to invest, in developing technology to support our growth. We expect our research and development expenses to increase as we expand headcount. While we invest heavily in research and development, we have also built a foundation for innovation through our approach to the learning management system as a learning platform. However, our investments in research and development may result in enhancements or new applications that may not achieve market adoption, are more expensive to develop than anticipated, may take longer to generate revenue or may generate less revenue than we anticipate.
Net Revenue Retention Rate
We calculate our net revenue retention rate by dividing the total revenue obtained from a particular customer in a given month by the total revenue from that customer from the same month in the immediately
50
Table of Contents
Index to Financial Statements
preceding year. This calculation contemplates all changes to revenue for the designated customer, which includes customer terminations, changes in quantities of users, changes in pricing, additional applications purchased or applications no longer used. We calculate the net revenue retention for our entire customer base at a given point in time. We believe our net revenue retention rate is an important metric to measure the long-term value of customer agreements and our ability to retain our customers. Our net revenue retention rate was over 100% at each of December 31, 2013 and 2014 and at each of September 30, 2014 and 2015.
Backlog
Backlog represents future non-cancellable amounts to be invoiced under our agreements. We have generally signed multiple year subscription contracts for our applications. For these agreements, it is common to invoice an initial amount at contract signing followed by subsequent periodic invoices, generally annually. At any point in the contract term, there can be amounts that we have not yet been contractually able to invoice. Until such time as these amounts are invoiced, they are not recorded in revenue, deferred revenue, accounts receivable or elsewhere in our consolidated financial statements, and are considered by us to be backlog. Multiple-year payments are recorded as deferred revenue until recognized as revenue according to our revenue recognition policies and are not considered a component of backlog. As of December 31, 2013 and 2014 and September 30, 2015, we had backlog of approximately $72.8 million, $113.2 million and $143.3 million, respectively. We expect backlog to fluctuate up or down from period to period for several reasons, including the timing and duration of customer contracts, varying billing cycles and the timing of customer renewals.
In addition, our deferred revenue consists of amounts that have been invoiced but that have not yet been recognized as revenue as of the end of a reporting period. The majority of our deferred revenue balance consists of subscription and support revenue that is recognized ratably over the contractual period. Together, the sum of deferred revenue and backlog represents our total billed and unbilled contract value, and provides significant visibility into future revenue streams. As of December 31, 2012 and 2013, the portion of backlog to be recognized in the following year plus the short-term deferred revenue balance accounted for approximately 67% and 70%, respectively, of the following year’s revenue.
Focus on Free Cash Flow
We define free cash flow as cash provided by (used in) operating activities less purchase of property, equipment, and other assets. We consider free cash flow to be an important measure that we are focused on to run our business. While our free cash flow is expected to be largely negative in the near future, we manage our business to it by employing a conservative operating philosophy in terms of the use of cash. We have raised approximately $90 million in cash to capitalize our business since inception. For more information about free cash flow, see the section titled “Selected Consolidated Financial Data—Non-GAAP Financial Measures.”
Financial Operations Overview
Revenue
We generate revenue primarily from two main sources: (1) subscription and support revenue, which is comprised of SaaS fees from customers accessing our learning management systems and from customers purchasing additional support beyond the standard support that is included in the basic SaaS fees; and (2) related professional services revenue, which is comprised of training, implementation services and other types of professional services.
Subscription revenue is derived from customers using our cloud-based learning platform and is driven primarily by the number of customers, the number of users at each customer, the price of our applications, and to a lesser extent historically, renewal rates. Support revenue is derived from customers purchasing additional support
51
Table of Contents
Index to Financial Statements
beyond the standard support that is included in the basic SaaS fee. Our contracts typically vary in length between one and five years. Subscriptions and support are non-cancelable and are billed in advance on an annual basis. All subscription and support fees billed are initially recorded in deferred revenue and recognized ratably over the subscription term. Amounts that have not been billed are not reflected in our consolidated financial statements.
Professional services and other revenue are derived primarily from implementation, training, and other consulting fees. Our standard implementation takes anywhere from 30 to 90 days depending on customer-side complexity and timelines. It includes regularly scheduled and highly-structured activities to ensure customers progress toward actually using our applications. Most of these interactions take place over the phone and through the use of web meeting technology. Implementation revenue is recorded over the longer of the contract term or the estimated customer life.
We include training with every implementation and offer additional training for a fee. The training offered is focused on creating confidence among users so they can be successful with our applications. Most training is performed remotely using web meeting technology. Because we have an established standalone value, we record training revenue upon the delivery of the training.
In addition to our implementation and training offerings, we provide consulting services for custom application development, integrations, content services and change management consulting. These services are architected to boost customer adoption of our applications and to drive usage of features and capabilities that are unique to our company. We have an established standalone value for these services. In situations where we are unable to utilize the proportional performance method, for example due to either the lack of adequate documentation of time incurred or to be incurred, we recognize revenue based on the milestone method if individual milestones with substantive value to the customer exist. If neither of these two methods is able to be utilized, revenue recognition is deferred until the contract is completed.
Cost of Revenue
Cost of subscription and support revenue consists primarily of the costs of our managed hosting provider and other third-party service providers, employee-related costs including payroll, benefits and stock-based compensation expense for our operations and customer support teams, amortization of capitalized software development costs and acquired technology, and allocated overhead costs, which we define as rent, facilities and costs related to information technology, or IT.
Cost of professional services and other revenue consists primarily of personnel costs of our professional services organization, including salaries, benefits, travel, bonuses and stock-based compensation, as well as allocated overhead costs.
Operating Expenses
Sales and Marketing. Sales and marketing expenses consist primarily of personnel costs of our sales and marketing employees, including sales commissions and incentives, benefits and stock-based compensation expense, marketing programs, including lead generation, costs of our annual InstructureCon user conference and allocated overhead costs. We immediately expense sales commissions related to acquiring new customers and upsells from existing customers. We expect sales and marketing expenses will increase as a result of hiring net new quota-carrying sales representatives inside and outside the United States, adding to the marketing staff and expanding our annual InstructureCon user conference and potentially adding other annual conferences. Over time, we expect sales and marketing expenses will decline as a percentage of total revenue.
Research and Development. Research and development expenses consist primarily of personnel costs of our development team, including payroll, benefits and stock-based compensation expense and allocated overhead costs. We capitalize certain software development costs that are attributable to developing new applications,
52
Table of Contents
Index to Financial Statements
features and adding incremental functionality to our platform and amortize such costs as costs of subscription revenue over the estimated life of the new application or incremental functionality, which is generally three years. We expect research and development expenses to increase in absolute dollars as we continue to increase the functionality of our software platform.
General and Administrative. General and administrative expenses consist of personnel costs and related expenses for executive, finance, legal, human resources, recruiting, employee-related information technology, administrative personnel, including payroll, benefits and stock-based compensation expense; professional fees for external legal, accounting and other consulting services; and allocated overhead costs. We expect that general and administrative expenses will increase on an absolute dollar basis but decrease as a percentage of total revenue as we focus on processes, systems and controls to enable our internal support functions to scale with the growth of our business. We also anticipate increases to general and administrative expenses as we incur the costs of compliance associated with being a publicly-traded company, including legal, audit and consulting fees.
Other Income (Expense)
Other income (expense) consists primarily of interest expense and the change in fair value of warrant liability which is subject to mark-to-market adjustments as of each reporting period. In February 2015, preferred stock warrants were exercised which resulted in the reclassification of the warrant liability of $3.9 million to additional paid-in capital. We have historically had a minimal amount of debt outstanding on which we pay interest. As we have expanded our international operations our exposure to fluctuations in foreign currencies has increased.
Income Tax Expense
We are subject to income taxes in the United States and foreign jurisdictions in which we do business. These foreign jurisdictions have statutory tax rates different from those in the United States. Accordingly, our effective tax rates will vary depending on the relative proportion of foreign to U.S. income and changes in tax laws.
53
Table of Contents
Index to Financial Statements
Results of Operations
The following tables set forth certain consolidated financial data in dollar amounts and as a percentage of total revenue.
| Year Ended December 31, |
Nine Months Ended September 30, |
|||||||||||||||
| 2013 | 2014 | 2014 | 2015 | |||||||||||||
| (unaudited) | ||||||||||||||||
| (in thousands) | ||||||||||||||||
| Revenue: |
||||||||||||||||
| Subscription and support |
$ | 22,456 | $ | 38,093 | $ | 26,328 | $ | 43,557 | ||||||||
| Professional services and other |
3,599 | 6,259 | 4,288 | 7,839 | ||||||||||||
|
|
|
|
|
|
|
|
|
|||||||||
| Total revenue |
26,055 | 44,352 | 30,616 | 51,396 | ||||||||||||
|
|
|
|
|
|
|
|
|
|||||||||
| Cost of revenue: |
||||||||||||||||
| Subscription and support |
8,581 | 12,131 | 8,331 | 12,520 | ||||||||||||
| Professional services and other |
2,039 | 2,982 | 1,979 | 4,717 | ||||||||||||
|
|
|
|
|
|
|
|
|
|||||||||
| Total cost of revenue |
10,620 | 15,113 | 10,310 | 17,237 | ||||||||||||
|
|
|
|
|
|
|
|
|
|||||||||
| Gross profit |
15,435 | 29,239 | 20,306 | 34,159 | ||||||||||||
|
|
|
|
|
|
|
|
|
|||||||||
| Operating expenses: |
||||||||||||||||
| Sales and marketing |
20,702 | 35,390 | 22,335 | 38,303 | ||||||||||||
| Research and development |
11,242 | 21,290 | 12,184 | 17,441 | ||||||||||||
| General and administrative |
5,321 | 11,268 | 6,890 | 18,475 | ||||||||||||
|
|
|
|
|
|
|
|
|
|||||||||
| Total operating expenses |
37,265 | 67,948 | 41,409 | 74,219 | ||||||||||||
|
|
|
|
|
|
|
|
|
|||||||||
| Loss from operations |
(21,830 | ) | (38,709 | ) | (21,103 | ) | (40,060 | ) | ||||||||
|
|
|
|
|
|
|
|
|
|||||||||
| Other income (expense): |
||||||||||||||||
| Interest income |
22 | 32 | 30 | 13 | ||||||||||||
| Interest expense |
(150 | ) | (136 | ) | (96 | ) | (72 | ) | ||||||||
| Change in fair value of warrant liability |
(545 | ) | (2,518 | ) | (2,219 | ) | (536 | ) | ||||||||
| Other income (expense), net |
4 | (39 | ) | 12 | (161 | ) | ||||||||||
|
|
|
|
|
|
|
|
|
|||||||||
| Total other expense, net |
(669 | ) | (2,661 | ) | (2,273 | ) | (756 | ) | ||||||||
|
|
|
|
|
|
|
|
|
|||||||||
| Loss before income taxes |
(22,499 | ) | (41,370 | ) | (23,376 | ) | (40,816 | ) | ||||||||
| Income tax expense |
— | (57 | ) | (7 | ) | (40 | ) | |||||||||
|
|
|
|
|
|
|
|
|
|||||||||
| Net loss |
$ | (22,499 | ) | $ | (41,427 | ) | $ | (23,383 | ) | $ | (40,856 | ) | ||||
|
|
|
|
|
|
|
|
|
|||||||||
54
Table of Contents
Index to Financial Statements
| Year Ended December 31, | Nine Months Ended September 30, |
|||||||||||||||
| 2013 | 2014 | 2014 | 2015 | |||||||||||||
| (as a percentage of total revenue) | ||||||||||||||||
| Revenue: |
||||||||||||||||
| Subscription and support |
86 | % | 86 | % | 86 | % | 85 | % | ||||||||
| Professional services and other |
14 | 14 | 14 | 15 | ||||||||||||
|
|
|
|
|
|
|
|
|
|||||||||
| Total revenue |
100 | 100 | 100 | 100 | ||||||||||||
|
|
|
|
|
|
|
|
|
|||||||||
| Cost of revenue: |
||||||||||||||||
| Subscription and support |
33 | 27 | 27 | 24 | ||||||||||||
| Professional services and other |
8 | 7 | 6 | 9 | ||||||||||||
|
|
|
|
|
|
|
|
|
|||||||||
| Total cost of revenue |
41 | 34 | 34 | 34 | ||||||||||||
|
|
|
|
|
|
|
|
|
|||||||||
| Gross profit |
59 | 66 | 66 | 66 | ||||||||||||
|
|
|
|
|
|
|
|
|
|||||||||
| Operating expenses: |
||||||||||||||||
| Sales and marketing |
79 | 80 | 73 | 75 | ||||||||||||
| Research and development |
43 | 48 | 40 | 34 | ||||||||||||
| General and administrative |
20 | 25 | 23 | 36 | ||||||||||||
|
|
|
|
|
|
|
|
|
|||||||||
| Total operating expenses |
142 | 153 | 135 | 144 | ||||||||||||
|
|
|
|
|
|
|
|
|
|||||||||
| Loss from operations |
(83 | ) | (87 | ) | (69 | ) | (78 | ) | ||||||||
|
|
|
|
|
|
|
|
|
|||||||||
| Other income (expense): |
||||||||||||||||
| Interest income |
0 | 0 | 0 | 0 | ||||||||||||
| Interest expense |
(1 | ) | 0 | (0 | ) | (0 | ) | |||||||||
| Change in fair value of warrant liability |
(2 | ) | (6 | ) | (7 | ) | (1 | ) | ||||||||
| Other income (expense), net |
0 | 0 | 0 | (0 | ) | |||||||||||
|
|
|
|
|
|
|
|
|
|||||||||
| Total other expense, net |
(3 | ) | (6 | ) | (7 | ) | (1 | ) | ||||||||
|
|
|
|
|
|
|
|
|
|||||||||
| Loss before income taxes |
(86 | ) | (93 | ) | (76 | ) | (79 | ) | ||||||||
| Income tax expense |
— | 0 | (0 | ) | (0 | ) | ||||||||||
|
|
|
|
|
|
|
|
|
|||||||||
| Net loss |
(86 | )% | (93 | )% | (76 | )% | (79 | )% | ||||||||
|
|
|
|
|
|
|
|
|
|||||||||
Nine Months Ended September 30, 2014 Compared to the Nine Months Ended September 30, 2015
Revenue
| Nine Months Ended September 30, |
Change | |||||||||||||||
| 2014 | 2015 | Amount | % | |||||||||||||
| (dollars in thousands) | ||||||||||||||||
| Subscription and support |
$ | 26,328 | $ | 43,557 | $ | 17,229 | 65 | % | ||||||||
| Professional services and other |
4,288 | 7,839 | 3,551 | 83 | ||||||||||||
|
|
|
|
|
|
|
|||||||||||
| Total revenue |
$ | 30,616 | $ | 51,396 | $ | 20,780 | 68 | |||||||||
|
|
|
|
|
|
|
|||||||||||
Subscription and support revenue increased $17.2 million for the nine months ended September 30, 2015 primarily due to an increase in the total number of customers, which grew from approximately 850 as of September 30, 2014 to over 1,600 as of September 30, 2015.
Professional services and other revenue increased $3.6 million for the nine months ended September 30, 2015 primarily due to an increase in new customers and the sale of premium implementations, which include additional professional services and onsite training.
55
Table of Contents
Index to Financial Statements
Cost of Revenue and Gross Margin
| Nine Months Ended September 30, |
Change | |||||||||||||||
| 2014 | 2015 | Amount | % | |||||||||||||
| (dollars in thousands) | ||||||||||||||||
| Cost of revenue: |
||||||||||||||||
| Subscription and support |
$ | 8,331 | $ | 12,520 | $ | 4,189 | 50 | % | ||||||||
| Professional services and other |
1,979 | 4,717 | 2,738 | 138 | ||||||||||||
|
|
|
|
|
|
|
|||||||||||
| Total cost of revenue |
$ | 10,310 | $ | 17,237 | $ | 6,927 | 67 | |||||||||
|
|
|
|
|
|
|
|||||||||||
| Gross margin percentage: |
||||||||||||||||
| Subscription and support revenue |
68 | % | 71 | % | ||||||||||||
| Professional services and other |
54 | 40 | ||||||||||||||
| Total gross margin |
66 | 66 | ||||||||||||||
Total cost of revenue increased $6.9 million for the nine months ended September 30, 2015 primarily due to an increase in employee-related costs, web hosting costs and amortization of developed technology. Total gross margin remained constant as the impact of improved leverage of our web hosting costs relative to the growth in subscription and support revenue was offset by higher costs of professional services and other revenue.
Subscription and support cost of revenue increased $4.2 million for the nine months ended September 30, 2015 primarily due to an increase in employee-related costs, web hosting and third-party software license costs, amortization of developed technology and overhead allocations. Employee-related costs increased $2.0 million as we continued to grow our customer support organization to support our customer growth and improve service levels and offerings. Web hosting and third-party software license costs increased $1.7 million due to the increase in total customers. Amortization of capitalized software development costs increased $0.3 million due to the continued development of our software platform. Allocated overhead expenses increased $0.2 million primarily due to higher rent expense and the depreciation of capital equipment.
Professional services and other costs of revenue increased $2.7 million for the nine months ended September 30, 2015 primarily due to an increase in employee-related costs, travel costs, outside contractors and overhead allocations. Employee-related costs increased $1.9 million as we continued to grow our professional services organization to support our customer growth and improve service levels and offerings. Travel costs increased $0.3 million as our premium implementations provided for onsite training. Outside contractor costs increased $0.3 million due to an increase in seasonal demand for training and professional services. Allocated overhead expenses increased $0.2 million primarily due to higher rent expense and the depreciation of capital equipment.
Operating Expenses
Sales and Marketing
| Nine Months Ended September 30, |
Change | |||||||||||||||
| 2014 | 2015 | Amount | % | |||||||||||||
| (dollars in thousands) | ||||||||||||||||
| Sales and marketing |
$ | 22,335 | $ | 38,303 | $ | 15,968 | 71 | % | ||||||||
Sales and marketing expenses increased $16.0 million for the nine months ended September 30, 2015 primarily due to an increase in employee-related costs and sales commissions, expansion of marketing programs to new international and corporate markets, travel and overhead. Employee-related costs and sales commissions increased $11.5 million as a result of the hiring of additional employees and growth in our customer base. Marketing program costs increased $2.5 million as we launched Bridge in February 2015, expanded into international markets, and increased attendance at InstructureCon, our annual user conference. Travel and other
56
Table of Contents
Index to Financial Statements
costs increased $1.4 million as we continued to expand our sales and marketing organization to grow our customer base. Allocated overhead expenses increased $0.6 million primarily due to higher rent expense and the depreciation of capital equipment.
Research and Development
| Nine Months Ended September 30, |
Change | |||||||||||||||
| 2014 | 2015 | Amount | % | |||||||||||||
| (dollars in thousands) | ||||||||||||||||
| Research and development |
$ | 12,184 | $ | 17,441 | $ | 5,257 | 43 | % | ||||||||
Research and development expenses increased $5.3 million for the nine months ended September 30, 2015 primarily due to an increase in employee-related costs as we continue to grow our engineering organization to develop new applications and continue to develop additional features for Canvas and Bridge.
General and Administrative
| Nine Months Ended September 30, |
Change | |||||||||||||||
| 2014 | 2015 | Amount | % | |||||||||||||
| (dollars in thousands) | ||||||||||||||||
| General and administrative |
$ | 6,890 | $ | 18,475 | $ | 11,585 | 168 | % | ||||||||
General and administrative expenses increased $11.6 million for the nine months ended September 30, 2015 primarily due to an increase in employee-related costs, including stock-based compensation, information technology, travel and other expenses, third-party services and overhead allocations. Stock-based compensation increased $6.7 million as a result of a non-cash expense associated with the purchase by an investor of common stock from current and former employees at a premium over fair value. Employee-related costs increased $3.7 million as a result of the recruiting and hiring of additional employees. Our information technology expenses increased $0.5 million as we continued to automate our internal systems. Travel and other expenses increased $0.4 million primarily due to our continued growth and international expansion. Third-party services increased $0.2 million due to tax and legal costs relating to our international expansion. Allocated overhead expenses increased $0.1 million primarily due to higher rent expense and the depreciation of capital equipment.
Other Income (Expense)
| Nine Months Ended September 30, |
Change | |||||||||||||||
| 2014 | 2015 | Amount | % | |||||||||||||
| (dollars in thousands) | ||||||||||||||||
| Other expense, net |
$ | (2,273 | ) | $ | (756 | ) | $ | 1,517 | (67 | )% | ||||||
Other income (expense) includes interest income and expense, the change in fair value of warrant liability and the impact of foreign currency transaction gains and losses. Other expense decreased $1.5 million for the nine months ended September 30, 2015 as the change in fair value of warrant liability decreased due to the exercise of the redeemable convertible preferred stock warrants in February 2015. The decrease in the change in fair value of warrant liability was offset by an increase in net foreign currency transaction losses.
57
Table of Contents
Index to Financial Statements
Year Ended December 31, 2013 Compared to the Year Ended December 31, 2014
Revenue
| Year Ended December 31, |
Change | |||||||||||||||
| 2013 | 2014 | Amount | % | |||||||||||||
| (dollars in thousands) | ||||||||||||||||
| Subscription and support |
$ | 22,456 | $ | 38,093 | $ | 15,637 | 70 | % | ||||||||
| Professional services and other |
3,599 | 6,259 | 2,660 | 74 | ||||||||||||
|
|
|
|
|
|
|
|||||||||||
| Total revenue |
$ | 26,055 | $ | 44,352 | $ | 18,297 | 70 | |||||||||
|
|
|
|
|
|
|
|||||||||||
Subscription and support revenue increased $15.6 million during 2014 due to an increase throughout the year in total customers, which grew from over 490 as of December 31, 2013 to over 1,000 as of December 31, 2014.
Professional services and other revenue increased $2.7 million primarily due to the increase in customers and from new customers purchasing premium implementations, which included additional professional services and onsite training.
Cost of Revenue and Gross Margin
| Year Ended December 31, |
Change | |||||||||||||||
| 2013 | 2014 | Amount | % | |||||||||||||
| (dollars in thousands) | ||||||||||||||||
| Cost of revenue: |
||||||||||||||||
| Subscription and support |
$ | 8,581 | $ | 12,131 | $ | 3,550 | 41 | % | ||||||||
| Professional services and other |
2,039 | 2,982 | 943 | 46 | ||||||||||||
|
|
|
|
|
|
|
|||||||||||
| Total cost of revenue |
$ | 10,620 | $ | 15,113 | $ | 4,493 | 42 | |||||||||
|
|
|
|
|
|
|
|||||||||||
| Gross margin percentage: |
||||||||||||||||
| Subscription and support |
62 | % | 68 | % | ||||||||||||
| Professional services and other |
43 | 52 | ||||||||||||||
| Total gross margin |
59 | 66 | ||||||||||||||
Total cost of revenue increased $4.5 million from 2013 to 2014 primarily due to an increase in web hosting costs, employee-related costs, amortization of developed and acquired technology, allocated overhead expenses, third-party services and travel. The increase in gross margin was primarily driven by additional efficiencies in our web hosting as we added additional customers during the period, as well as improved efficiencies within our professional services organization.
Subscription and support cost of revenue increased $3.6 million from 2013 to 2014 due to an increase in web hosting costs as a result of customer growth and corresponding headcount increases to service additional customers. Web hosting costs increased $2.1 million due to growth in our customer base. Employee-related costs increased $1.2 million as a result of the hiring of additional employees. Allocated overhead expenses increased $0.2 million primarily due to higher rent expense and the depreciation of capital equipment. Amortization of capitalized software development costs increased $0.1 million due to continued development of our software platform.
Professional services and other costs of revenue increased $0.9 million from 2013 to 2014 primarily due to higher employee-related costs of $0.7 million as a result of the hiring of additional employees. Third-party services increased $0.1 million and travel costs increased $0.1 million.
58
Table of Contents
Index to Financial Statements
Operating Expenses
Sales and Marketing
| Year Ended December 31, |
Change | |||||||||||||||
| 2013 | 2014 | Amount | % | |||||||||||||
| (dollars in thousands) | ||||||||||||||||
| Sales and marketing |
$ | 20,702 | $ | 35,390 | $ | 14,688 | 71 | % | ||||||||
Sales and marketing expenses increased $14.7 million from 2013 to 2014 primarily due to higher employee-related costs and sales commissions of $10.2 million. Marketing and advertising costs increased $1.6 million as a result of efforts to gain more market presence through increased exposure and an increase in attendees at our InstructureCon annual user conference. Travel costs increased $1.3 million as a result of our higher customer base, along with sales and marketing activities expanding into the international markets. Allocated overhead costs increased by $0.7 million related to higher rent expense and the depreciation of capital equipment. Third-party services increased $0.5 million due to our international expansion and information technology expenses increased $0.4 million as we continued to automate our internal systems.
Research and Development
| Year Ended December 31, |
Change | |||||||||||||||
| 2013 | 2014 | Amount | % | |||||||||||||
| (dollars in thousands) | ||||||||||||||||
| Research and development |
$ | 11,242 | $ | 21,290 | $ | 10,048 | 89 | % | ||||||||
Research and development expenses increased $10.0 million from 2013 to 2014 primarily due to higher employee-related costs of $8.4 million as a result of the hiring of additional employees as we continued to grow our engineering organization to develop new applications and continue to develop our existing software platform. Third-party services increased $0.6 million related to additional software platform enhancement costs. Allocated overhead costs increased $0.5 million primarily due to higher rent expense and the depreciation of capital equipment. Travel costs increased $0.3 million primarily related to the opening of our Chicago office for developers and the 12 Spokes acquisition that included workforce throughout the United States. Information technology expenses increased $0.2 million as we continued to automate our internal systems.
General and Administrative
| Year Ended December 31, |
Change | |||||||||||||||
| 2013 | 2014 | Amount | % | |||||||||||||
| (dollars in thousands) | ||||||||||||||||
| General and administrative |
$ | 5,321 | $ | 11,268 | $ | 5,947 | 112 | % | ||||||||
General and administrative expenses increased $5.9 million primarily due to higher employee-related costs of $4.1 million as a result of hiring additional employees as we continued to grow our business and required additional personnel to support our expanded operations. Professional fees increased $1.2 million a result of our international expansion, and legal and accounting services. Third-party enterprise software fees increased $0.4 million as we required additional financial and other operating systems to support our expanded operations. Allocated overhead costs increased by $0.2 million related to higher rent expense and the depreciation of capital equipment.
59
Table of Contents
Index to Financial Statements
Other Income (Expense)
| Year Ended December 31, |
Change | |||||||||||||||
| 2013 | 2014 | Amount | % | |||||||||||||
| (dollars in thousands) | ||||||||||||||||
| Other expense, net |
$ | (669 | ) | $ | (2,661 | ) | $ | (1,992 | ) | 298 | % | |||||
Other expense, net increased $2.0 million from 2013 to 2014 due to the expense recorded for the change in the fair value of warrant liability.
60
Table of Contents
Index to Financial Statements
Quarterly Results of Operations
The following tables set forth our quarterly consolidated statements of operations for each of the four quarters in the year ended December 31, 2014 and the quarters ended March 31, June 30 and September 30, 2015, as well as the percentage of revenue that each line item represents for each quarter. We have prepared the quarterly consolidated statements of operations data on a basis consistent with the audited consolidated financial statements included elsewhere in this prospectus. In the opinion of management, the financial information reflects all adjustments, consisting only of normal recurring adjustments, which we consider necessary for a fair presentation of this data. This information should be read in conjunction with the audited consolidated financial statements and related notes included elsewhere in this prospectus. The results of historical periods are not necessarily indicative of the results for any future period.
| Three Months Ended | ||||||||||||||||||||||||||||
| March 31, 2014 |
June 30, 2014 |
Sept. 30, 2014 |
Dec. 31, 2014 |
March 31, 2015 |
June 30, 2015 |
Sept. 30, 2015 |
||||||||||||||||||||||
| (unaudited) | ||||||||||||||||||||||||||||
| (in thousands) | ||||||||||||||||||||||||||||
| Revenue: |
||||||||||||||||||||||||||||
| Subscription and support |
$ | 7,558 | $ | 8,166 | $ | 10,604 | $ | 11,765 | $ | 12,601 | $ | 13,347 | $ | 17,609 | ||||||||||||||
| Professional services and other |
1,052 | 1,400 | 1,836 | 1,971 | 2,024 | 2,530 | 3,285 | |||||||||||||||||||||
|
|
|
|
|
|
|
|
|
|
|
|
|
|
|
|||||||||||||||
| Total revenue |
8,610 | 9,566 | 12,440 | 13,736 | 14,625 | 15,877 | 20,894 | |||||||||||||||||||||
|
|
|
|
|
|
|
|
|
|
|
|
|
|
|
|||||||||||||||
| Cost of revenue: |
||||||||||||||||||||||||||||
| Subscription and support(1)(2) |
2,478 | 2,608 | 3,245 | 3,800 | 3,676 | 3,937 | 4,907 | |||||||||||||||||||||
| Professional services and other(1) |
463 | 655 | 861 | 1,003 | 1,235 | 1,595 | 1,887 | |||||||||||||||||||||
|
|
|
|
|
|
|
|
|
|
|
|
|
|
|
|||||||||||||||
| Total cost of revenue |
2,941 | 3,263 | 4,106 | 4,803 | 4,911 | 5,532 | 6,794 | |||||||||||||||||||||
| Gross profit |
5,669 | 6,303 | 8,334 | 8,933 | 9,714 | 10,345 | 14,100 | |||||||||||||||||||||
|
|
|
|
|
|
|
|
|
|
|
|
|
|
|
|||||||||||||||
| Operating expenses: |
||||||||||||||||||||||||||||
| Sales and marketing(1)(2) |
6,231 | 7,960 | 8,144 | 13,055 | 11,081 | 14,050 | 13,172 | |||||||||||||||||||||
| Research and development(1)(2)(3) |
3,506 | 4,306 | 4,372 | 9,106 | 5,271 | 5,645 | 6,525 | |||||||||||||||||||||
| General and administrative(1)(2) |
1,823 | 2,360 | 2,707 | 4,378 | 10,046 | 3,923 | 4,506 | |||||||||||||||||||||
|
|
|
|
|
|
|
|
|
|
|
|
|
|
|
|||||||||||||||
| Total operating expenses |
11,560 | 14,626 | 15,223 | 26,539 | 26,398 | 23,618 | 24,203 | |||||||||||||||||||||
|
|
|
|
|
|
|
|
|
|
|
|
|
|
|
|||||||||||||||
| Loss from operations |
(5,891 | ) | (8,323 | ) | (6,889 | ) | (17,606 | ) | (16,684 | ) | (13,273 | ) | (10,103 | ) | ||||||||||||||
|
|
|
|
|
|
|
|
|
|
|
|
|
|
|
|||||||||||||||
| Other income (expense): |
||||||||||||||||||||||||||||
| Interest income |
18 | 10 | 2 | 2 | 3 | 4 | 6 | |||||||||||||||||||||
| Interest expense |
(28 | ) | (29 | ) | (39 | ) | (40 | ) | (22 | ) | (22 | ) | (28 | ) | ||||||||||||||
| Change in fair value of warrant liability |
(670 | ) | (721 | ) | (828 | ) | (299 | ) | (488 | ) | (39 | ) | (9 | ) | ||||||||||||||
| Other income (expense), net |
4 | 10 | (2 | ) | (51 | ) | (119 | ) | 10 | (52 | ) | |||||||||||||||||
|
|
|
|
|
|
|
|
|
|
|
|
|
|
|
|||||||||||||||
| Total other expense, net |
(676 | ) | (730 | ) | (867 | ) | (388 | ) | (626 | ) | (47 | ) | (83 | ) | ||||||||||||||
| Loss before for income taxes |
(6,567 | ) | (9,053 | ) | (7,756 | ) | (17,994 | ) | (17,310 | ) | (13,320 | ) | (10,186 | ) | ||||||||||||||
| Income tax expense |
— | — | (7 | ) | (50 | ) | — | (14 | ) | (26 | ) | |||||||||||||||||
|
|
|
|
|
|
|
|
|
|
|
|
|
|
|
|||||||||||||||
| Net loss |
$ | (6,567 | ) | $ | (9,053 | ) | $ | (7,763 | ) | $ | (18,044 | ) | $ | (17,310 | ) | $ | (13,334 | ) | $ | (10,212 | ) | |||||||
|
|
|
|
|
|
|
|
|
|
|
|
|
|
|
|||||||||||||||
61
Table of Contents
Index to Financial Statements
| (1) | Includes stock-based compensation as follows: |
| Three Months Ended | ||||||||||||||||||||||||||||
| March 31, 2014 |
June 30, 2014 |
Sept. 30, 2014 |
Dec. 31, 2014 |
March 31, 2015 |
June 30, 2015 |
Sept. 30, 2015 |
||||||||||||||||||||||
| (unaudited) | ||||||||||||||||||||||||||||
| (in thousands) | ||||||||||||||||||||||||||||
| Cost of revenue: |
||||||||||||||||||||||||||||
| Subscription |
$ | 4 | $ | 6 | $ | 14 | $ | 234 | $ | 24 | $ | 33 | $ | 49 | ||||||||||||||
| Professional services and other |
4 | 9 | 11 | 15 | 24 | 34 | 45 | |||||||||||||||||||||
| Sales and marketing |
42 | 60 | 72 | 2,703 | 181 | 241 | 346 | |||||||||||||||||||||
| Research and development |
45 | 116 | 146 | 3,664 | 240 | 287 | 344 | |||||||||||||||||||||
| General and administrative |
84 | 121 | 122 | 726 | 5,460 | 163 | 228 | |||||||||||||||||||||
|
|
|
|
|
|
|
|
|
|
|
|
|
|
|
|||||||||||||||
| Total stock-based compensation |
$ | 179 | $ | 312 | $ | 365 | $ | 7,342 | $ | 5,929 | $ | 758 | $ | 1,012 | ||||||||||||||
|
|
|
|
|
|
|
|
|
|
|
|
|
|
|
|||||||||||||||
| (2) | Includes payroll tax expense on secondary stock purchase transactions as follows: |
| Three Months Ended | ||||||||||||||||||||||||||||
| March 31, 2014 |
June 30, 2014 |
Sept. 30, 2014 |
Dec. 31, 2014 |
March 31, 2015 |
June 30, 2015 |
Sept. 30, 2015 |
||||||||||||||||||||||
| (unaudited) | ||||||||||||||||||||||||||||
| (in thousands) | ||||||||||||||||||||||||||||
| Cost of revenue: |
||||||||||||||||||||||||||||
| Subscription |
$ | — | $ | — | $ | — | $ | 30 | $ | — | $ | — | $ | — | ||||||||||||||
| Professional services and other |
— | — | — | — | — | — | — | |||||||||||||||||||||
| Sales and marketing |
— | — | — | 461 | — | — | — | |||||||||||||||||||||
| Research and development |
— | — | — | 653 | — | — | — | |||||||||||||||||||||
| General and administrative |
— | — | — | 81 | 1,327 | — | — | |||||||||||||||||||||
|
|
|
|
|
|
|
|
|
|
|
|
|
|
|
|||||||||||||||
| Total payroll tax expense on secondary stock purchase transactions |
$ | — | $ | — | $ | — | $ | 1,225 | $ | 1,327 | $ | — | $ | — | ||||||||||||||
|
|
|
|
|
|
|
|
|
|
|
|
|
|
|
|||||||||||||||
| (3) | Includes amortization of acquisition-related intangibles as follows: |
| Three Months Ended | ||||||||||||||||||||||||||||
| March 31, 2014 |
June 30, 2014 |
Sept. 30, 2014 |
Dec. 31, 2014 |
March 31, 2015 |
June 30, 2015 |
Sept. 30, 2015 |
||||||||||||||||||||||
| (unaudited) | ||||||||||||||||||||||||||||
| (in thousands) | ||||||||||||||||||||||||||||
| Cost of revenue: |
||||||||||||||||||||||||||||
| Subscription |
$ | — | $ | — | $ | — | $ | — | $ | — | $ | — | $ | — | ||||||||||||||
| Professional services and other |
— | — | — | — | — | — | — | |||||||||||||||||||||
| Sales and marketing |
— | — | — | — | — | — | — | |||||||||||||||||||||
| Research and development |
— | 2 | 2 | 2 | 2 | 2 | 3 | |||||||||||||||||||||
| General and administrative |
— | — | — | — | — | — | — | |||||||||||||||||||||
|
|
|
|
|
|
|
|
|
|
|
|
|
|
|
|||||||||||||||
| Total amortization of acquisition-related intangibles |
$ | — | $ | 2 | $ | 2 | $ | 2 | $ | 2 | $ | 2 | $ | 3 | ||||||||||||||
|
|
|
|
|
|
|
|
|
|
|
|
|
|
|
|||||||||||||||
62
Table of Contents
Index to Financial Statements
| Three Months Ended | ||||||||||||||||||||||||||||
| March 31, 2014 |
June 30, 2014 |
Sept. 30, 2014 |
Dec. 31, 2014 |
March 31, 2015 |
June 30, 2015 |
Sept. 30, 2015 |
||||||||||||||||||||||
| (as a percentage of total revenue) | ||||||||||||||||||||||||||||
| Revenue: |
||||||||||||||||||||||||||||
| Subscription and support |
88 | % | 85 | % | 85 | % | 86 | % | 86 | % | 84 | % | 84 | % | ||||||||||||||
| Professional services and other |
12 | 15 | 15 | 14 | 14 | 16 | 16 | |||||||||||||||||||||
|
|
|
|
|
|
|
|
|
|
|
|
|
|
|
|||||||||||||||
| Total revenue |
100 | 100 | 100 | 100 | 100 | 100 | 100 | |||||||||||||||||||||
|
|
|
|
|
|
|
|
|
|
|
|
|
|
|
|||||||||||||||
| Cost of Revenue: |
||||||||||||||||||||||||||||
| Subscription and support |
29 | 27 | 26 | 28 | 25 | 25 | 23 | |||||||||||||||||||||
| Professional services and other |
5 | 7 | 7 | 7 | 8 | 10 | 9 | |||||||||||||||||||||
|
|
|
|
|
|
|
|
|
|
|
|
|
|
|
|||||||||||||||
| Total cost of revenue |
34 | 34 | 33 | 35 | 33 | 35 | 32 | |||||||||||||||||||||
|
|
|
|
|
|
|
|
|
|
|
|
|
|
|
|||||||||||||||
| Gross profit |
66 | 66 | 67 | 65 | 67 | 65 | 68 | |||||||||||||||||||||
|
|
|
|
|
|
|
|
|
|
|
|
|
|
|
|||||||||||||||
| Operating expenses: |
||||||||||||||||||||||||||||
| Sales and marketing |
72 | 83 | 65 | 95 | 76 | 88 | 63 | |||||||||||||||||||||
| Research and development |
41 | 45 | 35 | 66 | 36 | 36 | 31 | |||||||||||||||||||||
| General and administrative |
21 | 25 | 22 | 32 | 69 | 25 | 22 | |||||||||||||||||||||
|
|
|
|
|
|
|
|
|
|
|
|
|
|
|
|||||||||||||||
| Total operating expenses |
134 | 153 | 122 | 193 | 181 | 149 | 116 | |||||||||||||||||||||
| Loss from operations |
(68 | ) | (87 | ) | (55 | ) | (128 | ) | (114 | ) | (84 | ) | (48 | ) | ||||||||||||||
|
|
|
|
|
|
|
|
|
|
|
|
|
|
|
|||||||||||||||
| Other income (expense): |
||||||||||||||||||||||||||||
| Interest income |
0 | 0 | 0 | 0 | 0 | 0 | 0 | |||||||||||||||||||||
| Interest expense |
0 | 0 | 0 | 0 | 0 | (0 | ) | (0 | ) | |||||||||||||||||||
| Change in fair value of warrant liability |
(8 | ) | (8 | ) | (7 | ) | (2 | ) | (3 | ) | (0 | ) | (0 | ) | ||||||||||||||
| Other income (expense), net |
0 | 0 | 0 | 0 | (1 | ) | 0 | (0 | ) | |||||||||||||||||||
|
|
|
|
|
|
|
|
|
|
|
|
|
|
|
|||||||||||||||
| Total other expense, net |
(8 | ) | (8 | ) | (7 | ) | (2 | ) | (4 | ) | (0 | ) | (0 | ) | ||||||||||||||
| Loss before income taxes |
(76 | ) | (95 | ) | (62 | ) | (130 | ) | (118 | ) | (84 | ) | (48 | ) | ||||||||||||||
| Income tax expense |
— | — | 0 | 0 | — | (0 | ) | (0 | ) | |||||||||||||||||||
| Net loss |
(76 | )% | (95 | )% | (62 | )% | (130 | )% | (118 | )% | (84 | )% | (48 | )% | ||||||||||||||
|
|
|
|
|
|
|
|
|
|
|
|
|
|
|
|||||||||||||||
| Three Months Ended | ||||||||||||||||||||||||||||
| March 31, 2014 |
June 30, 2014 |
Sept. 30, 2014 |
Dec. 31, 2014 |
March 31, 2015 |
June 30, 2015 |
Sept. 30, 2015 |
||||||||||||||||||||||
| (unaudited) | ||||||||||||||||||||||||||||
| (in thousands) | ||||||||||||||||||||||||||||
| Other Financial Data: |
||||||||||||||||||||||||||||
| Non-GAAP operating loss(1) |
$ | (5,712 | ) | $ | (8,009 | ) | $ | (6,522 | ) | $ | (9,037 | ) | $ | (9,426 | ) | $ | (12,526 | ) | $ | (9,088 | ) | |||||||
| Free cash flow(2) |
(8,335 | ) | (7,437 | ) | 7,491 | (14,517 | ) | (14,833 | ) | (15,000 | ) | 18,387 | ||||||||||||||||
| (1) | We define non-GAAP operating loss as operating loss before stock-based compensation, payroll tax expense on secondary stock purchase transactions and amortization of acquisition-related intangibles. For more information about non-GAAP operating loss, see the section titled “Selected Consolidated Financial Data—Non-GAAP Financial Measures.” |
| (2) | Free cash flow is a non-GAAP financial measure that we calculate as net cash provided by (used in) operating activities less purchases of property and equipment, net of proceeds from disposals of property and equipment. For more information about free cash flow, see the section titled “Selected Consolidated Financial Data—Non-GAAP Financial Measures.” |
63
Table of Contents
Index to Financial Statements
The following table provides a reconciliation of loss from operations to non-GAAP operating loss:
| Three Months Ended | ||||||||||||||||||||||||||||
| March 31, 2014 |
June 30, 2014 |
Sept. 30, 2014 |
Dec. 31, 2014 |
March 31, 2015 |
June 30, 2015 |
Sept. 30, 2015 |
||||||||||||||||||||||
| (unaudited) | ||||||||||||||||||||||||||||
| (in thousands) | ||||||||||||||||||||||||||||
| Loss from operations |
$ | (5,891 | ) | $ | (8,323 | ) | $ | (6,889 | ) | $ | (17,606 | ) | $ | (16,684 | ) | $ | (13,286 | ) | $ | (10,103 | ) | |||||||
| Stock-based compensation |
179 | 312 | 365 | 7,342 | 5,929 | 758 | 1,012 | |||||||||||||||||||||
| Payroll tax expense on secondary stock purchase transactions |
— | — | — | 1,225 | 1,327 | — | — | |||||||||||||||||||||
| Amortization of acquisition related intangibles |
— | 2 | 2 | 2 | 2 | 2 | 3 | |||||||||||||||||||||
|
|
|
|
|
|
|
|
|
|
|
|
|
|
|
|||||||||||||||
| Non-GAAP operating loss |
$ | (5,712 | ) | $ | (8,009 | ) | $ | (6,522 | ) | $ | (9,037 | ) | $ | (9,426 | ) | $ | (12,526 | ) | $ | (9,088 | ) | |||||||
|
|
|
|
|
|
|
|
|
|
|
|
|
|
|
|||||||||||||||
The following table provides a reconciliation of net cash provided by (used in) operating activities to free cash flow:
| Three Months Ended | ||||||||||||||||||||||||||||
| March 31, 2014 |
June 30, 2014 |
Sept. 30, 2014 |
Dec. 31, 2014 |
March 31, 2015 |
June 30, 2015 |
Sept. 30, 2015 |
||||||||||||||||||||||
| (unaudited) | ||||||||||||||||||||||||||||
| (in thousands) | ||||||||||||||||||||||||||||
| Net cash provided by (used in) operating activities |
$ | (8,073 | ) | $ | (6,479 | ) | $ | 8,084 | $ | (13,927 | ) | $ | (13,915 | ) | $ | (12,797 | ) | $ | 19,676 | |||||||||
| Less: purchases of property and equipment |
264 | 964 | 600 | 612 | 927 | 2,212 | 1,324 | |||||||||||||||||||||
| Plus: proceeds from disposals of property and equipment |
2 | 6 | 7 | 22 | 9 | 9 | 35 | |||||||||||||||||||||
|
|
|
|
|
|
|
|
|
|
|
|
|
|
|
|||||||||||||||
| Free cash flow |
$ | (8,335 | ) | $ | (7,437 | ) | $ | 7,491 | $ | (14,517 | ) | $ | (14,833 | ) | $ | (15,000 | ) | $ | 18,387 | |||||||||
|
|
|
|
|
|
|
|
|
|
|
|
|
|
|
|||||||||||||||
We have historically experienced some seasonality in terms of when we enter into customer agreements for our platform and applications, mostly around our academic customer’s typical fiscal year end of June 30. This seasonality is reflected to a much lesser extent, and sometimes is not immediately apparent, in our revenue, because we recognize subscription revenue ratably over the term of the subscription. In addition, we may experience variances in total customers over a particular quarter for a variety of business reasons, and the extent to which we gain or lose customers over a particular quarter will not necessarily correlate to the changes in revenue in that quarter or in future periods. As a result, a slowdown in our ability to enter into customer agreements may not be apparent in our revenue for the quarter, as the revenue recognized in any quarter is primarily from customer agreements entered into in prior quarters. Historical patterns should not be considered a reliable indicator of our future sales activity or performance.
Our revenue has increased over the periods presented above due to the significant increase in our customer base. Our operating expenses generally have increased sequentially in every quarter primarily due to increases in headcount and other related expenses to support our growth. The increase in stock-based compensation for the three months ended December 31, 2014 and March 31, 2015 included an investor purchase of common stock from current and former employees at a premium over the fair value, which resulted in additional stock-based compensation. For further details, see Note 1 to our consolidated financial statements. We anticipate our operating expenses will continue to increase in absolute dollars in future periods as we invest in the long-term growth of our business.
Our gross margin has continually improved as a result of higher revenue, lower hosting costs as a percentage of revenue and the efficient delivery of professional services.
64
Table of Contents
Index to Financial Statements
Liquidity and Capital Resources
As of September 30, 2015, we had $31.8 million of cash and cash equivalents. We believe our cash and cash equivalents, cash flows from operations and available borrowings under our credit facility will be sufficient to support our planned operations for at least the next 12 months. Our future capital requirements will depend on many factors including our growth rate, net revenue retention rates, the timing and extent of spending to support the expansion of sales and marketing and research and development activities, the introduction of new and enhanced offerings, and the continuing market acceptance of our platform. We may in the future enter into arrangements to acquire or invest in complementary businesses, services and technologies, and intellectual property rights. We may be required to seek additional equity or debt financing. If additional financing is required from outside sources, we may not be able to raise it on terms acceptable to us or at all. If we are unable to raise additional capital when desired, our business, operating results and financial condition may be adversely affected.
In June 2015, we entered into an amended and restated loan and security agreement, or credit facility, with Silicon Valley Bank. The agreement provides for up to $15.0 million in revolving borrowings (subject to increase to $25.0 million in the lender’s sole discretion). Availability is subject to a formula based on our monthly recurring revenue. Advances under the credit facility accrue interest at a floating per year rate equal to the prime rate plus 0.5%. The credit facility terminates in June 2017, at which time the principal amount of all outstanding advances becomes due and payable. We are obligated to pay a fee equal to 0.25% per year, payable quarterly in respect of any unused borrowing capacity under the credit facility. As of September 30, 2015 we did not have any outstanding borrowing under the credit facility.
To secure our obligations under the credit facility, we granted Silicon Valley Bank a security interest in substantially all of our tangible and intangible assets, excluding intellectual property. The credit facility contains customary events of default, conditions to borrowing, and covenants, including restrictions on our ability to dispose of assets, make acquisitions, incur debt, incur liens and make distributions and dividends to stockholders. The agreement also includes a financial covenant requiring the achievement of minimum bookings on a trailing three month basis, tested monthly. During the continuance of an event of default, SVB may accelerate amounts outstanding, terminate the credit facility and foreclose on the collateral. As of the date of this prospectus, we were in compliance with all covenants under the terms of the credit facility.
The following table shows our cash flows for 2013, 2014 and the nine months ended September 30, 2014 and 2015:
| Year Ended December 31, |
Nine Months Ended September 30, |
|||||||||||||||
| 2013 | 2014 | 2014 | 2015 | |||||||||||||
| (unaudited) | ||||||||||||||||
| (in thousands) | ||||||||||||||||
| Net cash used in operating activities |
$ | (8,634 | ) | $ | (20,395 | ) | $ | (6,468 | ) | $ | (7,036 | ) | ||||
| Net cash (used in) provided by investing activities |
(14,405 | ) | 10,003 | 10,593 | (5,366 | ) | ||||||||||
| Net cash provided by financing activities |
29,741 | 41,169 | 344 | 257 | ||||||||||||
Our cash flows are subject to seasonal fluctuations. A significant portion of our contracts have terms that coincide with our academic customers’ typical fiscal year-end of June 30. Historical experience has shown an increase in new and renewed contracts as well as anniversary billings, all of which immediately precede the beginning of our academic customers’ typical fiscal year-end. We typically invoice SaaS fees annually upfront with credit terms of net 30 or 60 days. In turn, our cash flows from operations are affected by this seasonality and are typically reflected in higher cash flow, accounts receivable and deferred revenue balances for the second and third quarter of each year.
65
Table of Contents
Index to Financial Statements
Operating Activities
Net cash used in operating activities consists primarily of net loss adjusted for certain non-cash items, including stock-based compensation, change in fair value of warrant liability, depreciation and amortization and other non-cash charges, net. We expect that we will continue to use cash from operating activities in 2015 as we continue to invest in and grow our business.
Net cash used in operating activities during the nine months ended September 30, 2015 primarily reflected our net loss of $40.9 million, offset by non-cash expenses that included $7.7 million of stock-based compensation, $2.1 million of depreciation and amortization, and $0.5 million in change in fair value of warrant liability. Working capital sources of cash included a net increase of $22.6 million in deferred revenue and accounts receivable primarily resulting from the previously discussed seasonal increases in new, renewed and anniversary contracts and our practice of invoicing our customers upfront annually. Also contributing to the source of cash was a $3.5 million increase in accounts payable and a $0.5 million adjustment to straight-line deferred rent expense, offset by a decrease in prepaid and other assets of $3.0 million.
Net cash used in operating activities during the nine months ended September 30, 2014 primarily reflected our net loss of $23.4 million, offset by non-cash expenses that included $2.2 million for the change in fair value of warrant liability, $1.5 million of depreciation and amortization, and $0.9 million in stock-based compensation. Working capital sources of cash included a net increase of $12.2 million in deferred revenue and accounts receivable primarily resulting from the growth in the number of customers invoiced during the period.
Net cash used in operating activities during 2014 primarily reflected our net loss of $41.4 million, offset by non-cash expenses that included $8.2 million in stock-based compensation, $2.6 million for the change in warrant liability, and $2.1 million of depreciation and amortization. Working capital sources of cash included a $12.5 million increase in deferred revenue primarily resulting from the growth in the number of customers invoiced during the period and a $2.5 million increase in accounts payable and accrued expenses as a result of a higher level of expenses consistent with the overall growth of the business. These sources of cash were offset by a $4.3 million increase in accounts receivable as a result of increased billings to customers consistent with the overall growth of the business, a $2.3 million increase in prepaid expenses and other assets resulting from a prepayment to one of our third-party hosting service providers and $0.3 million related for all other insignificant items. The change in net cash used in operating activities from 2013 to 2014 is primarily due to increases in employee-related costs as we continued to invest in and grow our business.
Net cash used in operating activities during 2013 primarily reflected our net loss of $22.5 million, offset by non-cash expenses that included $3.6 million of stock-based compensation, $1.5 million of depreciation and amortization, and $0.5 million for the change in warrant liability and $0.3 million related to other insignificant items. Working capital sources of cash included a $7.4 million increase in deferred revenue due to the growth in the number of customers invoiced during the period, a $2.7 million increase in deferred rent related to the move to our new corporate headquarters, and a $1.4 million increase in accounts payable and accrued expenses resulting from a higher level of expenses consistent with the overall growth of the business. These sources of cash were partially offset by a $2.1 million increase in accounts receivable as a result of increased billings to customers consistent with the overall growth of the business. A $1.4 million increase in prepaid expenses and other assets resulting from a prepayment to one of our third-party hosting service providers. The change in net cash used in operating activities during 2013 is primarily due to increases in employee-related costs as we continued to invest in and grow our business.
Investing Activities
Our investing activities have consisted primarily of property and equipment purchases for computer-related equipment and capitalization of software development costs. Capitalized software development costs are related to new applications or improvements to our existing software platform that expand the functionality for our
66
Table of Contents
Index to Financial Statements
customers. As our business grows, we expect that we will continue to invest in the expansion of, and improvements to, our leased spaces, both domestically and internationally.
Net cash used in investing activities during the nine months ended September 30, 2015 was $5.4 million, consisting primarily of $4.5 million of purchased property and equipment and capitalized software development costs and $1.5 million purchase of marketable securities, offset by $0.5 million of cash maturities from our marketable securities and other insignificant items.
Net cash provided by investing activities during the nine months ended September 30, 2014 was $10.6 million, consisting primarily of $13.8 million for the maturity and sale of marketable securities. These sources of cash were partially offset by $1.8 million of purchased property and equipment, $1.2 million purchase of marketable securities and $0.3 million acquisition of 12 Spokes.
Net cash provided by investing activities during 2014 was $10.0 million, consisting primarily of $13.8 million for the maturity and sale of marketable securities. These sources of cash were partially offset by a $2.4 million of purchased property and equipment and a $1.2 million purchase of marketable securities.
Net cash used in investing activities during 2013 was $14.4 million, consisting primarily of $13.4 million to purchase marketable securities and a $1.0 million purchase of property and equipment.
Financing Activities
Our financing activities have consisted primarily of issuances of preferred stock to fund our operations and, to a lesser extent, proceeds from the exercises of warrants and options. Cash flows used in financing activities consisted primarily of the repayment of capital leases.
Net cash provided by financing activities for the nine months ended September 30, 2015, consisted primarily of $0.3 million of proceeds received from warrant exercises and $0.2 million proceeds received from option exercises, offset by a $0.2 million repayment of capital lease obligations.
Net cash provided by financing activities for the nine months ended September 30, 2014, consisted primarily of $0.6 million of proceeds received from option exercises, offset by $0.2 million for the repayment of capital lease obligations and other insignificant items.
Net cash provided by financing activities for 2014, was $41.2 million, consisting primarily of $39.9 million of net proceeds received from the issuance of Series E preferred stock and $0.8 million of proceeds received from option exercises and $0.5 million for other insignificant items.
Net cash provided by financing activities for 2013, consisted primarily of net proceeds of $29.9 million received from the issuance of Series D preferred stock.
Contractual Obligations and Commitments
Contractual obligations are cash that we are obligated to pay as part of certain contracts that we have entered during the course of business. Below is a table that shows the projected outlays as of December 31, 2014:
| Payments due by Period: | ||||||||||||||||||||
| Total | Less than 1 Year |
1-3 Years |
3-5 Years |
More than 5 Years |
||||||||||||||||
| (in thousands) | ||||||||||||||||||||
| Capital lease obligation |
$ | 236 | $ | 236 | $ | — | $ | — | $ | — | ||||||||||
| Operating leases obligations |
50,135 | 4,570 | 13,941 | 9,988 | 21,636 | |||||||||||||||
|
|
|
|
|
|
|
|
|
|
|
|||||||||||
| Total |
$ | 50,371 | $ | 4,806 | $ | 13,941 | $ | 9,988 | $ | 21,636 | ||||||||||
|
|
|
|
|
|
|
|
|
|
|
|||||||||||
67
Table of Contents
Index to Financial Statements
We lease our office facilities under non-cancelable operating leases. As of December 31, 2014, we had leases that expire at various dates through 2025. In August 2015, we entered into a lease assumption agreement with total additional lease obligations of $6.6 million with a lease period expiring in 2027.
Off-Balance Sheet Arrangements
During 2013, 2014 and the nine months ended September 30, 2015 we did not have any relationships with any entities or financial partnerships, such as structured finance or special purpose entities established for the purpose of facilitating off-balance sheet arrangements or other purposes.
Qualitative and Quantitative Disclosures about Market Risk
We have operations both within the United States and internationally, and we are exposed to market risk in the ordinary course of business.
Foreign Currency Risk
Due to our international operations, we have foreign currency risks related to our revenue and operating expenses denominated in currencies other than the U.S. dollar, primarily the British Pound Sterling, Euro and Australian dollar. Our sales contracts are primarily denominated in U.S. dollars with a small number denominated in foreign currencies. In addition, a portion of our operating expenses are incurred outside the United States and are denominated in foreign currencies. Decreases in the relative value of the U.S. dollar to other currencies may negatively affect our revenue and other operating results as expressed in U.S. dollars. We do not believe an immediate 10% increase or decrease in the relative value of the U.S. dollar to other currencies would have a material effect on our operating results.
We have experienced and will continue to experience fluctuations in our net loss as a result of transaction gains or losses related to revaluing certain current asset and current liability balances that are denominated in currencies other than the functional currency of the entities in which they are recorded. We have recognized immaterial amounts of foreign currency gains and losses in 2013 and 2014. For the nine months ended September 30, 2015, we recognized $0.1 million of net foreign currency transaction losses. We have not engaged in the hedging of our foreign currency transactions to date, we are evaluating the costs and benefits of initiating such a program and may in the future hedge selected significant transactions denominated in currencies other than the U.S. dollar as we expand our international operation and our risk grows.
Interest Rate Risk
We hold cash and cash equivalents for working capital purposes. We do not buy and hold securities principally for the purpose of selling them in the near future nor do we intend to hold securities to maturity. Rather, our policy is focused on the preservation of capital, liquidity and return. From time to time, we may sell certain securities but the objectives are generally not to generate profits on short-term differences in price. We do not have material exposure to market risk with respect to investments, as any investments we enter into are primarily highly liquid investments. We had a $15 million credit facility with Silicon Valley Bank which was undrawn as of September 30, 2015. The interest accrued under the credit facility at a floating rate equal to the prime rate plus 0.5%. A 10% increase or decrease in interest rates would not result in a material change in either our obligations under the credit facility, even at the borrowing limit, or in the returns on our cash.
Income Taxes
As of December 31, 2014, we had approximately $59.1 million of federal and state net operating loss carryforwards available to reduce future taxable income that will begin to expire in 2028 for federal purposes and 2017 for state tax purposes. As of December 31, 2014, we also had federal research and development tax credit
68
Table of Contents
Index to Financial Statements
carryforwards of approximately $1.1 million and state research and investment credit carryforwards of $0.4 million. If not utilized, the federal and state carryforwards will expire at various dates through 2034.
Utilization of the net operating loss carryforwards may be subject to a substantial annual limitation due to the ownership change limitations provided by the Internal Revenue Code of 1986, as amended, and similar state provisions. The annual limitation may result in the expiration of net operating losses and credits before utilization. An analysis to determine the limitation of the net operating loss carryforwards has not been performed.
Due to our cumulative losses, we maintain a full valuation allowance against our deferred tax assets as of December 31, 2014. We consider all available evidence, both positive and negative, in assessing the extent to which a valuation allowance should be applied against our deferred tax assets.
Emerging Growth Company Status
Section 107 of the Jumpstart Our Small Business Startups Act, or JOBS Act, provides that an “emerging growth company” can take advantage of the extended transition period afforded by the JOBS Act for the implementation of new or revised accounting standards. However, we have chosen to irrevocably “opt out” of such extended transition period, and as a result, we will comply with new or revised accounting standards on the relevant dates on which adoption of such standards is required for non-emerging growth companies. Section 107 of the JOBS Act provides that our decision to not take advantage of the extended transition period for complying with new or revised accounting standards is irrevocable.
Critical Accounting Policies and Estimates
Our management’s discussion and analysis of financial condition and results of operations is based on our consolidated financial statements which have been prepared in accordance with accounting principles generally accepted in the United States of America. In preparing our financial statements, we make estimates, assumptions and judgments that can have a significant impact on our reported revenue, results of operations and net income or loss, as well as on the value of certain assets and liabilities on our balance sheet during and as of the reporting periods. These estimates, assumptions and judgments are necessary because future events and their effects on our results and the value of our assets cannot be determined with certainty, and are made based on our historical experience and on other assumptions that we believe to be reasonable under the circumstances. These estimates may change as new events occur or additional information is obtained, and we may periodically be faced with uncertainties, the outcomes of which are not within our control and may not be known for a prolonged period of time. Because the use of estimates is inherent in the financial reporting process, actual results could differ from those estimates.
The critical accounting estimates, assumptions and judgments that we believe have the most significant impact on our consolidated financial statements are described below.
Revenue Recognition
We primarily generate revenue from multiple element arrangements, which typically include subscriptions to our online software and support, implementation, training and consulting services. Our customers do not have the right to take possession of the online software solution. Revenue from subscriptions is recognized ratably over the subscription period beginning on the date the subscription is made available to customers. We recognize revenue from implementation over the customer life. We recognize revenue from training and consulting services as the services are provided. Amounts billed that have not yet met the applicable revenue recognition criteria are recorded as deferred revenue.
As part of accounting for multiple element arrangements, we must assess if each component has value on a standalone basis and should be treated as a separate unit of accounting. There is an in-depth process that we
69
Table of Contents
Index to Financial Statements
undergo to determine the standalone value for each component where we determine if an individual component could be sold by itself or if the component is sold by other third parties. If the component has standalone value upon delivery, we account for each component separately. Subscription services have standalone value as they are often sold separate from all other services. Implementation services do not have standalone value as they are not sold separately by us or by third parties. Training and consulting services also have standalone value as they are sold separately by us and by third parties.
We allocate total arrangement fees to each element in a multiple element arrangement based on the relative selling price hierarchy of each element. We are not able to establish vendor-specific objective evidence, or VSOE, the most reliable level of allocating standalone value, for our subscription implementation, training and consulting services because of our pricing practices. We note that third party evidence, or TPE, the second most reliable level of allocating standalone value, is not appropriate for determining the standalone value for any of our services because the pricing for any similar third party subscription or training or consulting services is inconsistent. Therefore, we rely on best estimate of selling price, or BESP, to allocate value to the various components of our arrangements.
We determine BESP by considering our overall pricing objectives and market conditions. Significant pricing practices taken into consideration for our subscription services, which may also include support, training, and professional services, include discounting practices, the size and volume of our transactions, the customer type, price lists, our pricing strategy, and historical stand-alone sales. The determination of BESP is made through consultation with and approval by our pricing committee. As our pricing strategies evolve, we may modify our pricing in the future which could result in changes in relative selling prices.
If our judgments change we would not expect to see a material effect on our consolidated financial statements.
We are evaluating the new revenue recognition guidance of ASC 606, effective January 1, 2018 and the adoption of this new guidance may have a material effect on the presentation of our consolidated financial statements.
Stock-Based Compensation
We measure and recognize compensation expense for all stock-based awards granted to our employees and other service providers, based on the estimated fair value of the award on the date of grant and on a straight-line basis over the vesting period of the award based on the estimated portion of the award that is expected to vest. We use the Black-Scholes option pricing model to measure the fair value of our stock-based awards when they are granted. We make several estimates in determining our stock-based compensation. These assumptions and estimates are as follows:
| • | Fair Value of Common Stock. As our stock is not publicly traded, we must estimate the fair value of common stock, as discussed in “Valuation of Common Stock” below. |
| • | Expected Term. The expected term represents the period that our stock-based awards are expected to be outstanding. The expected term assumptions were determined based on the vesting terms, exercise terms and contractual lives of the options. The expected term of employee option awards is determined using the average midpoint between vesting and the contractual term for outstanding awards, or the simplified method, because we do not yet have a sufficient history of option exercises. We consider this appropriate as we plan to see significant changes to our equity structure in the future and there is no other method that would be more indicative of exercise activity. |
| • | Expected Volatility. Since we do not have a trading history of our common stock, the expected volatility is determined based on the historical stock volatilities of our comparable companies. To determine our peer companies, we used the following criteria: software or software-as-a-service companies; similar histories and relatively comparable financial leverage; sufficient public company |
70
Table of Contents
Index to Financial Statements
| trading history; and in similar businesses and geographical markets. We used the peers’ stock price volatility over the expected life of our granted options to calculate the expected volatility. We intend to continue to apply this process using the same or similar public companies until a sufficient amount of historical information regarding the volatility of our own share price becomes available, or unless circumstances change such that the identified companies are no longer similar to us, in which case, more suitable companies whose share prices are publicly available would be used in the calculation. |
| • | Risk-Free Interest Rate. The risk-free interest rate is based on the implied yield available on U.S. Treasury zero-coupon issues with remaining terms similar to the expected term on the options. |
| • | Expected Dividend Yield. We have never declared or paid any cash dividends and do not plan to pay cash dividends in the foreseeable future, and, therefore, use an expected dividend yield of zero. |
We will continue to use judgment in evaluating the assumptions related to our stock-based compensation expense calculations on a prospective basis.
In addition to the assumptions used in the Black-Scholes option-pricing model, we must also estimate a forfeiture rate to calculate the stock-based compensation expense for our awards. Our forfeiture rate is based on an analysis of our actual forfeitures, although we do not have sufficient history, over the expected term. We will continue to evaluate the appropriateness of the forfeiture rate based on actual forfeiture experience, analysis of employee turnover and other factors. Changes in the estimated forfeiture rate can have a significant impact on our stock-based compensation expense as the cumulative effect of adjusting the rate is recognized in the period the forfeiture estimate is changed. If a revised forfeiture rate is higher than the previously estimated forfeiture rate, an adjustment is made that will result in a decrease to the stock-based compensation expense recognized in our financial statements. If a revised forfeiture rate is lower than the previously estimated forfeiture rate, an adjustment is made that will result in an increase to the share-based compensation expense recognized in our financial statements. See Note 9 to our consolidated financial statements for further information regarding stock-based compensation.
We have also recorded stock-based compensation for investor purchases of common stock and preferred stock from current and former employees to the extent the purchase price per share exceeded the fair value of such shares.
Valuation of Common Stock
Given the absence of an active market for our common stock, our board of directors was required to estimate the fair value of our common stock at the time of each option grant based upon several factors, including its consideration of input from management and contemporaneous third-party valuations.
The exercise price for all stock options granted was at the estimated fair value of the underlying common stock, as estimated on the date of grant by our board of directors in accordance with the guidelines outlined in the American Institute of Certified Public Accountants, Valuation of Privately-Held-Company Equity Securities Issued as Compensation. Each fair value estimate was based on a variety of factors, which included the following:
| • | contemporaneous valuations performed by unrelated third-party valuation firms; |
| • | the prices, rights, preferences and privileges of our preferred stock relative to those of our common stock; |
| • | the lack of marketability of our common stock; |
| • | our actual operating and financial performance; |
| • | current business conditions and projections; |
| • | our hiring key personnel and the experience of our management; |
| • | our history and the timing of the introduction of new applications and features; |
71
Table of Contents
Index to Financial Statements
| • | our stage of development; |
| • | the likelihood of achieving a liquidity event, such as an initial public offering or a merger or acquisition of our business given prevailing market conditions; |
| • | the illiquidity of stock-based awards involving securities in a private company; |
| • | the market performance of comparable publicly traded companies; and |
| • | U.S. and global capital market conditions. |
To allocate value to our common stock, we utilized either an option pricing method, or OPM, a probability weighted expected return method, or PWERM, approach or a hybrid method consisting of OPM and PWERM. The OPM treats common stock and preferred stock as call options on a business, with exercise prices based on the liquidation preference of the preferred stock. Therefore, the common stock only has value if the funds available for distribution to the holders of common stock exceeds the value of the liquidation preference of the preferred stock at the time of a liquidity event, such as a merger, sale, or initial public offering, assuming the business has funds available to make a liquidation preference meaningful and collectible by stockholders. The common stock is modeled as a call option with a claim on the business at an exercise price equal to the remaining value immediately after the preferred stock is liquidated. The OPM uses the Black-Scholes option-pricing model to price the call option.
The PWERM approach employs various market approach calculations depending upon the likelihood of various liquidation scenarios. For each of the various scenarios, an equity value is estimated and the rights and preferences for each shareholder class are considered to allocate the equity value to common shares. The common share value is then multiplied by a discount factor reflecting the calculated discount rate and the timing of the event. Lastly, the common share value is multiplied by an estimated probability for each scenario. The probability and timing of each scenario are based upon discussions between our board of directors and our management team. Under the PWERM, the value of our common stock is based upon four possible future events for our company: (1) an initial public offering, (2) an acquisition of our company, (3) remaining a private concern and (4) a liquidation scenario.
The market approach uses similar companies or transactions in the marketplace. We utilized the guideline company method of the market approach for determining the fair value of our common stock under the initial public offering scenarios. We identified companies similar to our business and used these guideline companies to develop relevant market multiples and ratios. We then applied these market multiples and ratios to our financial forecasts to create an indication of total equity value. Under the acquisition scenario, we utilized the guideline company method and the guideline transaction method of the market approach to determine the fair value of the common stock. The guideline transaction method compares the operating results and market value of the equity or invested capital of acquired companies similar to our business. Under the liquidation scenario, we assumed no value remained to be allocated to our common stockholders.
Following this offering, we will rely on the closing price of our common stock as reported by the New York Stock Exchange on the date of grant to determine the fair value of our common stock.
Based on the assumed initial public offering price per share of $17.00, the midpoint of the price range set forth on the cover page of this prospectus, the aggregate intrinsic value of our outstanding stock awards as of September 30, 2015 was $43.2 million, of which $19.6 million related to vested awards and $23.6 million related to unvested awards.
Recent Accounting Pronouncement
In May 2014, the Financial Accounting Standards Board, or FASB, issued Accounting Standards Update No. 2014-09, Revenue from Contracts with Customers (Topic 606), or ASU 2014-09, which amended the existing FASB Accounting Standards Codification. This standard establishes a principle for recognizing revenue
72
Table of Contents
Index to Financial Statements
upon the transfer of promised goods or services to customers, in an amount that reflects the expected consideration received in exchange for those goods or services. The standard also provides guidance on the recognition of costs related to obtaining and fulfilling customer contracts. In July 2015, the FASB decided to defer by one year the effective dates of its new revenue recognition standard for public and nonpublic entities. As a result, this guidance will be effective for public companies for interim and annual periods beginning on or after December 15, 2017. Public entities would be permitted to adopt the standard as early as the original public entity effective date; early adoption prior to that date would not be permitted. Once effective, entities can choose to apply the standard using either a full retrospective approach or a modified retrospective approach. We have not yet selected a transition method and are currently assessing the potential impact that this standard will have on our consolidated financial statements.
73
Table of Contents
Index to Financial Statements
LETTER FROM CHIEF EXECUTIVE OFFICER
Dear Instructure Investors,
When we went to market in 2011 with Canvas, our cloud-based learning management system for higher ed, we disrupted the stagnant LMS market with our simple strategy: Build a company focused on customer satisfaction and provide an open cloud platform that emphasizes user experience and continuous innovation.
In the last four years, we’ve created a successful sales, marketing and innovation machine that continues to roll forward globally. We currently have offices on four continents, with more than 700 employees, and our reach expands to millions of individual users through secured contracts with more than 1,600 customers, representing colleges, universities, K-12 school districts, and companies in more than 25 countries. Responding to demand from corporate users who liked what they saw with Canvas, we launched Bridge for corporate learning and training in 2015.
The hallmarks of success—high customer satisfaction and retention rates are the key factors, which we believe set us apart from other software companies. Customers love our software and our company’s open culture, which permeates every aspect of our technology, support and business operations.
We’ve built a team of smart, creative, passionate people who work hard to provide an awesome experience for our customers. Through Canvas and Bridge, we enable educational institutions and corporations to streamline workflows, provide anytime, anywhere access to information, and connect people, tools, and ideas seamlessly through an engaging, easy-to-use platform. We help millions of students, teachers and employees to achieve their education and learning goals. We make software that makes people smarter.
-josh
Josh Coates, CEO
Instructure
74
Table of Contents
Index to Financial Statements
Mission and Vision
Instructure’s mission is to make software that makes people smarter. Our vision is to help organizations everywhere leverage technology to maximize the potential of their people.
Overview
We provide an innovative, cloud-based learning management platform for academic institutions and companies worldwide. We built our learning management applications, Canvas, for the education market, and Bridge, for the corporate market, to enable our customers to easily develop, deliver and manage engaging face-to-face and online learning experiences. Our platform combines powerful, elegant and easy-to-use functionality with the reliability, security, scalability and support required by our customers.
In today’s dynamic, knowledge-driven economy, quality education and constant learning are critical to compete and succeed. Academic institutions recognize that for students to reach their maximum potential, they require a learning environment that is interactive and accessible. Similarly, companies need to deliver seamless and easy learning experiences to better attract, develop and retain talent and compete more effectively.
We develop software that millions of students, teachers and employees use to help achieve their education and learning goals. Our applications enhance academic and corporate learning by providing an engaging, easy-to-use platform for instructors and learners, enabling frequent and open interactions, streamlining workflow, and allowing the creation and sharing of content with anytime, anywhere access to information. Our platform runs on a modern, cloud-based architecture that enables users to teach, learn and engage across a wide variety of application environments, operating systems, devices and locations at any time. Our open standards allow for integration with third-party publishers and software providers to deliver additional learning content and applications. Our platform also provides data analytics capabilities enabling real-time reaction to information and benchmarking in order to personalize curricula and increase the efficacy of the learning process.
We offer our platform through a Software-as-a-Service, or SaaS, business model. Customers can rapidly deploy our applications with minimal upfront implementation. Customers also benefit from automatic software updates with virtually no downtime. Our SaaS business model substantially reduces the need for our customers to buy and support a broad range of IT infrastructure, and significantly reduces the cost, complexity and disruptions associated with implementations and upgrades of on-premise software.
We launched Canvas in February 2011 and have experienced rapid customer adoption in the education market. In addition, more than 100 corporate customers have implemented Canvas in order to deliver a more effective, simple way for their employees to learn. To better meet the needs of the corporate market, we leveraged our platform to develop Bridge, which launched in February 2015. As of September 30, 2015, we had more than 1,600 customers, representing colleges, universities, K-12 school districts, and companies in more than 25 countries.
For 2012, 2013 and 2014, revenue was $8.8 million, $26.1 million and $44.4 million, respectively, representing year-over-year growth of 197% and 70%. We have experienced net revenue retention rates of over 100% at each of December 31, 2012, 2013 and 2014. For 2012, 2013 and 2014, our net losses were $18.5 million, $22.5 million and $41.4 million, respectively, as we focused on growing our business. For the nine months ended September 30, 2015, revenue was $51.4 million and we incurred a net loss of $40.9 million.
75
Table of Contents
Index to Financial Statements
Industry Background
The Markets for Learning are Large, Growing and Highly Strategic
In today’s dynamic, knowledge-driven economy, students and employees must continuously develop knowledge and skills to compete and succeed. The pivotal role of learning, not only in academic settings but also in the corporate environment, has driven many organizations to seek out technologies and applications to help improve the creation and delivery of more effective learning experiences.
The market for academic and corporate learning management software is estimated to be $4.1 billion in 2015, and projected to grow to $7.8 billion in 2018, according to MarketsandMarkets. We attribute the rapid growth of this market, in part, to the migration of instructor-led training to online learning, which we believe will increase the adoption of learning management systems.
Corporate learning management software is part of the broader human capital management market, which also includes the recruiting, workforce management, performance management and compensation management software markets. IDC estimates that these additional markets will be $5.1 billion in 2015, and projected to grow to $6.4 billion in 2018. We believe these additional markets may present opportunities for us to develop additional applications on our platform over time.
Consumerization of Technology is Changing How People Interact, Learn, Train and Work
Recent innovations in consumer-oriented technology are changing how people expect to interact, learn, train and work. In particular, the ubiquity of social media and highly intuitive consumer and mobile applications have led instructors, students and employees to expect the same rich functionality, availability and usability from a learning platform. Users also expect learning management systems to provide a forum for discussion and collaboration to create a truly interactive user experience in addition to being a content delivery system.
Strong User Engagement Leads to Robust Data Analytics
Given today’s focus on accountability and performance, both academic institutions and companies are striving to improve learning outcomes. To do so, an organization must first understand the variables that impact results, such as attendance metrics, user engagement, and the efficacy of various learning content and technologies for individual learners. A learning management system has the potential to provide significant insight to educators and administrators on their students’ and employees’ progress toward meeting learning objectives and the factors impacting performance. In addition, such learning management systems can facilitate insightful benchmarking to allow organizations to explore other drivers of learning outcomes.
Strong user engagement with learning management systems is critical to maximize the potential of data analytics. High utilization enables the learning management system to capture more data, and leads to more insightful analyses on user behavior, quality of individual courses and effectiveness of digital content. Better analytics enables instructors and administrators to make more informed decisions about instruction and materials that in turn drive improved learning outcomes and performance for individuals and companies. This virtuous cycle among user engagement, data analytics and learning outcomes represents the evolution of learning technology. We believe that the market increasingly is demanding learning management software that delivers both robust analytics and strong user engagement.
Legacy Learning Management Systems Do Not Meet the Needs of Today’s Instructors, Students and Employees
Many traditional learning management systems are based on legacy technology architectures that do not meet the expectations of today’s users. We believe legacy learning management systems face the following key challenges:
| • | Poor User Experience. Learning management systems were first introduced over a decade ago. These systems often lack the features and interfaces to deliver a personalized, collaborative, engaging, mobile |
76
Table of Contents
Index to Financial Statements
| and always-on experience that users expect today. According to the Brandon Hall Group, 61% of companies are not highly satisfied with the feature set of their learning management systems. Users demand improved features, such as alerts, text, audio and video communication, collaboration tools, mobile access and personalization to help them achieve learning goals. |
| • | Not Mobile. Legacy learning management systems were not built for mobility and efforts to retrofit for use with mobile devices have often resulted in a poor user experience. This adversely impacts the usage of learning management systems as instructors, students and employees spend an increasing amount of time on their mobile devices. |
| • | Unreliable with Poor Uptime. Legacy learning management systems were not designed for cloud-based deployment. Traditional on-premise systems require downtime for maintenance, upgrades and unforeseen bug fixes, which can adversely impact instructors and students during critical times. |
| • | Low Utilization. Legacy learning management systems have historically been plagued by user dissatisfaction resulting in low utilization rates. In 2014, ECAR found that only 47% of faculty members use their learning management systems daily and only 41% of faculty members use a learning management system to interact with students outside the classroom. We believe lack of utilization adversely affects the investments these institutions have made in their learning management systems. According to the Brandon Hall Group, 48% of users are looking to leave their current learning management system and move to a new provider. |
| • | Expensive. Legacy learning management systems require substantial upfront and ongoing investments in IT infrastructure to implement and maintain an on-premise solution. Organizations often choose not to deploy software or to delay upgrades to newer versions due to concerns regarding costs, lengthy implementation and customization cycles, and potential business disruptions. This makes it difficult for organizations to respond quickly to changing needs and often results in outdated or different versions of applications running across various departments or geographies within organizations. |
| • | Limited Reach and Complexity of Data Analytics. While legacy learning management systems have historically enabled the capture of data, access has been generally limited to administrators and teachers and not to students. Further, analytics tools currently offered in existing on-premise solutions can be limited in capabilities making it difficult to translate the data into useful, actionable information. |
| • | Closed Ecosystem. Legacy learning management solutions are often closed systems, which can limit the number of third-party integrations into a platform. Customers are forced to spend time and often money to obtain separate integration contracts with third-party publishers and software providers. Consequently, it is more difficult for them to take advantage of the growing and robust set of learning, human resource and other applications available in open ecosystems. |
Our Platform
We designed our platform to enable users to teach, learn and collaborate anytime, anywhere, across a wide variety of application environments, operating systems, devices and locations. We believe our platform offers the following key benefits:
| • | Intuitive User Experience. We provide elegant and intuitive user interfaces that leverage familiar, consumer web navigation techniques, such as drag and drop, to make it easy to use our platform. We designed our system from the ground up, with modern, web-based design features, to create a differentiated user experience. We enable seamless collaboration among instructors and learners to share feedback and encourage online discussion forums. These interactive features extend learning beyond the physical classroom and facilitate a more engaging learning experience. Users can easily add audio, wikis, online workspaces, social media options and other collaboration tools to their online courses. Furthermore, our video-integrated functionality strengthens instructor-to-student and peer-to-peer online relationships and improves overall retention and usage rates. |
77
Table of Contents
Index to Financial Statements
| • | Optimized for Mobile. Our mobile-optimized platform allows users to access their applications anytime and anywhere. We offer a “mobile first” responsive design to ensure an optimal experience on most devices and, for Canvas, we also have iOS and Android native mobile applications available for free download on both phones and tablets. |
| • | High Availability and Uptime. Our software is mission-critical for our users and customers and we focus on maintaining enterprise-grade reliability at all times. Our standard contracts provide for guaranteed 99.9% annual uptime. We achieved 99.9% uptime during 2014 while our customer base grew over 75%. |
| • | High Utilization. Over ten million instructors, students and employees have used our software over the 12 months ended September 30, 2015. According to self-reported data in an ECAR 2014 survey, 58% of faculty in higher education use a learning management system to share content with students, while our internal analysis of higher education institutions using Canvas shows that 71% of faculty use Canvas to share content with students. |
| • | Native Cloud-based Software. Our cloud-based delivery model enables customers to rapidly deploy our applications to experience immediate benefit. Software updates are implemented regularly and transparently. Our single-instance, multi-tenant architecture is designed to scale to support our rapid growth. We increased our number of customers by over 750 during the 12 months ended September 30, 2015. Our cloud-based platform provides upfront cost savings over on-premise solutions by reducing the need for expensive IT resources and hardware infrastructure. |
| • | Open Access to Data Analytics. Our platform provides users with open API access to data analytics. We deliver the analytics in an easy to understand and consumable way, that is optimized for independent analysis. This open visibility allows learners to view their own progress in real-time, educators to adjust programs and personalize curricula for maximum effectiveness and organizations to benchmark user data internally and respond to patterns observed. |
| • | Open Platform. We are committed to collaboration and openness. Our open standards allow organizations to easily deliver additional learning content and applications from third-party publishers and software providers. This extends the content, tools and services necessary to satisfy the diverse needs of our customers without sacrificing the innate simplicity of our platform. Canvas users can deploy third-party content and software applications within the application interface or browse our EduAppCenter.com’s growing catalog of approximately 200 integrations. Bridge was specifically designed to integrate easily via open APIs with a variety of enterprise resource planning and human resources information systems. |
Our Growth Strategy
We are pursuing the following strategies to grow our business:
| • | Grow our U.S. Customer Base. We believe that the market for learning management systems remains significantly underserved. K-12 academic institutions have yet to widely adopt learning management systems, while most higher education institutions have adopted legacy systems with which they are often unsatisfied. In the corporate market, there are both greenfield opportunities and opportunities to displace legacy solutions that do not meet customer needs. As a result, we believe there is opportunity to substantially expand our base of U.S. academic and corporate customers. Toward that end, we are making significant investments in growing our direct sales team, particularly focused on the corporate market. |
| • | Further Maximize our Existing Customer Base. The majority of our academic customers implement Canvas widely within their institutions and across school districts. This approach to wide initial deployments allows us to efficiently and broadly promote adoption and utilization of Canvas by students and faculty. We plan to increase revenue from this customer base by selling additional applications and services. We plan to further penetrate our existing corporate customer base by growing the number of users on our platform and expanding enterprise wide. We believe our user-based pricing model and innovative applications provide us with a substantial opportunity to increase the value of our existing customer base. |
78
Table of Contents
Index to Financial Statements
| • | Continue to Expand Internationally. We believe there is a significant opportunity for our cloud-based learning management platform outside of the United States and we intend to expand our direct and indirect sales force to further penetrate international markets. We opened our international headquarters in London in June 2014, and for the nine months ended September 30, 2015, international customers accounted for 6% of our revenue. |
| • | Continue to Innovate and Offer New Applications. We will continue to make significant investments to further enhance the functionality of our existing applications, expand the number of applications on our extensible learning platform and develop into adjacent markets that will benefit our customers. We take a strategic approach to research and development investment. For example, in 2015, we launched Bridge to better serve our corporate customers because we saw corporate customers adopt Canvas, due to a lack of suitable alternatives. |
Our Applications
Our applications enhance academic and corporate learning by providing a system of engagement for teachers and learners, enabling frequent and open interactions, streamlining workflow, and allowing the creation and sharing of content with anytime, anywhere access to information. Our applications also provide users with powerful, easy-to-use functionality, to intuitively interact with course content and activities. All of our applications run on our extensible platform, which allows us to easily deploy new applications and features to support the needs of our customers. We use modern mobile technology to provide anytime, anywhere access to our applications from a wide array of devices, including personal computers, tablets and smartphones. We also have iOS and Android native mobile applications for Canvas available for free download.

79
Table of Contents
Index to Financial Statements
Canvas
Canvas is designed for our K-12 and higher education customers. Our customers use Canvas’s extensive set of flexible content creation, management and delivery tools to support and enhance face-to-face and online instruction.
Canvas enables instructors and learners to:
| • | post and discuss content such as assignments, quizzes, announcements and class notes; |
| • | choose, manage and change courses; |
| • | automate classroom activities, including the syllabus, attendance and calendar of course events; |
| • | perform outcomes-based assessments; |
| • | facilitate text, audio and video communications for enhanced teacher and student engagement; |
| • | grade assignments, using SpeedGrader, and post grades online; |
| • | access an integrated learning object repository; |
| • | analyze course and student data to improve learning outcomes and teaching methods; |
| • | set personalized academic goals and track performance; and |
| • | provide parental access to assignments and grades. |
Canvas supports standards-based integration with hundreds of third-party publishers and software providers. The extensibility of the Canvas application enables our customers to build the learning and teaching environment that meets their unique organizational needs.
Canvas Network
Canvas Network allows anyone around the world access to open online courses for personal and professional development. Through Canvas Network, academic institutions have the flexibility to offer and deliver courses over the internet to a much broader audience than just their own employees or on-campus students. Some institutions choose to pursue a massive open online course, or MOOC, format, and some choose to pursue a smaller online course format with more interaction. Institutions already using Canvas can easily move courses onto Canvas Network, extending their reach and enhancing their brand.
Canvas Data
Canvas Data provides access to a complete data set of user activity. This includes course activity information, assessment and evaluations, discreet page views, attendance metrics, user engagement, individual curricula, and demographic data, including user and device characteristics. Data is delivered in a format optimized to perform queries and reporting, making it easier for administrators to benchmark, customize teaching and improve learning outcomes.
Canvas Catalog
Canvas Catalog is a white-label, web-based course catalog and registration system that enables organizations to build and maintain a branded marketplace for their online course offerings. Catalog provides a searchable course index, custom course landing pages, collections of courses in specialized programs, automatically distributed certificates and other recognitions of completion, and online payment gateways for student registration and enrollment.
80
Table of Contents
Index to Financial Statements
Bridge
Bridge is designed to enable corporate customers to deliver impactful learning to accelerate employee progression and address the unique development needs of their workforce. Through Bridge, we have streamlined employee learning by offering a consumerized, mobile experience that is easy to use for both administrators and learners.
Bridge enables organizations to:
| • | create courses and training content; |
| • | deliver and track compliance and regulatory requirements; |
| • | create surveys to assess employees’ knowledge, ability and sentiment; |
| • | personalize courses based on feedback, need or job; |
| • | align employees to support organizational goals; |
| • | assign required training; |
| • | organize and group courses by various categories; |
| • | track employee learning progress; |
| • | provide a mobile experience to allow course access and management anywhere, from any device; and |
| • | extend training to reseller channels and other distribution networks. |
Bridge incorporates real-time feedback between managers and employees so that organizations can quickly respond to changing needs. Bridge offers integrated survey capabilities that enable organizations to diagnose organizational misalignment, as well as knowledge gaps, which can then be remediated through targeted and engaging learning experiences.
Technology and Standards
The technologies used to build our platform and applications are native cloud, multi-tenant and designed to scale to millions of users. We utilize a modern technology stack to take advantage of advancements in web-design, open source technologies, scalability, and security. We have implemented industry-standard best security practices to help us protect our servers and our customers’ critical information.
Our platform and applications are hosted on cloud infrastructure provided by Amazon Web Services, or AWS. Our hosting services provide full support, rolling release upgrades/updates, backup, and disaster recovery services. We primarily use Elastic Compute Cloud, or EC2, along with load balancing, auto scaling and storage, or S3, provided by Amazon. Our infrastructure enables us to scale horizontally and rapidly adjust to variances in usage, at the server, database and file store level. Our applications run on virtualized instances in Tier III and Tier IV AWS data center facilities, which provide industry-standard best security practices. As of September 30, 2015, we used AWS data center facilities located in Virginia, Oregon, Dublin, Ireland, Sydney, Australia and Singapore and intend to expand operations to other regions based on market conditions. These facilities have earned multiple certifications including, but not limited to, SOC 2 Type II, ISO9001 and ISO27001.
We designed our platform to be resilient to failure and capable of rapid recovery from component failure. We apply a wide variety of strategies to achieve 99.9% uptime, excluding scheduled maintenance. During 2014, we achieved 99.9% uptime. We have automated procedures in place to handle coordinated changes across our various instances and store backups of key databases in multiple redundant and geographically isolated locations.
Our technology stack is a dynamic web application built with our own automated scaling and provisioning technologies. We use Web 2.0 technologies like Ruby on Rails and Node.js, which provide users a familiar web
81
Table of Contents
Index to Financial Statements
experience. Our platform is built on underlying open source technologies, taking full advantage of advancements in scalability and flexibility. We utilize Linux and React operating systems, Postgres and Cassandra databases, and Redis value store. Our platform also provides an API that third-parties can use to add new features and functionality.
Keeping the platform secure is a primary focus of our operations team due to the sensitive nature of the data contained within the platform. We maintain a high level of diligence around data security and have chosen to adopt the AICPA SOC2 set of security controls and demonstrate compliance with these controls through annual audits and web application vulnerability assessments.
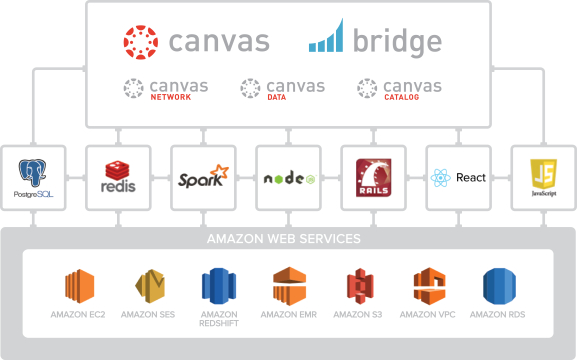
Customers
As of September 30, 2015, we had more than 1,600 customers representing colleges, universities, school districts, and companies in more than 25 countries. We have K-12 customers in 48 of 50 states. The majority of our academic customers implement Canvas widely within their institutions and across school districts. Canvas is used by seven Ivy League schools. We define a customer as an entity with an active subscription contract. In situations where there is a single contract that applies to entities with multiple subsidiaries or divisions, universities or schools, only the entity that has contracted for our platform is counted as a customer. For example, a contracting school district is counted as a single customer even though the school district encompasses multiple schools. In 2014, no single customer represented more than 10% of our revenue. The following sets forth a list of representative customers:
82
Table of Contents
Index to Financial Statements
Customer Case Studies
By using our applications to deliver an online learning experience, many customers benefit from an easy to use environment that gives access to insightful analytics, which can lead to significant cost savings. The case studies below illustrate the results that certain of our customers have achieved by using our platform.
Pasco County Schools
Situation: Beginning in 2008, Pasco County (along with every school district in Florida) was required by state law to offer a full-time virtual program for K-12 students. In response, the Pasco eSchool was launched in 2009. Its first four years were spent juggling numerous learning management systems to comply with rigid vendor requirements that course content be delivered using proprietary systems. And just as the eSchool began using Moodle, district schools were moving independently toward other learning management systems.
Solutions and Benefits: In 2012, Pasco County assembled an internal team to begin investigating a new learning management system that could simplify the district’s technology landscape. After narrowing the choice to four finalists, Pasco County chose Canvas because of its robust feature set, ease of use, customer-responsiveness, and open API, which allowed the district to customize the learning management system to meet current and future needs for both its virtual and in-school programs. To ensure the success of its implementation goals, the district purchased Premium Canvas Training and Support Packages. Pasco reported the following benefits from using Canvas:
| • | expanded reach with full time virtual program; |
| • | offered more courses to more students (both virtual and in-school); |
| • | offered and tracked professional development; |
| • | created a culture of teachers comfortable with teaching with technology; |
| • | easily integrated with other education applications; and |
| • | increased communication between teachers, students, and parents. |
University of Central Florida
Situation: The University of Central Florida, or UCF, is the second-largest university in the United States. Its 12 colleges offer 210 degree programs and serves approximately 61,000 students. UCF delivers 38% of its total credit hours online. It needed a learning management system that was flexible and that could be customized to meet UCF’s unique needs.
Solutions and Benefits: In 2012, UCF selected Canvas. UCF particularly valued Canvas’ extensibility and began implementing the platform with teachers and students as part of its distributed learning initiative. UCF’s Canvas usage has since grown and the university often participates in beta environments for new product and feature releases. Most recently, UCF began using Canvas Data to identify patterns and trends in its data. UCF reports the following benefits from using Canvas:
| • | a customized platform to fit its unique needs; |
| • | expanded capacity within the platform by building a suite of custom integrations; |
83
Table of Contents
Index to Financial Statements
| • | continual updates incorporate technical and pedagogical improvements, allowing instructors and designers to achieve a balanced approach in their online courses; and |
| • | high usage and user adoption. |
Richland Community College
Situation: Richland Community College was in need of a new learning management system to replace what they were currently using, which had been bought by another company and was now being shut down. They wanted a learning management system that was intuitive and agile, not slow and cumbersome like what they had been using.
Solution and Benefits: In May 2012, after evaluating several learning management systems, Richland Community College chose Canvas because of its student and teacher-friendly, easy-to-use interface. In May 2012, it began a soft, one-year roll out with select teachers and students. Then in summer 2013, they rolled out Canvas to the entire institution. To the faculty’s surprise, even though it was a new system for much of the faculty and students, the number of support tickets decreased dramatically from day one. In addition to this, Richland reported the following benefits from using Canvas:
| • | improved faculty/student communication; |
| • | experienced lower system and integration frustration; |
| • | reduced grading controversy due to easy-to-use gradebook with straight-forward insight into performance and grades; |
| • | less time spent uploading and locating content; |
| • | comfort in knowing Canvas support person is there anytime to answer any question they can’t figure out on their own; and |
| • | teachers and students report feeling comfortable with the learning management system and that it helps them to be successful. |
University of Birmingham
Situation: In 2013, the University of Birmingham’s legacy virtual learning environment was ready for review. It was time for the University’s digital learning team to seek a teaching and learning environment that was a better fit for their five-year digital strategy for growth and excellence in teaching and learning. The University sought a solution that would not only deliver a fully-integrated, connected University, but also provide a teaching and learning environment that was scalable, modern and appealing to both academic staff and digitally-native learners. The University was looking for a state-of-the-art solution that came with guaranteed reliability, accessibility and scalability, which could also set them apart from the competition.
Solution and Benefits: Canvas offered a collaborative solution for the University’s teaching and learning environment. Canvas is a cloud-based platform, which meant it could cope with increased usage at key times throughout the academic year in line with the University’s requirements. Canvas’ user-interface was designed to be easy-to-use, modern and accessible on multiple web browsers and devices in line with the University’s requirements.
The University of Birmingham implemented the system and set an 18-month window for all content to be transitioned to Canvas. However, in practice, this period has proven to be much shorter, with staff actively choosing to use the new platform. Within three months more courses were on Canvas than had been available in the penultimate year of the previous platform.
84
Table of Contents
Index to Financial Statements
Clearlink
Situation: In early 2014, Clearlink, a provider of content and conversion services, saw the increasing need to have an empowered centralized platform for training their growing sales teams efficiently and effectively. Understanding their need for a robust and easy-to-use learning management system, they went out into the market looking for a solution. They were impressed by the growth of Instructure and started exploring our corporate product, Bridge. Clearlink wanted a simple, cost effective solution that could deliver vendor information to the sales floor quickly and consistently, without pulling the inbound sales teams away from their phones. In choosing a new learning management system, an easy-to-use interface and reporting were both critical components of Clearlink’s decision making process. By late 2014, Clearlink picked Bridge as their learning management system.
Solutions and Benefits: After evaluating Bridge extensively, Clearlink chose Bridge for multiple reasons, including:
| • | an easy to navigate user interface; |
| • | an intuitive user experience for better adoptability; |
| • | Bridge easily creates programs and quizzes for content contributors; |
| • | quick and efficient response and interaction with the Instructure team; and |
| • | Instructure cares about Clearlink’s success. |
Since implementation in January 2015, Clearlink has developed over 43 courses and enrolled close to 1,600 employees. Each course has provided significant savings to Clearlink by allowing agents to consume trainings at their workstations and on their mobile devices. The ability to deliver training “virtually” has deepened learner engagement with information critical to creating quality sales. Additionally, key partners who rely on Clearlink’s unique customer acquisition capabilities are benefiting from Bridge’s capabilities. Instead of relying on a costly and time-consuming effort to send trainers, training materials and support to conduct on-site training events, brand-partners can now share their content directly with Clearlink to be consumed through Bridge. This has saved each organization significant time and expense and deepened the already strong relationship of trust. Additionally, the “real-time” access to training has allowed Clearlink to drive performance in important metrics such as answer rate percentage, sales conversion and unavailable time.
Sales and Marketing
We sell our applications and services through a direct sales force. Our sales organization includes technical sales engineers who serve as experts in the technical aspects of our applications and customer implementations. Many of our sales efforts require us to respond to request for proposals, particularly in the higher education space and to a lesser extent in K-12, and to a minimal extent in the corporate market. As of September 30, 2015, our sales function consisted of 143 employees, the majority of whom were direct quota-based sales representatives. As we grow internationally, we may use reseller partnerships as needed to penetrate certain new markets.
We engage in a variety of traditional and online marketing activities designed to provide sales lead generation and sales support and promote brand awareness. Our specific marketing activities for lead generation include advertising in trade publications, digital advertising, including search engine optimization and search engine marketing, display search and referral marketing. Brand awareness activities include press relations in business, human resources, education publications and blogs, market specific advertising campaigns and speaking engagements, and industry trade-shows and seminars. We also host InstructureCon, our annual user conference for current customers and prospects. Nearly 1,700 people attended InstructureCon 2015 in Park City, Utah.
85
Table of Contents
Index to Financial Statements
Customer Success
We view strong customer support and services as essential for customer retention even though our applications are easy to adopt and use. The majority of our services and support is offered by phone and online audio and video conferencing rather than in person, resulting in a more efficient and cost effective business model for us and our customers. As of September 30, 2015, our Customer Success department, responsible for all customer post-sale interaction, consisted of 212 employees located in the United States, the United Kingdom and Australia. Our services and support efforts include the following:
| • | Customer Success Management. We have created a strong Customer Success Management team to assist customers throughout the deployment and production lifecycle. They provide coverage available to all customers as part of their standard subscription as well as other service offerings. |
| • | Implementation Services. We believe that a positive onboarding experience leads to more satisfied customers, longer customer relationships and greater lifetime value. Our standard implementation takes anywhere from 30 to 90 days depending on customer-side complexity and timelines. It includes regularly scheduled and highly-structured activities to ensure customers progress toward actually and effectively using our applications. Most of these interactions take place over the phone and through online audio and video conferencing. |
| • | Training Services. Also critical to customer success is our customers’ comfort level with the features and functionality of our applications. We include training with every implementation and offer additional training for a fee. The training offered is intended to engender confidence among users so they can be successful with our platform. Most training is performed remotely by online audio and video conferencing. |
| • | Consulting Services. In addition to our implementation and training offerings, we provide custom application development, integrations, content services, and change management consulting. These services are architected to boost customer adoption of our applications and to drive usage of features and capabilities that are unique to Instructure, which we believe increases brand loyalty and lifetime value. |
| • | Support. We provide standard support services, which can be upgraded to our premium support services to include 24/7 coverage and an improved service level agreement. Our Tier 1 offering includes our premium support services as well as direct support to users by our agents. We also provide extensive user guides and online videos for the ongoing education and assistance of our users. During the 12 months ended September 30, 2015, more than 95% of our support users that responded to our survey reported they were satisfied with their experience when surveyed about their interactions with Instructure. |
Partner Ecosystem and Integration
We are committed to enabling our customers to build an ecosystem for successful learning. Our open platform is central to both our technology and our strategy.
From a technological perspective, we remain focused on implementing industry standards like IMS Global Learning Consortium’s Learning Tools Interoperability and Learning Information Services, allowing for robust integrations between Canvas and a large spectrum of third-party solutions to be offered to our customers.
Our partnership program invites third-party software, service and content providers, through an extensive library of APIs, to easily integrate with our applications and at no or minimal charge to the partner. This allows us to broaden and efficiently extend the functionality of our applications. We have over 100 partners, including Pearson, Cengage, Gooru, Ex Libris, Panopto, AspirEdu, Boundless Learning, iParadigms, Verificient Technologies, Zaption and Harvard Business Publishing.
86
Table of Contents
Index to Financial Statements
Research and Development
Our product, customer success, and sales and marketing teams operate cross-functionally and regularly engage with customers, partners and industry analysts to understand customer needs and general industry trends to enhance our existing applications. Additionally, our research and education team analyzes user data and current online learning trends and collaborates with customers to inform application development and growth into adjacent markets. Once application improvements are identified, the entire development organization works closely together to design, develop, test and launch new functionality and application updates. We have made, and will continue to make, significant investments to strengthen our existing applications, and expand the number of applications on our extensible learning platform that will benefit our customers and allow us to expand into new markets.
Culture and Employees
We are passionate about making learning and working more engaging and accessible for people everywhere and we apply that same vision at Instructure every day. We maintain seven values that we believe set us apart, define our company culture and serve as a strategic advantage as they are directly aligned with the experience we strive to provide to our customers.
| • | Customer Experience. We aspire to create an awesome customer experience in every interaction with our applications and people. |
| • | Openness. Instructure is built on openness—it’s part of who we are. Open doors. Open office. Open source. We have created an open work environment without offices to increase collaboration and transparency—and to reflect the open learning platform environment we provide to our customers. |
| • | Ownership. Everyone’s an owner because each of us can have a significant impact on our ability to succeed. Full-time Instructure employees receive equity grants and can participate in the success and growth of the company. |
| • | Trust. We have a clear “tell us if we’re doing something stupid” policy. Everyone is encouraged to offer input and feedback regardless of level of experience or position. Questioning the status quo is part of our DNA and supports us in continuing to disrupt and transform our markets. |
| • | Integrity. Simply put, we say what we’re going to do and then we do it. We hold people accountable for results and commitments. Our objectives and commitments are openly shared throughout the company. |
| • | Excellence. Achieving excellence isn’t easy. But we believe it can be simple. Instructure pursues the leading edge of innovation in our technology, support, and business operations. We do this by hiring smart, creative, passionate people and giving them opportunities to create awesome. |
| • | Simplicity. Our platform is designed to make teaching, learning, and engaging easier. Everything we do—from designing software to how we communicate—should reflect that. Keep it simple and easy to understand. |
Since our founding, we have worked hard to retain our open and engaging culture with people who are passionate about improving learning. We have received multiple “best places to work” awards and have maintained high ratings on recruiting websites. As of September 30, 2015, we had 709 full-time employees.
Competition
We operate in highly competitive markets. Canvas primarily competes with systems offered by Blackboard, Desire2Learn and Moodle in the education market. Bridge primarily competes with systems offered by Cornerstone OnDemand, Saba Software and SumTotal Systems (owned by Skillsoft) along with dozens of small,
87
Table of Contents
Index to Financial Statements
specialized systems for specific industries to large, generalized systems provided as part of a larger human resources management suite.
We may face future competition in our markets from other large, established companies, as well as from smaller specialized companies.
The principal competitive factors in our markets include the following:
| • | usability and features; |
| • | reliability and uptime; |
| • | service and support for users and staff; |
| • | software integration and third-party publisher partnerships; |
| • | mobile capabilities; |
| • | data analytics; and |
| • | collaboration and engagement. |
We believe that we compete favorably on the basis of these factors. Our ability to remain competitive will depend to a great extent upon our ongoing performance in the areas of product development, partner ecosystem development and customer support. In addition, many of our competitors, particularly the large software companies named above, may have greater name recognition, longer operating histories and significantly greater resources. Some competitors may be able to devote greater resources to the development, promotion and sale of their products than we can to ours, which could allow them to respond more quickly than we can to changes in customer needs. We cannot assure you that our competitors will not offer or develop products or services that are superior to ours or achieve greater market acceptance.
Intellectual Property
We rely on a combination of trade secret, copyright, and trademark laws, a variety of contractual arrangements, such as license agreements, assignment agreements, confidentiality and non-disclosure agreements, and confidentiality procedures and technical measures to gain rights to and protect the intellectual property used in our business. We actively pursue registration of our trademarks, logos, service marks, and domain names in the United States and in other key jurisdictions, but we have not, to date, applied for patent protection for any of our inventions. We are the registered holder of a variety of U.S. and international domain names that include the term Instructure, Canvas and Bridge.
A substantial portion of our Canvas application, including the base code, uses “open source” software we license from third parties. Open source software is made available to the general public on an “as-is” basis under the terms of a non-negotiable license. Open source software is generally freely accessible, usable and modifiable. Certain open source licenses, like the GNU Affero General Public License may require us to offer the components of our software that incorporate the open source software for no cost, make available source code for modifications or derivative works we create based upon incorporating or using the open source software, and license such modifications or derivative works under the terms of the particular open source license. We also rely on certain intellectual property rights that we license from third parties under proprietary licenses. Though such third-party technologies may not continue to be available to us on commercially reasonable terms, we believe that alternative technologies would be available to us.
To promote our open platform philosophy, we make available a substantial portion of the source code for Canvas available to the public on the “GitHub” platform for no charge, under the terms of the GNU Affero General Public License. We accept modifications of the source code for Canvas from contributors who agree to
88
Table of Contents
Index to Financial Statements
the terms of our contributor agreement. Our contributor agreement provides for assignment of joint ownership in the copyright to the contribution, and a license to any patent rights of the contributor. Contributors must also represent that it is an original work and that the contribution does not violate any third party intellectual property right.
We control access to and use of our proprietary technology and other confidential information through the use of internal and external controls, including contractual protections with employees, contractors, customers, and partners, and our software is protected by U.S. and international copyright laws. Our policy is to require employees and independent contractors to sign agreements assigning to us any inventions, trade secrets, works of authorship, developments and other processes generated by them on our behalf and agreeing to protect our confidential information, and all of our key employees and contractors have done so. In addition, we generally enter into confidentiality agreements with our vendors and customers. We also control and monitor access to, and distribution of our software, documentation and other proprietary information. In addition, we intend to expand our international operations, and effective copyright, trademark, and trade secret protection may not be available to us in every country in which our software is available.
Regulatory
The legal environment of internet-based businesses is evolving rapidly in the United States and elsewhere. The manner in which existing laws and regulations are applied in this environment, and how they will relate to our business in particular, both in the United States and internationally, is often unclear. For example, we sometimes cannot be certain which laws will be deemed applicable to us given the global nature of our business, including with respect to such topics as data privacy and security, pricing, credit card fraud, advertising, taxation, content regulation, and intellectual property ownership and infringement. Moreover, our academic customers are regulated at the state and federal levels by legislatures, administrative agencies and other policymaking bodies that can directly impact their ability to procure and deploy technology products.
Our customers, and those with whom they communicate using our applications, upload and store customer data onto our platform. This presents legal challenges to our business and operations, such as rights of privacy or intellectual property rights related to the content loaded onto our platform. Both in the United States and internationally, we must monitor and comply with a wide variety of laws and regulations regarding the data stored and processed on our platform as well as the operation of our business.
Data Privacy and Security Laws
Data privacy and security with respect to the collection of personally identifiable information, or PII, continues to be the focus of worldwide legislation and regulation. We are subject to data privacy and security regulation by data protection authorities in the U.S. (including the states in which we conduct our business) and potentially in other countries.
In recent years, there have been a number of well-publicized data breaches involving the unauthorized use and disclosure of individuals’ PII. Many states have responded to these incidents by enacting laws requiring holders of personal information to maintain safeguards and to take certain actions in response to a data breach, such as providing prompt notification of the breach to affected individuals and state officials or amending existing laws to expand compliance obligations. Federal laws are also under consideration that may create additional compliance obligations and penalties. In the European Union, where companies must meet specified privacy and security standards, the Data Protection Directive and data protection laws of each of the European Member countries require comprehensive information privacy and security protections for consumers with respect to PII collected about them. We have in the past relied on compliance with adherence to the U.S. Department of Commerce’s Safe Harbor Privacy Principles and compliance with the U.S.-EU and U.S.-Swiss Safe Harbor Frameworks as agreed to and set forth by the U.S. Department of Commerce, and the European Union and Switzerland, concerning U.S. companies doing business in Europe, collecting PII from European
89
Table of Contents
Index to Financial Statements
citizens, and transferring such PII to the United States under the Safe Harbor Framework. As a result of the October 6, 2015 European Union Court of Justice, or ECJ, opinion in Case C-362/14 (Schrems v. Data Protection Commissioner) regarding the adequacy of the U.S.-EU Safe Harbor Framework, the U.S.-EU Safe Harbor Framework is now considered, within the EU, to be an invalid means of legitimizing data transfers to the United States under the Data Protection Directive and its implementations into EU member state national law. In light of the ECJ opinion in Case C-362/14, we are engaged in efforts to legitimize data transfers from the European Economic Area, such as the use of so-called ‘model contract clauses’ developed by the European Commission. We post on our website our privacy policies and practices concerning the processing, use and disclosure of PII. Our publication of our Safe Harbor certifications, our privacy policy, and other statements we publish that provide promises and assurances about privacy and security can subject us to potential state and federal action if they are found to deceptive or misrepresentative of our practices.
Through contractual obligations with our customers we sometimes agree to certain obligations related to The Family Educational Rights and Privacy Act, or FERPA, which generally prohibits educational institutions that receive federal funding from disclosing PII from a student’s education records without the student’s consent. We are also subject to the Children’s Online Privacy Protection Act, or COPPA, which applies to operators of commercial websites and online services directed to U.S. children under the age of 13 that collect personal information from children, and to operators of general audience websites with actual knowledge that they are collecting information from U.S. children under the age of 13. Also, certain laws and regulations that protect the collection, use and disclosure of particular types of data may hinder our ability to provide services to customers and potential customers subjected to such laws.
Copyrights
U.S. and international copyright and trademark laws protect the rights of third parties from infringement of their works of authorship. Our customers and users can generally use our platform to upload and present a wide variety of content. We maintain an active copyright infringement policy and respond to takedown requests by third-party intellectual property right owners that might result from content uploaded to our platform. As our business expands to other countries, we must also respond to regional and country-specific intellectual property considerations, including takedown and cease-and-desist notices in foreign languages, and we must build infrastructure to support these processes. The Digital Millennium Copyright Act, or DMCA, also applies to our business. This statute includes a safe harbor that is intended to reduce the liability of online service providers for hosting content provided by users that infringes copyrights of others. The copyright infringement policies that we have implemented for our platform are intended to satisfy the DMCA safe harbor.
Facilities
We lease space for our corporate headquarters in Salt Lake City, Utah pursuant to leases that expire in February 2025 and October 2027. We also lease space in Chicago, Illinois for certain research and development functions pursuant to a lease that expires in July 2022. We maintain our international headquarters in London, England and sales offices in Sydney, Australia and Hong Kong. We believe our facilities are adequate for our current needs.
Legal Proceedings
We are, and from time to time may be, party to litigation and subject to claims incident to the ordinary course of business. As our growth continues, we may become party to an increasing number of litigation matters and claims. The outcome of litigation and claims cannot be predicted with certainty, and the resolution of these matters could materially affect our future results of operations, cash flows or financial position. We are not presently party to any legal proceedings that in the opinion of management, if determined adversely to us, would individually or taken together have a material adverse effect on our business, operating results, financial condition or cash flows.
90
Table of Contents
Index to Financial Statements
Executive Officers, Key Employees and Directors
The following table sets forth certain information regarding our current executive officers, key employees and directors as of September 30, 2015:
| Name |
Age | Position(s) | ||||
| Executive Officers |
||||||
| Joshua L. Coates |
41 | Chief Executive Officer and Director | ||||
| Steven B. Kaminsky |
56 | Chief Financial Officer | ||||
| Marc T. Maloy |
41 | Executive Vice President Worldwide Sales | ||||
| Matthew A. Kaminer |
42 | Senior Vice President, General Counsel and Secretary | ||||
| Key Employees |
||||||
| S. David Burggraaf |
48 | Senior Vice President Engineering | ||||
| Misty D. Frost |
45 | Senior Vice President Marketing | ||||
| Mitchell E. Macfarlane |
39 | Senior Vice President Customer Experience | ||||
| Giorgio J. Vanzini |
53 | Senior Vice President Product | ||||
| Jeff E. Weber |
49 | Senior Vice President People and Places | ||||
| Zachary S. Wily |
39 | Chief Architect | ||||
| Non-Employee Directors |
||||||
| Steven A. Collins(1)(2) |
50 | Director | ||||
| William M. Conroy(1)(3) |
56 | Director | ||||
| Byron B. Deeter(3) |
41 | Director | ||||
| E. Nicholaus Efstratis |
44 | Director | ||||
| Ellen Levy(3) |
46 | Director | ||||
| Adam D. Marcus |
40 | Director | ||||
| Lloyd G. Waterhouse(1)(2) |
63 | Director | ||||
| Brian C. Whitmer |
32 | Director | ||||
| (1) | Member of the compensation committee. |
| (2) | Member of the audit committee. |
| (3) | Member of the nominating and corporate governance committee. |
Executive Officers
Joshua L. Coates has served as our Chief Executive Officer since October 2010 and as a member of our board of directors since January 2010. From 2007 to 2009, Mr. Coates served as Chief Technology Officer of the advanced development group at EMC Corporation, a provider of online information backup and recovery services. In 2005, Mr. Coates founded Berkeley Data Systems, which operated mozy.com, an online storage company, where he served as Founder and Chief Executive Officer until it was acquired by EMC in 2007. In 1999, Mr. Coates founded Scale Eight, a software company, where he served as Founder, Chief Technology Officer and member of the board of directors. Mr. Coates holds a B.S. in computer science from University of California, Berkeley. We believe Mr. Coates is qualified to serve on our board of directors due to his extensive knowledge of our company and his extensive background in the software industry.
91
Table of Contents
Index to Financial Statements
Steven B. Kaminsky has served as our Chief Financial Officer since May 2012. From March 2008 to May 2012, Mr. Kaminsky served as Chief Financial Officer at Radisphere National Radiology Group, Inc., a provider of standards-based radiology delivery solutions for health systems. Beginning in 2005, he served as Chief Financial Officer at Plan Data Management, a healthcare technology company, which was acquired by TriZetto Group, Inc., a healthcare technology company, in 2006, after which Mr. Kaminsky served as Vice President of Finance and Internal Audit until 2008. From 2002 to 2005, Mr. Kaminsky served as Chief Financial Officer at ReefEdge, Inc., a software company. Prior to 2002, he held positions at McDonalds Corporation and Ernst & Young LLP. Mr. Kaminsky holds a B.S. in accounting from University of Illinois at Urbana-Champagne, an M.B.A. from University of California, Los Angeles and is a Certified Public Accountant (inactive).
Marc T. Maloy has served as our Executive Vice President Worldwide Sales since September 2014 and previously served as our Senior Vice President Sales since April 2013. From 2001 to 2013, Mr. Maloy served in various roles at HireRight, Inc., a background checking company, most recently as Senior Vice President of Worldwide Sales from 2009 to April 2013. From 1998 to 2001, he served as Director of Operations at Certico Verification Services, LLC, a pre-employment background screening company. Mr. Maloy holds a B.S. in human resources and operations management from the Kelley School at Indiana University.
Matthew A. Kaminer has served as our Senior Vice President, General Counsel and Secretary since May 2015. From July 2013 to May 2015, Mr. Kaminer served as General Counsel and Secretary of Collective Inc., a video and mobile advertising company. From June 2011 to July 2013, he served as General Counsel and Secretary of Epocrates, Inc., a healthcare information company. From March 2010 to June 2011, Mr. Kaminer served as General Counsel for MediMedia USA, Inc., a provider of specialty healthcare communications, publishing and medical education. From 2004 to 2009, Mr. Kaminer served as Assistant General Counsel and Chief Privacy Officer at WebMD Health Corp., a medical information company. Mr. Kaminer holds a B.S. in computer science from Pennsylvania State University and a J.D. from George Washington University.
Key Employees
S. David Burggraaf has served as our Senior Vice President Engineering since March 2014. From 2010 to 2014, Mr. Burggraaf served as Senior Vice President Product Engineering at FamilySearch Organization, a nonprofit family history organization. From 2006 to 2010, he served as Vice President Engineering at The Church of Jesus Christ of Latter-day Saints. From 1994 to 2006, Mr. Burggraaf served in various roles at Microsoft Corporation.
Misty D. Frost has served as our Senior Vice President Marketing since April 2012. From 2004 to 2012, Ms. Frost served in various roles at Datamark, Inc., a provider of enrollment marketing services to the higher education market, including Director of Product Development, Director of Interactive Operations and serving most recently as Vice President Delivery Services. Prior to 2004, she served in various marketing roles at Critical Mass Inc., a design agency, Sumus Interactive, Inc., a communications firm, and Dahlin Smith White, Inc., an advertising firm. Ms. Frost holds a B.S. in anthropology from the University of Utah.
Mitchell E. Macfarlane has served as our Senior Vice President Customer Experience since February 2015 and has served in various other leadership positions since joining us in May 2011. From May 2010 to May 2011, Mr. Macfarlane served as Principal Program Manager at VMware, Inc., a provider of virtualization and cloud infrastructure solutions. From 2006 to 2010, he served as Senior Enterprise Project Manager at InfoTrax Systems, LLC, a provider of backend operations systems. Prior to 2006, Mr. Macfarlane served in various roles at General Electric Company, Nu Skin Enterprises, Inc., a direct selling company, and Big Planet Inc., a multi-level marketing company selling internet services. Mr. Macfarlane holds a B.S. in sociology and an M.B.A. from Brigham Young University.
Giorgio J. Vanzini has served as our Senior Vice President Product since October 2015. From April 2013 to October 2015, Mr. Vanzini served as Senior Vice President, Product Development and Integration at DirecTV, a
92
Table of Contents
Index to Financial Statements
provider and broadcaster of direct broadcast satellite service and subsidiary of AT&T Inc. From 2001 to April 2013, he served in various roles at Microsoft, most recently as General Manager, Strategy and New Business Incubation from July 2010 to April 2013. Prior to 2001, Mr. Vanzini served in various roles at Microsoft, What You Want, a software company, Computer Resources International, an aerospace and defense company, Digital Equipment Corporation, a computer systems vendor, and Frequensor Systems AG, a software company. Mr. Vanzini holds a B.A. in business from Juventus Schulen, Business School in Zurich, Switzerland.
Jeff E. Weber has served as our Senior Vice President People and Places since May 2013. From August 1999 to April 2013, Mr. Weber served in various roles at ancestry.com, an online family history company, most recently as Senior Vice President People and Places from March 2012 to April 2013. From 1996 to 1999, he served as Director Human Resource Outsourcing at The Russell Group, LLC, a human resources outsourcing firm. From 1993 to 1996, Mr. Weber served as a Human Resource Generalist at Shell Oil Company. Mr. Weber holds a B.S. in business and an M.B.A. with an emphasis in organizational behavior from Brigham Young University.
Zachary S. Wily has served as our Chief Architect since March 2014 and served as our Vice President Engineering from May 2011 to March 2014 and our Director, Engineering from February 2010 to May 2011. From 2005 to 2010, Mr. Wily served in various roles at Mozy and EMC.
Non-Employee Directors
Steven A. Collins has served as a member of our board of directors since May 2014. From 2011 to February 2014, Mr. Collins served as the Executive Vice President and Chief Financial Officer of ExactTarget Inc., a cross-channel digital marketing company. From 2003 to 2011, Mr. Collins was with NAVTEQ Corporation, a digital mapping company, and served as the Vice President of Finance and the Senior Vice President of Finance & Accounting prior to being named Chief Financial Officer. Mr. Collins currently serves on the board of directors of Shopify, Inc. Mr. Collins holds a B.S. in industrial engineering from Iowa State University and an M.B.A. from the Wharton School of the University of Pennsylvania. Mr. Collins is a Certified Public Accountant. We believe Mr. Collins is qualified to serve on our board of directors due to his software industry experience, including his experience in finance.
William M. Conroy has served as a member of our board of directors since May 2013. Since March 2011, Mr. Conroy has served as President of Conroy Advisors, LLC, a consulting company. From March 2010 to March 2011, he served as Solutions Executive in the information management organization of IBM. From 2002 to 2010, Mr. Conroy served as President, Chief Executive Officer and a member of the board of directors of Initiate Systems, Inc., a software company, until it was acquired by IBM in 2010. From 2001 to 2002, he served as President and Chief Operating Officer of Click Commerce, Inc., a research solutions company. From 2000 to 2001, he served as a Partner with Insight Capital Group, a global private equity firm. From 1997 to 2000, Mr. Conroy served as Executive Vice President and Chief Operating Officer of TenFold Corporation, a software company. Prior to joining TenFold, he served in various capacities at Oracle Corporation, most recently as group vice president. Mr. Conroy holds a B.S. in business administration from Bowling Green State University. We believe Mr. Conroy is qualified to serve on our board of directors due to consulting and investment experience and his service on the boards of directors of other companies in the information technology industry.
Byron B. Deeter has served as a member of our board of directors since May 2013. Mr. Deeter is a Partner of Bessemer Venture Partners, a venture capital firm, where he has held various positions since he joined the firm in 2005, and is presently a member of the firm’s management company. From 2004 to 2005, he was a director at IBM. Mr. Deeter held various positions in Trigo Technologies, Inc., a product information management software company, including President and Chief Executive Officer from January 2000 to November 2000 and Vice President Business Development from November 2000 to April 2004. From 1998 to 2000, Mr. Deeter worked as an Associate with TA Associates, a private equity firm, and from 1996 to 1998, as an Analyst at McKinsey & Company. Mr. Deeter served on the board of directors of Eloqua, Inc. from 2007 to 2013, until Eloqua was
93
Table of Contents
Index to Financial Statements
acquired by Oracle, on the board of directors of Cornerstone OnDemand, Inc. from 2007 to July 2014 and on the board of directors of Criteo S.A. from April 2010 to January 2014. Mr. Deeter holds a B.A. in political economies of industrial societies from the University of California, Berkeley. We believe Mr. Deeter is qualified to serve on our board of directors due to his experience with SaaS and marketing companies.
E. Nicholaus Efstratis has served as a member of our board of directors since January 2010. Since 2007, Mr. Efstratis has served as a Managing Director at Epic Ventures, a venture capital firm. He has been a venture capitalist investing in early stage technology companies since 1999. Prior to focusing on the technology sector, Mr. Efstratis and his family founded and operated Ranchlife Adventures, a working cattle and guest ranch located in Montana. Mr. Efstratis holds a B.S. in entrepreneurship and an M.B.A. from Brigham Young University. We believe Mr. Efstratis is qualified to serve on our board of directors due to his investment experience in the information technology industry.
Ellen Levy has served as a member of our board of directors since August 2015. Since April 2012, Dr. Levy has served as Managing Director of Silicon Valley Connect, LLC, a management consulting company. From 2008 to April 2012, Dr. Levy served in various roles at LinkedIn Corporation, a professional social networking internet service, serving most recently as Vice President Strategic Initiatives since March 2010. Dr. Levy holds a B.A. from the University of Michigan and an M.A. and Ph.D. in cognitive psychology from Stanford University. We believe Dr. Levy is qualified to serve on our board of directors due to her experience working with software and other technology companies.
Adam D. Marcus has served as a member of our board of directors since January 2014. Mr. Marcus is a Managing Partner at OpenView Investments, LLC, dba OpenView Venture Partners, a venture capital firm, where he has held various positions since he joined the firm in 2009. From 2005 to 2009, he served as an Associate and Senior Associate at Battery Ventures, a venture capital firm. From 2003 to 2005, Mr. Marcus led corporate development for the Boston Celtics. Mr. Marcus holds a B.S. in psychology and Spanish from Franklin and Marshall College and an M.B.A. from the Tuck School of Business at Dartmouth College. We believe Mr. Marcus is qualified to serve on our board of directors due to his investment experience in the information technology industry and his experience with SaaS and marketing companies.
Lloyd G. Waterhouse has served as a member of our board of directors since August 2015. From June 2012 to April 2014, Mr. Waterhouse served as the Chief Executive Officer of McGraw-Hill Education, a division of The McGraw-Hill Companies, Inc., a content and analytics provider. From 2006 to December 2007, Mr. Waterhouse served as Chief Executive Officer and President of Harcourt Education Group, a global education company, and served as an independent director and consultant from August 2004 to September 2006. From 2001 to 2004, he served as Chief Executive Officer and Chairman of Reynolds and Reynolds Co., a leading provider of integrated solutions to automotive retailers. Since May 2010, Mr. Waterhouse has served on the board of directors of SolarWinds, Inc., and from April 2009 to June 2012, served on the board of directors of ITT Educational Services, Inc. Mr. Waterhouse holds a B.S. in finance from Pennsylvania State University and an M.B.A. from Youngstown State University. We believe Mr. Waterhouse is qualified to serve on our board of directors due to his experience as a senior executive, particularly within the education industry, and as a director of publicly-traded companies.
Brian C. Whitmer, one of our co-founders, has served as a member of our board of directors since January 2011 and between September 2008 and January 2010. Since July 2014, Mr. Whitmer has served as Founder of CoughDrop, Inc., an alternative and augmentative communication company. From September 2012 to December 2013, Mr. Whitmer served as our Chief Product Officer. From 2008 to September 2012, Mr. Whitmer served as our Vice President of Product. From 2007 to 2008, Mr. Whitmer served as a research lab assistant at Brigham Young University. From 2004 to 2006, he held various software development positions at the Missionary Training Center of The Church of Jesus Christ of Latter-day Saints. Mr. Whitmer holds a B.S. and M.S. in computer science from Brigham Young University. We believe Mr. Whitmer is qualified to serve on our board of directors due to his extensive knowledge of our company and his software industry experience.
94
Table of Contents
Index to Financial Statements
Family Relationships
There are no family relationships among any of the directors or executive officers.
Board Composition
Our business and affairs are managed under the direction of our board of directors, which currently consists of seven members. Certain members of our board of directors were elected pursuant to the provisions of a voting agreement among certain of our major stockholders. Under the terms of this voting agreement, the stockholders who are party to the voting agreement have agreed to vote their respective shares so as to elect as directors: (1) one director designated by EPIC Venture Fund IV (Mr. Efstratis); (2) one director designated by OpenView Venture Partners, L.P. (Mr. Marcus); (3) one director designated by Bessemer Venture Partners VIII L.P. (Mr. Deeter); (4) the person serving as Chief Executive Officer (Mr. Coates); (5) one director designated by certain holders of our common stock (Mr. Whitmer); and (6) two directors designated by the holders of our common stock and preferred stock, voting together as a single class (Mr. Collins and Mr. Conroy). The voting agreement will terminate upon the closing of this offering and none of our stockholders will have any special rights regarding the election or designation of members of our board of directors. There is no contractual arrangement by which Dr. Levy and Mr. Waterhouse were appointed to our board of directors.
Our board of directors will consist of nine members upon the closing of this offering. In accordance with our amended and restated certificate of incorporation to be filed in connection with this offering, immediately after this offering, our board of directors will be elected annually to serve until the next annual general meeting of stockholders.
Director Independence
Generally, under the listing requirements and rules of the New York Stock Exchange, or the NYSE, independent directors must comprise a majority of our board of directors within one year of the completion of this offering.
Our board of directors has undertaken a review of its composition, the composition of its committees and the independence of each director. Our board of directors has determined that, other than Mr. Coates, by virtue of his positions as President and Chief Executive Officer and Mr. Whitmer, by virtue of his prior employment with us, none of our directors has a relationship that would interfere with the exercise of independent judgment in carrying out the responsibilities of a director and that each is “independent” as that term is defined under the applicable rules and regulations of the SEC and the listing requirements and rules of the NYSE. Accordingly, a majority of our directors are independent, as required under applicable NYSE rules. In making this determination, our board of directors considered the current and prior relationships that each non-employee director has with our company and all other facts and circumstances our board of directors deemed relevant in determining their independence, including the beneficial ownership of our capital stock by each non-employee director.
Board Committees
Our board of directors has the authority to appoint committees to perform certain management and administration functions. Our board of directors has established an audit committee, a compensation committee and a nominating and corporate governance committee. The composition and responsibilities of each committee are described below. Members will serve on these committees until their resignation or until otherwise determined by the board of directors. Following the closing of this offering, the charters for each of these committees will be available on our website at www.instructure.com. Information contained on or accessible through our website is not a part of this prospectus, and the inclusion of our website address in this prospectus is an inactive textual reference only.
95
Table of Contents
Index to Financial Statements
Audit Committee
Our audit committee consists of Messrs. Collins and Waterhouse, each of whom satisfies the independence requirements under the NYSE listing standards and Rule 10A-3(b)(1) of the Exchange Act. The chairman of our audit committee is Mr. Collins. Our board of directors has determined that Mr. Collins is an “audit committee financial expert” within the meaning of SEC regulations. Our board of directors has also determined that each member of our audit committee has the requisite financial expertise required under the applicable requirements of the NYSE. In arriving at this determination, the board of directors has examined each audit committee member’s scope of experience and the nature of their employment in the corporate finance sector.
The primary purpose of the audit committee is to discharge the responsibilities of our board of directors with respect to our accounting, financial and other reporting and internal control practices and to oversee our independent registered accounting firm. Specific responsibilities of our audit committee include:
| • | selecting a qualified firm to serve as the independent registered public accounting firm to audit our financial statements; |
| • | helping to ensure the independence and performance of the independent registered public accounting firm; |
| • | discussing the scope and results of the audit with the independent registered public accounting firm, and reviewing, with management and the independent accountants, our interim and year-end operating results; |
| • | developing procedures for employees to submit concerns anonymously about questionable accounting or audit matters; |
| • | reviewing our policies on risk assessment and risk management; |
| • | reviewing related party transactions; |
| • | obtaining and reviewing a report by the independent registered public accounting firm at least annually, that describes our internal quality-control procedures, any material issues with such procedures, and any steps taken to deal with such issues when required by applicable law; and |
| • | approving (or, as permitted, pre-approving) all audit and all permissible non-audit service to be performed by the independent registered public accounting firm. |
Compensation Committee
Our compensation committee consists of Messrs. Collins, Conroy and Waterhouse, each of whom our board of directors has determined to be independent under the NYSE listing standards. In addition, our board of directors has determined each of Messrs. Collins and Waterhouse to be independent under the rules and regulations of the SEC, a “non-employee director” as defined in Rule 16b-3 promulgated under the Exchange Act and an “outside director” as that term is defined in Section 162(m) of the Internal Revenue Code of 1986, as amended, or the Code. The chairman of our compensation committee is Mr. Conroy.
The primary purpose of our compensation committee is to discharge the responsibilities of our board of directors to oversee our compensation policies, plans and programs and to review and determine the compensation to be paid to our executive officers, directors and other senior management, as appropriate. Specific responsibilities of our compensation committee include:
| • | reviewing and approving, or recommending that our board of directors approve, the compensation of our executive officers; |
| • | reviewing and recommending to our board of directors the compensation of our directors; |
| • | reviewing and approving, or recommending that our board of directors approve, the terms of compensatory arrangements with our executive officers; |
96
Table of Contents
Index to Financial Statements
| • | administering our stock and equity incentive plans; |
| • | selecting independent compensation consultants and assessing whether there are any conflicts of interest with any of the committee’s compensation advisors; |
| • | reviewing and approving, or recommending that our board of directors approve, incentive compensation and equity plans, severance agreements, change-of-control protections and any other compensatory arrangements for our executive officers and other senior management, as appropriate; |
| • | reviewing and establishing general policies relating to compensation and benefits of our employees; and |
| • | reviewing our overall compensation philosophy. |
Nominating and Corporate Governance Committee
Our nominating and corporate governance committee consists of Messrs. Conroy and Deeter and Dr. Levy, each of whom our board of directors has determined to be independent under the NYSE listing standards. The chairman of our nominating and corporate governance committee is Mr. Deeter.
Specific responsibilities of our nominating and corporate governance committee include:
| • | identifying, evaluating and selecting, or recommending that our board of directors approve, nominees for election to our board of directors; |
| • | evaluating the performance of our board of directors and of individual directors; |
| • | reviewing developments in corporate governance practices; |
| • | evaluating the adequacy of our corporate governance practices and reporting; |
| • | reviewing management succession plans; and |
| • | developing and making recommendations to our board of directors regarding corporate governance guidelines and matters. |
Code of Business Conduct and Ethics
We have adopted a Code of Business Conduct and Ethics that applies to all of our employees, officers and directors, including those officers responsible for financial reporting. Following the closing of this offering, the Code of Business Conduct and Ethics will be available on our website at www.instructure.com. Information contained on or accessible through our website is not a part of this prospectus, and the inclusion of our website address in this prospectus is an inactive textual reference only. We intend to disclose any amendments to the Code of Business Conduct and Ethics, or any waivers of its requirements, on our website to the extent required by the applicable rules and exchange requirements. The inclusion of our website address in this prospectus does not incorporate by reference the information on or accessible through our website into this prospectus.
Compensation Committee Interlocks and Insider Participation
None of the members of our compensation committee has ever been an officer or employee of our company. None of our executive officers serve, or have served during the last fiscal year, as a member of the board of directors, compensation committee or other board committee performing equivalent functions of any entity that has one or more executive officers serving as one of our directors or on our compensation committee.
97
Table of Contents
Index to Financial Statements
2014 Non-Employee Director Compensation
The following table sets forth information regarding compensation earned by or paid to our non-employee directors during 2014. Mr. Coates did not receive any additional compensation for his service on our board of directors.
| Name |
Fees Earned or Paid in Cash |
Option Awards(1) |
Other Compensation |
Total | ||||||||||||
| Steven A. Collins |
$ | — | $ | 168,976 | (2) | $ | — | $ | 168,976 | |||||||
| William M. Conroy |
— | — | 40,000 | (3) | 40,000 | |||||||||||
| Byron B. Deeter |
— | — | — | — | ||||||||||||
| E. Nicholaus Efstratis |
— | — | — | — | ||||||||||||
| Ellen Levy(4) |
— | — | — | — | ||||||||||||
| Adam D. Marcus |
— | — | — | — | ||||||||||||
| Lloyd G. Waterhouse(4) |
— | — | — | — | ||||||||||||
| Brian C. Whitmer |
— | — | 63,337 | (5) | 63,337 | |||||||||||
| (1) | The amounts reported do not reflect the amounts actually received by our non-employee directors. Instead, these amounts reflect the aggregate grant date fair value of each stock option granted to our non-employee directors during 2014, as computed in accordance with Financial Accounting Standards Board, or FASB, Accounting Standards Codification, or ASC, 718. Assumptions used in the calculation of these amounts are included in Note 9 to our audited financial statements included in this prospectus. As required by SEC rules, the amounts shown exclude the impact of estimated forfeitures related to service-based vesting conditions. Our non-employee directors who have received options will only realize compensation with regard to these options to the extent the trading price of our common stock is greater than the exercise price of such options. The table below lists the aggregate number of shares subject to outstanding option awards held by each of our non-employee directors. |
| Name |
Number of Shares Subject to Outstanding Options as of December 31, 2014 |
|||
| Steven A. Collins |
57,023 | |||
| William M. Conroy. |
— | |||
| Byron B. Deeter |
— | |||
| E. Nicholaus Efstratis |
— | |||
| Ellen Levy |
— | |||
| Adam D. Marcus |
— | |||
| Lloyd G. Waterhouse |
— | |||
| Brian C. Whitmer |
— | |||
| (2) | In May 2014, in connection with the appointment of Mr. Collins to the board of directors and in consideration for his service as a director, we granted Mr. Collins an option to purchase 57,023 shares of our common stock at an exercise price of $4.88 per share. All shares subject to the option are early exercisable, which are subject to our right to repurchase any unvested shares if Mr. Collins ceases to provide continued services with us through the relevant vesting date. The shares are scheduled to vest over a two-year period as follows: 1/24th of the shares vest each month, subject to continued service with us through each relevant vesting date. The vesting of Mr. Collin’s option award will accelerate in full upon a change of control. |
| (3) | Reflects compensation for advisory services paid to Mr. Conroy pursuant to a consulting agreement we entered into with Mr. Conroy in February 2013. |
| (4) | Dr. Levy and Mr. Waterhouse joined our board of directors in August 2015. |
| (5) | Includes (a) $30,004 earned in 2013, which were paid during 2014, pursuant to Mr. Whitmer’s employment and severance arrangements and (b) $33,333 for consulting services paid to Mr. Whitmer pursuant to a consulting agreement we entered into with Mr. Whitmer in December 2013. |
Non-Employee Director Compensation Policy
We have adopted a non-employee director compensation policy, pursuant to which our non-employee directors will be eligible to receive compensation for service on our board of directors and committees of our board of directors.
98
Table of Contents
Index to Financial Statements
Cash Compensation
Commencing upon the execution of the underwriting agreement for this offering, each non-employee director will receive an annual cash retainer of $30,000 for serving on our board of directors. The chairperson and members of the three standing committees of our board of directors will be entitled to the following additional annual cash retainers:
| Committee |
Chairperson Fee | Member Fee | ||||||
| Audit Committee |
$ | 20,000 | $ | 7,500 | ||||
| Compensation Committee |
10,000 | 5,000 | ||||||
| Nominating and Corporate Governance Committee |
7,500 | 3,500 | ||||||
All annual cash compensation amounts will be payable in equal quarterly installments in arrears, on the last day of each fiscal quarter for which the service occurred, pro-rated based on the days served in the applicable fiscal quarter.
Each director may elect to receive their annual cash compensation in the form of restricted stock units, or RSUs. Such RSUs will be granted on the date of our annual stockholder meeting and will vest in full on the last market trading day immediately prior to the next annual stockholder meeting, subject to the director’s continued service through such vesting date.
Equity Compensation
IPO Grant. On the date of this offering, each of Ellen Levy and Lloyd G. Waterhouse, will be granted an RSU with a value of $350,000. The value of this award will be determined based on the price per share set forth on the cover page of this prospectus. This award will vest as to 50% on the last market trading day immediately prior to the first annual stockholder meeting after the date of this offering and 50% of this award will vest on the last market trading day immediately prior to the second annual stockholder meeting after the date of this offering, subject, in each case, to the director’s continued service through such vesting date. On the date of this offering, each of William M. Conroy and Byron B. Deeter will be granted an RSU with a value of $262,500. The value of this award will be determined based on the price per share set forth on the cover page of this prospectus. This award will vest as to one-third on the last market trading day immediately prior to the first annual stockholder meeting after the date of this offering and two-thirds of this award will vest on the last market trading day immediately prior to the second annual stockholder meeting after the date of this offering, subject, in each case, to the director’s continued service through such vesting date.
Initial Grant. On the date of a non-employee director’s initial appointment to our board of directors, or if such date is not a market trading day, the first market trading day thereafter, such director will receive (1) a RSU with a value of $175,000, pro-rated based on the number of days that have elapsed as of the date of appointment since our last annual meeting of stockholders (or if an annual meeting has not yet been held, the date of this offering), or the Pro-rated Portion, plus (2) a RSU with a value of $175,000, or the Annual Portion. The value of the awards granted will be determined based on the fair market value per share of common stock on the applicable grant date. The Pro-rated Portion will vest in full on the last market trading day immediately prior to the next annual stockholder meeting following such director’s appointment, subject to the director’s continued service through such vesting date. The Annual Portion will vest on the last market trading day immediately prior to the second annual stockholder meeting following such director’s appointment. If a non-employee director is initially elected at an annual stockholder meeting, such director will receive a RSU with a value of $350,000. The award will vest as to 50% on the last market trading day immediately prior to our next annual stockholder meeting and 50% will vest on the last market trading day immediately prior to the second annual stockholder meeting following such election, subject, in each case, to the director’s continued service through such vesting date.
99
Table of Contents
Index to Financial Statements
Biennial Grant. On the date of each annual stockholder meeting, each non-employee director who is continuing in office after the date of such meeting, and whose IPO Grant, Initial Grant or most recent Biennial Grant, as applicable, has fully vested on the last market trading day immediately prior to the date of such annual stockholder meeting, will receive an RSU with a value of $350,000. The value of the awards granted will be determined based on the fair market value per share of common stock on the applicable grant date. The award will vest as to 50% on the last market trading day immediately prior to the next annual stockholder meeting and 50% will vest on the last market trading day immediately prior to the date of the following annual stockholder meeting, subject, in each case, to the director’s continued service through such vesting date.
Change in Control. All RSUs issued pursuant to the non-employee director compensation policy will vest in full upon a change in control or corporate transaction, each as defined in the 2015 Equity Incentive Plan, subject to the director’s continued service through the effective date of such transaction.
100
Table of Contents
Index to Financial Statements
Our named executive officers, consisting of our principal executive officer and the next two most highly compensated executive officers, as of December 31, 2014, were:
| • | Joshua L. Coates, our Chief Executive Officer; |
| • | Steven B. Kaminsky, our Chief Financial Officer; and |
| • | Marc T. Maloy, our Executive Vice President Worldwide Sales. |
2014 Summary Compensation Table
The following table presents all of the compensation awarded to or earned by our named executive officers during 2014:
| Name and Principal Position |
Year | Salary | Non-Equity Incentive Plan Compensation |
All Other Compensation |
Total | |||||||||||||||
| Joshua L. Coates |
2014 | $ | 1 | $ | — | $ | — | $ | 1 | |||||||||||
| Chief Executive Officer |
||||||||||||||||||||
| Steven B. Kaminsky |
2014 | 214,346 | 49,950 | (1) | 1,059 | (2) | 265,355 | |||||||||||||
| Chief Financial Officer |
||||||||||||||||||||
| Marc T. Maloy |
2014 | 256,944 | 141,786 | (3) | 2,859 | (4) | 401,589 | |||||||||||||
| Executive Vice President Worldwide Sales |
||||||||||||||||||||
| (1) | Represent amounts earned in 2014, which were paid during 2015, under our executive bonus plan based on the achievement of company and individual performance goals. Our 2014 company goals related to business and corporate development objective and financial management objectives. The 2014 annual performance bonuses for each eligible named executive officers based on company performance (80%) and individual performance (20%), which we determined was appropriate in order to reinforce the importance of integrated and collaborative leadership. For 2014, Mr. Coates waived his right to receive any payments under the executive bonus plan, our board of directors determined that Mr. Kaminsky was entitled to 106% of his target bonus and Mr. Maloy was not eligible to participate in our executive bonus plan. |
| (2) | Includes (a) the value of company paid premiums of $59 for life insurance and (b) $1,000 of safe-harbor matching contributions defined in our 401(k) plan. |
| (3) | Represents sales commissions earned by Mr. Maloy in 2014. The amounts earned under his incentive compensation opportunity were based on the achievement of sales targets. |
| (4) | Includes (a) the value of company paid premiums of $59 for life insurance and (b) $2,800 of safe-harbor matching contributions defined in our 401(k) plan. |
Outstanding Equity Awards as of December 31, 2014
The following table presents information regarding outstanding equity awards held by our named executive officers as of December 31, 2014. All awards were granted under our 2010 Equity Incentive Plan.
| Option Awards | Stock Awards | |||||||||||||||||||||||||||||||
| Name |
Grant Date | Vesting Commencement Date |
Number of Securities Underlying Unexercised Options (#) Exercisable |
Number of Securities Underlying Unexercised Options (#) Unexercisable |
Option Exercise Price Per Share(1) |
Option Expiration Date |
Number of Shares or Units of Stock That Have Not Vested |
Market Value of Shares or Units of Stock That Have Not Vested |
||||||||||||||||||||||||
| Joshua L. Coates |
— | — | — | — | $ | — | — | — | $ | — | ||||||||||||||||||||||
| Steven B. Kaminsky |
— | 05/21/2012 | — | — | — | — | 86,176 | (2)(3)(4) | 792,388 | (5) | ||||||||||||||||||||||
| 05/31/2013 | 05/31/2013 | 29,342 | (2)(3) | — | 2.07 | 05/30/2023 | — | — | ||||||||||||||||||||||||
| Marc T. Maloy |
04/11/2013 | 04/03/2013 | 149,999 | (2) | — | 1.01 | 04/10/2023 | — | — | |||||||||||||||||||||||
| (1) | The exercise price per share reflects the fair market value per share of our common stock on the date of grant as determined by our board of directors. |
101
Table of Contents
Index to Financial Statements
| (2) | All shares subject to the option are early exercisable, which are subject to our right to repurchase any unvested shares if the named executive officer ceases to provide continued services with us through the relevant vesting date. The shares are scheduled to vest over a four-year period as follows: 25% of the shares underlying the options vest on the one-year anniversary of the vesting commencement date and thereafter 1/48th of the shares vest each month, subject to continued service with us through each relevant vesting date. |
| (3) | Pursuant to the offer letter between the named executive officer and us, the vesting of such named executive officer’s stock and option awards will accelerate under certain circumstances as described under “—Employment and Change in Control Arrangements.” |
| (4) | Shares acquired pursuant to an early exercise provision and subject to a right of repurchase, which lapses in accordance with the vesting schedule. See footnote (2). |
| (5) | This amount reflects the fair market value of our common stock of $9.20 per share as of December 31, 2014 as determined by our board of directors. |
Emerging Growth Company Status
We are an “emerging growth company,” as defined in the JOBS Act. As an emerging growth company we will be exempt from certain requirements related to executive compensation, including, but not limited to, the requirements to hold a nonbinding advisory vote on executive compensation and to provide information relating to the ratio of total compensation of our Chief Executive Officer to the median of the annual total compensation of all of our employees, each as required by the Investor Protection and Securities Reform Act of 2010, which is part of the Dodd-Frank Wall Street Reform and Consumer Protection Act.
Pension Benefits
Our named executive officers did not participate in, or otherwise receive any benefits under, any pension or retirement plan sponsored by Instructure during 2014.
Nonqualified Deferred Compensation
Our named executive officers did not participate in, or earn any benefits under, a non-qualified deferred compensation plan sponsored by Instructure during 2014.
Employment and Change in Control Arrangements
We have offer letters with each of our executive officers other than Mr. Coates. The offer letters generally provide for at-will employment and set forth the executive officer’s initial base salary, initial equity grant amount, and eligibility for employee benefits. In addition, each of our named executive officers has executed of our standard proprietary information and inventions agreement. The key terms of employment with our executive officers are described below.
Offer Letters
Joshua L. Coates. We have no employment agreement or offer letter with Joshua L. Coates, our Chief Executive Officer, and we currently do not anticipate entering into one in the future. Mr. Coates’s current annual base salary is $1. Mr. Coates is an at-will employee and receives no benefits different from those available to all our full-time employees and receives no perquisites.
Steven B. Kaminsky. In April 2012, we extended an offer letter to Steven B. Kaminsky, our Chief Financial Officer. The offer letter has no specific term and constitutes an at-will employment arrangement. Mr. Kaminsky’s current annual base salary is $238,500 and his annual target bonus is 30% of his base salary. The offer letter provided Mr. Kaminsky with relocation support up to a maximum amount of $75,000 to assist with his relocation to the Company’s headquarters in Utah. In connection with his employment, Mr. Kaminsky was granted a stock option for 243,318 shares of common stock with an exercise price of $0.23 per share. In addition, pursuant to his offer letter, Mr. Kaminsky was eligible to receive an additional stock option grant if we completed a qualified financing by the one-year anniversary of Mr. Kaminsky’s start date. Accordingly, in connection with the sale and issuance of our Series D preferred stock, we granted Mr. Kaminsky a stock option for 29,342 shares of common stock with an exercise price of $2.07 per share. The shares underlying the option vest as to 25% on the one-year anniversary of the vesting commencement date and 1/48th of the shares vest each
102
Table of Contents
Index to Financial Statements
month thereafter, subject to Mr. Kaminsky’s continued service with us through each relevant vesting date. In April 2015, Mr. Kaminsky was granted an option to purchase 59,999 shares of common stock with an exercise price of $11.25 per share. The shares underlying the option vest in 12 equal monthly installments commencing on June 1, 2016, subject to Mr. Kaminsky’s continued service with us through each relevant vesting date.
Marc T. Maloy. In March 2013, we extended an offer letter to Marc T. Maloy, our Executive Vice President Worldwide Sales. The offer letter had no specific term and constitutes an at-will employment arrangement. Mr. Maloy’s current annual base salary is $250,000. The offer letter provided Mr. Maloy with relocation support up to a maximum amount of $25,000 to assist with his relocation to our headquarters in Utah. In connection with his employment, Mr. Maloy was granted a stock option for 163,333 shares of common stock with an exercise price of $1.01 per share. The shares underlying the option vest as to 25% on the one-year anniversary of the vesting commencement date and 1/48th of the shares vest each month thereafter, subject to Mr. Maloy’s continued service with us through each relevant vesting date. In April 2015, Mr. Maloy was granted an option to purchase 39,999 shares of common stock with an exercise price of $11.25 per share. The shares underlying the option vest in 12 equal monthly installments, commencing on May 3, 2017, subject to Mr. Maloy’s continued service with us through each relevant vesting date. Mr. Maloy is also eligible to receive sales commissions based on the achievement of sales targets.
Change in Control and Severance Agreements
In August 2015, we entered into executive agreements with each of our executive officers and certain other employees. The agreement with each executive officer provides that if such officer is terminated for any reason other than cause, death or disability or the officer voluntarily resigns for good reason, such officer would be entitled to receive the following severance benefits:
| • | a payment equal to 6 months of such officer’s then-current base salary, paid over the 6 month period following such officer’s separation from service; |
| • | reimbursement of COBRA premiums for such officer and his or her eligible dependents, if any, for a period of up to 6 months; and |
| • | a lump sum payment equal to 80% of such officer’s annual target bonus, pro-rated based on the number of full months of service in the year in which the separation of service occurs. |
In addition, these agreements provide that if such officer is terminated for any reason other than cause, death or disability or if the officer voluntarily resigns for good reason within 3 months prior to (and contingent upon the consummation of the change in control) or 12 months after a change in control, such officer would be entitled to receive the following severance benefits:
| • | a payment equal to 9 months of such officer’s then-current base salary, paid over the 9 month period following such officer’s separation from service; |
| • | reimbursement of COBRA premiums for such officer and his or her eligible dependents, if any, for a period of up to 9 months; |
| • | a lump sum payment equal to 80% of such officer’s annual target bonus, pro-rated based on the number of full months of service in the year in which the separation of service occurs, provided that the effective date of termination is on or after March 31 of the year of termination; and |
| • | 100% acceleration of vesting of all then-unvested equity awards held by such officer. |
Payment of any severance benefits is conditioned on the executive officer’s timely execution of a general release of claims in our favor.
103
Table of Contents
Index to Financial Statements
Equity Benefit Plans
We believe that our ability to grant equity-based awards is a valuable and necessary compensation tool that aligns the long-term financial interests of our employees, consultants and directors with the financial interests of our stockholders. In addition, we believe that our ability to grant options and other equity-based awards helps us to attract, retain and motivate employees, consultants and directors and encourages them to devote their best efforts to our business and financial success. The principal features of our equity incentive plans and our 401(k) plan are summarized below. These summaries are qualified in their entirety by reference to the actual text of the plans, which, other than the 401(k) plan, are filed as exhibits to the registration statement of which this prospectus is a part.
2015 Equity Incentive Plan
Our board of directors adopted the 2015 Equity Incentive Plan, or the 2015 Plan, in August 2015 and our stockholders approved the 2015 Plan in October 2015, which will become effective upon the execution and delivery of the underwriting agreement related to this offering. Once the 2015 Plan is effective, no further grants will be made under the 2010 Equity Incentive Plan, or the 2010 Plan.
Stock Awards. The 2015 Plan provides for the grant of incentive stock options, or ISOs, nonstatutory stock options, or NSOs, stock appreciation rights, restricted stock awards, restricted stock unit awards, performance-based stock awards, and other forms of equity compensation, or collectively, stock awards, all of which may be granted to employees, including officers, non-employee directors and consultants of us and our affiliates. Additionally, the 2015 Plan provides for the grant of performance cash awards. ISOs may be granted only to employees. All other awards may be granted to employees, including officers, and to non-employee directors and consultants.
Share Reserve. Initially, the aggregate number of shares of our common stock that may be issued pursuant to stock awards under the 2015 Plan after the 2015 Plan becomes effective is 2,000,000 shares. Additionally, the number of shares of our common stock reserved for issuance under our 2015 Plan will automatically increase on January 1 of each year, beginning on January 1, 2016 (assuming the 2015 Plan becomes effective before such date) and continuing through and including January 1, 2025, by 4.5% of the total number of shares of our capital stock outstanding on December 31 of the preceding calendar year, or a lesser number of shares determined by our board of directors. The maximum number of shares of our common stock that may be issued upon the exercise of ISOs under the 2015 Plan is 8,000,000 shares.
No person may be granted stock awards covering more than 1,000,000 shares of our common stock under the 2015 Plan during any calendar year pursuant to stock options, stock appreciation rights and other stock awards whose value is determined by reference to an increase over an exercise or strike price of at least 100% of the fair market value on the date the stock award is granted. Additionally, no person may be granted in a calendar year a performance stock award covering more than 1,000,000 shares of our common stock or a performance cash award having a maximum value in excess of $2,000,000. Such limitations are designed to help assure that any deductions to which we would otherwise be entitled with respect to such awards will not be subject to the $1,000,000 limitation on the income tax deductibility of compensation paid to any covered executive officer imposed by Section 162(m) of the Code.
If a stock award granted under the 2015 Plan expires or otherwise terminates without being exercised in full, or is settled in cash, the shares of our common stock not acquired pursuant to the stock award again will become available for subsequent issuance under the 2015 Plan. In addition, the following types of shares of our common stock under the 2015 Plan may become available for the grant of new stock awards under the 2015 Plan: (1) shares that are forfeited to or repurchased by us prior to becoming fully vested; (2) shares withheld to satisfy income or employment withholding taxes; or (3) shares used to pay the exercise or purchase price of a stock award. Shares issued under the 2015 Plan may be previously unissued shares or reacquired shares bought by us on the open market. As of the date of this prospectus, no awards have been granted and no shares of our common stock have been issued under the 2015 Plan.
104
Table of Contents
Index to Financial Statements
Administration. Our board of directors, or a duly authorized committee thereof, has the authority to administer the 2015 Plan. Our board of directors may also delegate to one or more of our officers the authority to (1) designate employees (other than other officers) to be recipients of certain stock awards, and (2) determine the number of shares of common stock to be subject to such stock awards. Subject to the terms of the 2015 Plan, our board of directors or the authorized committee, referred to herein as the plan administrator, determines recipients, dates of grant, the numbers and types of stock awards to be granted and the terms and conditions of the stock awards, including the period of their exercisability and vesting schedule applicable to a stock award. Subject to the limitations set forth below, the plan administrator will also determine the exercise price, strike price or purchase price of awards granted and the types of consideration to be paid for the award.
The plan administrator has the authority to modify outstanding awards under our 2015 Plan. Subject to the terms of our 2015 Plan, the plan administrator has the authority to reduce the exercise, purchase or strike price of any outstanding stock award, cancel any outstanding stock award in exchange for new stock awards, cash or other consideration, or take any other action that is treated as a repricing under generally accepted accounting principles, with the consent of any adversely affected participant.
Stock Options. ISOs and NSOs are granted pursuant to stock option agreements adopted by the plan administrator. The plan administrator determines the exercise price for a stock option, within the terms and conditions of the 2015 Plan, provided that the exercise price of a stock option generally cannot be less than 100% of the fair market value of our common stock on the date of grant. Options granted under the 2015 Plan vest at the rate specified by the plan administrator.
The plan administrator determines the term of stock options granted under the 2015 Plan, up to a maximum of ten years. Unless the terms of an optionholder’s stock option agreement provide otherwise, if an optionholder’s service relationship with us, or any of our affiliates, ceases for any reason other than disability, death or cause, the optionholder may generally exercise any vested options for a period of three months following the cessation of service. The option term may be extended in the event that exercise of the option following such a termination of service is prohibited by applicable securities laws or our insider trading policy. If an optionholder’s service relationship with us or any of our affiliates ceases due to disability or death, or an optionholder dies within a certain period following cessation of service, the optionholder or a beneficiary may generally exercise any vested options for a period of 12 months in the event of disability and 18 months in the event of death. In the event of a termination for cause, options generally terminate immediately upon the termination of the individual for cause. In no event may an option be exercised beyond the expiration of its term.
Acceptable consideration for the purchase of common stock issued upon the exercise of a stock option will be determined by the plan administrator and may include (1) cash, check, bank draft or money order, (2) a broker-assisted cashless exercise, (3) the tender of shares of our common stock previously owned by the optionholder, (4) a net exercise of the option if it is an NSO, and (5) other legal consideration approved by the plan administrator.
Unless the plan administrator provides otherwise, options generally are not transferable except by will, the laws of descent and distribution, or pursuant to a domestic relations order. An optionholder may designate a beneficiary, however, who may exercise the option following the optionholder’s death.
Tax Limitations on Incentive Stock Options. The aggregate fair market value, determined at the time of grant, of our common stock with respect to ISOs that are exercisable for the first time by an optionholder during any calendar year under all of our stock plans may not exceed $100,000. Options or portions thereof that exceed such limit will generally be treated as NSOs. No ISO may be granted to any person who, at the time of the grant, owns or is deemed to own stock possessing more than 10% of our total combined voting power or that of any of our affiliates unless (1) the option exercise price is at least 110% of the fair market value of the stock subject to the option on the date of grant, and (2) the term of the ISO does not exceed five years from the date of grant.
105
Table of Contents
Index to Financial Statements
Restricted Stock Awards. Restricted stock awards are granted pursuant to restricted stock award agreements adopted by the plan administrator. Restricted stock awards may be granted in consideration for (1) cash, check, bank draft or money order, (2) services rendered to us or our affiliates, or (3) any other form of legal consideration. Common stock acquired under a restricted stock award may, but need not, be subject to a share repurchase option in our favor in accordance with a vesting schedule to be determined by the plan administrator. A restricted stock award may be transferred only upon such terms and conditions as set by the plan administrator. Except as otherwise provided in the applicable award agreement, restricted stock awards that have not vested may be forfeited or repurchased by us upon the participant’s cessation of continuous service for any reason.
Restricted Stock Unit Awards. Restricted stock unit awards are granted pursuant to restricted stock unit award agreements adopted by the plan administrator. Restricted stock unit awards may be granted in consideration for any form of legal consideration. A restricted stock unit award may be settled by cash, delivery of stock, a combination of cash and stock as deemed appropriate by the plan administrator, or in any other form of consideration set forth in the restricted stock unit award agreement. Additionally, dividend equivalents may be credited in respect of shares covered by a restricted stock unit award. Except as otherwise provided in the applicable award agreement, restricted stock units that have not vested will be forfeited upon the participant’s cessation of continuous service for any reason.
Stock Appreciation Rights. Stock appreciation rights are granted pursuant to stock appreciation grant agreements adopted by the plan administrator. The plan administrator determines the strike price for a stock appreciation right, which generally cannot be less than 100% of the fair market value of our common stock on the date of grant. Upon the exercise of a stock appreciation right, we will pay the participant an amount not to exceed the product of (1) the excess of the per share fair market value of our common stock on the date of exercise over the strike price, multiplied by (2) the number of shares of common stock with respect to which the stock appreciation right is exercised. A stock appreciation right granted under the 2015 Plan vests at the rate specified in the stock appreciation right agreement as determined by the plan administrator.
The plan administrator determines the term of stock appreciation rights granted under the 2015 Plan, up to a maximum of ten years. Unless the terms of a participant’s stock appreciation right agreement provides otherwise, if a participant’s service relationship with us or any of our affiliates ceases for any reason other than cause, disability or death, the participant may generally exercise any vested stock appreciation right for a period of three months following the cessation of service. The stock appreciation right term may be further extended in the event that exercise of the stock appreciation right following such a termination of service is prohibited by applicable securities laws. If a participant’s service relationship with us, or any of our affiliates, ceases due to disability or death, or a participant dies within a certain period following cessation of service, the participant or a beneficiary may generally exercise any vested stock appreciation right for a period of 12 months in the event of disability and 18 months in the event of death. In the event of a termination for cause, stock appreciation rights generally terminate immediately upon the occurrence of the event giving rise to the termination of the individual for cause. In no event may a stock appreciation right be exercised beyond the expiration of its term.
Performance Awards. The 2015 Plan permits the grant of performance-based stock and cash awards that may qualify as performance-based compensation that is not subject to the $1,000,000 limitation on the income tax deductibility of compensation paid to a covered executive officer imposed by Section 162(m) of the Code. To help assure that the compensation attributable to performance-based awards will so qualify, our compensation committee can structure such awards so that stock or cash will be issued or paid pursuant to such award only after the achievement of certain pre-established performance goals during a designated performance period.
Our compensation committee may establish performance goals by selecting from one or more of the following performance criteria, including without limitation: (1) earnings (including earnings per share and net earnings; (2) total stockholder return; (3) return on equity or average stockholder’s equity; (4) return on assets, investment, or capital employed; (5) stock price; (6) margin (including gross margin); (7) income (before or after taxes); (8) operating income; (9) pre-tax profit; (10) operating cash flow; (11) sales or revenue targets; (12) increases in revenue or product revenue; (13) expenses and cost reduction goals; (14) improvement in or
106
Table of Contents
Index to Financial Statements
attainment of working capital levels; (15) economic value added (or an equivalent metric); (16) market share; (17) cash flow; (18) share price performance; (19) debt reduction; (20) implementation or completion of projects or processes; (21) stockholders’ equity; (22) capital expenditures; (23) debt levels; (24) operating profit or net operating profit; (25) workforce diversity; (26) growth of net income or operating income; (27) billings; (28) bookings; (29) employee retention; (30) user satisfaction; (31) the number of users, including but not limited to unique users; (32) budget management; (33) partner satisfaction; and (34) entry into or completion of strategic partnerships or transactions.
Our compensation committee may establish performance goals on a company-wide basis, with respect to one or more business units, divisions, affiliates, or business segments, and in either absolute terms or relative to the performance of one or more comparable companies or the performance of one or more relevant indices. Unless otherwise specified by our board of directors (i) in the award agreement at the time the award is granted or (ii) in such other document setting forth the performance goals at the time the performance goals are established, our compensation committee will appropriately make adjustments in the method of calculating the attainment of the performance goals as follows: (1) to exclude restructuring and other nonrecurring charges; (2) to exclude exchange rate effects; (3) to exclude the effects of changes to GAAP; (4) to exclude the effects of any statutory adjustments to corporate tax rates; (5) to exclude the effects of any “extraordinary items” as determined under GAAP; (6) to exclude the dilutive effects of acquisitions or joint ventures; (7) to assume that any business divested by our company achieved performance objectives at targeted levels during the balance of a performance period following such divestiture; (8) to exclude the effect of any change in the outstanding shares of our common stock by reason of any stock dividend or split, stock repurchase, reorganization, recapitalization, merger, consolidation, spin-off, combination or exchange of shares or other similar corporate change, or any distributions to common stockholders other than regular cash dividends; (9) to exclude the effects of stock based compensation and the award of bonuses under our bonus plans; (10) to exclude costs incurred in connection with potential acquisitions or divestitures that are required to be expensed under GAAP; (11) to exclude the goodwill and intangible asset impairment charges that are required to be recorded under GAAP; (12) to exclude the effect of any other unusual, non-recurring gain or loss or other extraordinary item; and (13) to exclude the effects of entering into or achieving milestones involved in licensing arrangements.
Other Stock Awards. The plan administrator may grant other awards based in whole or in part by reference to our common stock. The plan administrator will set the number of shares under the stock award and all other terms and conditions of such awards.
Changes to Capital Structure. In the event that there is a specified type of change in our capital structure, such as a stock split or recapitalization, appropriate adjustments will be made to (1) the class and maximum number of shares reserved for issuance under the 2015 Plan, (2) the class and maximum number of shares by which the share reserve may increase automatically each year, (3) the class and maximum number of shares that may be issued upon the exercise of ISOs, (4) the class and maximum number of shares subject to stock awards that can be granted in a calendar year (as established under the 2015 Plan pursuant to Section 162(m) of the Code) and (5) the class and number of shares and exercise price, strike price, or purchase price, if applicable, of all outstanding stock awards.
Corporate Transactions. In the event of certain specified significant corporate transactions, the plan administrator has the discretion to take any of the following actions with respect to stock awards:
| • | arrange for the assumption, continuation or substitution of a stock award by a surviving or acquiring entity or parent company; |
| • | arrange for the assignment of any reacquisition or repurchase rights held by us to the surviving or acquiring entity or parent company; |
| • | accelerate the vesting of the stock award and provide for its termination prior to the effective time of the corporate transaction; or |
107
Table of Contents
Index to Financial Statements
| • | make a payment equal to the excess of (1) the value of the property the participant would have received upon exercise of the stock award over (2) the exercise price otherwise payable in connection with the stock award. |
Our plan administrator is not obligated to treat all stock awards, even those that are of the same type, in the same manner.
Under the 2015 Plan, a corporate transaction is generally the consummation of (1) a sale or other disposition of all or substantially all of our consolidated assets, (2) a sale or other disposition of at least 90% of our outstanding securities, (3) a merger, consolidation or similar transaction following which we are not the surviving corporation, or (4) a merger, consolidation or similar transaction following which we are the surviving corporation but the shares of our common stock outstanding immediately prior to such transaction are converted or exchanged into other property by virtue of the transaction.
Change of Control. The plan administrator may provide, in an individual award agreement or in any other written agreement between a participant and us that the stock award will be subject to additional acceleration of vesting and exercisability in the event of a change of control. For example, certain of our employees may receive an award agreement that provides for vesting acceleration upon the individual’s termination without cause or resignation for good reason (including a material reduction in the individual’s base salary, duties, responsibilities or authority, or a material relocation of the individual’s principal place of employment with us) in connection with a change of control. Under the 2015 Plan, a change of control is generally (1) the acquisition by a person or entity of more than 50% of our combined voting power other than by merger, consolidation or similar transaction; (2) a consummated merger, consolidation or similar transaction immediately after which our stockholders cease to own more than 50% of the combined voting power of the surviving entity; or (3) a consummated sale, lease or exclusive license or other disposition of all or substantially of our consolidated assets.
Amendment and Termination. Our board of directors has the authority to amend, suspend, or terminate the 2015 Plan, provided that such action does not materially impair the existing rights of any participant without such participant’s written consent. No ISOs may be granted after the tenth anniversary of the date our board of directors adopted the 2015 Plan.
2010 Equity Incentive Plan
Our board of directors adopted and our stockholders approved the 2010 Plan, in January 2010. The 2010 Plan was amended most recently in March 2015. The 2010 Plan provides for the grant of incentive stock options, or ISOs, within the meaning of Section 422 of the Code, to our employees, and for the grant of nonstatutory stock options, or NSOs, restricted stock awards and stock appreciation rights to our employees, directors and consultants.
The 2015 Plan became will become effective upon the execution and delivery of the underwriting agreement related to this offering. As a result, we will not grant any additional options under our 2010 Plan following that date, and the 2010 Plan will be terminated. However, any outstanding options granted under the 2010 Plan will remain outstanding, subject to the terms of the 2010 Plan and stock option agreements, until such outstanding options are exercised or until they terminate or expire by their terms. Options granted under the 2010 Plan have terms similar to those described above with respect to options to be granted under the 2015 Plan.
Authorized Shares. The maximum number of shares of our common stock that may be issued under the 2010 Plan is 7,872,136. The maximum number of shares that may be issued upon the exercise of ISOs under the 2010 Plan is 7,872,136.
Shares subject to stock awards granted under the 2010 Plan that expire or terminate without being exercised in full or are settled in cash do not reduce the number of shares available for issuance under the 2010 Plan.
108
Table of Contents
Index to Financial Statements
Additionally, shares issued pursuant to stock awards under the 2010 Plan that we repurchase or that are forfeited, as well as shares used to pay the exercise price of a stock award or to satisfy the tax withholding obligations related to a stock award, become available for future grant under the 2010 Plan.
Plan Administration. Our board of directors or a duly authorized committee of our board of directors administers the 2010 Plan and the stock awards granted under it. Subject to the terms of the 2010 Plan, the board of directors has the authority to determine and amend the terms of awards, including recipients, the exercise, purchase or strike price of stock awards, if any, the number of shares subject to each stock award, the fair market value of a share of our common stock, the vesting schedule applicable to the awards, together with any vesting acceleration, and the form of consideration, if any, payable upon exercise or settlement of the award and the terms of the award agreements for use under the 2010 Plan.
The board of directors has the power to modify outstanding awards under the 2010 Plan. The board of directors has the authority to reprice any outstanding option or stock appreciation right, cancel any outstanding stock award in exchange for new stock awards, cash or other consideration, or take any other action that is treated as a repricing under GAAP, with the consent of any adversely affected participant.
Corporate Transactions. The 2010 Plan provides that in the event of a specified corporate transaction, as defined under the 2010 Plan, each outstanding stock award may be assumed or continued or an equivalent stock award may be substituted by a successor corporation and any reacquisition or repurchase rights held by us in respect of common stock issued pursuant to prior stock awards may be assigned to the successor corporation. If the successor corporation does not agree to assume or continue the stock award or to substitute an equivalent stock award, such stock awards will become fully vested and exercisable prior to the corporate transaction, and any reacquisition or repurchase rights will lapse. Any awards that have not been assumed, continued, substituted, or exercised prior to the corporate transaction will terminate at the closing of the transaction.
Transferability. A participant may not transfer stock awards under the 2010 Plan other than by will, the laws of descent and distribution, or as otherwise provided under the 2010 Plan.
Plan Amendment or Termination. Our board of directors has the authority to amend, suspend, or terminate our 2010 Plan, provided that such action is approved by our stockholders to the extent stockholder approval is necessary and that such action does not impair the existing rights of any participant without such participant’s written consent. Unless sooner terminated, the 2010 Plan will terminate on the day before the tenth anniversary of the date the 2010 Plan was adopted by the Board. No stock awards may be granted under the 2010 Plan while it is suspended or after it is terminated.
2015 Employee Stock Purchase Plan
Our board of directors adopted our 2015 Employee Stock Purchase Plan, or the ESPP, in August 2015. Our stockholders approved the ESPP in October 2015. The ESPP will become effective immediately upon the execution of the underwriting agreement for this offering. The maximum aggregate number of shares of our common stock that may be issued under our ESPP is 333,333 shares (subject to adjustment to reflect any split of our common stock). Additionally, the number of shares of our common stock reserved for issuance under our ESPP will increase automatically each year, beginning on January 1, 2016 and continuing through and including January 1, 2025, by the lesser of (1) 1% of the total number of shares of our common stock outstanding on December 31 of the preceding calendar year; (2) 333,333 shares of common stock; or (3) such lesser number as determined by our board of directors. Shares subject to purchase rights granted under the ESPP that terminate without having been exercised in full will not reduce the number of shares available for issuance under the ESPP. Shares may be authorized but unissued or reacquired common stock, including shares repurchased by us on the open market.
Our board of directors will administer the ESPP. Our board of directors may delegate authority to administer the ESPP to our compensation committee.
109
Table of Contents
Index to Financial Statements
Our employees and, if designated by our board of directors, the employees of our parent or subsidiaries may be eligible to participate in the ESPP. Employees, including executive officers, may have to satisfy one or more of the following service requirements before participating in the ESPP, as determined by the administrator: (1) customary employment for more than 20 hours per week and more than five months per calendar year, or (2) continuous employment for a minimum period of time, not to exceed two years. An employee may not be granted rights to purchase stock under the ESPP if such employee (1) immediately after the grant would own stock possessing 5% or more of the total combined voting power or value of our common stock, or (2) holds rights to purchase stock under the ESPP that would accrue at a rate that exceeds $25,000 worth of our stock for each calendar year that the rights remain outstanding. Under the ESPP, we may grant purchase rights that do not meet the requirements of an employee stock purchase plan because of deviations necessary to permit participation by employees who are foreign nationals or employed outside of the United States, as required by applicable foreign laws.
The administrator may approve offerings with a duration of not more than 27 months, and may specify one or more shorter purchase periods within each offering. Each offering will have one or more purchase dates on which shares of our common stock will be purchased for the employees who are participating in the offering. The administrator also may adopt procedures and sub-plans under the ESPP. No offerings have been approved as of the date of this prospectus.
The ESPP permits participants to purchase shares of our common stock through payroll deductions or other methods with up to 15% of their earnings. The purchase price of the shares will be not less than 85% of the lower of the fair market value of our common stock on the first day of an offering or on the date of purchase.
A participant may not transfer purchase rights under the ESPP other than by will, the laws of descent and distribution or as otherwise provided under the ESPP. During a participant’s lifetime, a purchase right may be exercised only by such participant.
In the event of a specified corporate transaction, such as a merger or change in control, a successor corporation may assume, continue or substitute each outstanding purchase right. If the successor corporation does not assume, continue or substitute for the outstanding purchase rights, the offering in progress may be shortened and a new exercise date will be set, so that the participants’ purchase rights can be exercised within 10 business days prior to the corporate transaction and terminate immediately thereafter.
The ESPP will remain in effect until terminated by the administrator in accordance with the terms of the ESPP. Our board of directors has the authority to amend, suspend or terminate our ESPP, at any time and for any reason.
Health and Welfare Benefits
All of our named executive officers are eligible to participate in our employee benefit plans, including our medical, dental and vision insurance plans, in each case on the same basis as all of our other full-time employees.
401(k) Plan
Our 401(k) Plan is a deferred savings retirement plan intended to qualify for favorable tax treatment under Section 401(a) of the Internal Revenue Code. All of our employees are generally eligible to participate in the 401(k) Plan subject to certain eligibility requirements, including requirements relating to age. Under the 401(k) Plan, each employee may make pre-tax contributions of up to 100% of their eligible compensation up to the current statutorily prescribed annual limit on pre-tax contributions under the Code. Employees who are 50 years of age or older may contribute additional amounts based on the statutory limits for catch-up contributions. We also make safe-harbor matching contributions up to $1,000 annually for each employee. Pre-tax contributions by employees and any employer contributions that we make to the 401(k) Plan and the income earned on those contributions are generally not taxable to employees until withdrawn. Employer contributions that we make to the 401(k) Plan are generally deductible when made. Employee contributions are held in trust as required by law. An employee’s interest in his or her pre-tax deferrals, including, with the exception of certain discretionary contributions, any matching contributions made by us, is 100% vested when contributed. For 2014, we made $0.3 million in matching contributions.
110
Table of Contents
Index to Financial Statements
Limitation on Liability and Indemnification of Directors and Officers
Upon the closing of this offering, our amended and restated certificate of incorporation will contain provisions that limit the liability of our current and former executive officers and directors for monetary damages to the fullest extent permitted by Delaware law. Delaware law provides that directors of a corporation will not be personally liable for monetary damages for any breach of fiduciary duties as directors, except liability:
| • | for any transaction from which the director derives an improper personal benefit; |
| • | for any act or omission not in good faith or that involves intentional misconduct or a knowing violation of law; |
| • | under Section 174 of the Delaware General Corporation Law (unlawful payment of dividends or redemption of shares); or |
| • | for any breach of a director’s duty of loyalty to the corporation or its stockholders. |
Such limitation of liability does not apply to liabilities arising under federal securities laws and does not affect the availability of equitable remedies, such as injunctive relief or rescission.
Our amended and restated certificate of incorporation and our bylaws will provide that we are required to indemnify our executive officers and directors to the fullest extent permitted by Delaware law. Our bylaws will also provide that, upon satisfaction of certain conditions, we shall advance expenses incurred by an executive officer and director in advance of the final disposition of any action or proceeding, and permit us to secure insurance on behalf of any officer, director, employee or other agent for any liability arising out of his or her actions in that capacity regardless of whether we would otherwise be permitted to indemnify him or her under the provisions of Delaware law. Our amended and restated certificate of incorporation and bylaws will also provide our board of directors with discretion to indemnify our other officers, employees and other agents when determined appropriate by the board. We have entered and expect to continue to enter into agreements to indemnify our directors and executive officers. With certain exceptions, these agreements provide for indemnification for related expenses including, among other things, attorneys’ fees, judgments, fines and settlement amounts incurred by any of these individuals in any action or proceeding. We believe that these bylaw provisions and indemnification agreements are necessary to attract and retain qualified persons as directors and officers. We also maintain customary directors’ and officers’ liability insurance.
The limitation of liability and indemnification provisions in our amended and restated certificate of incorporation and bylaws may discourage stockholders from bringing a lawsuit against our directors for breach of their fiduciary duty. They may also reduce the likelihood of derivative litigation against our directors and officers, even though an action, if successful, might benefit us and other stockholders. Furthermore, a stockholder’s investment may be adversely affected to the extent that we pay the costs of settlement and damage awards against directors and officers as required by these indemnification provisions. At present, there is no pending litigation or proceeding involving any of our directors, officers or employees for which indemnification is sought and we are not aware of any threatened litigation that may result in claims for indemnification.
Rule 10b5-1 Sales Plans
Our directors and officers may adopt written plans, known as Rule 10b5-1 plans, in which they will contract with a broker to buy or sell shares of our common stock on a periodic basis. Under a Rule 10b5-1 plan, a broker executes trades pursuant to parameters established by the director or officer when entering into the plan, without further direction from them. The director or officer may amend a Rule 10b5-1 plan in some circumstances and may terminate a plan at any time. Our directors and executive officers also may buy or sell additional shares outside of a Rule 10b5-1 plan when they are not in possession of material nonpublic information, subject to compliance with the terms of our insider trading policy. Prior to 180 days after the date of this offering, the sale of any shares under such plan would be subject to the lock-up agreement that the director or officer has entered into with the underwriters.
111
Table of Contents
Index to Financial Statements
CERTAIN RELATIONSHIPS AND RELATED PARTY TRANSACTIONS
The following is a summary of transactions since January 1, 2012 to which we have been a participant, in which:
| • | the amount involved exceeded or will exceed $120,000; and |
| • | any of our directors, executive officers, or holders of more than 5% of our capital stock, or any member of the immediate family of the foregoing persons, had or will have a direct or indirect material interest, other than compensation and other arrangements that are described in the section titled “Executive Compensation” or that were approved by our compensation committee. |
We believe the terms obtained or consideration that we paid or received, as applicable, in connection with the transactions described below were comparable to terms available or the amounts that would be paid or received, as applicable in arm’s-length transactions.
Sales of Preferred Stock
In August 2012, we issued an aggregate of 1,241,463 shares of our Series C preferred stock at a purchase price of $8.06 per share for an aggregate purchase price of $10.0 million. In May 2013, we issued an aggregate of 2,515,714 shares of our Series D preferred stock at a purchase price of $11.93 per share for an aggregate purchase price $30.0 million. In November 2014, we issued an aggregate of 1,824,732 shares of our Series E preferred stock at a purchase price of $21.92 per share for an aggregate purchase price $40.0 million. The following table summarizes purchases of preferred stock by holders of more than 5% of our capital stock and their affiliated entities and our directors. None of our executive officers purchased shares of preferred stock.
| Name |
Shares of Series C Preferred Stock |
Shares of Series D Preferred Stock |
Shares of Series E Preferred Stock |
Aggregate Purchase Price |
||||||||||||
| Entities affiliated with Bessemer Venture Partners(1) |
— | 2,180,293 | 182,472 | $ | 29,999,981 | |||||||||||
| Entities affiliated with Insight Venture Partners(2) |
— | — | 1,368,550 | 29,999,999 | ||||||||||||
| Entities affiliated with Epic Ventures(3) |
522,576 | 276,728 | 273,710 | 13,509,341 | ||||||||||||
| Entities affiliated with OpenView Venture Partners(4) |
718,887 | — | — | 5,790,648 | ||||||||||||
| (1) | Includes shares of preferred stock purchased by Bessemer Venture Partners VIII Institutional L.P. and Bessemer Venture Partners VIII L.P. Mr. Deeter, a member of our board of directors, is a partner of Bessemer Venture Partners. |
| (2) | Includes shares of preferred stock purchased by Insight Venture Partners (Cayman) VIII, L.P., Insight Venture Partners (Co-Investors) VIII, L.P., Insight Venture Partners (Delaware) VIII, L.P., Insight Venture Partners Coinvestment Fund (Delaware) III, L.P., Insight Venture Partners Coinvestment Fund III, L.P. and Insight Venture Partners VIII, L.P. |
| (3) | Includes shares of preferred stock purchased by Epic Expansion Capital, LLC, Epic Venture Fund IV, LLC and Zions SBIC LLC. Epic Ventures is the manager of Zions SBIC LLC. Mr. Efstratis, a member of our board of directors, is a Managing Director at Epic Ventures. |
| (4) | Includes shares of preferred stock purchased by OpenView Venture Partners, L.P., OpenView Affiliates Funds, L.P., OpenView Venture Partners II, L.P. and OpenView Affiliates Fund II, L.P. Mr. Marcus, a member of our board of directors, is a Managing Partner of OpenView Venture Partners. |
Repurchase and Subsequent Sale of Securities
In January 2012, we repurchased an aggregate of 229,886 shares of our Series A preferred stock at a purchase price of $4.35 per share and 310,077 shares of our common at a purchase price of $3.23 per share, for an aggregate purchase price of $2.0 million. In February 2012, we sold an equal number of shares at the same prices for an aggregate purchase price of $2.0 million to certain holders of 5% of our capital stock and their affiliated entities and our directors.
112
Table of Contents
Index to Financial Statements
The following table summarizes the capital stock we repurchased from Joshua L. Coates, our Chief Executive Officer, and Brian C. Whitmer, a member of the board of directors:
| Name |
Shares of Common Stock Repurchased |
Shares of Series A Preferred Stock Repurchased |
Aggregate Purchase Price |
|||||||||
| Joshua L. Coates |
— | 229,886 | $ | 1,000,001 | ||||||||
| Brian C. Whitmer |
155,039 | — | 500,002 | |||||||||
The following table summarizes the capital stock purchased by the holders of 5% of our capital stock and their affiliated entities and our directors. None of our executive officers purchased shares of capital stock.
| Name |
Shares of Common Stock |
Shares of Series A Preferred Stock |
Aggregate Purchase Price |
|||||||||
| Entities affiliated with OpenView Venture Partners(1) |
179,554 | 133,118 | $ | 1,158,132 | ||||||||
| Entities affiliated with Epic Ventures(2) |
130,523 | 96,767 | 841,873 | |||||||||
| (1) | Includes shares purchased by OpenView Venture Partners, L.P., OpenView Affiliates Funds, L.P., OpenView Venture Partners II, L.P. and OpenView Affiliates Fund II, L.P. Mr. Marcus, a member of our board of directors, is a Managing Partner of OpenView Venture Partners. |
| (2) | Includes shares purchased by Epic Venture Fund IV, LLC and Zions SBIC LLC. Epic Ventures is the manager of Zions SBIC LLC. Mr. Efstratis, a member of our board of directors, is a Managing Director at Epic Ventures. |
Other Issuances of Securities
In February 2013, we sold 24,814 shares of our common stock to Conroy Investments, LLC, an entity affiliated with William Conroy, a member of our board of directors, at a per share price of $6.05, for an aggregate purchase price of $150,000.
In February 2015, we issued 256,380 shares of our Series A preferred stock and 117,646 shares of our Series B preferred stock upon the exercise of outstanding warrants held by Joshua L. Coates, our Chief Executive Officer, at a per share exercise price of $0.39 and $1.28, respectively, for an aggregate purchase price of $250,000.
Investor Rights Agreement
In April 2014, we entered into an amended and restated investor rights agreement with holders of our preferred stock and common stock, including entities affiliated with Insight Venture Partners, Bessemer Venture Partners, Epic Ventures, OpenView Venture Partners, and our chief executive officer. Messrs. Deeter, Efstratis and Marcus, members of our board of directors, are affiliated with Bessemer Venture Partners, Epic Ventures and OpenView Venture Partners, respectively. After the closing of this offering, these holders will be entitled to certain registration rights, including the right to demand that we file a registration statement or request that their shares be covered by a registration statement that we are otherwise filing. The investor rights agreement also provides for a right of first refusal in favor of certain holders of our capital stock with regard to certain issuances of our capital stock. The rights of first refusal will not apply to, and will terminate upon, closing of this offering. For a description of these registration rights, see the section titled “Description of Capital Stock—Registration Rights.”
Offer Letters
We have entered into offer letters with our executive officers. For more information regarding these offer letters, see the section titled “Executive Compensation—Employment, Severance and Change of Control Agreements.”
113
Table of Contents
Index to Financial Statements
Equity Grants
We have granted stock options to our executive officers and a member of our board of directors. For a description of these stock options, see the section titled “Executive Compensation” and “Management—Non-Employee Director Compensation.”
Indemnification Agreements
Our amended and restated certificate of incorporation will contain provisions limiting the liability of directors, and our amended and restated bylaws provides that we will indemnify our directors and executive officers to the fullest extent permitted under Delaware law. Our amended and restated certificate of incorporation and bylaws will also provide our board of directors with discretion to indemnify our other officers, employees and agents when determined appropriate by the board of directors. In addition, we have entered into an indemnification agreement with each of our directors and executive officers, which requires us to indemnify them. For more information regarding these agreements, see the section titled “Executive Compensation—Limitation on Liability and Indemnification Matters.”
Participation in this Offering
Entities affiliated with Insight Venture Partners, an existing stockholder, have indicated an interest in purchasing up to an aggregate of $15 million of shares of our common stock in this offering at the initial public offering price. In addition, certain of our directors, executive officers and key employees have indicated an interest in purchasing up to an aggregate of approximately $3.3 million of shares of our common stock in this offering at the initial public offering price. Because these indications of interest are not binding agreements or commitments to purchase, these parties may elect not to purchase shares in this offering or the underwriters may elect not to sell any shares in this offering to such parties. If purchased by these parties, these shares will be subject to a 180-day lock-up restriction.
Related Party Transaction Policy
We have adopted a formal written policy that our executive officers, directors, key employees, holders of more than 5% of any class of our voting securities, and any member of the immediate family of and any entity affiliated with any of the foregoing persons, is not permitted to enter into a related-party transaction with us without the prior consent of our audit committee, or other independent body of our board of directors in the event it is inappropriate for our audit committee to review such transaction due to a conflict of interest. Any request for us to enter into a transaction with an executive officer, director, principal stockholder or any of their immediate family members or affiliates, in which the amount involved exceeds $120,000 must first be presented to our audit committee for review, consideration and approval. In approving or rejecting any such proposal, our audit committee will consider the relevant facts and circumstances available and deemed relevant to our audit committee, including, but not limited to, whether the transaction will be on terms no less favorable than terms generally available to an unaffiliated third-party under the same or similar circumstances and the extent of the related-party’s interest in the transaction.
All of the transactions described in this section were entered into prior to the adoption of this policy. Although we have not had a written policy for the review and approval of transactions with related persons, our board of directors has historically reviewed and approved any transaction where a director or officer had a financial interest, including the transactions described above. Prior to approving such a transaction, the material facts as to a director’s or officer’s relationship or interest in the agreement or transaction were disclosed to our board of directors. Our board of directors took this information into account when evaluating the transaction and in determining whether such transaction was fair to us and in the best interest of all our stockholders.
114
Table of Contents
Index to Financial Statements
The following table sets forth information with respect to the beneficial ownership of our common stock as of September 30, 2015 by:
| • | each person, or group of affiliated persons, known by us to beneficially own more than 5% of our common stock; |
| • | each of our named executive officers |
| • | each of our directors; and |
| • | all of our executive officers and directors as a group. |
The percentage of shares beneficially owned before the offering shown in the table is based on 21,988,514 shares of common stock outstanding as of September 30, 2015, after giving effect to the conversion of all outstanding shares of our preferred stock into common stock upon the closing of this offering (assuming a conversion ratio equal to approximately 1.2895 shares of common stock for each share of Series E preferred stock based on an assumed initial public offering price of $17.00 per share, the midpoint of the price range set forth on the cover page of this prospectus). The percentage of shares beneficially owned after this offering assumes the sale by us of 4,400,000 shares of common stock in this offering. The percentage of shares beneficially owned assumes no exercise of the underwriters’ over-allotment option to purchase additional shares of our common stock. The information set forth below assumes no purchase of shares in this offering by our directors and executive officers.
Beneficial ownership is determined according to the rules of the SEC and generally means that a person has beneficial ownership of a security if he, she or it possesses sole or shared voting or investment power of that security, including stock options and warrants that are exercisable within 60 days of September 30, 2015. Shares of our common stock issuable pursuant to stock options are deemed outstanding for computing the percentage of the person holding such options and the percentage of any group of which the person is a member but are not deemed outstanding for computing the percentage of any other person. Except as indicated by the footnotes below, we believe, based on the information furnished to us, that the persons named in the table below have sole voting and investment power with respect to all shares of common stock shown that they beneficially own, subject to community property laws where applicable. The information does not necessarily indicate beneficial ownership for any other purpose, including for purposes of Section 13(d) and 13(g) of the Securities Act.
115
Table of Contents
Index to Financial Statements
Unless otherwise indicated, the address of each beneficial owner listed in the table below is c/o Instructure, Inc., 6330 South 3000 East, Suite 700, Salt Lake City, UT 84121.
| Name and Address of Beneficial Owner |
Number of Shares Beneficially Owned |
Percentage of Shares Beneficially Owned |
||||||||||
| Before Offering |
After Offering |
|||||||||||
| Greater than 5% stockholders |
||||||||||||
| Entities affiliated with OpenView Venture Partners(1) |
4,953,126 | 22.5 | % | 18.8 | % | |||||||
| Entities affiliated with Epic Ventures(2) |
4,803,017 | 21.8 | 18.2 | |||||||||
| Entities affiliated with Bessemer Venture Partners(3) |
2,705,963 | 12.3 | 10.3 | |||||||||
| Entities affiliated with Insight Venture Partners(4) |
2,485,661 | 11.3 | 9.4 | |||||||||
| Directors and Named Executive Officers |
||||||||||||
| Joshua L. Coates(5) |
2,664,474 | 12.1 | 10.1 | |||||||||
| Steven B. Kaminsky(6) |
272,660 | 1.2 | 1.0 | |||||||||
| Marc T. Maloy(7) |
163,332 | * | * | |||||||||
| Steven A. Collins(8) |
57,023 | * | * | |||||||||
| William M. Conroy(9) |
124,724 | * | * | |||||||||
| Byron B. Deeter(3) |
2,705,963 | 12.3 | 10.3 | |||||||||
| E. Nicholaus Efstratis(2) (10) |
4,842,166 | 22.0 | 18.3 | |||||||||
| Ellen Levy |
— | — | — | |||||||||
| Adam D. Marcus(1) |
4,953,126 | 22.5 | 18.8 | |||||||||
| Lloyd G. Waterhouse |
— | — | — | |||||||||
| Brian C. Whitmer(11) |
1,242,748 | 5.7 | 4.7 | |||||||||
| All current executive officers and directors as a group (12 persons)(12) |
17,026,216 | 76.6 | 63.9 | |||||||||
| * | Represents beneficial ownership of less than one percent |
| (1) | Includes (a) 116,312 shares held by OpenView Affiliates Fund II, L.P., (b) 175,251 shares held by OpenView Affiliates Fund, L.P., (c) 2,360,251 shares held by OpenView Venture Partners II, L.P. and (d) 2,301,312 shares held by OpenView Venture Partners, L.P. OpenView Management, LLC, the general partner of OpenView Affiliates Fund II, L.P., OpenView Affiliates Fund, L.P., OpenView Venture Partners II, L.P. and OpenView Venture Partners, L.P., has sole voting and investment power with respect to the shares held by these entities. The managing member of OpenView Management, LLC is Scott Maxwell. Mr. Marcus, a member of our board of directors, is a managing partner at OpenView Venture Partners. The address for each of these entities is 303 Congress Street, 7th Floor, Boston, MA 02210. |
| (2) | Includes (a) 572,806 shares held by Epic Expansion Capital Annex, LLC, (b) 352,940 shares held by Epic Expansion Capital, LLC, (c) 2,672,811 shares held by Epic Venture Fund IV, LLC and (d) 1,204,460 shares held by Zions SBIC LLC. EPIC Management Partners, LLC is the manager of Epic Expansion Capital Annex, LLC. E. Nicholaus Efstratis and Kent Madsen have shared voting and investment power with respect to the shares held by Epic Expansion Capital Annex, LLC, Epic Expansion Capital, LLC, Epic Venture Fund IV, LLC and Zions SBIC LLC, each of whom disclaims beneficial ownership of the securities held by such entities, except to the extent of any pecuniary interest therein. Mr. Efstratis, a member of our board of directors, is a managing director at Epic Ventures. The address for each of these entities is One South Main Street, 8th Floor Salt Lake City, UT 84111. |
| (3) | Includes (a) 1,477,457 shares held by Bessemer Venture Partners VIII Institutional L.P. (“Bessemer Institutional”) and (b) 1,228,506 shares held by Bessemer Venture Partners VIII L.P. (“Bessemer VIII” and together with Bessemer Institutional, the “Bessemer Entities”). Deer VIII & Co. L.P. is the general partner of each of the Bessemer Entities, and Deer VIII & Co. Ltd. is the general partner of Deer VIII & Co. L.P. Each of Deer VIII & Co. L.P. and Deer VIII & Co. Ltd. may be deemed to have voting and dispositive power over the shares held by the Bessemer Entities. Robert M. Stavis, J. Edmund Colloton, David J. Cowan, Byron B. Deeter, a member of our board of directors, Robert P. Goodman and Jeremy S. Levine are the directors of Deer VIII & Co. Ltd. Investment and voting decisions with respect to shares held by the Bessemer Entities are made by the directors of Deer VIII & Co. Ltd. acting as an investment committee. No stockholder, partner, director, officer, manager, member or employee of Deer VIII & Co. L.P. or Deer VIII & Co. Ltd. has beneficial ownership (within the meaning of Rule 13d-3 promulgated under the Exchange Act) of any shares held by the Bessemer Entities. The address for the Bessemer Entities is c/o Bessemer Venture Partners 1865 Palmer Avenue, Suite 104, Larchmont, NY 10538. |
| (4) | Includes (a) 771,213 shares held by Insight Venture Partners VIII, L.P.; (b) 199,490 shares held by Insight Venture Partners (Cayman) VIII, L.P.; (c) 27,522 shares held by Insight Venture Partners (Co-Investors) VIII, L.P.; (d) 244,605 shares held by Insight Venture Partners (Delaware) VIII, L.P., (e) 721,013 shares held by Insight Venture Partners Coinvestment Fund III, L.P. and (f) 521,818 shares held by Insight Venture Partners Coinvestment Fund (Delaware) III, L.P. Insight Holdings Group, LLC (“Holdings”) is the sole shareholder of Insight Venture Associates VIII, Ltd. (“IVA Ltd”) and Insight Venture Associates Coinvestment III, LTD (“IVA Coinvestment LTD”). IVA Ltd is the general partner of Insight Venture Associates VIII, L.P. (“IVP LP”), which is the general |
116
Table of Contents
Index to Financial Statements
| partner of Insight Venture Partners VIII, L.P., Insight Venture Partners (Cayman) VIII L.P., Insight Venture Partners (Delaware) VIII, L.P. and Insight Venture Partners VIII (Co-Investors), L.P. IVA Coinvestment LTD is the general partner of Insight Venture Associates Coinvestment III, L.P. (“IVA Coinvestment LP”), which is the general partner of Insight Venture Partners Coinvestment Fund (Delaware) III, L.P. and Insight Venture Partners Coinvestment Fund III, L.P. Each of Jeffrey Horing, Deven Parekh, Peter Sobiloff, Michael Triplett and Jeffrey Lieberman is a member of the board of managers of Holdings. Because Messrs. Horing, Parekh, Sobiloff, Triplett and Lieberman are members of the board of managers of Holdings, Holdings is the sole shareholder of IVA Ltd and IVA Coinvestment LTD, Messrs. Horing, Parekh, Sobiloff, Triplett and Lieberman have voting and dispositive power over the shares held by these entities. The foregoing is not an admission by Holdings, IVA Ltd or IVA Coinvestment LTD that it is the beneficial owner of the shares held by these entities. The principal business address of the entities affiliated with Insight Venture Management, LLC is c/o Insight Venture Partners, 1114 Avenue of the Americas 36th Floor, New York, NY 10036. Entities affiliated with Insight Venture Partners have indicated an interest in purchasing up to an aggregate of $15 million of shares of our common stock in this offering at the initial public offering price. Because these indications of interest are not binding agreements or commitments to purchase, these parties may elect not to purchase shares in this offering or the underwriters may elect not to sell any shares in this offering to such parties. If these entities purchase all such shares of common stock in this offering at an assumed initial public offering price of $17.00 per share, the aggregate beneficial ownership of these parties would increase by 3.3%. |
| (5) | Represents 2,664,474 shares held by Grizzly Peak, LLC, with respect to which Joshua L. Coates holds sole voting and investment power. |
| (6) | Includes (a) 243,318 shares, of which 40,553 shares are subject to a right of repurchase, and (b) 29,342 shares issuable pursuant to stock options exercisable within 60 days of September 30, 2015. |
| (7) | Includes (a) 13,333 shares and (b) 149,999 shares issuable pursuant to stock options exercisable within 60 days of September 30, 2015. |
| (8) | Represents 57,023 shares issuable pursuant to stock options exercisable within 60 days of September 30, 2015. |
| (9) | Includes (a) 119,169 shares held by Conroy Investments, LLC, with respect to which Mr. Conroy holds sole voting and investment power, and (b) 5,555 shares issuable pursuant to stock options exercisable within 60 days of September 30, 2015. |
| (10) | Includes 39,149 shares held by NKE Investments, LLC. Mr. Efstratis has voting and dispositive power over the shares held by this entity. In addition, Mr. Efstratis is a managing director at Epic Ventures. Please see footnote (2). |
| (11) | Includes (a) 709,415 shares held by The Brian and Paula Whitmer Revocable Trust dated April 10, 2014 and (b) 533,333 shares held by Whitmer Family Enterprises, LLC, with respect to all of which Mr. Whitmer holds sole voting and investment power. |
| (12) | Includes (a) 16,784,297 shares held by our directors, executive officers and affiliated entities and (b) 241,919 shares issuable pursuant to stock options exercisable within 60 days of September 30, 2015. Certain of our directors and executive officers have indicated an interest in purchasing up to an aggregate of approximately $3.2 million of shares of our common stock in this offering at the initial offering price. Because these indications of interest are not binding agreements or commitments to purchase, these parties may elect not to purchase shares in this offering or the underwriters may elect not to sell any shares in this offering to such parties. If these directors and executive officers purchase all such shares of common stock in this offering at an assumed initial public offering price of $17.00 per share, the aggregate beneficial ownership of these parties would increase by less than 1%. |
117
Table of Contents
Index to Financial Statements
General
The following description of our capital stock and certain provisions of our amended and restated certificate of incorporation and amended and restated bylaws to be in effect immediately after the closing of the offering are summaries and are qualified by reference to these documents. Copies of these documents will be filed with the SEC as exhibits to our registration statement, of which this prospectus forms a part. The descriptions of our common stock and preferred stock reflect changes to our capital structure that will occur upon the closing of this offering.
Our amended and restated certificate of incorporation will provide for common stock and will authorize shares of undesignated preferred stock, the rights, preferences and privileges of which may be designated from time to time by our board of directors.
Upon the closing of this offering, our authorized capital stock will consist of 210,000,000 shares, all with a par value of $0.0001 per share, of which:
| • | 200,000,000 shares are designated as common stock; and |
| • | 10,000,000 shares are designated as preferred stock. |
As of September 30, 2015, we had outstanding:
| • | 21,988,514 shares of common stock, which assumes the conversion of all outstanding shares of preferred stock into shares of common stock immediately upon the closing of this offering (assuming a conversion ratio equal to approximately 1.2895 shares of common stock for each share of Series E preferred stock based on an assumed initial public offering price of $17.00 per share, the midpoint of the price range set forth on the cover page of this prospectus); |
| • | 3,909,871 shares of common stock issuable upon the exercise of outstanding stock options with a weighted-average exercise price of $5.95 per share; and |
| • | 103,332 shares of common stock issuable upon the exercise of outstanding warrants with a weighted-average exercise price of $2.11 per share. |
In addition, stock options to purchase an aggregate of 313,661 shares of common stock were granted subsequent to September 30, 2015, with an exercise price of $14.25 per share. Our outstanding capital stock was held by 202 stockholders of record as of September 30, 2015.
Common Stock
Voting Rights
Each holder of common stock is entitled to one vote for each share of common stock held on all matters submitted to a vote of stockholders, except as otherwise expressly provided in our amended and restated certificate of incorporation or required by applicable law. Cumulative voting for the election of directors is not provided for in our amended and restated certificate of incorporation, which means that the holders of a majority of the shares of common stock can elect all of the directors then standing for election.
Dividends and Distributions
Subject to preferences that may apply to any shares of preferred stock outstanding at the time, the holders of outstanding shares of common stock are entitled to receive dividends out of funds legally available at the times and in the amounts that our board of directors may determine. We do not anticipate paying any cash dividends in the foreseeable future.
118
Table of Contents
Index to Financial Statements
Liquidation Rights
Upon our liquidation, dissolution or winding-up, the assets legally available for distribution to our stockholders would be distributable ratably among the holders of common stock and any participating preferred stock outstanding at that time after payment of liquidation preferences, on any outstanding shares of preferred stock and payment of other claims of creditors.
The rights, preferences, and privileges of holders of common stock are subject to, and may be adversely affected by, the rights of holders of shares of any series of preferred stock that we may designate and issue in the future.
Preemptive or Similar Rights
Our common stock is not entitled to preemptive rights and is not subject to conversion or redemption.
Preferred Stock
As of September 30, 2015, there were 14,977,124 shares of preferred stock outstanding, which will convert, immediately upon the closing of this offering, into 15,505,330 shares of common stock (assuming a conversion ratio equal to approximately 1.2895 shares of common stock for each share of Series E preferred stock based on an assumed initial public offering price of $17.00 per share, the midpoint of the price range set forth on the cover page of this prospectus). See the section of this prospectus titled “Prospectus Summary—Offering” for further discussion.
Upon the closing of this offering, our board of directors may, without further action by our stockholders, fix the rights, preferences, privileges and restrictions of up to an aggregate of 10,000,000 shares of preferred stock in one or more series and authorize their issuance. These rights, preferences and privileges could include dividend rights, conversion rights, voting rights, terms of redemption, liquidation preferences, sinking fund terms and the number of shares constituting any series or the designation of such series, any or all of which may be greater than the rights of our common stock. The issuance of our preferred stock could adversely affect the voting power of holders of our common stock and the likelihood that such holders will receive dividend payments and payments upon liquidation. In addition, the issuance of preferred stock could have the effect of delaying, deferring or preventing a change of control or other corporate action. Upon the closing of this offering, no shares of preferred stock will be outstanding, and we have no present plan to issue any shares of preferred stock.
Options
As of September 30, 2015, 3,909,871 shares of common stock were issuable upon the exercise of outstanding stock options, with a weighted-average exercise price of $5.95 per share. In addition, stock options to purchase an aggregate of 313,661 shares of common stock were granted subsequent to September 30, 2015, with an exercise price of $14.25 per share. For additional information regarding the terms of these plans, see the section titled “Executive Compensation—Employee Benefit Plans.”
Warrants
As of September 30, 2015, 103,332 shares of common stock were issuable upon exercise of outstanding warrants to purchase common stock with a weighted-average exercise price of $2.11 per share. Of such shares 16,666 are only issuable, at an exercise price of $4.47 per share, if the aggregate loan balance under our credit facility exceeds $7,500,000. The warrants provide for the adjustment of the number of shares issuable upon the exercise of the warrants in the event of stock splits, recapitalizations, reclassifications and consolidations. Unless exercised earlier, these warrants shall terminate three years after the closing of this offering.
119
Table of Contents
Index to Financial Statements
Registration Rights
We are party to an investor rights agreement which provides that holders of our preferred stock, including certain holders of 5% of our capital stock and entities affiliated with certain of our directors, have certain registration rights, as set forth below. This investor rights agreement was entered into in April 2011 and has been amended and restated from time to time in connection with our preferred stock financings. The registration of shares of our common stock pursuant to the exercise of registration rights described below would enable the holders to sell these shares without restriction under the Securities Act when the applicable registration statement is declared effective. We will pay the registration expenses, other than underwriting discounts and selling commissions, of the shares registered pursuant to the demand, piggyback and Form S-3 registrations described below.
Generally, in an underwritten offering, the managing underwriter, if any, has the right, subject to specific conditions, to limit the number of shares such holders may include. The demand, piggyback and Form S-3 registration rights described below will expire three years after the effective date of the registration statement, of which this prospectus forms a part, or with respect to any particular stockholder, such time as that stockholder can sell all of its shares under Rule 144 of the Securities Act during any 90-day period.
Demand Registration Rights
The holders of 18,692,752 shares of common stock will be entitled to certain demand registration rights. At any time beginning 180 days after the closing of this offering, the holders of 75% of these shares may, on not more than two occasions, request that we file a registration statement having an aggregate offering price to the public of not less than $10,000,000 to register the offer and sale of all or a portion of their shares.
Piggyback Registration Rights
In connection with this offering, the holders of 18,692,752 shares of common stock were entitled to, and the necessary percentage of holders waived, their rights to include their shares of registrable securities in this offering. If we propose to register the offer and sale of any of our securities under the Securities Act either for our own account or for the account of other security holders, the holders of these shares will be entitled to certain “piggyback” registration rights allowing them to include their shares in such registration, subject to certain marketing and other limitations. As a result, whenever we propose to file a registration statement under the Securities Act including a registration statement on Form S-3 as discussed below, other than with respect to a demand registration or a registration statement on Forms S-4 or S-8, the holders of these shares are entitled to notice of the registration and have the right, subject to limitations that the underwriters may impose on the number of shares included in the registration, to include their shares in the registration.
Form S-3 Registration Rights
The holders of 18,692,752 shares of common stock will be entitled to certain Form S-3 registration rights. Such holders may make a request that we register their shares on Form S-3 if we are qualified to file a registration statement on Form S-3. Such request for registration on Form S-3 must cover securities the aggregate offering price of which, before payment of underwriting discounts and commissions, is at least $500,000.
Anti-Takeover Provisions
Amended and Restated Certificate of Incorporation and Amended and Restated Bylaws
Among other things, our amended and restated certificate of incorporation and amended and restated bylaws will:
| • | permit our board of directors to issue up to 10,000,000 shares of preferred stock, with any rights, preferences and privileges as they may designate, including the right to approve an acquisition or other change of control; |
120
Table of Contents
Index to Financial Statements
| • | provide that the authorized number of directors may be changed only by resolution of our board of directors; |
| • | provide that, subject to the rights of any series of preferred stock to elect directors, directors may be removed with or without cause, by the holders of at least 66 2/3% of all of our then-outstanding shares of the capital stock entitled to vote generally at an election of directors; |
| • | provide that all vacancies, including newly created directorships, may, except as otherwise required by law, be filled by the affirmative vote of a majority of directors then in office, even if less than a quorum; |
| • | require that any action to be taken by our stockholders must be effected at a duly called annual or special meeting of stockholders and not be taken by written consent or electronic transmission; |
| • | provide that stockholders seeking to present proposals before a meeting of stockholders or to nominate candidates for election as directors at a meeting of stockholders must provide advance notice in writing, and also specify requirements as to the form and content of a stockholder’s notice; |
| • | provide that special meetings of our stockholders may be called only by the chairperson of our board of directors, our chief executive officer or by our board of directors pursuant to a resolution adopted by a majority of the total number of authorized directors; and |
| • | not provide for cumulative voting rights, therefore allowing the holders of a majority of the shares of common stock entitled to vote in any election of directors to elect all of the directors standing for election, if they should so choose. |
The amendment of any of these provisions would require approval by the holders of at least 66 2/3% of all of our then-outstanding capital stock entitled to vote generally in the election of directors.
The combination of these provisions will make it more difficult for our existing stockholders to replace our board of directors as well as for another party to obtain control of us by replacing our board of directors. Because our board of directors has the power to retain and discharge our officers, these provisions could also make it more difficult for existing stockholders or another party to effect a change in management. In addition, the authorization of undesignated preferred stock makes it possible for our board of directors to issue preferred stock with voting or other rights or preferences that could impede the success of any attempt to change our control.
These provisions are intended to enhance the likelihood of continued stability in the composition of our board of directors and its policies and to discourage coercive takeover practices and inadequate takeover bids. These provisions are also designed to reduce our vulnerability to hostile takeovers and to discourage certain tactics that may be used in proxy fights. However, such provisions could have the effect of discouraging others from making tender offers for our shares and may have the effect of delaying changes in our control or management. As a consequence, these provisions may also inhibit fluctuations in the market price of our stock.
Delaware Anti-Takeover Law
We are subject to Section 203 of the Delaware General Corporation Law, or Section 203. Section 203 generally prohibits a public Delaware corporation from engaging in a “business combination” with an “interested stockholder” for a period of three years after the date of the transaction in which the person became an interested stockholder, unless:
| • | prior to the date of the transaction, the board of directors of the corporation approved either the business combination or the transaction which resulted in the stockholder becoming an interested stockholder; |
| • | the interested stockholder owned at least 85% of the voting stock of the corporation outstanding upon consummation of the transaction, excluding for purposes of determining the number of shares outstanding (1) shares owned by persons who are directors and also officers and (2) shares owned by |
121
Table of Contents
Index to Financial Statements
| employee stock plans in which employee participants do not have the right to determine confidentially whether shares held subject to the plan will be tendered in a tender or exchange offer; or |
| • | on or subsequent to the consummation of the transaction, the business combination is approved by the board and authorized at an annual or special meeting of stockholders, and not by written consent, by the affirmative vote of at least 66 2/3% of the outstanding voting stock which is not owned by the interested stockholder. |
Section 203 defines a business combination to include:
| • | any merger or consolidation involving the corporation and the interested stockholder; |
| • | any sale, transfer, pledge or other disposition involving the interested stockholder of 10% or more of the assets of the corporation; |
| • | subject to exceptions, any transaction involving the corporation that has the effect of increasing the proportionate share of the stock of any class or series of the corporation beneficially owned by the interested stockholder; |
| • | subject to exceptions, any transaction that results in the issuance or transfer by the corporation of any stock of the corporation to the interested stockholder; and |
| • | the receipt by the interested stockholder of the benefit of any loans, advances, guarantees, pledges or other financial benefits provided by or through the corporation. |
In general, Section 203 defines an interested stockholder as any entity or person beneficially owning 15% or more of the outstanding voting stock of the corporation and any entity or person affiliated with or controlling or controlled by the entity or person.
Choice of Forum
Our amended and restated certificate of incorporation will provide that the Court of Chancery of the State of Delaware will be the exclusive forum for any derivative action or proceeding brought on our behalf; any action asserting a breach of fiduciary duty; any action asserting a claim against us arising pursuant to the Delaware General Corporation Law, our amended and restated certificate of incorporation or our amended and restated bylaws; or any action asserting a claim against us that is governed by the internal affairs doctrine. The enforceability of similar choice of forum provisions in other companies’ certificates of incorporation has been challenged in legal proceedings, and it is possible that, in connection with one or more actions or proceedings described above, a court could find the choice of forum provisions contained in our amended and restated certificate of incorporation to be inapplicable or unenforceable.
Limitations of Liability and Indemnification
See the section titled “Executive Compensation—Limitation on Liability and Indemnification.”
Listing
Our common stock has been approved for listing on the New York Stock Exchange under the symbol “INST.”
Transfer Agent and Registrar
The transfer agent and registrar for our common stock is Computershare Trust Company N.A. The transfer agent and registrar’s address is 250 Royall Street, Canton, Massachusetts 02021. The transfer agent’s telephone number is (877) 373-6374.
122
Table of Contents
Index to Financial Statements
SHARES ELIGIBLE FOR FUTURE SALE
Prior to this offering, no public market for our common stock existed, and a liquid trading market for our common stock may not develop or be sustained after this offering. Future sales of our common stock in the public market could adversely affect prevailing market prices of our common stock from time to time and could impair our future ability to raise equity capital in the future. As described below, only a limited number of shares will be available for sale shortly after this offering due to contractual and legal restrictions on resale. Nevertheless, sales of our common stock in the public market after such restrictions lapse, or the perception that those sales may occur, could adversely affect the prevailing market price at such time and our ability to raise equity capital in the future.
Based upon the number of shares outstanding as of September 30, 2015, upon the closing of this offering 26,388,514 shares of our common stock will be outstanding, assuming no exercise of the underwriters’ over-allotment option to purchase additional shares of common stock and no exercise of outstanding options or warrants. All of the shares sold in this offering will be freely tradable, except that any shares held by our affiliates, as that term is defined in Rule 144 under the Securities Act, may only be sold in compliance with the limitations described below.
The remaining 21,988,514 shares of common stock outstanding after this offering are restricted securities as defined in Rule 144 under the Securities Act or are subject to lock-up agreements with us as described below. Following the expiration of the lock-up period, restricted securities may be sold in the public market only if the offer and sale is registered or if the offer and sale qualifies for an exemption from registration, including under Rule 144 or 701 promulgated under the Securities Act, described in greater detail below. These remaining shares will generally become available for sale in the public market as follows:
| • | no shares will be eligible for sale in the public market on the date of this prospectus; and |
| • | approximately 21,988,514 shares will be eligible for sale in the public market upon expiration of lock-up agreements 181 days after the date of this prospectus, subject in certain circumstances to the volume, manner of sale and other limitations of Rule 144 and Rule 701. |
As of September 30, 2015, of the 3,909,871 shares of common stock issuable upon exercise of options outstanding, approximately 2,221,278 shares will be vested and eligible for sale 181 days after the date of this prospectus.
We may issue shares of common stock from time to time as consideration for future acquisitions, investments or other corporate purposes. In the event that any such acquisition, investment or other transaction is significant, the number of shares of common stock that we may issue may in turn be significant. We may also grant registration rights covering those shares of common stock issued in connection with any such acquisition and investment.
In addition, the shares of common stock reserved for future issuance under our 2015 Plan will become eligible for sale in the public market to the extent permitted by the provisions of various vesting schedules, the lock-up agreements, a registration statement under the Securities Act or an exemption from registration, including Rule 144 and Rule 701.
Rule 144
In general, persons who have beneficially owned restricted shares of our common stock for at least six months, and any affiliate of the company who owns either restricted or unrestricted shares of our common stock, are entitled to sell their securities without registration with the SEC under an exemption from registration provided by Rule 144 under the Securities Act.
123
Table of Contents
Index to Financial Statements
Persons who have beneficially owned restricted shares of our common stock for at least six months would be entitled to sell their securities provided that (1) such person is not deemed to have been one of our affiliates at the time of, or at any time during the 90 days preceding a sale and (2) we are subject to the periodic reporting requirements of the Exchange Act for at least 90 days before the sale and (3) we are current in our Exchange Act reporting at the time of sale.
Persons who have beneficially owned restricted shares of our common stock for at least six months but who are our affiliates at the time of, or any time during the 90 days preceding, a sale, would be subject to additional restrictions, by which such person would be entitled to sell within any three-month period only a number of securities that does not exceed the greater of either of the following:
| • | 1% of the number of shares of our common stock outstanding after this offering, which will equal approximately 263,885 shares immediately after the closing of this offering, based on the number of shares of common stock outstanding as of September 30, 2015; or |
| • | the average weekly trading volume of our common stock on the NYSE during the four calendar weeks preceding the filing of a notice on Form 144 with respect to the sale; provided, in each case, that we are subject to the periodic reporting requirements of the Exchange Act for at least 90 days before the sale. |
Such sales by affiliates must also comply with the manner of sale, current public information and notice provisions of Rule 144.
Rule 701
In general, under Rule 701, a person who purchased shares of our common stock pursuant to a written compensatory plan or contract and who is not deemed to have been one of our affiliates during the immediately preceding 90 days may sell these shares in reliance upon Rule 144, but without being required to comply with the notice, manner of sale, public information requirements or volume limitation provisions of Rule 144. Rule 701 also permits affiliates to sell their Rule 701 shares under Rule 144 without complying with the holding period requirements of Rule 144. All holders of Rule 701 shares, however, are required to wait until 90 days after the date of this prospectus before selling such shares pursuant to Rule 701. As of September 30, 2015, 1,231,158 shares of our outstanding common stock had been issued in reliance on Rule 701 as a result of exercises of stock options and issuance of restricted stock. However, substantially all Rule 701 shares are subject to lock-up agreements as described below and will become eligible for sale upon the expiration of the restrictions set forth in those agreements.
Form S-8 Registration Statements
As soon as practicable after the closing of this offering, we intend to file a Form S-8 registration statement under the Securities Act to register the issuance of shares of our common stock under our equity compensation plans and agreements. This registration statement will become effective immediately upon filing, and shares covered by such registration statement will be eligible for sale in the public markets, subject to vesting restrictions, the lock-up agreements described above and Rule 144 limitations applicable to affiliates. For a more complete discussion of our equity compensation plans, see the section titled “Executive Compensation—Employee Benefit Plans.”
Lock-Up Arrangements
Our officers, directors and substantially all of our stockholders and option and warrant holders have agreed with the underwriters that for a period of 180 days following the date of this prospectus, subject to certain exceptions, that they will not offer, sell, contract to sell, pledge or otherwise dispose of, directly or indirectly, any shares of our common stock or securities convertible into or exchangeable or exercisable for any shares of our common stock, enter into a transaction that would have the same effect, or enter into any swap, hedge or other
124
Table of Contents
Index to Financial Statements
arrangement that transfers, in whole or in part, any of the economic consequences of ownership of our common stock, whether any of these transactions are to be settled by delivery of our common stock or other securities, in cash or otherwise. Morgan Stanley & Co. LLC and Goldman, Sachs & Co. may, in their sole discretion, at any time, release all or any portion of the shares from the restrictions in this agreement.
In addition to the restrictions contained in the lock-up agreement described above, we have entered into agreements with certain securityholders, including the investor rights agreement and our standard form option agreement, that contain market stand-off provisions imposing restrictions on the ability of such securityholders to offer, sell or transfer our equity securities for a period of 180 days following the date of this prospectus.
Registration Rights
Upon the closing of this offering, the holders of 18,692,752 shares of common stock or their transferees, will be entitled to certain rights with respect to the registration of those shares under the Securities Act. If the offer and sale of these shares are registered, they will be freely tradable without restriction under the Securities Act immediately upon the effectiveness of the registration. For a description of these registration rights, see the section titled “Description of Capital Stock—Registration Rights.”
125
Table of Contents
Index to Financial Statements
MATERIAL U.S. FEDERAL INCOME AND ESTATE TAX CONSEQUENCES TO NON-U.S. HOLDERS OF OUR COMMON STOCK
The following summary describes the material U.S. federal income and estate tax consequences of the acquisition, ownership and disposition of our common stock acquired in this offering by Non-U.S. Holders (as defined below). This discussion does not address all aspects of U.S. federal income and estate taxes and does not deal with foreign, state and local consequences that may be relevant to Non-U.S. Holders in light of their particular circumstances, nor does it address U.S. federal tax consequences other than income and estate taxes. Special rules different from those described below may apply to certain Non-U.S. Holders that are subject to special treatment under the Code, such as financial institutions, insurance companies, tax-exempt organizations, broker-dealers and traders in securities, U.S. expatriates, “controlled foreign corporations,” “passive foreign investment companies,” corporations that accumulate earnings to avoid U.S. federal income tax, persons that hold our common stock as part of a “straddle,” “hedge,” “conversion transaction,” “synthetic security” or integrated investment or other risk reduction strategy, persons subject to the alternative minimum tax or federal Medicare contribution tax on net investment income, partnerships and other pass-through entities, and investors in such pass-through entities. Such Non-U.S. Holders are urged to consult their own tax advisors to determine the U.S. federal, state, local and other tax consequences that may be relevant to them. Furthermore, the discussion below is based upon the provisions of the Code, and Treasury regulations, rulings and judicial decisions thereunder as of the date hereof, and such authorities may be repealed, revoked or modified, perhaps retroactively, so as to result in U.S. federal income and estate tax consequences different from those discussed below. We have not requested a ruling from the U.S. Internal Revenue Service, or IRS, with respect to the statements made and the conclusions reached in the following summary, and there can be no assurance that the IRS will agree with such statements and conclusions. This discussion assumes that the Non-U.S. Holder holds our common stock as a “capital asset” within the meaning of Section 1221 of the Code (generally, property held for investment).
Persons considering the purchase of our common stock pursuant to this offering should consult their own tax advisors concerning the U.S. federal income and estate tax consequences of acquiring, owning and disposing of our common stock in light of their particular situations as well as any consequences arising under the laws of any other taxing jurisdiction, including any state, local or foreign tax consequences.
For the purposes of this discussion, a “Non-U.S. Holder” is, for U.S. federal income tax purposes, a beneficial owner of common stock that is neither a U.S. Holder, nor a partnership (or other entity treated as a partnership for U.S. federal income tax purposes regardless of its place of organization or formation). A “U.S. Holder” means a beneficial owner of our common stock that is for U.S. federal income tax purposes (1) an individual who is a citizen or resident of the U.S., (2) a corporation or other entity treated as a corporation created or organized in or under the laws of the U.S., any state thereof or the District of Columbia, (3) an estate the income of which is subject to U.S. federal income taxation regardless of its source or (4) a trust if it (a) is subject to the primary supervision of a court within the U.S. and one or more U.S. persons have the authority to control all substantial decisions of the trust or (b) has a valid election in effect under applicable U.S. Treasury regulations to be treated as a U.S. person.
Distributions
Subject to the discussion below, distributions, if any, made on our common stock to a Non-U.S. Holder of our common stock to the extent made out of our current or accumulated earnings and profits (as determined under U.S. federal income tax principles) generally will constitute dividends for U.S. tax purposes and will be subject to withholding tax at a 30% rate or such lower rate as may be specified by an applicable income tax treaty. To obtain a reduced rate of withholding under a treaty, a Non-U.S. Holder generally will be required to provide us with a properly executed IRS Form W-8BEN (in the case of individuals), IRS Form W-8BEN-E (in the case of entities), or other appropriate form, certifying the Non-U.S. Holder’s entitlement to benefits under that treaty. This certification must be provided to us or our paying agent prior to the payment of dividends and must be updated periodically. In the case of a Non-U.S. Holder that is an entity, Treasury Regulations
126
Table of Contents
Index to Financial Statements
and the relevant tax treaty provide rules to determine whether, for purposes of determining the applicability of a tax treaty, dividends will be treated as paid to the entity or to those holding an interest in that entity. If a Non-U.S. Holder holds stock through a financial institution or other agent acting on the holder’s behalf, the holder will be required to provide appropriate documentation to such agent. The holder’s agent will then be required to provide certification to us or our paying agent, either directly or through other intermediaries. If you are eligible for a reduced rate of U.S. federal withholding tax under an income tax treaty and you do not timely provide the required certification, you may be able to obtain a refund or credit of any excess amounts withheld by timely filing an appropriate claim for a refund with the IRS.
We generally are not required to withhold tax on dividends paid to a Non-U.S. Holder that are effectively connected with the Non-U.S. Holder’s conduct of a trade or business within the U.S. (and, if required by an applicable income tax treaty, are attributable to a permanent establishment that such holder maintains in the U.S.) if a properly executed IRS Form W-8ECI, stating that the dividends are so connected, is furnished to us (or, if stock is held through a financial institution or other agent, to such agent). In general, such effectively connected dividends will be subject to U.S. federal income tax, on a net income basis at the regular graduated rates. A corporate Non-U.S. Holder receiving effectively connected dividends may also be subject to an additional “branch profits tax,” which is imposed, under certain circumstances, at a rate of 30% (or such lower rate as may be specified by an applicable treaty) on the corporate Non-U.S. Holder’s effectively connected earnings and profits, subject to certain adjustments.
To the extent distributions on our common stock, if any, exceed our current and accumulated earnings and profits, they will first reduce the Non-U.S. Holder’s adjusted basis in our common stock, but not below zero, and then will be treated as gain to the extent of any excess, and taxed in the same manner as gain realized from a sale or other disposition of common stock as described in the next section.
Gain on Disposition of Our Common Stock
Subject to the discussion below regarding backup withholding and foreign accounts, a Non-U.S. Holder generally will not be subject to U.S. federal income tax with respect to gain realized on a sale or other disposition of our common stock unless (1) the gain is effectively connected with a trade or business of such holder in the U.S. (and, if required by an applicable income tax treaty, is attributable to a permanent establishment that such holder maintains in the U.S.), (2) the Non-U.S. Holder is a nonresident alien individual and is present in the U.S. for 183 or more days in the taxable year of the disposition and certain other conditions are met or (3) we are or have been a “United States real property holding corporation” within the meaning of Code Section 897(c)(2) at any time within the shorter of the five-year period preceding such disposition or such holder’s holding period. In general, we would be a U.S. real property holding corporation if interests in U.S. real estate comprised (by fair market value) at least half of our business assets. We believe that we are not, and do not anticipate becoming, a U.S. real property holding corporation. However, because the determination of whether we are a U.S. real property holding corporation depends on the fair market value of our U.S. real property relative to the fair market value of our other business assets, there can be no assurance that we will not become a U.S. real property holding corporation in the future. Even if we are treated as a U.S. real property holding corporation, gain realized by a Non-U.S. Holder on a disposition of our common stock will not be subject to U.S. federal income tax so long as (a) the Non-U.S. Holder owned, directly, indirectly and constructively, no more than five percent of our common stock at all times within the shorter of (i) the five-year period preceding the disposition or (ii) the holder’s holding period and (b) our common stock is regularly traded on an established securities market. There can be no assurance that our common stock will qualify as regularly traded on an established securities market.
If you are a Non-U.S. Holder described in (1) above, you will be required to pay tax on the net gain derived from the sale at regular graduated U.S. federal income tax rates, and corporate Non-U.S. Holders described in (a) above may be subject to the additional branch profits tax at a 30% rate or such lower rate as may be specified by an applicable income tax treaty. If you are an individual Non-U.S. Holder described in (2) above, you will be
127
Table of Contents
Index to Financial Statements
required to pay a flat 30% tax on the gain derived from the sale, which gain may be offset by U.S. source capital losses if you timely file U.S. tax returns reporting the losses (even though you are not considered a resident of the U.S.).
Information Reporting Requirements and Backup Withholding
Generally, we must report information to the IRS with respect to any dividends we pay on our common stock including the amount of any such dividends, the name and address of the recipient, and the amount, if any, of tax withheld. A similar report is sent to the holder to whom any such dividends are paid. Pursuant to tax treaties or certain other agreements, the IRS may make its reports available to tax authorities in the recipient’s country of residence.
Dividends paid by us (or our paying agents) to a Non-U.S. Holder may also be subject to U.S. backup withholding. U.S. backup withholding generally will not apply to a Non-U.S. Holder who provides a properly executed IRS Form W-8BEN (in the case of individuals) or IRS Form W-8BEN-E (in the case of entities) or otherwise establishes an exemption.
Under current U.S. federal income tax law, U.S. information reporting and backup withholding requirements generally will apply to the proceeds of a disposition of our common stock effected by or through a U.S. office of any broker, U.S. or foreign, except that information reporting and such requirements may be avoided if the holder provides a properly executed IRS Form W-8BEN (in the case of individuals) or IRS Form W-8BEN-E (in the case of entities) or otherwise meets documentary evidence requirements for establishing Non-U.S. Holder status or otherwise establishes an exemption. Generally, U.S. information reporting and backup withholding requirements will not apply to a payment of disposition proceeds to a Non-U.S. Holder where the transaction is effected outside the U.S. through a non-U.S. office of a non-U.S. broker. Information reporting and backup withholding requirements may, however, apply to a payment of disposition proceeds if the broker has actual knowledge, or reason to know, that the holder is, in fact, a U.S. person. For information reporting purposes, certain brokers with substantial U.S. ownership or operations will generally be treated in a manner similar to U.S. brokers.
Any amounts of tax withheld under the backup withholding rules may be credited against the tax liability of persons subject to backup withholding, provided that the required information is timely furnished to the IRS.
Foreign Accounts
A U.S. federal withholding tax of 30% may apply to dividends on and the gross proceeds of a disposition of our common stock paid to a foreign financial institution (as specifically defined by applicable rules) unless such institution enters into an agreement with the U.S. government to withhold on certain payments and to collect and provide to the U.S. tax authorities substantial information regarding U.S. account holders of such institution (which includes certain equity holders of such institution, as well as certain account holders that are foreign entities with U.S. owners). This U.S. federal withholding tax of 30% will also apply to dividends on and the gross proceeds of a disposition of our common stock to a non-financial foreign entity unless such entity provides the withholding agent with either a certification that it does not have any substantial direct or indirect U.S. owners or provides information regarding substantial direct and indirect U.S. owners of the entity. The withholding tax described above will not apply if the foreign financial institution or non-financial foreign entity otherwise qualifies for an exemption from the rules. Under certain circumstances, a Non-U.S. Holder might be eligible for refunds or credits of such taxes. Holders are encouraged to consult with their own tax advisors regarding the possible implications of these rules to their investment in our common stock.
The withholding provisions described above apply currently to payments of dividends and, pursuant to IRS guidance, is expected to apply to payments of gross proceeds from a sale or other disposition of common stock on or after January 1, 2019.
128
Table of Contents
Index to Financial Statements
Federal Estate Tax
If an individual Non-U.S. Holder is treated as the owner of, or has made certain lifetime transfers of, an interest in our common stock, that person’s gross estate will include the value thereof for U.S. federal estate tax purposes, and may be subject to U.S. federal estate tax unless an applicable estate tax treaty provides otherwise, even though such individual was not a citizen or resident of the U.S. at the time of his or her death.
129
Table of Contents
Index to Financial Statements
Under the terms and subject to the conditions in an underwriting agreement dated the date of this prospectus, the underwriters named below, for whom Morgan Stanley & Co. LLC and Goldman, Sachs & Co. are acting as representatives, have severally agreed to purchase, and we have agreed to sell to them, the number of shares indicated below:
| Name |
Number of Shares |
|||
| Morgan Stanley & Co. LLC |
||||
| Goldman, Sachs & Co. |
||||
| Jefferies LLC |
||||
| Needham & Company, LLC |
||||
| Oppenheimer & Co. Inc. |
||||
| Raymond James & Associates, Inc. |
||||
|
|
|
|||
| Total |
4,400,000 | |||
|
|
|
|||
The underwriters and the representatives are collectively referred to as the “underwriters” and the “representatives,” respectively. The underwriters are offering the shares of common stock subject to their acceptance of the shares from us and subject to prior sale. The underwriting agreement provides that the obligations of the several underwriters to pay for and accept delivery of the shares of common stock offered by this prospectus are subject to the approval of certain legal matters by their counsel and to certain other conditions. The underwriters are obligated to take and pay for all of the shares of common stock offered by this prospectus if any such shares are taken. However, the underwriters are not required to take or pay for the shares covered by the underwriters’ over-allotment option described below.
The underwriters initially propose to offer part of the shares of common stock directly to the public at the offering price listed on the cover page of this prospectus and part to certain dealers. After the initial offering of the shares of common stock, the offering price and other selling terms may from time to time be varied by the representatives.
We have granted to the underwriters an option, exercisable for 30 days from the date of this prospectus, to purchase up to additional 660,000 shares of common stock at the public offering price listed on the cover page of this prospectus, less underwriting discounts and commissions. The underwriters may exercise this option solely for the purpose of covering over-allotments, if any, made in connection with the offering of the shares of common stock offered by this prospectus. To the extent the option is exercised, each underwriter will become obligated, subject to certain conditions, to purchase about the same percentage of the additional shares of common stock as the number listed next to the underwriter’s name in the preceding table bears to the total number of shares of common stock listed next to the names of all underwriters in the preceding table.
Entities affiliated with Insight Venture Partners, an existing stockholder, have indicated an interest in purchasing up to an aggregate of $15 million of shares of our common stock in this offering at the initial public offering price. In addition, certain of our directors, executive officers and key employees have indicated an interest in purchasing up to an aggregate of approximately $3.3 million of shares of our common stock in this offering at the initial public offering price. Because these indications of interest are not binding agreements or commitments to purchase, these parties may elect not to purchase shares in this offering or the underwriters may elect not to sell any shares in this offering to such parties. The underwriters will receive the same discount from any shares of our common stock purchased by these parties as they will from any other shares of our common stock sold to the public in this offering. If purchased by these parties, these shares will be subject to a 180-day lock-up restriction.
130
Table of Contents
Index to Financial Statements
The following table shows the per share and total public offering price, underwriting discounts and commissions, and proceeds before expenses to us. These amounts are shown assuming both no exercise and full exercise of the underwriters’ option to purchase up to an additional 660,000 shares of common stock.
| Total | ||||||||||||
| Per Share |
No Exercise |
Full Exercise |
||||||||||
| Public offering price |
$ | $ | $ | |||||||||
| Underwriting discounts and commissions to be paid by us |
$ | $ | $ | |||||||||
| Proceeds, before expenses, to us |
$ | $ | $ | |||||||||
The estimated offering expenses payable by us, exclusive of the underwriting discounts and commissions, are approximately $3.2 million. We have agreed to reimburse the underwriters for expense relating to clearance of this offering with the Financial Industry Regulatory Authority up to $35,000.
The underwriters have informed us that they do not intend sales to discretionary accounts to exceed 5% of the total number of shares of common stock offered by them.
Our common stock has been approved for listing on the New York Stock Exchange under the trading symbol “INST.”
We and all directors and officers and the holders of substantially all of our outstanding stock and stock options have agreed that, without the prior written consent of the representatives on behalf of the underwriters, we and they will not, during the period ending 180 days after the date of this prospectus, which we refer to as the restricted period:
| • | offer, pledge, sell, contract to sell, sell any option or contract to purchase, purchase any option or contract to sell, grant any option, right or warrant to purchase, lend or otherwise transfer or dispose of, directly or indirectly, any shares of common stock or any securities convertible into or exercisable or exchangeable for shares of common stock; |
| • | file any registration statement with the SEC relating to the offering of any shares of common stock or any securities convertible into or exercisable or exchangeable for common stock; or |
| • | enter into any swap or other arrangement that transfers to another, in whole or in part, any of the economic consequences of ownership of the common stock |
whether any such transaction described above is to be settled by delivery of common stock or such other securities, in cash or otherwise. In addition, we and each such person agrees that, without the prior written consent of the representatives on behalf of the underwriters, we or such other person will not, during the restricted period, make any demand for, or exercise any right with respect to, the registration of any shares of common stock or any security convertible into or exercisable or exchangeable for common stock.
The restrictions described in the immediately preceding paragraph do not apply to:
| (1) | transactions relating to shares of our common stock or other securities acquired in this offering or in open market transactions after the completion of this offering; |
| (2) | transfers of shares of our common stock or any security convertible into our common stock as a bona fide gift or charitable contribution; |
| (3) | transfers of shares of our common stock or any security convertible into our common stock to an immediate family member or a trust for the direct or indirect benefit of the party subject to the lockup agreement or such immediate family member of the party subject to the lock-up agreement (for purposes of the lock-up agreement, “immediate family” shall mean any relationship by blood, marriage or adoption, not more remote than first cousin); |
131
Table of Contents
Index to Financial Statements
| (4) | transfers of shares of our common stock or any security convertible into our common stock by will or intestacy; |
| (5) | transfers of shares of our common stock or any security convertible into our common stock pursuant to a domestic relations order, divorce decree or court order; |
| (6) | distributions of shares of our common stock or any security convertible into our common stock to limited partners, general partners, members, stockholders or holders of similar equity interests in the party subject to the lock-up agreement; |
| (7) | sale of shares to the underwriters; |
| (8) | transfers or distributions of shares of our common stock or any securities convertible into or exercisable or exchangeable for our common stock by a stockholder that is a trust to a trustor or beneficiary of the trust or to the estate of a beneficiary of such trust; |
| (9) | transfers to us in connection with the repurchase of our common stock in connection with the termination of the employment with us of the party subject to the lock-up agreement pursuant to contractual agreements with us; |
| (10) | the disposition of shares of our common stock to us, or the withholding of shares of our common stock by us, in a transaction exempt from Section 16(b) of the Exchange Act solely in connection with the payment of taxes due with respect to the vesting of restricted stock granted under a stock incentive plan, stock purchase plan or pursuant to a contractual employment arrangement described in this prospectus, insofar as such restricted stock is outstanding as of the date of this prospectus; |
| (11) | the exercise of a stock option granted under a stock incentive plan or stock purchase plan described in this prospectus by the party subject to the lock-up agreement, and the receipt by the party subject to the lock-up agreement of shares of our common stock from us upon such exercise, insofar as such option is outstanding as of the date of this prospectus, provided that the underlying shares shall continue to be subject to the restrictions on transfer set forth in the lock-up agreement and, provided, further that, if required, any public report or filing under Section 16 of the Exchange Act shall clearly indicate in the footnotes thereto that the filing relates to the exercise of a stock option, that no shares were sold by the reporting person and that the shares received upon exercise of the stock option are subject to a lock-up agreement with the underwriters of this offering; |
| (12) | a merger, consolidation or other similar transaction involving a change of control that has been approved by our board of directors, provided that, in the event that such change of control transaction is not completed, this clause (12) shall not be applicable and the shares of the party subject to the lock-up agreement shall remain subject to the restrictions contained in the lock-up agreement; |
| (13) | the establishment of a trading plan pursuant to Rule 10b5-1 under the Exchange Act for the transfer of shares of our common stock provided that (a) such plan does not provide for the transfer of our common stock during the restricted period and (b) to the extent a public announcement or filing under the Exchange Act, if any, is required of or voluntarily made by or on behalf of the party subject to the lock-up agreement or us regarding the establishment of such plan, such announcement or filing shall include a statement to the effect that no transfer of our common stock may be made under such plan during the restricted period; |
provided, that, in the case of clauses (2), (3), (4), (5), (6) or (8) above each transferee, donee or distributee shall sign and deliver a lock-up agreement; and, provided, further that in the case of clauses (1), (2), (3), (4), (5), (6), (8), (9) or (10) above no filing under Section 16(a) of the Exchange Act, reporting a reduction in beneficial ownership of shares of our common stock, shall be required or shall be voluntarily made during the restricted period. A “change of control” means the transfer (whether by tender offer, merger, consolidation or other similar transaction), in one transaction or a series of related transactions, to a person or group of affiliated persons (other than an underwriter pursuant to this offering), of our voting securities if, after such transfer, such person or group of affiliated persons would hold at least 90% of our (or the surviving entity’s) outstanding voting securities and for the avoidance of doubt, this offering is not a change of control.
132
Table of Contents
Index to Financial Statements
The representatives, in their sole discretion, may release the common stock and other securities subject to the lock-up agreements described above in whole or in part at any time.
In order to facilitate the offering of the common stock, the underwriters may engage in transactions that stabilize, maintain or otherwise affect the price of the common stock. Specifically, the underwriters may sell more shares than they are obligated to purchase under the underwriting agreement, creating a short position. A short sale is covered if the short position is no greater than the number of shares available for purchase by the underwriters under the over-allotment option. The underwriters can close out a covered short sale by exercising the over-allotment option or purchasing shares in the open market. In determining the source of shares to close out a covered short sale, the underwriters will consider, among other things, the open market price of shares compared to the price available under the over-allotment option. The underwriters may also sell shares in excess of the over-allotment option, creating a naked short position. The underwriters must close out any naked short position by purchasing shares in the open market. A naked short position is more likely to be created if the underwriters are concerned that there may be downward pressure on the price of the common stock in the open market after pricing that could adversely affect investors who purchase in this offering. As an additional means of facilitating this offering, the underwriters may bid for, and purchase, shares of common stock in the open market to stabilize the price of the common stock. These activities may raise or maintain the market price of the common stock above independent market levels or prevent or retard a decline in the market price of the common stock. The underwriters are not required to engage in these activities and may end any of these activities at any time.
We and the underwriters have agreed to indemnify each other against certain liabilities, including liabilities under the Securities Act.
A prospectus in electronic format may be made available on websites maintained by one or more underwriters, or selling group members, if any, participating in this offering. The representatives may agree to allocate a number of shares of common stock to underwriters for sale to their online brokerage account holders. Internet distributions will be allocated by the representatives to underwriters that may make internet distributions on the same basis as other allocations.
Other Relationships
The underwriters and their respective affiliates are full service financial institutions engaged in various activities, which may include securities trading, commercial and investment banking, financial advisory, investment management, investment research, principal investment, hedging, financing and brokerage activities. Certain of the underwriters and their respective affiliates have, from time to time, performed, and may in the future perform, various financial advisory and investment banking services for us, for which they received or will receive customary fees and expenses.
In addition, in the ordinary course of their various business activities, the underwriters and their respective affiliates may make or hold a broad array of investments and actively trade debt and equity securities (or related derivative securities) and financial instruments (including bank loans) for their own account and for the accounts of their customers and may at any time hold long and short positions in such securities and instruments. Such investment and securities activities may involve our securities and instruments. The underwriters and their respective affiliates may also make investment recommendations or publish or express independent research views in respect of such securities or instruments and may at any time hold, or recommend to clients that they acquire, long or short positions in such securities and instruments.
Pricing of the Offering
Prior to this offering, there has been no public market for our common stock. The initial public offering price will be determined by negotiations between us and the representatives. Among the factors considered in determining the initial public offering price will be our future prospects and those of our industry in general, our
133
Table of Contents
Index to Financial Statements
sales, earnings and certain other financial and operating information in recent periods, and the price-earnings ratios, price-sales ratios, market prices of securities, and certain financial and operating information of companies engaged in activities similar to ours.
Selling Restrictions
Canada
The shares of our common stock may be sold only to purchasers purchasing, or deemed to be purchasing, as principal that are accredited investors, as defined in National Instrument 45-106 Prospectus Exemptions or subsection 73.3(1) of the Securities Act (Ontario), and are permitted clients, as defined in National Instrument 31-103 Registration Requirements, Exemptions and Ongoing Registrant Obligations. Any resale of the shares of our common stock must be made in accordance with an exemption from, or in a transaction not subject to, the prospectus requirements of applicable securities laws.
Securities legislation in certain provinces or territories of Canada may provide a purchaser with remedies for rescission or damages if this prospectus (including any amendment thereto) contains a misrepresentation, provided that the remedies for rescission or damages are exercised by the purchaser within the time limit prescribed by the securities legislation of the purchaser’s province or territory. The purchaser should refer to any applicable provisions of the securities legislation of the purchaser’s province or territory for particulars of these rights or consult with a legal advisor.
Pursuant to section 3A.3 (or, in the case of securities issued or guaranteed by the government of a non-Canadian jurisdiction, section 3A.4) of National Instrument 33-105 Underwriting Conflicts (NI 33-105), the underwriters are not required to comply with the disclosure requirements of NI 33-105 regarding underwriter conflicts of interest in connection with this offering.
European Economic Area
In relation to each Member State of the European Economic Area which has implemented the Prospectus Directive, or Relevant Member State, an offer to the public of any shares of our common stock may not be made in that Relevant Member State, except that an offer to the public in that Relevant Member State of any shares of our common stock may be made at any time under the following exemptions under the Prospectus Directive, if they have been implemented in that Relevant Member State:
| • | to any legal entity which is a qualified investor as defined in the Prospectus Directive; |
| • | to fewer than 100 or, if the Relevant Member State has implemented the relevant provision of the 2010 PD Amending Directive, 150, natural or legal persons (other than qualified investors as defined in the Prospectus Directive), as permitted under the Prospectus Directive, subject to obtaining the prior consent of the representatives for any such offer; or |
| • | in any other circumstances falling within Article 3(2) of the Prospectus Directive, provided that no such offer of shares of our common stock shall result in a requirement for the publication by us or any underwriter of a prospectus pursuant to Article 3 of the Prospectus Directive. |
For the purposes of this provision, the expression an “offer to the public” in relation to any shares of our common stock in any Relevant Member State means the communication in any form and by any means of sufficient information on the terms of the offer and any shares of our common stock to be offered so as to enable an investor to decide to purchase any shares of our common stock, as the same may be varied in that Member State by any measure implementing the Prospectus Directive in that Member State, the expression “Prospectus Directive” means Directive 2003/71/EC (and amendments thereto, including the 2010 PD Amending Directive, to the extent implemented in the Relevant Member State), and includes any relevant implementing measure in the Relevant Member State, and the expression “2010 PD Amending Directive” means Directive 2010/73/EU.
134
Table of Contents
Index to Financial Statements
United Kingdom
Each underwriter has represented and agreed that:
| • | it has only communicated or caused to be communicated and will only communicate or cause to be communicated an invitation or inducement to engage in investment activity (within the meaning of Section 21 of the Financial Services and Markets Act 2000 (“FSMA”)) received by it in connection with the issue or sale of the shares of our common stock in circumstances in which Section 21(1) of the FSMA does not apply to us; and |
| • | it has complied and will comply with all applicable provisions of the FSMA with respect to anything done by it in relation to the shares of our common stock in, from or otherwise involving the United Kingdom. |
135
Table of Contents
Index to Financial Statements
The validity of the shares of common stock being offered by this prospectus will be passed upon for us by Cooley LLP, Palo Alto, California. Wilson Sonsini Goodrich & Rosati, Professional Corporation, Palo Alto, California, is counsel for the underwriters in connection with this offering.
The consolidated financial statements of Instructure, Inc. at December 31, 2013 and 2014, and for the years then ended, appearing in this Prospectus and Registration Statement have been audited by Ernst & Young LLP, independent registered public accounting firm, as set forth in their report thereon appearing elsewhere herein, and are included in reliance upon such report given on the authority of such firm as experts in accounting and auditing.
WHERE YOU CAN FIND ADDITIONAL INFORMATION
We have filed with the SEC a registration statement on Form S-1, including exhibits and schedules, under the Securities Act, with respect to the shares of common stock being offered by this prospectus. This prospectus, which constitutes part of the registration statement, does not contain all of the information in the registration statement and its exhibits. For further information with respect to us and the common stock offered by this prospectus, we refer you to the registration statement and its exhibits. Statements contained in this prospectus as to the contents of any contract or any other document referred to are not necessarily complete, and in each instance, we refer you to the copy of the contract or other document filed as an exhibit to the registration statement. Each of these statements is qualified in all respects by this reference.
You can read our SEC filings, including the registration statement, over the internet at the SEC’s website at www.sec.gov. You may also read and copy any document we file with the SEC at its public reference facilities at 100 F Street, NE, Washington, D.C. 20549. You may also obtain copies of these documents at prescribed rates by writing to the Public Reference Section of the SEC at 100 F Street, NE, Washington, D.C. 20549. Please call the SEC at 1-800-SEC-0330 for further information on the operation of the public reference facilities. You may also request a copy of these filings, at no cost, by writing us at 6330 South 3000 East, Suite 700, Salt Lake City, UT 84121.
Upon the closing of this offering, we will be subject to the information reporting requirements of the Securities Exchange Act of 1934 and we will file reports, proxy statements and other information with the SEC. These reports, proxy statements and other information will be available for inspection and copying at the public reference room and web site of the SEC referred to above. We also maintain a website at www.instructure.com, at which, following the closing of this offering, you may access these materials free of charge as soon as reasonably practicable after they are electronically filed with, or furnished to, the SEC. Information contained on or accessible through our website is not a part of this prospectus, and the inclusion of our website address in this prospectus is an inactive textual reference only.
136
Table of Contents
Index to Financial Statements
INDEX TO CONSOLIDATED FINANCIAL STATEMENTS
| F-2 | ||||
| F-3 | ||||
| F-4 | ||||
| F-5 | ||||
| Consolidated Statements of Redeemable Convertible Preferred Stock and Stockholders’ Deficit |
F-6 | |||
| F-7 | ||||
| F-8 |
F-1
Table of Contents
Index to Financial Statements
REPORT OF INDEPENDENT REGISTERED PUBLIC ACCOUNTING FIRM
The Board of Directors of Instructure, Inc.
We have audited the accompanying consolidated balance sheets of Instructure, Inc. and subsidiaries as of December 31, 2013 and 2014, and the related consolidated statements of operations, comprehensive loss, redeemable convertible preferred stock and stockholders’ deficit and cash flows for the years then ended. These financial statements are the responsibility of the Company’s management. Our responsibility is to express an opinion on these financial statements based on our audits.
We conducted our audits in accordance with the standards of the Public Company Accounting Oversight Board (United States). Those standards require that we plan and perform the audit to obtain reasonable assurance about whether the financial statements are free of material misstatement. We were not engaged to perform an audit of the Company’s internal control over financial reporting. Our audits included consideration of internal control over financial reporting as a basis for designing audit procedures that are appropriate in the circumstances, but not for the purpose of expressing an opinion on the effectiveness of the Company’s internal control over financial reporting. Accordingly, we express no such opinion. An audit also includes examining, on a test basis, evidence supporting the amounts and disclosures in the financial statements, assessing the accounting principles used and significant estimates made by management, and evaluating the overall financial statement presentation. We believe that our audits provide a reasonable basis for our opinion.
In our opinion, the financial statements referred to above present fairly, in all material respects, the consolidated financial position of Instructure, Inc. and subsidiaries at December 31, 2013 and 2014, and the consolidated results of its operations and its cash flows for the years then ended, in conformity with U.S. generally accepted accounting principles.
/s/ Ernst & Young LLP
Salt Lake City, Utah
June 24, 2015,
except for the retroactive effect of the 1-for-1.5
reverse stock split as described in paragraph four of Note 1,
as to which the date is
November 2, 2015
F-2
Table of Contents
Index to Financial Statements
Consolidated Balance Sheets
(in thousands, except per share data)
|
December 31, |
September 30, 2015 |
Pro forma Stockholders’ Deficit September 30, 2015 |
||||||||||||||
| 2013 | 2014 | |||||||||||||||
| (unaudited) | ||||||||||||||||
| Assets |
||||||||||||||||
| Current assets: |
||||||||||||||||
| Cash and cash equivalents |
$ | 13,138 | $ | 43,915 | $ | 31,770 | ||||||||||
| Short term marketable securities |
9,317 | 501 | 1,448 | |||||||||||||
| Accounts receivable—net of allowance of $53, $135, and $255 at December 31, 2013, 2014, and September 30, 2015 (unaudited), respectively |
3,927 | 8,182 | 11,243 | |||||||||||||
| Prepaid expenses |
1,037 | 2,979 | 3,163 | |||||||||||||
| Other current assets |
328 | 617 | 2,827 | |||||||||||||
|
|
|
|
|
|
|
|||||||||||
| Total current assets |
27,747 | 56,194 | 50,451 | |||||||||||||
| Noncurrent marketable securities |
3,990 | — | — | |||||||||||||
| Property and equipment, net |
7,077 | 7,761 | 10,309 | |||||||||||||
| Goodwill |
— | 989 | 989 | |||||||||||||
| Intangible assets, net |
1,027 | 753 | 521 | |||||||||||||
| Noncurrent prepaid expenses |
677 | 652 | 703 | |||||||||||||
| Other assets |
651 | 677 | 1,231 | |||||||||||||
|
|
|
|
|
|
|
|||||||||||
| Total assets |
$ | 41,169 | $ | 67,026 | $ | 64,204 | ||||||||||
|
|
|
|
|
|
|
|||||||||||
| Liabilities, redeemable convertible preferred stock and stockholders’ deficit |
||||||||||||||||
| Current liabilities: |
||||||||||||||||
| Accounts payable |
$ | 1,784 | $ | 2,546 | $ | 3,901 | ||||||||||
| Accrued liabilities |
3,669 | 5,605 | 7,746 | |||||||||||||
| Deferred rent |
— | 380 | 490 | |||||||||||||
| Deferred revenue |
16,780 | 29,380 | 53,754 | |||||||||||||
| Capital lease obligation |
271 | 223 | 16 | |||||||||||||
|
|
|
|
|
|
|
|||||||||||
| Total current liabilities |
22,504 | 38,134 | 65,907 | |||||||||||||
| Deferred revenue, net of current portion |
2,686 | 2,574 | 3,996 | |||||||||||||
| Deferred rent, net of current portion |
8,385 | 8,520 | 8,914 | |||||||||||||
| Capital lease obligation, net of current portion |
223 | — | — | |||||||||||||
| Warrant liability |
1,002 | 3,577 | 214 | |||||||||||||
| Other long-term liabilities |
355 | 763 | 438 | |||||||||||||
|
|
|
|
|
|
|
|||||||||||
| Total liabilities |
35,155 | 53,568 | 79,469 | |||||||||||||
|
|
|
|
|
|
|
|||||||||||
| Commitments and contingencies |
||||||||||||||||
| Redeemable convertible preferred stock: |
||||||||||||||||
| Redeemable convertible preferred stock, par value of $0.0001 per share; 13,152, 15,086 and 15,086 shares authorized as of December 31, 2013 and 2014 and September 30, 2015 (unaudited), respectively; 12,779, 14,604 and 14,977 shares issued and outstanding as of December 31, 2013 and 2014 and September 30, 2015 (unaudited), respectively; liquidation and redemption value of $49,431, $89,431, $93,580 as of December 31, 2013 and 2014 and September 30, 2015 (unaudited); no shares issued and outstanding pro forma at September 30, 2015 |
49,092 | 88,989 | 93,770 | $ | — | |||||||||||
|
|
|
|
|
|
|
|
|
|||||||||
| Stockholders’ (deficit): |
||||||||||||||||
| Common stock, par value of $0.0001 per share; 23,333, 25,333 and 26,600 shares authorized as of December 31, 2013 and 2014 and September 30, 2015 (unaudited), respectively; 4,911, 7,476 and 7,612 shares issued and 3,783, 6,348 and 6,484 shares outstanding at December 31, 2013, 2014, and September 30, 2015 (unaudited), respectively; 21,989 shares issued and outstanding, pro forma at September 30, 2015 (unaudited) (see Note 1) |
1 | 1 | 1 | 2 | ||||||||||||
| Treasury stock, 1,128 common shares, at cost |
(1 | ) | (1 | ) | (1 | ) | (1 | ) | ||||||||
| Additional paid-in capital |
5,413 | 14,392 | 21,745 | 115,514 | ||||||||||||
| Accumulated other comprehensive income |
5 | — | (1 | ) | (1 | ) | ||||||||||
| Accumulated deficit |
(48,496 | ) | (89,923 | ) | (130,779 | ) | (130,779 | ) | ||||||||
|
|
|
|
|
|
|
|
|
|||||||||
| Total stockholders’ deficit |
(43,078 | ) | (75,531 | ) | (109,035 | ) | $ | (15,265 | ) | |||||||
|
|
|
|
|
|
|
|
|
|||||||||
| Total liabilities, redeemable convertible preferred stock and stockholders’ deficit |
$ | 41,169 | $ | 67,026 | $ | 64,204 | ||||||||||
|
|
|
|
|
|
|
|||||||||||
See accompanying notes.
F-3
Table of Contents
Index to Financial Statements
Consolidated Statements of Operations
(in thousands, except per share amounts)
| Year Ended December 31, |
Nine Months Ended September 30, |
|||||||||||||||
| 2013 | 2014 | 2014 | 2015 | |||||||||||||
| (unaudited) | ||||||||||||||||
| Revenue: |
||||||||||||||||
| Subscription and support |
$ | 22,456 | $ | 38,093 | $ | 26,328 | $ | 43,557 | ||||||||
| Professional services and other |
3,599 | 6,259 | 4,288 | 7,839 | ||||||||||||
|
|
|
|
|
|
|
|
|
|||||||||
| Total revenue |
26,055 | 44,352 | 30,616 | 51,396 | ||||||||||||
|
|
|
|
|
|
|
|
|
|||||||||
| Cost of revenue: |
||||||||||||||||
| Subscription and support |
8,581 | 12,131 | 8,331 | 12,520 | ||||||||||||
| Professional services and other |
2,039 | 2,982 | 1,979 | 4,717 | ||||||||||||
|
|
|
|
|
|
|
|
|
|||||||||
| Total cost of revenue |
10,620 | 15,113 | 10,310 | 17,237 | ||||||||||||
|
|
|
|
|
|
|
|
|
|||||||||
| Gross profit |
15,435 | 29,239 | 20,306 | 34,159 | ||||||||||||
|
|
|
|
|
|
|
|
|
|||||||||
| Operating expenses: |
||||||||||||||||
| Sales and marketing |
20,702 | 35,390 | 22,335 | 38,303 | ||||||||||||
| Research and development |
11,242 | 21,290 | 12,184 | 17,441 | ||||||||||||
| General and administrative |
5,321 | 11,268 | 6,890 | 18,475 | ||||||||||||
|
|
|
|
|
|
|
|
|
|||||||||
| Total operating expenses |
37,265 | 67,948 | 41,409 | 74,219 | ||||||||||||
|
|
|
|
|
|
|
|
|
|||||||||
| Loss from operations |
(21,830 | ) | (38,709 | ) | (21,103 | ) | (40,060 | ) | ||||||||
|
|
|
|
|
|
|
|
|
|||||||||
| Other income (expense): |
||||||||||||||||
| Interest income |
22 | 32 | 30 | 13 | ||||||||||||
| Interest expense |
(150 | ) | (136 | ) | (96 | ) | (72 | ) | ||||||||
| Change in fair value of warrant liability |
(545 | ) | (2,518 | ) | (2,219 | ) | (536 | ) | ||||||||
| Other income (expense), net |
4 | (39 | ) | 12 | (161 | ) | ||||||||||
|
|
|
|
|
|
|
|
|
|||||||||
| Total other expense, net |
(669 | ) | (2,661 | ) | (2,273 | ) | (756 | ) | ||||||||
|
|
|
|
|
|
|
|
|
|||||||||
| Loss before income taxes |
(22,499 | ) | (41,370 | ) | (23,376 | ) | (40,816 | ) | ||||||||
| Income tax expense |
— | (57 | ) | (7 | ) | (40 | ) | |||||||||
|
|
|
|
|
|
|
|
|
|||||||||
| Net loss |
$ | (22,499 | ) | $ | (41,427 | ) | $ | (23,383) | $ | (40,856) | ||||||
|
|
|
|
|
|
|
|
|
|||||||||
| Deemed dividends to investors |
(353 | ) | — | — | (632 | ) | ||||||||||
|
|
|
|
|
|
|
|
|
|||||||||
| Net loss attributable to common stockholders |
$ | (22,852 | ) | $ | (41,427 | ) | $ | (23,383) | $ | (41,488) | ||||||
|
|
|
|
|
|
|
|
|
|||||||||
| Net loss per common share attributable to common stockholders, basic and diluted |
$ | (6.26 | ) | $ | (7.50 | ) | $ | (4.37 | ) | $ | (6.61 | ) | ||||
|
|
|
|
|
|
|
|
|
|||||||||
| Weighted average common shares used in computing basic and diluted net loss per common share attributable to common stockholders |
3,650 | 5,525 | 5,356 | 6,279 | ||||||||||||
|
|
|
|
|
|
|
|
|
|||||||||
| Pro forma net loss per common share attributable to common stockholders, basic and diluted (unaudited) |
$ | (2.01 | ) | $ | (1.90 | ) | ||||||||||
|
|
|
|
|
|||||||||||||
| Pro forma weighted average common shares used in computing basic and diluted net loss per common share attributable to common stockholders (unaudited) |
20,657 | 21,784 | ||||||||||||||
|
|
|
|
|
|||||||||||||
See accompanying notes.
F-4
Table of Contents
Index to Financial Statements
Consolidated Statements of Comprehensive Loss
(in thousands)
| Year Ended December 31, | Nine Months Ended September 30, |
|||||||||||||||
| 2013 | 2014 | 2014 | 2015 | |||||||||||||
| (unaudited) | ||||||||||||||||
| Net loss |
$ | (22,499 | ) | $ | (41,427 | ) | $ | (23,383 | ) | $ | (40,856 | ) | ||||
| Other comprehensive income (loss): |
||||||||||||||||
| Unrealized gain (loss) on marketable securities |
5 | — | (1 | ) | (1 | ) | ||||||||||
|
|
|
|
|
|
|
|
|
|||||||||
| Comprehensive loss |
$ | (22,494 | ) | $ | (41,427 | ) | $ | (23,384 | ) | $ | (40,857 | ) | ||||
|
|
|
|
|
|
|
|
|
|||||||||
See accompanying notes.
F-5
Table of Contents
Index to Financial Statements
Consolidated Statements of Redeemable Convertible Preferred Stock and Stockholders’ Deficit
(in thousands)
| Redeemable Convertible Preferred Stock |
Common Stock, $0.001 Par Value |
Common Treasury Stock |
Additional Paid-In Capital |
Accumulated Other Comprehensive Income |
Accumulated Deficit |
Total Stockholders’ Deficit |
||||||||||||||||||||||||||||||||||||
| Shares | Amount | Shares | Amount | Shares | Amount | |||||||||||||||||||||||||||||||||||||
| Balances at January 1, 2013 |
10,263 | $ | 18,863 | 4,686 | $ | 1 | (1,128 | ) | $ | (1 | ) | 2,130 | $ | — | $ | (25,997 | ) | $ | (23,867 | ) | ||||||||||||||||||||||
| Exercise of common stock options |
— | — | 225 | — | — | — | 42 | — | — | 42 | ||||||||||||||||||||||||||||||||
| Vesting of common stock subject to repurchase |
— | — | — | — | — | — | 2 | — | — | 2 | ||||||||||||||||||||||||||||||||
| Stock-based compensation |
— | — | — | — | — | — | 3,592 | — | — | 3,592 | ||||||||||||||||||||||||||||||||
| Repurchase of common stock |
— | — | — | — | (24 | ) | (150 | ) | — | — | — | (150 | ) | |||||||||||||||||||||||||||||
| Reissuance of treasury stock |
— | — | — | — | 24 | 150 | — | — | — | 150 | ||||||||||||||||||||||||||||||||
| Issuance of Series D redeemable convertible preferred stock—net of issuance costs of $124 |
2,516 | 29,876 | — | — | — | — | — | — | — | — | ||||||||||||||||||||||||||||||||
| Deemed dividends to investors |
— | 353 | — | — | — | — | (353 | ) | — | — | (353 | ) | ||||||||||||||||||||||||||||||
| Unrealized gain on marketable securities |
— | — | — | — | — | — | — | 5 | — | 5 | ||||||||||||||||||||||||||||||||
| Net loss |
— | — | — | — | — | — | — | — | (22,499 | ) | (22,499 | ) | ||||||||||||||||||||||||||||||
|
|
|
|
|
|
|
|
|
|
|
|
|
|
|
|
|
|
|
|
|
|||||||||||||||||||||||
| Balances at December 31, 2013 |
12,779 | 49,092 | 4,911 | 1 | (1,128 | ) | (1 | ) | 5,413 | 5 | (48,496 | ) | (43,078 | ) | ||||||||||||||||||||||||||||
| Exercise of common stock options |
— | — | 2,469 | — | — | — | 528 | — | — | 528 | ||||||||||||||||||||||||||||||||
| Vesting of common stock subject to repurchase |
— | — | — | — | — | — | 149 | — | — | 149 | ||||||||||||||||||||||||||||||||
| Stock-based compensation |
— | — | — | — | — | — | 8,198 | — | — | 8,198 | ||||||||||||||||||||||||||||||||
| Grant of restricted stock awards |
— | — | 73 | — | — | — | — | — | — | — | ||||||||||||||||||||||||||||||||
| Issuance of Series E redeemable convertible preferred stock—net of issuance costs of $103 |
1,825 | 39,897 | — | — | — | — | — | — | — | — | ||||||||||||||||||||||||||||||||
| Common stock issued in 12 Spokes acquisition |
— | — | 23 | — | — | — | 104 | — | — | 104 | ||||||||||||||||||||||||||||||||
| Unrealized loss on marketable securities |
— | — | — | — | — | — | — | (6 | ) | — | (6 | ) | ||||||||||||||||||||||||||||||
| Reclassification of gain on marketable securities to earnings |
— | — | — | — | — | — | — | 1 | — | 1 | ||||||||||||||||||||||||||||||||
| Net loss |
— | — | — | — | — | — | — | — | (41,427 | ) | (41,427 | ) | ||||||||||||||||||||||||||||||
|
|
|
|
|
|
|
|
|
|
|
|
|
|
|
|
|
|
|
|
|
|||||||||||||||||||||||
| Balance at December 31, 2014 |
14,604 | 88,989 | 7,476 | 1 | (1,128 | ) | (1 | ) | 14,392 | — | (89,923 | ) | (75,531 | ) | ||||||||||||||||||||||||||||
| Exercise of common stock options (unaudited) |
— | — | 179 | — | — | — | 246 | — | — | 246 | ||||||||||||||||||||||||||||||||
| Vesting of common stock subject to repurchase (unaudited) |
— | — | — | — | — | — | 40 | — | — | 40 | ||||||||||||||||||||||||||||||||
| Stock-based compensation (unaudited) |
— | — | — | — | — | — | 7,699 | — | — | 7,699 | ||||||||||||||||||||||||||||||||
| Cancellation of restricted stock awards |
— | — | (43 | ) | — | — | — | — | — | — | — | |||||||||||||||||||||||||||||||
| Exercise of redeemable convertible preferred stock warrant (unaudited) |
373 | 4,149 | — | — | — | — | — | — | — | — | ||||||||||||||||||||||||||||||||
| Deemed dividends to investors (unaudited) |
— | 632 | — | — | — | — | (632 | ) | — | — | (632 | ) | ||||||||||||||||||||||||||||||
| Unrealized loss on marketable securities |
— | — | — | — | — | — | — | (1 | ) | — | (1 | ) | ||||||||||||||||||||||||||||||
| Net loss (unaudited) |
— | — | — | — | — | — | — | — | (40,856 | ) | (40,856 | ) | ||||||||||||||||||||||||||||||
|
|
|
|
|
|
|
|
|
|
|
|
|
|
|
|
|
|
|
|
|
|||||||||||||||||||||||
| Balance at September 30, 2015 (unaudited) |
14,977 | $ | 93,770 | 7,612 | $ | 1 | (1,128 | ) | $ | (1 | ) | $ | 21,745 | $ | (1 | ) | $ | (130,779 | ) | $ | (109,035 | ) | ||||||||||||||||||||
|
|
|
|
|
|
|
|
|
|
|
|
|
|
|
|
|
|
|
|
|
|||||||||||||||||||||||
See accompanying notes.
F-6
Table of Contents
Index to Financial Statements
Consolidated Statements of Cash Flows
(in thousands)
| Year Ended December 31, | Nine Months Ended September 30, |
|||||||||||||||
| 2013 | 2014 | 2014 | 2015 | |||||||||||||
| (unaudited) | ||||||||||||||||
| Operating Activities: |
||||||||||||||||
| Net loss |
$ | (22,499 | ) | $ | (41,427 | ) | $ | (23,383 | ) | $ | (40,856 | ) | ||||
| Adjustments to reconcile net loss to net cash used in operating activities: |
||||||||||||||||
| Depreciation of property and equipment |
1,238 | 1,760 | 1,263 | 1,873 | ||||||||||||
| Amortization of intangible assets |
299 | 306 | 225 | 232 | ||||||||||||
| Amortization of deferred financing costs |
49 | 61 | 38 | 54 | ||||||||||||
| Change in fair value of warrant liability |
545 | 2,575 | 2,219 | 536 | ||||||||||||
| Excess tax benefit for stock-based compensation |
(50 | ) | (872 | ) | — | — | ||||||||||
| Stock-based compensation |
3,592 | 8,198 | 856 | 7,699 | ||||||||||||
| Other |
245 | 200 | 116 | 165 | ||||||||||||
| Changes in assets and liabilities: |
||||||||||||||||
| Accounts receivable, net |
(2,067 | ) | (4,335 | ) | (4,325 | ) | (3,229 | ) | ||||||||
| Prepaid expenses and other assets |
(1,378 | ) | (2,296 | ) | (593 | ) | (3,021 | ) | ||||||||
| Accounts payable and accrued liabilities |
1,435 | 2,542 | 154 | 3,496 | ||||||||||||
| Deferred revenue |
7,359 | 12,488 | 16,454 | 25,796 | ||||||||||||
| Deferred rent |
2,742 | 515 | 591 | 504 | ||||||||||||
| Other liabilities |
(144 | ) | (110 | ) | (83 | ) | (285 | ) | ||||||||
|
|
|
|
|
|
|
|
|
|||||||||
| Net cash used in operating activities |
(8,634 | ) | (20,395 | ) | (6,468 | ) | (7,036 | ) | ||||||||
|
|
|
|
|
|
|
|
|
|||||||||
| Investing Activities: |
||||||||||||||||
| Purchases of property and equipment |
(997 | ) | (2,440 | ) | (1,828 | ) | (4,463 | ) | ||||||||
| Purchases of intangible assets |
(7 | ) | (6 | ) | (6 | ) | — | |||||||||
| Proceeds from disposal of property and equipment |
— | 37 | 15 | 53 | ||||||||||||
| Purchases of marketable securities |
(13,401 | ) | (1,155 | ) | (1,155 | ) | (1,456 | ) | ||||||||
| Sale of marketable securities |
— | 10,402 | 10,402 | — | ||||||||||||
| Maturities of marketable securities |
— | 3,415 | 3,415 | 500 | ||||||||||||
| Acquisition of 12 Spokes |
— | (250 | ) | (250 | ) | — | ||||||||||
|
|
|
|
|
|
|
|
|
|||||||||
| Net cash provided by (used in) investing activities |
(14,405 | ) | 10,003 | 10,593 | (5,366 | ) | ||||||||||
|
|
|
|
|
|
|
|
|
|||||||||
| Financing Activities: |
||||||||||||||||
| Proceeds from issuance of redeemable convertible preferred stock, net of issuance costs of $124, $103, $0 and $0 in the years ended December 31, 2013 and 2014 and the nine months ended September 30, 2014 and 2015, respectively |
29,876 | 39,897 | — | — | ||||||||||||
| Proceeds from exercise of redeemable convertible preferred stock warrants |
— | — | — | 250 | ||||||||||||
| Proceeds from exercise of stock options |
42 | 751 | 565 | 246 | ||||||||||||
| Payments of line of credit financing costs |
(22 | ) | (80 | ) | (18 | ) | (32 | ) | ||||||||
| Repurchase of common stock |
(150 | ) | — | — | — | |||||||||||
| Proceeds from the sale of treasury stock |
150 | — | — | — | ||||||||||||
| Advances from the revolving credit note facility |
2,000 | — | — | — | ||||||||||||
| Repayment of advances from the revolving credit note facility |
(2,000 | ) | — | — | — | |||||||||||
| Repayment of capital lease obligations |
(205 | ) | (271 | ) | (203 | ) | (207 | ) | ||||||||
| Excess tax benefit for stock-based compensation |
50 | 872 | — | — | ||||||||||||
|
|
|
|
|
|
|
|
|
|||||||||
| Net cash provided by financing activities |
29,741 | 41,169 | 344 | 257 | ||||||||||||
|
|
|
|
|
|
|
|
|
|||||||||
| Net increase (decrease) in cash |
6,702 | 30,777 | 4,469 | (12,145 | ) | |||||||||||
| Cash, beginning of period |
6,436 | 13,138 | 13,138 | 43,915 | ||||||||||||
|
|
|
|
|
|
|
|
|
|||||||||
| Cash, end of period |
$ | 13,138 | $ | 43,915 | $ | 17,607 | $ | 31,770 | ||||||||
|
|
|
|
|
|
|
|
|
|||||||||
| Supplemental cash flow disclosure: |
||||||||||||||||
| Cash paid for interest |
$ | 101 | $ | 51 | $ | 41 | $ | 18 | ||||||||
| Non-cash investing and financing activities: |
||||||||||||||||
| Leasehold improvements |
$ | 5,629 | $ | — | $ | — | $ | 494 | ||||||||
| Property and equipment acquired under capital lease |
$ | 699 | $ | — | $ | — | $ | — | ||||||||
| Capital expenditures incurred but not yet paid |
$ | — | $ | 33 | $ | 7 | $ | 164 | ||||||||
| Line of credit financing costs |
$ | 47 | $ | 58 | $ | 58 | $ | — | ||||||||
| Issuance of common stock for acquisition |
$ | — | $ | 104 | $ | 104 | $ | — | ||||||||
| Deemed dividends to investors |
$ | 353 | $ | — | $ | — | $ | 632 | ||||||||
| Vesting of common stock subject to repurchase |
$ | 2 | $ | 149 | $ | 128 | $ | 40 | ||||||||
F-7
Table of Contents
Index to Financial Statements
Notes to Consolidated Financial Statements
1. Description of Business and Summary of Significant Accounting Policies
Organization
Instructure, Inc. provides an innovative, cloud-based learning management platform for academic institutions and companies worldwide. We built our learning management applications, Canvas, for the education market, and Bridge, for the corporate market, to enable our customers to easily develop, deliver and manage engaging face-to-face and online learning experiences. We offer our platform through a Software-as-a-Service, or SaaS, business model. We were incorporated in the state of Delaware in September 2008. We are headquartered in Salt Lake City, Utah, and have wholly-owned subsidiaries in the United Kingdom, Australia, the Netherlands and Hong Kong, all of which commenced operations in 2014 and Sweden, which commenced operations in February 2015.
We have financed our operations to date primarily with cash receipts from customers and the proceeds from the sale of redeemable convertible preferred stock. We will continue to require additional capital to move forward with our business plan. While we do have borrowings of $15,000,000 available (see Note 6—Credit Facility), there can be no assurance that funds necessary beyond these amounts will be available in amounts or on terms sufficient to ensure ongoing operations.
Basis of Presentation
The consolidated financial statements have been prepared in accordance with accounting principles generally accepted in the United States, or U.S. GAAP. The accompanying consolidated financial statements include our accounts and those of our wholly-owned subsidiaries. All intercompany transactions have been eliminated in consolidation.
Reverse Stock Split
On October 28, 2015, our board of directors and on October 30, 2015, our stockholders, respectively, approved the amendment and restatement of our certificate of incorporation to effect a reverse split of our common stock and redeemable convertible preferred stock at a 1-for-1.5 ratio (the “Reverse Stock Split”). The Reverse Stock Split became effective on October 30, 2015, upon the filing of our amended and restated certificate of incorporation. The par value of the common and redeemable convertible preferred was not adjusted as a result of the Reverse Stock Split. All issued and outstanding common stock, redeemable convertible preferred stock, options for common stock, restricted stock awards, warrants and per share amounts have been retroactively adjusted to reflect this Reverse Stock Split for all periods presented.
Unaudited Pro Forma Information
Upon the closing of our initial public offering, or IPO, all outstanding redeemable convertible preferred stock will automatically convert into shares of common stock. The unaudited pro forma stockholders’ deficit information gives effect to the conversion of the redeemable convertible preferred stock as of September 30, 2015. The effect of this conversion on the pro forma consolidated balance sheet will reduce stockholders’ deficit by $93,770,000.
Unaudited Interim Financial Information
The accompanying interim consolidated balance sheet as of September 30, 2015 and the consolidated statements of operations, comprehensive loss and cash flows for the nine months ended September 30, 2014 and
F-8
Table of Contents
Index to Financial Statements
INSTRUCTURE, INC.
Notes to Consolidated Financial Statements
2015, and the consolidated statement of redeemable convertible preferred stock and stockholders’ deficit for the nine months ended September 30, 2015, and the related footnote disclosures are unaudited. The unaudited interim consolidated financial statements have been prepared on a basis consistent with the annual consolidated financial statements and, in the opinion of management, reflect all adjustments necessary to present fairly our consolidated financial position as of September 30, 2015 and our results of operations and cash flows for the nine months ended September 30, 2014 and 2015. The results for the nine months ended September 30, 2015 are not necessarily indicative of the results expected for the full fiscal year or any other period.
Use of Estimates
The preparation of the consolidated financial statements in conformity with U.S. GAAP requires management to make estimates and assumptions that affect reported amounts and disclosures. Accordingly, actual results could differ from those estimates. Such estimates, which we evaluate on an on-going basis, include allowances for doubtful accounts, useful lives for property and equipment and intangible assets, valuation of marketable securities, valuation allowances for net deferred income tax assets, valuation of stock-based compensation and common stock, preferred stock warrants, the best estimate of selling price of deliverables included in multiple-deliverable revenue arrangements and the weighted average customer life used in the recognition of nonrefundable upfront implementation service revenue. We base our estimates on historical experience and on various other assumptions which we believe to be reasonable.
Operating Segments
We operate in a single operating segment, cloud-based learning management systems. Operating segments are defined as components of an enterprise for which separate financial information is regularly evaluated by the chief operating decision makers, or CODMs, which are our chief executive officer and chief financial officer, in deciding how to allocate resources and assess performance. Our CODMs evaluate our financial information and resources and assess the performance of these resources on a consolidated basis. Since we operate in one operating segment, all required financial segment information can be found in the consolidated financial statements.
Net Loss Per Share Attributable to Common Stockholders
Basic net loss per share attributable to common stockholders is computed by dividing net loss attributable to common stockholders by the weighted average number of common shares outstanding for the period, less the weighted average unvested common stock subject to repurchase or forfeiture. Diluted net loss per share attributable to common stockholders is computed by giving effect to all potential dilutive common stock equivalents outstanding for the period.
For purposes of this calculation, options to purchase common stock, common stock and redeemable convertible preferred stock warrants, and redeemable convertible preferred stock are considered to be common stock equivalents. We applied the two-class method to calculate our basic and diluted net loss per share of common stock, as our redeemable convertible preferred stock and common stock are participating securities. The two-class method is an earnings allocation formula that treats a participating security as having rights to earnings that otherwise would have been available to common stockholders. However, the two-class method does not impact the net loss per common share attributable to common stockholders as we were in a loss position for each of the periods presented and the redeemable convertible preferred stockholders do not participate in losses.
F-9
Table of Contents
Index to Financial Statements
INSTRUCTURE, INC.
Notes to Consolidated Financial Statements
A reconciliation of the denominator used in the calculation of basic and diluted loss per share is as follows (in thousands, except per share amounts):
| Year Ended December 31, | Nine Months Ended September 30, |
|||||||||||||||
| 2013 | 2014 | 2014 | 2015 | |||||||||||||
| (unaudited) | ||||||||||||||||
| Numerator: |
||||||||||||||||
| Net loss attributable to common stockholders |
$ | (22,852 | ) | $ | (41,427 | ) | $ | (23,383 | ) | $ | (41,488 | ) | ||||
|
|
|
|
|
|
|
|
|
|||||||||
| Denominator: |
||||||||||||||||
| Weighted-average common shares outstanding—basic |
3,672 | 5,750 | 5,607 | 6,376 | ||||||||||||
| Less: Weighted-average common stock subject to repurchase |
(22 | ) | (225 | ) | (251 | ) | (97 | ) | ||||||||
|
|
|
|
|
|
|
|
|
|||||||||
| Total weighted-average common shares outstanding—basic |
3,650 | 5,525 | 5,356 | 6,279 | ||||||||||||
|
|
|
|
|
|
|
|
|
|||||||||
| Dilutive effect of share equivalents resulting from stock options, unvested restricted stock awards, common stock warrants, common stock subject to repurchase, redeemable convertible preferred stock warrants and redeemable convertible preferred stock (as converted) |
— | — | — | — | ||||||||||||
|
|
|
|
|
|
|
|
|
|||||||||
| Weighted-average common shares outstanding-diluted |
3,650 | 5,525 | 5,356 | 6,279 | ||||||||||||
|
|
|
|
|
|
|
|
|
|||||||||
| Net loss per common share attributable to common stockholders, basic and diluted |
$ | (6.26 | ) | $ | (7.50 | ) | $ | (4.37 | ) | $ | (6.61 | ) | ||||
|
|
|
|
|
|
|
|
|
|||||||||
During 2013 and 2014, and the nine months ended September 30, 2014 and 2015 (unaudited), we incurred net losses and, therefore, the effect of our outstanding stock options, unvested restricted stock, common stock warrants, common stock subject to repurchase, redeemable convertible preferred stock warrants and redeemable convertible preferred stock was not included in the calculation of diluted loss per share as the effect would be anti-dilutive. The following table contains share totals with a potentially dilutive impact (in thousands):
| Year Ended December 31, | Nine Months Ended September 30, |
|||||||||||||||
| 2013 | 2014 | 2014 | 2015 | |||||||||||||
| (unaudited) | ||||||||||||||||
| Options to purchase common stock |
4,389 | 2,994 | 2,755 | 3,910 | ||||||||||||
| Common stock warrants |
70 | 103 | 103 | 103 | ||||||||||||
| Redeemable convertible preferred stock warrants |
373 | 373 | 373 | — | ||||||||||||
| Common stock subject to repurchase |
5 | 135 | 164 | 65 | ||||||||||||
| Redeemable convertible preferred stock (as converted) |
12,779 | 14,604 | 12,779 | 14,977 | ||||||||||||
| Unvested restricted stock awards |
— | 58 | 62 | — | ||||||||||||
|
|
|
|
|
|
|
|
|
|||||||||
| Total |
17,616 | 18,267 | 16,236 | 19,055 | ||||||||||||
|
|
|
|
|
|
|
|
|
|||||||||
Unaudited Pro Forma Net Loss Per Share Attributable to Common Stockholders
Upon the closing of the proposed IPO, all shares of redeemable convertible preferred stock will automatically convert into 15,505,330 shares of common stock (assuming a conversion ratio equal to approximately 1.2895 shares of common stock for each share of Series E preferred stock based on an assumed initial public offering price of $17.00 per share). The unaudited pro forma net loss per common share attributable
F-10
Table of Contents
Index to Financial Statements
INSTRUCTURE, INC.
Notes to Consolidated Financial Statements
to common stockholders, basic and diluted, for the year ended December 31, 2014 and the nine months ended September 30, 2015 have been computed to give effect to the redeemable convertible preferred stock as if such shares had been converted to common stock as of the beginning of the period.
A reconciliation of the numerator and denominator used in the calculation of unaudited pro forma basic and diluted loss per share is as follows (in thousands, except per share amounts):
| Year Ended December 31, 2014 |
Nine Months Ended September 30, 2015 |
|||||||
| Numerator: |
||||||||
| Net loss attributable to common stockholders |
$ | (41,427 | ) | $ | (41,488 | ) | ||
|
|
|
|
|
|||||
| Denominator: |
||||||||
| Weighted-average common shares outstanding-basic |
|
5,525 |
|
6,279 | ||||
| Pro forma adjustment for assumed conversion of redeemable convertible preferred stock to common stock upon the closing of the proposed IPO |
15,132 | 15,505 | ||||||
|
|
|
|
|
|||||
| Number of shares used for pro forma basic earnings per share computation |
20,657 | 21,784 | ||||||
|
|
|
|
|
|||||
| Dilutive effect of share equivalents resulting from stock options, unvested restricted stock awards, common stock warrants, common stock subject to repurchase and redeemable convertible preferred stock warrants |
— | — | ||||||
|
|
|
|
|
|||||
| Number of shares used for pro forma dilutive earnings per share computation |
20,657 | 21,784 | ||||||
|
|
|
|
|
|||||
| Pro forma net loss per common share attributable to common stockholders, basic and diluted |
$ | (2.01 | ) | $ | (1.90 | ) | ||
|
|
|
|
|
|||||
Concentration of Credit Risk, Significant Customers and International Operations
Financial instruments that potentially subject us to a concentration of credit risk consist principally of cash and accounts receivable. We deposit cash with high credit quality financial institutions, which at times, may exceed federally insured amounts. We have not experienced any losses on our deposits. We perform ongoing credit evaluations of our customers’ financial condition and generally require no collateral from our customers. We review the expected collectability of accounts receivable and record an allowance for doubtful accounts receivable for amounts that we determine are not collectible.
The following table depicts the largest customer’s revenue as a percentage of total revenue:
| Year Ended December 31, | Nine Months Ended September 30, | |||||||||||||||
| 2013 | 2014 | 2014 | 2015 | |||||||||||||
| (unaudited) | ||||||||||||||||
| Customer A |
16.7 | % | 9.8 | % | 10.7 | % | 6.4 | % | ||||||||
The following table depicts the largest customers’ outstanding net accounts receivable balance as a percentage of the total outstanding net accounts receivable balance:
| December 31, | September 30, 2015 |
|||||||||||
| 2013 | 2014 | |||||||||||
| (unaudited) | ||||||||||||
| Customer B |
27.1 | % | 24.1 | % | 7.9 | % | ||||||
| Customer C |
— | 2.3 | 14.8 | |||||||||
|
|
|
|
|
|
|
|||||||
| Total |
27.1 | % | 26.4 | % | 22.7 | % | ||||||
F-11
Table of Contents
Index to Financial Statements
INSTRUCTURE, INC.
Notes to Consolidated Financial Statements
There were no other customers with outstanding net accounts receivable balances as a percentage of the total outstanding net accounts receivable balance greater than 10% as of December 31, 2013 and 2014, and at September 30, 2015 (unaudited).
In 2014, we began international operations. Because our long-term growth strategy involves further expansion of our sales to customers outside of the United States, our business will be susceptible to risks associated with international operations.
Cash and Cash Equivalents
We consider all short-term highly liquid investments purchased with original maturities of three months or less at the time of acquisition to be cash equivalents.
Marketable Securities
We hold investments in marketable securities, consisting of corporate debt securities and commercial paper. We classify our marketable securities as available-for-sale investments as we neither buy and hold securities for the purpose of selling them in the near future nor intend to hold securities to maturity. We classify our marketable securities as short term on the consolidated balance sheet for all purchased investments with contractual maturities that are less than one year as of the balance sheet date. Our marketable securities are carried at estimated fair value with any unrealized gains and losses, net of taxes, included in accumulated other comprehensive income (loss) in stockholders’ equity. Unrealized losses are charged against other income (expense), net when a decline in fair value is determined to be other-than-temporary. We have not recorded any such impairment charge in the periods presented. We determine realized gains or losses on sale or maturity of marketable securities on a specific identification method, and record such gains or losses as other income (expense), net.
Accounts Receivable
Accounts receivable are carried at the original invoiced amount less an allowance for doubtful accounts based on the probability of future collection. When management becomes aware of circumstances that may decrease the likelihood of collection, it records a specific allowance against amounts due, which reduces the receivable to the amount that management reasonably believes will be collected. For all other customers, management determines the adequacy of the allowance based on historical loss patterns, the number of days that billings are past due and an evaluation of the potential risk of loss associated with specific accounts. Account balances are written off against the allowance for doubtful accounts receivable when the potential for recovery is remote. Recoveries of receivables previously written off are recorded when payment is received.
The following is a roll-forward of our allowance for doubtful accounts (in thousands):
| Balance Beginning of Period |
Charged to Costs or Expenses |
Deductions(1) | Balance at End of Period |
|||||||||||||
| Allowance for Doubtful Accounts |
||||||||||||||||
| Year ended December 31, 2013 |
$ | — | $ | 53 | $ | — | $ | 53 | ||||||||
| Year ended December 31, 2014 |
53 | 109 | (27 | ) | 135 | |||||||||||
| Nine months ended September 30, 2015 (unaudited) |
135 | 148 | (28 | ) | 255 | |||||||||||
| (1) | Deductions include actual accounts written-off, net of recoveries. |
F-12
Table of Contents
Index to Financial Statements
INSTRUCTURE, INC.
Notes to Consolidated Financial Statements
Property and Equipment
Property and equipment are stated at cost less accumulated depreciation. Expenditures that materially increase values or capacities or extend useful lives of property and equipment are capitalized.
Repairs and maintenance costs that do not extend the useful life or improve the related assets are expensed as incurred. Depreciation is computed using the straight-line method over the estimated useful lives of the assets or over the related lease terms (if shorter). The estimated useful life of each asset category is as follows:
| Estimated Useful Life | ||
| Computer and office equipment |
2-3 years | |
| Purchased software |
2-3 years | |
| Furniture and fixtures |
2-6 years | |
| Leasehold improvements and other |
lesser of lease term or useful life (2-10 years) | |
| Capitalized software development costs |
3 years |
Certain costs incurred to develop software applications used in the cloud-based learning management system are capitalized and included in property and equipment, net on the balance sheets. Capitalizable costs consist of (1) certain external direct costs of materials and services incurred in developing or obtaining internal-use software; and (2) payroll and payroll-related costs for employees who are directly associated with and who devote time to the project. These costs generally consist of internal labor during configuration, coding and testing activities. Research and development costs incurred during the preliminary project stage, or costs incurred for data conversion activities, training, maintenance and general and administrative or overhead costs, are expensed as incurred. Costs that cannot be separated between the maintenance of, and relatively minor upgrades and enhancements to, internal-use software are also expensed as incurred. Costs incurred during the application development stage that significantly enhance and add new functionality to the cloud-based learning management system are capitalized as capitalized software development costs. Capitalization begins when: (1) the preliminary project stage is complete; (2) management with the relevant authority authorizes and commits to the funding of the software project; (3) it is probable the project will be completed; (4) the software will be used to perform the functions intended; and (5) certain functional and quality standards have been met.
When there are indicators of potential impairment, we evaluate recoverability of the carrying values of property and equipment by comparing the carrying amount of an asset to the estimated undiscounted future cash flows expected to be generated by the asset. If the carrying amount of the asset exceeds our estimated undiscounted future net cash flows, an impairment charge is recognized based on the amount by which the carrying value of the asset exceeds the fair value of the asset. We did not incur any impairment charges during 2013 and 2014 and the nine months ended September 30, 2014 and 2015 (unaudited).
Leases
We lease our facilities under operating leases. For leases that contain rent escalation or rent concession provisions, we record rent expense for the total rent payable during the lease term on a straight-line basis over the term of the lease. We record the difference between the rent paid and the straight-line rent as a deferred rent liability in the accompanying balance sheets.
Fair Value
Our short-term financial instruments include accounts receivable, accounts payable and accrued expenses and are carried in the consolidated financial statements as of December 31, 2013 and 2014, and as of September 30, 2015 (unaudited) at amounts that approximate fair value due to their short-term maturity dates.
F-13
Table of Contents
Index to Financial Statements
INSTRUCTURE, INC.
Notes to Consolidated Financial Statements
Goodwill
Goodwill represents the excess cost of the fair value of the net tangible and identifiable intangible assets acquired in a business combination. Goodwill is not subject to amortization, but is monitored annually for impairment or more frequently if there are indicators of impairment. Management considers the following potential indicators of impairment: (1) significant underperformance relative to historical or projected future operating results; (2) significant changes in our use of acquired assets or the strategy of our overall business; (3) significant negative industry or economic trends; and (4) a significant decline in our stock price for a sustained period. We perform our annual impairment test on September 30. Currently, our goodwill is evaluated at the entity level as it is determined there is only one reporting unit. We perform a two-step impairment test. In the first step, the fair value of each reporting unit is compared to its carrying amount. If the fair value exceeds the carrying value of the net assets assigned, goodwill is not considered impaired and the second step is not required. If the carrying value exceeds the fair value, then the second step of the impairment test is performed in order to determine the implied fair value of the reporting unit’s goodwill. If the carrying value of the goodwill exceeds the fair value, then an impairment charge is recorded. On September 30, 2014, the estimated fair value of our single reporting unit exceeded its carrying amount. Because the fair value of our single reporting unit was in excess of its carrying value and there were no indicators that our goodwill had become impaired since that date, there was no impairment as of September 30, 2014 through December 31, 2014.
During 2013 and 2014 and the nine months ended September 30, 2014 and 2015 (unaudited), we did not recognize an impairment charge. We have no other intangible assets with indefinite useful lives.
Liability for Common Stock Warrants
We account for freestanding warrants to purchase shares of our common stock that are not considered indexed to our own stock as warrant liabilities on our consolidated balance sheets. Under Accounting Standards Codification, or ASC, 815, we record the liability-classified common stock warrants issued in conjunction with our credit facility at their estimated fair value because they are free standing and the number of shares exercisable under this warrant to purchase our common stock increases if the loan balance exceeds $7,500,000 (see Note 6—Credit Facility). At the end of each reporting period, changes in the estimated fair value of the warrants to purchase shares of common stock are recorded as a change in fair value of warrant liability in the consolidated statements of operations.
Liability for Redeemable Convertible Preferred Stock Warrants
We account for freestanding warrants to purchase shares of our contingently redeemable convertible preferred stock as warrant liability on our consolidated balance sheets. We record the redeemable convertible preferred stock warrants at their estimated fair value because these warrants may contingently obligate us to redeem the underlying redeemable convertible preferred stock at some point in the future. At the end of each reporting period, changes in the estimated fair value of the warrant liability is recorded as change in fair value of warrant liability in the consolidated statements of operations until the earlier of the exercise or expiration of the warrants, or the completion of a qualifying liquidation event including an initial public offering, at which time the redeemable convertible preferred stock issuable upon exercise of the warrants would become common stock and the related liability would be reclassified to common stock in stockholders’ deficit. As noted in Note 8—Stockholders’ Deficit, the redeemable convertible preferred stock warrants were exercised in February 2015.
Revenue Recognition
We generate revenue primarily from two main sources: (1) subscription revenue, which is comprised of SaaS fees from customers accessing our learning management systems and from customers purchasing additional
F-14
Table of Contents
Index to Financial Statements
INSTRUCTURE, INC.
Notes to Consolidated Financial Statements
support beyond the standard support that is included in the basic SaaS fees; and (2) related professional services revenue, which is comprised of training, implementation services and other types of professional services. We provide our applications as a service and revenue is recognized when persuasive evidence of an arrangement exists, the fee is fixed or determinable, collection is reasonably assured, and delivery has occurred or services have been rendered.
Because we provide our applications as a service and customers do not take possession of the software, these arrangements are accounted for as service contracts. For arrangements with multiple deliverables, we follow the guidance provided in ASC 605-25, Revenue Recognition for Multiple-Element Arrangements. In accordance with this guidance, deliverables in multiple-deliverable arrangements are accounted for as separate units of accounting if the delivered items have standalone value. If the deliverables in a multiple-deliverable arrangement do not have standalone value, the revenue associated with the deliverables is recognized ratably as a single unit of accounting over the period commencing upon delivery of the final deliverable and over the term of that deliverable. We allocate revenue to each deliverable in an arrangement based on a selling price hierarchy. The selling price for a deliverable is based on its vendor-specific objective evidence, or VSOE, if available, third-party evidence, or TPE, if VSOE is not available, or best estimate of the selling price, or BESP, if neither VSOE nor TPE is available. The total arrangement fee for a multiple-deliverable arrangement is allocated based on the relative VSOE, TPE, or BESP of each element.
We determine BESP by considering our overall pricing objectives and market conditions. Significant pricing practices taken into consideration for our subscription services, which may also include support, training, and professional services, include discounting practices, the size and volume of our transactions, the customer type, price lists, our pricing strategy, and historical stand-alone sales. The determination of BESP is made through consultation with and approval by our pricing committee. As our pricing strategies evolve, we may modify our pricing in the future which could result in changes in relative selling prices.
As subscription and support revenue are delivered over the entire length of the arrangement (the service period), they are recognized ratably beginning on the date our service is made available to customers through the end of the service period and all other revenue recognition criteria have been met. Implementation services are nonrefundable upfront fees that do not have standalone value. As such, we defer revenue for implementation services in multiple-element arrangements and recognize the revenue over the longer of the contract term or customer life. Training and professional services are sold with subscriptions and separately (i.e., not sold contemporaneously with the negotiation of a subscription contract) and we have determined each has standalone value. As a result, these services are recognized as revenue when the related services are delivered, which is generally within two to three months from the date of contract.
We also derive revenue from fees for separate, project-based custom application development, integrations, content services and change management consulting services. Pricing of these projects is generally either fixed fee or time and material based. We recognize revenue from these service arrangements in accordance with ASC 605. To the extent that adequate project reporting of time incurred and time to complete records exist, we recognize consulting services revenue as the services are performed under the proportionate performance method. In situations where we are unable to utilize the proportional performance method, for example due to either the lack of adequate documentation of time incurred or to be incurred, we recognize revenue based on the milestone method if individual milestones with substantive value to the customer exist. If neither of these two methods is able to be utilized, revenue recognition is deferred until the contract is completed. During 2013 and 2014 and the nine months ended September 30, 2014 and 2015 (unaudited) there was no revenue recognized under the proportionate performance method. We recognized $0, $223,000, $128,000 and $407,000 in revenue under the milestone method for 2013 and 2014 and the nine months ended September 30, 2014 and 2015 (unaudited), respectively.
F-15
Table of Contents
Index to Financial Statements
INSTRUCTURE, INC.
Notes to Consolidated Financial Statements
Cost of Revenue
Cost of subscription revenue consists primarily of our managed hosting provider and other third-party service providers, employee-related costs including payroll, benefits and stock-based compensation expense for our operations and customer support teams, amortization of capitalized software development costs and acquired technology, and allocated overhead costs, which we define as rent, facilities and costs related to information technology, or IT.
Cost of professional services and other revenue consists primarily of personnel costs of our professional services organization, including salaries, benefits, travel, bonuses and stock-based compensation, as well as allocated overhead costs.
Service Availability Warranty
We warrant to our customers: (1) that commercially reasonable efforts will be made to maintain the online availability of the platform for a minimum availability in a trailing 365-day period (excluding scheduled outages, standard maintenance windows, force majeure, and outages that result from any technology issue originating from any customer or user); (2) the functionality or features of the platform may change but will not materially degrade during any paid term; and (3) that support may change but will not materially degrade during any paid term. To date, we have not experienced any significant losses under these warranties.
Advertising Costs
Advertising costs are expensed as incurred and are included in sales and marketing expenses. Advertising expenses totaled $2,192,000 and $3,849,000 for 2013 and 2014, respectively. Advertising expenses totaled $2,595,000 and $5,074,000 for the nine months ended September 30, 2014 and 2015 (unaudited), respectively.
Stock-Based Compensation
Stock-based compensation cost is measured at the grant date based on the fair value of the award granted and recognized as compensation expense using the straight-line method over the period in which the award is expected to vest, which is generally the period from the grant date to the end of the vesting period. Forfeitures are estimated at the time of grant and revised, if necessary, in subsequent periods if actual forfeitures differ from those estimates.
We use the Black-Scholes option pricing model to determine the fair value of stock options. The Black-Scholes option pricing model is affected by the unit price and a number of assumptions, including the award’s expected life, risk-free interest rate, the expected volatility of the underlying stock and expected dividends.
These assumptions are estimated as follows:
| • | Fair Value of Our Common Stock. Because our common stock is not yet publicly traded, we must estimate the fair value of common stock. The fair value of the common stock underlying the stock options is determined by our board of directors, which considered numerous objective and subjective factors to determine the fair value of common stock at each grant date. These factors included, but were not limited to: (1) contemporaneous valuations of common stock performed by third-party specialists; (2) the lack of marketability of our common stock; (3) developments in the business; (4) the prices paid in recent transactions involving our equity securities; and (5) the likelihood of achieving a liquidity event, such as an initial public offering or a merger or acquisition, given prevailing market conditions. |
F-16
Table of Contents
Index to Financial Statements
INSTRUCTURE, INC.
Notes to Consolidated Financial Statements
| • | Risk-Free Interest Rate. We base the risk-free interest rate used in the Black-Scholes option pricing model on the implied yield available on U.S. Treasury zero-coupon issues with remaining terms similar to the expected term on the options. |
| • | Expected Term. We estimate the expected term for stock options using the simplified method due to the lack of historical exercise activity for our company. The simplified method calculates the expected term as the mid-point between the vesting date and the contractual expiration date of the award. |
| • | Volatility. We estimate the price volatility factor based on the historical volatilities of our comparable companies as we do not have a sufficient trading history for our common stock. To determine our comparable companies, we consider public enterprise cloud-based application providers and select those that are similar to us in size, stage of life cycle, and financial leverage. We intend to continue to apply this process using the same or similar public companies until a sufficient amount of historical information regarding the volatility of our own common stock share price becomes available, or unless circumstances change such that the identified companies are no longer similar to us, in which case, more suitable companies whose share prices are publicly available would be utilized in the calculation. |
| • | Dividend Yield. We have not paid and do not expect to pay dividends for the foreseeable future. |
Foreign Currency
The functional currency of our foreign subsidiaries is the U.S. dollar. Monetary assets and liabilities denominated in a foreign currency are revalued into U.S. dollars at the exchange rates in effect at the balance sheet dates. Income and expense accounts are revalued on the date of the transaction using the exchange rate in effect on the transaction date. Non-monetary assets, liabilities, and equity transactions are converted at historical exchange rates in effect at the time of the transaction. Foreign currency transaction gains and losses are recorded in the statement of operations in other income (expense), net. The net foreign currency transaction loss for the years ended December 31, 2013 and 2014 and for the nine months ended September 30, 2014 and 2015 (unaudited) was $0, $67,000, $8,000 and $146,000, respectively.
Research and Development
With the exception of capitalized software development costs, research and development costs are expensed as incurred.
Commissions
We recognize commission expense related to subscriptions in the period in which the contract is signed.
Risks and Uncertainties
We are subject to all of the risks inherent in an early stage business. These risks include, but are not limited to, a limited operating history, new and rapidly evolving markets, dependence on the development of new services, unfavorable economic and market conditions, changes in level of demand for our services, and the timing of new application introductions. If we fail to anticipate or to respond adequately to technological developments in our industry, changes in customer or supplier requirements, or changes in regulatory requirements or industry standards, or any significant delays in the development or introduction of services, our business could be harmed.
F-17
Table of Contents
Index to Financial Statements
INSTRUCTURE, INC.
Notes to Consolidated Financial Statements
Income Taxes
Deferred tax assets and liabilities are accounted for using the asset and liability method and represent the future tax consequences attributable to differences between financial statement carrying amounts of existing assets and liabilities and their respective tax bases. Deferred tax assets and liabilities are measured using enacted tax rates that are expected to be in effect when these temporary differences are expected to reverse. A valuation allowance is provided when it is more likely than not that some portion of the deferred tax assets will not be realized. At December 31, 2013 and 2014, the majority of deferred tax assets are offset by a valuation allowance. We recognize interest and penalties as a component of income tax expense.
Recent Accounting Pronouncement
In May 2014, the Financial Accounting Standards Board, or FASB, issued Accounting Standards Update No. 2014-09, Revenue from Contracts with Customers (Topic 606), or ASU 2014-09, which amended the existing FASB Accounting Standards Codification. This standard establishes a principle for recognizing revenue upon the transfer of promised goods or services to customers, in an amount that reflects the expected consideration received in exchange for those goods or services. The standard also provides guidance on the recognition of costs related to obtaining and fulfilling customer contracts. In July 2015, the FASB decided to defer by one year the effective dates of its new revenue recognition standard for public and nonpublic entities. As a result, this guidance will be effective for public companies for interim and annual periods beginning on or after December 15, 2017. Public entities would be permitted to adopt the standard as early as the original public entity effective date; early adoption prior to that date would not be permitted. Once effective, entities can choose to apply the standard using either a full retrospective approach or a modified retrospective approach. We have not yet selected a transition method and are currently assessing the potential impact that this standard will have on our consolidated financial statements.
2. Property and Equipment
Property and equipment consist of the following (in thousands):
| December 31, | September 30, 2015 |
|||||||||||
| 2013 | 2014 | |||||||||||
| (unaudited) | ||||||||||||
| Computer and office equipment |
$ | 847 | $ | 1,663 | $ | 2,404 | ||||||
| Purchased software |
429 | 500 | 978 | |||||||||
| Capitalized software development costs |
445 | 1,393 | 2,772 | |||||||||
| Furniture and fixtures |
1,047 | 1,426 | 1,743 | |||||||||
| Leasehold improvements and other |
5,770 | 5,845 | 7,148 | |||||||||
|
|
|
|
|
|
|
|||||||
| 8,538 | 10,827 | 15,045 | ||||||||||
| Less accumulated depreciation and amortization |
(1,461 | ) | (3,066 | ) | (4,736 | ) | ||||||
|
|
|
|
|
|
|
|||||||
| Total |
$ | 7,077 | $ | 7,761 | $ | 10,309 | ||||||
|
|
|
|
|
|
|
|||||||
Accumulated amortization for capitalized software development costs was $81,000, $315,000 and $758,000 at December 31, 2013 and 2014 and September 30, 2015 (unaudited), respectively. Amortization expense for capitalized software development costs for the years ended December 31, 2013 and 2014 was $73,000 and $234,000, respectively, and is recorded within cost of revenue on the statements of operations. Amortization expense for capitalized software development costs for the nine months ended September 30, 2014 and 2015 was $133,000 and $443,000 (unaudited), respectively.
F-18
Table of Contents
Index to Financial Statements
INSTRUCTURE, INC.
Notes to Consolidated Financial Statements
3. Acquisition
On April 15, 2014, we acquired all of the assets of 12 Spokes, Inc., a privately-held software and application development company located in Utah, through an asset purchase transaction. We completed this transaction to expand the capabilities of our employee base. The consideration paid for 12 Spokes included $1,000,000 of cash, of which $250,000 was paid up front and the remaining will be paid out equally over the next three years on the anniversary of the transaction. The deferred payments were recorded as a liability using the present value of the future cash payments of $683,000, of which $239,000 is included in current liabilities. Additionally, we issued 93,330 shares of restricted common stock with a fair value of $417,000, of which 23,330 of fully vested shares of common stock with a fair value of $104,000 is included in the purchase price. The remaining 70,000 are unvested shares of restricted common stock with a fair value of $313,000 being recorded as compensation expense over the vesting period.
The transaction has been accounted for under the acquisition method of accounting. Under the acquisition method of accounting, we allocated the purchase price to the identifiable assets based on their estimated fair value at the date of acquisition. No liabilities were acquired in the transaction. We incurred transaction costs of $41,000 in connection with the transaction, which were included in general and administrative expenses in 2014.
The components of the purchase price and allocation for the acquisition of the 12 Spokes assets are as follows (in thousands):
| Consideration: |
||||
| Cash paid |
$ | 250 | ||
| Restricted common stock |
104 | |||
| Deferred consideration |
683 | |||
|
|
|
|||
| Fair value of total consideration |
$ | 1,037 | ||
|
|
|
|||
| Identifiable assets acquired: |
||||
| Fixed assets: computers |
$ | 22 | ||
| Intangible assets: non-compete agreements |
26 | |||
|
|
|
|||
| Total |
48 | |||
|
|
|
|||
| Goodwill |
989 | |||
|
|
|
|||
| Total |
$ | 1,037 | ||
|
|
|
The fair value of the non-compete agreements was determined using the discounted cash flow method. The discounted cash flow method measures cash flow with and without competition to determine the fair value of the non-compete. The non-compete agreements are being amortized over the estimated useful life of three years based on the expected employment term plus the non-compete term.
The computers are being depreciated over their estimated useful lives on a straight-line basis.
The excess of the purchase consideration over the fair value of the net tangible and identifiable intangible assets acquired was recorded as goodwill. The goodwill is attributable to assembled workforce acquired. For income tax purposes $1,000,000 is expected to be deductible. The purchase price allocation was finalized as of December 31, 2014.
Pro forma results of operations have not been presented because the acquisition was not material in relation to our consolidated financial statements for the period from January 1, 2013 to the date of acquisition.
F-19
Table of Contents
Index to Financial Statements
INSTRUCTURE, INC.
Notes to Consolidated Financial Statements
4. Intangible Assets
Intangible assets consisted of the following (in thousands):
| Average Remaining Useful Life |
December 31, | September 30, 2015 |
||||||||||||||
| 2013 | 2014 | |||||||||||||||
| (unaudited) | ||||||||||||||||
| Domain names |
38 Months | $ | 1,251 | $ | 1,268 | $ | 1,268 | |||||||||
| Tradenames and trademarks |
29 Months | 120 | 109 | 109 | ||||||||||||
| Non-compete agreements |
27.5 Months | — | 26 | 26 | ||||||||||||
| Accumulated amortization |
(344 | ) | (650 | ) | (882 | ) | ||||||||||
|
|
|
|
|
|
|
|||||||||||
| Total |
$ | 1,027 | $ | 753 | $ | 521 | ||||||||||
|
|
|
|
|
|
|
|||||||||||
Amortization expense for intangible assets was $299,000 and $306,000 for the years ended December 31, 2013 and 2014, respectively. Amortization expense for intangible assets was $225,000 and $232,000 for the nine months ended September 30, 2014 and 2015 (unaudited), respectively.
Based on the recorded intangible assets at December 31, 2014, estimated amortization expense is expected to be as follows (in thousands):
| Years Ending December 31, |
Amortization Expense |
|||
| 2015 |
$ | 309 | ||
| 2016 |
309 | |||
| 2017 |
133 | |||
| 2018 |
1 | |||
| 2019 |
1 | |||
|
|
|
|||
| Total |
$ | 753 | ||
|
|
|
|||
5. Marketable Securities
Our investment policy is consistent with the definition of available-for-sale securities. We do not buy and hold securities principally for the purpose of selling them in the near future nor do we intend to hold securities to maturity. Rather, our policy is focused on the preservation of capital, liquidity and return. From time to time, we may sell certain securities but the objectives are generally not to generate profits on short-term differences in price.
The following table summarizes, by major security type, our assets that are measured at fair value on a recurring basis (in thousands).
| December 31, 2013 | ||||||||||||||||
| Amortized Cost |
Gross Unrealized Gains |
Gross Unrealized Losses |
Estimated Fair Value |
|||||||||||||
| Corporate debt securities |
$ | 13,302 | $ | 7 | $ | (2 | ) | $ | 13,307 | |||||||
| December 31, 2014 | ||||||||||||||||
| Amortized Cost |
Gross Unrealized Gains |
Gross Unrealized Losses |
Estimated Fair Value |
|||||||||||||
| Corporate debt securities |
$ | 501 | $ | — | $ | — | $ | 501 | ||||||||
F-20
Table of Contents
Index to Financial Statements
INSTRUCTURE, INC.
Notes to Consolidated Financial Statements
| September 30, 2015 (unaudited) | ||||||||||||||||
| Amortized Cost |
Gross Unrealized Gains |
Gross Unrealized Losses |
Estimated Fair Value |
|||||||||||||
| Corporate debt securities |
$ | 1,449 | $ | — | $ | (1) | $ | 1,448 | ||||||||
Because we do not intend to sell the investments that are in an unrealized loss position and it is not likely that we will be required to sell any investments before recovery of their amortized cost basis, we do not consider those investments with an unrealized loss to be other-than-temporarily impaired as of December 31, 2013.
There were no marketable securities in an unrealized loss position as of December 31, 2014. There were $1,448,000 marketable securities in an unrealized loss position of $1,000 as of September 30, 2015 (unaudited). Because we do not intend to sell the investments that are in an unrealized loss position and it is not likely that we will be required to sell any investments before recovery of their amortized cost basis, we do not consider those investments with an unrealized loss to be other-than-temporarily impaired at September 30, 2015.
There were no gross realized gains or losses from the sale or maturity of marketable securities during 2013. There were gross realized gains of $9,000 and gross realized losses of $0 from the sale or maturity of marketable securities included in other income (expense) during 2014. There were gross realized gains of $9,000 and $0 gross realized losses of $0 and $0 from the sale or maturity of marketable securities for the nine months ended September 30, 2014 and 2015 (unaudited), respectively.
During 2013 and 2014, we recognized gross interest income on securities of $116,000 and $177,000, respectively. Interest income was offset by amortization expense on securities of $99,000 and $148,000 during 2013 and 2014, respectively, and reported net within interest income on the statement of comprehensive loss.
During the nine months ended September 30, 2014 and 2015, we recognized gross interest income on securities of $172,000 and $13,000 (unaudited), respectively. Interest income was offset by amortization expense on securities of $144,000 and $8,000 during the nine months ended September 30, 2014 and 2015 (unaudited), respectively.
The estimated fair value of investments by contractual maturity is as follows (in thousands):
| December 31, 2014 | September 30, 2015 | |||||||
| (unaudited) | ||||||||
| Due within one year |
$ | 501 | $ | 1,448 | ||||
| Due after one year and through 5 years |
— | — | ||||||
| Due after 5 years and through 10 years |
— | — | ||||||
| Due after 10 years |
— | — | ||||||
|
|
|
|
|
|||||
| Total |
$ | 501 | $ | 1,448 | ||||
|
|
|
|
|
|||||
6. Credit Facility
In November 2012, we entered into a loan and security agreement with a financial institution, or the credit facility, allowing us to incur revolver borrowings of up to $7.0 million, or such lesser amount equal to a percentage of our monthly contracted recurring revenue. Interest on borrowings accrued at a rate equal to the prime rate plus 1.25% to 3.75%, with the exact interest rate determined by reference to a specified operating metric. Accrued interest is payable monthly on the first day of each month with all outstanding borrowings payable on the maturity date. In addition to an upfront facility fee, we are obligated to pay the lender a fee, payable quarterly in arrears, in an amount equal to 0.25% of the average unused portion of the available borrowings.
F-21
Table of Contents
Index to Financial Statements
INSTRUCTURE, INC.
Notes to Consolidated Financial Statements
The credit facility contains customary conditions to borrowing, events of default and covenants, including covenants that restrict our ability to dispose of assets, change our business, merge with or acquire other entities, incur indebtedness, incur encumbrances, make distributions to holders of our capital stock, make investments or engage in transactions with our affiliates. The agreement also includes a financial covenant requiring the achievement of minimum bookings on a trailing three month basis, tested monthly. During the continuance of an event of default, SVB may accelerate amounts outstanding, terminate the credit facility, and foreclose on the collateral. Amounts borrowed under the credit facility are secured by a first priority security interest in substantially all of our assets other than intellectual property and more than 65% of the capital stock of any of our foreign subsidiaries.
We issued a warrant to purchase 70,000 shares of common stock to the lender in connection with the credit facility (see Note 8—Stockholder’s Deficit). The warrant has a ten-year term and an exercise price of $0.99 per share.
In February 2013, we amended the credit facility to (1) decrease available aggregate revolver borrowings to $5.0 million from February 2013 to July 2013 and $4.0 million thereafter and (2) change the interest rate on borrowings to the prime rate plus 1.50% to 4.50%, with the exact interest rate determined by reference to a specified operating metric. In addition, if we obtained net cash proceeds of at least $10.0 million from the sale of our equity securities, then the credit facility provided that the aggregate available borrowings would increase to $7.0 million, or such lesser amount equal to a percentage of our monthly contracted recurring revenue. In May 2013, we obtained equity funding in excess of $10.0 million. Additionally, the credit facility contained a covenant requiring us to have certain minimum new and renewal contracts during the term.
In April 2014, we further amended the credit facility to (1) increase available aggregate revolver borrowings and (2) change the interest rate on borrowings from the prime rate plus 1.00% to prime rate plus 1.75%, with the exact interest rate determined by reference to a specified operating metric. The aggregate revolver borrowings increased to $7.5 million until April 2015 and, in April 2015, increased to $10.0 million through the maturity date in April 2016, which limit could be increased to $15.0 million from April 2015 through September 2015 at our election, so long as we were in compliance with all terms and conditions under the credit facility. Actual available borrowings under the credit facility were equal to a percentage of our monthly contracted recurring revenue. Additionally, the credit facility contained a covenant based on consummation of contracts during each applicable three-month measurement period.
We issued a warrant to purchase 33,332 shares of common stock to the lender in connection with the April 2014 amendment of the credit facility (see Note 8—Stockholder’s Deficit). The warrant has a ten-year term and an exercise price of $4.47 per share.
In June 2015, we amended the credit facility to (1) increase available aggregate revolver borrowings and (2) decrease the interest rate on borrowings from a rate of prime plus 1.75% to prime plus 0.50%. The aggregate revolver borrowings is $15.0 million (subject to increase to $25.0 million in the lender’s sole discretion) through the maturity date in June 2017 so long as we are in compliance with all terms and conditions under the credit facility. The agreement also includes a financial covenant requiring the achievement of minimum bookings on a trailing three month basis, tested monthly. During the continuance of an event of default, the lender may accelerate amounts outstanding, terminate the credit facility, and foreclose on the collateral.
As of December 31, 2014 and September 30, 2015 (unaudited), we had no borrowings under the credit facility. Unamortized deferred financing costs associated with the credit facility, were $57,000, $56,000, and $78,000 as of December 31, 2013 and 2014, and September 30, 2015 (unaudited), respectively.
The fair value of the warrant on the date of grant was $58,000 and was recorded as deferred financing costs and recognized as interest expense over the term of the credit facility. Given the warrant is liability classified, we
F-22
Table of Contents
Index to Financial Statements
INSTRUCTURE, INC.
Notes to Consolidated Financial Statements
are recording subsequent changes in the fair value of the warrant to changes in the fair value of warrant liability on the statements of operations (see Note 8—Stockholder’s Deficit).
The following are the assumptions used in the estimate of the fair value of the warrant on the date of grant:
| Dividend Yield |
None | |
| Risk-free interest rate |
1.79% | |
| Expected term (in years) |
5.2 | |
| Volatility |
70% | |
| Probability of contingent event |
20% |
7. Geographic Data
We have one operating segment, which is our cloud-based learning management systems. Revenue by geographic region, based on the physical location of the customer, is (in thousands):
| Year Ended December 31, |
Nine Months Ended September 30, |
|||||||||||||||
| 2013 | 2014 | 2014 | 2015 | |||||||||||||
| (unaudited) | ||||||||||||||||
| United States |
$ | 25,580 | $ | 42,366 | $ | 29,358 | $ | 48,301 | ||||||||
| Foreign |
475 | 1,986 | 1,258 | 3,095 | ||||||||||||
|
|
|
|
|
|
|
|
|
|||||||||
| Total revenue |
$ | 26,055 | $ | 44,352 | $ | 30,616 | $ | 51,396 | ||||||||
|
|
|
|
|
|
|
|
|
|||||||||
| Percentage of revenue generated outside of the United States |
2 | % | 4 | % | 4 | % | 6 | % | ||||||||
|
|
|
|
|
|
|
|
|
|||||||||
8. Stockholders’ Deficit
Common Stock
We had 23,333,333, 25,333,333 and 26,600,000 shares of $0.0001 par value common stock authorized as of December 31, 2013 and 2014, and September 30, 2015 (unaudited), respectively. There were 4,911,367, 7,476,161, and 7,611,718 shares issued at December 31, 2013 and 2014, and September 30, 2015 (unaudited), respectively. There were 1,128,472 shares of common stock held in treasury at December 31, 2013 and 2014 and September 30, 2015 (unaudited). Each share of common stock has the right to one vote on all matters submitted to a vote of stockholders. The holders of common stock are also entitled to receive dividends whenever funds are legally available and if declared by the board of directors, subject to prior rights of holders of all classes of stock outstanding having priority rights as to dividends. No dividends have been declared or paid on the common stock through September 30, 2015 (unaudited).
During 2013, we issued 225,538 shares of common stock upon the exercise of stock options and received cash of $42,000. During 2014, we issued 2,468,647 shares of common stock upon the exercise of stock options and received cash of $751,000.
During the nine months ended September 30, 2014 (unaudited), we issued 2,308,777 shares of common stock upon the exercise of stock options and received cash of $565,000. During the nine months ended September 30, 2015 (unaudited), we issued 179,263 shares of common stock upon the exercise of stock options and received cash of $246,000.
F-23
Table of Contents
Index to Financial Statements
INSTRUCTURE, INC.
Notes to Consolidated Financial Statements
Common Stock Warrants
In November 2012, we issued a warrant to purchase 70,000 shares of common stock in connection with the credit facility (See Note 6—Credit Facility). The warrant is fully exercisable and expires in November 2022. This warrant is classified as stockholders’ equity on the consolidated balance sheets.
In April 2014, we issued the lender a second warrant to purchase up to 33,332 shares of common stock in connection with an amendment of the credit facility (See Note 6—Credit Facility) at an exercise price of $4.47 per share, of which 16,666 are exercisable as of December 31, 2014 and September 30, 2015. An additional 16,666 shares may become exercisable if our aggregate outstanding balance of the credit facility exceeds $7,500,000. We anticipate the probability that the additional 16,666 shares may become exercisable at 20%. The common stock warrant expires upon the earliest of (1) three years after we file a registration statement for an initial public offering that is completed, (2) if we are acquired or substantially all of our assets are acquired or leased or otherwise disposed, then immediately prior to and contingent upon that acquisition, and (3) April 1, 2024. In the event of an acquisition, the common stock warrant will be automatically net-share settled if such exercise would provide value to the holder. This common stock warrant is classified as a liability and recorded as a warrant liability on the consolidated balance sheets with changes in fair value being recorded each reporting period through the changes in fair value of warrant liability account on the statements of operations.
The following table summarizes information about common stock warrants outstanding as of December 31, 2013 and 2014 and September 30, 2015 (in thousands, except per share amounts):
| Years of Expiration |
Number of Shares Underlying Warrants as of | Exercise Price |
||||||||||||||||||
| Warrants to Purchase |
December 31, 2013 |
December 31, 2014 |
September 30, 2015 |
|||||||||||||||||
| (unaudited) | ||||||||||||||||||||
| Common stock |
2022 | 70 | 70 | 70 | $ | 0.99 | ||||||||||||||
| Common stock |
2024 | — | 33 | 33 | 4.47 | |||||||||||||||
Redeemable Convertible Preferred Stock
We have authorized multiple series of redeemable convertible preferred stock with a par value per share of $0.0001, collectively, the Series Preferred. The number of authorized and outstanding shares of Series Preferred as of December 31, 2013 and 2014 and September 30, 2015 (unaudited), was:
| December 31, | September 30, 2015 |
|||||||||||||||||||||||
| 2013 | 2014 | |||||||||||||||||||||||
| Authorized Shares |
Outstanding Shares |
Authorized Shares |
Outstanding Shares |
Authorized Shares |
Outstanding Shares |
|||||||||||||||||||
| (unaudited) | ||||||||||||||||||||||||
| Series A |
2,596,000 | 2,340,000 | 2,596,000 | 2,340,000 | 2,596,000 | 2,596,000 | ||||||||||||||||||
| Series B |
6,799,000 | 6,682,000 | 6,799,000 | 6,682,000 | 6,799,000 | 6,799,000 | ||||||||||||||||||
| Series C |
1,241,000 | 1,241,000 | 1,241,000 | 1,241,000 | 1,241,000 | 1,241,000 | ||||||||||||||||||
| Series D |
2,516,000 | 2,516,000 | 2,516,000 | 2,516,000 | 2,516,000 | 2,516,000 | ||||||||||||||||||
| Series E |
— | — | 1,934,000 | 1,825,000 | 1,934,000 | 1,825,000 | ||||||||||||||||||
|
|
|
|
|
|
|
|
|
|
|
|
|
|||||||||||||
| Total |
13,152,000 | 12,779,000 | 15,086,000 | 14,604,000 | 15,086,000 | 14,977,000 | ||||||||||||||||||
|
|
|
|
|
|
|
|
|
|
|
|
|
|||||||||||||
During 2013, we issued 2,516,000 shares of Series D preferred stock for cash at a purchase price of $11.925 per share. Issuance costs of $124,000 were netted against the total proceeds of $30,000,000.
F-24
Table of Contents
Index to Financial Statements
INSTRUCTURE, INC.
Notes to Consolidated Financial Statements
During 2014, we issued 1,825,000 shares of Series E preferred stock for cash at a purchase price of $21.921 per share. Issuance costs of $103,000 were netted against the total proceeds of $40,000,000.
During the nine months ended September 30, 2015 (unaudited), we issued 256,000 shares of Series A preferred stock for the exercise of the Series A preferred stock warrant at an exercise price of $0.39 per share. The amount of cash received from the exercise was $100,000.
During the nine months ended September 30, 2015 (unaudited), we issued 117,000 shares of Series B preferred stock for the exercise of the Series B preferred stock warrant at an exercise price of $1.275 per share. The amount of cash received from the exercise was $150,000.
The liquidation preference (in thousands), dividend rate and conversion rates of the Series Preferred, in order of liquidation preference, as of September 30, 2015, is:
| Liquidation Preference |
Dividend Rate* |
Original Issue Price |
Conversion Ratio |
|||||||||||||
| Series A |
$ | 1,012 | 8 | % | $ | 0.39 | 1:1 | |||||||||
| Series B |
8,669 | 8 | 1.275 | 1:1 | ||||||||||||
| Series C |
10,000 | 8 | 8.055 | 1:1 | ||||||||||||
| Series D |
30,000 | 8 | 11.925 | 1:1 | ||||||||||||
| Series E |
40,000 | 8 | 21.921 | 1:1 | ||||||||||||
|
|
|
|||||||||||||||
| Total liquidation preference |
$ | 89,681 | ||||||||||||||
|
|
|
|||||||||||||||
| * | Non-cumulative undeclared dividend. No dividends have been declared through September 30, 2015 (unaudited). |
The significant rights, privileges, and preferences of the Series Preferred are as follows:
Dividends
The holders of Series Preferred are entitled to receive 8% of the respective original issue price per annum (as disclosed in the previous table) in preference to holders of common stock. The dividends are non-cumulative and only payable if and when declared by our board of directors. In the event dividends are paid on any share of common stock, we will pay an additional dividend on all outstanding shares of series preferred in a per share amount equal to the amount paid or set aside for each share of common stock.
Liquidation
The holders of Series Preferred have liquidation preferences over the holders of common stock in the amounts disclosed in the previous table, along with any declared but unpaid dividends. If upon a liquidation event, our assets are insufficient to make payment in full to all holders of Series Preferred, payment will be made to the holders of Series Preferred ratably in proportion to the full amounts to which they would otherwise be respectively entitled. After the payment of the liquidation preferences, the holders of Series Preferred will share in any remaining distribution on an as-if converted basis with the holders of common stock up to an amount equal to two times their respective original issue price per share, as adjusted for any stock dividends, combinations, splits, recapitalizations and the like, inclusive of their liquidation preference distributions.
F-25
Table of Contents
Index to Financial Statements
INSTRUCTURE, INC.
Notes to Consolidated Financial Statements
Conversion
Each share of Series Preferred is convertible into common stock at the initial conversion rate as shown in the previous table, subject to adjustment based on certain anti-dilution provisions, including stock splits, stock dividends, subdivision, combinations, recapitalization or similar events, as provided by our amended and restated certificate of incorporation. Further, the shares of a particular series of Series Preferred will automatically convert into shares of common stock upon the vote or written consent of the holders of a majority of the shares of such series of Series Preferred. In addition, each share of Series Preferred shall automatically be converted into shares of common stock immediately upon the closing of an initial public offering of our common stock at a price in which gross cash proceeds to us are at least $50,000,000. If the price in the public offering is less than the original issue price of the Series E preferred stock ($21.921), the conversion price of the Series E preferred stock shall be reduced to the price per share in such offering.
Redemption
The holders of Series Preferred have no voluntary rights to redeem shares. A liquidation or winding up of our company, a greater than 50% change in control, or a sale of substantially all of our assets would constitute a redemption event. Although the redeemable convertible preferred stock is not mandatorily or currently redeemable, these events would constitute a redemption event outside of our control. Accordingly, these shares are considered contingently redeemable and are classified as temporary equity on the accompanying consolidated balance sheets.
Voting
The holders of Series Preferred are entitled to the number of votes equal to the number of shares of common stock into which the preferred stock could be converted. The holders of Series A preferred stock voting as a single class (on an as-converted basis), the holders of Series B preferred stock voting as a single class (on an as-converted basis) and the holders of Series D preferred stock voting as a single class (on an as-converted basis), are entitled to elect one member of the board of directors per respective series. The holders of a majority of the common stock are entitled to elect two members of the board of directors. The holders of a majority of the Series Preferred and common stock, voting together as a single class (on an as-converted basis) are entitled to elect two members of the board of directors.
Stockholder Rights
The holders of Series Preferred have protective provisions that require consent of holders of at least 75% of the outstanding Series Preferred for specific actions including the following: (1) changes in the corporation’s certificate of incorporation or bylaws that would affect, alter, or change the preference or rights of the preferred stock; (2) changes in the authorized number of shares of the Series Preferred; (3) declaration, or payment of dividends; (4) redemption or repurchase of shares; (5) any agreement by Instructure or our stockholders regarding an asset transfer or acquisition; (6) changes in the size of the board of directors; (7) creation of a new class or series of stock ranking on parity with or senior to the Series Preferred in right of redemption, liquidation preference, voting or dividends; (8) engaging in transactions with affiliates unless approved by the board of directors; (9) granting exclusive distribution rights to all or substantially all of our products or granting an exclusive license to all or substantially all of our intellectual property unless approved by the board of directors, including at least one director elected by the Series Preferred; or (10) making any change in the president, chief executive officer, chief financial officer, chief technical officer or chief operating officer or other material change to the compensation thereof, unless approved by the board of directors.
F-26
Table of Contents
Index to Financial Statements
INSTRUCTURE, INC.
Notes to Consolidated Financial Statements
In addition, the holders of a majority of each respective series of Series Preferred must approve any amendment, alteration or repeal of any provision of the amended and restated certificate of incorporation that alters or changes the voting or other powers, preferences or other special rights or privileges or restrictions of such respective series of Series Preferred.
Redeemable Convertible Preferred Stock Warrants
In connection with loans from a stockholder in prior years, warrants were issued on various dates from 2008 through 2010 to purchase Series A and Series B redeemable convertible preferred stock. These warrants are recorded at fair value and marked to market at each reporting period with changes recorded within change in fair value of warrant liability on the consolidated statements of operations and classified and recorded as a warrant liability on the consolidated balance sheets.
These redeemable convertible preferred stock warrants were exercised during the nine months ended September 30, 2015 (unaudited). In connection with the exercise of the warrant, the warrant liability was marked to market one last time as of the settlement date. The resulting warrant liability of $3,899,000 and the cash received of $250,000 was recorded as redeemable convertible preferred stock.
The following table summarizes information about redeemable convertible preferred stock warrants outstanding as of December 31, 2013 and 2014 and September 30, 2015 (unaudited) (in thousands, except per share amounts):
| Years of Expiration |
Number of Shares Underlying Warrants as of | Exercise Price |
||||||||||||||||||
| Warrants to Purchase |
December 31, 2013 |
December 31, 2014 |
September 30, 2015 |
|||||||||||||||||
| (unaudited) | ||||||||||||||||||||
| Series A redeemable convertible preferred stock |
2018 | 51 | 51 | — | $ | 0.39 | ||||||||||||||
| Series A redeemable convertible preferred stock |
2019 | 205 | 205 | — | 0.39 | |||||||||||||||
| Series B redeemable convertible preferred stock |
2015 | 117 | 117 | — | 1.275 | |||||||||||||||
9. Stock-Based Compensation
Our 2010 Equity Incentive Plan, or the 2010 Plan, provides for the grant of incentive stock options, nonqualified options, stock appreciation rights, and shares of restricted stock. As of December 31, 2014 and September 30, 2015 (unaudited), there were 6,605,470 and 7,872,136 shares of common stock authorized, respectively. As of December 31, 2014 and September 30, 2015 (unaudited), 6,446,919 and 7,498,151 shares, net of forfeitures, were granted, respectively, and 158,551 and 373,985 shares remain available for future grants, respectively. We expect to issue new shares of common stock for all stock options exercised.
Certain stock options provide for early exercise provisions of unvested shares. The unvested shares are subject to a repurchase right held by us at the original purchase price. Early exercises of options are not deemed to be substantive exercises for accounting purposes and accordingly, amounts received for early exercises are initially recorded in accrued liabilities or other long-term liabilities and reclassified to additional paid-in capital as the underlying shares vest. At December 31, 2013 and 2014 and September 30, 2015 (unaudited), we had $0, $74,000 and $33,000 recorded in liabilities related to early exercises of stock options, and the related number of unvested shares subject to repurchase was 5,230, 134,783 and 64,748, respectively.
The board of directors determines the terms of each grant. Generally, the options have a vesting period of four years and have a ten-year contractual life. Certain stock options have provisions to accelerate vesting upon the occurrence of certain events such as a change in control. Certain stock options provide for early exercise
F-27
Table of Contents
Index to Financial Statements
INSTRUCTURE, INC.
Notes to Consolidated Financial Statements
provisions of unvested shares. All options were granted with an exercise price equal to the estimated fair value of our common stock at the date of grant. The fair value of the common stock that underlies the stock options has historically been determined by the board of directors based, in part, upon periodic valuation studies obtained from a third-party valuation firm.
In performing its valuation analysis, the valuation firm engaged in discussions with management, analyzed historical and forecasted financial statements, and reviewed corporate documents. In addition, these valuation studies were based on a number of assumptions, including industry, general economic, market and other conditions that could reasonably be evaluated at the time of the valuation.
We estimated the grant-date fair value of options granted using the following assumptions in the Black-Scholes option pricing model:
| Year Ended December 31, | Nine Months Ended September 30, | |||||||
| 2013 | 2014 | 2014 | 2015 | |||||
| (unaudited) | ||||||||
| Dividend yield |
None | None | None | None | ||||
| Volatility |
63.00% | 70.00%—71.18% | 70.00%—71.19% | 67.14%—70.00% | ||||
| Risk-free interest rate |
0.85%—2.16% | 1.65%—1.99% | 1.65%—1.99% | 1.46%—1.84% | ||||
| Expected life (years) |
5.6—6.1 | 5.3—6.1 | 5.3—6.1 | 5.1—6.7 | ||||
| Fair value of common stock |
$0.990—$2.355 | $2.355—$8.430 | $2.355—$6.330 | $9.195—$12.270 | ||||
We estimate forfeitures at the time of grant for those awards that are expected to vest and revise those estimates in subsequent periods if actual forfeitures differ from those estimates. All stock-based payment awards are amortized on a straight-line basis over the requisite service periods of the awards, which are generally the vesting periods.
During 2013, certain investors purchased 447,423 shares of common stock and we purchased 24,814 shares of common stock from current and former employees, for an aggregate of 472,237 shares at a weighted average price per share of $8.77. In addition, during 2013, certain investors also purchased an aggregate of 66,667 shares of Series A redeemable convertible preferred stock from another third-party investor, at a weighted average price per share of $8.34. These transactions were for aggregate consideration of $4,705,000. The purchase price per share was in excess of the fair value of such shares. As a result, during 2013, we recorded the incremental purchase price above fair value of $3,123,000 as stock-based compensation expense for the sales by the current and former employees and $353,000 as a non-cash deemed dividend for the sales by the third-party investor.
During 2014, certain investors purchased an aggregate of 648,774 shares of common stock from current and former employees, at a weighted average price per share of $19.72. This transaction resulted in aggregate purchase consideration of $12,797,000. The purchase price per share was in excess of the fair value of such shares. As a result, during 2014, we recorded the incremental purchase price above fair value of $6,898,000 as stock-based compensation expense for the sales by current and former employees.
During the nine months ended September 30, 2015 (unaudited), certain investors purchased an aggregate of 121,528 shares of common stock from a former employee, at a weighted average price per share of $19.72. In addition, during the nine months ended September 30, 2015 (unaudited), certain investors also purchased an aggregate of 534,251 shares of Series A redeemable convertible preferred stock from a current employee and another third-party investor, at a weighted average price per share of $21.93. These transactions resulted in aggregate purchase consideration of $14,109,000. The purchase price per share was in excess of the fair value of such shares. As a result, during the nine months ended September 30, 2015 (unaudited), we recorded the
F-28
Table of Contents
Index to Financial Statements
INSTRUCTURE, INC.
Notes to Consolidated Financial Statements
incremental purchase price above fair value of $5,353,000 as stock-based compensation expense for the sales by the current and former employees and $632,000 as a non-cash deemed dividend for the sale by the third-party investor.
The following two tables show stock-based compensation expense by award type and where the stock-based compensation expense was recorded in our consolidated statements of operations (in thousands):
| Year Ended December 31, | Nine Months Ended September 30, | |||||||||||||||
| 2013 | 2014 | 2014 | 2015 | |||||||||||||
| (unaudited) | ||||||||||||||||
| Options |
$ | 469 | $ | 1,233 | $ | 808 | $ | 2,285 | ||||||||
| Vesting of restricted stock awards |
— | 67 | 48 | 61 | ||||||||||||
| Employee sale of securities to investors |
3,123 | 6,898 | — | 5,353 | ||||||||||||
|
|
|
|
|
|
|
|
|
|||||||||
| Total stock-based compensation |
$ | 3,592 | $ | 8,198 | $ | 856 | $ | 7,699 | ||||||||
|
|
|
|
|
|
|
|
|
|||||||||
| Year Ended December 31, | Nine Months Ended September 30, | |||||||||||||||
| 2013 | 2014 | 2014 | 2015 | |||||||||||||
| (unaudited) | ||||||||||||||||
| Subscription and support cost of revenue |
$ | 28 | $ | 258 | $ | 24 | $ | 106 | ||||||||
| Professional services and other cost of revenue |
8 | 39 | 24 | 103 | ||||||||||||
| Sales and marketing |
1,597 | 2,877 | 174 | 768 | ||||||||||||
| Research and development |
1,585 | 3,971 | 307 | 871 | ||||||||||||
| General and administrative |
374 | 1,053 | 327 | 5,851 | ||||||||||||
|
|
|
|
|
|
|
|
|
|||||||||
| Total stock-based compensation |
$ | 3,592 | $ | 8,198 | $ | 856 | $ | 7,699 | ||||||||
|
|
|
|
|
|
|
|
|
|||||||||
The following table summarizes the stock option activity for the year ended December 31, 2014 and for the nine months ended September 30, 2015 (unaudited) (in thousands, except per share amounts):
| Shares Underlying Options |
Weighted- Average Exercise Price |
Weighted- Average Remaining Life (in years) |
Aggregate Intrinsic Value |
|||||||||||||
| Outstanding at January 1, 2014 |
4,389 | $ | 0.65 | 8.2 | $ | 7,471 | ||||||||||
| Granted |
1,474 | 5.95 | ||||||||||||||
| Exercised |
(2,469 | ) | 0.30 | |||||||||||||
| Forfeited or cancelled |
(400 | ) | 2.35 | |||||||||||||
|
|
|
|||||||||||||||
| Outstanding at December 31, 2014 |
2,994 | 3.32 | 8.5 | 17,594 | ||||||||||||
|
|
|
|||||||||||||||
| Granted (unaudited) |
1,328 | 11.17 | ||||||||||||||
| Exercised (unaudited) |
(179 | ) | 1.36 | |||||||||||||
| Forfeited or cancelled (unaudited) |
(233 | ) | 5.37 | |||||||||||||
|
|
|
|||||||||||||||
| Outstanding at September 30, 2015 (unaudited) |
3,910 | 5.95 | 8.4 | 31,272 | ||||||||||||
|
|
|
|||||||||||||||
| Vested and expected to vest—December 31, 2014 |
2,505 | 3.23 | 8.5 | 14,933 | ||||||||||||
| Exercisable at December 31, 2014 |
1,162 | 1.12 | 7.8 | 9,387 | ||||||||||||
| Vested and expected to vest—September 30, 2015 (unaudited) |
3,345 | 5.75 | 8.3 | 27,433 | ||||||||||||
| Exercisable at September 30, 2015 (unaudited) |
1,523 | 2.01 | 7.3 | 18,185 | ||||||||||||
F-29
Table of Contents
Index to Financial Statements
INSTRUCTURE, INC.
Notes to Consolidated Financial Statements
The activity of the our unvested options for the year ended December 31, 2014 and the nine months ended September 30, 2015 (unaudited) is presented below (in thousands, except per share amounts):
| Shares Underlying Options |
Weighted- Average Grant Date Fair Value Per Option |
|||||||
| Unvested at January 1, 2014 |
2,264 | $ | 0.72 | |||||
| Granted |
1,474 | 3.75 | ||||||
| Vested |
(1,154 | ) | 0.66 | |||||
| Forfeited |
(395 | ) | 1.48 | |||||
|
|
|
|||||||
| Unvested at December 31, 2014 |
2,189 | 2.65 | ||||||
|
|
|
|||||||
| Granted (unaudited) |
1,328 | 6.96 | ||||||
| Vested (unaudited) |
(706 | ) | 2.04 | |||||
| Forfeited (unaudited) |
(216 | ) | 3.57 | |||||
|
|
|
|||||||
| Unvested at September 30, 2015 (unaudited) |
2,595 | 4.95 | ||||||
|
|
|
|||||||
The weighted-average grant-date fair value of each option granted during 2013 and 2014 was $1.05 and $3.75, respectively. The total intrinsic value of options exercised was $327,000, $10,942,000, $9,775,000 and $1,697,000 during 2013 and 2014 and the nine months ended September 30, 2014 and 2015 (unaudited), respectively. The total fair value of options vested during 2013 and 2014 and the nine months ended September 30, 2014 and 2015 (unaudited) was $351,000, $735,000, $552,000 and $1,420,000, respectively.
As of December 31, 2014 and September 30, 2015, we had $4,253,000 and $8,947,000 (unaudited), respectively, of unrecognized stock-based compensation costs related to non-vested awards that are expected to be recognized over a weighted average period of 3.1 years and 3.0 years (unaudited), respectively.
In April 2014, in connection with the 12 Spokes acquisition, we issued 70,000 shares of restricted common stock as part of the employee agreement between us and the former owner of 12 Spokes. The shares are subject to a four year vesting period and vest monthly over the vesting period. These shares were issued for no consideration and therefore the fair value of these shares of $313,000 is recorded as compensation expense over the vesting period. In December 2014, this same employee and we mutually agreed to a termination agreement. The agreement specified that the employee would remain with us until April 2015 for a total vesting of 17,333 shares of restricted common stock. In addition, we agreed to accelerate six months’ worth of vesting, which resulted in an additional 8,667 shares of restricted common stock. We recorded additional stock-based compensation for the acceleration as a modification of improbable to probable. The remaining 44,000 shares of restricted common stock were forfeited in July 2015 (unaudited).
F-30
Table of Contents
Index to Financial Statements
INSTRUCTURE, INC.
Notes to Consolidated Financial Statements
The activity for restricted stock awards for the year ended December 31, 2014, and nine months ended September 30, 2015 (unaudited) is as follows (in thousands, except per share amounts):
| Restricted Stock Outstanding | ||||||||
| Shares | Weighted- Average Grant Date Fair Value Per Share |
|||||||
| Unvested and outstanding at January 1, 2014 |
— | $ | — | |||||
| Granted |
73 | 4.47 | ||||||
| Vested |
(15 | ) | 4.47 | |||||
| Canceled |
— | — | ||||||
|
|
|
|||||||
| Unvested and outstanding at December 31, 2014 |
58 | 4.47 | ||||||
| Granted (unaudited) |
— | — | ||||||
| Vested (unaudited) |
(15 | ) | 4.47 | |||||
| Canceled (unaudited) |
(43 | ) | — | |||||
|
|
|
|||||||
| Unvested and outstanding at September 30, 2015 (unaudited) |
— | — | ||||||
|
|
|
|||||||
10. Income Taxes
Loss before provision for income taxes was as follows:
| Year Ended December 31, | ||||||||
| 2013 | 2014 | |||||||
| (in thousands) | ||||||||
| United States |
$ | (22,499 | ) | $ | (36,783 | ) | ||
| Foreign |
— | (4,587 | ) | |||||
|
|
|
|
|
|||||
| Total |
$ | (22,499 | ) | $ | (41,370 | ) | ||
|
|
|
|
|
|||||
The following reconciles the differences between income taxes computed at the federal statutory rate of 35% and the provision for income taxes:
| Year Ended December 31, | ||||||||
| 2013 | 2014 | |||||||
| (in thousands) | ||||||||
| Expected income tax (benefit) expense at the federal statutory rate |
$ | (7,650 | ) | $ | (14,066 | ) | ||
| State tax net of federal benefit |
(1,614 | ) | (904 | ) | ||||
| Stock-based compensation |
1,267 | 2,782 | ||||||
| Preferred stock warrant liability |
185 | 856 | ||||||
| Difference in foreign tax rates |
— | 1,524 | ||||||
| Research and development credits |
(236 | ) | (314 | ) | ||||
| Valuation allowance for deferred tax assets |
8,026 | 10,114 | ||||||
| Other |
22 | 65 | ||||||
|
|
|
|
|
|||||
| Income tax provision |
$ | — | $ | 57 | ||||
|
|
|
|
|
|||||
In 2014, we had a current state and foreign income tax expense of $22,000 and $63,000, respectively, and a deferred foreign income tax benefit of $(28,000).
F-31
Table of Contents
Index to Financial Statements
INSTRUCTURE, INC.
Notes to Consolidated Financial Statements
Deferred Tax Assets and Liabilities
Deferred income taxes reflect the net effects of temporary differences between the carrying amounts of assets and liabilities for financial reporting purposes and the amounts used for income tax purposes. Significant components of our deferred tax assets and liabilities were as follows:
| Year Ended December 31, | ||||||||
| 2013 | 2014 | |||||||
| (in thousands) | ||||||||
| Deferred tax assets: |
||||||||
| Net operating loss carryforwards |
$ | 13,235 | $ | 22,626 | ||||
| Research and development credits |
519 | 897 | ||||||
| Accruals and reserves |
2,607 | 2,746 | ||||||
| Depreciation |
177 | 286 | ||||||
| Stock-based compensation |
196 | 611 | ||||||
|
|
|
|
|
|||||
| Total deferred tax assets |
16,734 | 27,166 | ||||||
|
|
|
|
|
|||||
| Deferred tax liabilities: |
||||||||
| Intangible assets |
— | (20 | ) | |||||
| Capitalized costs |
(138 | ) | (409 | ) | ||||
|
|
|
|
|
|||||
| Total deferred tax liabilities |
(138 | ) | (429 | ) | ||||
|
|
|
|
|
|||||
| Valuation allowance |
(16,596 | ) | (26,709 | ) | ||||
|
|
|
|
|
|||||
| Net deferred tax assets |
$ | — | $ | 28 | ||||
|
|
|
|
|
|||||
At December 31, 2014, we had $22,626,000 in tax-effected federal and state net operating loss carryforwards that, if unused, begin expiring in 2017. Although a portion of these carryforwards are subject to the provisions of Internal Revenue Code Section 382, we do not believe these limitations will prevent us from fully utilizing these carryforwards. Additionally, we had $2,703,000 of carryforwards related to excess tax benefits for stock-based compensation. These operating loss carryforwards, if unused, begin expiring in 2017. Finally, at December 31, 2014, we had $1,514,000 in income tax credits, consisting primarily of federal and state research and development tax credits. These tax credits, if unused, begin expiring in 2023.
We review all available evidence to evaluate our recovery of deferred tax assets, including our recent history of accumulated losses in all tax jurisdictions over the most recent three years as well as our ability to generate income in future periods. We have provided a valuation allowance against our U.S. net deferred tax assets as it is more likely than not that these assets will not be realized given the nature of the assets and the likelihood of future utilization.
The valuation allowance increased by $8,026,000 in 2013 and $10,113,000 in 2014, due to the increase in the deferred tax assets by approximately the same amounts (primarily due to the increase in the net operating loss carryforwards).
U.S. income taxes on the undistributed earnings of our non-U.S. subsidiaries have not been provided for as we currently plan to indefinitely reinvest these amounts and have the ability to do so. Cumulative undistributed foreign earnings were not material at December 31, 2013 and December 31, 2014.
We have net operating loss carryforwards of $34,105,000 and $59,070,000, respectively at December 31, 2013 and 2014, which expire at various dates through 2034. We have generated net operating loss carryforwards
F-32
Table of Contents
Index to Financial Statements
INSTRUCTURE, INC.
Notes to Consolidated Financial Statements
from stock compensation deductions and the amount of federal and state excess tax benefits totaling $2,703,000 will be credited to additional paid-in capital when realized.
We have federal research and development credit carryforwards of $1,120,000 at December 31, 2014 that expire at various dates through 2034. We also have state research and investment credit carryforwards of $393,000 that expire at various dates through 2028.
On December 19, 2014 the Tax Increase Prevention Act was signed into law, which contains provisions that extended the federal research credit through the end of 2014. The federal research credit provisions had previously expired at the end of 2013. A benefit of $483,000 for 2014 federal research credit is reflected in the consolidated financial statements.
Uncertain Tax Positions
We account for uncertainty in income taxes using a two-step process. We first determine whether it is more likely than not that a tax position will be sustained upon examination by the tax authority, including resolutions of any related appeals or litigation processes, based on technical merit. If a tax position meets the more-likely-than-not recognition threshold it is then measured to determine the amount of benefit to recognize in the financial statements. The tax position is measured as the largest amount of benefit that is greater than 50% likely of being realized upon ultimate settlement.
The following summarizes activity related to unrecognized tax benefits:
| Year Ended December 31, | ||||||||
| 2013 | 2014 | |||||||
| (in thousands) | ||||||||
| Unrecognized benefit—beginning of the year |
$ | 121 | $ | 280 | ||||
| Gross increases (decreases)—prior period positions |
— | — | ||||||
| Gross increases (decreases)—current period positions |
159 | 203 | ||||||
|
|
|
|
|
|||||
| Unrecognized benefit—end of period |
$ | 280 | $ | 483 | ||||
|
|
|
|
|
|||||
All of the unrecognized tax benefits decrease deferred tax assets with a corresponding decrease to the valuation allowance. None of the unrecognized tax benefits would affect our effective tax rate if recognized in the future.
We have elected to recognize interest and penalties related to uncertain tax positions as a component of income tax expense. No interest or penalties have been recorded through December 31, 2014.
We do not expect any significant change in our unrecognized tax benefits within the next 12 months.
We file tax returns in the United States, the United Kingdom, Australia, the Netherlands, Hong Kong and various state jurisdictions. All of our tax years remain open to examination by major taxing jurisdictions to which we are subject, as carryforward attributes generated in past years may still be adjusted upon examination by the Internal Revenue Service or state and foreign tax authorities if they have or will be used in future periods. We are routinely examined by various taxing authorities. We do not expect that the results of ongoing examinations will have a material effect on our financial condition or results of operations.
F-33
Table of Contents
Index to Financial Statements
INSTRUCTURE, INC.
Notes to Consolidated Financial Statements
11. Fair Value of Financial Instruments
The fair value of a financial instrument is the amount that could be received upon the sale of an asset or paid to transfer a liability in an orderly transaction between market participants at the measurement date. Financial assets are marked to bid prices and financial liabilities are marked to offer prices. Fair value measurements do not include transaction costs. The fair value hierarchy prioritizes the quality and reliability of the information used to determine fair values. Categorization within the fair value hierarchy is based on the lowest level of input that is significant to the fair value measurement. The fair value hierarchy is defined into the following three categories:
| Level 1: |
Quoted market prices in active markets for identical assets or liabilities. | |
| Level 2: |
Observable market based inputs or unobservable inputs that are corroborated by market data. | |
| Level 3: |
Unobservable inputs that are not corroborated by market data. | |
There were no transfers between Level 1 and Level 2 of the fair value measurement hierarchy during 2013 and 2014. Assets and liabilities measured at fair value on a recurring basis as of December 31, 2013, were as follows (in thousands):
| December 31, 2013 | ||||||||||||||||
| Level 1 | Level 2 | Level 3 | Total | |||||||||||||
| Assets: |
||||||||||||||||
| Money market funds |
$ | 7,597 | $ | — | $ | — | $ | 7,597 | ||||||||
| Corporate debt securities |
— | 13,307 | — | 13,307 | ||||||||||||
|
|
|
|
|
|
|
|
|
|||||||||
| Total assets |
$ | 7,597 | $ | 13,307 | $ | — | $ | 20,904 | ||||||||
|
|
|
|
|
|
|
|
|
|||||||||
| Liabilities: |
||||||||||||||||
| Redeemable convertible preferred stock warrant liability |
$ | — | $ | — | $ | 1,002 | $ | 1,002 | ||||||||
|
|
|
|
|
|
|
|
|
|||||||||
Assets and liabilities measured at fair value on a recurring basis as of December 31, 2014, were as follows (in thousands):
| December 31, 2014 | ||||||||||||||||
| Level 1 | Level 2 | Level 3 | Total | |||||||||||||
| Assets: |
||||||||||||||||
| Money market funds |
$ | 4,650 | $ | — | $ | — | $ | 4,650 | ||||||||
| Corporate debt securities |
— | 501 | — | 501 | ||||||||||||
|
|
|
|
|
|
|
|
|
|||||||||
| Total assets |
$ | 4,650 | $ | 501 | $ | — | $ | 5,151 | ||||||||
|
|
|
|
|
|
|
|
|
|||||||||
| Liabilities: |
||||||||||||||||
| Redeemable convertible preferred stock warrant liability |
$ | — | $ | — | $ | 3,439 | $ | 3,439 | ||||||||
| Common stock warrant liability |
— | — | 138 | 138 | ||||||||||||
|
|
|
|
|
|
|
|
|
|||||||||
| Total liabilities |
$ | — | $ | — | $ | 3,577 | $ | 3,577 | ||||||||
|
|
|
|
|
|
|
|
|
|||||||||
F-34
Table of Contents
Index to Financial Statements
INSTRUCTURE, INC.
Notes to Consolidated Financial Statements
Assets and liabilities measured at fair value on a recurring basis as of September 30, 2015 (unaudited) were as follows (in thousands):
| September 30, 2015 (unaudited) | ||||||||||||||||
| Level 1 | Level 2 | Level 3 | Total | |||||||||||||
| Assets: |
||||||||||||||||
| Money market funds |
$ | 3,702 | $ | — | $ | — | $ | 3,702 | ||||||||
| Corporate debt securities |
— | 1,448 | — | 1,448 | ||||||||||||
|
|
|
|
|
|
|
|
|
|||||||||
| Total assets |
$ | 3,702 | $ | 1,448 | $ | — | $ | 5,150 | ||||||||
|
|
|
|
|
|
|
|
|
|||||||||
| Liabilities: |
||||||||||||||||
| Redeemable convertible preferred stock warrant liability |
$ | — | $ | — | $ | — | $ | — | ||||||||
| Common stock warrant liability |
— | — | 214 | 214 | ||||||||||||
|
|
|
|
|
|
|
|
|
|||||||||
| Total liabilities |
$ | — | $ | — | $ | 214 | $ | 214 | ||||||||
|
|
|
|
|
|
|
|
|
|||||||||
The following table sets forth a summary of the changes in the estimated fair value of the warrant liabilities, which is measured at fair value on a recurring basis using significant unobservable inputs (Level 3) (in thousands):
| Redeemable Convertible Preferred Stock Warrant Liability |
Common Stock Warrant Liability |
|||||||
| Balance at January 1, 2013 |
$ | 457 | $ | — | ||||
| Recognized expense |
545 | — | ||||||
|
|
|
|
|
|||||
| Balance at December 31, 2013 |
1,002 | — | ||||||
| Warrant issuance |
— | 58 | ||||||
| Recognized expense |
2,437 | 80 | ||||||
|
|
|
|
|
|||||
| Balance at December 31, 2014 |
$ | 3,439 | $ | 138 | ||||
|
|
|
|
|
|||||
| September 30, 2014 (unaudited): |
||||||||
| Balance at January 1, 2014 |
1,002 | — | ||||||
| Warrant issuance |
— | 58 | ||||||
| Recognized expense |
2,151 | 68 | ||||||
|
|
|
|
|
|||||
| Balance at September 30, 2014 |
$ | 3,153 | $ | 126 | ||||
|
|
|
|
|
|||||
| September 30, 2015 (unaudited): |
||||||||
| Balance at January 1, 2015 |
3,439 | 138 | ||||||
| Recognized expense |
460 | 76 | ||||||
| Exercise of warrant |
(3,899 | ) | — | |||||
|
|
|
|
|
|||||
| Balance at September 30, 2015 |
$ | — | $ | 214 | ||||
|
|
|
|
|
|||||
The fair values of these outstanding warrants are measured using an option pricing model and probability weighted expect return model. Inputs used to determine estimated fair value include the estimated fair value of the underlying preferred and common stock at the valuation measurement date, the estimated time to exit, risk-free interest rates, expected dividends, probability of contingent event, and estimated volatility. In addition to the above, significant inputs to the common stock warrant also includes the estimated likelihood of the exercise contingency being met. Estimated volatility is based on the volatility of a peer group. We monitor the historical volatility of peer group companies on a quarterly basis and adjusts the estimated volatility when significant
F-35
Table of Contents
Index to Financial Statements
INSTRUCTURE, INC.
Notes to Consolidated Financial Statements
changes in the peer group volatilities occur. Generally, increases (decreases) in the fair value of the underlying preferred and common stock would result in a directionally similar impact to the fair value measurement.
Fair value is a market-based measurement that should be determined based on the assumptions that market participants would use in pricing an asset or liability. The hierarchy level assigned to each security in our marketable securities portfolio and cash equivalents is based on our assessment of the transparency and reliability of the inputs used in the valuation of such instrument at the measurement date. The fair value of cash equivalents included in the Level 1 category is based on quoted prices that are readily and regularly available in an active market. The fair value of the marketable securities included in the Level 2 category is based on observable inputs, such as quoted prices for similar assets at the measurement date; quoted prices in markets that are not active; or other inputs that are observable, either directly or indirectly. These values were obtained from an independent pricing service and were evaluated using pricing models that vary by asset class and may incorporate available trade, bid and other market information and price quotes from well-established independent pricing vendors and broker-dealers. See Note 4—Intangible Assets for further information regarding the fair value of our investments.
The carrying amount of our cash, receivables, and payables approximates fair value because of the short-term nature of these items.
12. Commitments and Contingencies
Litigation
We are involved in legal proceedings, including challenges to trademarks and employment matters, from time to time arising in the normal course of business. Management believes that the outcome of these proceedings will not have a material impact on our financial position, results of operations, or liquidity.
Lease Commitments
We lease office furniture under capital lease agreements that expire in December 2015. The total outstanding balance financed under capital leases was $494,000, $223,000 and $16,000 at December 31, 2013 and 2014 and September 30, 2015 (unaudited), respectively. Accumulated depreciation on the leased assets was $200,000, $480,000, and $689,000 at December 31, 2013 and 2014 and September 30, 2015 (unaudited), respectively. Depreciation of assets recorded under the capital leases is included in depreciation expense.
We lease office space under non-cancelable operating leases that contain rent escalation clauses and renewal options. We recognize rent expense on a straight-line basis over the lease period and have accrued for rent expense incurred but not paid. During 2013 we entered into a 12 year non-cancellable operating lease for our corporate headquarters that included a lease incentive allowance of $8,088,000 that we could use for either the payment of tenant improvements or rent abatement. We utilized $5,629,000 of the lease incentive allowance for tenant improvements and the remaining $2,459,000 as a rent abatement for the first 13 months of the lease. As part of the lease agreement, we are subject to 3% annual rent escalations.
In order to accommodate current and anticipated future growth, we took occupancy in June 2015 of a leased research and development facility in Chicago, Illinois. The lease for the research and development facility was executed in December 2014 and is a 7.5 year non-cancellable operating lease that included a lease tenant improvement allowance of $494,000. The lease also provided a 50% monthly rent abatement for the first 24 months, or approximately $303,000 in total rent abatement. As part of the lease agreement, we are subject to 2.5% annual rent escalations.
F-36
Table of Contents
Index to Financial Statements
INSTRUCTURE, INC.
Notes to Consolidated Financial Statements
At December 31, 2014, future minimum lease payments under non-cancellable operating and capital leases were as follows (in thousands):
| Year Ended December 31: |
Capital | Operating | Total | |||||||||
| 2015 |
$ | 236 | $ | 4,570 | $ | 4,806 | ||||||
| 2016 |
— | 4,460 | 4,460 | |||||||||
| 2017 |
— | 4,654 | 4,654 | |||||||||
| 2018 |
— | 4,827 | 4,827 | |||||||||
| 2019 |
— | 4,937 | 4,937 | |||||||||
| Thereafter |
— | 26,687 | 26,687 | |||||||||
|
|
|
|
|
|
|
|||||||
| Total |
236 | 50,135 | 50,371 | |||||||||
| Less: Portion representing interest |
(13 | ) | — | (13 | ) | |||||||
|
|
|
|
|
|
|
|||||||
| Capital lease obligation |
$ | 223 | $ | 50,135 | $ | 50,358 | ||||||
|
|
|
|
|
|
|
|||||||
Rent expense under operating leases for 2013 and 2014, was $2,617,000 and $3,317,000, respectively. Rent expense for the nine months ended September 30, 2014 and 2015 (unaudited), was $2,355,000 and $2,949,000, respectively.
On March 31, 2013, we relocated our headquarters to a new office location to accommodate current and future growth and ceased use of the leased property with the intent of entering into sublease arrangements with third-parties to offset future minimum lease payment obligations. Our original lease agreement goes through August 31, 2017. During 2013, we entered into two sublease agreements with third-parties in exchange for escalating monthly rental payments as well as tenant improvement incentives of approximately $250,000 and $126,000. The sublease agreements go through the entire term of the original lease or through August 31, 2017. During 2013, in connection with the exit of the leased office space, we estimated and recorded $79,000 within general and administrative expenses on the statement of comprehensive loss as an estimate of the loss on the exit of the leased property. The loss on the exit of the leased property was estimated by calculating the net present value of future minimum lease payments offset by actual monthly sublease rental income. The difference between the net present value of the net future payments and the actual payments, or approximately $30,000, is being amortized as accretion expense over the remaining lease term within general and administrative expenses on the statement of comprehensive loss. As of December 31, 2014, there is an unamortized short and long term lease loss reserve balance of $31,000 and $51,000 recorded within other assets on the consolidated balance sheet. As of September 30, 2015 (unaudited), there is an unamortized short and long-term lease loss reserve balance of $33,000 and $29,000 recorded within other assets on the consolidated balance sheet.
At December 31, 2014, the net future minimum lease (payments) and sublease rental income to be received under these non-cancellable operating leases are as follows (in thousands):
| Year Ended December 31: |
Payments | Sublease Rental Income |
Total | |||||||||
| 2015 |
$ | (736 | ) | $ | 768 | $ | 32 | |||||
| 2016 |
(758 | ) | 790 | 32 | ||||||||
| 2017 |
(519 | ) | 538 | 19 | ||||||||
| 2018 |
— | — | — | |||||||||
| Thereafter |
— | — | — | |||||||||
|
|
|
|
|
|
|
|||||||
| Total |
$ | (2,013 | ) | $ | 2,096 | $ | 83 | |||||
|
|
|
|
|
|
|
|||||||
F-37
Table of Contents
Index to Financial Statements
INSTRUCTURE, INC.
Notes to Consolidated Financial Statements
13. Employee Benefit Plan
We sponsor a qualified 401(k) defined contribution plan, or the 401(k) Plan, available to all qualified employees. The 401(k) Plan allows employees to contribute gross salary though payroll deductions up to the legally mandated limit based on their jurisdiction. In 2014, we implemented a matching contribution equal to 50% of each participant’s elective contributions, not to exceed $1,000 per participant annually. Participants vest in matching contributions over a four-year period after a one year cliff vest. The cost recognized for our contributions to the 401(k) Plan for 2014 was $296,000. We did not make any contributions for the year ended December 31, 2013. The cost recognized for the nine months ended September 30, 2014 and 2015 (unaudited) was $245,000 and $399,000, respectively.
14. Related-Party Transactions
We incurred $40,000 for consulting services provided by a member of our board of directors during each of 2013 and 2014, and $30,000 for each of the nine months ended September 30, 2014 and 2015 (unaudited). We owed $20,000, $10,000 and $10,000 for such services at December 31, 2013 and 2014 and September 30, 2015 (unaudited), respectively.
We incurred $35,000 for sales and marketing services provided by one of our stockholders for 2013, and owed $0 to such stockholder at December 31, 2013. This agreement was terminated in May 2013.
15. Subsequent Events (Unaudited)
In preparing the consolidated financial statements as of and for the year ended December 31, 2014, we evaluated subsequent events for recognition and measurement purposes through June 24, 2015, the date the independent auditors’ report was originally issued and the audited annual consolidated financial statements were available for issuance. After the original issuance of the consolidated financial statements and through November 9, 2015, we have evaluated subsequent events or transactions that have occurred that may require disclosure in the accompanying financial statements. In October 2015, we granted options to purchase an aggregate of 313,661 shares of common stock with an exercise price of $14.25 per share. Total unrecognized stock-based compensation cost, net of estimated forfeitures, was $2.2 million, which is expected to be recognized over a weighted-average period of approximately four years.
F-38
Table of Contents
Index to Financial Statements

Table of Contents
Index to Financial Statements
PART II
INFORMATION NOT REQUIRED IN PROSPECTUS
Item 13. Other Expenses of Issuance and Distribution.
The following table sets forth all costs and expenses, other than underwriting discounts and commissions, payable by Instructure, Inc. (the “Registrant”) in connection with the sale of the common stock being registered. All amounts shown are estimates except for the Securities and Exchange Commission (“SEC”) registration fee, the Financial Industry Regulatory Authority, Inc. (“FINRA”) filing fee and the New York Stock Exchange initial listing fee.
| Amount | ||||
| SEC registration fee |
$ | 9,172 | ||
| FINRA filing fee |
14,162 | |||
| New York Stock Exchange initial listing fee |
150,000 | |||
| Legal fees and expenses |
1,300,000 | |||
| Accounting fees and expenses |
1,200,000 | |||
| Printing and engraving expenses |
250,000 | |||
| Transfer agent and registrar fees and expenses |
10,000 | |||
| Miscellaneous expenses |
266,666 | |||
|
|
|
|||
| Total |
$ | 3,200,000 | ||
|
|
|
|||
Item 14. Indemnification of Directors and Officers.
Section 145 of the Delaware General Corporation Law authorizes a court to award, or a corporation’s board of directors to grant, indemnity to directors and officers in terms sufficiently broad to permit such indemnification under certain circumstances for liabilities, including reimbursement for expenses incurred, arising under the Securities Act. Our amended and restated certificate of incorporation that will be in effect upon the closing of this offering provides for indemnification of our directors, officers, employees and other agents to the maximum extent permitted by the Delaware General Corporation Law, and our amended and restated bylaws that will be in effect upon the closing of this offering provide for indemnification of our directors, officers, employees and other agents to the maximum extent permitted by the Delaware General Corporation Law.
We have entered into indemnification agreements with our directors and officers, whereby we have agreed to indemnify our directors and officers to the fullest extent permitted by law, including indemnification against expenses and liabilities incurred in legal proceedings to which the director or officer was, or is threatened to be made, a party by reason of the fact that such director or officer is or was a director, officer, employee or agent of Instructure, provided that such director or officer acted in good faith and in a manner that the director or officer reasonably believed to be in, or not opposed to, the best interest of Instructure. At present, there is no pending litigation or proceeding involving a director or officer of Instructure regarding which indemnification is sought, nor is the registrant aware of any threatened litigation that may result in claims for indemnification.
We maintain insurance policies that indemnify our directors and officers against various liabilities arising under the Securities Act and the Securities Exchange Act of 1934, as amended, that might be incurred by any director or officer in his capacity as such.
The underwriters are obligated, under certain circumstances, pursuant to the underwriting agreement to be filed as Exhibit 1.1 hereto, to indemnify us and our officers and directors against liabilities under the Securities Act.
II-1
Table of Contents
Index to Financial Statements
Item 15. Recent Sales of Unregistered Securities.
The following sets forth information regarding all unregistered securities sold since January 1, 2012:
| (1) | In February 2012, we issued an aggregate of 229,886 shares of our Series A preferred stock to six accredited investors at a purchase price of $4.35 per share and 310,077 shares of our common stock to six accredited investors at a purchase price of $3.23 per share, for an aggregate purchase price of $2.0 million. |
| (2) | In August 2012, we issued an aggregate of 1,241,463 shares of our Series C preferred stock to six accredited investors at a per share price of $8.06, for an aggregate purchase price of $10.0 million. |
| (3) | In February 2013, we issued 24,814 shares of our common stock to one accredited investor at a per share price of $6.05, for an aggregate purchase price of $150,000. |
| (4) | In May 2013, we issued an aggregate of 2,515,714 shares of our Series D preferred stock to 13 accredited investors at a per share price of $11.93, for an aggregate purchase price of $30.0 million. |
| (5) | In April 2014, we issued an aggregate of 93,330 shares of our common stock to two accredited investors at a per share price of $4.47, for an aggregate purchase price $417,200, in connection with an asset purchase agreement. |
| (6) | In November 2014, we issued an aggregate of 1,824,732 shares of our Series E preferred stock to nine accredited investors at a per share price of $21.92, for an aggregate purchase price $40.0 million. |
| (7) | In February 2015, we issued 117,646 shares of our Series B preferred stock to one accredited investor upon exercise of an outstanding warrant at a per share exercise price of $1.28, for an aggregate purchase price of $150,000. |
| (8) | In February 2015, we issued 256,383 shares of our Series A preferred stock to one accredited investor upon exercise of an outstanding warrant at a per share exercise price of $0.39, for an aggregate purchase price $100,000. |
| (9) | From January 2012 to November 9, 2015, we have granted stock options under our 2010 Equity Incentive Plan to purchase an aggregate of 5,546,428 shares of common stock with exercise prices ranging between $0.14 and $14.25 per share to a total of 801 employees, directors and consultants. |
| (10) | From January 1, 2012 to November 9, 2015, we issued and sold an aggregate of 3,165,527 shares of common stock upon the exercise of options under our 2010 Equity Incentive Plan at exercise prices ranging between $0.05 and $11.25 per share, for aggregate proceeds of $1,118,847. |
| (11) | From January 2012 to November 9, 2015, we have granted restricted stock awards under our 2010 Equity Incentive Plan of 72,778 shares of common stock at a grant date fair value of $4.47 per share to one consultant and one employee for an aggregate fair value of $325,318. |
The offers, sales and issuances of the securities described in paragraphs 1 through 8 above were exempt from registration under Section 4(a)(2) of the Securities Act (or Regulation D promulgated thereunder) in that the transactions were by an issuer not involving any public offering.
The offers, sales and issuances of the securities described in paragraphs 9 through 11 above were exempt from registration under compensatory benefit plans and contracts relating to compensation as provided under either (a) Rule 701 promulgated under the Securities Act or (b) under Section 4(a)(2) of the Securities Act (or Regulation D promulgated thereunder).
We did not pay or give, directly or indirectly, any commission or other remuneration, including the underwriting discounts and commissions, in connection with any of the issuances of securities listed above. The recipients of the securities in each of these transactions represented their intentions to acquire the securities for investment only and not with a view to or for sale in connection with any distribution thereof, and appropriate legends were placed upon the stock certificates issued in these transactions. All recipients had adequate access,
II-2
Table of Contents
Index to Financial Statements
through their employment or other relationship with us or through other access to information provided by us, to information about us. The sales of these securities were made without any general solicitation or advertising.
Item 16. Exhibits and Financial Statement Schedules.
(a) Exhibits.
The list of exhibits is set forth under “Exhibit Index” at the end of this registration statement and is incorporated herein by reference.
(b) Financial Statement Schedules.
No financial statement schedules are provided because the information called for is not required or is shown either in the financial statements or the notes thereto.
Item 17. Undertakings.
The undersigned Registrant hereby undertakes to provide to the underwriters at the closing specified in the underwriting agreement certificates in such denominations and registered in such names as required by the underwriters to permit prompt delivery to each purchaser.
Insofar as indemnification for liabilities arising under the Securities Act of 1933 may be permitted to directors, officers and controlling persons of the Registrant pursuant to the foregoing provisions, or otherwise, the Registrant has been advised that in the opinion of the Securities and Exchange Commission such indemnification is against public policy as expressed in the Act and is, therefore, unenforceable. In the event that a claim for indemnification against such liabilities (other than the payment by the Registrant of expenses incurred or paid by a director, officer or controlling person of the Registrant in the successful defense of any action, suit or proceeding) is asserted by such director, officer or controlling person in connection with the securities being registered, the Registrant will, unless in the opinion of its counsel the matter has been settled by controlling precedent, submit to a court of appropriate jurisdiction the question whether such indemnification by it is against public policy as expressed in the Act and will be governed by the final adjudication of such issue.
The undersigned Registrant hereby undertakes that:
| (1) | For purposes of determining any liability under the Securities Act of 1933, the information omitted from the form of prospectus filed as part of this registration statement in reliance upon Rule 430A and contained in a form of prospectus filed by the Registrant pursuant to Rule 424(b)(1) or (4) or 497(h) under the Securities Act shall be deemed to be part of this registration statement as of the time it was declared effective. |
| (2) | For the purpose of determining any liability under the Securities Act of 1933, each post-effective amendment that contains a form of prospectus shall be deemed to be a new registration statement relating to the securities offered therein, and the offering of such securities at that time shall be deemed to be the initial bona fide offering thereof. |
| (3) | For the purpose of determining liability of the registrant under the Securities Act of 1933 to any purchaser in the initial distribution of the securities: The undersigned registrant undertakes that in a primary offering of securities of the undersigned registrant pursuant to this registration statement, regardless of the underwriting method used to sell the securities to the purchaser, if the securities are offered or sold to such purchaser by means of any of the following communications, the undersigned registrant will be a seller to the purchaser and will be considered to offer or sell such securities to such purchaser: |
(i) Any preliminary prospectus or prospectus of the undersigned registrant relating to the offering required to be filed pursuant to Rule 424;
II-3
Table of Contents
Index to Financial Statements
(ii) Any free writing prospectus relating to the offering prepared by or on behalf of the undersigned registrant or used or referred to by the undersigned registrant;
(iii) The portion of any other free writing prospectus relating to the offering containing material information about the undersigned registrant or its securities provided by or on behalf of the undersigned registrant; and
(iv) Any other communication that is an offer in the offering made by the undersigned registrant to the purchaser.
| (4) | If the registrant is subject to Rule 430C, each prospectus filed pursuant to Rule 424(b) as part of a registration statement relating to an offering, other than registration statements relying on Rule 430B or other than prospectuses filed in reliance on Rule 430A, shall be deemed to be part of and included in the registration statement as of the date it is first used after effectiveness. Provided, however, that no statement made in a registration statement or prospectus that is part of the registration statement or made in a document incorporated or deemed incorporated by reference into the registration statement or prospectus that is part of the registration statement will, as to a purchaser with a time of contract of sale prior to such first use, supersede or modify any statement that was made in the registration statement or prospectus that was part of the registration statement or made in any such document immediately prior to such date of first use. |
II-4
Table of Contents
Index to Financial Statements
SIGNATURES
Pursuant to the requirements of the Securities Act of 1933, the Registrant has duly caused this Amendment No. 4 to the Registration Statement to be signed on its behalf by the undersigned, thereunto duly authorized, in the City of Salt Lake City, State of Utah, on the 9th day of November, 2015.
| INSTRUCTURE, INC. |
| /s/ Joshua L. Coates |
| Joshua L. Coates |
| Chief Executive Officer |
Pursuant to the requirements of the Securities Act, this Amendment No. 4 to the Registration Statement has been signed by the following persons in the capacities and on the dates indicated.
| SIGNATURE |
TITLE |
DATE | ||
| /s/ Joshua L. Coates Joshua L. Coates |
Chief Executive Officer and Director (Principal Executive Officer) |
November 9, 2015 | ||
| /s/ Steven B. Kaminsky Steven B. Kaminsky |
Chief Financial Officer (Principal Financial and Accounting Officer) |
November 9, 2015 | ||
| * Steven A. Collins |
Director | November 9, 2015 | ||
| * William M. Conroy |
Director | November 9, 2015 | ||
| * Byron B. Deeter |
Director | November 9, 2015 | ||
| * E. Nicholaus Efstratis |
Director | November 9, 2015 | ||
| * Ellen Levy |
Director | November 9, 2015 | ||
| * Adam D. Marcus |
Director | November 9, 2015 | ||
| * Lloyd G. Waterhouse |
Director | November 9, 2015 | ||
| * Brian C. Whitmer |
Director | November 9, 2015 | ||
| *By: | /s/ Matthew A. Kaminer | |
| Matthew A. Kaminer | ||
| Attorney-in-Fact | ||
II-5
Table of Contents
Index to Financial Statements
Exhibit Index
| Exhibit |
Description of Document | |
| 1.1# | Form of Underwriting Agreement. | |
| 3.1# | Amended and Restated Certificate of Incorporation, as currently in effect. | |
| 3.2# | Form of Amended and Restated Certificate of Incorporation to be effective upon the closing of this offering. | |
| 3.3# | Amended and Restated Bylaws, as currently in effect. | |
| 3.4# | Form of Amended and Restated Bylaws to be effective upon the closing of this offering. | |
| 4.1# | Form of Common Stock Certificate. | |
| 5.1# | Opinion of Cooley LLP. | |
| 10.1# | Amended and Restated Investor Rights Agreement, by and among the Registrant and certain of its stockholders, dated November 21, 2014. | |
| 10.2# | Form of Indemnity Agreement by and between the Registrant and its directors and officers. | |
| 10.3+# | 2010 Equity Incentive Plan and Forms of Incentive Stock Option Agreement and Nonqualified Stock Option Agreement. | |
| 10.4+# | 2015 Equity Incentive Plan. | |
| 10.5+# | Form of Stock Option Agreement, Notice of Exercise and Stock Option Grant Notice under the 2015 Equity Incentive Plan. | |
| 10.6+# | Form of Restricted Stock Unit Grant Notice and Restricted Stock Unit Award Agreement under the 2015 Equity Incentive Plan. | |
| 10.7+# | 2015 Employee Stock Purchase Plan. | |
| 10.8+# | Form of Executive Agreement by and between the Registrant and its officers. | |
| 10.9+# | Non-Employee Director Compensation Policy. | |
| 10.10# | Lease Agreement by and between the Registrant and Old Mill Building IV, LLC, dated October 2, 2012. | |
| 10.11# | First Amendment to Lease Agreement by and between the Registrant and Old Mill Building IV, LLC, dated October 30, 2014. | |
| 10.12# | Lease Assumption Agreement by and between the Registrant and Old Mill Building IV, LLC, dated August 11, 2015. | |
| 10.13# | Amended and Restated Loan and Security Agreement by and between the Registrant and Silicon Valley Bank, dated June 15, 2015. | |
| 10.14# | Warrant to Purchase Common Stock issued to Silicon Valley Bank, dated November 14, 2012. | |
| 10.15# | Warrant to Purchase Common Stock issued to Silicon Valley Bank, dated April 1, 2014. | |
| 23.1 | Consent of Ernst & Young LLP, Independent Registered Public Accounting Firm. | |
| 23.2# | Consent of Cooley LLP (reference is made to Exhibit 5.1). | |
| 24.1# | Power of Attorney (see signature page on pages II-5 and II-6 to the original filing of this registration statement on Form S-1). | |
| + | Indicates management contract or compensatory plan. |
| # | Previously filed. |