Attached files
| file | filename |
|---|---|
| EX-32 - EXHIBIT 32 - 180 DEGREE CAPITAL CORP. /NY/ | v424053_ex32.htm |
| EX-31.02 - EXHIBIT 31.02 - 180 DEGREE CAPITAL CORP. /NY/ | v424053_ex31-02.htm |
| EX-31.01 - EXHIBIT 31.01 - 180 DEGREE CAPITAL CORP. /NY/ | v424053_ex31-01.htm |
UNITED STATES
SECURITIES AND EXCHANGE COMMISSION
WASHINGTON, D. C. 20549
Form 10-Q
x QUARTERLY REPORT PURSUANT TO SECTION 13 OR 15(d) OF THE SECURITIES EXCHANGE ACT OF 1934
For the quarterly period ended September 30, 2015
¨ TRANSITION REPORT PURSUANT TO SECTION 13 OR 15(d) OF THE SECURITIES EXCHANGE ACT OF 1934
For the transition period from ____________ to _____________
Commission file number: 0-11576
| HARRIS & HARRIS GROUP, INC. |
| (Exact Name of Registrant as Specified in Its Charter) |
| New York | 13-3119827 | |
| (State or Other Jurisdiction of | (I.R.S. Employer Identification No.) | |
| Incorporation or Organization) |
| 1450 Broadway, New York, New York | 10018 |
| (Address of Principal Executive Offices) | (Zip Code) |
| (212) 582-0900 |
| (Registrant's Telephone Number, Including Area Code) |
Indicate by check mark whether the registrant: (1) has filed all reports required to be filed by Section 13 or 15(d) of the Securities Exchange Act of 1934 during the preceding 12 months (or for such shorter period that the registrant was required to file such reports), and (2) has been subject to such filing requirements for the past 90 days.
Yes x No ¨
Indicate by check mark whether the registrant has submitted electronically and posted on its corporate Web site, if any, every Interactive Data File required to be submitted and posted pursuant to Rule 405 of Regulation S-T during the preceding 12 months (or for such shorter period that the registrant was required to submit and post such files).
Yes ¨ No ¨
Indicate by check mark whether the registrant is a large accelerated filer, an accelerated filer, a non-accelerated filer, or a smaller reporting company. See the definitions of "large accelerated filer," "accelerated filer" and "smaller reporting company" in Rule 12b-2 of the Exchange Act. (Check one):
| Large accelerated filer ¨ | Accelerated filer x | ||
| Non-accelerated filer ¨ | Smaller reporting company ¨ | ||
| (Do not check if a smaller reporting company) | |||
Indicate by check mark whether the registrant is a shell company (as defined in Rule 12b-2 of the Exchange Act).
Yes ¨ No x
Indicate the number of shares outstanding of each of the issuer's classes of common stock, as of the latest practicable date.
| Class | Outstanding at November 9, 2015 |
| Common Stock, $0.01 par value per share | 30,903,501 shares |
Harris & Harris Group, Inc.
Form 10-Q, September 30, 2015
Item 1. Consolidated Financial Statements
In the opinion of management, these financial statements reflect all adjustments, consisting of valuation adjustments and normal recurring accruals, necessary for a fair statement of our financial position, results of operations and cash flows for such periods.
Harris & Harris Group, Inc.® (the "Company," "us," "our" and "we"), is an internally managed, non-diversified management investment company that has elected to operate as a business development company ("BDC") under the Investment Company Act of 1940 (the "1940 Act"). Certain information and disclosures normally included in the consolidated financial statements in accordance with accounting principles generally accepted in the United States of America ("GAAP") have been condensed or omitted as permitted by Regulation S-X and Regulation S-K. Accordingly, they do not include all information and disclosures necessary for a fair presentation of our financial position, results of operations and cash flows in conformity with GAAP. The results of operations for any interim period are not necessarily indicative of the results for the full year. The accompanying consolidated financial statements should be read in conjunction with the audited consolidated financial statements and notes thereto contained in our Annual Report on Form 10-K for the year ended December 31, 2014.
| 1 |
|
CONSOLIDATED STATEMENTS OF ASSETS AND LIABILITIES (Unaudited) |
| September 30, 2015 | December 31, 2014 | |||||||
| ASSETS | ||||||||
| Investments, in portfolio securities at value: | ||||||||
| Unaffiliated privately held companies | ||||||||
| (cost: $19,916,279 and $22,304,047, respectively) | $ | 5,689,722 | $ | 13,854,906 | ||||
| Unaffiliated rights to milestone payments | ||||||||
| (adjusted cost basis: $2,387,278 and $2,387,278, respectively) | 5,058,083 | 3,193,865 | ||||||
| Unaffiliated publicly traded securities | ||||||||
| (cost: $1,623,029 and $1,741,128, respectively) | 1,605,704 | 1,398,085 | ||||||
| Non-controlled affiliated privately held companies | ||||||||
| (cost: $57,473,883 and $67,236,533, respectively) | 45,339,625 | 58,470,864 | ||||||
| Non-controlled affiliated publicly traded companies | ||||||||
| (cost: $11,683,371 and $5,591,299, respectively) | 7,285,825 | 8,384,641 | ||||||
| Controlled affiliated privately held companies | ||||||||
| (cost: $21,879,303 and $13,111,030, respectively) | 6,258,526 | 4,462,479 | ||||||
| Equity method privately held company | ||||||||
| (adjusted cost basis: $228,379 and $0, respectively) | 228,379 | 0 | ||||||
| Total, investments in private portfolio companies, rights to milestone | ||||||||
| payments, public securities at value | ||||||||
| (cost: $115,191,522 and $112,371,315, respectively) | $ | 71,465,864 | $ | 89,764,840 | ||||
| Cash | 21,427,019 | 20,748,314 | ||||||
| Funds held in escrow from sales of investments at value (Note 3) | 374,851 | 306,802 | ||||||
| Receivable from portfolio company | 0 | 160,877 | ||||||
| Interest receivable | 11,020 | 62,482 | ||||||
| Prepaid expenses | 420,654 | 754,856 | ||||||
| Other assets | 458,600 | 296,690 | ||||||
| Total assets | $ | 94,158,008 | $ | 112,094,861 | ||||
| LIABILITIES & NET ASSETS | ||||||||
| Term loan credit facility (Note 5) | $ | 5,000,000 | $ | 0 | ||||
| Post-retirement plan liabilities (Note 8) | 1,307,680 | 1,267,615 | ||||||
| Accounts payable and accrued liabilities | 583,980 | 841,915 | ||||||
| Deferred rent | 292,152 | 330,904 | ||||||
| Total liabilities | $ | 7,183,812 | $ | 2,440,434 | ||||
| Commitments and contingencies (Note 12) | ||||||||
| Net assets | $ | 86,974,196 | $ | 109,654,427 | ||||
| Net assets are comprised of: | ||||||||
| Preferred stock, $0.10 par value, | ||||||||
| 2,000,000 shares authorized; none issued | $ | 0 | $ | 0 | ||||
| Common stock, $0.01 par value, 45,000,000 shares | ||||||||
| authorized at 9/30/15 and 12/31/14; 33,150,425 and | ||||||||
| 33,109,583 shares issued at 9/30/15 and 12/31/14, respectively | 331,504 | 331,096 | ||||||
| Additional paid in capital (Note 9) | 215,621,582 | 215,051,662 | ||||||
| Accumulated net operating and realized loss | (81,671,504 | ) | (80,434,528 | ) | ||||
| Accumulated unrealized depreciation of investments | (43,725,658 | ) | (22,606,475 | ) | ||||
| Accumulated other comprehensive income (Note 8) | 561,465 | 718,203 | ||||||
| Treasury stock, at cost (2,127,559 shares at 9/30/15 and | ||||||||
| 1,828,740 shares at 12/31/14) (Note 13) | (4,143,193 | ) | (3,405,531 | ) | ||||
| Net assets | $ | 86,974,196 | $ | 109,654,427 | ||||
| Shares outstanding | 31,022,866 | 31,280,843 | ||||||
| Net asset value per outstanding share | $ | 2.80 | $ | 3.51 | ||||
The accompanying unaudited notes are an integral part of these consolidated financial statements.
| 2 |
|
CONSOLIDATED STATEMENTS OF OPERATIONS (Unaudited) |
| Three Months Ended Sept. 30, | Nine Months Ended Sept. 30, | |||||||||||||||
| 2015 | 2014 | 2015 | 2014 | |||||||||||||
| Investment income: | ||||||||||||||||
| Interest from: | ||||||||||||||||
| Unaffiliated companies | $ | 6,785 | $ | 21,555 | $ | 27,561 | $ | 108,237 | ||||||||
| Non-controlled affiliated companies | 44,886 | (27,703 | ) | 299,208 | 55,668 | |||||||||||
| Controlled affiliated companies | 72,759 | 40,382 | 164,392 | 111,715 | ||||||||||||
| Cash and U.S. Treasury securities and other | 4,599 | 1,796 | 9,347 | 8,274 | ||||||||||||
| Fees for providing managerial assistance to | ||||||||||||||||
| portfolio companies | 71,359 | 37,500 | 84,859 | 37,500 | ||||||||||||
| Yield-enhancing fees on debt securities | 44,014 | 19,843 | 90,062 | 52,105 | ||||||||||||
| Total investment income | 244,402 | 93,373 | 675,429 | 373,499 | ||||||||||||
| Expenses: | ||||||||||||||||
| Salaries, benefits and stock-based | ||||||||||||||||
| compensation (Note 9) | 955,900 | 1,127,028 | 3,012,078 | 3,786,814 | ||||||||||||
| Administration and operations | 105,120 | 108,908 | 341,214 | 446,348 | ||||||||||||
| Professional fees | 278,654 | 365,557 | 1,165,673 | 962,780 | ||||||||||||
| Rent | 83,308 | 69,389 | 218,772 | 217,480 | ||||||||||||
| Insurance expense | 73,768 | 84,006 | 215,103 | 251,946 | ||||||||||||
| Directors’ fees and expenses | 98,218 | 91,875 | 286,743 | 278,283 | ||||||||||||
| Interest and other debt expense | 209,831 | 94,831 | 561,577 | 282,827 | ||||||||||||
| Custody fees | 15,701 | 16,200 | 47,317 | 45,219 | ||||||||||||
| Depreciation | 11,710 | 13,182 | 36,412 | 39,632 | ||||||||||||
| Total expenses | 1,832,210 | 1,970,976 | 5,884,889 | 6, 311,329 | ||||||||||||
| Net operating loss | (1,587,808 | ) | (1,877,603 | ) | (5,209,460 | ) | (5,937,830 | ) | ||||||||
| Net realized gain (loss): | ||||||||||||||||
| Realized gain (loss) from investments: | ||||||||||||||||
| Unaffiliated companies | (294,797 | ) | 15,475 | 3,005,039 | 3,962,313 | |||||||||||
| Controlled affiliated companies | 1,559,235 | 0 | 1,559,235 | 0 | ||||||||||||
| Unaffiliated rights to milestone payments | 0 | 536,813 | 0 | 536,813 | ||||||||||||
| Non-Controlled affiliated companies | 0 | (4,488,575 | ) | (392,430 | ) | (11,199,638 | ) | |||||||||
| Publicly traded companies | 11,158 | 0 | 52,569 | 1,333,497 | ||||||||||||
| Written call options | 0 | 145,426 | 0 | 232,079 | ||||||||||||
| Realized gain (loss) from investments | 1,275,596 | (3,790,861 | ) | 4,224,413 | (5,134,936 | ) | ||||||||||
| Income tax expense (Note 10) | 376 | 1,676 | 2,081 | 17,662 | ||||||||||||
| Net realized gain (loss) from investments | 1,275,220 | (3,792,537 | ) | 4,222,332 | (5,152,598 | ) | ||||||||||
| Net (increase) decrease in unrealized | ||||||||||||||||
| depreciation on investments: | ||||||||||||||||
| Investments | (16,532,025 | ) | 4,857,214 | (21,119,183 | ) | 8,040,836 | ||||||||||
| Written call options | 0 | (97,926 | ) | 0 | (8,882 | ) | ||||||||||
| Net (increase) decrease in unrealized | ||||||||||||||||
| depreciation on investments | (16,532,025 | ) | 4,759,288 | (21,119,183 | ) | 8,031,954 | ||||||||||
| Net realized and unrealized | ||||||||||||||||
| (loss) gain on investments | (15,256,805 | ) | 966,751 | (16,896,851 | ) | 2,879,356 | ||||||||||
| Share of loss on equity method investment | (60,012 | ) | 0 | (249,848 | ) | 0 | ||||||||||
| Net decrease in net assets | ||||||||||||||||
| resulting from operations: | ||||||||||||||||
| Total | $ | (16,904,625 | ) | $ | (910,852 | ) | $ | (22,356,159 | ) | $ | (3,058,474 | ) | ||||
| Per average basic and diluted outstanding share | $ | (0.54 | ) | $ | (0.03 | ) | $ | (0.71 | ) | $ | (0.10 | ) | ||||
| Average outstanding shares | 31,251,950 | 31, 245,664 | 31,272,790 | 31, 215,069 | ||||||||||||
The accompanying unaudited notes are an integral part of these consolidated financial statements.
| 3 |
|
CONSOLIDATED STATEMENTS OF COMPREHENSIVE LOSS (Unaudited) |
| Three Months Ended Sept. 30, | Nine Months Ended Sept. 30, | |||||||||||||||
| 2015 | 2014 | 2015 | 2014 | |||||||||||||
| Net decrease resulting from operations | $ | (16,904,625 | ) | $ | (910,852 | ) | $ | (22,356,159 | ) | $ | (3,058,474 | ) | ||||
| Other comprehensive income (loss): | ||||||||||||||||
| Amortization of prior service cost | (52,246 | ) | (52,246 | ) | (156,738 | ) | (156,738 | ) | ||||||||
| Other comprehensive loss | (52,246 | ) | (52,246 | ) | (156,738 | ) | (156,738 | ) | ||||||||
| Comprehensive loss | $ | (16,956,871 | ) | $ | (963,098 | ) | $ | (22,512,897 | ) | $ | (3,215,212 | ) | ||||
The accompanying unaudited notes are an integral part of these consolidated financial statements.
| 4 |
|
CONSOLIDATED STATEMENTS OF CASH FLOWS (Unaudited) |
| Nine Months Ended | Nine Months Ended | |||||||
| September 30, 2015 | September 30, 2014 | |||||||
| Cash flows (used in) provided by operating activities: | ||||||||
| Net decrease in net assets resulting from operations | $ | (22,356,159 | ) | $ | (3,058,474 | ) | ||
| Adjustments to reconcile net decrease in net assets resulting from | ||||||||
| operations to net cash (used in) provided by operating activities: | ||||||||
| Net realized loss (gain) and change in unrealized | ||||||||
| depreciation (appreciation) on investments | 16,894,770 | (2,897,018 | ) | |||||
| Depreciation of fixed assets, amortization of prepaid | ||||||||
| assets and accretion of bridge note interest | (381,204 | ) | (145,502 | ) | ||||
| Share of loss on equity method investee | 249,848 | 0 | ||||||
| Stock-based compensation expense | 617,972 | 741,483 | ||||||
| Amortization of prior service cost | (156,738 | ) | (156,738 | ) | ||||
| Purchase of U.S. government securities | 0 | (19,999,044 | ) | |||||
| Sale of U.S. government securities | 0 | 38,998,052 | ||||||
| Purchase of equity method investment | (262,215 | ) | 0 | |||||
| Purchase of affiliated portfolio companies | (6,690,532 | ) | (12,056,559 | ) | ||||
| Purchase of unaffiliated portfolio companies | (509,824 | ) | (240,500 | ) | ||||
| Payments received on debt investments | 783,418 | 865,071 | ||||||
| Proceeds from sale of investments and conversion of bridge notes | 8,183,453 | 10,929,061 | ||||||
| Proceeds from call option premiums | 0 | 338,229 | ||||||
| Payments for put and call option purchases | 0 | (218,352 | ) | |||||
| Changes in assets and liabilities: | ||||||||
| Receivable from portfolio company | 160,877 | 54,160 | ||||||
| Receivable from sales of investments | 0 | 427,466 | ||||||
| Interest receivable | 51,462 | 2,728 | ||||||
| Prepaid expenses | 334,202 | 368,642 | ||||||
| Other assets | (191,891 | ) | (621 | ) | ||||
| Post-retirement plan liabilities | 40,065 | 48,776 | ||||||
| Accounts payable and accrued liabilities | (257,935 | ) | (4,244 | ) | ||||
| Deferred rent | (38,752 | ) | (10,771 | ) | ||||
| Net cash (used in) provided by operating activities | (3,529,183 | ) | 13,985,845 | |||||
| Cash flows from investing activities: | ||||||||
| Purchase of fixed assets | (6,806 | ) | (5,296 | ) | ||||
| Net cash used in investing activities | (6,806 | ) | (5,296 | ) | ||||
| Cash flows from financing activities: | ||||||||
| Proceeds from drawdown of loan facility | 5,000,000 | 0 | ||||||
| Purchase of treasury stock | (737,662 | ) | 0 | |||||
| Payment of withholdings related to net settlement of restricted stock | (47,644 | ) | (68,872 | ) | ||||
| Net cash provided by (used in) financing activities | 4,214,694 | (68,872 | ) | |||||
| Net increase in cash | $ | 678,705 | $ | 13,911,677 | ||||
| Cash at beginning of the period | 20,748,314 | 8,538,548 | ||||||
| Cash at end of the period | $ | 21,427,019 | $ | 22,450,225 | ||||
| Supplemental disclosures of cash flow information: | ||||||||
| Income taxes paid | $ | 2,081 | $ | 17,662 | ||||
The accompanying unaudited notes are an integral part of these consolidated financial statements.
| 5 |
|
CONSOLIDATED STATEMENTS OF CHANGES IN NET ASSETS (Unaudited) |
| Nine Months Ended | Year Ended | |||||||
| September 30, 2015 | December 31, 2014 | |||||||
| Changes in net assets from operations: | ||||||||
| Net operating loss | $ | (5,209,460 | ) | $ | (7,901,727 | ) | ||
| Net realized gain (loss) on investments | 4,222,332 | (5,083,625 | ) | |||||
| Net (increase) in unrealized | ||||||||
| depreciation on investments | (21,119,183 | ) | (576,186 | ) | ||||
| Net (decrease) in unrealized | ||||||||
| appreciation on written call options | 0 | (8,882 | ) | |||||
| Share of loss on equity method investment | (249,848 | ) | 0 | |||||
| Net decrease in net assets | ||||||||
| resulting from operations | (22,356,159 | ) | (13,570,420 | ) | ||||
| Changes in net assets from | ||||||||
| capital stock transactions: | ||||||||
| Purchase of treasury stock | (737,662 | ) | 0 | |||||
| Acquisition of vested restricted stock awards | ||||||||
| to pay required employee withholding tax | (47,644 | ) | (124,751 | ) | ||||
| Stock-based compensation expense | 617,972 | 857,006 | ||||||
| Net (decrease) increase in net assets resulting | ||||||||
| from capital stock transactions | (167,334 | ) | 732,255 | |||||
| Changes in net assets from accumulated | ||||||||
| other comprehensive (loss) income: | ||||||||
| Other comprehensive (loss) | (156,738 | ) | (208,983 | ) | ||||
| Net (decrease) in net assets resulting from | ||||||||
| accumulated other comprehensive (loss) income | (156,738 | ) | (208,983 | ) | ||||
| Net decrease in net assets | (22,680,231 | ) | (13,047,148 | ) | ||||
| Net Assets: | ||||||||
| Beginning of the period | 109,654,427 | 122,701,575 | ||||||
| End of the period | $ | 86,974,196 | $ | 109,654,427 | ||||
The accompanying unaudited notes are an integral part of these consolidated financial statements.
| 6 |
|
CONSOLIDATED SCHEDULE OF INVESTMENTS AS OF SEPTEMBER 30, 2015 (Unaudited) |
| Method of | Primary | Shares/ | ||||||||||||||
| Valuation (1) | Industry (2) | Cost | Principal | Value | ||||||||||||
| Investments in Unaffiliated Companies (3) – | ||||||||||||||||
| 14.2% of net assets at value | ||||||||||||||||
| Private Placement Portfolio (Illiquid) (4) – | ||||||||||||||||
| 6.5% of net assets at value | ||||||||||||||||
| Bridgelux, Inc. (5)(8)(9)(10) | Energy | |||||||||||||||
| Manufacturing high-power light emitting | ||||||||||||||||
| diodes (LEDs) and arrays | ||||||||||||||||
| Series B Convertible Preferred Stock | (M) | $ | 1,000,000 | 1,861,504 | $ | 259,350 | ||||||||||
| Series C Convertible Preferred Stock | (M) | 1,352,196 | 2,130,699 | 535,587 | ||||||||||||
| Series D Convertible Preferred Stock | (M) | 1,371,622 | 999,999 | 738,177 | ||||||||||||
| Series E Convertible Preferred Stock | (M) | 672,599 | 440,334 | 608,537 | ||||||||||||
| Series E-1 Convertible Preferred Stock | (M) | 386,073 | 399,579 | 401,267 | ||||||||||||
| Warrants for Series E Convertible Preferred | ||||||||||||||||
| Stock expiring 12/31/17 | (M) | 93,969 | 170,823 | 0 | ||||||||||||
| Warrants for Common Stock expiring 6/1/16 | (M) | 72,668 | 132,100 | 0 | ||||||||||||
| Warrants for Common Stock expiring 8/9/18 | (M) | 148,409 | 171,183 | 0 | ||||||||||||
| Warrants for Common Stock expiring 10/21/18 | (M) | 18,816 | 84,846 | 0 | ||||||||||||
| 5,116,352 | 2,542,918 | |||||||||||||||
| Cambrios Technologies Corporation (5)(8)(9) | Electronics | |||||||||||||||
| Developing nanowire-enabled electronic | ||||||||||||||||
| materials for the display industry | ||||||||||||||||
| Series B Convertible Preferred Stock | ( I ) | 1,294,025 | 1,294,025 | 9,176 | ||||||||||||
| Series C Convertible Preferred Stock | ( I ) | 1,300,000 | 1,300,000 | 9,218 | ||||||||||||
| Series D Convertible Preferred Stock | ( I ) | 515,756 | 515,756 | 192,940 | ||||||||||||
| Series D-2 Convertible Preferred Stock | ( I ) | 92,400 | 92,400 | 17,338 | ||||||||||||
| Series D-4 Convertible Preferred Stock | ( I ) | 216,168 | 216,168 | 40,563 | ||||||||||||
| 3,418,349 | 269,235 | |||||||||||||||
| Cobalt Technologies, Inc. (8)(9)(11) | Energy | |||||||||||||||
| Developed processes for making bio- | ||||||||||||||||
| butanol through biomass fermentation | ||||||||||||||||
| Series C-1 Convertible Preferred Stock | (M) | 749,998 | 352,112 | 0 | ||||||||||||
| Series D-1 Convertible Preferred Stock | (M) | 122,070 | 48,828 | 0 | ||||||||||||
| Series E-1 Convertible Preferred Stock | (M) | 114,938 | 46,089 | 0 | ||||||||||||
| Warrants for Series E-1 Pref. Stock expiring on 10/9/22 | ( I ) | 2,781 | 1,407 | 0 | ||||||||||||
| Warrants for Series E-1 Pref. Stock expiring on 3/11/23 | ( I ) | 5,355 | 2,707 | 0 | ||||||||||||
| 995,142 | 0 | |||||||||||||||
| Magic Leap, Inc. (8)(9)(12) | Electronics | |||||||||||||||
| Developing novel human computing | ||||||||||||||||
| interfaces and software | ||||||||||||||||
| Series B Convertible Preferred Stock | ( I ) | 338,604 | 29,291 | 323,677 | ||||||||||||
The accompanying unaudited notes are an integral part of these consolidated financial statements.
| 7 |
|
HARRIS & HARRIS GROUP, INC. CONSOLIDATED SCHEDULE OF INVESTMENTS AS OF SEPTEMBER 30, 2015 (Unaudited) |
| Method of | Primary | Shares/ | ||||||||||||||
| Valuation (1) | Industry (2) | Cost | Principal | Value | ||||||||||||
| Investments in Unaffiliated Companies (3) – | ||||||||||||||||
| 14.2% of net assets at value (Cont.) | ||||||||||||||||
| Private Placement Portfolio (Illiquid) (4) – | ||||||||||||||||
| 6.5% of net assets at value (Cont.) | ||||||||||||||||
| Mersana Therapeutics, Inc. (5)(8)(9) | Life Sciences | |||||||||||||||
| Developing antibody drug conjugates | ||||||||||||||||
| for cancer therapy | ||||||||||||||||
| Series A-1 Convertible Preferred Stock | (H) | $ | 683,538 | 635,081 | $ | 557,075 | ||||||||||
| Series B-1 Convertible Preferred Stock | (H) | 104,521 | 97,111 | 106,820 | ||||||||||||
| Common Stock | (H) | 3,875,395 | 350,539 | 243,483 | ||||||||||||
| 4,663,454 | 907,378 | |||||||||||||||
| Nanosys, Inc. (5)(8) | Energy | |||||||||||||||
| Developing inorganic nanowires and | ||||||||||||||||
| quantum dots for use in LED-backlit devices | ||||||||||||||||
| Series C Convertible Preferred Stock | (M) | 1,500,000 | 803,428 | 141,754 | ||||||||||||
| Series D Convertible Preferred Stock | (M) | 3,000,003 | 1,016,950 | 652,762 | ||||||||||||
| Series E Convertible Preferred Stock | (M) | 496,573 | 433,688 | 471,530 | ||||||||||||
| 4,996,576 | 1,266,046 | |||||||||||||||
| Nano Terra, Inc. (5) | Energy | |||||||||||||||
| Developing surface chemistry and nano- | ||||||||||||||||
| manufacturing solutions | ||||||||||||||||
| Senior secured debt, 12.0%, maturing on 12/1/15 | ( I ) | 66,548 | $ | 101,951 | 100,975 | |||||||||||
| Warrants for Common Stock expiring on 2/22/21 | ( I ) | 69,168 | 4,462 | 1,148 | ||||||||||||
| Warrants for Series A-3 Pref. Stock expiring on 11/15/22 | ( I ) | 35,403 | 47,508 | 61,662 | ||||||||||||
| 171,119 | 163,785 | |||||||||||||||
| Phylagen, Inc. (5)(8)(13) | Life Sciences | |||||||||||||||
| Developing technology to improve human | ||||||||||||||||
| health and productivity | ||||||||||||||||
| Secured Convertible Bridge Note, 5%, acquired 2/5/15 | (M) | 206,521 | $ | 200,000 | 206,521 | |||||||||||
| Secured Convertible Bridge Note, 5%, acquired 6/5/15 | (M) | 10,162 | $ | 10,000 | 10,162 | |||||||||||
| 216,683 | 216,683 | |||||||||||||||
| Total Unaffiliated Private Placement Portfolio (cost: $19,916,279) | $ | 5,689,722 | ||||||||||||||
The accompanying unaudited notes are an integral part of these consolidated financial statements.
| 8 |
|
HARRIS & HARRIS GROUP, INC. CONSOLIDATED SCHEDULE OF INVESTMENTS AS OF SEPTEMBER 30, 2015 (Unaudited) |
| Method of | Primary | Shares/ | ||||||||||||||
| Valuation (1) | Industry (2) | Cost | Principal | Value | ||||||||||||
| Rights to Milestone Payments (Illiquid) (6) – 5.8% of net assets at value | ||||||||||||||||
| Amgen, Inc. (8)(9) | Life Sciences | |||||||||||||||
| Rights to Milestone Payments from | ||||||||||||||||
| Acquisition of BioVex Group, Inc. | ( I ) | $ | 1,757,608 | $ | 1,757,608 | $ | 3,794,540 | |||||||||
| Laird Technologies, Inc. (8)(9) | Energy | |||||||||||||||
| Rights to Milestone Payments from Merger & | ||||||||||||||||
| Acquisition of Nextreme Thermal Solutions, Inc. | ( I ) | 0 | $ | 0 | 0 | |||||||||||
| Canon, Inc. (8)(9)(14) | Electronics | |||||||||||||||
| Rights to Milestone Payments from | ||||||||||||||||
| Acquisition of Molecular Imprints, Inc. | ( I ) | 629,670 | $ | 629,670 | 1,263,543 | |||||||||||
| Total Unaffiliated Rights to Milestone Payments (cost: $2,387,278) | $ | 5,058,083 | ||||||||||||||
| Publicly Traded Portfolio (7) – 1.9% of net assets at value | ||||||||||||||||
| Champions Oncology, Inc. (5)(9) | Life Sciences | |||||||||||||||
| Developing its TumorGraftTM platform for | ||||||||||||||||
| personalized medicine and drug development | ||||||||||||||||
| Common Stock | (M) | $ | 1,622,629 | 2,922,492 | $ | 1,579,284 | ||||||||||
| Warrants for Common Stock expiring 1/28/19 | ( I ) | 400 | 66,000 | 26,420 | ||||||||||||
| 1,623,029 | 1,605,704 | |||||||||||||||
| Total Unaffiliated Publicly Traded Portfolio (cost: $1,623,029) | $ | 1,605,704 | ||||||||||||||
| Total Investments in Unaffiliated Companies (cost: $23,926,586) | $ | 12,353,509 | ||||||||||||||
The accompanying unaudited notes are an integral part of these consolidated financial statements.
| 9 |
|
HARRIS & HARRIS GROUP, INC. CONSOLIDATED SCHEDULE OF INVESTMENTS AS OF SEPTEMBER 30, 2015 (Unaudited) |
| Method of | Primary | Shares/ | ||||||||||||||
| Valuation (1) | Industry (2) | Cost | Principal | Value | ||||||||||||
| Investments in Non-Controlled | ||||||||||||||||
| Affiliated Companies (3) – | ||||||||||||||||
| 60.5% of net assets at value | ||||||||||||||||
| Private Placement Portfolio (Illiquid) (15) – 52.1% of net assets at value | ||||||||||||||||
| ABSMaterials, Inc. (5)(8)(9) | Energy | |||||||||||||||
| Developing nano-structured absorbent materials | ||||||||||||||||
| for water remediation and consumer applications | ||||||||||||||||
| Series A Convertible Preferred Stock | ( I ) | $ | 435,000 | 390,000 | $ | 306,779 | ||||||||||
| Series B Convertible Preferred Stock | ( I ) | 1,217,644 | 1,037,751 | 1,248,058 | ||||||||||||
| 1,652,644 | 1,554,837 | |||||||||||||||
| Adesto Technologies Corporation (5)(8)(9)(16) | Electronics | |||||||||||||||
| Developing low-power, high-performance | ||||||||||||||||
| memory devices | ||||||||||||||||
| Series A Convertible Preferred Stock | (M) | 2,200,000 | 6,547,619 | 928,895 | ||||||||||||
| Series B Convertible Preferred Stock | (M) | 2,200,000 | 5,952,381 | 844,450 | ||||||||||||
| Series C Convertible Preferred Stock | (M) | 1,485,531 | 2,122,187 | 301,070 | ||||||||||||
| Series D Convertible Preferred Stock | (M) | 1,393,147 | 1,466,470 | 214,922 | ||||||||||||
| Series D-1 Convertible Preferred Stock | (M) | 703,740 | 987,706 | 140,124 | ||||||||||||
| Series E Convertible Preferred Stock | (M) | 2,499,999 | 3,508,771 | 4,920,118 | ||||||||||||
| 10,482,417 | 7,349,579 | |||||||||||||||
| AgBiome, LLC (5)(8)(9) | Life Sciences | |||||||||||||||
| Providing early-stage research and discovery for | ||||||||||||||||
| agriculture and utilizing the crop microbiome to | ||||||||||||||||
| identify products that reduce risk and improve yield | ||||||||||||||||
| Series A-1 Convertible Preferred Stock | ( I ) | 2,000,000 | 2,000,000 | 4,035,554 | ||||||||||||
| Series A-2 Convertible Preferred Stock | ( I ) | 521,740 | 417,392 | 896,459 | ||||||||||||
| Series B Convertible Preferred Stock | ( I ) | 500,006 | 160,526 | 574,333 | ||||||||||||
| 3,021,746 | 5,506,346 | |||||||||||||||
| D-Wave Systems, Inc. (8)(9)(17) | Electronics | |||||||||||||||
| Developing high-performance | ||||||||||||||||
| quantum computing systems | ||||||||||||||||
| Series 1 Class B Convertible Preferred Stock | (H) | 1,002,074 | 1,144,869 | 1,535,674 | ||||||||||||
| Series 1 Class C Convertible Preferred Stock | (H) | 487,804 | 450,450 | 608,449 | ||||||||||||
| Series 1 Class D Convertible Preferred Stock | (H) | 748,473 | 855,131 | 1,155,075 | ||||||||||||
| Series 1 Class E Convertible Preferred Stock | (H) | 248,049 | 269,280 | 380,372 | ||||||||||||
| Series 1 Class F Convertible Preferred Stock | (H) | 238,323 | 258,721 | 365,457 | ||||||||||||
| Series 1 Class H Convertible Preferred Stock | (H) | 909,088 | 460,866 | 758,165 | ||||||||||||
| Series 2 Class D Convertible Preferred Stock | (H) | 736,019 | 678,264 | 916,171 | ||||||||||||
| Series 2 Class E Convertible Preferred Stock | (H) | 659,493 | 513,900 | 734,858 | ||||||||||||
| Series 2 Class F Convertible Preferred Stock | (H) | 633,631 | 493,747 | 706,040 | ||||||||||||
| Warrants for Common Stock expiring 5/12/19 | ( I ) | 26,357 | 20,415 | 819 | ||||||||||||
| 5,689,311 | 7,161,080 | |||||||||||||||
The accompanying unaudited notes are an integral part of these consolidated financial statements.
| 10 |
|
HARRIS & HARRIS GROUP, INC. CONSOLIDATED SCHEDULE OF INVESTMENTS AS OF SEPTEMBER 30, 2015 (Unaudited) |
| Method of | Primary | Shares/ | ||||||||||||||
| Valuation (1) | Industry (2) | Cost | Principal | Value | ||||||||||||
| Investments in Non-Controlled | ||||||||||||||||
| Affiliated Companies (3) – 60.5% of net assets at value (Cont.) | ||||||||||||||||
| Private Placement Portfolio (Illiquid) (15) – 52.1% of net assets at value (Cont.) | ||||||||||||||||
| EchoPixel, Inc. (5)(8)(9) | Life Sciences | |||||||||||||||
| Developing algorithms and software to improve | ||||||||||||||||
| visualization of data for life science and | ||||||||||||||||
| healthcare applications | ||||||||||||||||
| Series Seed Convertible Preferred Stock | ( I ) | $ | 1,250,000 | 4,194,630 | $ | 1,348,754 | ||||||||||
| Ensemble Therapeutics Corporation (5)(8)(9) | Life Sciences | |||||||||||||||
| Developing DNA-Programmed ChemistryTM | ||||||||||||||||
| for the discovery of new classes of therapeutics | ||||||||||||||||
| Series B Convertible Preferred Stock | ( I ) | 2,000,000 | 1,449,275 | 752,423 | ||||||||||||
| Series B-1 Convertible Preferred Stock | ( I ) | 679,754 | 492,575 | 1,461,514 | ||||||||||||
| 2,679,754 | 2,213,937 | |||||||||||||||
| HZO, Inc. (5)(8)(9) | Electronics | |||||||||||||||
| Developing novel industrial coatings that | ||||||||||||||||
| protect electronics against damage from liquids | ||||||||||||||||
| Common Stock | ( I ) | 666,667 | 405,729 | 318,269 | ||||||||||||
| Series I Convertible Preferred Stock | ( I ) | 5,709,835 | 2,266,894 | 4,181,907 | ||||||||||||
| Series II Convertible Preferred Stock | ( I ) | 2,500,006 | 674,638 | 2,503,470 | ||||||||||||
| 8,876,508 | 7,003,646 | |||||||||||||||
| Laser Light Engines, Inc. (8)(9) | Energy | |||||||||||||||
| Manufactured solid-state light sources for | ||||||||||||||||
| digital cinema and large-venue projection displays | ||||||||||||||||
| Series A Convertible Preferred Stock | (M) | 2,000,000 | 7,499,062 | 0 | ||||||||||||
| Series B Convertible Preferred Stock | (M) | 3,095,802 | 13,571,848 | 0 | ||||||||||||
| Secured Convertible Bridge Note, 12%, acquired 10/7/11 | (M) | 200,000 | $ | 200,000 | 0 | |||||||||||
| Secured Convertible Bridge Note, 12%, acquired 11/17/11 | (M) | 95,652 | $ | 95,652 | 0 | |||||||||||
| Secured Convertible Bridge Note, 12%, acquired 12/21/11 | (M) | 82,609 | $ | 82,609 | 0 | |||||||||||
| Secured Convertible Bridge Note, 12%, acquired 3/5/12 | (M) | 434,784 | $ | 434,784 | 0 | |||||||||||
| Secured Convertible Bridge Note, 12%, acquired 7/26/12 | (M) | 186,955 | $ | 186,955 | 0 | |||||||||||
| Secured Convertible Bridge Note, 20%, acquired 4/29/13 | (M) | 166,667 | $ | 166,667 | 0 | |||||||||||
| Secured Convertible Bridge Note, 20%, acquired 7/22/13 | (M) | 166,667 | $ | 166,667 | 0 | |||||||||||
| Secured Convertible Bridge Note, 10%, acquired 10/30/13 | (M) | 80,669 | $ | 80,669 | 0 | |||||||||||
| Secured Convertible Bridge Note, 10%, acquired 2/5/14 | (M) | 19,331 | $ | 19,331 | 0 | |||||||||||
| Secured Convertible Bridge Note, 10%, acquired 6/24/14 | (M) | 13,745 | $ | 13,745 | 0 | |||||||||||
| 6,542,881 | 0 | |||||||||||||||
The accompanying unaudited notes are an integral part of these consolidated financial statements.
| 11 |
|
HARRIS & HARRIS GROUP, INC. CONSOLIDATED SCHEDULE OF INVESTMENTS AS OF SEPTEMBER 30, 2015 (Unaudited) |
| Method of | Primary | Shares/ | ||||||||||||||
| Valuation (1) | Industry (2) | Cost | Principal | Value | ||||||||||||
| Investments in Non-Controlled | ||||||||||||||||
| Affiliated Companies (3) – 60.5% of net assets at value (Cont.) | ||||||||||||||||
| Private Placement Portfolio (Illiquid) (15) – 52.1% of net assets at value (Cont.) | ||||||||||||||||
| Metabolon, Inc. (5)(8)(9) | Life Sciences | |||||||||||||||
| Developing a biochemical profiling | ||||||||||||||||
| platform for precision medicine | ||||||||||||||||
| Series B Convertible Preferred Stock | (M) | $ | 2,500,000 | 371,739 | $ | 2,594,442 | ||||||||||
| Series B-1 Convertible Preferred Stock | (M) | 706,214 | 148,696 | 1,082,077 | ||||||||||||
| Series C Convertible Preferred Stock | (M) | 1,000,000 | 1,000,000 | 2,360,805 | ||||||||||||
| Series D Convertible Preferred Stock | (M) | 1,499,999 | 835,882 | 1,990,454 | ||||||||||||
| Series E-1 Convertible Preferred Stock | (M) | 1,225,000 | 444,404 | 1,402,598 | ||||||||||||
| Series E-2 Convertible Preferred Stock | (M) | 299,999 | 103,277 | 300,234 | ||||||||||||
| 7,231,212 | 9,730,610 | |||||||||||||||
| ORIG3N, Inc. (5)(8)(9)(13) | Life Sciences | |||||||||||||||
| Developing precision medicine applications | ||||||||||||||||
| for induced pluripotent stems cells | ||||||||||||||||
| Series 1 Convertible Preferred Stock | ( I ) | 500,000 | 1,195,315 | 505,938 | ||||||||||||
| Produced Water Absorbents, Inc. (5)(8)(18) | Energy | |||||||||||||||
| Developing nano-structured absorbent materials | ||||||||||||||||
| for environmental remediation of contaminated | ||||||||||||||||
| water in the oil and gas industries | ||||||||||||||||
| Series A Convertible Preferred Stock | (M) | 1,000,000 | 1,000,000 | 2,704 | ||||||||||||
| Series B Convertible Preferred Stock | (M) | 1,496,865 | 5,987,460 | 364,117 | ||||||||||||
| Series B-2 Convertible Preferred Stock | (M) | 1,015,427 | 4,322,709 | 262,878 | ||||||||||||
| Series B-3 Convertible Preferred Stock | (M) | 978,641 | 3,914,564 | 238,057 | ||||||||||||
| Series C Convertible Preferred Stock | (M) | 1,000,268 | 2,667,380 | 121,750 | ||||||||||||
| Series D Convertible Preferred Stock | (M) | 986,066 | 2,629,510 | 239,682 | ||||||||||||
| Subordinated Secured Debt, 12%, maturing on 12/31/15 | ( I ) | 993,417 | $ | 1,000,000 | 968,050 | |||||||||||
| Subordinated Convertible Bridge Note, 12%, acquired 6/3/2015 | (M) | 259,863 | $ | 250,000 | 259,863 | |||||||||||
| Subordinated Convertible Bridge Note, 12%, acquired 7/15/2015 | (M) | 256,411 | $ | 250,000 | 256,411 | |||||||||||
| Subordinated Convertible Bridge Note, 12%, acquired 9/28/2015 | (M) | 250,247 | $ | 250,000 | 250,247 | |||||||||||
| Warrants for Series B-2 Preferred Stock expiring upon liquidation event | ( I ) | 65,250 | 300,000 | 1,139 | ||||||||||||
| 8,302,455 | 2,964,898 | |||||||||||||||
The accompanying unaudited notes are an integral part of these consolidated financial statements.
| 12 |
|
HARRIS & HARRIS GROUP, INC. CONSOLIDATED SCHEDULE OF INVESTMENTS AS OF SEPTEMBER 30, 2015 (Unaudited) |
| Method of | Primary | Shares/ | ||||||||||||||
| Valuation (1) | Industry (2) | Cost | Principal | Value | ||||||||||||
| Investments in Non-Controlled | ||||||||||||||||
| Affiliated Companies (3) – 60.5% of net assets at value (Cont.) | ||||||||||||||||
| Private Placement Portfolio (Illiquid) (15) – 52.1% of net assets at value (Cont.) | ||||||||||||||||
| Ultora, Inc. (5)(8) | Energy | |||||||||||||||
Developed energy-storage
devices | ||||||||||||||||
| Series A Convertible Preferred Stock | (M) | $ | 886,830 | 17,736 | $ | 0 | ||||||||||
| Series B Convertible Preferred Stock | (M) | 236,603 | 2,347,254 | 0 | ||||||||||||
| Secured Convertible Bridge Note, 5%, acquired 5/7/14 | (M) | 86,039 | $ | 86,039 | 0 | |||||||||||
| Secured Convertible Bridge Note, 5%, acquired 8/20/14 | (M) | 17,208 | $ | 17,208 | 0 | |||||||||||
| Secured Convertible Bridge Note, 5%, acquired 10/14/14 | (M) | 10,750 | $ | 10,750 | 0 | |||||||||||
| Secured Convertible Bridge Note, 5%, acquired 3/30/15 | (M) | 7,525 | $ | 7,525 | 0 | |||||||||||
| 1,244,955 | 0 | |||||||||||||||
| Total Non-Controlled Private Placement Portfolio (cost: $57,473,883) | $ | 45,339,625 | ||||||||||||||
| Publicly Traded Portfolio (19) – 8.4% of net assets at value | ||||||||||||||||
| Enumeral Biomedical Holdings, Inc. (5)(9)(20) | Life Sciences | |||||||||||||||
| Developing therapeutics and diagnostics through functional assaying of single cells | ||||||||||||||||
| Common Stock | (M) | $ | 4,993,357 | 7,966,368 | $ | 3,160,681 | ||||||||||
| Warrants for Common Stock expiring 7/30/19 | ( I ) | 540,375 | 1,500,000 | 195,549 | ||||||||||||
| Warrants for Common Stock expiring 2/2/24 | ( I ) | 57,567 | 255,120 | 87,482 | ||||||||||||
| Options to Purchase Common Stock at $1.00 expiring 7/30/16 | ( I ) | 0 | 80,000 | 1,875 | ||||||||||||
| 5,591,299 | 3,445,587 | |||||||||||||||
| OpGen, Inc. (5)(8)(21) | Life Sciences | |||||||||||||||
| Developing tools for genomic sequence assembly and analysis | ||||||||||||||||
| Common Stock | (M) | 5,665,708 | 1,409,796 | 3,637,274 | ||||||||||||
| Warrants for Common Stock expiring 5/8/20 | (M) | 425,579 | 300,833 | 174,032 | ||||||||||||
| Warrants for Common Stock expiring 2/17/25 | ( I ) | 785 | 31,206 | 28,932 | ||||||||||||
| 6,092,072 | 3,840,238 | |||||||||||||||
| Total Non-Controlled Publicly Traded Portfolio (cost: $11,683,371) | $ | 7,285,825 | ||||||||||||||
| Total Investments in Non-Controlled Affiliated Companies (cost: $69,157,254) | $ | 52,625,450 | ||||||||||||||
The accompanying unaudited notes are an integral part of these consolidated financial statements.
| 13 |
|
HARRIS & HARRIS GROUP, INC. CONSOLIDATED SCHEDULE OF INVESTMENTS AS OF SEPTEMBER 30, 2015 (Unaudited) |
| Method of | Primary | Shares/ | ||||||||||||||
| Valuation (1) | Industry (2) | Cost | Principal | Value | ||||||||||||
| Investments in Controlled | ||||||||||||||||
| Affiliated Companies (3) – 7.2% of net assets at value | ||||||||||||||||
| Private Placement Portfolio (Illiquid) (22) – 7.2% of net assets at value | ||||||||||||||||
| Black Silicon Holdings, Inc. (5)(8)(23) | Electronics | |||||||||||||||
| Developing silicon-based optoelectronic | ||||||||||||||||
| products enabled by its proprietary Black Silicon | ||||||||||||||||
| Series A Convertible Preferred Stock | ( I ) | $ | 750,000 | 233,499 | $ | 0 | ||||||||||
| Series A-1 Convertible Preferred Stock | ( I ) | 890,000 | 2,966,667 | 0 | ||||||||||||
| Series A-2 Convertible Preferred Stock | ( I ) | 2,445,000 | 4,207,537 | 0 | ||||||||||||
| Series B-1 Convertible Preferred Stock | ( I ) | 1,169,561 | 1,892,836 | 0 | ||||||||||||
| Series C Convertible Preferred Stock | ( I ) | 1,171,316 | 1,674,030 | 0 | ||||||||||||
| Secured Convertible Bridge Note, 8%, acquired 8/4/15 | ( I ) | 1,294,931 | $ | 1,278,454 | 318,738 | |||||||||||
| 7,720,808 | 318,738 | |||||||||||||||
| NGX Bio, Inc. (5)(8)(9)(24) | Life Sciences | |||||||||||||||
| Developing translational genomics solutions | ||||||||||||||||
| Series Seed Convertible Preferred Stock | ( I ) | 375,000 | 500,000 | 585,214 | ||||||||||||
| Series A Convertible Preferred Stock | ( I ) | 499,999 | 329,989 | 504,882 | ||||||||||||
| Warrants for Series Seed Preferred Stock expiring 6/6/19 | ( I ) | 125,000 | 166,667 | 195,070 | ||||||||||||
| 999,999 | 1,285,166 | |||||||||||||||
| ProMuc, Inc. (5)(8) | Life Sciences | |||||||||||||||
| Developing synthetic mucins for the | ||||||||||||||||
| nutritional, food and healthcare markets | ||||||||||||||||
| Common Stock | (M) | 1 | 1,000 | 1 | ||||||||||||
| Secured Convertible Bridge Note, 8%, acquired 12/18/13 | (M) | 400,016 | $ | 350,000 | 400,016 | |||||||||||
| Secured Convertible Bridge Note, 8%, acquired 8/13/14 | (M) | 109,074 | $ | 100,000 | 109,074 | |||||||||||
| Secured Convertible Bridge Note, 8%, acquired 8/5/15 | (M) | 75,937 | $ | 75,000 | 75,937 | |||||||||||
| 585,028 | 585,028 | |||||||||||||||
| Senova Systems, Inc. (5)(8) | Life Sciences | |||||||||||||||
| Developing next-generation sensors to measure pH | ||||||||||||||||
| Series B Convertible Preferred Stock | ( I ) | 1,218,462 | 1,350,000 | 465,021 | ||||||||||||
| Series B-1 Convertible Preferred Stock | ( I ) | 1,083,960 | 2,759,902 | 879,999 | ||||||||||||
| Series C Convertible Preferred Stock | ( I ) | 1,208,287 | 1,611,049 | 1,210,089 | ||||||||||||
| Warrants for Series B Preferred Stock expiring 10/15/17 | ( I ) | 131,538 | 164,423 | 56,637 | ||||||||||||
| Warrants for Series B Preferred Stock expiring 4/24/18 | ( I ) | 20,000 | 25,000 | 8,611 | ||||||||||||
| 3,662,247 | 2,620,357 | |||||||||||||||
The accompanying unaudited notes are an integral part of these consolidated financial statements.
| 14 |
|
HARRIS & HARRIS GROUP, INC. CONSOLIDATED SCHEDULE OF INVESTMENTS AS OF SEPTEMBER 30, 2015 (Unaudited) |
| Method of | Primary | Shares/ | ||||||||||||||
| Valuation (1) | Industry (2) | Cost | Principal | Value | ||||||||||||
| Investments in Controlled | ||||||||||||||||
| Affiliated Companies (3) – 7.2% of net assets at value (Cont.) | ||||||||||||||||
| Private Placement Portfolio (Illiquid) (22) – 7.2% of net assets at value (Cont.) | ||||||||||||||||
| SynGlyco, Inc. (5)(8) | Life Sciences | |||||||||||||||
| Developed synthetic carbohydrates for | ||||||||||||||||
| pharmaceutical applications | ||||||||||||||||
| Common Stock | ( I ) | $ | 2,729,817 | 57,463 | $ | 0 | ||||||||||
| Series A' Convertible Preferred Stock | ( I ) | 4,855,627 | 4,855,627 | 123,460 | ||||||||||||
| Secured Convertible Bridge Note, 8%, acquired 1/23/13 | ( I ) | 430,699 | $ | 350,000 | 430,699 | |||||||||||
| Secured Convertible Bridge Note, 8%, acquired 4/25/13 | ( I ) | 362,114 | $ | 300,000 | 362,114 | |||||||||||
| 8,378,257 | 916,273 | |||||||||||||||
| TARA Biosystems, Inc. (5)(8) | Life Sciences | |||||||||||||||
| Developing human tissue models for toxicology | ||||||||||||||||
| and drug discovery applications | ||||||||||||||||
| Common Stock | (M) | 20 | 2,000,000 | 20 | ||||||||||||
| Secured Convertible Bridge Note, 8%, acquired 8/20/14 | (M) | 326,983 | $ | 300,000 | 326,983 | |||||||||||
| Secured Convertible Bridge Note, 8%, acquired 5/18/15 | (M) | 205,961 | $ | 200,000 | 205,961 | |||||||||||
| 532,964 | 532,964 | |||||||||||||||
| Total Controlled Private Placement Portfolio (cost: $21,879,303) | $ | 6,258,526 | ||||||||||||||
| Total Investments in Controlled Affiliated Companies (cost: $21,879,303) | $ | 6,258,526 | ||||||||||||||
| Total Private Placement and Publicly Traded Portfolio (cost: $114,963,143) | $ | 71,237,485 | ||||||||||||||
The accompanying unaudited notes are an integral part of these consolidated financial statements.
| 15 |
|
HARRIS & HARRIS GROUP, INC. CONSOLIDATED SCHEDULE OF INVESTMENTS AS OF SEPTEMBER 30, 2015 (Unaudited) |
| Method of | Primary | Shares/ | ||||||||||||||
| Valuation (1) | Industry (2) | Cost | Principal | Value | ||||||||||||
| Equity Method Investments (25) – 0.3% of net assets at value | ||||||||||||||||
| Private Placement Portfolio (Illiquid) (25) – 0.3% of net assets at value | ||||||||||||||||
| Accelerator IV-New York Corporation (5)(8)(9)(26) | Life Sciences | |||||||||||||||
| Identifying and managing emerging | ||||||||||||||||
| biotechnology companies | ||||||||||||||||
| Series A Common Stock | (E) | $ | 228,379 | 478,227 | $ | 228,379 | ||||||||||
| Total Equity Method Investments (cost: $228,379) | $ | 228,379 | ||||||||||||||
| Total Investments (cost: $115,191,522) | $ | 71,465,864 | ||||||||||||||
The accompanying unaudited notes are an integral part of these consolidated financial statements.
| 16 |
|
HARRIS & HARRIS GROUP, INC. CONSOLIDATED SCHEDULE OF INVESTMENTS AS OF SEPTEMBER 30, 2015 (Unaudited) |
Notes to Consolidated Schedule of Investments
| (1) | See "Footnote to Consolidated Schedule of Investments" on page 32 for a description of the "Valuation Procedures." |
| (2) | We classify "Energy" companies as those that seek to improve performance, productivity or efficiency, and to reduce environmental impact, waste, cost, energy consumption or raw materials. We classify "Electronics" companies as those that address problems in electronics-related industries, including semiconductors and computing. We classify "Life Sciences" companies as those that address problems in life sciences-related industries, including biotechnology, agriculture, advanced materials and chemicals, healthcare, bioprocessing, water, industrial biotechnology, food, nutrition and energy. |
| (3) | Investments in unaffiliated companies consist of investments in which we own less than five percent of the voting shares of the portfolio company. Investments in non-controlled affiliated companies consist of investments in which we own five percent or more, but less than 25 percent, of the voting shares of the portfolio company, or where we hold one or more seats on the portfolio company’s board of directors but do not control the company. Investments in controlled affiliated companies consist of investments in which we own 25 percent or more of the voting shares of the portfolio company or otherwise control the company. |
| (4) | The aggregate cost for federal income tax purposes of investments in unaffiliated privately held companies is $19,916,279. The gross unrealized appreciation based on the tax cost for these securities is $0. The gross unrealized depreciation based on the tax cost for these securities is $14,226,557. |
| (5) | All or a portion of the investments or instruments are pledged as collateral under our Loan Facility with Orix Corporate Capital, Inc. |
| (6) | The aggregate cost for federal income tax purposes of investments in unaffiliated rights to milestone payments is $2,387,278. The gross unrealized appreciation based on the tax cost for these securities is $2,670,805. The gross unrealized depreciation based on the tax cost for these securities is $0. |
| (7) | The aggregate cost for federal income tax purposes of investments in unaffiliated publicly traded companies is $1,623,029. The gross unrealized appreciation based on the tax cost for these securities is $0. The gross unrealized depreciation based on the tax cost for these securities is $17,325. |
| (8) | We are subject to legal restrictions on the sale of our investment(s) in this company. |
| (9) | Represents a non-income producing security. Investments that have not paid dividends or interest within the last 12 months are considered to be non-income producing. |
| (10) | On July 21, 2015, Bridgelux signed a definitive agreement to be acquired by an investment group led by China Electronics Corporation and ChongQing Linkong Development Investment Company. The close of this transaction is subject to customary regulatory approvals. |
| (11) | Cobalt Technologies, Inc., also did business as Cobalt Biofuels. Cobalt is in the process of liquidating its assets for the benefit of creditors. |
| (12) | We received our shares of Magic Leap, Inc., as part of the consideration paid for one of our portfolio companies in an acquisition during the second quarter of 2015. A total of 4,394 shares of our 29,291 shares of Magic Leap are held in escrow to satisfy indemnity claims through May 1, 2016. |
| (13) | Initial investment was made in 2015. |
The accompanying unaudited notes are an integral part of this consolidated schedule.
| 17 |
|
HARRIS & HARRIS GROUP, INC. CONSOLIDATED SCHEDULE OF INVESTMENTS AS OF SEPTEMBER 30, 2015 (Unaudited) |
| (14) | On October 1, 2015, we received proceeds of $795,657 upon achievement of the first milestone. This amount is included in the value of our potential milestone payments as of September 30, 2015. |
| (15) | The aggregate cost for federal income tax purposes of investments in non-controlled affiliated privately held companies is $57,473,883. The gross unrealized appreciation based on the tax cost for these securities is $6,560,459. The gross unrealized depreciation based on the tax cost for these securities is $18,694,717. |
| (16) | In October of 2015, Adesto effected a 33:1 reverse stock split. On October 27, 2015, Adesto completed an initial public offering ("IPO") at which time all of our shares of preferred stock converted to common stock. Our shares of Series A, B, C, and D Preferred Stock converted on a one-for-one basis. Each share of our Series D-1 Preferred Stock converted into 1.033 shares of common stock. Each share of our Series E Preferred Stock converted into 9.8841 shares of common stock. |
| (17) | D-Wave Systems, Inc., is located and is doing business primarily in Canada. We invested in D-Wave through Parallel Universes, Inc., a Delaware company. Our investment is denominated in Canadian dollars and is subject to foreign currency translation. See "Note 3. Summary of Significant Accounting Policies." D-Wave is not a qualifying asset under Section 55(a) of the 1940 Act. Under the 1940 Act, we may not acquire non-qualifying assets unless, at the time the acquisition is made, qualifying assets are at least 70 percent of our total assets. |
| (18) | Produced Water Absorbents, Inc., also does business as ProSep, Inc. |
| (19) | The aggregate cost for federal income tax purposes of investments in non-controlled affiliated publicly traded companies is $11,683,371. The gross unrealized appreciation based on the tax cost for these securities is $0. The gross unrealized depreciation based on the tax cost for these securities is $4,397,546. |
| (20) | A portion of the Company's shares and warrants of Enumeral Biomedical Holdings, Inc., are subject to restrictions on transfer, and we are also subject to a lock-up agreement that restricts our ability to trade these shares, exclusive of the general restriction on the transfer of unregistered securities. The lock-up period on our 7,966,368 shares of Enumeral Biomedical Holdings expires on January 31, 2016. |
| (21) | The Company's shares of OpGen, Inc., became freely tradeable on November 2, 2015. A total of 300,833 shares and 300,833 warrants are not qualifying assets under Section 55(a) of the 1940 Act. Under the 1940 Act, we may not acquire non-qualifying assets unless, at the time the acquisition is made, qualifying assets are at least 70 percent of our total assets. |
| (22) | The aggregate cost for federal income tax purposes of investments in controlled affiliated companies is $21,879,303. The gross unrealized appreciation based on the tax cost for these securities is $285,167. The gross unrealized depreciation based on the tax cost for these securities is $15,905,944. |
| (23) | On August 3, 2015, SiOnyx, Inc., reorganized its corporate structure to become a subsidiary of a new company, Black Silicon Holdings, Inc. Our security holdings of SiOnyx converted into securities of Black Silicon Holdings. SiOnyx was then acquired by an undisclosed buyer. Black Silicon Holdings owns a profit interest in the undisclosed buyer. |
| (24) | On August 19, 2015, UberSeq, Inc., changed its name to NGX Bio, Inc. |
| (25) | The aggregate cost for federal income tax purposes of investments in privately held equity method investments is $228,379. Under the equity method, investments are carried at cost, plus or minus the Company's equity in the increases and decreases in the investee's net assets after the date of acquisition and certain other adjustments. |
| (26) | As part of our initial investment in Accelerator IV-New York Corporation, the Company made an additional operating and investment commitment. See "Note 11. Commitments and Contingencies." |
The accompanying unaudited notes are an integral part of this consolidated schedule.
| 18 |
|
HARRIS & HARRIS GROUP, INC. CONSOLIDATED SCHEDULE OF INVESTMENTS AS OF DECEMBER 31, 2014 |
| Method of | Primary | Shares/ | ||||||||||||||
| Valuation (1) | Industry (2) | Cost | Principal | Value | ||||||||||||
| Investments in Unaffiliated Companies (3) – 16.8% of net assets at value | ||||||||||||||||
| Private Placement Portfolio (Illiquid) (4) – 12.6% of net assets at value | ||||||||||||||||
| Bridgelux, Inc. (5)(8)(9) | Energy | |||||||||||||||
| Manufacturing high-power light emitting diodes (LEDs) and arrays | ||||||||||||||||
| Series B Convertible Preferred Stock | (M) | $ | 1,000,000 | 1,861,504 | $ | 607,692 | ||||||||||
| Series C Convertible Preferred Stock | (M) | 1,352,196 | 2,130,699 | 826,294 | ||||||||||||
| Series D Convertible Preferred Stock | (M) | 1,371,622 | 999,999 | 787,915 | ||||||||||||
| Series E Convertible Preferred Stock | (M) | 672,599 | 440,334 | 724,344 | ||||||||||||
| Series E-1 Convertible Preferred Stock | (M) | 386,073 | 399,579 | 499,686 | ||||||||||||
| Warrants for Series C Convertible Preferred Stock expiring 8/31/15 | ( I ) | 168,270 | 163,900 | 32,815 | ||||||||||||
| Warrants for Series D Convertible Preferred Stock expiring 8/31/15 | ( I ) | 128,543 | 166,665 | 35,139 | ||||||||||||
| Warrants for Series E Convertible Preferred Stock expiring 12/31/17 | ( I ) | 93,969 | 170,823 | 36,448 | ||||||||||||
| Warrants for Common Stock expiring 6/1/16 | ( I ) | 72,668 | 132,100 | 6,562 | ||||||||||||
| Warrants for Common Stock expiring 8/9/18 | ( I ) | 148,409 | 171,183 | 29,966 | ||||||||||||
| Warrants for Common Stock expiring 10/21/18 | ( I ) | 18,816 | 84,846 | 4,215 | ||||||||||||
| 5,413,165 | 3,591,076 | |||||||||||||||
| Cambrios Technologies Corporation (5)(8)(9) | Electronics | |||||||||||||||
| Developing nanowire-enabled electronic materials for the display industry | ||||||||||||||||
| Series B Convertible Preferred Stock | ( I ) | 1,294,025 | 1,294,025 | 41,829 | ||||||||||||
| Series C Convertible Preferred Stock | ( I ) | 1,300,000 | 1,300,000 | 42,022 | ||||||||||||
| Series D Convertible Preferred Stock | ( I ) | 515,756 | 515,756 | 358,416 | ||||||||||||
| Series D-2 Convertible Preferred Stock | ( I ) | 92,400 | 92,400 | 32,361 | ||||||||||||
| Series D-4 Convertible Preferred Stock | ( I ) | 216,168 | 216,168 | 75,708 | ||||||||||||
| 3,418,349 | 550,336 | |||||||||||||||
| Cobalt Technologies, Inc. (5)(8)(9)(10) | Energy | |||||||||||||||
| Developing processes for making bio- butanol through biomass fermentation | ||||||||||||||||
| Series C-1 Convertible Preferred Stock | (M) | 749,998 | 352,112 | 0 | ||||||||||||
| Series D-1 Convertible Preferred Stock | (M) | 122,070 | 48,828 | 0 | ||||||||||||
| Series E-1 Convertible Preferred Stock | (M) | 114,938 | 46,089 | 0 | ||||||||||||
| Warrants for Series E-1 Pref. Stock expiring on 10/9/22 | ( I ) | 2,781 | 1,407 | 0 | ||||||||||||
| Warrants for Series E-1 Pref. Stock expiring on 3/11/23 | ( I ) | 5,355 | 2,707 | 0 | ||||||||||||
| 995,142 | 0 | |||||||||||||||
The accompanying notes are an integral part of these consolidated financial statements.
| 19 |
|
HARRIS & HARRIS GROUP, INC. CONSOLIDATED SCHEDULE OF INVESTMENTS AS OF DECEMBER 31, 2014 |
| Method of | Primary | Shares/ | ||||||||||||||
| Valuation (1) | Industry (2) | Cost | Principal | Value | ||||||||||||
| Investments in Unaffiliated Companies (3) – 16.8% of net assets at value (Cont.) | ||||||||||||||||
| Private Placement Portfolio (Illiquid) (4) – 12.6% of net assets at value (Cont.) | ||||||||||||||||
| GEO Semiconductor Inc. (5)(11) | Electronics | |||||||||||||||
| Developing programmable, high-performance video and geometry processing solutions | ||||||||||||||||
| Loan and Security Agreement with GEO Semiconductor relating to the following assets: | ||||||||||||||||
| Warrants for Series A Pref. Stock expiring on 3/1/18 | ( I ) | $ | 7,512 | 10,000 | $ | 10,919 | ||||||||||
| Warrants for Series A-1 Pref. Stock expiring on 6/29/18 | ( I ) | 7,546 | 10,000 | 12,010 | ||||||||||||
| 15,058 | 22,929 | |||||||||||||||
| Mersana Therapeutics, Inc. (5)(8)(9)(12) | Life Sciences | |||||||||||||||
| Developing antibody drug conjugates for cancer therapy | ||||||||||||||||
| Series A-1 Convertible Preferred Stock | ( I ) | 683,538 | 635,081 | 434,387 | ||||||||||||
| Common Stock | ( I ) | 3,875,395 | 350,539 | 138,048 | ||||||||||||
| 4,558,933 | 572,435 | |||||||||||||||
| Molecular Imprints, Inc. (5)(8)(9)(13) | Electronics | |||||||||||||||
| Manufacturing nanoimprint lithography capital equipment for non-semiconductor manufacturing markets | ||||||||||||||||
| Series A Convertible Preferred Stock | (M) | 928,884 | 928,884 | 928,884 | ||||||||||||
| Nanosys, Inc. (5)(8) | Energy | |||||||||||||||
| Developing inorganic nanowires and quantum dots for use in LED-backlit devices | ||||||||||||||||
| Series C Convertible Preferred Stock | (M) | 1,500,000 | 803,428 | 932,035 | ||||||||||||
| Series D Convertible Preferred Stock | (M) | 3,000,003 | 1,016,950 | 2,530,003 | ||||||||||||
| Series E Convertible Preferred Stock | (M) | 496,573 | 433,688 | 844,004 | ||||||||||||
| 4,996,576 | 4,306,042 | |||||||||||||||
The accompanying notes are an integral part of these consolidated financial statements.
| 20 |
|
HARRIS & HARRIS GROUP, INC. CONSOLIDATED SCHEDULE OF INVESTMENTS AS OF DECEMBER 31, 2014 |
| Method of | Primary | Shares/ | ||||||||||||||
| Valuation (1) | Industry (2) | Cost | Principal | Value | ||||||||||||
| Investments in Unaffiliated Companies (3) – 16.8% of net assets at value (Cont.) | ||||||||||||||||
| Private Placement Portfolio (Illiquid) (4) – 12.6% of net assets at value (Cont.) | ||||||||||||||||
| Nano Terra, Inc. (5) | Energy | |||||||||||||||
| Developing surface chemistry and nano- manufacturing solutions | ||||||||||||||||
| Senior secured debt, 12.0%, maturing on 12/1/15 | ( I ) | $ | 349,966 | $ | 385,369 | $ | 383,180 | |||||||||
| Warrants for Series A-2 Pref. Stock expiring on 2/22/21 | ( I ) | 69,168 | 446,248 | 13 | ||||||||||||
| Warrants for Series C Pref. Stock expiring on 11/15/22 | ( I ) | 35,403 | 241,662 | 66,673 | ||||||||||||
| 454,537 | 449,866 | |||||||||||||||
| Nantero, Inc. (5)(8)(9) | Electronics | |||||||||||||||
| Developing a high-density, nonvolatile, random access memory chip, enabled by carbon nanotubes | ||||||||||||||||
| Series A Convertible Preferred Stock | ( I ) | 489,999 | 345,070 | 1,440,529 | ||||||||||||
| Series B Convertible Preferred Stock | ( I ) | 323,000 | 207,051 | 871,532 | ||||||||||||
| Series C Convertible Preferred Stock | ( I ) | 571,329 | 188,315 | 941,639 | ||||||||||||
| Series D Convertible Preferred Stock | ( I ) | 139,075 | 35,569 | 179,638 | ||||||||||||
| 1,523,403 | 3,433,338 | |||||||||||||||
| Total Unaffiliated Private Placement Portfolio (cost: $22,304,047) | $ | 13,854,906 | ||||||||||||||
| Rights to Milestone Payments (Illiquid) (6) – 2.9% of net assets at value | ||||||||||||||||
| Amgen, Inc. (8)(9) | Life Sciences | |||||||||||||||
| Rights to Milestone Payments from Acquisition of BioVex Group, Inc. | ( I ) | $ | 1,757,608 | $ | 1,757,608 | $ | 2,564,917 | |||||||||
| Laird Technologies, Inc. (8)(9) | Energy | |||||||||||||||
| Rights to Milestone Payments from Merger & Acquisition of Nextreme Thermal Solutions, Inc. | ( I ) | 0 | $ | 0 | 0 | |||||||||||
| Canon, Inc. (8)(9) | Electronics | |||||||||||||||
| Rights to Milestone Payments from Acquisition of Molecular Imprints, Inc. | ( I ) | 629,670 | $ | 629,670 | 628,948 | |||||||||||
| Total Unaffiliated Rights to Milestone Payments (cost: $2,387,278) | $ | 3,193,865 | ||||||||||||||
The accompanying notes are an integral part of these consolidated financial statements.
| 21 |
|
HARRIS & HARRIS GROUP, INC. CONSOLIDATED SCHEDULE OF INVESTMENTS AS OF DECEMBER 31, 2014 |
| Method of | Primary | Shares/ | ||||||||||||||
| Valuation (1) | Industry (2) | Cost | Principal | Value | ||||||||||||
| Publicly Traded Portfolio (7) – 1.3% of net assets at value | ||||||||||||||||
| Solazyme, Inc. (5)(9) | Energy | |||||||||||||||
| Developing algal biodiesel, industrial chemicals and specialty ingredients using synthetic biology | ||||||||||||||||
| Common Stock | (M) | $ | 118,099 | 50,000 | $ | 129,000 | ||||||||||
| Champions Oncology, Inc. (5)(9) | Life Sciences | |||||||||||||||
| Developing its TumorGraftTM
platform for personalized medicine and drug development | ||||||||||||||||
| Common Stock | (M) | 1,622,629 | 2,523,895 | 1,261,695 | ||||||||||||
| Warrants for Common Stock expiring 1/29/18 | ( I ) | 400 | 40,000 | 7,390 | ||||||||||||
| 1,623,029 | 1,269,085 | |||||||||||||||
| Total Unaffiliated Publicly Traded Portfolio (cost: $1,741,128) | $ | 1,398,085 | ||||||||||||||
| Total Investments in Unaffiliated Companies (cost: $26,432,453) | $ | 18,446,856 | ||||||||||||||
The accompanying notes are an integral part of these consolidated financial statements.
| 22 |
|
HARRIS & HARRIS GROUP, INC. CONSOLIDATED SCHEDULE OF INVESTMENTS AS OF DECEMBER 31, 2014 |
| Method of | Primary | Shares/ | ||||||||||||||
| Valuation (1) | Industry (2) | Cost | Principal | Value | ||||||||||||
| Investments in Non-Controlled Affiliated Companies (3) – 61.0% of net assets at value | ||||||||||||||||
| Private Placement Portfolio (Illiquid) (14) – 53.3% of net assets at value | ||||||||||||||||
| ABSMaterials, Inc. (5)(8)(9) | Energy | |||||||||||||||
| Developing nano-structured absorbent materials for environmental remediation | ||||||||||||||||
| Series A Convertible Preferred Stock | ( I ) | $ | 435,000 | 390,000 | $ | 291,875 | ||||||||||
| Series B Convertible Preferred Stock | ( I ) | 1,217,644 | 1,037,751 | 1,255,717 | ||||||||||||
| 1,652,644 | 1,547,592 | |||||||||||||||
| Accelerator IV-New York Corporation (8)(9)(15)(16) | Life Sciences | |||||||||||||||
| Identifying and managing emerging biotechnology companies | ||||||||||||||||
| Series A Common Stock | ( I ) | 216,012 | 216,012 | 51,627 | ||||||||||||
| Adesto Technologies Corporation (5)(8)(9)(17) | Electronics | |||||||||||||||
| Developing low-power, high-performance memory devices | ||||||||||||||||
| Series A Convertible Preferred Stock | (H) | 2,200,000 | 6,547,619 | 1,652,609 | ||||||||||||
| Series B Convertible Preferred Stock | (H) | 2,200,000 | 5,952,381 | 1,527,457 | ||||||||||||
| Series C Convertible Preferred Stock | (H) | 1,485,531 | 2,122,187 | 632,526 | ||||||||||||
| Series D Convertible Preferred Stock | (H) | 1,393,147 | 1,466,470 | 612,462 | ||||||||||||
| Series D-1 Convertible Preferred Stock | (H) | 703,740 | 987,706 | 356,159 | ||||||||||||
| Series E Convertible Preferred Stock | (H) | 2,499,999 | 3,508,771 | 10,042,110 | ||||||||||||
| 10,482,417 | 14,823,323 | |||||||||||||||
| AgBiome, LLC (5)(8)(9) | Life Sciences | |||||||||||||||
| Providing early-stage research and discovery for agriculture and utilizing the crop microbiome to identify products that reduce risk and improve yield | ||||||||||||||||
| Series A-1 Convertible Preferred Stock | ( I ) | 2,000,000 | 2,000,000 | 2,406,210 | ||||||||||||
| Series A-2 Convertible Preferred Stock | ( I ) | 521,740 | 417,392 | 583,494 | ||||||||||||
| 2,521,740 | 2,989,704 | |||||||||||||||
The accompanying notes are an integral part of these consolidated financial statements.
| 23 |
|
HARRIS & HARRIS GROUP, INC. CONSOLIDATED SCHEDULE OF INVESTMENTS AS OF DECEMBER 31, 2014 |
| Method of | Primary | Shares/ | ||||||||||||||
| Valuation (1) | Industry (2) | Cost | Principal | Value | ||||||||||||
| Investments in Non-Controlled Affiliated Companies (3) – 61.0% of net assets at value (Cont.) | ||||||||||||||||
| Private Placement Portfolio (Illiquid) (14) – 53.3% of net assets at value (Cont.) | ||||||||||||||||
| D-Wave Systems, Inc. (8)(18) | Electronics | |||||||||||||||
| Developing high-performance quantum computing systems | ||||||||||||||||
| Series 1 Class B Convertible Preferred Stock | (H) | $ | 1,002,074 | 1,144,869 | $ | 1,766,715 | ||||||||||
| Series 1 Class C Convertible Preferred Stock | (H) | 487,804 | 450,450 | 699,457 | ||||||||||||
| Series 1 Class D Convertible Preferred Stock | (H) | 748,473 | 855,131 | 1,327,843 | ||||||||||||
| Series 1 Class E Convertible Preferred Stock | (H) | 248,049 | 269,280 | 435,260 | ||||||||||||
| Series 1 Class F Convertible Preferred Stock | (H) | 238,323 | 258,721 | 418,193 | ||||||||||||
| Series 1 Class H Convertible Preferred Stock | (H) | 909,088 | 460,866 | 870,998 | ||||||||||||
| Series 2 Class D Convertible Preferred Stock | (H) | 736,019 | 678,264 | 1,053,205 | ||||||||||||
| Series 2 Class E Convertible Preferred Stock | (H) | 659,493 | 513,900 | 839,844 | ||||||||||||
| Series 2 Class F Convertible Preferred Stock | (H) | 633,631 | 493,747 | 806,909 | ||||||||||||
| Warrants for Common Stock expiring 6/30/15 | ( I ) | 98,644 | 153,890 | 108,479 | ||||||||||||
| Warrants for Common Stock expiring 5/12/19 | ( I ) | 26,357 | 20,415 | 8,351 | ||||||||||||
| 5,787,955 | 8,335,254 | |||||||||||||||
| EchoPixel, Inc. (5)(8)(9) | Life Sciences | |||||||||||||||
| Developing algorithms and software to improve visualization of data for life science and healthcare applications | ||||||||||||||||
| Series Seed Convertible Preferred Stock | ( I ) | 1,250,000 | 4,194,630 | 1,312,425 | ||||||||||||
| Ensemble Therapeutics Corporation (5)(8) | Life Sciences | |||||||||||||||
| Developing DNA-Programmed ChemistryTM for the discovery of new classes of therapeutics | ||||||||||||||||
| Series B Convertible Preferred Stock | ( I ) | 2,000,000 | 1,449,275 | 1,060,023 | ||||||||||||
| Series B-1 Convertible Preferred Stock | ( I ) | 679,754 | 492,575 | 1,833,862 | ||||||||||||
| 2,679,754 | 2,893,885 | |||||||||||||||
| HZO, Inc. (5)(8)(9) | Electronics | |||||||||||||||
| Developing novel industrial coatings that protect electronics against damage from liquids | ||||||||||||||||
| Common Stock | ( I ) | 666,667 | 405,729 | 322,832 | ||||||||||||
| Series I Convertible Preferred Stock | ( I ) | 5,709,835 | 2,266,894 | 4,482,097 | ||||||||||||
| Series II Convertible Preferred Stock | ( I ) | 2,000,003 | 539,710 | 2,113,002 | ||||||||||||
| 8,376,505 | 6,917,931 | |||||||||||||||
The accompanying notes are an integral part of these consolidated financial statements.
| 24 |
|
HARRIS & HARRIS GROUP, INC. CONSOLIDATED SCHEDULE OF INVESTMENTS AS OF DECEMBER 31, 2014 |
| Method of | Primary | Shares/ | ||||||||||||||
| Valuation (1) | Industry (2) | Cost | Principal | Value | ||||||||||||
| Investments in Non-Controlled Affiliated Companies (3) – 61.0% of net assets at value (Cont.) | ||||||||||||||||
| Private Placement Portfolio (Illiquid) (14) – 53.3% of net assets at value (Cont.) | ||||||||||||||||
| Laser Light Engines, Inc. (5)(8) | Energy | |||||||||||||||
| Manufactured solid-state light sources for digital cinema and large-venue projection displays | ||||||||||||||||
| Series A Convertible Preferred Stock | (M) | $ | 2,000,000 | 7,499,062 | $ | 0 | ||||||||||
| Series B Convertible Preferred Stock | (M) | 3,095,802 | 13,571,848 | 0 | ||||||||||||
| Secured Convertible Bridge Note, 12%, acquired 10/7/11 | (M) | 200,000 | $ | 200,000 | 0 | |||||||||||
| Secured Convertible Bridge Note, 12%, acquired 11/17/11 | (M) | 95,652 | $ | 95,652 | 0 | |||||||||||
| Secured Convertible Bridge Note, 12%, acquired 12/21/11 | (M) | 82,609 | $ | 82,609 | 0 | |||||||||||
| Secured Convertible Bridge Note, 12%, acquired 3/5/12 | (M) | 434,784 | $ | 434,784 | 0 | |||||||||||
| Secured Convertible Bridge Note, 12%, acquired 7/26/12 | (M) | 186,955 | $ | 186,955 | 0 | |||||||||||
| Secured Convertible Bridge Note, 20%, acquired 4/29/13 | (M) | 166,667 | $ | 166,667 | 0 | |||||||||||
| Secured Convertible Bridge Note, 20%, acquired 7/22/13 | (M) | 166,667 | $ | 166,667 | 0 | |||||||||||
| Secured Convertible Bridge Note, 10%, acquired 10/30/13 | (M) | 80,669 | $ | 80,669 | 0 | |||||||||||
| Secured Convertible Bridge Note, 10%, acquired 2/5/14 | (M) | 19,331 | $ | 19,331 | 0 | |||||||||||
| Secured Convertible Bridge Note, 10%, acquired 6/24/14 | (M) | 13,745 | $ | 13,745 | 0 | |||||||||||
| 6,542,881 | 0 | |||||||||||||||
| Metabolon, Inc. (5)(8)(9) | Life Sciences | |||||||||||||||
| Developing service and diagnostic products through the use of a metabolomics, or biochemical, profiling platform | ||||||||||||||||
| Series B Convertible Preferred Stock | (H) | 2,500,000 | 371,739 | 2,781,374 | ||||||||||||
| Series B-1 Convertible Preferred Stock | (H) | 706,214 | 148,696 | 1,158,654 | ||||||||||||
| Series C Convertible Preferred Stock | (H) | 1,000,000 | 1,000,000 | 2,535,525 | ||||||||||||
| Series D Convertible Preferred Stock | (H) | 1,499,999 | 835,882 | 2,179,624 | ||||||||||||
| Series E Convertible Preferred Stock | (H) | 1,225,000 | 444,404 | 1,556,847 | ||||||||||||
| Warrants for Series B-1 Convertible Preferred Stock expiring 3/25/15 | ( I ) | 293,786 | 74,348 | 484,535 | ||||||||||||
| 7,224,999 | 10,696,559 | |||||||||||||||
| OpGen, Inc. (8)(19) | Life Sciences | |||||||||||||||
| Developing tools for genomic sequence assembly and analysis | ||||||||||||||||
| Series A Convertible Preferred Stock | (H) | 610,017 | 610,017 | 606,252 | ||||||||||||
| Common Stock | (H) | 3,260,000 | 29,883 | 22,752 | ||||||||||||
| Secured Convertible Bridge Note, 8%, acquired 7/11/14 | (H) | 216,991 | $ | 209,020 | 273,908 | |||||||||||
| Secured Convertible Bridge Note, 8%, acquired 10/16/14 | (H) | 254,278 | $ | 250,000 | 256,571 | |||||||||||
| Secured Convertible Bridge Note, 8%, acquired 11/14/14 | (H) | 202,133 | $ | 200,000 | 203,633 | |||||||||||
| Secured Convertible Bridge Note, 8%, acquired 12/29/14 | (H) | 100,067 | $ | 100,000 | 100,561 | |||||||||||
| 4,643,486 | 1,463,677 | |||||||||||||||
The accompanying notes are an integral part of these consolidated financial statements.
| 25 |
|
HARRIS & HARRIS GROUP, INC. CONSOLIDATED SCHEDULE OF INVESTMENTS AS OF DECEMBER 31, 2014 |
| Method of | Primary | Shares/ | ||||||||||||||
| Valuation (1) | Industry (2) | Cost | Principal | Value | ||||||||||||
| Investments in Non-Controlled Affiliated Companies (3) – 61.0% of net assets at value (Cont.) | ||||||||||||||||
| Private Placement Portfolio (Illiquid) (14) – 53.3% of net assets at value (Cont.) | ||||||||||||||||
| Produced Water Absorbents, Inc. (5)(8) | Energy | |||||||||||||||
| Developing nano-structured absorbent materials for environmental remediation of contaminated water in the oil and gas industries | ||||||||||||||||
| Series A Convertible Preferred Stock | (M) | $ | 1,000,000 | 1,000,000 | $ | 300,215 | ||||||||||
| Series B Convertible Preferred Stock | (M) | 1,496,865 | 5,987,460 | 2,188,272 | ||||||||||||
| Series B-2 Convertible Preferred Stock | (M) | 1,015,427 | 4,322,709 | 1,579,844 | ||||||||||||
| Series B-3 Convertible Preferred Stock | (M) | 978,641 | 3,914,564 | 1,430,677 | ||||||||||||
| Series C Convertible Preferred Stock | (M) | 1,000,268 | 2,667,380 | 755,130 | ||||||||||||
| Subordinated Secured Debt, 12%, maturing on 6/30/15 | (M) | 979,253 | $ | 1,000,000 | 979,450 | |||||||||||
| Warrants for Series B-2 Preferred Stock expiring upon liquidation event | ( I ) | 65,250 | 300,000 | 44,014 | ||||||||||||
| 6,535,704 | 7,277,602 | |||||||||||||||
| SiOnyx, Inc. (5)(8) | Electronics | |||||||||||||||
| Developing silicon-based optoelectronic products enabled by its proprietary Black Silicon | ||||||||||||||||
| Series A Convertible Preferred Stock | ( I ) | 750,000 | 233,499 | 0 | ||||||||||||
| Series A-1 Convertible Preferred Stock | ( I ) | 890,000 | 2,966,667 | 0 | ||||||||||||
| Series A-2 Convertible Preferred Stock | ( I ) | 2,445,000 | 4,207,537 | 0 | ||||||||||||
| Series B-1 Convertible Preferred Stock | ( I ) | 1,169,561 | 1,892,836 | 0 | ||||||||||||
| Series C Convertible Preferred Stock | ( I ) | 1,171,316 | 1,674,030 | 0 | ||||||||||||
| Secured Convertible Bridge Note, 8%, acquired 1/31/14 | ( I ) | 1,281,125 | $ | 1,281,125 | 0 | |||||||||||
| Secured Convertible Bridge Note, 8%, acquired 5/9/14 | ( I ) | 76,966 | $ | 93,976 | 0 | |||||||||||
| Secured Convertible Bridge Note, 10%, acquired 12/12/14 | ( I ) | 69,382 | $ | 68,999 | 161,285 | |||||||||||
| Warrants for Series B-1 Convertible Preferred Stock expiring 2/23/17 | ( I ) | 130,439 | 247,350 | 0 | ||||||||||||
| Warrants for Common Stock expiring 3/28/17 | ( I ) | 84,207 | 418,507 | 0 | ||||||||||||
| Warrants for Common Stock expiring 5/9/19 | ( I ) | 17,010 | 3,208 | 0 | ||||||||||||
| 8,085,006 | 161,285 | |||||||||||||||
The accompanying notes are an integral part of these consolidated financial statements.
| 26 |
|
HARRIS & HARRIS GROUP, INC. CONSOLIDATED SCHEDULE OF INVESTMENTS AS OF DECEMBER 31, 2014 |
| Method of | Primary | Shares/ | ||||||||||||||
| Valuation (1) | Industry (2) | Cost | Principal | Value | ||||||||||||
| Investments in Non-Controlled Affiliated Companies (3) – 61.0% of net assets at value (Cont.) | ||||||||||||||||
| Private Placement Portfolio (Illiquid) (14) – 53.3% of net assets at value (Cont.) | ||||||||||||||||
| Ultora, Inc. (5)(8) | Energy | |||||||||||||||
| Developing energy-storage devices enabled by carbon nanotubes | ||||||||||||||||
| Series A Convertible Preferred Stock | ( I ) | $ | 886,830 | 17,736 | $ | 0 | ||||||||||
| Series B Convertible Preferred Stock | ( I ) | 236,603 | 2,347,254 | 0 | ||||||||||||
| Secured Convertible Bridge Note, 5%, acquired 5/7/14 | ( I ) | 86,039 | $ | 86,039 | 0 | |||||||||||
| Secured Convertible Bridge Note, 5%, acquired 8/20/14 | ( I ) | 17,208 | $ | 17,208 | 0 | |||||||||||
| Secured Convertible Bridge Note, 5%, acquired 10/14/14 | ( I ) | 10,750 | $ | 10,750 | 0 | |||||||||||
| 1,237,430 | 0 | |||||||||||||||
| Total Non-Controlled Private Placement Portfolio (cost: $67,236,533) | $ | 58,470,864 | ||||||||||||||
| Publicly Traded Portfolio (20) – 7.7% of net assets at value | ||||||||||||||||
| Enumeral Biomedical Holdings, Inc. (5)(21) | Life Sciences | |||||||||||||||
| Developing therapeutics and diagnostics through functional assaying of single cells | ||||||||||||||||
| Common Stock | (M) | $ | 4,993,357 | 7,966,368 | $ | 7,251,178 | ||||||||||
| Warrants for Common Stock expiring 7/30/19 | ( I ) | 540,375 | 1,500,000 | 874,594 | ||||||||||||
| Warrants for Common Stock expiring 2/2/24 | ( I ) | 57,567 | 255,120 | 208,179 | ||||||||||||
| Options to Purchase Common Stock at $1.00 expiring 8/4/24 | ( I ) | 0 | 56,667 | 50,690 | ||||||||||||
| 5,591,299 | 8,384,641 | |||||||||||||||
| Total Non-Controlled Publicly Traded Portfolio (cost: $5,591,299) | $ | 8,384,641 | ||||||||||||||
| Total Investments in Non-Controlled Affiliated Companies (cost: $72,827,832) | $ | 66,855,505 | ||||||||||||||
The accompanying notes are an integral part of these consolidated financial statements.
| 27 |
|
HARRIS & HARRIS GROUP, INC. CONSOLIDATED SCHEDULE OF INVESTMENTS AS OF DECEMBER 31, 2014 |
| Method of | Primary | Shares/ | ||||||||||||||
| Valuation (1) | Industry (2) | Cost | Principal | Value | ||||||||||||
| Investments in Controlled Affiliated Companies (3) – 4.1% of net assets at value | ||||||||||||||||
| Private Placement Portfolio (Illiquid) (22) – 4.1% of net assets at value | ||||||||||||||||
| ProMuc, Inc. (5)(8) | Life Sciences | |||||||||||||||
| Developing synthetic mucins for the nutritional, food and healthcare markets | ||||||||||||||||
| Common Stock | (M) | $ | 1 | 1,000 | $ | 1 | ||||||||||
| Secured Convertible Bridge Note, 8%, acquired 12/18/13 | (M) | 379,074 | $ | 350,000 | 379,074 | |||||||||||
| Secured Convertible Bridge Note, 8%, acquired 8/13/14 | (M) | 103,090 | $ | 100,000 | 103,090 | |||||||||||
| 482,165 | 482,165 | |||||||||||||||
| Senova Systems, Inc. (5)(8) | Life Sciences | |||||||||||||||
| Developing next-generation sensors to measure pH | ||||||||||||||||
| Series B Convertible Preferred Stock | ( I ) | 1,218,462 | 1,350,000 | 403,123 | ||||||||||||
| Series B-1 Convertible Preferred Stock | ( I ) | 1,083,960 | 2,759,902 | 899,187 | ||||||||||||
| Series C Convertible Preferred Stock | ( I ) | 608,287 | 811,049 | 609,349 | ||||||||||||
| Warrants for Series B Preferred Stock expiring 10/15/17 | ( I ) | 131,538 | 164,423 | 49,098 | ||||||||||||
| Warrants for Series B Preferred Stock expiring 4/24/18 | ( I ) | 20,000 | 25,000 | 7,465 | ||||||||||||
| 3,062,247 | 1,968,222 | |||||||||||||||
| SynGlyco, Inc. (5)(8) | Life Sciences | |||||||||||||||
| Developed synthetic carbohydrates for pharmaceutical applications | ||||||||||||||||
| Common Stock | ( I ) | 2,729,817 | 57,463 | 0 | ||||||||||||
| Series A' Convertible Preferred Stock | ( I ) | 4,855,627 | 4,855,627 | 0 | ||||||||||||
| Senior Secured Debt, 12.00%, maturing on 12/11/14 | ( I ) | 424,101 | $ | 500,000 | 820,119 | |||||||||||
| Secured Convertible Bridge Note, 8%, acquired 1/23/13 | ( I ) | 406,417 | $ | 350,000 | 204,763 | |||||||||||
| Secured Convertible Bridge Note, 8%, acquired 4/25/13 | ( I ) | 341,825 | $ | 300,000 | 172,220 | |||||||||||
| 8,757,787 | 1,197,102 | |||||||||||||||
| TARA Biosystems, Inc. (5)(8)(15) | Life Sciences | |||||||||||||||
| Developing human tissue models for toxicology and drug discovery applications | ||||||||||||||||
| Common Stock | (M) | 20 | 2,000,000 | 20 | ||||||||||||
| Secured Convertible Bridge Note, 8%, acquired 8/20/14 | (M) | 308,811 | $ | 300,000 | 308,811 | |||||||||||
| 308,831 | 308,831 | |||||||||||||||
The accompanying notes are an integral part of these consolidated financial statements.
| 28 |
|
HARRIS & HARRIS GROUP, INC. CONSOLIDATED SCHEDULE OF INVESTMENTS AS OF DECEMBER 31, 2014 |
| Method of | Primary | Shares/ | ||||||||||||||
| Valuation (1) | Industry (2) | Cost | Principal | Value | ||||||||||||
| Investments in Controlled | ||||||||||||||||
| Affiliated Companies (3) – | ||||||||||||||||
| 4.1% of net assets at value (Cont.) | ||||||||||||||||
| Private Placement Portfolio (Illiquid) (22) – | ||||||||||||||||
| 4.1% of net assets at value (Cont.) | ||||||||||||||||
| UberSeq, Inc. (5)(8)(9)(15) | Life Sciences | |||||||||||||||
| Developing translational genomics solutions | ||||||||||||||||
| Series Seed Convertible Preferred Stock | ( I ) | $ | 500,000 | 500,000 | $ | 506,159 | ||||||||||
| Total Controlled Private Placement Portfolio (cost: $13,111,030) | $ | 4,462,479 | ||||||||||||||
| Total Investments in Controlled Affiliated Companies (cost: $13,111,030) | $ | 4,462,479 | ||||||||||||||
| Total Private Placement and Publicly Traded Portfolio (cost: $112,371,315) | $ | 89,764,840 | ||||||||||||||
| Total Investments (cost: $112,371,315) | $ | 89,764,840 | ||||||||||||||
The accompanying notes are an integral part of these consolidated financial statements.
| 29 |
|
HARRIS & HARRIS GROUP, INC. CONSOLIDATED SCHEDULE OF INVESTMENTS AS OF DECEMBER 31, 2014 |
Notes to Consolidated Schedule of Investments
| (1) | See "Footnote to Consolidated Schedule of Investments" on page 32 for a description of the "Valuation Procedures." |
| (2) | We classify "Energy" companies as those that seek to improve performance, productivity or efficiency, and to reduce environmental impact, waste, cost, energy consumption or raw materials. We classify "Electronics" companies as those that address problems in electronics-related industries, including semiconductors. We classify "Life Sciences" companies as those that address problems in life sciences-related industries, including biotechnology, agriculture, advanced materials and chemicals, healthcare, bioprocessing, water, industrial biotechnology, food, nutrition and energy. |
| (3) | Investments in unaffiliated companies consist of investments in which we own less than five percent of the voting shares of the portfolio company. Investments in non-controlled affiliated companies consist of investments in which we own five percent or more, but less than 25 percent, of the voting shares of the portfolio company, or where we hold one or more seats on the portfolio company’s board of directors but do not control the company. Investments in controlled affiliated companies consist of investments in which we own 25 percent or more of the voting shares of the portfolio company or otherwise control the company. |
| (4) | The aggregate cost for federal income tax purposes of investments in unaffiliated privately held companies is $22,304,047. The gross unrealized appreciation based on the tax cost for these securities is $7,872. The gross unrealized depreciation based on the tax cost for these securities is $8,457,013. |
| (5) | All or a portion of the investments or instruments are pledged as collateral under our Loan Facility with Orix Corporate Capital, Inc. |
| (6) | The aggregate cost for federal income tax purposes of investments in unaffiliated rights to milestone payments is $2,387,278. The gross unrealized appreciation based on the tax cost for these securities is $807,309. The gross unrealized depreciation based on the tax cost for these securities is $722. |
| (7) | The aggregate cost for federal income tax purposes of investments in unaffiliated publicly traded companies is $1,741,128. The gross unrealized appreciation based on the tax cost for these securities is $10,901. The gross unrealized depreciation based on the tax cost for these securities is $353,944. |
| (8) | We are subject to legal restrictions on the sale of our investment(s) in this company. |
| (9) | Represents a non-income producing security. Investments that have not paid dividends or interest within the last 12 months are considered to be non-income producing. |
| (10) | Cobalt Technologies, Inc., also does business as Cobalt Biofuels. |
| (11) | On March 11, 2015, we submitted notice to exercise our put option for our remaining warrants of GEO Semiconductor, Inc. |
The accompanying notes are an integral part of this consolidated schedule.
| 30 |
|
HARRIS & HARRIS GROUP, INC. CONSOLIDATED SCHEDULE OF INVESTMENTS AS OF DECEMBER 31, 2014 |
| (12) | With our investment in the Mersana Therapeutics, Inc., Series A-1 financing, we received a warrant to purchase 277,760 shares of Series A-2 Convertible Preferred Stock. The ability to exercise the warrant is contingent upon Mersana's achievement of certain milestones. Mersana has not achieved those milestones as of December 31, 2014, and, therefore, this warrant is a contingent asset as of that date. In January 2015, the holders of these warrants, including the Company, elected to cancel them owing to the milestones being impossible to achieve. |
| (13) | Upon the closing of Canon, Inc.'s acquisition of Molecular Imprints, Inc.'s semiconductor lithography equipment business, a new spin-out company, which retained the name Molecular Imprints, Inc., was formed. These shares represent our investment in the new company. |
| (14) | The aggregate cost for federal income tax purposes of investments in non-controlled affiliated privately held companies is $67,236,533. The gross unrealized appreciation based on the tax cost for these securities is $11,846,184. The gross unrealized depreciation based on the tax cost for these securities is $20,611,853. |
| (15) | Initial investment was made in 2014. |
| (16) | As part of our initial investment in Accelerator IV-New York Corporation, the Company made an additional operating and investment commitment. See "Note 11. Commitments and Contingencies." |
| (17) | Adesto Technologies Corporation's Series E shares have certain rights and preferences in a sale or IPO that are not ascribed to the other classes of stock. |
| (18) | D-Wave Systems, Inc., is located and is doing business primarily in Canada. We invested in D-Wave through Parallel Universes, Inc., a Delaware company. Our investment is denominated in Canadian dollars and is subject to foreign currency translation. See "Note 2. Summary of Significant Accounting Policies." D-Wave is not a qualifying asset under Section 55(a) of the 1940 Act. Under the 1940 Act, we may not acquire non-qualifying assets unless, at the time the acquisition is made, qualifying assets are at least 70 percent of our total assets. |
| (19) | On March 3, 2015, OpGen, Inc., filed a registration statement on Form S-1 to seek an IPO. There can be no assurances if or when such IPO will occur or if it will be successful. |
| (20) | The aggregate cost for federal income tax purposes of investments in non-controlled affiliated publicly traded companies is $5,591,299. The gross unrealized appreciation based on the tax cost for these securities is $2,793,342. The gross unrealized depreciation based on the tax cost for these securities is $0. |
| (21) | The Company's shares of Enumeral Biomedical Holdings, Inc., are subject to restrictions on transfer, and we are also subject to a lock-up agreement that restricts our ability to trade these shares, exclusive of the general restriction on the transfer of unregistered securities. The lock-up period on our 7,966,368 shares of Enumeral Biomedical Holdings expires on January 31, 2016. |
| (22) | The aggregate cost for federal income tax purposes of investments in controlled affiliated companies is $13,111,030. The gross unrealized appreciation based on the tax cost for these securities is $6,159. The gross unrealized depreciation based on the tax cost for these securities is $8,654,710. |
The accompanying notes are an integral part of this consolidated schedule.
| 31 |
|
HARRIS & HARRIS GROUP, INC. FOOTNOTE TO CONSOLIDATED SCHEDULE OF INVESTMENTS |
VALUATION PROCEDURES
| I. | Determination of Net Asset Value |
The 1940 Act requires periodic valuation of each investment in the portfolio of the Company to determine its net asset value. Under the 1940 Act, unrestricted securities with readily available market quotations are to be valued at the current market value; all other assets must be valued at "fair value" as determined in good faith by or under the direction of the Board of Directors.
The Board of Directors is also responsible for (1) determining overall valuation guidelines and (2) ensuring that the investments of the Company are valued within the prescribed guidelines.
The Valuation Committee, comprised of all of the independent Board members, is responsible for determining the valuation of the Company’s assets within the guidelines established by the Board of Directors. The Valuation Committee receives information and recommendations from management. An independent valuation firm also reviews select portfolio company valuations. The independent valuation firm does not provide proposed valuations.
The fair values assigned to these investments are based on available information and do not necessarily represent amounts that might ultimately be realized when that investment is sold, as such amounts depend on future circumstances and cannot reasonably be determined until the individual investments are actually liquidated or become readily marketable.
The deal team meets at the end of each quarter to discuss portfolio companies and propose fair valuations for all privately held securities, restricted publicly traded securities and publicly traded securities without reliable market quotations. The Valuation Committee book is prepared with the use of data from primary sources whenever reasonably practicable. Proposed valuations for each portfolio company are communicated to the Valuation Committee in the Valuation Committee book and at the Valuation Committee meeting after the end of each quarter. The Valuation Committee determines the fair value of each private security and publicly traded securities without reliable market quotations. All valuations are then reported to the full Board of Directors along with the Chief Financial Officer’s calculation of net asset value.
| II. | Approaches to Determining Fair Value |
Accounting Standards Codification Topic 820, "Fair Value Measurements and Disclosures," ("ASC 820") defines fair value as the price that would be received to sell an asset or paid to transfer a liability in an orderly transaction between market participants at the measurement date (exit price). It applies fair value terminology to all valuations whereas the 1940 Act applies market value terminology to readily marketable assets and fair value terminology to other assets.
| 32 |
The main approaches to measuring fair value utilized are the market approach, the income approach and the hybrid approach.
| · | Market Approach (M): The market approach may use quantitative inputs such as prices and other relevant information generated by market transactions involving identical or comparable assets or liabilities and the values of market multiples derived from a set of comparable companies. The market approach may also use qualitative inputs such as progress toward milestones, the long-term potential of the business, current and future financing requirements and the rights and preferences of certain securities versus those of other securities. The selection of the relevant inputs used to derive value under the market approach requires judgment considering factors specific to the significance and relevance of each input to deriving value. |
| · | Income Approach (I): The income approach uses valuation techniques to convert future amounts (for example, revenue, cash flows or earnings) to a single present value amount (discounted). The measurement is based on the value indicated by current market expectations about those future amounts. Those valuation techniques include present value techniques; option-pricing models, such as the Black-Scholes-Merton formula (a closed-form model) and a binomial model (a lattice model), which incorporate present value techniques; and the multi-period excess earnings method, which is used to measure the fair value of certain assets. |
| · | Hybrid Approach (H): The hybrid approach uses elements of both the market approach and the income approach. The hybrid approach calculates values using the market and income approach, individually. The resulting values are then distributed among the share classes based on probability of exit outcomes. |
ASC Topic 820 classifies the inputs used to measure fair value by these approaches into the following hierarchy:
| · | Level 1: Unadjusted quoted prices in active markets for identical assets or liabilities; |
| · | Level 2: Quoted prices in active markets for similar assets or liabilities, or quoted prices for identical or similar assets or liabilities in markets that are not active, or inputs other than quoted prices that are observable for the asset or liability, either directly or indirectly, for substantially the full term of the financial instrument. Level 2 inputs are in those markets for which there are few transactions, the prices are not current, little public information exists or instances where prices vary substantially over time or among brokered market makers; and |
| · | Level 3: Inputs to the valuation methodology are unobservable and significant to the fair value measurement. Unobservable inputs are those inputs that reflect our own assumptions that market participants would use to price the asset or liability based upon the best available information. |
| 33 |
Financial assets and liabilities are classified in their entirety based on the lowest level of input that is significant to the fair value measurement and are not necessarily an indication of risks associated with the investment.
| III. | Investment Categories |
The Company’s investments can be classified into five broad categories for valuation purposes:
| · | Equity-related securities; |
| · | Long-term fixed-income securities; |
| · | Short-term fixed-income securities; |
| · | Investments in intellectual property, patents, research and development in technology or product development; and |
| · | All other securities. |
The Company applies the methods for determining fair value discussed above to the valuation of investments in each of these five broad categories as follows:
| A. | EQUITY-RELATED SECURITIES |
Equity-related securities, including options or warrants, are fair valued using the market, income or hybrid approaches. The following factors may be considered to fair value these types of securities:
| § | Readily available public market quotations; |
| § | The cost of the Company’s investment; |
| § | Transactions in a company's securities or unconditional firm offers by responsible parties as a factor in determining valuation; |
| § | The financial condition and operating results of the company; |
| § | The company's progress towards milestones; |
| § | The long-term potential of the business and technology of the company; |
| § | The values of similar securities issued by companies in similar businesses; |
| 34 |
| § | Multiples to revenue, net income or EBITDA that similar securities issued by companies in similar businesses receive; |
| § | Estimated time to exit; |
| § | Volatility of similar securities in similar businesses; |
| § | The proportion of the company's securities we own and the nature of any rights to require the company to register restricted securities under applicable securities laws; and |
| § | The rights and preferences of the class of securities we own as compared with other classes of securities the portfolio company has issued. |
When the income approach is used to value warrants, the Company uses the Black-Scholes-Merton formula.
| B. | LONG-TERM FIXED-INCOME SECURITIES |
| 1. | Readily Marketable. Long-term fixed-income securities for which market quotations are readily available are valued using the most recent bid quotations when available. |
| 2. | Not Readily Marketable. Long-term fixed-income securities for which market quotations are not readily available are fair valued using the income approach. The factors that may be considered when valuing these types of securities by the income approach include: |
| · | Credit quality; |
| · | Interest rate analysis; |
| · | Quotations from broker-dealers; |
| · | Prices from independent pricing services that the Board believes are reasonably reliable; and |
| · | Reasonable price discovery procedures and data from other sources. |
| C. | SHORT-TERM FIXED-INCOME SECURITIES |
Short-term fixed-income securities are valued in the same manner as long-term fixed-income securities until the remaining maturity is 60 days or less, after which time such securities may be valued at amortized cost if there is no concern over payment at maturity.
| 35 |
D. INVESTMENTS IN INTELLECTUAL PROPERTY, PATENTS, RESEARCH AND DEVELOPMENT IN TECHNOLOGY OR PRODUCT DEVELOPMENT
Such investments are fair valued using the market approach. The Company may consider factors specific to these types of investments when using the market approach including:
| · | The cost of the Company’s investment; |
| · | Investments in the same or substantially similar intellectual property or patents or research and development in technology or product development or offers by responsible third parties; |
| · | The results of research and development; |
| · | Product development and milestone progress; |
| · | Commercial prospects; |
| · | Term of patent; |
| · | Projected markets; and |
| · | Other subjective factors. |
| E. | ALL OTHER SECURITIES |
All other securities are reported at fair value as determined in good faith by the Valuation Committee using the approaches for determining valuation as described above.
For all other securities, the reported values shall reflect the Valuation Committee's judgment of fair values as of the valuation date using the outlined basic approaches of valuation discussed in Section II. They do not necessarily represent an amount of money that would be realized if we had to sell such assets in an immediate liquidation. Thus, valuations as of any particular date are not necessarily indicative of amounts that we may ultimately realize as a result of future sales or other dispositions of investments we hold.
| IV. | Frequency of Valuation |
The Valuation Committee shall value the Company’s investment assets (i) as of the end of each calendar quarter at the time sufficiently far in advance of filing of the Company’s reports on Form 10-Q and Form 10-K to enable preparation thereof, (ii) as of within 48 hours of pricing any common stock of the Company by the Company (exclusive of Sundays and holidays) unless the proposed sale price is at least 200 percent of any reasonable net asset value of such shares, and (iii) as of any other time requested by the Board of Directors.
| 36 |
| V. | Regular Review |
The Chief Operating Officer and Chief Financial Officer shall review these Valuation Procedures on an annual basis to determine the continued appropriateness and accuracy of the methodologies used in valuing the Company’s investment assets, and will report any proposed modifications to these Valuation Procedures to the Board of Directors for consideration and approval.
The Chief Executive Officer, the Chief Operating Officer, the Chief Financial Officer and the individuals responsible for preparing the Valuation Committee book shall meet quarterly before each Valuation Committee meeting to review the methodologies for the valuation of each security, and will highlight any changes to the Valuation Committee.
| VI. | Other Assets |
Non-investment assets, such as fixtures and equipment, shall be valued using the cost approach less accumulated depreciation at rates determined by management and reviewed by the Audit Committee. Valuation of such assets is not the responsibility of the Valuation Committee.
| 37 |
|
NOTES TO CONSOLIDATED FINANCIAL STATEMENTS (Unaudited) |
NOTE 1. THE COMPANY
Harris & Harris Group, Inc. (the "Company," "us," "our" and "we"), is a non-diversified management investment company operating as a business development company ("BDC") under the Investment Company Act of 1940 (the "1940 Act") that specializes in making investments in companies commercializing and integrating products enabled by disruptive technologies predominantly in the life sciences. We operate as an internally managed investment company whereby our officers and employees, under the general supervision of our Board of Directors, conduct our operations.
H&H Ventures Management, Inc.SM ("Ventures") is a 100 percent wholly owned subsidiary of the Company. Ventures is taxed under Subchapter C (a "C Corporation") of the Internal Revenue Code of 1986 (the "Code"). Harris Partners I, L.P, is a limited partnership and, from time to time, may be used to hold certain interests in portfolio companies. The partners of Harris Partners I, L.P., are Ventures (sole general partner) and the Company (sole limited partner). Ventures pays taxes on income generated by its operations as well as on any non-passive investment income generated by Harris Partners I, L.P. For the period ended September 30, 2015, there was no non-passive investment income generated by Harris Partners I, L.P. Ventures, as the sole general partner, consolidates Harris Partners I, L.P. The Company consolidates its wholly owned subsidiary, Ventures, for financial reporting purposes.
NOTE 2. INTERIM FINANCIAL STATEMENTS
Our interim financial statements have been prepared in accordance with the instructions to Form 10-Q and Article 10 of Regulation S-X and in conformity with accounting principles generally accepted in the United States of America ("GAAP") applicable to interim financial information. Accordingly, the information presented on our interim financial statements does not include all information and disclosures necessary for a fair presentation of our financial position, results of operations and cash flows in conformity with GAAP for annual financial statements. In the opinion of management, these financial statements reflect all adjustments, consisting of valuation adjustments and normal recurring accruals, necessary for a fair statement of our financial position, results of operations and cash flows for such periods. The results of operations for any interim period are not necessarily indicative of the results for the full year. These financial statements should be read in conjunction with the financial statements and notes thereto contained in our Annual Report on Form 10-K for the fiscal year ended December 31, 2014.
NOTE 3. SUMMARY OF SIGNIFICANT ACCOUNTING POLICIES
The following is a summary of significant accounting policies followed in the preparation of the consolidated financial statements:
| 38 |
Principles of Consolidation. The consolidated financial statements have been prepared in accordance with GAAP and include the accounts of the Company and its wholly owned subsidiary. The Company is an investment company following accounting and reporting guidance in Accounting Standards Codification 946. In accordance with GAAP and Regulation S-X, the Company may only consolidate its interests in investment company subsidiaries and controlled operating companies whose business consists of providing services to the Company. Our wholly owned subsidiary, Ventures, is a controlled operating company that provides services to us and is, therefore, consolidated. All significant inter-company accounts and transactions have been eliminated in consolidation. Certain prior period amounts have been reclassified to conform to the current period presentation.
Use of Estimates. The preparation of the consolidated financial statements in conformity with GAAP requires management to make estimates and assumptions that affect the reported amounts of assets and liabilities and contingent assets and liabilities and the reported amounts of revenues and expenses. Actual results could differ from these estimates, and the differences could be material. The most significant estimates relate to the fair valuations of our investments.
Portfolio Investment Valuations. Investments are stated at "value" as defined in the 1940 Act and in the applicable regulations of the Securities and Exchange Commission ("SEC") and in accordance with GAAP. Value, as defined in Section 2(a)(41) of the 1940 Act, is (i) the market price for those securities for which a market quotation is readily available and (ii) the fair value as determined in good faith by, or under the direction of, the Board of Directors for all other assets. (See "Valuation Procedures" in the "Footnote to Consolidated Schedule of Investments.") As of September 30, 2015, our financial statements include venture capital investments fair valued by the Board of Directors at $64,465,395 and one venture capital investment valued under the equity method at $228,379. The fair values and equity method value were determined in good faith by, or under the direction of, the Board of Directors. The fair value amount includes the values of our privately held investments as well as the securities of Champions Oncology, Inc., and certain warrants, options and restricted securities of Enumeral Biomedical Holdings, Inc., and the warrants of OpGen, Inc., which are publicly traded companies. Our investment in Accelerator-New York IV is accounted for under the equity method of accounting as it represents a non-controlling interest in an operating entity that provides investment advisory services to the Company. Under the equity method, investments are carried at cost, plus or minus the Company’s equity in the increases and decreases in the investee’s net assets after the date of acquisition and certain other adjustments. The Company’s share of the net income or loss of the investee is included in “Equity in earnings/(loss) from equity method investees” on the Company’s “Consolidated Statements of Operations.” Upon sale of investments, the values that are ultimately realized may be different from the fair value presented in the Company's financial statements. The difference could be material.
Cash. Cash includes demand deposits. Cash is carried at cost, which approximates fair value.
Unaffiliated Rights to Milestone Payments. At September 30, 2015, and December 31, 2014, the outstanding potential milestone payments from Amgen, Inc.’s acquisition of BioVex Group, Inc., were valued at $3,794,540 and $2,564,917, respectively. The milestone payments are derivatives and valued using the probability-adjusted, present value of proceeds from future payments that would be due upon successful completion of certain regulatory and sales milestones. On November 17, 2014, the Company received a payment of $2,070,955 owing to the achievement of the first milestone. If all the remaining milestones are met, we would receive $7,455,438. There can be no assurance as to how much of this amount we will ultimately realize or when it will be realized, if at all. At September 30, 2015, and December 31, 2014, the outstanding potential milestone payments from Canon, Inc.'s acquisition of Molecular Imprints, Inc., were valued at $1,263,543 and $628,948, respectively. On October 1, 2015, the Company received a payment of $795,567 owing to the achievement of the first milestone. If all the remaining milestones are met, we would receive an additional $938,926. There can be no assurance as to how much of this amount we will ultimately realize or when it will be realized, if at all. At September 30, 2015, and December 31, 2014, the outstanding potential milestone payments from Laird Technologies, Inc.’s acquisition of Nextreme Thermal Solutions, Inc., were valued at $0. If all the remaining milestones are met, we would receive approximately $400,000. There can be no assurance as to how much of this amount we will ultimately realize or when it will be realized, if at all.
| 39 |
Funds Held in Escrow from Sale of Investment. At September 30, 2015, and December 31, 2014, there were funds held in escrow fair valued at $311,411 and $306,802, respectively, relating to the sale of Molecular Imprints, Inc.'s semiconductor lithography equipment business to Canon, Inc., that are expected to be released in April of 2016 and April of 2017, net of settlement of any indemnity claims and expenses related to the transaction. If the funds held in escrow for this transaction are released in full, we would receive $625,000 and realize a gain of $313,589. At September 30, 2015, and December 31, 2014, there were funds held in escrow fair valued at $63,440 and $0, respectively, relating to the sale of Molecular Imprints' non-semiconductor business to Magic Leap, Inc., that are expected to be released in May of 2016, net of settlement of any indemnity claims and expenses related to the transaction. If the funds held in escrow for this transaction are released in full, we would receive $126,972 and realize a gain of $63,532.
Prepaid Expenses. We include prepaid insurance premiums and deferred financing charges in "Prepaid expenses." Prepaid insurance premiums are recognized over the term of the insurance contract and are included in "Insurance expense" in the Consolidated Statements of Operations. Deferred financing charges consist of fees and expenses paid in connection with the closing of loan facilities and are capitalized at the time of payment. Deferred financing charges are amortized over the term of the loan facility discussed in "Note 5. Debt." Amortization of the financing charges is included in "Interest and other debt expense" in the Consolidated Statements of Operations.
Property and Equipment. Property and equipment are included in "Other assets" and are carried at $189,749 and $219,729 at September 30, 2015, and December 31, 2014, respectively, representing cost, less accumulated depreciation of $433,807 and $399,373, respectively. Depreciation is provided using the straight-line method over the estimated useful lives of the property and equipment. We estimate the useful lives to be five to ten years for furniture and fixtures, three years for computer equipment, and the lesser of ten years or the remaining life of the lease for leasehold improvements. All of our fixed assets are pledged as collateral under the Company's four-year $20,000,000 Multi-Draw Term Loan Facility Credit Agreement, by and among the Company, as borrower, Orix Corporate Capital, Inc., as administrative agent and lender and the other lenders party thereto from time to time (the "Loan Facility").
Post-Retirement Plan Liabilities. The Company provides a Retiree Medical Benefit Plan for employees who meet certain eligibility requirements. Until it was terminated on May 5, 2011, the Company also provided an Executive Mandatory Retirement Benefit Plan for certain individuals employed by us in a bona fide executive or high policy-making position. The net periodic post-retirement benefit cost for the year includes service cost for the year and interest on the accumulated post-retirement benefit obligation. Unrecognized actuarial gains and losses are recognized as net periodic benefit cost pursuant to the Company's historical accounting policy. The impact of plan amendments is amortized over the employee's average service period as a reduction of net periodic benefit cost. Unamortized plan amendments are included in "Accumulated other comprehensive income" in the Consolidated Statements of Assets and Liabilities.
| 40 |
Interest Income Recognition. Interest income, including amortization of premium and accretion of discount, is recorded on an accrual basis. When accrued interest is determined not to be recoverable, the Company ceases accruing interest and writes off any previously accrued interest. Securities are deemed to be non-income producing if, on their last interest or dividend date, no cash was paid or no cash or in-kind dividends were declared. These write-offs are reversed through interest income. During the three months and nine months ended September 30, 2015, the Company earned $46,070 and $158,559, respectively, in interest on senior secured debt, subordinated secured debt, non-convertible promissory notes and interest-bearing accounts. During the three months and nine months ended September 30, 2014, the Company earned $58,087 and $202,679, respectively, in interest on U.S. government securities, senior secured debt, participation agreements, subordinated secured debt, non-convertible promissory notes and interest-bearing accounts. During the three months and nine months ended September 30, 2015, the Company recorded, on a net basis, $82,959 and $341,949, respectively, of bridge note interest. The total for the nine months ended September 30, 2015, includes a partial write-off of previously accrued bridge note interest of $1,427. During the three months and nine months ended September 30, 2014, the Company recorded, on a net basis, $(2,214) and $133,320, respectively, of bridge note interest. The total for the nine months ended September 30, 2014, includes a partial write-off of previously accrued bridge note interest of $70,946.
Yield-Enhancing Fees on Debt Securities. Yield-enhancing fees received in connection with our venture debt investments are deferred. The unearned fee income is accreted into income based on the effective interest method over the life of the investment. For the three months and nine months ended September 30, 2015, total yield-enhancing fees accreted into investment income were $44,014 and $90,062, respectively. For the three months and nine months ended September 30, 2014, total yield-enhancing fees accreted into investment income were $19,843 and $52,105, respectively.
Fees for Providing Managerial Assistance to Portfolio Companies. For the three months and nine months ended September 30, 2015, the Company earned income of $71,359 and $84,859, respectively, owing to certain of its employees providing managerial assistance to certain portfolio companies. For the three months and nine months ended September 30, 2014, the Company earned income of $37,500 owing to one of its employees providing managerial assistance to one of its portfolio companies.
Call Options. The Company writes covered call options on publicly traded securities with the intention of earning option premiums. Option premiums may increase the Company’s realized gains and, therefore, may help increase distributable income, but may limit the realized gains on the security. When a company writes (sells) an option, an amount equal to the premium received by the Company is recorded in the Consolidated Statements of Assets and Liabilities as a liability. The amount of the liability is subsequently marked-to-market to reflect the current market value of the option written. When an option expires, the Company realizes a gain on the option to the extent of the premiums received. Premiums received from writing options that are exercised or closed are added to the proceeds or offset against the amount paid on the transaction to determine the realized gain or loss. Previously recorded unrealized gains and losses on expired, exercised or closed options are reversed at the time of such transactions. At September 30, 2015, and December 31, 2014, the Company did not have shares covered by call option contracts.
| 41 |
Stock-Based Compensation. The Company has a stock-based employee compensation plan. The Company accounts for the Amended and Restated Harris & Harris Group, Inc. 2012 Equity Incentive Plan (the "Stock Plan") by determining the fair value of all share-based payments to employees, including the fair value of grants of employee stock options and restricted stock awards, and records these amounts as an expense in the Consolidated Statements of Operations over the vesting period with a corresponding increase to our additional paid-in capital. For the three months and nine months ended September 30, 2015, and September 30, 2014, the increase to our operating expenses was offset by the increase to our additional paid-in capital, resulting in no net impact to our net asset value. Additionally, the Company does not record the potential tax benefits associated with the expensing of stock options or restricted stock because the Company currently intends to qualify as a regulated investment company ("RIC") under Subchapter M of the Code, and the deduction attributable to such expensing, therefore, is unlikely to provide any additional tax savings. The amount of non-cash, stock-based compensation expense recognized in the Consolidated Statements of Operations is based on the fair value of the awards the Company expects to vest, recognized over the vesting period on a straight-line basis for each award, and adjusted for actual awards vested and pre-vesting forfeitures. The forfeiture rate is estimated at the time of grant and revised, if necessary, in subsequent periods if the actual forfeiture rate differs from the estimated rate and is accounted for in the current period and prospectively. See "Note 9. Stock-Based Compensation" for further discussion.
Rent expense. Our lease at 1450 Broadway, New York, New York, commenced on January 21, 2010. The lease expires on December 31, 2019. The base rent is $36 per square foot with a 2.5 percent increase per year over the 10 years of the lease, subject to a full abatement of rent for four months and a rent credit for six months throughout the lease term. We apply these rent abatements, credits, escalations and landlord payments on a straight-line basis in the determination of rent expense over the lease term. Certain leasehold improvements were also paid for on our behalf by the landlord, the cost of which is accounted for as property and equipment and "Deferred rent" in the accompanying Consolidated Statements of Assets and Liabilities. These leasehold improvements are depreciated over the lease term. We also currently lease office space in California and leased office space in North Carolina until December 31, 2014.
Realized Gain or Loss and Unrealized Appreciation or Depreciation of Portfolio Investments. Realized gain or loss is recognized when an investment is disposed of and is computed as the difference between the Company's cost basis in the investment at the disposition date and the net proceeds received from such disposition. Realized gains and losses on investment transactions are determined by specific identification. Unrealized appreciation or depreciation is computed as the difference between the fair value of the investment and the cost basis of such investment.
Income Taxes. As we currently intend to continue to qualify as a RIC under Subchapter M of the Code and distribute any ordinary income, the Company does not accrue for income taxes. The Company has capital loss carryforwards that can be used to offset net realized capital gains. The Company recognizes interest and penalties in income tax expense. We pay federal, state and local income taxes on behalf of our wholly owned subsidiary, Ventures, which is a C corporation. See "Note 10. Income Taxes" for further discussion.
Foreign Currency Translation. The accounting records of the Company are maintained in U.S. dollars. All assets and liabilities denominated in foreign currencies are translated into U.S. dollars based on the rate of exchange of such currencies against U.S. dollars on the date of valuation. The Company does not isolate the portion of the results of operations that arises from changes in foreign currency rates on investments held on its Consolidated Statements of Operations.
| 42 |
Securities Transactions. Securities transactions are accounted for on the date the transaction for the purchase or sale of the securities is entered into by the Company (i.e., trade date).
Concentration of Credit Risk. The Company places its cash and cash equivalents with financial institutions and, at times, cash held in depository accounts may exceed the Federal Deposit Insurance Corporation insured limit.
Recent Accounting Pronouncements. In April 2015, the Financial Accounting Standards Board (“FASB”) issued Accounting Standards Update No. 2015-03, “Simplifying the Presentation of Debt Issuance Costs” (“ASU 2015-03”), which changes the presentation of debt issuance costs in financial statements. ASU 2015-03 requires an entity to present such costs in the balance sheet as a direct deduction from the related debt liability rather than as an asset. Amortization of the costs will continue to be reported as interest expense. It is effective for annual reporting periods beginning after December 15, 2016. Early adoption is permitted. The new guidance will be applied retrospectively to each prior period presented. The adoption of ASU 2015-03 is not anticipated to have a material impact on the Company's consolidated financial statements.
NOTE 4. BUSINESS RISKS AND UNCERTAINTIES
We invest primarily in privately held companies, the securities of which are inherently illiquid. We also have investments in small publicly traded companies. Although these companies are publicly traded, their stock may not trade at high volumes, which may restrict our ability to sell our positions and prices can be volatile. We may also be subject to restrictions on transfer and/or other lock-up provisions after these companies initially go public. These privately held and publicly traded businesses tend to not have attained profitability, and many of these businesses also lack management depth and have limited or no history of operations. Because of the speculative nature of our investments and the lack of a liquid market for and restrictions on transfers of privately held investments, there is greater risk of loss relative to traditional marketable investment securities.
We do not choose investments based on a strategy of diversification. We also do not rebalance the portfolio should one of our portfolio companies increase in value substantially relative to the rest of the portfolio. Therefore, the value of our portfolio may be more vulnerable to microeconomic events affecting a single sector, industry or portfolio company and to general macroeconomic events that may be unrelated to our portfolio companies. These factors may subject the value of our portfolio to greater volatility than a company that follows a diversification strategy. As of September 30, 2015, and December 31, 2014, our largest 10 investments by value accounted for approximately 79 percent and 82 percent, respectively, of the value of our equity-focused venture capital portfolio. Our largest three investments, by value, Metabolon, Inc., Adesto Technologies Corporation and D-Wave Systems, Inc., accounted for approximately 15 percent, 11 percent and 11 percent, respectively, of our equity-focused venture capital portfolio at September 30, 2015. Our largest three investments, by value, Adesto Technologies Corporation, Metabolon, Inc., and Enumeral Biomedical Holdings, Inc., accounted for approximately 17 percent, 12 percent and 10 percent, respectively, of our equity-focused venture capital portfolio at December 31, 2014. Metabolon, Adesto Technologies and D-Wave Systems are privately held portfolio companies. Enumeral Biomedical Holdings is a publicly traded portfolio company.
| 43 |
Approximately 89 percent of the portion of our equity-focused venture capital portfolio that was fair valued was comprised of securities of 25 privately held companies, the securities of publicly traded Champions Oncology, Inc., the warrants of OpGen, Inc., and certain warrants and restricted securities of Enumeral Biomedical Holdings, Inc. Approximately 0.3 percent of the portion of our equity-focused venture capital portfolio that was valued according to the equity method was comprised of one privately held company. Because there is typically no public or readily ascertainable market for our interests in the small privately held companies in which we invest, the valuation of the securities in that portion of our portfolio is determined in good faith by our Valuation Committee, which is comprised of all of the independent members of our Board of Directors. The values are determined in accordance with our Valuation Procedures and are subject to significant estimates and judgments. The fair value of the securities in our portfolio may differ significantly from the values that would be placed on these securities if a ready market for the securities existed. Any changes in valuation are recorded in our Consolidated Statements of Operations as "Net decrease (increase) in unrealized depreciation on investments." Changes in valuation of any of our investments in privately held companies from one period to another may be significant.
NOTE 5. DEBT
The Company has a Loan Facility with Orix Corporate Capital, Inc., which may be used to fund investments in portfolio companies. The Loan Facility, among other things, matures on September 30, 2017, and bears interest at 10 percent per annum in cash. The Company has the option to have interest accrue at a rate of 13.5 percent per annum if the Company decides not to pay interest in cash monthly. The Company currently plans to pay interest in cash if and when any borrowings are outstanding. The Loan Facility also requires payment of a draw fee on each borrowing equal to 1.0 percent of such borrowing and an unused commitment fee of 1.0 percent per annum. Fee payments under the Loan Facility are made quarterly in arrears. The Company may prepay the loans or reduce the aggregate commitments under the Loan Facility at any time prior to the maturity date, as long as certain conditions are met, including payment of required prepayment or termination fees. The Loan Facility is secured by all of the assets of the Company and its wholly owned subsidiaries, subject to certain customary exclusions. The Loan Facility contains certain affirmative and negative covenants, including without limitation: (a) maintenance of certain minimum liquidity requirements; (b) maintenance of an eligible asset leverage ratio of not less than 4.0:1.0; (c) limitations on liens; (d) limitations on the incurrence of additional indebtedness; and (e) limitations on structural changes, mergers and disposition of assets (other than in the normal course of our business activities).
At September 30, 2015, and December 31, 2014, the Company had outstanding debt of $5,000,000 and $0, respectively. The weighted average annualized interest rate for the three months and nine months ended September 30, 2015, was 10 percent, exclusive of amortization of closing fees and other expenses. We had no debt outstanding during 2014, and, therefore, there was no applicable interest rate for that period. The weighted average debt outstanding for the three months and nine months ended September 30, 2015, was $5,000,000 and $3,369,963, respectively. The remaining capacity under the Loan Facility was $15,000,000 at September 30, 2015. Unamortized fees and expenses of $349,760 and $480,921 related to establishing the Loan Facility are included as "Prepaid expenses" in the Consolidated Statements of Assets and Liabilities as of September 30, 2015, and December 31, 2014, respectively. These amounts are amortized over the term of the Loan Facility, and $131,160 was amortized in the nine months ended September 30, 2015, and in the nine months ended September 30, 2014. The Company paid $38,333 and $126,250 in non-utilization fees during the three months and nine months ended September 30, 2015, respectively. The Company paid $51,111 and $151,667 in non-utilization fees during the three months and nine months ended September 30, 2014, respectively. During the nine months ended September 30, 2015, the Company paid a $50,000 utilization fee associated with a drawdown of the Loan Facility. At September 30, 2015, the Company was in compliance with all covenants required by the Loan Facility.
| 44 |
NOTE 6. FAIR VALUE OF INVESTMENTS
At September 30, 2015, our financial assets valued at fair value were categorized as follows in the fair value hierarchy:
| Fair Value Measurement at Reporting Date Using: | ||||||||||||||||
| Unadjusted Quoted | ||||||||||||||||
| Prices in Active | Significant Other | Significant | ||||||||||||||
| Markets for Identical | Observable Inputs | Unobservable Inputs | ||||||||||||||
| Description | September 30, 2015 | Assets (Level 1) | (Level 2) | (Level 3) | ||||||||||||
| Privately Held Portfolio Companies: | ||||||||||||||||
| Preferred Stock | $ | 52,119,263 | $ | 0 | $ | 0 | $ | 52,119,263 | ||||||||
| Bridge Notes | 3,212,725 | 0 | 0 | 3,212,725 | ||||||||||||
| Warrants | 837,502 | 0 | 0 | 837,502 | ||||||||||||
| Rights to Milestone Payments | 5,058,083 | 0 | 0 | 5,058,083 | ||||||||||||
| Common Stock | 561,773 | 0 | 0 | 561,773 | ||||||||||||
| Senior Secured Debt | 100,975 | 0 | 0 | 100,975 | ||||||||||||
| Subordinated Secured Debt | 968,050 | 0 | 0 | 968,050 | ||||||||||||
| Options | 1,875 | 1,875 | ||||||||||||||
| Publicly Traded Portfolio | ||||||||||||||||
| Companies: | ||||||||||||||||
| Common Stock | $ | 8,377,239 | $ | 6,772,090 | $ | 1,579,284 | $ | 25,865 | ||||||||
| Total Investments: | $ | 71,237,485 | $ | 6,772,090 | $ | 1,579,284 | $ | 62,886,111 | ||||||||
| Funds Held in Escrow From Sales of Investments: | $ | 374,851 | $ | 0 | $ | 0 | $ | 374,851 | ||||||||
| Total Financial Assets: | $ | 71,612,336 | $ | 6,772,090 | $ | 1,579,284 | $ | 63,260,962 | ||||||||
| 45 |
Financial Instruments Disclosed, but not Carried, at Fair Value
The following table presents the carrying value and the fair value of the Company's financial liabilities disclosed, but not carried, at fair value as of September 30, 2015, and the level of each financial liability within the fair value hierarchy:
| Description | Carrying Value | Fair Value | Level 1 | Level 2 | Level 3 | |||||||||||||||
| Term Loan Credit Facility(1) | $ | 5,000,000 | $ | 5,000,000 | $ | 0 | $ | 0 | $ | 5,000,000 | ||||||||||
| Total | $ | 5,000,000 | $ | 5,000,000 | $ | 0 | $ | 0 | $ | 5,000,000 | ||||||||||
| (1) | Fair value of the Term Loan Credit Facility is equal to the carrying amount of this credit facility. |
Significant Unobservable Inputs
The table below presents the valuation technique and quantitative information about the significant unobservable inputs utilized by the Company in the fair value measurements of Level 3 assets. Unobservable inputs are those inputs for which little or no market data exists and, therefore, require an entity to develop its own assumptions.
Fair Value at September 30, 2015 | Valuation Technique(s) | Unobservable Input | Range (Weighted Average(a)) | |||||||
| Preferred Stock | $ | 7,824,156 | Hybrid Approach | Private Offering Price Volatility Time to Exit | $1.08 - $2.17 ($2.08) 46.8% - 97.1% (51.07%) 1.75 - 2 Years (1.77) | |||||
| Preferred Stock | 22,176,766 | Income Approach | Private Offering Price Non-Performance Risk Volatility Time to Exit | $0 - $11.56 ($2.47) 0% - 75% (0.91%) 50.7% - 116.4% (64.08%) 1.25 - 4.5 Years (2.72) | ||||||
| Preferred Stock | 22,118,341 | Market Approach | Private Offering Price Volatility Revenue Multiples Time to Exit Discount for Lack of Marketability | $0 - $2.90 ($1.57) 0% - 50% (26.16%) 0 - 4.6 (2.24) 0.25 - 2 Years (1.02) 0% - 16.6% (11.8%) | ||||||
| Bridge Notes | 1,111,551 | Income Approach | Private Offering Price | $1.00 ($1.00) | ||||||
| Bridge Notes | 2,101,174 | Market Approach | Private Offering Price | $1.00 ($1.00) | ||||||
| 46 |
Fair Value at September 30, 2015 | Valuation Technique(s) | Unobservable Input | Range (Weighted Average(a)) | |||||||
| Common Stock | 243,483 | Hybrid Approach | Private Offering Price Volatility Time to Exit | $1.08 ($1.08) 97.1% (97.1%) 2 Years (2) | ||||||
| Common Stock | 318,269 | Income Approach | Private Offering Price Volatility Time to Exit | $3.71 ($3.71) 50.7% (50.7%) 3 Years (3) | ||||||
| Common Stock | 21 | Market Approach | Private Offering Price | $0.0001 - $0.001 ($0.0001) | ||||||
| Warrants | 174,033 | Market Approach | Volume Weighted Average Price | 0.58 (0.58) | ||||||
| Warrants | 663,469 | Income Approach | Stock Price Volatility Expected Term | $0 - $6.48 ($1.12) 33.7% - 111.61% (73.53%) 1.25 - 9.39 Years (4.65) | ||||||
| Rights to Milestone Payments | 5,058,083 | Probability Weighted Discounted Cash Flow | Probability of Achieving Independent Milestones Probability of Achieving Dependent Milestones | 0% - 100% (45%) 0% - 100% (60%) | ||||||
| Subordinated Secured Debt | 968,050 | Income Approach | Effective Yield | 18.1% (18.1%) | ||||||
| Senior Secured Debt | 100,975 | Income Approach | Effective Yield | 15.8% (15.8%) | ||||||
| Funds Held in Escrow From Sales of Investments | 374,851 | Market Approach | Escrow Discount | 50% (50%) | ||||||
| Options | 1,875 | Income Approach | Stock Price Volatility Expected Term | $0.40 ($0.40) 81.4% (81.4%) 0.83 Years (0.83) | ||||||
| OTC Traded Common Stock | 25,865 | Market Approach | Stock Price Discount for Lack of Marketability | $0.40 ($0.40) 50% (50%) | ||||||
| Total | $ | 63,260,962 | ||||||||
| (a) | Weighted average based on fair value at September 30, 2015. |
| 47 |
Valuation Methodologies and Inputs for Level 3 Assets
The following sections describe the valuation techniques and significant unobservable inputs used to measure Level 3 assets.
Preferred Stock, Bridge Notes and Common Stock
Preferred stock, bridge notes and common stock are valued by either a market, income or hybrid approach using internal models with inputs, most of which are not market observable. Common inputs for valuing Level 3 preferred stock, bridge note and private common stock investments include prices from recently executed private transactions in a company’s securities or unconditional firm offers, revenue multiples of comparable publicly traded companies, merger and acquisition ("M&A") transactions consummated by comparable companies, discounts for lack of marketability, rights and preferences of the class of securities we own as compared with other classes of securities the portfolio company has issued, particularly related to potential liquidity scenarios of an initial public offering ("IPO") or an acquisition transaction, estimated time to exit, volatilities of comparable publicly traded companies and management’s best estimate of risk attributable to non-performance risk. Certain securities are valued using the present value of future cash flows. We define non-performance risk as the risk that the price per share (or implied valuation of a portfolio company) or the effective yield of a debt security of a portfolio company, as applicable, does not appropriately represent the risk that a portfolio company with negative cash flow will be: (a) unable to raise capital, will need to be shut down and will not return our invested capital; or (b) able to raise capital, but at a valuation significantly lower than the implied post-money valuation of the last round of financing. We assess non-performance risk for each private portfolio company quarterly. Our assessment of non-performance risk typically includes an evaluation of the financial condition and operating results of the company, the company's progress towards milestones, and the long-term potential of the business and technology of the company and how this potential may or may not affect the value of the shares owned by us. An increase to the non-performance risk or a decrease in the private offering price of a future round of financing from that of the most recent round would result in a lower fair value measurement and/or a change in the distribution of value among the classes of securities we own. An increase in the volatility assumption generally increases the enterprise value calculated in an option pricing model. An increase in the time to exit assumption also generally increases the enterprise value calculated in an option pricing model. Variations in the expected time to exit or expected volatility assumptions have a significant impact on fair value. We may also consider changes in market values for sets of comparable companies when recent private transaction information is not available.
Option pricing models place a high weighting on liquidation preferences, which means that small differences in how the preferences are structured can have a material effect on the fair value of our securities at the time of valuation and also on future valuations should additional rounds of financing occur with senior preferences. As such, valuations calculated by option pricing models may not increase if 1) rounds of financing occur at higher prices per share, 2) liquidation preferences include multiples on investment, 3) the amount of invested capital is small and/or 4) liquidation preferences are senior to prior rounds of financing.
Bridge notes commonly contain terms that provide for the conversion of the full amount of principal, and sometimes interest, into shares of preferred stock at a defined price per share and/or the price per share of the next round of financing. The use of a discount for non-performance risk in the valuation of bridge notes would indicate the potential for conversion of only a portion of the principal, plus interest when applicable, into shares of preferred stock or the potential that a conversion event will not occur and that the likely outcome of a liquidation of assets would result in payment of less than the remaining principal outstanding of the note. An increase in non-performance risk would result in a lower fair value measurement.
| 48 |
Warrants and Options
We use the Black-Scholes-Merton option-pricing model to determine the fair value of warrants and options held in our portfolio unless there is a publicly traded active market for such warrants and options or another indication of value such as a sale of the portfolio company. Option pricing models, including the Black-Scholes-Merton model, require the use of subjective input assumptions, including expected volatility, expected life, expected dividend rate, and expected risk-free rate of return. In the Black-Scholes-Merton model, variations in the expected volatility or expected term assumptions have a significant impact on fair value. Because certain securities underlying the warrants in our portfolio are not publicly traded, many of the required input assumptions are more difficult to estimate than they would be if a public market for the underlying securities existed.
An input to the Black-Scholes-Merton option-pricing model is the value per share of the type of stock for which the warrant is exercisable as of the date of valuation. This input is derived according to the methodologies discussed in "Preferred Stock, Bridge Notes and Common Stock."
Rights to Milestone Payments
Rights to milestone payments are valued using a probability-weighted discounted cash flow model. As part of Amgen Inc.’s acquisition of our former portfolio company, BioVex Group, Inc., we are entitled to potential future milestone payments based upon the achievement of certain regulatory and sales milestones. We are also entitled to future milestone payments from Laird Technologies Inc.'s acquisition of our former portfolio company, Nextreme Thermal Solutions, Inc., and from Canon, Inc.'s acquisition of Molecular Imprints, Inc. We assign probabilities to the achievements of the various milestones. Milestones identified as independent milestones can be achieved irrespective of the achievement of other contractual milestones. Dependent milestones are those that can only be achieved after another, or series of other, milestones are achieved. The interest rates used in these models are observable inputs from sources such as the published interest rates for corporate bonds of the acquiring or comparable companies.
Subordinated Secured Debt and Senior Secured Debt
We invest in venture debt investments through subordinated secured debt and senior secured debt. We value these securities using an income approach. The income approach uses valuation techniques to convert future amounts (for example, cash flows or earnings) to a single present value amount (discounted). The measurement is based on the value indicated by current market expectations about those future amounts. Common inputs for valuing Level 3 debt investments include: the effective yield of the debt investment or, in the case where we have received warrant coverage, the warrant-adjusted effective yield of the security, adjustments for changes in the yields of comparable publicly traded high-yield debt funds and risk-free interest rates and an assessment of non-performance risk. For venture debt investments, an increase in yields would result in a lower fair value measurement. Furthermore, yields would decrease, and value would increase, if the company is exceeding targets and risk has been substantially reduced from the level of risk that existed at the time of investment. Yields would increase, and values would decrease, if the company is failing to meet its targets and risk has been increased from the level of risk that existed at the time of investment. Historically, we also invested in venture debt through participation agreements. As of December 31, 2014, the amounts held in participation agreements consisted solely of warrants. These warrants are valued using the Black-Scholes-Merton pricing model as discussed in "Warrants and Options." The participation agreements were sold in 2015.
| 49 |
The following chart shows the components of change in the financial assets categorized as Level 3 for the three months ended September 30, 2015.
Beginning 7/1/2015 | Total Realized Gains (Losses) Included in Changes in Net Assets | Transfers | Total Unrealized (Depreciation) Appreciation Included in Changes in Net Assets | Investments in Portfolio Companies, Interest on Bridge Notes, and Amortization of Loan Fees, Net | Disposals and Settlements | Ending Balance 9/30/2015 | Amount of Total (Depreciation) Appreciation for the Period Included in Changes in Net Assets Attributable to the Change in Unrealized Gains or Losses Relating to Assets Still Held at the Reporting Date | |||||||||||||||||||||||||
| Preferred Stock | $ | 63,882,805 | $ | 0 | $ | 0 | $ | (13,513,549 | ) | $ | 1,750,007 | $ | 0 | $ | 52,119,263 | $ | (13,513,549 | ) | ||||||||||||||
| Bridge Notes | 5,194,358 | 1,790,891 | 0 | (2,090,749 | ) | 747,427 | (2,429,202 | ) | 3,212,725 | (3,356,937 | ) | |||||||||||||||||||||
| Common Stock | 452,129 | 0 | 0 | 109,644 | 0 | 0 | 561,773 | 109,644 | ||||||||||||||||||||||||
| Warrants | 1,023,104 | (528,469 | ) | 201,558 | 141,309 | 0 | 0 | 837,502 | 82,935 | |||||||||||||||||||||||
| Rights to Milestone Payments | 3,181,183 | 0 | 0 | 1,876,900 | 0 | 0 | 5,058,083 | 1,876,900 | ||||||||||||||||||||||||
| Subordinated Secured Debt | 987,025 | 0 | 0 | (20,537 | ) | 1,562 | 0 | 968,050 | (20,537 | ) | ||||||||||||||||||||||
| Senior Secured Debt | 764,253 | 0 | 0 | (108,422 | ) | 42,453 | (597,309 | ) | 100,975 | (108,422 | ) | |||||||||||||||||||||
| Funds Held in Escrow From Sales of Investments | 372,835 | 2,016 | 0 | 0 | 0 | 0 | 374,851 | 0 | ||||||||||||||||||||||||
| Options | 38,536 | 0 | 0 | (36,661 | ) | 0 | 0 | 1,875 | (36,661 | ) | ||||||||||||||||||||||
| OTC Traded Common Stock | 7,707,262 | 0 | (7,698,444 | ) | 17,047 | 0 | 0 | 25,865 | 521,145 | |||||||||||||||||||||||
| Total | $ | 83,603,490 | $ | 1,264,438 | $ | (7,496,886 | ) | $ | (13,625,018 | ) | $ | 2,541,449 | $ | (3,026,511 | ) | $ | 63,260,962 | $ | (14,445,482 | ) | ||||||||||||
| 50 |
We elected to use the beginning of period values to recognize transfers in and out of Level 2 and Level 3 investments. For the three months ended September 30, 2015, there were transfers out of Level 3 investments totaling $7,496,886. Certain of our shares of Enumeral Biomedical Holdings, Inc., and OpGen, Inc., transferred from Level 3 investments owing to the use of their unadjusted closing share price on their respective stock exchanges on September 30, 2015, to derive their value.
The following chart shows the components of change in the financial assets categorized as Level 3 for the nine months ended September 30, 2015.
Beginning Balance 1/1/2015 | Total Realized Gains (Losses) Included in Changes in Net Assets | Transfers | Total Unrealized (Depreciation) Appreciation Included in Changes in Net Assets | Investments in Portfolio Companies, Interest on Bridge Notes, and Amortization of Loan Fees, Net | Disposals and Settlements | Ending Balance 9/30/2015 | Amount of Total (Depreciation) Appreciation for the Period Included in Changes in Net Assets Attributable to the Change in Unrealized Gains or Losses Relating to Assets Still Held at the Reporting Date | |||||||||||||||||||||||||
| Preferred Stock | $ | 70,969,603 | $ | 3,351,833 | $ | (231,361 | )1 | $ | (20,121,000 | ) | $ | 3,684,034 | $ | (5,533,846 | ) | $ | 52,119,263 | $ | (18,211,065 | ) | ||||||||||||
| Bridge Notes | 2,163,916 | 1,790,891 | (1,630,121 | ) | 653,728 | 2,663,513 | (2,429,202 | ) | 3,212,725 | (612,460 | ) | |||||||||||||||||||||
| Common Stock | 535,280 | 0 | (74,379 | ) | 100,872 | 0 | 0 | 561,773 | 100,872 | |||||||||||||||||||||||
| Warrants | 2,026,864 | (911,957 | ) | 0 | (525,754 | ) | 272,349 | (24,000 | ) | 837,502 | (777,815 | ) | ||||||||||||||||||||
| Rights to Milestone Payments | 3,193,865 | 0 | 0 | 1,864,218 | 0 | 0 | 5,058,083 | 1,864,218 | ||||||||||||||||||||||||
| Senior Secured Debt | 1,203,299 | 0 | 0 | (394,805 | ) | 75,899 | (783,418 | ) | 100,975 | (394,805 | ) | |||||||||||||||||||||
| Subordinated Secured Debt | 979,450 | 0 | 0 | (25,563 | ) | 14,163 | 0 | 968,050 | (25,563 | ) | ||||||||||||||||||||||
| Funds Held in Escrow From Sales of Investments | 306,802 | (58,923 | ) | 126,972 | 1 | 0 | 0 | 0 | 374,851 | 0 | ||||||||||||||||||||||
| Options | 50,690 | 0 | 0 | (48,815 | ) | 0 | 0 | 1,875 | (48,815 | ) | ||||||||||||||||||||||
| OTC Traded Common Stock | 7,251,178 | 0 | (8,020,281 | ) | (87,684 | ) | 882,652 | 0 | 25,865 | (87,684 | ) | |||||||||||||||||||||
| Total | $ | 88,680,947 | $ | 4,171,844 | $ | (9,829,170 | ) | $ | (18,584,803 | ) | $ | 7,592,610 | $ | (8,770,466 | ) | $ | 63,260,962 | $ | (18,193,117 | ) | ||||||||||||
1There was a $126,972 transfer from "Preferred Stock" into "Funds Held in Escrow From Sales of Investments" owing to the sale of Molecular Imprints, Inc.
| 51 |
For the nine months ended September 30, 2015, there were transfers out of Level 3 investments totaling $9,829,170. Our shares of Accelerator IV-New York Corporation transferred from a Level 3 investment owing to its qualification as an equity method investment. Certain of our shares of Enumeral Biomedical Holdings, Inc., and OpGen, Inc., transferred from Level 3 investments owing to the use of their unadjusted closing share price on their respective stock exchanges on September 30, 2015, to derive their value.
At December 31, 2014, our financial assets were categorized as follows in the fair value hierarchy:
| Fair Value Measurement at Reporting Date Using: | ||||||||||||||||
| Description | December 31, 2014 | Unadjusted Quoted Prices in Active Markets for Identical Assets (Level 1) | Significant Other Observable Inputs (Level 2) | Significant Unobservable Inputs (Level 3) | ||||||||||||
| Privately Held Portfolio Companies: | ||||||||||||||||
| Preferred Stock | $ | 70,969,603 | $ | 0 | $ | 0 | $ | 70,969,603 | ||||||||
| Bridge Notes | 2,163,916 | 0 | 0 | 2,163,916 | ||||||||||||
| Warrants | 2,026,864 | 0 | 0 | 2,026,864 | ||||||||||||
| Rights to Milestone Payments | 3,193,865 | 0 | 0 | 3,193,865 | ||||||||||||
| Common Stock | 535,280 | 0 | 0 | 535,280 | ||||||||||||
| Senior Secured Debt | 1,203,299 | 0 | 0 | 1,203,299 | ||||||||||||
| Subordinated Secured Debt | 979,450 | 0 | 0 | 979,450 | ||||||||||||
| Options | 50,690 | 0 | 0 | 50,690 | ||||||||||||
| Publicly Traded Portfolio Companies: | ||||||||||||||||
| Common Stock | $ | 8,641,873 | $ | 1,390,695 | $ | 0 | $ | 7,251,178 | ||||||||
| Total Investments: | $ | 89,764,840 | $ | 1,390,695 | $ | 0 | $ | 88,374,145 | ||||||||
| Funds Held in Escrow From | ||||||||||||||||
| Sales of Investments: | $ | 306,802 | $ | 0 | $ | 0 | $ | 306,802 | ||||||||
| Total Financial Assets: | $ | 90,071,642 | $ | 1,390,695 | $ | 0 | $ | 88,680,947 | ||||||||
| 52 |
The following chart shows the components of change in the financial assets categorized as Level 3 for the year ended December 31, 2014.
Beginning Balance 1/1/2014 | Total Realized (Losses) Gains Included in Changes in Net Assets | Transfers | Total Unrealized Appreciation (Depreciation) Included in Changes in Net Assets | Investments in Portfolio Companies, Interest on Bridge Notes, and Amortization of Loan Fees, Net | Disposals and Settlements | Ending Balance 12/31/2014 | Amount of Total (Depreciation) Appreciation for the Period Included in Changes in Net Assets Attributable to the Change in Unrealized Gains or Losses Relating to Assets Still Held at the Reporting Date | |||||||||||||||||||||||||
| Preferred Stock | $ | 71,577,059 | $ | (7,472,760 | ) | $ | (371,644 | )1,2 | $ | 5,555,721 | $ | 8,191,037 | $ | (6,509,810 | ) | $ | 70,969,603 | $ | (6,283,994 | ) | ||||||||||||
| Bridge Notes | 6,044,114 | (50,000 | ) | (4,968,041 | )1 | (2,253,312 | ) | 3,434,976 | (43,821 | ) | 2,163,916 | (2,303,312 | ) | |||||||||||||||||||
| Common Stock | 108,668 | 0 | 1,130,362 | 1 | (919,782 | ) | 216,032 | 0 | 535,280 | (919,782 | ) | |||||||||||||||||||||
| Warrants | 800,487 | 0 | 65,250 | 1 | 519,818 | 641,309 | 0 | 2,026,864 | 519,818 | |||||||||||||||||||||||
| Rights to Milestone Payments | 3,489,433 | 536,813 | 629,670 | 608,904 | 0 | (2,070,955 | ) | 3,193,865 | 608,904 | |||||||||||||||||||||||
| Participation Agreements | 777,195 | 84,371 | 0 | (68,196 | ) | 5,892 | (799,262 | ) | 0 | 0 | ||||||||||||||||||||||
| Senior Secured Debt | 1,511,828 | 0 | 0 | 17,364 | (12,536 | ) | (313,357 | ) | 1,203,299 | 17,364 | ||||||||||||||||||||||
| Subordinated Secured Debt | 0 | 0 | 0 | 197 | 979,253 | 0 | 979,450 | 197 | ||||||||||||||||||||||||
| Funds Held in Escrow From Sales of Investments | 1,786,390 | 270,241 | 625,000 | 2 | 0 | 0 | (2,374,829 | ) | 306,802 | 0 | ||||||||||||||||||||||
| Options | 0 | 0 | 0 | 50,690 | 0 | 0 | 50,690 | 50,690 | ||||||||||||||||||||||||
| OTC Traded Common Stock | 0 | 0 | 2,889,403 | 1 | 3,402,150 | 959,625 | 0 | 7,251,178 | 3,402,150 | |||||||||||||||||||||||
| Total | $ | 86,095,174 | $ | (6,631,335 | ) | $ | 0 | $ | 6,913,554 | $ | 14,415,588 | $ | (12,112,034 | ) | $ | 88,680,947 | $ | (4,907,965 | ) | |||||||||||||
1Transfers among asset classes are owing to conversions at financing events. These do not represent transfers in or out of Level 3.
2 There was a $625,000 transfer from "Preferred Stock" into "Funds Held in Escrow From Sales of Investments" owing to the sale of Molecular Imprints, Inc., to Canon, Inc.
There were no transfers out of Level 3 investments during the year ended December 31, 2014.
| 53 |
The following chart shows the components of change in the financial assets categorized as Level 3 for the three months ended September 30, 2014.
Beginning Balance 7/1/2014 | Total Realized (Losses) Gains Included in Changes in Net Assets | Transfers | Total Unrealized Appreciation (Depreciation) Included in Changes in Net Assets | Investments in Portfolio Companies, Interest on Bridge Notes, and Amortization of Loan Fees, Net | Disposals and Settlements | Ending Balance 9/30/2014 | Amount of Total Appreciation (Depreciation) for the Period Included in Changes in Net Assets Attributable to the Change in Unrealized Gains or Losses Relating to Assets Still Held at the Reporting Date | |||||||||||||||||||||||||
| Preferred Stock | $ | 82,918,390 | $ | (4,488,575 | ) | $ | (3,376,258 | )1 | $ | 267,065 | $ | 0 | $ | (21,420 | )2 | $ | 75,299,202 | $ | (4,242,929 | ) | ||||||||||||
| Bridge Notes | 2,514,976 | 0 | (206,902 | )1 | (646,690 | ) | 624,016 | 0 | 2,285,400 | (646,690 | ) | |||||||||||||||||||||
| Common Stock | 546,767 | 0 | 693,757 | 1 | (89,116 | ) | 216,032 | 0 | 1,367,440 | (89,116 | ) | |||||||||||||||||||||
| Warrants | 921,633 | 0 | 0 | 602,860 | 540,375 | 0 | 2,064,868 | 602,860 | ||||||||||||||||||||||||
| Rights to Milestone Payments | 4,127,104 | 536,813 | 0 | 587,325 | 0 | (2,070,955 | )3 | 3,180,287 | 587,325 | |||||||||||||||||||||||
| Participation Agreements | 675,165 | 16,000 | 0 | 11,209 | 3,291 | (554,240 | ) | 151,425 | 16,100 | |||||||||||||||||||||||
| Senior Secured Debt | 1,305,901 | 0 | 0 | (74,590 | ) | 16,552 | (86,121 | ) | 1,161,742 | (74,590 | ) | |||||||||||||||||||||
| Funds Held in Escrow From Sales of Investments | 1,447,933 | (2,454 | ) | 0 | 0 | 0 | (1,139,514 | ) | 305,965 | 0 | ||||||||||||||||||||||
| Options | 0 | 0 | 0 | 62,945 | 0 | 0 | 62,945 | 62,945 | ||||||||||||||||||||||||
| OTC Traded Common Stock | 0 | 0 | 2,889,403 | 1 | 5,008,416 | 959,625 | 0 | 8,857,444 | 5,008,416 | |||||||||||||||||||||||
| Total | $ | 94,457,869 | $ | (3,938,216 | ) | $ | 0 | $ | 5,729,424 | $ | 2,359,891 | $ | (3,872,250 | ) | $ | 94,736,718 | $ | 1,224,321 | ||||||||||||||
1Transfers among asset classes are owing to conversions at financing events. These do not represent transfers in or out of Level 3.
2Represents a settlement of $21,420 from the disposal of Contour Energy Systems, Inc. This was a receivable as of September 30, 2014.
3Represents a settlement of $2,070,955 from the achievement of the first milestone associated with Amgen's acquisition of BioVex Group, Inc. This was a receivable as of September 30, 2014.
There were no transfers out of Level 3 investments during the three months ended September 30, 2014.
| 54 |
The following chart shows the components of change in the financial assets categorized as Level 3 for the nine months ended September 30, 2014.
Beginning Balance 1/1/2014 | Total Realized (Losses) Gains Included in Changes in Net Assets | Transfers | Total Unrealized Appreciation (Depreciation) Included in Changes in Net Assets | Investments in Portfolio Companies, Interest on Bridge Notes, and Amortization of Loan Fees, Net | Disposals and Settlements | Ending Balance 9/30/2014 | Amount of Total Appreciation (Depreciation) for the Period Included in Changes in Net Assets Attributable to the Change in Unrealized Gains or Losses Relating to Assets Still Held at the Reporting Date | |||||||||||||||||||||||||
| Preferred Stock | $ | 71,577,059 | $ | (7,474,688 | ) | $ | (629,931 | )1,2 | $ | 10,493,609 | $ | 7,841,034 | $ | (6,507,881 | )3 | $ | 75,299,202 | $ | (1,346,108 | ) | ||||||||||||
| Bridge Notes | 6,044,114 | (50,000 | ) | (4,709,754 | )1 | (1,771,015 | ) | 2,772,055 | 0 | 2,285,400 | (1,821,018 | ) | ||||||||||||||||||||
| Common Stock | 108,668 | 0 | 1,130,362 | 1 | (87,622 | ) | 216,032 | 0 | 1,367,440 | (87,622 | ) | |||||||||||||||||||||
| Warrants | 800,487 | 0 | 65,250 | 1 | 557,822 | 641,309 | 0 | 2,064,868 | 557,822 | |||||||||||||||||||||||
| Rights to Milestone Payments | 3,489,433 | 536,813 | 629,670 | 595,326 | 0 | (2,070,955 | )4 | 3,180,287 | 595,326 | |||||||||||||||||||||||
| Participation Agreements | 777,195 | 16,000 | 0 | (7,022 | ) | 5,892 | (640,640 | ) | 151,425 | 37,023 | ||||||||||||||||||||||
| Senior Secured Debt | 1,511,828 | 0 | 0 | (171,866 | ) | 46,212 | (224,432 | ) | 1,161,742 | (171,866 | ) | |||||||||||||||||||||
| Funds Held in Escrow From Sales of Investments | 1,786,390 | 269,404 | 625,000 | 2 | 0 | 0 | (2,374,829 | ) | 305,965 | 0 | ||||||||||||||||||||||
| Options | 0 | 0 | 0 | 62,945 | 0 | 0 | 62,945 | 62,945 | ||||||||||||||||||||||||
| OTC Traded Common Stock | 0 | 0 | 2,889,403 | 1 | 5,008,416 | 959,625 | 0 | 8,857,444 | 5,008,416 | |||||||||||||||||||||||
| Total | $ | 86,095,174 | $ | (6,702,471 | ) | $ | 0 | $ | 14,680,593 | $ | 12,482,159 | $ | (11,818,737 | ) | $ | 94,736,718 | $ | 2,834,918 | ||||||||||||||
1Transfers among asset classes are owing to conversions at financing events. These do not represent transfers in or out of Level 3.
2 There was a $625,000 transfer from "Preferred Stock" into "Funds Held in Escrow From Sales of Investments" owing to the sale of Molecular Imprints, Inc., to Canon, Inc.
3Includes a settlement of $21,420 from the disposal of Contour Energy Systems, Inc. This was a receivable as of September 30, 2014.
4Represents a settlement of $2,070,955 from the achievement of the first milestone associated with Amgen's acquisition of BioVex Group, Inc. This was a receivable as of September 30, 2014.
There were no transfers out of Level 3 investments during the nine months ended September 30, 2014.
| 55 |
NOTE 7. DERIVATIVES
At September 30, 2015, and December 31, 2014, we had rights to milestone payments from Amgen, Inc.’s acquisition of our former portfolio company, BioVex Group, Inc. These milestone payments were fair valued at $3,794,540 and $2,564,917 as of September 30, 2015, and December 31, 2014, respectively. At September 30, 2015, and December 31, 2014, we had rights to milestone payments from Laird Technologies, Inc.'s acquisition of our former portfolio company, Nextreme Thermal Solutions, Inc. These milestone payments were fair valued at $0 as of September 30, 2015, and December 31, 2014. At September 30, 2015, and December 31, 2014, we had rights to milestone payments from Canon, Inc.'s acquisition of our former portfolio company, Molecular Imprints, Inc. These milestone payments were fair valued at $1,263,543 and $628,948 as of September 30, 2015, and December 31, 2014, respectively. These milestone payments are contingent upon certain milestones being achieved in the future.
The following tables present the value of derivatives held at September 30, 2015, and the effect of derivatives held during the three months ended September 30, 2015, along with the respective location in the financial statements.
| Statements of Assets and Liabilities: | ||||||||||||||
| Assets | Liabilities | |||||||||||||
| Derivatives | Location | Fair Value | Location | Fair Value | ||||||||||
| Amgen, Inc. Rights to Milestone Payments from Acquisition of BioVex Group, Inc. | Investments | $ | 3,794,540 | — | — | |||||||||
| Laird Technologies, Inc. Rights to Milestone Payments from Acquisition of Nextreme Thermal Solutions, Inc. | Investments | $ | 0 | — | — | |||||||||
| Canon, Inc. Rights to Milestone Payments from Acquisition of Molecular Imprints, Inc. | Investments | $ | 1,263,543 | — | — | |||||||||
| 56 |
Statements of Operations for the Three Months Ended September 30, 2015: | ||||||||||
| Derivatives | Location | Realized Gain/(Loss) | Change in unrealized Appreciation | |||||||
| Amgen, Inc. Rights to Milestone Payments from Acquisition of BioVex Group, Inc. | Net Realized and Unrealized Gain (Loss) | $ | 0 | $ | 1,245,279 | |||||
| Laird Technologies, Inc. Rights to Milestone Payments from Acquisition of Nextreme Thermal Solutions, Inc. | Net Realized and Unrealized Gain (Loss) | $ | 0 | $ | 0 | |||||
| Canon, Inc. Rights to Milestone Payments from Acquisition of Molecular Imprints, Inc. | Net Realized and Unrealized Gain (Loss) | $ | 0 | $ | 631,621 | |||||
Statements of Operations for the Nine Months Ended September 30, 2015: | ||||||||||
| Derivatives | Location | Realized Gain/(Loss) | Change in unrealized Appreciation | |||||||
| Amgen, Inc. Rights to Milestone Payments from Acquisition of BioVex Group, Inc. | Net Realized and Unrealized Gain (Loss) | $ | 0 | $ | 1,229,623 | |||||
| Laird Technologies, Inc. Rights to Milestone Payments from Acquisition of Nextreme Thermal Solutions, Inc. | Net Realized and Unrealized Gain (Loss) | $ | 0 | $ | 0 | |||||
| Canon, Inc. Rights to Milestone Payments from Acquisition of Molecular Imprints, Inc. | Net Realized and Unrealized Gain (Loss) | $ | 0 | $ | 634,595 | |||||
The following tables present the value of derivatives held at December 31, 2014, and the effect of derivatives held during the year ended December 31, 2014, along with the respective location in the financial statements.
| 57 |
| Statements of Assets and Liabilities: | ||||||||||||||
| Assets | Liabilities | |||||||||||||
| Derivatives | Location | Fair Value | Location | Fair Value | ||||||||||
| Equity Contracts | — | — | Written call options payable | $ | 0 | |||||||||
| Amgen, Inc. Rights to Milestone Payments from Acquisition of BioVex Group, Inc. | Investments | $ | 2,564,917 | — | — | |||||||||
| Laird Technologies, Inc. Rights to Milestone Payments from Acquisition of Nextreme Thermal Solutions, Inc. | Investments | $ | 0 | — | — | |||||||||
| Canon, Inc. Rights to Milestone Payments from Acquisition of Molecular Imprints, Inc. | Investments | $ | 628,948 | — | — | |||||||||
| Statements of Operations: | ||||||||||
| Derivatives | Location | Realized Gain/(Loss) | Change
in unrealized Appreciation | |||||||
| Equity Contracts | Net Realized and Unrealized (Loss) Gain | $ | 232,079 | $ | (8,882 | ) | ||||
| Amgen, Inc. Rights to Milestone Payments from Acquisition of BioVex Group, Inc. | Net Realized and Unrealized (Loss) Gain | $ | 536,813 | $ | 609,626 | |||||
| Laird Technologies, Inc. Rights to Milestone Payments from Acquisition of Nextreme Thermal Solutions, Inc. | Net Realized and Unrealized (Loss) Gain | $ | 0 | $ | 0 | |||||
| Canon, Inc. Rights to Milestone Payments from Acquisition of Molecular Imprints, Inc. | Net Realized and Unrealized (Loss) Gain | $ | 0 | $ | (722 | ) | ||||
NOTE 8. EMPLOYEE BENEFITS
We administer a plan to provide medical and dental insurance for retirees and their spouses who, at the time of their retirement, have 10 years of service with us and have attained 50 years of age or have attained 45 years of age and have 15 years of service with us (the "Medical Benefit Retirement Plan"). On March 7, 2013, the Board of Directors amended the Medical Benefit Retirement Plan. The amendment limits the medical benefit to $10,000 per year for a period of ten years. The amendment does not affect benefits accrued by former employees or one current employee who is grandfathered under the former terms of the plan.
| 58 |
Our accumulated post-retirement benefit obligation was re-measured as of the plan amendment date, which resulted in a $1,101,338 decrease in our liability. A deferred gain of $1,101,338 owing to this amendment was included in "Accumulated other comprehensive income" as of March 31, 2013. This amount is being amortized over a service period of 5.27 years. During the three months and nine months ended September 30, 2015, a total of $52,246 and $156,738, respectively, was amortized and included as a reduction of "Salaries, benefits and stock-based compensation" on our Consolidated Statements of Operations.
NOTE 9. STOCK-BASED COMPENSATION
The Company maintains the Stock Plan, which provides for the grant of equity-based awards of stock options to our officers and employees and restricted stock to our officers, employees and non-employee directors subject to compliance with the 1940 Act and an exemptive order granted on April 3, 2012, by the SEC permitting us to award shares of restricted stock (the "Exemptive Order").
Stock Option Awards
During the nine months ended September 30, 2015, and the year ended December 31, 2014, the Compensation Committee of the Board of Directors of the Company did not grant any stock options.
The stock options outstanding are fully vested and have, therefore, been fully expensed.
For the three months and nine months ended September 30, 2014, the Company recognized $0 and $92,758, respectively, of compensation expense in the Consolidated Statements of Operations related to stock options.
For the nine months ended September 30, 2015, and September 30, 2014, no options were exercised.
A summary of the changes in outstanding stock options for the nine months ended September 30, 2015, is as follows:
| Weighted | Weighted Average | |||||||||||||||||||
| Weighted | Average | Remaining | Aggregate | |||||||||||||||||
| Average | Grant Date | Contractual | Intrinsic | |||||||||||||||||
| Shares | Exercise Price | Fair Value | Term (Years) | Value | ||||||||||||||||
| Options Outstanding at January 1, 2015 | 1,423,912 | $ | 9.77 | $ | 6.28 | 1.68 | $ | 0 | ||||||||||||
| Granted | 0 | 0 | 0 | 0 | ||||||||||||||||
| Exercised | 0 | 0 | 0 | 0 | ||||||||||||||||
| Forfeited or Expired | (21,000 | ) | 4.80 | 2.21 | 0 | |||||||||||||||
| Options Outstanding and Exercisable at September 30, 2015 | 1,402,912 | $ | 9.85 | $ | 6.34 | 0.96 | $ | 0 | ||||||||||||
| 59 |
The aggregate intrinsic value in the table above with respect to outstanding options is calculated as the difference between the Company's closing stock price of $2.14 on September 30, 2015, and the exercise price, multiplied by the number of in-the-money options. This amount represents the total pre-tax intrinsic value that would have been received by the option holders had all option holders exercised their awards on September 30, 2015.
Restricted Stock
For the three months and nine months ended September 30, 2015, we recognized $185,991 and $617,972, respectively, of compensation expense related to restricted stock awards. As of September 30, 2015, there was unrecognized compensation cost of $1,255,133 related to restricted stock awards. This cost is expected to be recognized over a remaining weighted average period of approximately 1.1 years.
Non-vested restricted stock awards as of September 30, 2015, and changes during the nine months ended September 30, 2015, were as follows:
| Shares | Weighted-Average Grant Date Fair Value Per Share | |||||||
| Outstanding at January 1, 2015 | 1,165,495 | $ | 2.73 | |||||
| Granted | 10,000 | 2.72 | ||||||
| Vested based on service | (40,842 | ) | 3.39 | |||||
| Shares withheld related to net share settlement of restricted stock | (17,325 | ) | 3.37 | |||||
| Forfeited | (3,999 | ) | 3.44 | |||||
| Outstanding at September 30, 2015 | 1,113,329 | $ | 2.69 | |||||
Non-vested restricted stock awards as of September 30, 2014, and changes during the nine months ended September 30, 2014, were as follows:
| Shares | Weighted-Average Grant Date Fair Value Per Share | |||||||
| Outstanding at January 1, 2014 | 1,504,518 | $ | 2.78 | |||||
| Granted | 40,360 | 3.01 | ||||||
| Vested based on service | (48,226 | ) | 3.32 | |||||
| Shares withheld related to net share settlement of restricted stock | (21,658 | ) | 3.37 | |||||
| Forfeited | (144,000 | ) | 2.75 | |||||
| Outstanding at September 30, 2014 | 1,330,994 | $ | 2.76 | |||||
| 60 |
Under net settlement procedures currently applicable to our outstanding restricted stock awards for current employees, upon each settlement date, restricted stock awards are withheld to cover the required withholding tax, which is based on the value of the restricted stock award on the settlement date as determined by the closing price of our common stock on the vesting date. The remaining amounts are delivered to the recipient as shares of our common stock. During the nine months ended September 30, 2015, 58,167 restricted stock awards vested, of which 49,500 restricted stock awards were net settled by withholding 17,325 shares, which represented the employees' minimum statutory obligation for each such employee's applicable income and other employment taxes and remitted cash totaling $47,644 to the appropriate tax authorities. During the nine months ended September 30, 2014, 69,884 restricted stock awards vested, of which 61,880 restricted stock awards were net settled by withholding 21,658 shares, which represented the employees' minimum statutory obligation for each such employee's applicable income and other employment taxes and remitted cash totaling $68,872 to the appropriate tax authorities. The amount remitted to the tax authorities for the employees' tax obligation was reflected as a financing activity within our Consolidated Statements of Cash Flows. The shares withheld by us as a result of the net settlement of restricted stock awards are not considered issued and outstanding, thereby reducing our shares outstanding used to calculate net asset value per share.
NOTE 10. INCOME TAXES
We have elected to be treated as a RIC under the Code and operate in a manner so as to qualify for the tax treatment applicable to RICs.
In order to qualify as a RIC, we must, in general, (1) annually, derive at least 90 percent of our gross income from dividends, interest, gains from the sale of securities and similar sources; (2) quarterly, meet certain investment diversification requirements; and (3) annually, distribute at least 90 percent of our investment company taxable income as a dividend. We may either distribute or retain our net capital gain from investments, but any net capital gain not distributed will be subject to corporate income tax and the excise tax described below to the extent not offset by the capital loss carryforward. We currently intend to consider designating net capital gains for distribution as "cash dividends," "designated undistributed capital gains" or "deemed dividends" or some combination thereof. We will be subject to a four percent excise tax to the extent we fail to distribute at least 98 percent of our annual net ordinary income and 98.2 percent of our capital gain net income and would be subject to income tax to the extent we fail to distribute 100 percent of our investment company taxable income. As of January 1, 2015, we had capital loss carryforwards of $9,775,492, which we intend to use to offset current year capital gains, if any. During the nine months ended September 30, 2015, we realized net capital gains of $4,224,413.
Because of the specialized nature of our investment portfolio, we generally can satisfy the diversification requirements under the Code if we receive a certification from the SEC pursuant to Section 851(e) of the Code that we are "principally engaged in the furnishing of capital to other corporations which are principally engaged in the development or exploitation of inventions, technological improvements, new processes, or products not previously generally available."
| 61 |
We have received SEC certification since 1999, including for 2014, pursuant to Section 851(e) of the Code. There can be no assurance that we will qualify for or receive certification for 2015 or subsequent years (to the extent we need additional certification) or that we will actually qualify for Subchapter M treatment in subsequent years. In addition, under certain circumstances, even if we qualified for Subchapter M treatment in a given year, we might take action in a subsequent year to ensure that we would be taxed in that subsequent year as a C Corporation, rather than as a RIC.
For the three months ended September 30, 2015, and September 30, 2014, we paid $376 and $1,676, respectively, in federal, state and local taxes. For the nine months ended September 30, 2015, and September 30, 2014, we paid $2,081 and $17,662, respectively, in federal, state and local taxes. At September 30, 2015, and September 30, 2014, we had $0 accrued for federal, state and local taxes payable by the Company.
We pay federal, state and local taxes primarily related to sublease income generated by Ventures, which is taxed as a C Corporation. For the three months ended September 30, 2015, and 2014, our income tax expense for Ventures was $325 and $1,676, respectively. For the nine months ended September 30, 2015, and 2014, our income tax expense for Ventures was $1,125 and $16,733, respectively.
NOTE 11. CHANGE IN NET ASSETS PER SHARE
The following table sets forth the computation of basic and diluted per share net increases (decreases) in net assets resulting from operations for the three months and nine months ended September 30, 2015, and September 30, 2014.
| For the Three Months Ended September 30 | For the Nine Months Ended September 30 | |||||||||||||||
| 2015 | 2014 | 2015 | 2014 | |||||||||||||
| Numerator for decrease in net assets per share resulting from operations | $ | (16,904,625 | ) | $ | (910,852 | ) | $ | (22,356,159 | ) | $ | (3,058,474 | ) | ||||
| Denominator for basic weighted average shares | 31,251,950 | 31,245,664 | 31,272,790 | 31,215,069 | ||||||||||||
| Basic net decrease in net assets per share resulting from operations | $ | (0.54 | ) | $ | (0.03 | ) | $ | (0.71 | ) | $ | (0.10 | ) | ||||
| Denominator for diluted weighted average shares | 31,251,950 | 31,245,664 | 31,272,790 | 31,215,069 | ||||||||||||
| Diluted net decrease in net assets per share resulting from operations1 | $ | (0.54 | ) | $ | (0.03 | ) | $ | (0.71 | ) | $ | (0.10 | ) | ||||
| Anti-dilutive shares by type: | ||||||||||||||||
| Stock Options | 1,402,912 | 1,425,372 | 1,402,912 | 1,425,372 | ||||||||||||
| Restricted Stock | 220,329 | 353,994 | 220,329 | 345,935 | ||||||||||||
| Total anti-dilutive shares | 1,623,241 | 1,779,366 | 1,623,241 | 1,771,307 | ||||||||||||
1A total of 839,000 and 973,000 performance-based shares of restricted stock were outstanding at September 30, 2015, and September 30, 2014, respectively. These shares vest when the volume-weighted stock price is at or above pre-determined stock price targets over a 30-day period. These pre-determined stock price targets range from $5.00 per share to $9.00 per share. These shares were not included in the computation of diluted net asset value per share because as of the end of the reporting period none of the pre-determined stock price targets were met.
| 62 |
For the nine months ended September 30, 2015, and September 30, 2014, the calculation of net decrease in net assets resulting from operations per diluted share did not include stock options or shares of restricted stock because such shares were anti-dilutive. Stock options and restricted stock awards may be dilutive in future periods in which there are both a net increase in net assets resulting from operations and either significant increases in our average stock price or significant decreases in the amount of unrecognized compensation cost during the period.
NOTE 12. COMMITMENTS AND CONTINGENCIES
On July 21, 2014, the Company made an investment in Accelerator IV-New York Corporation ("Accelerator") for a 9.6 percent interest in the company. This investment was diluted to 9.0 percent through follow-on financings by Accelerator in which the Company did not participate. Accelerator will be identifying emerging biotechnology companies for the Company to invest in directly over a five-year period. If the Company defaults on these commitments, the other investors may purchase the Company's shares of Accelerator for $0.001 per share. In the event of default, the Company would still be required to contribute the remaining operating commitment.
The Company's aggregate operating and investment commitments in Accelerator amounted to $666,667 and $3,333,333, respectively. During the nine months ended September 30, 2015, $262,215 in capital was called, all of which related to the operating commitment. As of September 30, 2015, the Company had remaining unfunded commitments of $188,440 and $3,333,333, or approximately 28.3 percent and 100 percent, of the total operating and investment commitments, respectively. The withdrawal of contributed capital is not permitted. The transfer or assignment of capital is subject to approval by Accelerator.
NOTE 13. SHARE REPURCHASE PROGRAM
On August 6, 2015, our Board of Directors authorized a repurchase of up $2.5 million of the Company’s common stock in the open market within a six-month period. Under the repurchase program, we may, but we are not obligated to, repurchase our outstanding common stock in the open market from time to time provided that we comply with the prohibitions under our Insider Trading Policies and Procedures and the guidelines specified in Rule 10b-18 of the Securities Exchange Act of 1934, as amended, including certain price, market volume and timing constraints. In addition, any repurchases will be conducted in accordance with the 1940 Act. During the quarter ended September 30, 2015, we repurchased 298,819 shares at an average price of approximately $2.47 per share, inclusive of commissions. This represents a discount of approximately 11.8 percent of the net asset value per share at September 30, 2015. The total dollar amount of shares repurchased in this period is $737,662, leaving a maximum of $1,762,338 available for future program purchases.
NOTE 14. SUBSEQUENT EVENTS
On October 1, 2015, the Company received proceeds of $795,567 upon the achievement of the first milestone associated with the sale of Molecular Imprints, Inc., to Canon, Inc.
| 63 |
On October 27, 2015, Adesto Technologies Corporation completed an IPO priced at $5.00 per share, trading on the NASDAQ Capital Market under the symbol "IOTS." The Company invested $1,000,000 in the offering. On November 6, 2015, the closing price of Adesto's shares of common stock was $5.41.
On October 30, 2015, the Company made a $250,000 follow-on investment in Produced Water Absorbents, Inc., a privately held portfolio company.
During October of 2015, the Company repurchased an additional 119,365 shares of its stock at an average price of $2.20 inclusive of commissions. There is a maximum of $1,500,003 available for future program purchases.
On November 3, 2015, the initial U.S. sales milestone associated with Amgen, Inc.’s acquisition of BioVex Group, Inc., was achieved. The Company will receive proceeds of $2,070,955 related to this achievement on or before December 18, 2015.
| 64 |
|
FINANCIAL HIGHLIGHTS (Unaudited) |
| Three Months Ended Sept. 30 | Nine Months Ended Sept. 30 | |||||||||||||||
| 2015 | 2014 | 2015 | 2014 | |||||||||||||
| Per Share Operating Performance | ||||||||||||||||
| Net asset value per share, beginning | ||||||||||||||||
| of period | $ | 3.34 | $ | 3.87 | $ | 3.51 | $ | 3.93 | ||||||||
| Net operating loss* | (0.05 | ) | (0.06 | ) | (0.17 | ) | (0.19 | ) | ||||||||
| Net realized gain (loss) on investments* | 0.04 | (0.12 | ) | 0.14 | (0.16 | ) | ||||||||||
| Net (increase) decrease in unrealized | ||||||||||||||||
| depreciation on investments and | ||||||||||||||||
| written call options* (1) | (0.53 | ) | 0.15 | (0.67 | ) | 0.26 | ||||||||||
| Share of loss on equity method investment(2) | 0.00 | 0.00 | (0.01 | ) | 0.00 | |||||||||||
| Total from investment operations* | (0.54 | ) | (0.03 | ) | (0.71 | ) | (0.09 | ) | ||||||||
| Net increase as a result of stock- | ||||||||||||||||
| based compensation expense* | 0.01 | 0.01 | 0.02 | 0.02 | ||||||||||||
| Net decrease as a result of acquisition | ||||||||||||||||
| of vested restricted stock awards | ||||||||||||||||
| related to employee withholding(2) | (0.01 | ) | 0.00 | (0.01 | ) | (0.01 | ) | |||||||||
| Total (decrease) increase from capital | ||||||||||||||||
| stock transactions | 0.00 | 0.01 | 0.01 | 0.01 | ||||||||||||
| Net (decrease) increase as a result of | ||||||||||||||||
| other comprehensive income*(2) | 0.00 | 0.00 | (0.01 | ) | 0.00 | |||||||||||
| Net (decrease) increase in net asset value | (0.54 | ) | (0.02 | ) | (0.71 | ) | (0.08 | ) | ||||||||
| Net asset value per share, end | ||||||||||||||||
| of period | $ | 2.80 | $ | 3.85 | $ | 2.80 | $ | 3.85 | ||||||||
| Stock price per share, end | ||||||||||||||||
| of period | $ | 2.14 | $ | 2.98 | $ | 2.14 | $ | 2.98 | ||||||||
| Total return based on stock price | (22.18 | )% | (6.29 | )% | (27.46 | )% | 0.00 | % | ||||||||
| Supplemental Data: | ||||||||||||||||
| Net assets, end of period | $ | 86,974,196 | $ | 120,158,974 | $ | 86,974,196 | $ | 120,158,974 | ||||||||
| Ratio of expenses, excluding taxes, | ||||||||||||||||
| to average net assets(3) | 1.91 | % | 1.64 | % | 5.78 | % | 5.26 | % | ||||||||
| Ratio of expenses, including taxes, | ||||||||||||||||
| to average net assets(3) | 1.91 | % | 1.64 | % | 5.79 | % | 5.27 | % | ||||||||
| Ratio of net operating loss to | ||||||||||||||||
| average net assets(3) | (1.66 | )% | (1.56 | )% | (5.12 | )% | (4.95 | )% | ||||||||
| Average debt outstanding | $ | 5,000,000 | $ | 0.00 | $ | 3,369,963 | $ | 0.00 | ||||||||
| Average debt per share | $ | 0.16 | $ | 0.00 | $ | 0.11 | $ | 0.00 | ||||||||
| Number of shares outstanding, | ||||||||||||||||
| end of period | 31,022,866 | 31,245,664 | 31,022,866 | 31, 245,664 | ||||||||||||
| * | Based on Average Shares Outstanding |
| (1) | Net unrealized gains (losses) includes rounding adjustments to reconcile change in net asset value per share. See "Item 2. Management's Discussion and Analysis of Financial Condition and Results of Operations" for a description of unrealized losses on investments. |
| (2) | Amounts listed as zero are amounts calculated as less than $0.005. |
| (3) | Not annualized. |
The accompanying unaudited notes are an integral part of this schedule.
| 65 |
Item 2. Management's Discussion and Analysis of Financial Condition and Results of Operations
The information contained in this section should be read in conjunction with the Company's unaudited September 30, 2015, Consolidated Financial Statements and the Company's audited 2014 Consolidated Financial Statements and notes thereto.
Cautionary Statement Regarding Forward-Looking Statements
This Quarterly Report on Form 10-Q contains forward-looking statements that involve substantial risks and uncertainties. These forward-looking statements are not historical facts, but rather are based on current expectations, estimates and projections about the Company, our current and prospective portfolio investments, our industry, our beliefs, and our assumptions. Words such as "anticipates," "expects," "intends," "plans," "will," "may," "continue," "believes," "seeks," "estimates," "would," "could," "should," "targets," "projects," and variations of these words and similar expressions are intended to identify forward-looking statements. The forward-looking statements contained in this Quarterly Report involve risks and uncertainties, including statements as to:
| • | our future operating results; |
| • | our business prospects and the prospects of our portfolio companies; |
| • | the impact of investments that we expect to make; |
| • | our contractual arrangements and relationships with third parties; |
| • | the dependence of our future success on the general economy and its impact on the industries in which we invest; |
| • | the ability of our portfolio companies to achieve their objectives; |
| • | our expected financings and investments; |
| • | the adequacy of our cash resources and working capital; and |
| • | the timing of cash flows, if any, from the operations and/or monetization of our positions in our portfolio companies. |
These statements are not guarantees of future performance and are subject to risks, uncertainties, and other factors, some of which are beyond our control and difficult to predict and could cause actual results to differ materially from those expressed or forecasted in the forward-looking statements, including without limitation:
| • | an economic downturn could impair our portfolio companies’ ability to continue to operate, which could lead to the loss of some or all of our investments in such portfolio companies; |
| • | a contraction of available credit and/or an inability to access the equity markets could impair our investment activities; |
| 66 |
| • | interest rate volatility could adversely affect our results, particularly if we elect to use leverage as a material part of our investment strategy; |
| • | currency fluctuations could adversely affect the results of our investments in foreign companies, particularly to the extent that we receive payments denominated in foreign currency rather than U.S. dollars; and |
| • | the risks, uncertainties and other factors we identify in "Risk Factors" and elsewhere in this Quarterly Report on Form 10-Q and in our other filings with the Securities and Exchange Commission ("SEC"), including our Annual Report on Form 10-K for the year ended December 31, 2014. |
Although we believe that the assumptions on which these forward-looking statements are based are reasonable, any of those assumptions could prove to be inaccurate, and, as a result, the forward-looking statements based on those assumptions also could be inaccurate. Important assumptions include our ability to originate new investments, certain margins and levels of profitability and the availability of additional capital. In light of these and other uncertainties, the inclusion of a projection or forward-looking statement in this Quarterly Report on Form 10-Q should not be regarded as a representation by us that our plans and objectives will be achieved. These risks and uncertainties include those described or identified in "Risk Factors" and elsewhere in this Quarterly Report on Form 10-Q. You should not place undue reliance on these forward-looking statements, which apply only as of the date of this Quarterly Report on Form 10-Q.
We incorporated under the laws of the state of New York in August 1981. In 1983, we completed an initial public offering ("IPO"). In 1984, we divested all of our assets except Otisville BioTech, Inc., and became a financial services company with the investment in Otisville as the initial focus of our business activity.
In 1992, we registered as an investment company under the 1940 Act, commencing operations as a closed-end, non-diversified investment company. In 1995, we elected to become a BDC subject to the provisions of Sections 55 through 65 of the 1940 Act.
We build transformative companies from disruptive science. We make venture capital investments in companies enabled by multidisciplinary, disruptive science. We define venture capital investments as the money and resources made available to privately held and publicly traded small businesses with exceptional growth potential.
In 2002, we focused the company on investing in hard science companies enabled at the nanoscale and microscale. As of December 31, 2001, we had $13.4 million in net cash on our balance sheet. Over the next 13 years we raised over approximately $140 million in capital in the public markets and recycled approximately $100 million in realized capital from portfolio investments back into the Company.
| 67 |
Beginning in 2009, because of the overlap with companies enabled at the nanoscale, many of our new initial investments were in BIOLOGY+ companies. We define BIOLOGY+ investments as investments in interdisciplinary life science companies where biology is intersecting with innovations in areas such as electronics, physics, materials science, chemistry, information technology, engineering and mathematics. In 2013, we announced that all new initial investments would be in BIOLOGY+ companies. We focused our efforts on BIOLOGY+ because in looking back through our decade of investing in nanotechnology and microtechnology, we observed that our gross returns in the life sciences significantly outperformed our gross returns in electronics and in energy.
Additionally, through our involvement with nanotechnology and our current experience with BIOLOGY+, we have been front and center in the development of the technologies that are enabling precision health and precision medicine. Precision health and medicine are enabled by a series of advancements at the intersection of what is called genomics 2.0 and digital technologies. Genomics 2.0 includes genomics, metabolomics, proteomics, epigenomics, the microbiome, cellular information, tissue information and organ information. Digital technologies include the devices used to gather information as well as the interpretive tools: visualization tools, machine learning, network science tools and computational advances. We are and will continue to be involved in all of these technology areas.
During 2011, we began realizing the first exits from the portfolio we began building in 2002. As one can see below, since 2001, we have realized multiple exits from this portfolio that have generated both gains and losses on invested capital. However, as we have discussed previously in letters to shareholders, most recently in our Annual Letter to Shareholders dated March 16, 2015, we have not yet generated the “home-run” return that we need as an early-stage investor to impact significantly and positively net asset value per share and potentially lead to stock price appreciation.
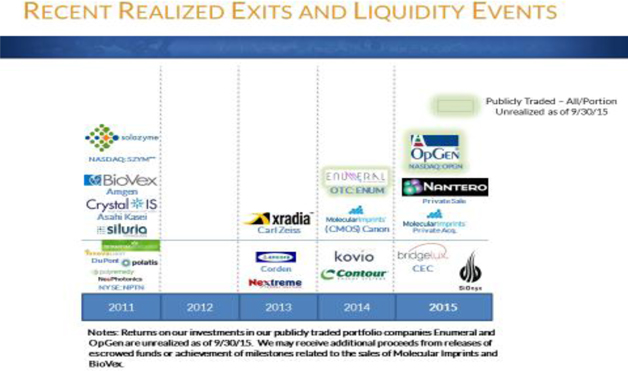
| 68 |
We believe we need to realize one or more liquidity events that have the potential to be “impactful” to Harris & Harris Group’s investors within the next two years. We define “impactful” as the ability to return in excess of $30 million to Harris & Harris Group. Furthermore, we believe it is important to have at least one impactful event that returns six to ten times our investment to create meaningful growth to our net asset value. We currently believe we have such potentially “impactful” companies in our existing portfolio, although we cannot assure when or if any of those companies will meet our internal criteria as such.
We are involved in some of the most important technologies of the coming decade. This is why we believe we have the opportunity to generate impactful returns into the future. We have built, and we continue to build, companies that are leaders in the emerging fields of the internet of things (IoT), the microbiome, machine learning, AgTech and regenerative medicine. These companies and technologies are now attracting tremendous attention, and we believe many of our portfolio companies are positioned to be leaders in their respective markets.
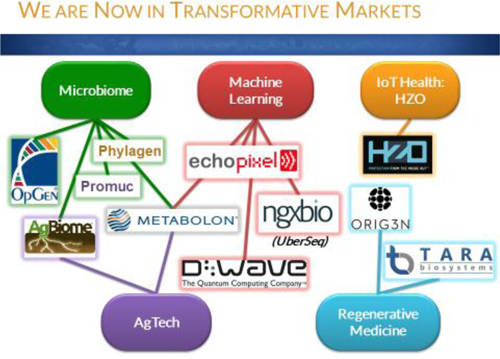
As we look to the future, our BIOLOGY+ efforts are focused in the new precision health and medicine market. We define precision health as a focus on preventative care and wellbeing. It includes not just medical technologies, but digital technologies that permit individuals to take control of their health and wellbeing at all stages of their lives, especially ahead of the period in their lives when disease becomes more prevalent and even dominant.
We believe there are three trends that will drive the new precision health industry opportunity: 1) As both investment banks, Macquarie and Barclays, point out in recent reports, there is a general shift towards consumerism in health and healthcare decisions; 2) The movement of digital technologies into the life sciences market is putting far more information at the fingertips of the individual and placing a high value on business models that can translate the power of aggregated data to the individual decision maker; and 3) The merging of new genomic data with phenotypic or environmental data, called genomics 2.0, will finally provide medically actionable information. We believe it will be driven partly by baby boomers now entering a period in their lives where disease becomes prevalent, and partly by “millennial” populations that are digitally savvy and taking control of their healthcare decisions.
| 69 |
In conjunction with our focus on BIOLOGY+, we have shifted from investing in a wide variety of companies in multiple markets to building fewer companies focused on precision health and medicine. In the companies we are now building, we believe we have the potential to have greater ownership, impact and control. The number of companies in our portfolio will decrease in size over the coming years, but the potential impact of each company within our portfolio will become greater. We believe this is the best way to build companies that can create the necessary impact for our shareholders.
We do not believe our stock price reflects the current or future value of the companies we are a part of building at Harris & Harris Group. When there is such a disconnect in the potential value of our Company and the price reflected in the stock, we believe one of the best investments we can make is in our own stock. Utilizing the cash the Company has received from the monetization of some of our portfolio companies in 2015, our Board of Directors has authorized the repurchase of up to $2.5 million of our shares in the open market at prices that may be above or below the net asset value as reported in our most recently published financial statements. We anticipate that the manner, timing, and amount of any share purchases will be determined by our management based upon the evaluation of market conditions, stock price, and additional factors in accordance with regulatory requirements. Pursuant to the Investment Company Act of 1940, as amended, we are required to notify shareholders when such a program is initiated or implemented. The repurchase program does not require us to acquire any specific number of shares and may be extended, modified, or discontinued at any time. During the quarter ended September 30, 2015, we repurchased 298,819 shares at an average price of approximately $2.47 per share, inclusive of commissions. This represents a discount of approximately 11.8 percent of the net asset value per share at September 30, 2015. The total dollar amount of shares repurchased in this period is $737,662, leaving a maximum of $1,762,338 available for future program purchases as of September 30, 2015. We subsequently repurchased an additional 119,365 shares at an average price of approximately $2.20 per share for a total cost of $262,335.
Each quarter we provide detail on our investment portfolio and trends in venture capital that may impact our shareholders. We organize this detail as follows: Realizations and potential liquidity in the portfolio, maturity of the portfolio, ownership and investment in the portfolio, investing trends, current business environment, valuation information, and, finally, results of operations.
"Realize" refers to realizing value in our venture capital portfolio. Since our investment in Otisville in 1983 through September 30, 2015, we have made a total of 104 equity-focused venture capital investments. We have completely exited 75 and partially exited two of these 104 investments, recognizing aggregate net realized gains of $88,600,201 on invested capital of $133,290,596, or 1.7 times invested capital. For the securities of the 25 privately held companies in our equity-focused portfolio held at September 30, 2015, we have net unrealized depreciation of $41,974,258 on invested capital of $99,098,346. We have aggregate net realized gains on our exited companies, offset by unrealized depreciation for our 25 currently held equity-focused investments of $46,625,943 on invested capital of $232,388,942.
| 70 |
The amount of net realized gains includes the following exits in 2014 and 2015:
| · | Realized gains of $1,790,891 from the repayment of certain bridge notes of Black Silicon Holdings, Inc., from the proceeds received from the sale of its wholly owned subsidiary, SiOnyx, Inc. On August 3, 2015, SiOnyx, Inc., reorganized its corporate structure to become a subsidiary of a new company, Black Silicon Holdings. At the time of reorganization, our warrants in SiOnyx were cancelled, and we realized a loss of $231,656 on those securities. Our security holdings of SiOnyx converted into securities of Black Silicon Holdings. SiOnyx was then acquired by an undisclosed buyer. Black Silicon Holdings received cash and a profit interest in the undisclosed buyer that is held through our ownership in Black Silicon Holdings; |
| · | Realized gains of $3,109,347 from the sale of our investment in Nantero, Inc., on invested capital of $1,718,706; |
| · | Realized gains of $242,485 from the sale of the non-semiconductor business of Molecular Imprints, Inc., on invested capital of $928,884; |
| · | Realized gains of $3,949,818 from the sale of the semiconductor lithography equipment business of Molecular Imprints, Inc., to Canon, Inc., on invested capital of $2,848,041; |
| · | Realized gains of $296,972 from the sale of shares of Champions Oncology, Inc., on invested capital of $576,971; |
| · | Realized gains of $536,813 from rights to milestone payments resulting from the achievement during the third quarter of 2014 of the first milestone associated with Amgen, Inc.'s acquisition of BioVex Group, Inc.; |
| · | Realized loss of $7,299,533 on our investment in Kovio, Inc., on invested capital of $7,299,533. On January 21, 2014, substantially all of Kovio's assets were sold by Square 1 Bank, Kovio's secured creditor, to Thin Film Electronics ASA. Our shares were subsequently declared worthless on February 19, 2014; and |
| · | Realized loss of $4,488,576 on our investment in Contour Energy Systems, Inc., on invested capital of $4,509,995. On August 15, 2014, the stockholders of Contour Energy Systems were given official notice of its liquidation and dissolution, which was approved by its board of directors following the approval of the majority of the stockholders. |
The aggregate net realized gains and the cumulative invested capital do not reflect the cost or value of our freely tradable shares of Champions Oncology, Inc., that we owned as of September 30, 2015. The aggregate net realized gains also do not include potential milestone payments that could occur as part of the acquisitions of BioVex Group, Inc., Nextreme Thermal Solutions, Inc., or Molecular Imprints, Inc., at points in time in the future. If these amounts were included as of September 30, 2015, our aggregate net realized gains and cumulative invested capital from 1983 through September 30, 2015, would be $95,359,508 and $137,300,503, respectively, or 1.7 times invested capital. These amounts also do not include our shares of Enumeral Biomedical Holdings, Inc., and OpGen, Inc., that, while traded publicly, are restricted and/or are subject to lock-up agreements.
| 71 |
Recent and Potential Liquidity Events From Our Portfolio as of September 30, 2015
On June 11, 2015, the Company and an undisclosed buyer entered into a Share Purchase Agreement for the purchase by such buyer of the Company's shares of preferred stock of Nantero, Inc. Upon execution of the Agreement, the Company received $4,828,052 in proceeds from the sale.
On April 18, 2014, Canon, Inc., completed its acquisition of Molecular Imprints, Inc.'s semiconductor lithography equipment business. On October 1, 2015, the Company received proceeds of $795,567 upon the achievement of the first milestone associated with this transaction. We could receive an additional $625,000 from amounts held in escrow as well as up to $938,926 upon the achievement of certain additional milestones. As of September 30, 2015, we valued the remaining potential milestone payments from the sale of Molecular Imprints at $1,263,543, which includes the $795,567 received on October 1, 2015. There can be no assurance as to the timing and how much of the remaining amount we will ultimately realize in the future, if any. With the closing of the transaction, a new spin-out company, which retained the name "Molecular Imprints, Inc.," was formed to continue development and commercialization of nanoscale patterning in consumer and biomedical applications, and we became a shareholder of the new company.
On May 1, 2015, this new spin-out of Molecular Imprints, Inc.'s non-semiconductor business was acquired. Upon closing of the transaction, we received our initial payment of $705,794 and 24,897 shares of Series B Preferred Stock of the acquiring company. As of September 30, 2015, additional proceeds of $126,972 and 4,394 shares of Series B Preferred Stock of the acquiring party are held in an indemnity escrow and $3,386 is held in a stockholder representative funding escrow until May 1, 2016. There can be no assurance as to how much of these amounts we will ultimately realize. As of September 30, 2015, we valued the funds and the shares of stock held in escrow from the sale of Molecular Imprints at $63,440 and $26,246, respectively.
As of September 30, 2015, we valued the remaining potential milestone payments from the sale of BioVex Group, Inc., at $3,794,540. If all the remaining milestone payments were to be paid by Amgen, Inc., we would receive an additional $7,455,438. There can be no assurance as to the timing and how much of this amount we will ultimately realize in the future.
As of September 30, 2015, we valued potential milestone payments from the sale of Nextreme Thermal Solutions, Inc., to Laird Technologies, Inc., at $0.
Enumeral Biomedical Holdings is traded publicly on the OTC market under the symbol ENUM. Certain of the Company's shares of Enumeral Biomedical Holdings are subject to restrictions on transfer, and we are also subject to a lock-up agreement that restricts our ability to trade all securities of Enumeral owned by us, exclusive of the general restriction on the transfer of unregistered securities. The lock-up period on our 7,966,368 shares of Enumeral Biomedical Holdings expires on January 31, 2016. ENUM's stock closed trading on November 6, 2015, at $0.30 per share.
On May 5, 2015, OpGen, Inc., completed an IPO. As of that date, the company's common stock and warrants trade on the NASDAQ Capital Market under the symbols OPGN and OPGNW, respectively. With the close of the offering, our preferred stock and certain of our bridge notes were converted into shares of common stock of OpGen. We invested $1.8 million in the IPO, inclusive of $650,000 in outstanding demand notes. Certain of our shares and warrants of OpGen are subject to restrictions on transfer and/or lock-up agreements. The lock-up period on these securities expired on November 2, 2015. OpGen's common stock closed trading on November 6, 2015, at $1.90 per share.
| 72 |
In July 2015, SynGlyco negotiated the acceleration and settlement of payments due to it from the sale of its synthesis business to Corden Pharmaceuticals. This acceleration of payments yielded proceeds that paid off in full our senior secured debt investment with a payment to us of $567,500. We expect to receive additional repayments for our outstanding secured convertible bridge notes of approximately $750,000 from this transaction. Additionally, SynGlyco entered into two license agreements that may provide additional payments in the future. These payments will bring our total cash distributions from this investment to approximately $1.7 million. We invested a total of $8.8 million in SynGlyco, beginning with our initial investment in 2007 and valued our securities of the company at $916,273 as of September 30, 2015.
On July 21, 2015, Bridgelux signed a definitive agreement to be acquired by an investment group led by China Electronics Corporation and ChongQing Linkong Development Investment Company. The close of this transaction is subject to customary regulatory approvals.
In August 2015, SiOnyx, Inc., reorganized its corporate structure to become a subsidiary of a new company, Black Silicon Holdings, Inc. Our security holdings of SiOnyx converted into securities of Black Silicon Holdings. SiOnyx was then acquired by an undisclosed buyer. We received proceeds of $2,429,202 and a profit interest in the undisclosed buyer that is held through our ownership in Black Silicon Holdings.
On October 27, 2015, Adesto Technologies Corporation completed an IPO priced at $5.00 per share, trading on the NASDAQ Capital Market under the symbol "IOTS." The Company invested $1,000,000 in the offering. On November 6, 2015, the closing price of Adesto's shares of common stock was 5.41.
Our companies often plan for and/or begin the process of pursuing potential sales and/or IPOs of those companies by hiring bankers and/or advisors to attempt to pursue such liquidity events. We consider these efforts to be in the ordinary course of business for those companies until the potential and timing of a transaction become tangible through events such as acceptance of letters of intent to acquire a company and/or the beginning of a road show to pursue an IPO.
Strategy for Managing Publicly Traded Positions
We have generated $2,469,676 in net cash premiums on call options sold and put options purchased of Solazyme since the company completed an IPO in May 2011. We have sold all of our shares of Solazyme since its IPO for net proceeds, after commission, of $22,571,157 or an average sale price of $9.80 per share. Including premiums from call and put options, the average sale price for these shares was $10.87 per share. Our average cost basis in Solazyme is $2.36 per share. During the nine months ended September 30, 2015, we sold 50,000 shares of Solazyme.
We have sold 769,295 shares of our position in Champions Oncology, Inc., in open market transactions for net proceeds, after commission, of $873,944 or an average sale price of $1.14 per share. Our average cost basis in Champions is $0.67 per share. During the nine months ended September 30, 2015, we did not sell any shares of Champions.
| 73 |
Maturity of Current Equity-Focused Venture Capital Portfolio
There are three main drivers of our potential growth in value over the next four years. First, we believe that we have a larger portfolio of more mature companies based on their relative level of development towards a liquidity event than we have had historically. Second, we believe the quality of the companies in our existing portfolio based on our view of their relative business models is stronger than it has been historically. Third, we own larger percentages of the companies in the existing portfolio than we have owned historically, which provides us with greater upside potential in the event one is successful.
As of September 30, 2015, we had 20 privately held, equity-focused companies in our portfolio that have yet to complete liquidity events (e.g., public listings or merger and acquisition ("M&A") transactions) and are not in the process of liquidating their assets. These do not include 1) our publicly traded and unrestricted shares Champions Oncology, Inc.; 2) our publicly traded shares of Enumeral Biomedical Holdings, Inc., and OpGen, Inc., which are subject to restrictions on their sale; 3) our venture debt deal with NanoTerra, Inc.; 4) our rights to milestone payments from Amgen, Inc., Laird Technologies, Inc., and Canon, Inc.; 5) our portfolio companies that are in the process of liquidating their assets or have shut down, including Cobalt Technologies, Inc., Laser Light Engines, Inc., and Ultora, Inc.; and 6) our portfolio companies, Black Silicon Holdings, Inc., and SynGlyco, Inc., that exist to collect payments from the sale of subsidiaries or assets, and Bridgelux, Inc., that entered into an acquisition agreement. As of September 30, 2015, we valued these 20 privately held equity-focused companies at $53,574,538. Including the companies referenced above, we valued our total venture capital portfolio at $71,465,864 as of September 30, 2015. At September 30, 2015, from first dollar in, the average and median holding periods for the 26 privately held equity-focused investments were 5.8 years and 5.3 years, respectively. Historically, as measured from first dollar in to last dollar out, the average and median holding periods for the 75 investments we have fully exited were 4.5 years and 3.5 years, respectively.
Our current portfolio is comprised of BIOLOGY+ and other companies at varying stages of maturity in a diverse set of industries. As our portfolio companies mature, we seek to invest in new early- and mid-stage companies that may mature into mid- and late-stage companies. This continuous progression creates a pipeline of investment maturities that may lead to future sources of positive contributions to net asset value per share as these companies mature and potentially experience liquidity and exit events. Our pipeline of investment maturities for the 23 equity-focused companies in our portfolio that are not in the process of being sold or shut down are shown in the figure below (our "Active Portfolio").
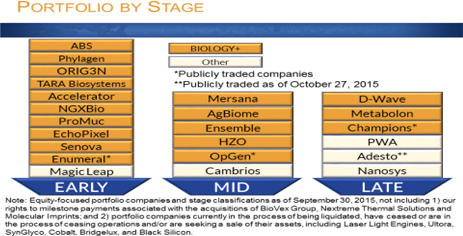
| 74 |
We expect some of our portfolio companies to transition between stages of maturity over time. This transition may be forward if the company is maturing and is successfully executing its business plan or may be backward if the company is not successfully executing its business plan or decides to change its business plan substantially from its original plan. Transitions backward may be accompanied by an increase in non-performance risk, which reduces valuation. We discuss non-performance risk and its implications on value below in the section titled "Valuation of Investments."
Ownership of Our Portfolio Companies
By studying our portfolio in greater detail, it is evident to us that potential returns from approximately half of the companies in our portfolio could be the real drivers of net asset value growth over the coming years. These companies include ones in which we have substantial ownership and ones where we currently believe the potential value at exit is substantial. The table below provides some additional detail on our ownership of the 19 privately held, equity-focused companies in our portfolio that have yet to complete liquidity events (e.g., public listings or M&A transactions) and are not in the process of liquidating their assets, excluding Phylagen, Inc., in which we invested a note in a series seed financing and in which we do not have any voting rights.
| Portfolio Company | Voting Ownership Range | |
|
EchoPixel, Inc. NGX Bio, Inc. Produced Water Absorbents, Inc. ProMuc, Inc. Senova Systems, Inc. |
>20% | |
|
ABSMaterials, Inc. Adesto Technologies Corp. TARA Biosystems, Inc. |
15-20% | |
|
HZO, Inc. ORIG3N, Inc. |
10-15% | |
|
Accelerator IV-New York Corporation AgBiome, LLC Ensemble Therapeutics Corporation Metabolon, Inc. |
5-10% | |
|
Cambrios Technologies Corporation Mersana Therapeutics, Inc. |
2.5-5% | |
|
D-Wave Systems, Inc.* Magic Leap, Inc. Nanosys, Inc.
|
0-2.5% |
*We own voting and non-voting classes of preferred equity of D-Wave Systems, Inc. If the non-voting preferred equity was included in the calculation, our ownership of D-Wave would be in the 2.5-5% range.
| 75 |
Level of Involvement in Our Portfolio Companies
The 1940 Act generally requires that BDCs offer to "make available significant managerial assistance" to portfolio companies. We are actively involved with our portfolio companies through membership on boards of directors, as observers to the boards of directors and/or through frequent communication with management. As of September 30, 2015, we held at least one board seat or observer rights on 17 of our 20 equity-focused portfolio companies that have yet to complete a liquidity event or an uplisting to a national exchange and are not in the process of being shut down or have not agreed to be acquired (85 percent).
We may be involved actively in the formation and development of business strategies of our earliest stage portfolio companies. This involvement may include hiring management, licensing intellectual property, securing space and raising additional capital. We also provide managerial assistance to late-stage companies looking for potential exit opportunities by leveraging our relationships with the banking and investment community and our knowledge and experience in running a micro-capitalization publicly traded business.
Growth in Ownership of Portfolio Companies
The chart below depicts the change in our ownership of our portfolio companies from 2001 through September 30, 2015. Our fully diluted, investment-weighted average ownership has increased from approximately five percent for initial investments made between 2001 and 2004 to approximately 16 percent for initial investments made between 2009 and 2014. This increasing ownership, which we have noted in previous shareholder communications, gives us more control over these companies to potentially affect outcomes beneficial to the Company. Over the coming five years, as companies where our initial investment was made between 2005 and the present continue to mature and exit, we believe our increased levels of ownership have the potential to provide greater returns than our historical investments.
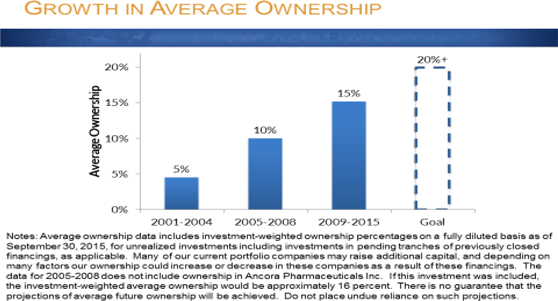
| 76 |
Our goal with our new investments is to have even greater ownership at the time of the realization of our return than we have had historically for all of the reasons discussed above.
Investments and Current Investment Pace
The following is a summary of our initial and follow-on equity-focused investments from January 1, 2011, to September 30, 2015. We consider a "round led" to be a round where we were the new investor or the leader of a group of investors in an investee company. Typically, but not always, the lead investor negotiates the price and terms of the deal with the investee company.
| 2011 | 2012 | 2013 | 2014 | Nine
Months Sept. 30, 2015 | ||||||||||||||||
| Total Incremental Investments | $ | 17,688,903 | $ | 15,141,941 | $ | 18,076,288 | $ | 14,276,808 | $ | 7,462,571 | ||||||||||
| No. of New Investments | 4 | 2 | 2 | 3 | 2 | |||||||||||||||
| No. of Follow-On Investment Rounds | 31 | 26 | 37 | 33 | 25 | |||||||||||||||
| No. of Rounds Led | 4 | 3 | 9 | 8 | 6 | |||||||||||||||
| Average Dollar Amount – Initial | $ | 1,339,744 | $ | 1,407,500 | $ | 550,001 | $ | 338,677 | $ | 225,000 | ||||||||||
| Average Dollar Amount – Follow-On | $ | 397,740 | $ | 474,113 | $ | 449,359 | $ | 401,842 | $ | 280,503 | ||||||||||
Industry Sectors of Investment
We generally classify our investments in one of three industry sectors: Life Sciences, Energy and Electronics. The interdisciplinary nature of science-based inventions enables our portfolio companies to address needs in multiple sectors rather than being confined to addressing needs in one sector. As such, many of our companies can adjust their business foci to address needs in a secondary sector should opportunities in the company’s primary sector decrease in number or magnitude.
We classify companies in our life sciences portfolio as those that address problems in life sciences-related industries, including biotechnology, agriculture, advanced materials and chemicals, diagnostics, healthcare, bioprocessing, water, industrial biotechnology, food, nutrition and energy. We classify companies that address life science-related problems as a primary or secondary sector as BIOLOGY+. With our focus on investing in BIOLOGY+ companies, we expect that the number of companies addressing life science-related industries as a primary focus will grow, while those that address electronics and energy-related sectors as a primary focus will decline. That said, we expect these companies may address electronics and energy-related sectors as a secondary sector given the interdisciplinary nature of BIOLOGY+ companies.
We classify companies in our energy portfolio as those that seek to improve performance, productivity or efficiency, and to reduce environmental impact, waste, cost, energy consumption or raw materials. Energy is a term used commonly to describe products and processes that solve global problems related to resource constraints. The term "cleantech" is also used commonly in a similar manner.
| 77 |
We classify companies in our electronics portfolio as those that address problems in electronics-related industries, including semiconductors, telecommunications and data communications, metrology and test and measurement.
Our Sources of Liquid Capital
The sources of liquidity that we use to make our investments are classified as primary and secondary liquidity. As of September 30, 2015 and December 31, 2014, our total primary and secondary liquidity was $29,822,073 and $29,620,665, respectively. We do not include funds available and undrawn from our credit facility as primary or secondary liquidity. We believe it is important to examine both our primary and secondary liquidity when assessing the strength of our balance sheet and our future investment capabilities.
Primary liquidity is comprised of cash and certain receivables. As of September 30, 2015, we held $21,427,019 in cash and $17,815 in certain receivables. As of December 31, 2014, we held $20,748,314 in cash and $230,478 in certain receivables.
During the nine months ended September 30, 2015, we sold 50,000 shares of our investment in Solazyme, Inc., in open market sales. We received $170,662 in net proceeds from these transactions. In May of 2015, we received proceeds of $705,794 from the sale of Molecular Imprints, Inc.'s non-semiconductor business. In June of 2015, we sold our shares of Nantero, Inc., for proceeds of $4,828,052. In July of 2015, SynGlyco, Inc., repaid its senior secured debt resulting in proceeds of $567,500 to the Company. In August of 2015, Black Silicon Holdings, Inc.'s repayment of certain bridge notes resulted in proceeds of $2,429,202 to the Company. The proceeds from these transactions added to our primary liquidity during the third quarter. Payments upon achieving milestones from the sale of BioVex Group, Inc., and the sale of Molecular Imprints, Inc., to Canon, Inc., would also add to our primary liquidity in future quarters if these milestones are achieved successfully. The probability-adjusted values of the future milestone payments for the sales of BioVex and Molecular Imprints, as determined at the end of each fiscal quarter, are included as an asset on our Consolidated Statements of Assets and Liabilities and will be included in primary liquidity only if and when payment is received for achievement of the milestones.
Our secondary liquidity is comprised of the stock of both unrestricted and restricted publicly traded companies. Although these companies are publicly traded, their stock may not trade at high volumes and prices may be volatile, which may restrict our ability to sell our positions at any given time. As of September 30, 2015, our secondary liquidity was $8,377,239. Champions Oncology, Inc., accounts for $1,579,284 of the total amount of secondary liquidity based on the volume weighted average price of its common stock during the quarter ended September 30, 2015. Enumeral Biomedical Holdings, Inc., and OpGen, Inc., account for $3,160,681 and $3,637,274, respectively, of the total amount of secondary liquidity based on the closing price of their common stock as of September 30, 2015, less a liquidity discount to reflect that a portion of these shares are subject to restrictions on transfer. We are also subject to a lock-up agreement that restricts our ability to trade our securities of Enumeral Biomedical Holdings and OpGen, exclusive of the general restriction on the transfer of unregistered securities. The lock-up period on our 7,966,368 shares and warrants for the purchase of 1,755,120 shares of common stock of Enumeral Biomedical Holdings expires on January 31, 2016. The lock-up period on our 1,409,796 shares and warrants for the purchase of 332,039 shares of common stock of OpGen expired on November 2, 2015.
| 78 |
On October 27, 2015, Adesto Technologies Corporation completed an IPO. The shares of Adesto will add to our secondary liquidity in the fourth quarter of 2015.
As of December 31, 2014, our secondary liquidity was $8,641,873. Solazyme, Inc., accounted for $129,000 of the total amount of secondary liquidity based on the closing price of its common stock of $2.58 as of December 31, 2014. Champions Oncology accounted for $1,261,695 of the total amount of secondary liquidity based on the closing price of its common stock of $0.50 as of December 31, 2014. Enumeral Biomedical Holdings accounted for $7,251,178 of the total amount of secondary liquidity based on the closing price of its common stock of $1.05 as of December 31, 2014, less a liquidity discount to reflect that these shares are subject to restrictions on transfer.
We also have the $20,000,000 Loan Facility, which we can draw on to increase liquidity. As of September 30, 2015, we had $5,000,000 in debt outstanding relating to this Loan Facility.
The third quarter of 2015 ended with decreases in value in the public market indices. In private company exits, the third quarter of 2015 saw a decrease in the number of IPOs and an increase in M&A transactions, compared with the second quarter of 2015. Funding for venture capital firms decreased from the second quarter of 2015.
Thirteen venture-backed companies raised $1.7 billion through IPOs in the third quarter of 2015, according to Thomson Reuters and the National Venture Capital Association ("NVCA"). Eleven of the thirteen were U.S.-based companies. Ten of the IPOs were in life science companies. For the third quarter of 2015, 90 venture-backed M&A transactions were reported. This is an increase from the second quarter of 2015 (74) and a decrease from the third quarter of 2014 (136).
Fifty-three U.S. venture capital funds raised $4.4 billion in the third quarter of 2015, according to Thomson Reuters and the NVCA. Compared with the second quarter of 2015, this is a 34 percent decrease in the number of funds raised and a 59 percent decrease in the amount of capital raised. Of the 53 funds that were raised, 13 were new funds. This marks the third quarter of 2015 as the slowest quarter for venture capital fundraising since the third quarter of 2013.
Historically, difficult venture environments have resulted in a higher than normal number of companies not receiving financing and being subsequently closed down with a loss to venture investors, and other companies receiving financing but at significantly lower valuations than the preceding financing rounds. This issue is compounded by the fact that many existing venture capital firms with which we have co-invested historically in a number of our current portfolio companies have few remaining years of investment and available capital owing to the finite lifetime of the funds managed by these firms. Additionally, even if a firm were able to raise a new fund, commonly venture capital firms are not permitted to invest new funds in existing investments. This limitation of available capital can lead to fractured syndicates of investors. A fractured syndicate can result in a portfolio company being unable to raise additional capital to fund operations. This issue is especially acute in capital-intensive sectors that are enabled by science-related innovations, such as life sciences, energy and electronics, which are generally not in favor among venture capital firms. The result of these difficulties is that the portfolio company may be forced to sell before reaching its full potential or be shut down entirely if the remaining investors cannot financially support the company. As such, improvements in the exit environment for venture-backed companies through IPOs and M&A transactions may not translate to an increase in the available capital to venture-backed companies, particularly those that have investments from funds that are in the latter stage of life unless the markets improve for some time into the future.
| 79 |
Our overall goal remains unchanged. We seek to maintain our leadership position in investing in science-enabled and BIOLOGY+ companies and increase our net asset value per share outstanding. The current environment for venture capital financings continues to favor those firms that have capital to invest regardless of the stage of the investee company. We continue to finance our new and follow-on equity and convertible debt investments from our cash reserves held in bank accounts. We may in the future invest borrowed capital to take advantage of opportunities that we believe will return greater than the cost of such borrowed capital. We have historically held, and may in the future again hold, our cash in U.S. Treasury securities. We believe the current status of the venture capital industry and the current economic climate provide opportunities to invest this capital in the types of companies in which we invest at historically low valuations and under favorable terms in equity and convertible debt of new and existing privately held and publicly traded companies.
We value our privately held venture capital investments each quarter as determined in good faith by our Valuation Committee, a committee of all the independent directors, within guidelines established by our Board of Directors in accordance with the 1940 Act. See "Footnote to Consolidated Schedule of Investments" contained in "Consolidated Financial Statements" for additional information.
The values of privately held, venture capital-backed companies are inherently more difficult to determine than those of publicly traded companies at any single point in time because securities of these types of companies are not actively traded. We believe, perhaps even more than in the past, that illiquidity, and the perception of illiquidity, can affect value. Management believes further that the long-term effects of the difficult venture capital market and difficult exit environments will continue to affect negatively the fundraising ability of weak companies regardless of near-term improvements in the overall global economy and public markets and that these factors can also affect value.
We note that while the valuations of our privately held, venture capital-backed companies may decrease, sometimes substantially, such decrease may facilitate an increase in our ownership of the overall company in conjunction with a follow-on investment in such company. In these cases, the ultimate return on our overall invested capital could be greater than it would have been without such interim decrease in valuation.
Option pricing models use call option theory to derive the value of sets of classes of securities taking into account the financial rights and preferences of classes of securities such as liquidation preference, redemption rights and dividends. This method treats common and preferred stock as call options on the company’s enterprise value. It derives breakpoints based on liquidation preferences of the preferred stock and then calculates the values of those liquidation preferences and the company as a whole using Black-Scholes-Merton equations. The sum of these values yields the estimated enterprise value of the portfolio company. This method of derivation is often referred to as “backsolve” as it uses the price per share of the most recent round of financing to backsolve for the values of the other classes of outstanding securities of the company.
| 80 |
Option pricing models use the following inputs in their calculations:
| • | Last Round Price per Share |
| • | Liquidation Preferences (including dividends and redemptions, if any) |
| • | Estimated Time to Exit |
| • | Estimated Volatility |
| • | Risk-Free Interest Rate |
| • | Outstanding Capitalization of the Company |
Variations in these inputs and assumptions can have a significant impact on fair value. Companies that are valued using market comparables and/or volatilities derived from publicly traded securities are subject to the volatilities within those markets.
Given the consideration of the liquidation preferences, option pricing models more accurately represent scenarios where liquidation preferences are honored, as they would be in an M&A scenario, but not in public offering scenarios where it is common to have all classes of preferred stock converted to common stock. Liquidation preferences are business terms that are common in the venture capital industry and are generally used to provide some downside protection should the company not meet expectations. They can be structured on parity with prior rounds of financing or senior to prior rounds of financing. They can include multiples on the amounts invested and can provide for further distributions following the initial preference or be restricted to the amount of invested capital.
This high weighting of liquidation preferences means that small differences in how the preferences are structured can have a material effect on the fair value of our securities at the time of valuation and also on future valuations should additional rounds of financing occur with senior preferences. As such, valuations calculated by option pricing models may not increase if 1) rounds of financing occur at higher prices per share, 2) liquidation preferences include multiples on investment, 3) the amount of invested capital is small and/or 4) liquidation preferences are senior to prior rounds of financing.
We note that the ultimate return on any investment may be materially different than the fair value derived as of the date of valuation.
Three of our portfolio companies trade in public exchanges and are subject to the volatility inherent in the public markets. The following table illustrates the range of values of these securities.
| 81 |
| Public Companies' Trading History | ||||||||||||
| Price per Share on November 6, 2015 | Q3 2015 Trading Range | H& H Ownership Value in Q3 2015 Trading Range* | January - September 2015 Trading Range | H& H Ownership Value in January - September 2015 Trading Range* | ||||||||
| Champions Oncology, Inc.** | $ | 5.00 | $0.44 - $9.00 | $1.3 - $2.2 Million | $0.20 - $9.00 | $0.6 - $2.2 Million | ||||||
| Enumeral Biomedical Holdings, Inc. | $ | 0.30 | $0.31 - $0.70 | $2.4 - $5.8 Million | $0.30 - $1.07 | $2.4 - $8.5 Million | ||||||
| OpGen. Inc. | $ | 1.90 | $2.21 - $4.43 | $3.1 - $6.2 Million | $2.21 - $5.44 | $3.1 - $7 Million | ||||||
| Total: | $6.8- $14.2 Million | $6.1- $17.7 Million | ||||||||||
*Calculated based on common shares held as of September 30, 2015.
**On August 12, 2015, Champions Oncology effected a 12:1 reverse stock split.
Adesto Technologies Corporation completed an IPO on October 27, 2015, by selling 5,000,000 shares of its common stock at $5.00 per share. The Company invested $1,000,000 in this offering. Based on the offering price, the Company's ownership of Adesto, including the $1,000,000 investment in the IPO, was valued at $8.9 million as of the date of the IPO without any discounts for lack of marketability. The closing price per share of Adesto's common stock on November 6, 2015, was $5.41. The Company's ownership of Adesto at that price per share is valued at approximately $9,574,986 without any discounts for lack of marketability. This amount includes the value of the additional shares purchased at the IPO.
In each of the years in the period of 2011 through 2014 and for the nine months ended September 30, 2015, excluding our rights to milestone payments, we recorded the following gross write-ups in privately held securities as a percentage of net assets at the beginning of the year ("BOY"), gross write-downs in privately held securities as a percentage of net assets at the beginning of the year, and change in value of private portfolio securities as a percentage of net assets at the beginning of the year.
| Gross Write-Ups and Write-Downs of the Privately Held Portfolio | ||||||||||||||||||||
| 2011 | 2012 | 2013 | 2014 | Nine Months Ended Sept. 30, 2015 | ||||||||||||||||
| Net Asset Value, BOY | $ | 146,853,912 | $ | 145,698,407 | $ | 128,436,774 | $ | 122,701,575 | $ | 109,654,427 | ||||||||||
| Gross Write-Downs During Year | $ | (11,375,661 | ) | $ | (19,604,046 | ) | $ | (19,089,816 | ) | $ | (14,050,501 | ) | $ | (20,792,731 | ) | |||||
| Gross Write-Ups During Year | $ | 11,997,991 | $ | 14,099,904 | $ | 10,218,994 | $ | 4,587,923 | $ | 3,412,447 | ||||||||||
| Gross Write-Downs as a Percentage of Net Asset Value, BOY | (7.8 | )% | (13.5 | )% | (14.9 | )% | (11.5 | )% | (19.0 | )% | ||||||||||
| Gross Write-Ups as a Percentage of Net Asset Value, BOY | 8.2 | % | 9.7 | % | 8.0 | % | 3.8 | % | 3.1 | % | ||||||||||
| Net Change as a Percentage of Net Asset Value, BOY | 0.4 | % | (3.8 | )% | (6.9 | )% | (7.7 | )% | (15.9 | )% | ||||||||||
| 82 |
From June 30, 2015, to September 30, 2015, the value of our equity-focused venture capital portfolio, including our rights to potential future milestone payments from the sales of BioVex Group, Inc., Nextreme Thermal Solutions, Inc., and Molecular Imprints, Inc., decreased by $15,773,760, from $87,075,839 to $71,302,079.
Not including our rights to potential future milestone payments from the sale of BioVex Group, Inc., Nextreme Thermal Solutions, Inc., and Molecular Imprints, Inc., our equity-focused portfolio companies decreased in value by $17,650,660 from $83,894,656 to $66,243,996. This decrease was primarily owing to a net decrease in valuations and to the repayment of certain bridge notes of Black Silicon Holdings, Inc., from the proceeds received by the company from the sale of its subsidiary, the former SiOnyx, Inc., offset by new and follow-on investments of $7,462,571.
We note that our Valuation Committee and ultimately our Board of Directors take into account multiple sources of quantitative and qualitative inputs to determine the value of our privately held portfolio companies.
We also note that our Valuation Committee does not set the value of our unrestricted or registered shares of Enumeral Biomedical Holdings, Inc., which trades on an OTC exchange, or the value of our unrestricted or registered shares and a portion of our warrants for the purchase of common stock of OpGen, Inc., which trades on the NASDAQ Capital Market. For the third quarter of 2015, our Valuation Committee set the value of Champions Oncology, Inc., owing to the determination that it did not trade in an active market.
Six portfolio companies, Adesto Technologies Corporation, Enumeral Biomedical Holdings, Inc., Metabolon, Inc., Nanosys, Inc., OpGen, Inc., and Produced Water Absorbents, Inc., of which all or a portion of the securities owned by us were fair valued by our Valuation Committee, accounted for $15.8 million, or 82 percent, of the gross write-downs of our portfolio companies held as of September 30, 2015. The decreases in value were overwhelmingly influenced by the broad decreases in the value of publicly traded companies during the third quarter of 2015.
The change in value of Adesto Technologies Corporation was primarily owing to the pricing terms of its IPO, which valued the company at a substantial discount to the average multiple to revenues of comparable publicly traded companies.
We note that a portion of our securities of Enumeral Biomedical Holdings and OpGen were not fair valued by the Valuation Committee as of September 30, 2015, because those securities were registered, unrestricted securities that traded in an active market and were, therefore, valued based on the closing price of the shares on the date of valuation. The primary contributing factor for the decrease in valuation of our restricted shares and our warrants of Enumeral Biomedical Holdings was a decrease in the stock price of the company from $0.64 as of June 30, 2015, to $0.40 as of September 30, 2015. The primary contributing factor for the decrease in valuation of OpGen was a decrease in the stock price of the company from $3.72 as of June 30, 2015, to $2.58 as of September 30, 2015.
The primary contributing factor for the decrease in valuation of Nanosys and Produced Water Absorbents were the changes in the revenues and multiples of revenues of publicly traded comparable companies used to derive the value of our securities of the company.
| 83 |
As of September 30, 2015, our top ten investments by value accounted for approximately 79 percent of the value of our equity-focused venture capital portfolio.
Top Ten Equity-Focused Investments by Value
| Portfolio Company | Value as of 09/30/2015 | Cumulative % of Equity Focused Venture Capital Portfolio | ||||||
| Metabolon, Inc. | $ | 9,730,610 | 15% | |||||
| Adesto Technologies Corp. | $ | 7,349,579 | 26% | |||||
| D-Wave Systems, Inc. | $ | 7,161,080 | 37% | |||||
| HZO, Inc. | $ | 7,003,646 | 47% | |||||
| AgBiome, L.L.C. | $ | 5,506,346 | 55% | |||||
| OpGen, Inc.* | $ | 3,840,238 | 61% | |||||
| Enumeral Biomedical Holdings, Inc. * | $ | 3,445,587 | 66% | |||||
| Produced Water Absorbents, Inc. | $ | 2,964,898 | 71% | |||||
| Senova Systems, Inc. | $ | 2,620,357 | 75% | |||||
| Bridgelux, Inc. | $ | 2,542,918 | 79% | |||||
* Enumeral Biomedical Holdings' and OpGen's ranks by value include the value of their Level 1 asset shares
We present the financial results of our operations utilizing accounting principles generally accepted in the United States of America ("GAAP") for investment companies. On this basis, the principal measure of our financial performance during any period is the net increase (decrease) in our net assets resulting from our operating activities, which is the sum of the following three elements:
Net Operating Income (Loss) - the difference between our income from interest, dividends, and fees and our operating expenses.
Net Realized Gain (Loss) on Investments - the difference between the net proceeds of sales of portfolio securities and their stated cost.
Net Increase (Decrease) in Unrealized Appreciation or Depreciation on Investments - the net unrealized change in the value of our investment portfolio.
| 84 |
Owing to the structure and objectives of our business, we generally expect to experience net operating losses and seek to generate increases in our net assets from operations through the long-term appreciation and monetization of our venture capital investments. We have relied, and continue to rely, primarily on proceeds from sales of investments, rather than on investment income, to defray a significant portion of our operating expenses. Because such sales are unpredictable, we attempt to maintain adequate working capital to provide for fiscal periods when there are no such sales.
The potential for, or occurrence of, inflation could result in rising interest rates for government-backed debt. We may also invest in both short- and long-term U.S. government and agency securities. To the extent that we invest in short- and long-term U.S. government and agency securities, changes in interest rates result in changes in the value of these obligations that result in an increase or decrease of our net asset value. The level of interest rate risk exposure at any given point in time depends on the market environment, the expectations of future price and market movements, and the quantity and duration of long-term U.S. government and agency securities held by the Company, and it will vary from period to period. During the three months and nine months ended September 30, 2015, we did not hold any U.S. government securities. During the three months and nine months ended September 30, 2014, our average holdings of U.S. government securities were $0 and $3,899,941, respectively.
Three months ended September 30, 2015, as compared with the three months ended September 30, 2014
In the three months ended September 30, 2015, and September 30, 2014, we had net decreases in net assets resulting from operations of $16,904,625 and $910,852, respectively.
Investment Income and Expenses:
We had net operating losses of $1,587,808 and $1,877,603 for the three months ended September 30, 2015, and September 30, 2014, respectively. The variation in these results is primarily owing to the changes in investment income and operating expenses, including non-cash expense included in salaries, benefits and stock-based compensation of $185,991 in 2015 primarily associated with the compensation cost for restricted stock as compared with $243,849 for the same period in 2014. During the three months ended September 30, 2015, and September 30, 2014, total investment income was $244,402 and $93,373, respectively. During the three months ended September 30, 2015, and September 30, 2014, total operating expenses were $1,832,210 and $1,970,976, respectively.
During the three months ended September 30, 2015, as compared with the same period in 2014, investment income increased, reflecting an increase in interest income from convertible bridge notes, non-convertible promissory notes, yield-enhancing fees on debt securities and fees for providing managerial assistance to portfolio companies, offset by a decrease in interest income from senior secured debt and senior secured debt through a participation agreement. During the three months ended September 30, 2015, and September 30, 2014, we did not hold any U.S. government securities primarily owing to the decrease in yield available over the durations of maturities in which we were willing to invest.
| 85 |
Operating expenses, including non-cash, stock-based compensation expenses, were $1,832,210 and $1,970,976 for the three months ended September 30, 2015, and September 30, 2014, respectively. The decrease in operating expenses for the three months ended September 30, 2015, as compared with the three months ended September 30, 2014, was primarily owing to decreases in salaries, benefits and stock-based compensation expense, administration and operations expense, professional fees, insurance expense and custody fees, offset by increases in rent expense, directors' fees and expenses and interest and other debt expense.
Salaries, benefits and stock-based compensation expense decreased by $171,128, or 15.2 percent, for the three months ended September 30, 2015, as compared with September 30, 2014, primarily as a result of a decrease in salaries and benefits owing primarily to a decrease in our employee headcount, a decrease in employee bonus expense of $32,125, and a decrease in compensation cost of $57,858 for restricted stock awards associated with the Stock Plan. At September 30, 2015, we had nine full-time employees and one part-time employee as compared with 12 full-time employees and one part-time employee at September 30, 2014. While the non-cash, stock-based compensation expense for the Stock Plan increased our operating expenses by $185,991, this increase was offset by a corresponding increase to our additional paid-in capital, resulting in no net impact to our net asset value. Administration and operations expense decreased by $3,788, or 3.5 percent, for the three months ended September 30, 2015, as compared with September 30, 2014, primarily as a result of net decreases in general office and administration expenses and decreases in managing directors' travel-related expenses. Professional fees decreased by $86,903, or 23.8 percent, for the three months ended September 30, 2015, as compared with September 30, 2014, primarily as a result of a decrease in certain legal fees and consulting fees. Insurance expense decreased by $10,238, or 12.2 percent, for the three months ended September 30, 2015, as compared with September 30, 2014. Custody fees decreased by $499, or 3.1 percent, for the three months ended September 30, 2015, as compared with September 30, 2014.
Rent expense increased by $13,919, or 20.1 percent, for the three months ended September 30, 2015, as compared with September 30, 2014. Our rent expense of $83,308 for the three months ended September 30, 2015, includes $96,348 of rent paid in cash, net of $13,040 non-cash rent expense, credits and abatements that we recognize on a straight-line basis over the lease term. Our rent paid in cash of $96,348 includes $15,511 of real estate tax escalation charges on our corporate headquarters located at 1450 Broadway in New York City. Directors' fees and expenses increased by $6,343, or 6.9 percent, for the three months ended September 30, 2015, as compared with September 30, 2014, primarily owing to an increase in travel-related expenses, offset by a decrease in fees associated with a smaller Board of Directors. Interest and other debt expense increased by $115,000, or 121.3 percent, for the three months ended September 30, 2015, as compared with September 30, 2014, primarily as a result of utilization fees associated with a drawdown of the Loan Facility.
Realized Gains and Losses from Investments:
During the three months ended September 30, 2015, we realized net gains on investments of $1,275,596. During the three months ended September 30, 2014, we realized net (losses) on investments of $(3,790,861).
| 86 |
During the three months ended September 30, 2015, we realized net gains of $1,275,596 consisting primarily of a realized gain of $1,790,891 on the repayment of certain bridge notes of Black Silicon Holdings, Inc., a realized gain of $11,152 on the sale of 25,000 shares of Solazyme, Inc., a realized gain of $1,942 on our escrow payment from the sale of Molecular Imprints, Inc., to Canon, Inc., and a realized gain of $74 on our escrow payment relating to the sale of our investment in Molecular Imprints, Inc., to Magic Leap, Inc., offset by a realized loss of $296,813 on our investment in Bridgelux, Inc., owing to the expiration of certain warrants, and a realized loss of $231,656 owing to the cancellation of our warrants in SiOnyx, Inc.
During the three months ended September 30, 2014, we realized net losses of $3,790,861 consisting primarily of a realized loss of $4,488,575 on our investment in Contour Energy Systems, Inc., owing to its liquidation and dissolution and a realized loss of $2,454 on our escrow payment from the sale of Molecular Imprints, Inc., offset by a realized gain of $536,813 on our investment in rights to milestone payments from Amgen, Inc., a realized gain of $16,000 on the early repayment of the senior debt by OHSO Clean, Inc., and a realized gain of $145,426 on the repurchase and expiration of certain Solazyme, Inc., written call option contracts.
Net Unrealized Appreciation and Depreciation of Portfolio Securities:
During the three months ended September 30, 2015, net unrealized depreciation on total investments increased by $16,532,025, or 60.8 percent, from accumulated net unrealized depreciation of $27,193,633 at June 30, 2015, to accumulated net unrealized depreciation of $43,725,658 at September 30, 2015. During the three months ended September 30, 2014, net unrealized depreciation on total investments decreased by $4,759,288, or 25.4 percent, from accumulated net unrealized depreciation of $18,748,741 at June 30, 2014, to accumulated net unrealized depreciation of $13,989,453 at September 30, 2014.
During the three months ended September 30, 2015, net unrealized depreciation on our venture capital investments increased by $16,532,025, from net unrealized depreciation of $27,193,633 at June 30, 2015, to net unrealized depreciation of $43,725,658 at September 30, 2015, owing to write-downs in the valuations of the following portfolio company investments:
| Investment | Amount of Write-Down | |||
| Adesto Technologies Corporation | 8,308,722 | |||
| Enumeral Biomedical Corp. | 1,953,820 | |||
| Black Silicon Holdings, Inc. | 1,859,236 | |||
| Produced Water Absorbents, Inc. | 1,696,200 | |||
| Nanosys, Inc. | 1,565,039 | |||
| OpGen, Inc. | 1,455,455 | |||
| Metabolon, Inc. | 808,049 | |||
| Ensemble Therapeutics Corporation | 580,720 | |||
| Cambrios Technologies Corporation | 306,121 | |||
| SynGlyco, Inc. | 139,510 | |||
| Senova Systems, Inc. | 66,695 | |||
| NanoTerra, Inc. | 2,517 | |||
| 87 |
The write-downs for the three months ended September 30, 2015, were partially offset by write-ups in the valuations of the following portfolio company investments:
| Investment | Amount of Write-Ups | |||
| Bridgelux, Inc. | 297,188 | |||
| Mersana Therapeutics, Inc. | 200,714 | |||
| AgBiome, LLC | 160,485 | |||
| Champions Oncology, Inc. | 122,204 | |||
| HZO, Inc. | 45,925 | |||
| D-Wave Systems, Inc. | 15,943 | |||
| EchoPixel, Inc. | 14,442 | |||
| NGX Bio, Inc. | 7,467 | |||
| ABSMaterials, Inc. | 6,169 | |||
| Magic Leap, Inc. | 4,205 | |||
| ORIG3N, Inc. | 2,192 | |||
In addition to the write-ups listed above, we had an increase in unrealized depreciation of $524,387 on our investment in D-Wave Systems, Inc., owing to foreign currency translation.
We had an increase in unrealized depreciation of $19,388 on our investment in Solazyme, Inc., owing to a realized gain on the sale of its securities.
We had a decrease in unrealized depreciation of $1,245,279 on the rights to milestone payments from Amgen, Inc.’s acquisition of BioVex Group, Inc.
We had a decrease in unrealized depreciation of $631,621 on the rights to milestone payments from Canon, Inc.’s acquisition of Molecular Imprints, Inc.
During the three months ended September 30, 2014, net unrealized depreciation on our venture capital investments decreased by $4,857,214, from net unrealized depreciation of $18,846,667 at June 30, 2014, to net unrealized depreciation of $13,989,453 at September 30, 2014, owing primarily to a net decrease in unrealized depreciation on our investment in Contour Energy Systems, Inc., of $4,509,995 resulting in a realized loss on this investment. We also had the following write-ups in the valuations of the following portfolio company investments:
| Investment | Amount of Write-Up | |||
| Enumeral Biomedical Holdings, Inc. | $ | 4,917,909 | ||
| Adesto Technologies Corporation | 2,468,468 | |||
| Produced Water Absorbents, Inc. | 1,654,040 | |||
| SynGlyco, Inc. | 221,499 | |||
| Nanosys, Inc. | 145,591 | |||
| OpGen, Inc. | 128,066 | |||
| Mersana Therapeutics, Inc. | 127,147 | |||
| Bridgelux, Inc. | 19,792 | |||
| GEO Semiconductor, Inc. | 18,790 | |||
| EchoPixel, Inc. | 8,389 | |||
| UberSeq, Inc. | 5,262 | |||
| 88 |
The write-ups for the three months ended September 30, 2014, were offset by write-downs in the valuations of the following portfolio company investments:
| Investment | Amount of Write-Down | |||
| Cambrios Technologies Corporation | $ | 1,958,798 | ||
| D-Wave Systems, Inc. | 1,607,986 | |||
| HzO, Inc. | 1,603,311 | |||
| Ensemble Therapeutics Corporation | 1,078,149 | |||
| Champions Oncology, Inc. | 666,344 | |||
| Cobalt Technologies, Inc. | 601,025 | |||
| Nantero, Inc. | 417,046 | |||
| Senova Systems, Inc. | 335,822 | |||
| Metabolon, Inc. | 295,589 | |||
| SiOnyx, Inc. | 294,867 | |||
| Solazyme, Inc. | 216,000 | |||
| ABSMaterials, Inc. | 183,365 | |||
| AgBiome, LLC | 94,086 | |||
| Ultora, Inc. | 42,590 | |||
| NanoTerra, Inc. | 39,403 | |||
| Laser Light Engines, Inc. | 13,745 | |||
| OHSO Clean, Inc. | 4,889 | |||
We had an increase in unrealized depreciation owing to foreign currency translation of $502,044 on our investment in D-Wave Systems, Inc.
We had an increase in unrealized depreciation of $2,447 on the rights to milestone payments from Canon, Inc.’s acquisition of Molecular Imprints, Inc.
We had a decrease in unrealized depreciation of $589,772 on the rights to milestone payments from Amgen, Inc.’s acquisition of BioVex Group, Inc.
Nine months ended September 30, 2015, as compared with the nine months ended September 30, 2014
In the nine months ended September 30, 2015, and September 30, 2014, we had net decreases in net assets resulting from operations of $22,356,159 and $3,058,474, respectively.
Investment Income and Expenses:
We had net operating losses of $5,209,460 and $5,937,830 for the nine months ended September 30, 2015, and September 30, 2014, respectively. The variation in these results is primarily owing to the changes in investment income and operating expenses, including non-cash expense included in salaries, benefits and stock-based compensation of $617,972 in 2015 primarily associated with the compensation cost for restricted stock as compared with $741,483 for the same period in 2014. During the nine months ended September 30, 2015, and September 30, 2014, total investment income was $675,429 and $373,499, respectively. During the nine months ended September 30, 2015, and September 30, 2014, total operating expenses were $5,884,889 and $6,311,329, respectively.
| 89 |
During the nine months ended September 30, 2015, as compared with the same period in 2014, investment income increased, reflecting increases in interest income from convertible bridge notes, non-convertible promissory notes, yield-enhancing fees on debt securities and fees for providing managerial assistance to portfolio companies, offset by decreases in interest income from senior secured debt, senior secured debt through a participation agreement, and a decrease in our average holdings of U.S. government securities. During the nine months ended September 30, 2015, our average holdings of U.S. government securities were $0 as compared with $3,899,941 during the nine months ended September 30, 2014, primarily owing to the decrease in yield available over the durations of maturities in which we were willing to invest.
Operating expenses, including non-cash, stock-based compensation expenses, were $5,884,889 and $6,311,329 for the nine months ended September 30, 2015, and September 30, 2014, respectively. The decrease in operating expenses for the nine months ended September 30, 2015, as compared with the nine months ended September 30, 2014, was primarily owing to decreases in salaries, benefits and stock-based compensation expense, administration and operations expense and insurance expense, offset by increases in professional fees, rent expense, directors' fees and expenses, interest and other debt expense and custody fees.
Salaries, benefits and stock-based compensation expense decreased by $774,736, or 20.5 percent, for the nine months ended September 30, 2015, as compared with September 30, 2014, primarily as a result of a decrease in salaries and benefits owing primarily to a decrease in our employee headcount, a decrease in employee bonus expense of $229,625 and a decrease in compensation cost of $123,511 for restricted stock awards associated with the Stock Plan. At September 30, 2015, we had nine full-time employees and one part-time employee as compared with 12 full-time employees and one part-time employee at September 30, 2014. While the non-cash, stock-based compensation expense for the Stock Plan increased our operating expenses by $617,972, this increase was offset by a corresponding increase to our additional paid-in capital, resulting in no net impact to our net asset value. Administration and operations expense decreased by $105,134, or 23.6 percent, for the nine months ended September 30, 2015, as compared with September 30, 2014, primarily as a result of decreases in managing directors' travel-related expenses and net decreases in general office and administration expenses, including decreases in costs associated with a Meet the Portfolio Day held during the comparable period in 2014. We did not hold a Meet the Portfolio Day during the nine months ended September 30, 2015. Insurance expense decreased by $36,843, or 14.6 percent, for the nine months ended September 30, 2015, as compared with September 30, 2014.
Professional fees increased by $202,893, or 21.1 percent, for the nine months ended September 30, 2015, as compared with September 30, 2014, primarily as a result of an increase in certain legal fees and accounting fees associated with exploration of strategic opportunities, offset by a decrease in certain consulting fees. Rent expense increased by $1,292, or less than one percent, for the nine months ended September 30, 2015, as compared with September 30, 2014. Our rent expense of $218,772 for the nine months ended September 30, 2015, includes $257,523 of rent paid in cash, net of $38,751 non-cash rent expense, credits and abatements that we recognize on a straight-line basis over the lease term. Our rent paid in cash of $257,523 includes $15,511 of real estate tax escalation charges on our corporate headquarters located at 1450 Broadway in New York City. Directors' fees and expenses increased by $8,460, or 3.0 percent, for the nine months ended September 30, 2015, as compared with September 30, 2014, primarily owing to additional meetings held by the Board of Directors and an increase in travel-related expenses, offset by a decrease owing to a smaller Board of Directors. Interest and other debt expense increased by $278,750, or 98.6 percent, for the nine months ended September 30, 2015, as compared with September 30, 2014, primarily as a result of utilization fees associated with a drawdown of the Loan Facility. Custody fees increased by $2,098, or 4.6 percent, for the nine months ended September 30, 2015, as compared with September 30, 2014.
| 90 |
Realized Gains and Losses from Investments:
During the nine months ended September 30, 2015, and September 30, 2014, we realized net gains (losses) on investments of $4,224,413 and $(5,134,936), respectively.
During the nine months ended September 30, 2015, we realized net gains of $4,224,413 consisting primarily of a realized gain of $3,109,347 on the sale of our investment in Nantero, Inc., a realized gain of $1,790,891 on the repayment of certain bridge notes of Black Silicon Holdings, Inc., a realized gain of $242,485 on the sale of our investment in Molecular Imprints, Inc., a realized gain of $52,563 on the sale of 50,000 shares of Solazyme, Inc., a realized gain of $8,942 on the sale of certain warrants of GEO Semiconductor, Inc., and a realized gain of $4,609 on our escrow payment from the sale of our investment in Molecular Imprints to Canon, Inc., offset by a realized loss of $296,813 on our investment in Bridgelux, Inc., owing to the expiration of certain warrants, a realized loss of $293,786 on our investment in Metabolon, Inc., owing to the expiration of certain warrants, a realized loss of $231,656 owing to the cancellation of our warrants in SiOnyx, Inc., a realized loss of $98,644 on our investment in D-Wave Systems, Inc., owing to the expiration of certain warrants, and a realized loss of $63,532 on our escrow payment owing to the sale of our investment in Molecular Imprints to Magic Leap, Inc.
During the nine months ended September 30, 2014, we realized net losses of $5,134,936, consisting primarily of realized losses on the value of our investments in Kovio, Inc., of $7,299,533, and Contour Energy Systems, Inc., of $4,488,575, offset by a realized gain of $3,946,313 on the sale of our investment in Molecular Imprints, Inc., a realized gain of $16,000 on the early repayment of the senior secured debt by OHSO Clean, Inc., a realized gain of $204,442 on the sale of 575,756 shares of Champions Oncology, Inc., a realized gain of $1,129,054 on the sale of 117,834 shares of Solazyme, Inc., and a realized gain of $232,079 on the repurchase and expiration of certain Solazyme written call option contracts. At September 30, 2014, we still owned 2,523,895 and 50,000 shares of Champions Oncology and Solazyme, respectively. We also had a realized gain of $588,440 on our escrow payment from the sale of Xradia, Inc., and a realized gain of $536,813 on our investment in rights to milestone payments from Amgen, Inc.
Net Unrealized Appreciation and Depreciation of Portfolio Securities:
During the nine months ended September 30, 2015, net unrealized depreciation on total investments increased by $21,119,183, or 93.4 percent, from accumulated net unrealized depreciation of $22,606,475 at December 31, 2014, to accumulated net unrealized depreciation of $43,725,658 at September 30, 2015. During the nine months ended September 30, 2014, net unrealized depreciation on total investments decreased by $8,031,954, or 36.5 percent, from accumulated net unrealized depreciation of $22,021,407 at December 31, 2013, to accumulated net unrealized depreciation of $13,989,453 at September 30, 2014.
| 91 |
During the nine months ended September 30, 2015, net unrealized depreciation on our venture capital investments increased by $21,119,183, from net unrealized depreciation of $22,606,475 at December 31, 2014, to net unrealized depreciation of $43,725,658 at September 30, 2015, owing to write-downs in the valuations of the following portfolio company investments:
| Investment | Amount of Write-Down | |||
| Adesto Technologies Corporation | 7,473,744 | |||
| Produced Water Absorbents, Inc. | 6,079,455 | |||
| Enumeral Biomedical Corp. | 4,939,054 | |||
| Nanosys, Inc. | 3,039,996 | |||
| Metabolon, Inc. | 972,162 | |||
| Bridgelux, Inc. | 751,346 | |||
| Ensemble Therapeutics Corporation | 679,948 | |||
| HZO, Inc. | 414,288 | |||
| Cambrios Technologies Corporation | 281,101 | |||
| Magic Leap, Inc. | 14,927 | |||
| Ultora, Inc. | 7,525 | |||
| NanoTerra, Inc. | 2,663 | |||
The write-downs for the nine months ended September 30, 2015, were partially offset by write-ups in the valuations of the following portfolio company investments:
| Investment | Amount of Write-Ups | |||
| AgBiome, LLC | 2,016,636 | |||
| OpGen, Inc. | 927,975 | |||
| Black Silicon Holdings, Inc. | 521,649 | |||
| Champions Oncology, Inc. | 336,607 | |||
| NGX Bio, Inc. | 279,008 | |||
| Mersana Therapeutics, Inc. | 230,422 | |||
| Accelerator IV – New York Corporation | 164,385 | |||
| SynGlyco, Inc. | 98,700 | |||
| Senova Systems, Inc. | 52,135 | |||
| D-Wave Systems, Inc. | 41,182 | |||
| EchoPixel, Inc. | 36,329 | |||
| ABSMaterials, Inc. | 7,245 | |||
| ORIG3N, Inc. | 5,938 | |||
We had an increase in unrealized depreciation of $1,909,935 on our investment in Nantero, Inc., owing to a realized gain on the sale of its securities.
We had an increase in unrealized depreciation of $1,116,758 on our investment in D-Wave Systems, Inc., owing to foreign currency translation.
We had an increase in unrealized depreciation of $10,840 on our investment in Solazyme, Inc., owing to a realized gain on the sale of its securities.
| 92 |
We had an increase in unrealized depreciation of $7,870 on our investment in GEO Semiconductor, Inc., owing to a realized gain on the sale of certain warrants.
We had a decrease in unrealized depreciation of $1,229,623 on the rights to milestone payments from Amgen, Inc.’s acquisition of BioVex Group, Inc.
We had a decrease in unrealized depreciation of $634,595 on the rights to milestone payments from Canon, Inc.’s acquisition of Molecular Imprints, Inc.
During the nine months ended September 30, 2014, net unrealized depreciation on our venture capital investments decreased by $8,040,881, from net unrealized depreciation of $22,030,334 at December 31, 2013, to net unrealized depreciation of $13,989,453 at September 30, 2014, owing primarily to a net decrease in unrealized depreciation on our investment in Contour Energy Systems, Inc., of $4,419,151 resulting in a realized loss on this investment owing to its liquidation and dissolution and Kovio, Inc., of $7,299,533 resulting in a realized loss on this investment when such securities were deemed worthless. We also had the following write-ups in the valuations of the following portfolio company investments:
| Investment | Amount of Write-Up | |||
| Enumeral Biomedical Holdings, Inc. | $ | 5,942,121 | ||
| Produced Water Absorbents, Inc. | 3,630,689 | |||
| Adesto Technologies Corporation | 2,468,468 | |||
| D-Wave Systems, Inc. | 2,228,621 | |||
| SynGlyco, Inc. | 564,959 | |||
| OpGen, Inc. | 129,560 | |||
| Mersana Therapeutics, Inc. | 127,147 | |||
| Bridgelux, Inc. | 81,166 | |||
| GEO Semiconductor, Inc. | 41,916 | |||
| EchoPixel, Inc. | 8,389 | |||
| UberSeq, Inc. | 5,262 | |||
The write-ups for the nine months ended September 30, 2014, were offset by write-downs in the valuations of the following portfolio company investments:
| Investment | Amount of Write-Down | |||
| SiOnyx, Inc. | $ | 5,016,061 | ||
| Cambrios Technologies Corporation | 2,813,384 | |||
| Ensemble Therapeutics Corporation | 1,440,683 | |||
| Champions Oncology, Inc. | 1,430,566 | |||
| Cobalt Technologies, Inc. | 901,558 | |||
| Nantero, Inc. | 417,046 | |||
| Metabolon, Inc. | 339,764 | |||
| Senova Systems, Inc. | 335,822 | |||
| Ultora, Inc. | 293,684 | |||
| Nanosys, Inc. | 207,508 | |||
| HzO, Inc. | 199,327 | |||
| 93 |
(Cont'd)
| Investment | Amount of Write-Down | |||
| Laser Light Engines, Inc. | 195,806 | |||
| ABSMaterials, Inc. | 183,365 | |||
| AgBiome, LLC | 94,086 | |||
| OHSO Clean, Inc. | 44,043 | |||
| NanoTerra, Inc. | 28,923 | |||
We had an increase in unrealized depreciation of $3,872,348 on our investment in Molecular Imprints, Inc., primarily owing to a realized gain on the sale of its securities.
We had an increase in unrealized depreciation of $1,176,247 on our investment in Solazyme, Inc., primarily owing to realized gains on the partial sale of the securities.
We had an increase in unrealized depreciation owing to foreign currency translation of $511,206 on our investment in D-Wave Systems, Inc.
We had an increase in unrealized depreciation of $1,860 on the rights to milestone payments from Canon, Inc.’s acquisition of Molecular Imprints, Inc.
We had a decrease in unrealized depreciation of $597,186 on the rights to milestone payments from Amgen, Inc.’s acquisition of BioVex Group, Inc.
Unrealized appreciation on our U.S. government securities portfolio decreased from unrealized appreciation of $45 at December 31, 2013, to $0 at September 30, 2014. We did not hold any U.S. government securities at September 30, 2014.
September 30, 2015
At September 30, 2015, our total assets and net assets were $94,158,008 and $86,974,196, respectively. At December 31, 2014, our total assets and net assets were $112,094,861 and $109,654,427, respectively.
At September 30, 2015, our net asset value per share was $2.80, as compared with $3.51 at December 31, 2014. At September 30, 2015, and December 31, 2014, our shares outstanding were 31,022,866 and 31,280,843, respectively.
Significant developments in the nine months ended September 30, 2015, included a decrease in the holdings of our venture capital investments of $18,298,976 and an increase in our cash of $678,705. The decrease in our venture capital investments from $89,764,840 at December 31, 2014, to $71,465,864 at September 30, 2015, resulted primarily from a decrease in value of $3,433,338 owing to the sale of our investment in Nantero, Inc., a decrease in value of $928,884 owing to the sale of our investment in Molecular Imprints, Inc., a decrease in value of $161,286 owing to the reorganization of the corporate structure of SiOnyx, Inc., to become a subsidiary of Black Silicon Holdings, Inc., a decrease in value of $129,000 owing to the sale of our investment in Solazyme, Inc., and a decrease in the net value of our venture capital investments held of $21,109,039, offset by new and follow-on investments of $7,462,571. The increase in our cash from $20,748,314 at December 31, 2014, to $21,427,019 at September 30, 2015, is primarily owing to proceeds of $2,429,202 from the repayment of certain bridge notes in Black Silicon Holdings, proceeds of $4,828,052 on the sale of our investment in Nantero, proceeds of $705,794 on the sale of our investment in Molecular Imprints, proceeds of $103,310 on the sale of certain warrants of GEO Semiconductor, Inc., proceeds of $567,500 from the repayment of the senior secured debt of SynGlyco, Inc., net proceeds of $170,662 on the sale of our remaining 50,000 shares of Solazyme and a drawdown of $5,000,000 from the Loan Facility, offset by new and follow-on venture capital investments totaling $7,462,571, the payment of cash for operating expenses of $5,352,774 and the purchase of treasury shares totaling $737,662.
| 94 |
The following table is a summary of additions to our portfolio of venture capital investments made during the nine months ended September 30, 2015:
| New Investments | Amount of Investment | |||
| ORIG3N, Inc. | $ | 250,000 | ||
| Phylagen, Inc. | 200,000 | |||
| Follow-On Investments | Amount of Investment | |||
| OpGen, Inc. | $ | 1,155,000 | ||
| Senova Systems, Inc. | 600,000 | |||
| AgBiome, LLC. | 500,006 | |||
| HZO, Inc. | 500,003 | |||
| Produced Water Absorbents, Inc. | 500,000 | |||
| Produced Water Absorbents, Inc. | 484,203 | |||
| NGX Bio, Inc. | 300,001 | |||
| Metabolon, Inc. | 299,999 | |||
| Produced Water Absorbents, Inc. | 250,000 | |||
| Produced Water Absorbents, Inc. | 250,000 | |||
| Produced Water Absorbents, Inc. | 250,000 | |||
| ORIG3N, Inc. | 250,000 | |||
| Accelerator IV-New York Corporation | 262,215 | |||
| OpGen, Inc. | 208,035 | |||
| TARA Biosystems, Inc. | 200,000 | |||
| NGX Bio, Inc. | 199,999 | |||
| Nantero, Inc. | 195,303 | |||
| SiOnyx, Inc. | 117,653 | |||
| Mersana Therapeutics, Inc. | 104,521 | |||
| SiOnyx, Inc. | 103,500 | |||
| OpGen, Inc. | 100,000 | |||
| SiOnyx, Inc. | 89,608 | |||
| ProMuc, Inc. | 75,000 | |||
| Phylagen, Inc. | 10,000 | |||
| Ultora, Inc. | 7,525 | |||
| Total | $ | 7,462,571 | ||
| 95 |
The following table summarizes the value of our portfolio of venture capital investments as compared with its cost at September 30, 2015, and December 31, 2014:
| September 30, 2015 | December 31, 2014 | |||||||
| Venture capital investments, at cost | $ | 115,191,522 | $ | 112,371,315 | ||||
| Net unrealized (depreciation) | (43,725,658 | ) | (22,606,475 | ) | ||||
| Venture capital investments, at value | $ | 71,465,864 | $ | 89,764,840 | ||||
Net cash used in operating activities for the nine months ended September 30, 2015, was $3,529,183, primarily reflecting the purchase of venture capital investments of $7,462,571 and the payment of operating expenses, offset by proceeds from the sale of investments and repayment of principal of $8,966,871.
Net cash used in investing activities for the nine months ended September 30, 2015, was $6,806, primarily reflecting the purchase of fixed assets.
Net cash provided by financing activities for the nine months ended September 30, 2015, was $4,214,694, primarily reflecting a partial drawdown from the Loan Facility, offset by the purchase of treasury stock and the net settlement of restricted stock.
Net cash provided by operating activities for the nine months ended September 30, 2014, was $13,985,845, primarily reflecting the net sale of U.S. government securities of $18,999,008 and proceeds from the sale of investments of $10,929,061, offset by the purchase of venture capital investments of $12,297,059 and the payment of operating expenses.
Net cash used in investing activities for the nine months ended September 30, 2014, was $5,296, primarily reflecting the purchase of fixed assets.
Liquidity and Capital Resources
Our liquidity and capital resources are generated and are generally available through our cash holdings, cash flows from payments received on our venture debt investments, proceeds from periodic follow-on equity offerings and realized capital gains retained for reinvestment.
We fund our day-to-day operations using interest earned and proceeds from our cash holdings and interest earned from our venture debt securities. We believe the increase or decrease in the value of our venture capital investments does not materially affect the day-to-day operations of the Company or our daily liquidity. As of September 30, 2015, and December 31, 2014, we had no investments in money market mutual funds.
| 96 |
Our Loan Facility may be used to fund our investments and not for the payment of day-to-day operating expenses. As of September 30, 2015, we had $5,000,000 in debt outstanding. We have not issued any debt securities, and, therefore, are not subject to credit agency downgrades.
As a venture capital company, it is critical that we have capital available to support our best companies until we have an opportunity for liquidity in our investments. As such, we will continue to maintain a substantial amount of liquid capital on our balance sheet.
Although we cannot predict future market conditions, we continue to believe that our current cash and our ability to adjust our investment pace will provide us with adequate liquidity to execute our current business strategy.
At September 30, 2015, and December 31, 2014, our total primary liquidity was $21,444,834 and $20,978,792, respectively. Our primary liquidity is principally comprised of our cash and certain receivables. The increase in our primary liquidity from December 31, 2014, to September 30, 2015, is primarily owing to proceeds of $2,429,202 from the repayment of certain bridge notes in Black Silicon Holdings, Inc., proceeds of $4,828,052 on the sale of our investment in Nantero, proceeds of $705,794 on the sale of our investment in Molecular Imprints, proceeds of $103,310 on the sale of certain warrants of GEO Semiconductor, Inc., proceeds of $567,500 from the repayment of the senior secured debt of SynGlyco, Inc., net proceeds of $170,662 on the sale of our remaining 50,000 shares of Solazyme and a drawdown of $5,000,000 from the Loan Facility, offset by new and follow-on venture capital investments totaling $7,462,571, the payment of cash for operating expenses of $5,352,774 and the purchase of treasury shares totaling $737,662.
At September 30, 2015, and December 31, 2014, our secondary liquidity was $8,377,239 and $8,641,873, respectively. Secondary liquidity does not include the value of warrants or options we hold in Champions Oncology, Inc., Enumeral Biomedical Holdings, Inc., and OpGen, Inc. Our secondary liquidity consists of our publicly traded securities. Although these companies are publicly traded, their stock may not trade at high volumes and prices can be volatile, which may restrict our ability to sell our positions at any given time. We may also be restricted for a period of time in selling our positions in these companies due to our shares being unregistered. As of September 30, 2015, our publicly traded securities of Enumeral Biomedical Holdings and OpGen, Inc., were restricted from sale. On October 27, 2015, Adesto Technologies Corporation completed an IPO. The shares of Adesto will add to our secondary liquidity in the fourth quarter of 2015.
As of September 30, 2015, we have $5,000,000 in debt outstanding.
We do not include funds held in escrow from the sale of investments in primary or secondary liquidity. These funds become primary liquidity if and when they are received at the expiration of the escrow period.
We believe that the current and future venture capital environment may adversely affect the valuation of investment portfolios, lead to tighter lending standards and result in reduced access to capital. These conditions may lead to a decline in net asset value and/or decline in valuations of our portfolio companies in future quarters. Although we cannot predict future market conditions, we continue to believe that our current cash and our ability to adjust our investment pace will provide us with adequate liquidity to execute our current business strategy.
| 97 |
Except for a rights offering, we are generally not able to issue and sell our common stock at a price below our net asset value per share, exclusive of any distributing commission or discount, without shareholder approval. As of September 30, 2015, our net asset value per share was $2.80 per share and our closing market price was $2.14 per share. We do not currently have shareholder approval to issue or sell shares below our net asset value per share.
On September 30, 2013, the Company entered into the Loan Facility that may be used by the Company to fund investments in portfolio companies. The Loan Facility, among other things, matures on September 30, 2017, and bears interest at 10 percent per annum in cash. The Company has the option to have interest accrue at a rate of 13.5 percent per annum if the Company decides not to pay interest in cash monthly. The Company currently plans to pay interest in cash if and when any borrowings are outstanding. The Loan Facility also requires payment of a draw fee on each borrowing equal to 1.0 percent of such borrowing and an unused commitment fee of 1.0 percent per annum. Interest and fee payments under the Loan Facility are made quarterly in arrears. The Company may prepay the loans or reduce the aggregate commitments under the Loan Facility at any time prior to the maturity date, as long as certain conditions are met, including payment of required prepayment or termination fees. The Loan Facility is secured by all of the assets of the Company and its wholly owned subsidiaries, subject to certain customary exclusions. The Loan Facility contains certain affirmative and negative covenants, including without limitation: (a) maintenance of certain minimum liquidity requirements; (b) maintenance of an eligible asset leverage ratio of not less than 4.0:1.0; (c) limitations on liens; (d) limitations on the incurrence of additional indebtedness; and (e) limitations on structural changes, mergers and disposition of assets (other than in the normal course of our business activities). There were no borrowings at closing.
At September 30, 2015, and December 31, 2014, the Company had $5,000,000 and $0, respectively, in debt outstanding. The remaining capacity under the Loan Facility was $15,000,000 at September 30, 2015.
A summary of our significant contractual payment obligations is as follows:
Payments Due by Period
| Total | Less than 1 Year | 1-3 Years | 3-5 Years | More Than 5 Years | ||||||||||||||||
| Multi-Draw Loan Facility(1) | $ | 5,000,000 | $ | 0 | $ | 5,000,000 | $ | 0 | $ | 0 | ||||||||||
| Operating leases | 1,264,899 | 285,934 | 593,491 | 385,474 | 0 | |||||||||||||||
| Total | $ | 6,264,899 | $ | 285,934 | $ | 5,593,491 | $ | 385,474 | $ | 0 | ||||||||||
(1)As of September 30, 2015, we had $15,000,000 of unused borrowing capacity under our Loan Facility.
On July 21, 2014, the Company made an investment in Accelerator IV-New York Corporation ("Accelerator") for a 9.6 percent interest in the company. This investment was diluted to 9.0 percent through follow-on financings by Accelerator in which the Company did not participate. Accelerator will be identifying emerging biotechnology companies for the Company to invest in directly over a five-year period. If the Company defaults on these commitments, the other investors may purchase the Company's shares of Accelerator for $0.001 per share. In the event of default, the Company would still be required to contribute the remaining operating commitment.
| 98 |
The Company's aggregate operating and investment commitments in Accelerator amounted to $666,667 and $3,333,333, respectively. During the nine months ended September 30, 2015, $262,215 in capital was called, all of which related to the operating commitment. As of September 30, 2015, the Company had remaining unfunded commitments of $188,440 and $3,333,333, or approximately 28.3 percent and 100 percent, of the total operating and investment commitments, respectively. The withdrawal of contributed capital is not permitted. The transfer or assignment of capital is subject to approval by Accelerator.
The Company's significant accounting policies are described in Note 3 to the Consolidated Financial Statements and in the Footnote to the Consolidated Schedule of Investments. Critical accounting policies are those that are both important to the presentation of our financial condition and results of operations and those that require management’s most difficult, complex or subjective judgments. The Company considers the following accounting policies and related estimates to be critical:
Valuation of Portfolio Investments
The most significant estimate inherent in the preparation of our consolidated financial statements is the valuation of investments and the related amounts of unrealized appreciation and depreciation of investments recorded. As a BDC, we invest in primarily illiquid securities that generally have no established trading market.
Investments are stated at "value" as defined in the 1940 Act and in the applicable regulations of the SEC and U.S. GAAP. ASC 820 defines fair value, establishes a framework for measuring fair value and expands disclosures about assets and liabilities measured at fair value. ASC 820 provides a consistent definition of fair value that focuses on exit price in the principal, or most advantageous, market and prioritizes, within a measurement of fair value, the use of market-based inputs over entity-specific inputs. ASC 820 also establishes the following three-level hierarchy for fair value measurements based upon the transparency of inputs to the valuation of an asset or liability as of the measurement date.
• Level 1 - inputs to the valuation methodology are quoted prices (unadjusted) for identical assets or liabilities in active markets;
• Level 2 - inputs to the valuation methodology include quoted prices for similar assets and liabilities in active markets, and inputs that are observable for the asset or liability, either directly or indirectly, for substantially the full term of the financial instrument. Level 2 inputs are in those markets for which there are few transactions, the prices are not current, little public information exists or instances where prices vary substantially over time or among brokered market makers; and
| 99 |
• Level 3 - inputs to the valuation methodology are unobservable and significant to the fair value measurement. Unobservable inputs are those inputs that reflect our own assumptions that market participants would use to price the asset or liability based upon the best available information.
Financial assets and liabilities are classified in their entirety based on the lowest level of input that is significant to the fair value measurement and are not necessarily an indication of risks associated with the investment. See "Note 6. Fair Value of Investments" in the accompanying notes to our consolidated financial statements for additional information regarding fair value measurements.
Value, as defined in Section 2(a)(41) of the 1940 Act, is (i) the market price for those securities for which a market quotation is readily available and (ii) the fair value as determined in good faith by, or under the direction of, the Board of Directors for all other assets. See "Valuation Procedures" in the "Footnote to Consolidated Schedule of Investments" for additional information. As of September 30, 2015, our financial statements include venture capital investments fair valued at $64,465,395, and equity method valued at $228,379, the values of which were determined in good faith by, or under the direction of, the Board of Directors. As of September 30, 2015, approximately 74 percent of our net assets represent investments in portfolio companies valued by the Board of Directors.
Determining fair value requires that judgment be applied to the specific facts and circumstances of each portfolio investment, although our valuation policy is intended to provide a consistent basis for determining fair value of the portfolio investments. Factors that may be considered include, but are not limited to, the cost of the Company’s investment; transactions in the portfolio company’s securities or unconditional firm offers by responsible parties; the financial condition and operating results of the company; the long-term potential of the business and technology of the company; the values of similar securities issued by companies in similar businesses; volatilities of similar securities issued by companies in similar businesses; expected time to exit; multiples to revenues, net income or EBITDA that similar securities issued by companies in similar businesses receive; the proportion of the company’s securities we own and the nature of any rights to require the company to register restricted securities under the applicable securities laws; management's assessment of non-performance risk; the achievement of milestones; discounts for restrictions on transfers of publicly traded securities; and the rights and preferences of the class of securities we own as compared with other classes of securities the portfolio has issued.
In addition, with respect to our debt investments for which no readily available market quotations are available, we will generally consider the financial condition and current and expected future cash flows of the portfolio company; the creditworthiness of the portfolio company and its ability to meet its current debt obligations; the relative seniority of our debt investment within the portfolio company’s capital structure; the availability and value of any available collateral; and changes in market interest rates and credit spreads for similar debt investments.
Historically, difficult venture capital environments have resulted in companies not receiving financing and being subsequently closed down with a loss of investment to venture investors, and other companies receiving financing but at significantly lower valuations than the preceding rounds, leading to very deep dilution for those who do not participate in the new rounds of investment. Our best estimate of this non-performance risk has been quantified and included in the valuation of our portfolio companies as of September 30, 2015.
| 100 |
All investments recorded at fair value are categorized based upon the level of judgment associated with the inputs used to measure their fair value. Hierarchical levels related to the amount of subjectivity associated with the inputs to fair valuation of these assets are as discussed above.
As of September 30, 2015, approximately 88 percent of our portfolio company investments were classified as Level 3 in the hierarchy, indicating a high level of judgment required in their valuation.
The values assigned to our assets are based on available information and do not necessarily represent amounts that might ultimately be realized, as these amounts depend on future circumstances and cannot be reasonably determined until the individual investments are actually liquidated or become readily marketable. Upon sale of investments, the values that are ultimately realized may be materially different from what is presently estimated.
Stock-Based Compensation
Determining the appropriate fair-value model and calculating the fair value of share-based awards on the date of grant requires judgment. Historically, we have used the Black-Scholes-Merton option pricing model to estimate the fair value of employee stock options.
Management uses the Black-Scholes-Merton option pricing model in instances where we lack historical data necessary for more complex models and when the share award terms can be valued within the model. Other models may yield fair values that are significantly different from those calculated by the Black-Scholes-Merton option pricing model.
Management uses a binomial lattice option pricing model in instances where it is necessary to include a broader array of assumptions. We used the binomial lattice model for the 10-year NQSOs granted on March 18, 2009, and for performance-based restricted stock awards. These awards included accelerated vesting provisions or target stock prices that were based on market conditions.
Option pricing models require the use of subjective input assumptions, including expected volatility, expected life, expected dividend rate, and expected risk-free rate of return. Variations in the expected volatility or expected term assumptions have a significant impact on fair value. As the volatility or expected term assumptions increase, the fair value of the stock option increases. The expected dividend rate and expected risk-free rate of return are not as significant to the calculation of fair value. A higher assumed dividend rate yields a lower fair value, whereas higher assumed interest rates yield higher fair values for stock options.
In the Black-Scholes-Merton model, we use the simplified calculation of expected term as described in the SEC’s Staff Accounting Bulletin 107 because of the lack of historical information about option exercise patterns. In the binomial lattice model, we use an expected term that assumes the options will be exercised at two times the strike price because of the lack of option exercise patterns. Future exercise behavior could be materially different than that which is assumed by the model.
| 101 |
Expected volatility is based on the historical fluctuations in the Company's stock. The Company's stock has historically been volatile, which increases the fair value of the underlying share-based awards.
GAAP requires us to develop an estimate of the number of share-based awards that will be forfeited owing to employee turnover. Quarterly changes in the estimated forfeiture rate can have a significant effect on reported share-based compensation, as the effect of adjusting the rate for all expense amortization after the grant date is recognized in the period the forfeiture estimate is changed. If the actual forfeiture rate proves to be higher than the estimated forfeiture rate, then an adjustment will be made to increase the estimated forfeiture rate, which would result in a decrease to the expense recognized in the financial statements. If the actual forfeiture rate proves to be lower than the estimated forfeiture rate, then an adjustment will be made to decrease the estimated forfeiture rate, which would result in an increase to the expense recognized in the financial statements. Such adjustments would affect our operating expenses and additional paid-in capital, but would have no effect on our net asset value.
Pension and Post-Retirement Benefit Plan Assumptions
The Company provides a Retiree Medical Benefit Plan for employees who meet certain eligibility requirements. Until it was terminated on May 5, 2011, the Company also provided an Executive Mandatory Retirement Benefit Plan for certain individuals employed by us in a bona fide executive or high policy-making position. Our former President accrued benefits under this plan prior to his retirement, and the termination of the plan has no impact on his accrued benefits. Several statistical and other factors that attempt to anticipate future events are used in calculating the expense and liability values related to our post-retirement benefit plans. These factors include assumptions we make about the discount rate, the rate of increase in healthcare costs, and mortality, among others.
The discount rate reflects the current rate at which the post-retirement medical benefit and pension liabilities could be effectively settled considering the timing of expected payments for plan participants. In estimating this rate, we consider the Citigroup Pension Liability Index in the determination of the appropriate discount rate assumptions. The weighted average rate we utilized to measure our post-retirement medical benefit obligation as of December 31, 2014, and to calculate our 2015 expense was 3.83 percent. We used a discount rate of 2.95 percent to calculate our pension obligation for the Executive Mandatory Retirement Benefit Plan.
Recent Developments - Portfolio Companies
On October 1, 2015, the Company received proceeds of $795,567 upon the achievement of the first milestone associated with the sale of Molecular Imprints, Inc., to Canon, Inc.
On October 27, 2015, Adesto Technologies Corporation completed an IPO priced at $5.00 per share, trading on the NASDAQ Capital Market under the symbol "IOTS." The Company invested $1,000,000 in the offering. On November 6, 2015, the closing price of Adesto's shares of common stock was 5.41.
| 102 |
On October 30, 2015, the Company made a $250,000 follow-on investment in Produced Water Absorbents, Inc., a privately held portfolio company.
On November 3, 2015, the initial U.S. sales milestone associated with Amgen, Inc.’s acquisition of BioVex Group, Inc., was achieved. The Company will receive proceeds of $2,070,955 related to this achievement on or before December 18, 2015.
During October of 2015, the Company repurchased an additional 119,365 shares of its stock at an average price of $2.20 inclusive of commissions. There is a maximum of $1,500,003 available for future program purchases.
Item 3. Quantitative and Qualitative Disclosures About Market Risk
Our business activities contain elements of risk. We consider the principal types of market risk to be valuation risk, interest rate risk and foreign currency risk. Although we are risk-seeking rather than risk-averse in our investments, we consider the management of risk to be essential to our business.
Valuation Risk
Value, as defined in Section 2(a)(41) of the 1940 Act, is (i) the market price for those securities for which market quotations are readily available and (ii) fair value as determined in good faith by, or under the direction of, the Board of Directors for all other assets. (See the "Valuation Procedures" in the "Footnote to Consolidated Schedule of Investments" contained in "Item 1. Consolidated Financial Statements.")
Because there is typically no public market for our interests in the privately held small businesses in which we invest, the valuation of the equity interests in that portion of our portfolio is determined in good faith by our Board of Directors with the assistance of our Valuation Committee, comprised of the independent members of our Board of Directors, in accordance with our Valuation Procedures. In the absence of a readily ascertainable market value, the determined value of our portfolio of equity interests may differ significantly from the values that would be placed on the portfolio if a ready market for the equity interests existed. Determining fair value requires that judgment be applied to the specific facts and circumstances of each portfolio investment, although our valuation policy is intended to provide a consistent basis for determining fair value of the portfolio investments. Factors that may be considered include, but are not limited to, readily available public market quotations; the cost of the Company’s investment; transactions in the portfolio company’s securities or unconditional firm offers by responsible parties; the financial condition and operating results of the company; the long-term potential of the business and technology of the company; the estimated time to exit our investment; the values and volatilities of similar securities issued by companies in similar businesses; multiples to revenues, net income or EBITDA that similar securities issued by companies in similar businesses receive; the proportion of the company’s securities we own and the nature of any rights to require the company to register restricted securities under the applicable securities laws; management's assessment of non-performance risk; the achievement of milestones; and the rights and preferences of the class of securities we own as compared with other classes of securities the portfolio has issued.
| 103 |
In addition, with respect to our debt investments for which no readily available market quotations are available, we will generally consider the financial condition and current and expected future cash flows of the portfolio company; the creditworthiness of the portfolio company and its ability to meet its current debt obligations; the relative seniority of our debt investment within the portfolio company’s capital structure; the availability and value of any available collateral; and changes in market interest rates and credit spreads for similar debt investments. Any changes in valuation are recorded in our Consolidated Statements of Operations as "Net increase (decrease) in unrealized appreciation on investments." Changes in valuation of any of our investments in privately held companies from one period to another may be volatile.
Investments in privately held, immature companies are inherently more volatile than investments in more mature businesses. Such immature businesses are inherently fragile and easily affected by both internal and external forces. Our investee companies can lose much or all of their value suddenly in response to an internal or external adverse event. Conversely, these immature businesses can gain suddenly in value in response to an internal or external positive development.
The values assigned to our assets are based on available information and do not necessarily represent amounts that might ultimately be realized, as these amounts depend on future circumstances and cannot be reasonably determined until the individual investments are actually liquidated or become readily marketable. Upon sale of investments, the values that are ultimately realized may be materially different from what is presently estimated.
Interest Rate Risk
Interest rate sensitivity refers to the change in earnings that may result from changes in the level of interest rates. Our borrowings under our Loan Facility bear interest at a fixed rate of 10 percent per annum, and, therefore, changes in interest rate benchmarks, such as LIBOR, will not affect our earnings on such investments if we decide to fund them through draws from our Loan Facility.
We may also invest in both short- and long-term U.S. government and agency securities. To the extent that we invest in short- and long-term U.S. government and agency securities, changes in interest rates result in changes in the value of these obligations that result in an increase or decrease of our net asset value. The level of interest rate risk exposure at any given point in time depends on the market environment, the expectations of future price and market movements, and the quantity and duration of long-term U.S. government and agency securities held by the Company, and it will vary from period to period.
In addition, market interest rates for high-yield corporate debt are an input in determining value of our investments in debt securities of privately held and publicly traded companies. Significant changes in these market rates could affect the value of our debt securities as of the date of measurement of value. Our investment income could be adversely affected should such debt securities include floating interest rates. We do not currently have any investments in debt securities with floating interest rates.
| 104 |
Foreign Currency Risk
Most of our investments are denominated in U.S. dollars. We currently have one investment denominated in Canadian dollars. We are exposed to foreign currency risk related to potential changes in foreign currency exchange rates. The potential loss in fair value on this investment resulting from a 10 percent adverse change in quoted foreign currency exchange rates is $459,027 at September 30, 2015.
Item 4. Controls and Procedures
(a) Disclosure Controls and Procedures. As of the end of the period covered by this report, the Company’s management, under the supervision and with the participation of our chief executive officer and chief financial officer, conducted an evaluation of the effectiveness of the design and operation of our disclosure controls and procedures (as required by Rules 13a-15 of the 1934 Act). Disclosure controls and procedures means controls and other procedures of an issuer that are designed to ensure that information required to be disclosed by the issuer in the reports that it files or submits under the 1934 Act is recorded, processed, summarized and reported, within time periods specified in the SEC's rules and forms, and that such information is accumulated and communicated to the issuer's management, as appropriate, to allow timely decisions regarding required disclosures. As of September 30, 2015, based upon this evaluation of our disclosure controls and procedures, our chief executive officer and chief financial officer concluded that our disclosure controls and procedures were effective.
(b) Changes in Internal Control Over Financial Reporting. There have not been any changes in the Company's internal control over financial reporting (as such term is defined in Rules 13a-15(f) and 15d-15(f) under the 1934 Act) during the third quarter of 2015 to which this report relates that have materially affected, or are reasonably likely to materially affect, the Company’s internal control over financial reporting.
| 105 |
Investing in our common stock involves significant risks relating to our business and investment objective. You should carefully consider the risks and uncertainties described in our Annual Report on Form 10-K for the year ended December 31, 2014, before you purchase any of our common stock.
The risks described in our Annual Report on Form 10-K are not the only risks facing our Company. Unknown additional risks and uncertainties, or ones that we currently consider immaterial, may also impair our business. If any of these risks or uncertainties materialize, our business, financial condition or results of operations could be materially adversely affected. In this event, the trading price of our common stock could decline, and you could lose all or part of your investment.
As of September 30, 2015, we believe that the following updates should be considered to the risk factors previously disclosed in response to “Item 1A. Risk Factors” of our Annual Report on Form 10-K for the fiscal year ended December 31, 2014.
Approximately 47.2 percent of the net asset value attributable to our equity-focused venture capital investment portfolio, or 35.9 percent of our net asset value, as of September 30, 2015, is concentrated in Metabolon, Inc., Adesto Technologies Corporation, D-Wave Systems, Inc., and HZO, Inc.
At September 30, 2015, we valued our investment in Metabolon, which had a historical cost to us of $7,231,212, at $9,730,610, our investment in Adesto, which had a historical cost to us of $10,482,417, at $7,349,579, our investment in D-Wave, which had a historical cost to us of $5,689,311, at $7,161,080, and our investment in HZO, which had a historical cost to us of $8,876,508, at $7,003,646, which collectively represent 47.2 percent of the net asset value attributable to our equity-focused venture capital investment portfolio, excluding our rights to potential future milestone payments from the sale of BioVex to Amgen, or 35.9 percent of our net asset value.
Any downturn in the business outlook and/or substantial changes in the funding requirements of Adesto, Metabolon, D-Wave or HZO could have a significant effect on the value of our current investments in those companies, and the overall value of our portfolio, and could have a significant adverse effect on the value of our common stock.
Item 2. Unregistered Sales of Equity Securities and Use of Proceeds
Sales of Unregistered Equity Securities
We did not engage in unregistered sales of equity securities during the nine months ended September 30, 2015.
| 106 |
Issuer Purchases of Equity Securities
On August 6, 2015, our Board of Directors authorized a repurchase of up $2.5 million of the Company’s common stock in the open market within a six-month period. Under the repurchase program, we may, but we are not obligated to, repurchase our outstanding common stock in the open market from time to time provided that we comply with the prohibitions under our Insider Trading Policies and Procedures and the guidelines specified in Rule 10b-18 of the Securities Exchange Act of 1934, as amended, including certain price, market volume and timing constraints. In addition, any repurchases will be conducted in accordance with the 1940 Act. During the quarter ended September 30, 2015, we repurchased 298,819 shares at an average price of approximately $2.47 per share, inclusive of commissions. This represents a discount of approximately 12.1 percent of the net asset value per share at September 30, 2015. The total dollar amount of shares repurchased in this period is $737,662, leaving a maximum of $1,762,338 available for future program purchases.
The following table discloses on a monthly basis for the quarter ended September 30, 2015, the total number of shares repurchased (including the total number of shares repurchased under this program), the average price paid per share, and the maximum number of shares (or approximate dollar value) of shares that may yet be repurchased under the program.
| Period | (a) Total Number of Shares Purchased | (b) Average Price Paid per Share | (c) Total Number of Shares Purchased as Part of Publicly Announced Program | (d) Maximum Number (or Approximate Dollar Value) of Shares that May Yet Be Purchased Under the Program | ||||||||||||
| August 21- 31, 2015 | 88,875 | $ | 2.54 | 88,875 | $ | 2,274,557 | ||||||||||
| September 1-30, 2015 | 209,944 | 2.44 | 298,819 | 1,762,338 | ||||||||||||
Item 3. Defaults Upon Senior Securities
None.
Item 4. Mine Safety Disclosures
Not applicable.
None.
| 107 |
| 31.01* | Certification of CEO pursuant to Section 302 of the Sarbanes-Oxley Act of 2002. | |
| 31.02* | Certification of CFO pursuant to Section 302 of the Sarbanes-Oxley Act of 2002. | |
| 32* | Certification of CEO and CFO pursuant to 18 U.S.C. Section 1350, as adopted pursuant to Section 906 of the Sarbanes-Oxley Act of 2002. |
*filed herewith
| 108 |
Pursuant to the requirements of the Securities Exchange Act of 1934, the registrant has duly caused this report to be signed on its behalf by the undersigned thereunto duly authorized.
| Harris & Harris Group, Inc. |
| /s/ | Douglas W. Jamison | |
| By: | Douglas W. Jamison | |
| Chief Executive Officer |
| /s/ | Patricia N. Egan | |
| By: | Patricia N. Egan | |
| Chief Financial Officer |
Date: November 9, 2015
| 109 |
| Exhibit No. | Description | |
| 31.01 | Certification of CEO pursuant to Section 302 of the Sarbanes-Oxley Act of 2002. | |
| 31.02 | Certification of CFO pursuant to Section 302 of the Sarbanes-Oxley Act of 2002. | |
| 32 | Certification of CEO and CFO pursuant to 18 U.S.C. Section 1350, as adopted pursuant to Section 906 of the Sarbanes-Oxley Act of 2002. |
| 110 |
HARRIS & HARRIS GROUP, INC.
INVESTMENTS IN AND ADVANCES TO AFFILIATES
| Name of Issuer | Title of Issue or Nature of Indebtedness(A) | Amount of Dividends or Interest Credited to Income (B) | Value as of December 31, 2014 | Gross Additions (C) | Gross Reductions (D) | Value as of September 30, 2015 | ||||||||||||||||
MAJORITY OWNED CONTROLLED INVESTMENTS: | ||||||||||||||||||||||
Black Silicon Holdings, Inc. | Series A Convertible Preferred Stock | $ | 0 | $ | 0 | $ | 0 | $ | 0 | $ | 0 | |||||||||||
| Series A-1 Convertible Preferred Stock | 0 | 0 | 0 | 0 | 0 | |||||||||||||||||
| Series A-2 Convertible Preferred Stock | 0 | 0 | 0 | 0 | 0 | |||||||||||||||||
| Series B-1 Convertible Preferred Stock | 0 | 0 | 0 | 0 | 0 | |||||||||||||||||
| Series C Convertible Preferred Stock | 0 | 0 | 0 | 0 | 0 | |||||||||||||||||
| Secured Convertible Bridge Notes | 94,687 | 161,285 | 157,453 | 0 | 318,738 | |||||||||||||||||
| NGX Bio, Inc. | Series Seed Convertible Preferred Stock | $ | 0 | $ | 506,159 | $ | 79,055 | $ | 0 | $ | 585,214 | |||||||||||
| Series A Convertible Preferred Stock | 0 | 0 | 504,882 | 0 | 504,882 | |||||||||||||||||
| Warrants for Series Seed Preferred Stock | 0 | 0 | 195,070 | 0 | 195,070 | |||||||||||||||||
| ProMuc, Inc. | Common Stock | $ | 0 | $ | 1 | $ | 0 | $ | 0 | $ | 1 | |||||||||||
| Secured Convertible Bridge Note | 27,863 | 482,164 | 102,863 | 0 | 585,027 | |||||||||||||||||
| SynGlyco, Inc. | Common Stock | $ | 0 | $ | 0 | $ | 0 | $ | 0 | $ | 0 | |||||||||||
| Series A' Convertible Preferred Stock | 0 | 0 | 123,460 | 0 | 123,460 | |||||||||||||||||
| Senior Secured Debt | 113,232 | 820,119 | 0 | (820,119 | ) | 0 | ||||||||||||||||
| Secured Convertible Bridge Notes | 44,572 | 376,983 | 415,830 | 0 | 792,813 | |||||||||||||||||
| TARA Biosystems, Inc. | Common Stock | $ | 0 | $ | 20 | $ | 0 | $ | 0 | $ | 20 | |||||||||||
| Secured Convertible Bridge Notes | 24,133 | 308,811 | 224,133 | 0 | 532,944 | |||||||||||||||||
| Total Majority Owned Controlled Investments | $ | 304,487 | $ | 2,655,542 | $ | 1,802,746 | $ | (820,119 | ) | $ | 3,638,169 | |||||||||||
i
| Name of Issuer | Title of Issue or Nature of Indebtedness(A) | Amount of Dividends or Interest Credited to Income (B) | Value as of December 31, 2014 | Gross Additions (C) | Gross Reductions (D) | Value as of September 30, 2015 | ||||||||||||||||
OTHER CONTROLLED INVESTMENTS: | ||||||||||||||||||||||
| Senova Systems, Inc. | Series B Convertible Preferred Stock | $ | 0 | $ | 403,123 | $ | 61,898 | $ | 0 | $ | 465,021 | |||||||||||
| Series B-1 Convertible Preferred Stock | 0 | 899,187 | 0 | (19,188 | ) | 879,999 | ||||||||||||||||
| Series C Convertible Preferred Stock | 0 | 609,349 | 600,740 | 0 | 1,210,089 | |||||||||||||||||
| Warrants for Series B Preferred Stock | 0 | 56,563 | 8,685 | 0 | 65,248 | |||||||||||||||||
| Total Other Controlled Investments | $ | 0 | $ | 1,968,222 | $ | 671,323 | $ | (19,188 | ) | $ | 2,620,357 | |||||||||||
| AFFILIATE INVESTMENTS: | ||||||||||||||||||||||
| ABSMaterials, Inc. | Series A Convertible Preferred Stock | $ | 0 | $ | 291,875 | $ | 14,904 | $ | 0 | $ | 306,779 | |||||||||||
| Series B Convertible Preferred Stock | 0 | 1,255,717 | 0 | (7,659 | ) | 1,248,058 | ||||||||||||||||
| Adesto Technologies Corporation | Series A Convertible Preferred Stock | $ | 0 | $ | 1,652,609 | $ | 0 | $ | (723,714 | ) | $ | 928,895 | ||||||||||
| Series B Convertible Preferred Stock | 0 | 1,527,457 | 0 | (683,007 | ) | 844,450 | ||||||||||||||||
| Series C Convertible Preferred Stock | 0 | 632,526 | 0 | (331,456 | ) | 301,070 | ||||||||||||||||
| Series D Convertible Preferred Stock | 0 | 612,462 | 0 | (397,540 | ) | 214,922 | ||||||||||||||||
| Series D-1 Convertible Preferred Stock | 0 | 356,159 | 0 | (216,035 | ) | 140,124 | ||||||||||||||||
| Series E Convertible Preferred Stock | 0 | 10,042,110 | 0 | (5,121,992 | ) | 4,920,118 | ||||||||||||||||
| AgBiome, LLC | Series A-1 Convertible Preferred Stock | $ | 0 | $ | 2,406,210 | $ | 1,629,344 | $ | 0 | $ | 4,035,554 | |||||||||||
| Series A-2 Convertible Preferred Stock | 0 | 583,494 | 312,965 | 0 | 896,459 | |||||||||||||||||
| Series B Convertible Preferred Stock | 0 | 0 | 574,333 | 0 | 574,333 | |||||||||||||||||
| D-Wave Systems, Inc. | Series 1 Class B Convertible Preferred Stock | $ | 0 | $ | 1,766,715 | $ | 0 | $ | (231,041 | ) | $ | 1,535,674 | ||||||||||
| Series 1 Class C Convertible Preferred Stock | 0 | 699,457 | 0 | (91,008 | ) | 608,449 | ||||||||||||||||
ii
| Name of Issuer | Title of Issue or Nature of Indebtedness(A) | Amount of Dividends or Interest Credited to Income (B) | Value as of December 31, 2014 | Gross Additions (C) | Gross Reductions (D) | Value as of September 30, 2015 | ||||||||||||||||
D-Wave Systems, Inc. (Cont'd) | Series 1 Class D Convertible Preferred Stock | $ | 0 | $ | 1,327,843 | $ | 0 | $ | (172,768 | ) | $ | 1,155,075 | ||||||||||
| Series 1 Class E Convertible Preferred Stock | 0 | 435,260 | 0 | (54,888 | ) | 380,372 | ||||||||||||||||
| Series 1 Class F Convertible Preferred Stock | 0 | 418,193 | 0 | (52,736 | ) | 365,457 | ||||||||||||||||
| Series 1 Class H Convertible Preferred Stock | 0 | 870,998 | 0 | (112,833 | ) | 758,165 | ||||||||||||||||
| Series 2 Class D Convertible Preferred Stock | 0 | 1,053,205 | 0 | (137,034 | ) | 916,171 | ||||||||||||||||
| Series 2 Class E Convertible Preferred Stock | 0 | 839,844 | 0 | (104,986 | ) | 734,858 | ||||||||||||||||
| Series 2 Class F Convertible Preferred Stock | 0 | 806,909 | 0 | (100,869 | ) | 706,040 | ||||||||||||||||
| Warrants for Common Stock | 0 | 116,830 | 0 | (116,011 | ) | 819 | ||||||||||||||||
| EchoPixel, Inc. | Series Seed Convertible Preferred Stock | $ | 0 | $ | 1,312,425 | $ | 36,329 | $ | 0 | $ | 1,348,754 | |||||||||||
| Ensemble Therapeutics Corporation | Series B Convertible Preferred Stock | $ | 0 | $ | 1,060,023 | $ | 0 | $ | (307,600 | ) | $ | 752,423 | ||||||||||
| Series B-1 Convertible Preferred Stock | 0 | 1,833,862 | 0 | (372,348 | ) | 1,461,514 | ||||||||||||||||
| HZO, Inc. | Common Stock | $ | 0 | $ | 322,832 | $ | 0 | $ | (4,563 | ) | $ | 318,269 | ||||||||||
| Series I Convertible Preferred Stock | 0 | 4,482,097 | 0 | (300,190 | ) | 4,181,907 | ||||||||||||||||
| Series II Convertible Preferred Stock | 0 | 2,113,002 | 500,003 | (109,535 | ) | 2,503,470 | ||||||||||||||||
| Laser Light Engines, Inc. | Series A Convertible Preferred Stock | $ | 0 | $ | 0 | $ | 0 | $ | 0 | $ | 0 | |||||||||||
| Series B Convertible Preferred Stock | 0 | 0 | 0 | 0 | 0 | |||||||||||||||||
| Convertible Bridge Notes(E) | 0 | 0 | 0 | 0 | 0 | |||||||||||||||||
iii
| Name of Issuer | Title of Issue or Nature of Indebtedness(A) | Amount of Dividends or Interest Credited to Income (B) | Value as of December 31, 2014 | Gross Additions (C) | Gross Reductions (D) | Value as of September 30, 2015 | ||||||||||||||||
| Metabolon, Inc. | Series B Convertible Preferred Stock | $ | 0 | $ | 2,781,374 | $ | 0 | $ | (186,932 | ) | $ | 2,594,442 | ||||||||||
| Series B-1 Convertible Preferred Stock | 0 | 1,158,654 | 0 | (76,577 | ) | 1,082,077 | ||||||||||||||||
| Series C Convertible Preferred Stock | 0 | 2,535,525 | 0 | (174,720 | ) | 2,360,805 | ||||||||||||||||
| Series D Convertible Preferred Stock | 0 | 2,179,624 | 0 | (189,170 | ) | 1,990,454 | ||||||||||||||||
| Series E-1 Convertible Preferred Stock | 0 | 1,556,847 | 0 | (154,249 | ) | 1,402,598 | ||||||||||||||||
| Series E-2 Convertible Preferred Stock | 0 | 0 | 300,234 | 0 | 300,234 | |||||||||||||||||
| Warrants for Series B-1 Preferred Stock | 0 | 484,535 | 0 | (484,535 | ) | 0 | ||||||||||||||||
| ORIG3N, Inc. | Series I Convertible Preferred Stock | $ | 0 | $ | 0 | $ | 505,938 | $ | 0 | $ | 505,938 | |||||||||||
| Produced Water Absorbents, Inc. | Series A Convertible Preferred Stock | $ | 0 | $ | 300,215 | $ | 0 | $ | (297,511 | ) | $ | 2,704 | ||||||||||
| Series B Convertible Preferred Stock | 0 | 2,188,272 | 0 | (1,824,155 | ) | 364,117 | ||||||||||||||||
| Series B-2 Convertible Preferred Stock | 0 | 1,579,844 | 0 | (1,316,966 | ) | 262,878 | ||||||||||||||||
| Series B-3 Convertible Preferred Stock | 0 | 1,430,677 | 0 | (1,192,620 | ) | 238,057 | ||||||||||||||||
| Series C Convertible Preferred Stock | 0 | 755,130 | 0 | (633,380 | ) | 121,750 | ||||||||||||||||
| Series D Convertible Preferred Stock | 0 | 0 | 984,203 | (744,521 | ) | 239,682 | ||||||||||||||||
| Warrants for Series B-2 Convertible Preferred Stock | 0 | 44,014 | 0 | (42,875 | ) | 1,139 | ||||||||||||||||
| Subordinated Secured Non- Convertible Debt | 105,163 | 979,450 | 0 | (11,400 | ) | 968,050 | ||||||||||||||||
| Secured Convertible Bridge Note | 16,521 | 0 | 766,521 | 0 | 766,521 | |||||||||||||||||
| Ultora, Inc. | Series A Convertible Preferred Stock | $ | 0 | $ | 0 | $ | 0 | $ | 0 | $ | 0 | |||||||||||
| Series B Convertible Preferred Stock | 0 | 0 | 0 | 0 | 0 | |||||||||||||||||
| Unsecured Bridge Notes(E) | 0 | 0 | 7,525 | (7,525 | ) | 0 | ||||||||||||||||
| Total Affiliate Investments | $ | 121,684 | $ | 56,794,275 | $ | 5,632,299 | $ | (17,086,949 | ) | $ | 45,339,625 | |||||||||||
iv
| (A) | Common stock, warrants, options, membership units and, in some cases, preferred stock are generally non-income producing and restricted. The principal amount of debt and the number of shares of common and preferred stock and number of membership units are shown in the accompanying Consolidated Schedules of Investments as of September 30, 2015, and December 31, 2014. |
| (B) | Represents the total amount of interest or dividends and yield-enhancing fees on debt securities credited to income for the portion of the year an investment was a control or affiliate investment, as appropriate. Amounts credited to preferred or common stock represent accrued bridge note interest related to conversions that occurred during 2015. |
| (C) | Gross additions include increases in investments resulting from new portfolio investments, paid-in-kind interest or dividends, the amortization of discounts and fees. Gross additions also include net increases in unrealized appreciation or decreases in unrealized depreciation. |
| (D) | Gross reductions include decreases in investments resulting from principal collections related to investment repayments or sales, the amortization of premiums and acquisition costs. Gross reductions also include net increases in unrealized depreciation or decreases in unrealized appreciation. |
| (E) | Debt security is on non-accrual status and, therefore, is considered non-income producing during the nine months ended September 30, 2015. |
**Information related to the amount of equity in the net profit and loss for the year for the investments listed has not been included in this schedule. This information is not considered to be meaningful owing to the complex capital structures of the portfolio companies, with different classes of equity securities outstanding with different preferences in liquidation. These investments are not consolidated, nor are they accounted for under the equity method of accounting.
v