Attached files
| file | filename |
|---|---|
| 8-K - FORM 8-K - LOJACK CORP | a8-kq32015earningsrelease.htm |
| EX-99.1 - EXHIBIT 99.1 EARNINGS RELEASE Q3 2015 - LOJACK CORP | q3earningsrelease.htm |

1 © 2015 LoJack Corporation. All Rights Reserved. LoJack and the LoJack logo are trademarks or registered trademarks of the LoJack Corporation in the United States and other countries. LoJack Corporation Q3 2015 Results November 6, 2015

2 Forward-looking Statements Statements in this presentation that are not statements of historical fact are forward-looking statements. Such forward- looking statements, which include statements regarding the Company’s strategic plans and initiatives, markets, customer orders and shipments, and future financial performance, are based on a number of assumptions and involve a number of risks and uncertainties, and accordingly, actual results could differ materially. Factors that may cause such differences include, but are not limited to: (1) the continued and future acceptance of the Company's products and services, including the Company's Pre-Install Program and inventory management, fleet management and telematics solutions; (2) the Company's ability to obtain financing from lenders and to satisfy or obtain waivers for covenant requirements under its credit facility; (3) the outcome of ongoing litigation involving the Company; (4) the Company’s ability to enforce the terms of the settlement agreement with Tracker do Brasil LTDA and its impact on the Company's future relationships with Tracker and its affiliates; (5) the rate of growth in the industries of the Company's customers; (6) the presence of competitors with greater technical, marketing, and financial resources; (7) the Company's customers' ability to access the credit markets, including changes in interest rates; (8) the Company's ability to promptly and effectively respond to technological change to meet evolving customer needs; (9) the Company's ability to successfully expand its operations, including through the introduction of new products and services; (10) changes in general economic or geopolitical conditions; (11) conditions in the automotive retail market and the Company's relationships with dealers, licensees, partners, agents and local law enforcement; (12) delays or other changes in the timing of purchases by the Company's customers; (13) the Company's ability to achieve the expected benefits of its strategic alliances with TomTom and Trackunit; (14) financial and reputational risks related to product quality and liability issues; (15) the Company's ability to re-enter the Brazilian market in a timely manner and/or on favorable terms; and (16) trade tensions and governmental regulations and restrictions in Argentina and the Company's other international markets. For a further discussion of these and other significant factors to consider in connection with forward-looking statements concerning the Company, reference is made to the Company's Annual Report on Form 10-K for the year ended December 31, 2014 and the Company's other filings with the Securities and Exchange Commission. Such forward-looking statements speak only as of the date made. Except as required by law, the Company undertakes no obligation to update these forward-looking statements.

3 In addition to financial measures prepared in accordance with generally accepted accounting principles (GAAP), this presentation also contains certain non-GAAP financial measures including EBITDA, Adjusted EBITDA and non-GAAP gross profit (and the corresponding gross margin percentages). The Company believes that the inclusion of these non-GAAP financial measures in this presentation helps investors to gain a meaningful understanding of changes in the Company's core operating results, and can also help investors who wish to make comparisons between LoJack and other companies on both a GAAP and a non-GAAP basis. LoJack management uses these non-GAAP measures, in addition to GAAP financial measures, as the basis for measuring our core operating performance and comparing such performance to that of prior periods and to the performance of our competitors. These measures are also used by management to assist with their financial and operating decision making. The non-GAAP financial measures included in this presentation are not meant to be considered superior to or a substitute for results of operations prepared in accordance with GAAP. In addition, the non-GAAP financial measures included in this presentation may be different from, and therefore may not be comparable to, similar measures used by other companies. Reconciliations of the non- GAAP financial measures used in this presentation to the most directly comparable GAAP financial measures are set forth in the accompanying appendix to this presentation. Use of Non-GAAP Financial Measures

4 Q3 2015 Overview • Net income of $1.5 million, or $0.08 per diluted share • Gross profit increases 76% YoY to $17.8 million • Gross profit margin of 54.4% • Significant reduction in opex and the absence of additional QAP expense drives $11.2 million improvement in EBITDA and $6.9 million in cash flow from operations

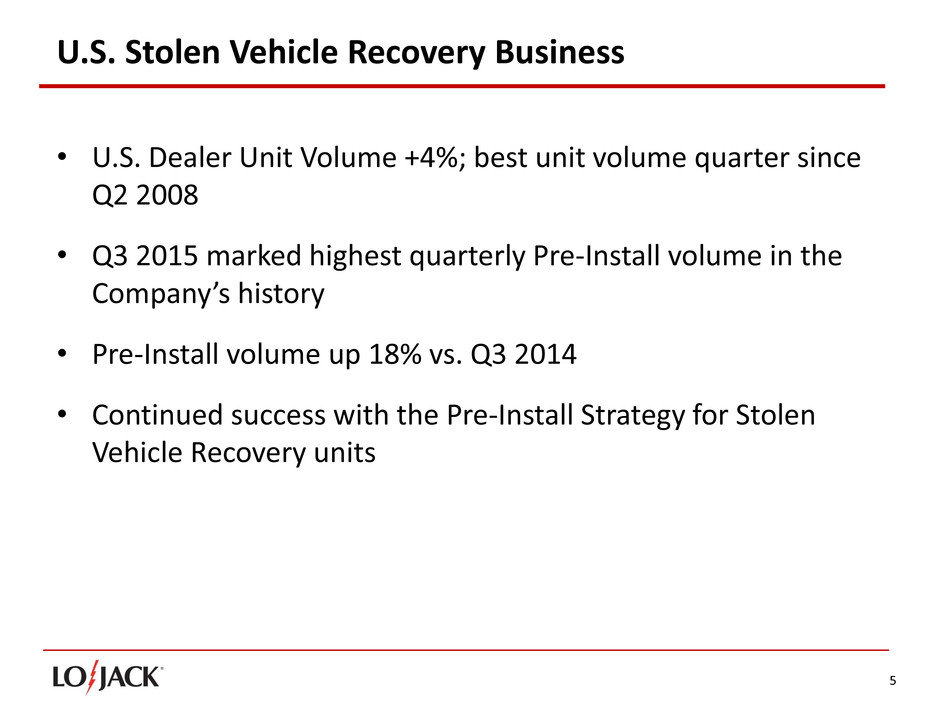
5 U.S. Stolen Vehicle Recovery Business • U.S. Dealer Unit Volume +4%; best unit volume quarter since Q2 2008 • Q3 2015 marked highest quarterly Pre-Install volume in the Company’s history • Pre-Install volume up 18% vs. Q3 2014 • Continued success with the Pre-Install Strategy for Stolen Vehicle Recovery units

6 Advancing the Pre-Install Strategy Pre-Install Program Sales Mix % Share of Dealer Channel Volume Strong Pre-Install Acquisition in Q3 expected to set the stage for continued unit sales and revenue for the balance of 2015 31% 32% 34% 43% 44% 45% 46% 51% 52% 55% 54% 61% 62% 60% 60% 0% 10% 20% 30% 40% 50% 60% 70% Q1 2012Q2 2012Q3 2012Q4 2012Q1 2013Q2 2013Q3 2013Q4 2013Q1 2014Q2 2014Q3 2014Q4 2014Q1 2015Q2 2015Q3 2015

7 U.S. Sales Outlook Remains Positive Industry forecasts project annual total light vehicle growth of +5% in 2015, with retail sales projected to be up 4.6%. Source: Power Information Network – PIN, a business division of J.D. Power & Associates 0.0 5.0 10.0 15.0 20.0 25.0 2008 2009 2010 2011 2012 2013 2014 2015 F'cst 2016 F'cst Ligh t V e hi c le S a le s ( M il li ons ) Total U.S. Light Vehicle Sales Fleet & Retail (2008 to 2016E) Fleet Sales Retail Sales 13.2M 10.4M 11.6M 12.8M 14.5M 15.6M -18.0% -21.1% +11.1% +10.3% +7.6% +5.9% +5.0% 16.5M 17.3M -17.2% -18.6% +6.3% +12.4% +13.6% +9.5% +5.6% +4.6% +13.5% +0.2% 17.4M +0.4%

8 International International Revenue +40% vs. Q3 2014 • Revenue at $9.8 million vs. $7 million in Q3 2014 Italy • Stronger growth continues to deliver profitability; revenue growth of 34% vs. Q3 2014 • Surpassed 66,000 subscriber, a 49% growth vs. Q3 2014

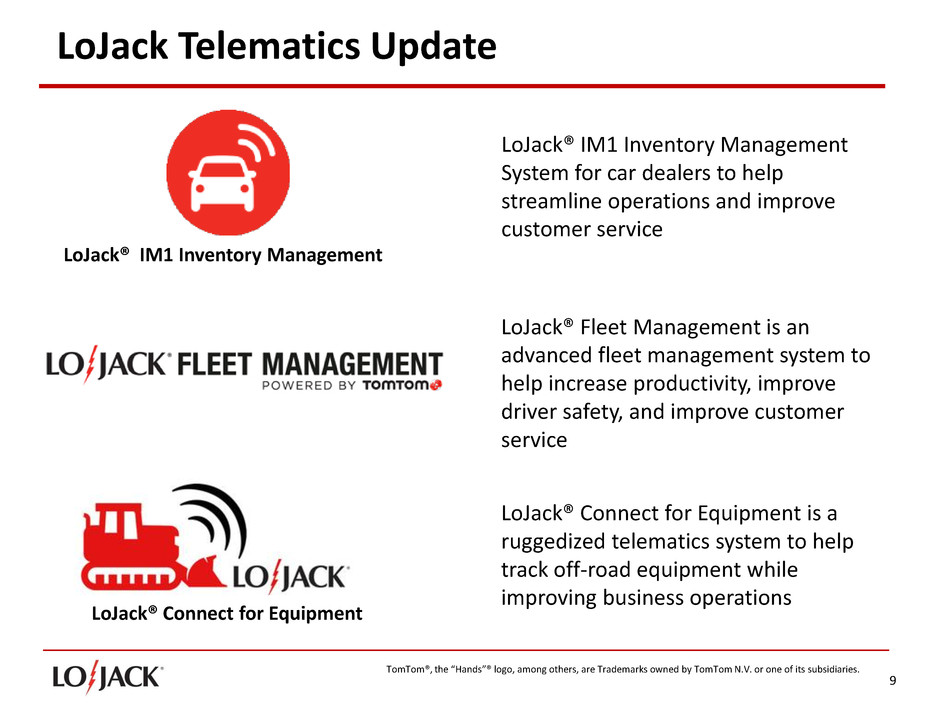
9 LoJack Telematics Update LoJack® IM1 Inventory Management LoJack® IM1 Inventory Management System for car dealers to help streamline operations and improve customer service LoJack® Fleet Management is an advanced fleet management system to help increase productivity, improve driver safety, and improve customer service LoJack® Connect for Equipment is a ruggedized telematics system to help track off-road equipment while improving business operations LoJack® Connect for Equipment TomTom®, the “Hands”® logo, among others, are Trademarks owned by TomTom N.V. or one of its subsidiaries.

10 Financial Review

11 Q3 Revenues ($ in millions) (unaudited) Q3 2015 Q3 2014 % change Consolidated revenues $ 32.6 $ 32.7 0% U.S. revenues 21.5 23.2 (7%) International licensees 7.9 5.6 41% Italy 1.9 1.4 34% Other 1.3 2.5 (48%)

12 Q3 Consolidated Results Highlights *Please refer to Appendix for reconciliation of non-GAAP items ($ in thousands, except per share data) (unaudited) Q3 2015 Q32014 Revenue $ 32,644 $ 32,673 Y/Y change (0.0%) Gross profit 17,767 10,086 Y/Y change 76.2% Gross profit margin 54.4% 30.9% Non-GAAP gross profit* 17,781 16,658 Non-GAAP gross profit margin* 54.5% 51.0% Operating expenses 15,053 18,409 Y/Y change (18%) EBITDA* 3,539 (7,657) Adjusted EBITDA* 3,980 88 Net income (loss) attributable to LoJack Corp. $ 1,481 $ (8,194) Net income (loss) per diluted share attributable to LoJack Corp. $ 0.08 $ (0.45)

13 Balance Sheet Highlights ($ in millions) Sept. 30, 2015 (unaudited) Dec. 31, 2014 Cash and cash equivalents $ 18.7 $ 17.6 Accounts receivable, net 22.1 24.0 Inventories 7.0 8.3 Total assets 73.7 76.3 Bank debt 7.0 10.0 Deferred revenue 16.7 17.1 Total liabilities 50.0 55.8 Stockholders’ equity 23.8 20.4 Working capital $ 21.9 $ 18.4

14 Quality Assurance Program Reserve (QAP) ($ in thousands) (unaudited) QAP Reserve Balance at December 31, 2014 $ 6,406 Additions $ 1,076 Payments/reductions $ (4,751) Foreign exchange impact $ (32) Balance at September 30, 2015 $ 2,699

15 Summary • Effective cost-reduction initiatives help drive strong year-over-year financial performance • SVR business provides significant margin and cash flow opportunity • Improved liquidity, positive cash flow and new telematics wins position the Company effectively

16 Appendix: GAAP to Non-GAAP Reconciliation Net income to EBITDA and Adjusted EBITDA (Unaudited, in thousands) Three Months Ended September 30, Nine Months Ended September 30, 2015 2014 2015 2014 Net income (loss), as reported $ 1,495 $ (8,174 ) $ 1,077 $ (17,148 ) Adjusted for: Interest expense 138 110 518 697 Provision (benefit) for income taxes 767 (358 ) 857 (179 ) Depreciation and amortization 1,139 765 3,444 2,807 EBITDA 3,539 (7,657 ) 5,896 (13,823 ) Stock compensation expense 417 410 1,138 1,293 Licensee agreement modification — — (2,000 ) — Brazil legal settlement — — (2,000 ) — Quality assurance program — 6,506 1,076 8,040 Restructuring costs 24 829 486 1,729 Adjusted EBITDA $ 3,980 $ 88 $ 4,596 $ (2,761 )

17 Appendix: GAAP to Non-GAAP Gross Profit and Gross Profit Margin Percentage Reconciliation (Unaudited, in thousands) Three Months Ended September 30, Nine Months Ended September 30, 2015 2014 2015 2014 $ % of Revenue $ % of Revenue $ % of Revenue $ % of Revenue Gross profit, as reported 17,767 54.4 % 10,086 30.9 % 50,207 52.8 % 42,171 43.4 % Adjusted for: Restructuring costs 14 — % 66 — 0.2 % 70 0.1 % 164 0.2 % Quality assurance program — — % 6,506 19.9 % 1,076 1.1 % 8,040 8.3 % Non-GAAP gross profit 17,781 54.5 % 16,658 51.0 % 51,353 54.0 % 50,375 51.8 %
