Attached files
| file | filename |
|---|---|
| 8-K - FORM 8-K - HYSTER-YALE MATERIALS HANDLING, INC. | d59492d8k.htm |
 Investor
Presentation November 6, 2015
Exhibit 99 |
 Presenters • Alfred M. Rankin, Jr. Chairman, President and Chief Executive Officer of Hyster-Yale Materials Handling
• Colin Wilson President and Chief Executive Officer of NACCO Materials Handling Group • Kenneth C. Schilling Senior Vice President and Chief Financial Officer 2 |
 Safe
Harbor Statement & Disclosure 3
This presentation includes forward-looking comments subject to important
risks and uncertainties. It may also contain financial measures that are
not in conformance with accounting principles generally accepted in the
United States of America (GAAP).
Refer to Hyster-Yale’s reports filed on Forms 8-K (current), 10-Q
(quarterly), and 10-K (annual) for information on factors that could
cause actual results to differ materially from information in this
presentation and for information reconciling financial measures to GAAP.
Past performance may not be representative of future
results. Guidance noted in the following slides was effective as of the
company’s most recent earnings release and conference call (October
28, 2015). Nothing in this presentation should be construed as
reaffirming or disaffirming such guidance. This presentation is not an
offer to sell or a solicitation of offers to buy any of
Hyster-Yale’s securities. |
 Hyster-Yale Snapshot
Hyster-Yale Materials Handling, Inc. (NYSE:HY)
Leading global designer, manufacturer and
marketer of lift trucks and provider of aftermarket
parts and support Headquartered in Cleveland, Ohio Separate lift truck and fuel cell power solutions segments Over 5,400 employees globally LTM 9/30/15 Revenue – $2.6 billion LTM 9/30/15 Net income – $83.9 million LTM 9/30/15 EBITDA (1) – $141.0 million 9/30/15 Net cash – $67.6 million LTM 9/30/15 ROTCE (1) of 22.0% (Net cash basis) _____________________ (1) EBITDA and ROTCE are non-GAAP measures and should not be considered in isolation or as a substitute for GAAP measures.
For discussion of non-GAAP items and the related
reconciliations to GAAP measures, see information in the Appendix starting on page 26. 4 |
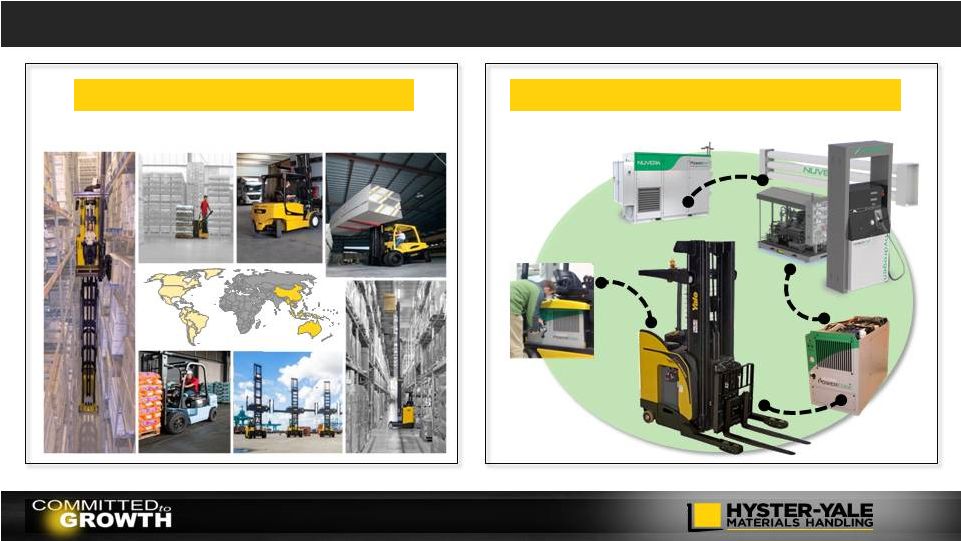 Our
Businesses Our Core Lift Truck Business
Organic growth through market share gain
5 Our New Hydrogen Power Business Rapid growth through development of technology |
 6 HYSTER-YALE HYSTER-YALE Leading position in growing industry benefiting from globalization and long- term worldwide economic recovery and development High potential for partnership and consolidation opportunities to enhance share gain initiatives Strong balance sheet, financial flexibility and attractive returns on capital employed Premier brands, comprehensive global product line and exclusive, global independent distribution network Strong economic engine driven by volume economies of scale Focused strategic initiatives to gain market share and enhance margins over next two years Focused investment in capital goods sector with share gain and growth opportunities - in developed countries from exposure to goods movement, distribution and warehousing, and in developing countries from exposure to industrialization A Solid Investment Option Debt free Cash Generation & Commitment to Shareholder Return Investment & Growth in Game Changing Technology Leading Products & Market Positions Strategies to Gain Share in Growth Segments & Markets Customer Focused & Solutions Oriented |
 2015 Third
Quarter Highlights •
Lift truck segment revenue decline driven by significant
unfavorable currency and a shift in mix to lower-priced trucks
partially offset by higher unit volumes and price increases
Decrease in lift truck operating results from:
- Unfavorable currency movements of $4.4 million and a shift in sales to lower-margin products + Price increases, material costs deflation & lower freight, as
well as lower operating expenses
• Nuvera spend was on target with original guidance given 2015 Third Quarter Highlights Short-term Outlook 2015 Third Quarter LTM 9/30/15 Consolidated Revenue $652.1 100.0% $2,643.8 100.0% Lift Truck Operating Profit 35.6 5.5% 131.2 5.0% Nuvera Operating Loss (6.6) (1.1)% (20.7) (0.8)% Consolidated Operating Profit 29.0 4.4% 110.5 4.2% Consolidated Net Income 20.9 3.2% 83.9 3.2% EBITDA $36.6 5.6% $141.0 5.3% ($ in millions) 7 • Global lift truck markets expected to be soft in Q4 2015, all markets expected to decline except Western Europe Substantially lower operating profit in Q4 2015 due to expected unit volume declines, unfavorable currency movements and higher IT costs, partially offset by price increases, lower incentive compensation and material cost deflation Lift truck net income expected to decline due to lower operating profit and higher effective income tax rate • Nuvera net loss expected to be $5.5 million - $7.0 million in Q4 2015 |
 Hyster-Yale Use of Cash Priorities
8 Return Cash to Stockholders Investments in Adjacent or Complementary Businesses Investments in Hydrogen Power Business Investments in Share Gain Programs Investments in Core Lift Truck Business To support strategic initiatives to accelerate growth or enhance margins Acquisitions of technologies that will accelerate the business Acquisitions of other forklift-related businesses 2013 2014 2015 Annual Dividends (1) $16.7m $1.00/share $17.8m $1.10/share $13.8m (Paid YTD) $1.14/share 2012 to 2014 Share Buyback $49.8m / 694,653 shares of Class A common stock Investments to commercialize Nuvera’s technology (1) Dollars represent total dividends paid during calendar year, while dividend per share represents the annualized dividend
rate after each May increase in 2014 and 2015 |
 Lift Truck
Industry Overview (units in thousands)
Global Lift Truck Industry Size
_____________________
Trend line represents 4.5% CAGR from 2006-2008 Average Industry Size.
Source: WITS. Represents order intake. Global Lift Truck
Industry Breakdown (Units)
_____________________
Source: WITS. LTM 9/30/15 Orders Reports.
Long-term
CAGR (2004 – 2014) = 4.5% Global Lift Truck Industry Size _____________________ Source: WITS. LTM 9/30/15 and LTM 9/30/14 order intake. 9 Lift Truck Industry – Unit Distribution by Class _____________________ Source: WITS. LTM 9/30/15 Orders Reports. ICE = Internal Combustion Engine Total Industry = 1,102k Units Class 4 ICE 5% Market Size - $ _____________________ Source: Internal Company estimates Market Size - Size Estimated Industry Revenue Mix Class 5 ICE 56% Class 1 Electric 19% Class 2 Electric 12% Class 3 Electric 8% Europe 32% China 22% Americas 25% Japan 8% Asia-Pacific 8% Middle East & Africa 5% 951 872 547 794 975 944 1,010 1,088 1,102 0 300 600 900 1,200 2007 2008 2009 2010 2011 2012 2013 2014 LTM Q3 15 Class 1 Electric 17% 10% Class 2 Electric Class 3 Electric 31% Class 4 ICE 3% Class 5 ICE 39% Change over Prior Year Total Americas Brazil EMEA JAPIC +3% +13% -34% +5% -3% |
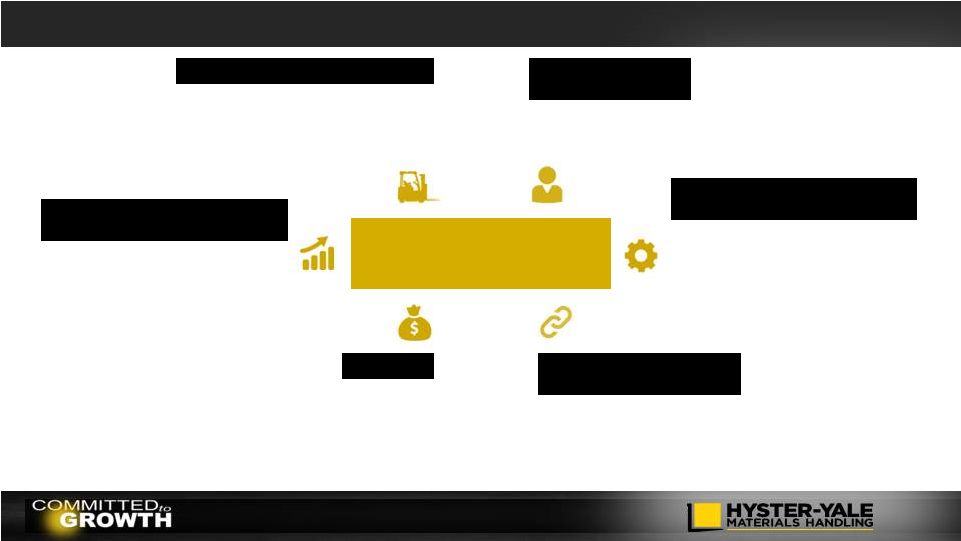
 Hyster-Yale’s Economic Engine
10 Hyster-Yale’s economic engine is driven by increasing unit volume as our “hedgehog” approach gets
embedded in all our activities and our flywheels increase momentum…
A large lift truck population base drives parts and service volume
resulting in enhanced profitability for dealers and Hyster-Yale
Design Component Commonality Supply Chain Manufacturing Quality Marketing Parts Infrastructure Capital Requirements Geographic and Product Balance Worldwide Distribution Strength to Drive Market Share Parts and Service Volume Large Lift Truck Population in Service Volume Economies of Scale |
 Lift
Truck Business Target Economics Goal and Gap to Target 7% Goal
Achieve minimum operating profit margin of 7% at the peak of the current market cycle and 7% at mid-cycle of the next market cycle Target Economics gap closure can be achieved by… Increased margin on ICE trucks Segmentation Low Cost of Ownership Unit volume Stronger Industry + Share Growth = Volume Leverage LTM 9/30/15 Gap to Target Economics Actual Lift Truck Operating Profit Margin 5.0% Margin Variances (0.5%) Unit margin 0.0% Parts/other (0.5%) Volume Variances 2.5% Manufacturing variances/other 1.5% Operating Expenses 1.0% Lift Truck Operating Profit % Gap 2.0% 11 |
 Leverage
Gained from Moving Volume to Full Manufacturing Capacity 12
25,000 units of additional volume $500 million of additional revenue & $65-$70 million of operating profit At Full Capacity: 115,000 units / year $30 million fixed cost absorption by moving from current capacity utilization to full utilization of our manufacturing capacity $35-$40 million by meeting target economics in standard margin net of increased SG&A spread over more units 0% 50% 100% LTM Q3 2015 2017-2018 Unused Capacity Unit Volume 23% |
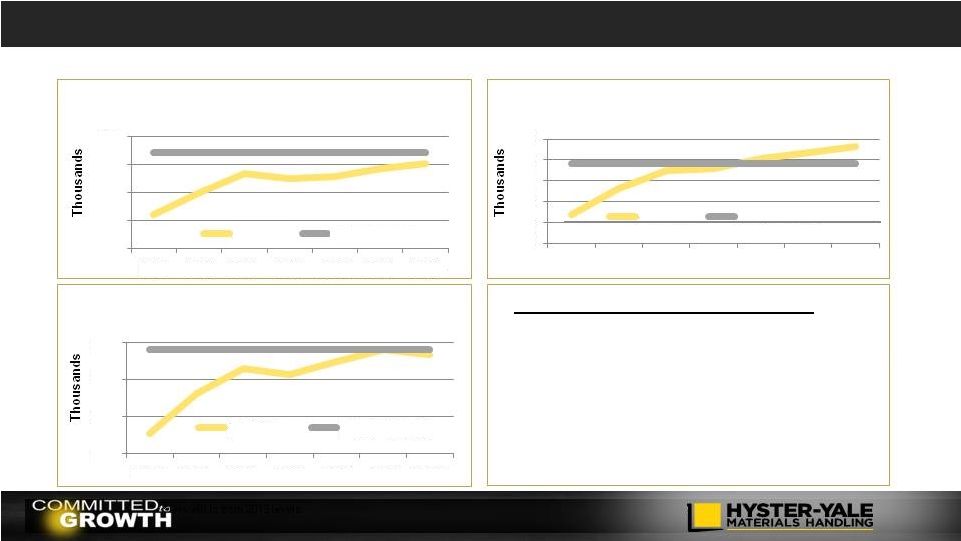 Over the
Remainder of this Market Cycle, Target Volumes Driven by… Share growth
of approx. 1.3% pts > Strategic initiatives
> Share growth is expected to be
approximately 80% of volume
increase required Growth of 15-20% by 2018-2019** Growth of 0-5% by 2016-2017** Growth of 5-10% by 2017-2018** * Growth is from 2013 levels. 13 *First 9 months of 2015 Annualized **Growth is from 2014 levels 100 200 300 400 500 2009 2010 2011 2012 2013 2014 2015* EMEA Industry Actual Prior Peak 50 100 150 200 250 300 2009 2010 2011 2012 2013 2014 2015* Americas Industry Actual Prior Peak 150 250 350 450 2009 2010 2011 2012 2013 2014 2015* Asia Industry Actual Prior Peak |
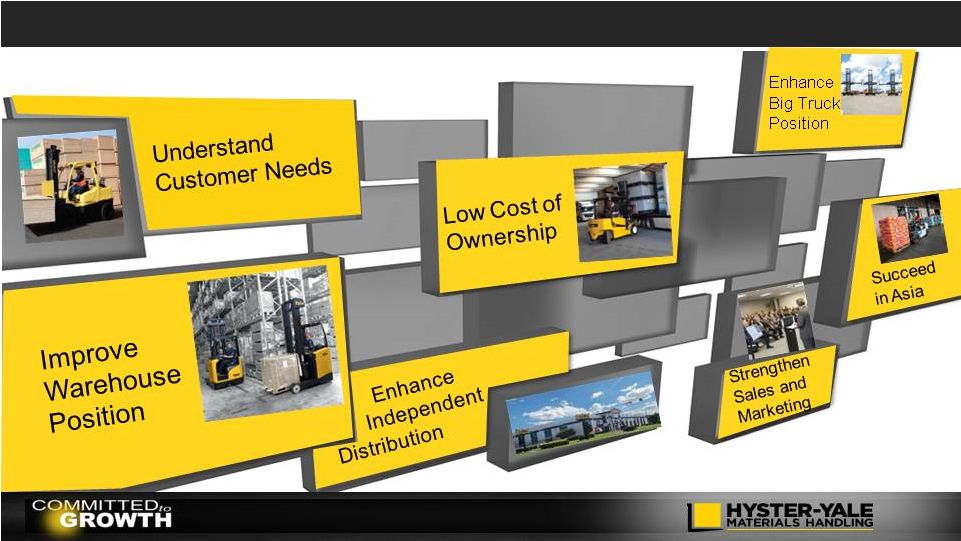 Our Core
Lift Truck Strategic Initiatives 14 |
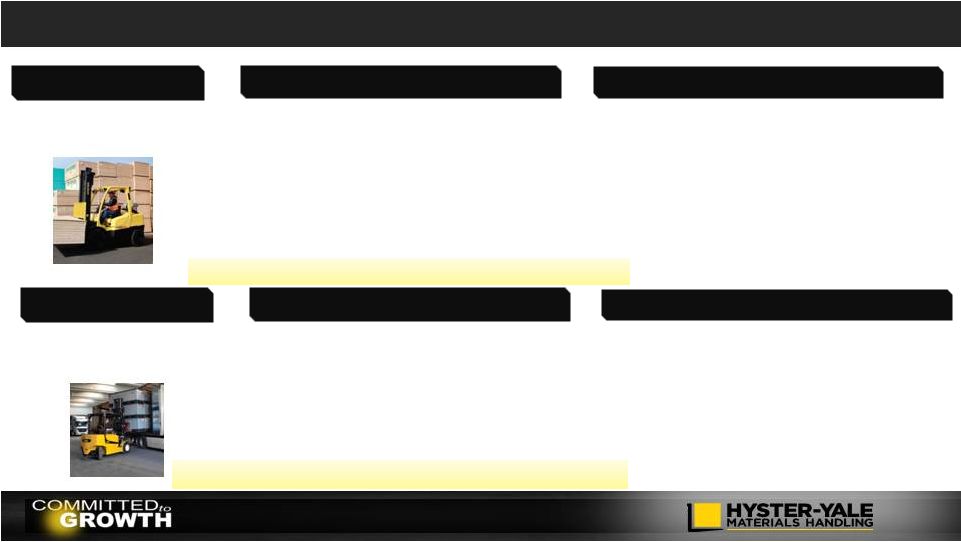 Core Lift
Truck Strategic Initiatives Update 15
Strategic Objective Implementation Highlights • Provide the right product and solution to meet the specific needs of different customers across multiple industries • Increasing penetration of the Metals and Paper segments • Gained conquest business at two large trucking accounts • Introduced efficient battery extraction solutions for electric truck applications Initiative Understand Customer Needs Strategic Objective Implementation Highlights • Deliver lowest cost of ownership for all of our customers based on their specific application Initiative Low Cost of Ownership • Increasing penetration of factory- fitted telematics • Introduced new fleet management system to manage costs more effectively • Launched fuel efficient engines with longer service intervals Outcome: Win in Targeted Major Accounts and Applications Outcome: Competitive Advantage across Product Segments |
 Core Lift
Truck Strategic Initiatives Update 16
Strategic Objective Implementation Highlights • Develop the strongest independent, exclusive dealer network Initiative Enhance Independent Distribution Strategic Objective Implementation Highlights • Strengthen penetration of the growing warehouse segment Initiative Improve Warehouse Position • Completed a major restructuring of network in North America that included a competitive conversion • Growth of our dual brand coverage in North America • 6 new dealers appointed in EMEA since the beginning of 2015 • Resources: Adding industry-focused direct
salespeople and solutions and application
center expertise • Capability: New products, enhanced selling tools and trained dealers • Rollout: Portfolio of initiatives, targeted accounts and leverage global knowledge • Results: Winning business in 5 out
of the top 10 US Retailers’ Distribution
Centers
Outcome: Best Distribution Channels in the Industry
Outcome: Be a Top Tier Global Competitor in Warehouse
|
 Core Lift
Truck Strategic Initiatives Update 17
Strategic Objective Implementation Highlights Initiative Succeed in Asia Strategic Objective Implementation Highlights Initiative Enhance Big Truck Market Position • 5 new dealers appointed in 2015 • Direct sales support on large accounts is resulting in sales to conquest accounts • Additional Big Truck sales by leveraging global metals industry expertise • Launched additional UTILEV products • Large accounts identified, assigned and actively being pursued/increased direct sales support • Conquest accounts won • Enhanced dealer support capability • Expand market penetration throughout Asia • Increase leading market position in Big Trucks / Become vendor of choice in Big Truck segment Outcome: Increase Share and Strengthen Distribution at Accelerated Pace Outcome: Enhance leading market position in Big Trucks |
 Core Lift
Truck Strategic Initiatives Update 18
Strategic Objective Implementation Highlights Initiative Strengthen Sales and Marketing Organization • Recruited experienced individuals with deep knowledge of the lift truck business • Added expertise in dealer management, account identification and coverage, financial merchandising and solutions development • Added expertise to focus on implementing standard sales processes in our independent dealers • Expanded investment in National Account sales and support - winning conquest accounts • Increased global collaboration to maximize efficiencies and effectiveness • Strengthen and align sales and marketing organization in all geographic regions Outcome: Gain momentum leading to higher unit volumes and enhanced market share |
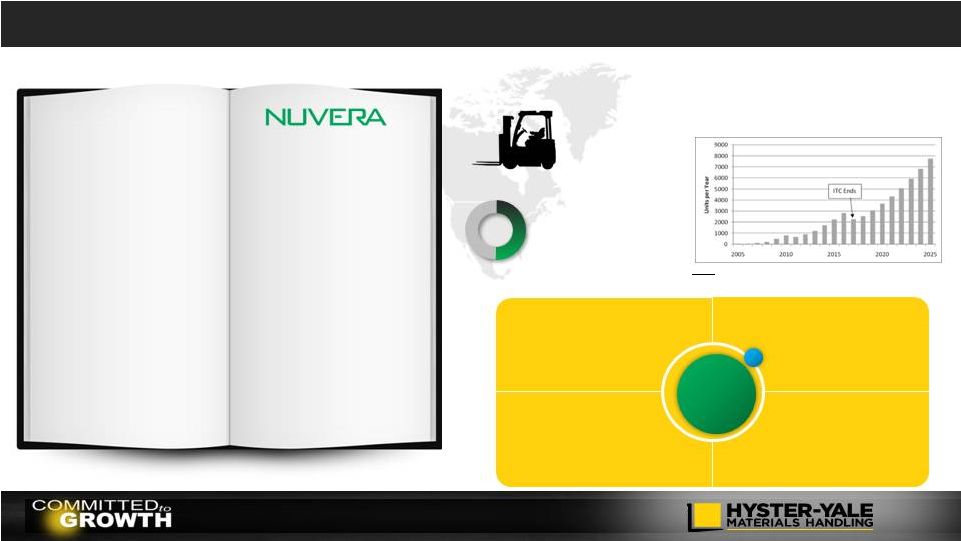 The Nuvera Story Our Hydrogen Power Business 19 • Purchased for a small investment amount • Investing pre-tax expense dollars to break-even • Solutions across Hydrogen Value Chain • Strong IP / Patent portfolio • Pipeline of new technologies and solutions • Rapid usage development in major user fleets 25-50% • Only one main competitor in lift truck space • Increasing use and interest from large users • Developing turnkey option for lift truck customers • Integrated lift truck engines will provide increased value • Provides strong base for entry into other industries • Core power source of lift trucks in the future Short Term Target N. America Lift Truck Market electric trucks sold per year 140,000+ Estimated up to can benefit from Fuel Cell solutions Why Hydrogen Source: David Greene et. al., Status and Outlook for the U.S.
Non-Automotive Fuel Cell Industry: Impacts of Government Policies and Assessment of Future Opportunities, Oak Ridge National Laboratory, May 2011 (ORNL/TM-2011/101). Fuel Cell Power penetration projected to triple by 2025 Lift Truck fleets already largely electrified in developed markets Growing industrial demand for high performance, zero emission solutions Electric Lift Trucks offer many advantages: maintenance, operations, emissions Fuel Cells can solve limitations: productivity, scalability, performance, costs |
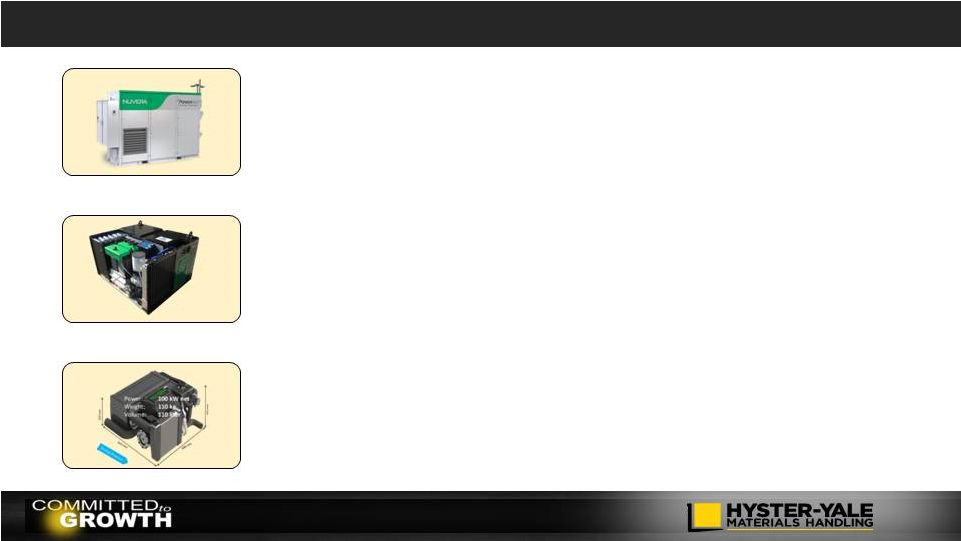 Nuvera
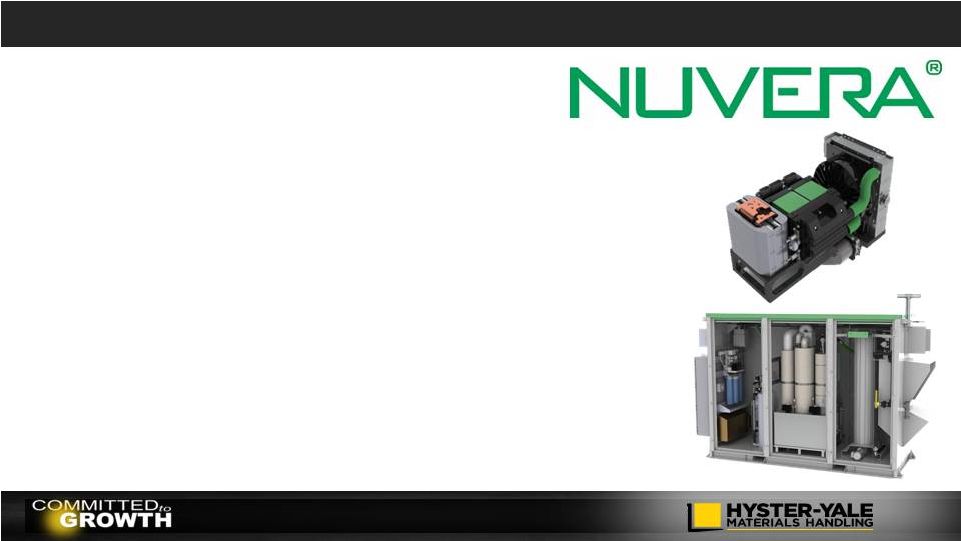
Products 20
PowerTap ® ~ Hydrogen Generator • Low fixed costs ideal for small to medium size lift truck fleets • Scalable to meet growth in customer demand • On site generation reduces supply chain risk PowerEdge ® ~ Battery Replacements • Seamless integration into most Electric Lift Truck designs • Stack power output size 50% higher than our leading competitor • Industrial design and testing demanding lift truck standards Orion ® ~ Fuel Cell Engine • Current Generation: High efficiency and durability ideally suited to lift truck
customer demands • Next Generation: Leap in power density and efficiency opens opportunities
in non-lift truck applications |
 The
Nuvera Plan Develop PowerEdge
® units for full range of electric lift trucks Build selling capacity First orders for PowerEdge ® units expected Q4 2015 Mean time between failure (MTBF) improvements to PowerTap ® PT 50 Hercules ® and Orion ® 2 technology development Hyster-Yale dealer engagement “Try-to-buy” PowerEdge ® program Turnkey Total Power Solution Build customer based industry and application solutions Hercules ® and Orion ® 2 product development Cost reduction engineering to meet target costs PowerTap ® PT 250 development Phase 1 2015 - 2016 Phase 1 2015 - 2016 Phase 3 2017 – 2018 Phase 3 2017 – 2018 Phase 2 2016 – 2017 Phase 2 2016 – 2017 700 PowerEdge ® and 10 PowerTap ® units per quarter at target margins achieves break- even operating profit performance Develop incremental partner opportunities in other industries Launch Hercules and Orion ® 2 Integrated fuel cell engines for full range of Hyster-Yale products Capture full aftermarket potential PowerTap ® PT 250 launch 21 |
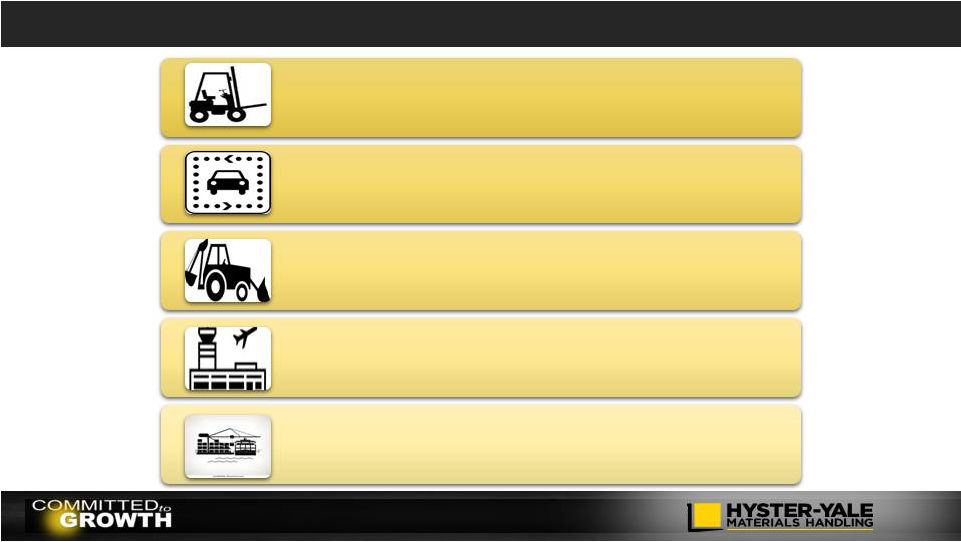 Nuvera – Numerous Market Opportunities 22 Across the Lift Truck Line • Class 1,2 & 3 solutions in 2015-2016 • Integrated engines for Big Truck and Class 4 & 5 in 2017-2019 Automotive • Growing market demand and OEM investment • Orion ® 2 next generation power density is strong differentiator Construction Equipment • Environmental pressures driving search for non-emission solutions • Strong synergies with lift truck design requirements Aerospace • Demand for emission reductions in many airports • Ground power supply & support vehicles, on-board power supply Seaports • Emission free container handling • Ground support / drayage equipment, on-board auxiliary power |
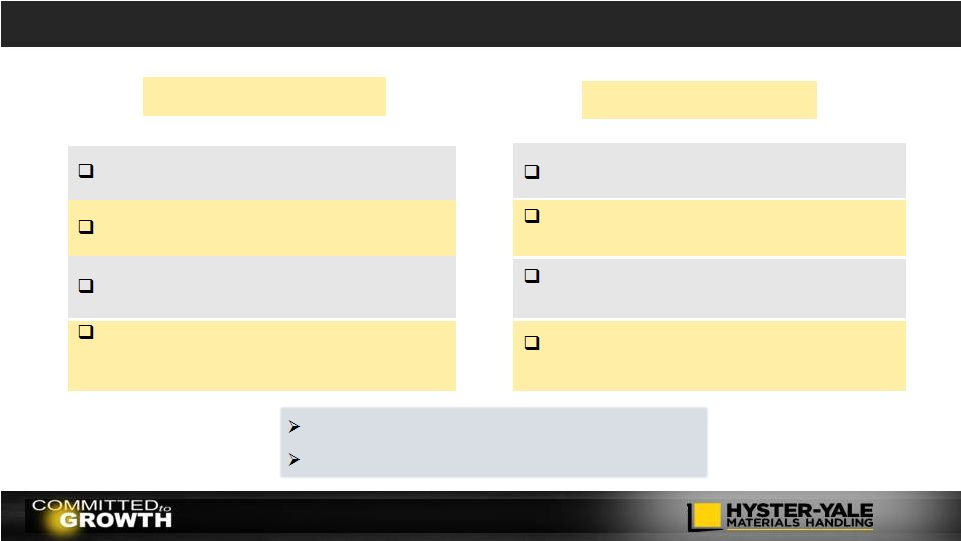
 Low cost
solution in heavy duty applications Low cost solution in heavy duty
applications Increasing customer demand for battery
alternative Increasing customer demand for battery
alternative Market
gaining momentum – Improve productivity Market gaining momentum – Improve productivity Incremental sales and service opportunities Incremental sales and service opportunities Zero emissions alternative to ICE Zero emissions alternative to ICE Growing demand for low emissions – Australia, Japan, China Growing demand for low emissions – Australia, Japan, China Nuvera – Supporting Lift Truck Strategic Initiatives Low Cost of Ownership Low Cost of Ownership Understanding Customer Needs Understanding Customer Needs Improving Warehouse Position Improving Warehouse Position Strong Independent Distribution Strong Independent Distribution Big Truck Position Big Truck Position Succeed in Asia Succeed in Asia 23 |
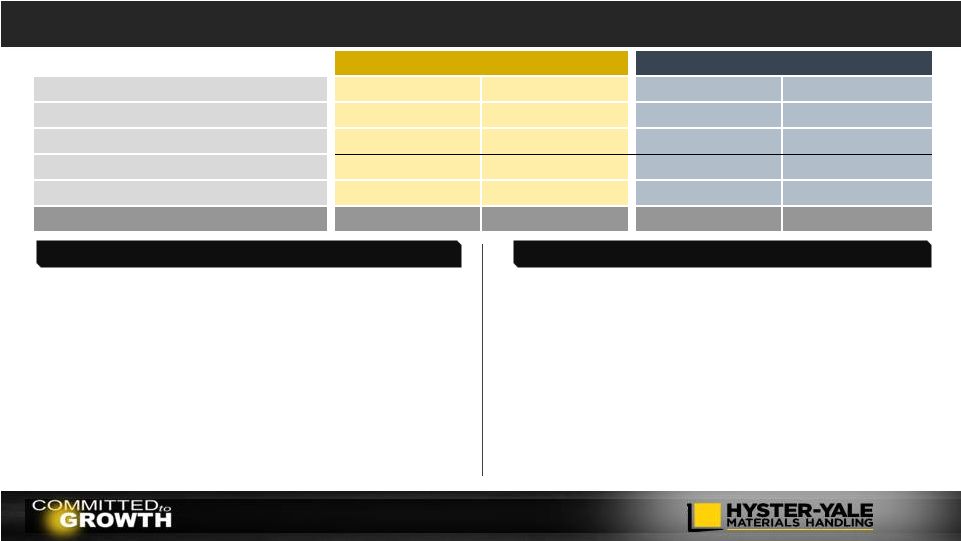
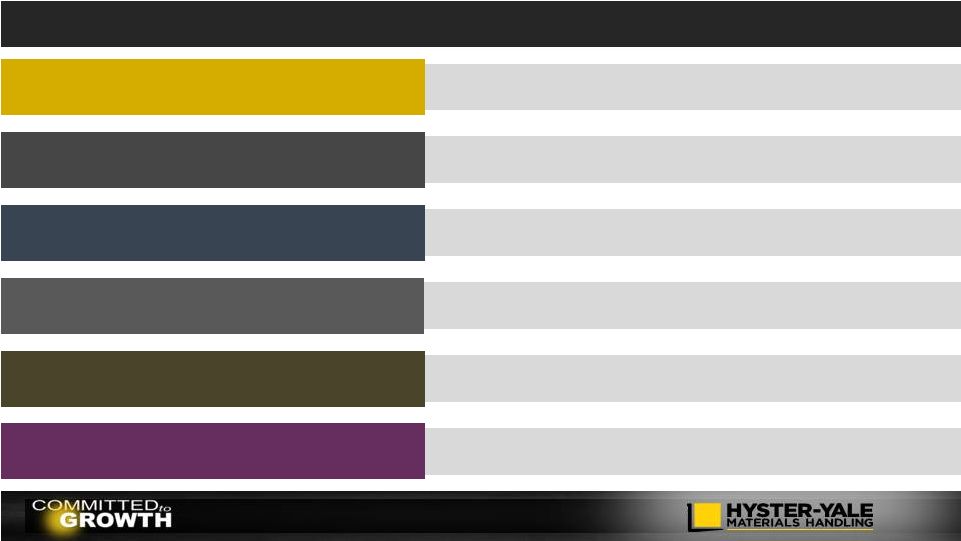
 24 Valuation Approach By Business Lift Truck Business Lift Truck Business Fuel Cell Business Fuel Cell Business Board Oversight as Separate Businesses Incentives Tied to Individual Businesses Strong Operating Cash Generation Strong Operating Cash Generation Market Leading Products and Position Market Leading Products and Position Mature Cyclical Industry Mature Cyclical Industry Value using Traditional Valuation Model of EBITDA Multiple on a Net Debt Basis Value using Traditional Valuation Model of EBITDA Multiple on a Net Debt Basis Developing / Technology Industry Developing / Technology Industry Distinct Technology / Patents in Fuel Cell and Hydrogen Generation Distinct Technology / Patents in Fuel Cell and Hydrogen Generation Operating Cash Invested in New Product Commercialization / Ramp Up Operating Cash Invested in New Product Commercialization / Ramp Up Value as Venture Business with Developed Technology Value as Venture Business with Developed Technology |
 Rationale
for Investing in Hyster-Yale •
Core business is a value business, generating strong cash returns over
the cycle. Strong brands and solid customer base.
– Opportunity for volume growth through industry share gains. – Strong, stable management with proven success record. • Nuvera offers significant growth potential as an alternative power source with patented design features. Strong customer value proposition in high-growth market segment. 25 |
 Appendix 26 |
 Non-GAAP Disclosure
27 Adjusted Lift Truck Business Operating Profit, EBITDA and return on total capital employed are not measurements under U.S. GAAP, should not be considered in isolation or as a substitute for GAAP measures, and are not necessarily comparable with similarly titled measures of other companies. Hyster-Yale defines each as the following: Adjusted Lift Truck Business Operating Profit is defined as Lift Truck Operating Profit, as reported, adjusted for the pre-tax effect of the $17.7 million gain on sale from the Brazil land and facility; EBITDA is defined as income before income taxes and noncontrolling interest income (loss) plus net interest expense and depreciation and amortization expense; Return on total capital employed (“ROTCE”) is defined as net income before interest expense, after tax, divided by average capital employed. Average capital employed is defined as average stockholders’ equity plus average debt less average cash. For reconciliations from GAAP measurements to non-GAAP measurements, see the following pages. |
 Non-GAAP Reconciliation
Year Ended December 31 Qtr. Trailing 12 Months 2010 2011 2012 2013 2014 9/30/15 9/30/15 Reconciliation of EBITDA Net income attributable to stockholders $32.4 $82.6 $98.0 $110.0 $109.8 $20.9 $83.9 Noncontrolling interest income (loss) (0.1) – 0.1 0.2 0.4 0.1 0.5 Income taxes provision 1.8 18.9 7.0 17.2 39.9 7.4 24.0 Interest expense 16.6 15.8 12.4 9.0 3.9 1.3 4.2 Interest income (2.3) (1.8) (1.5) (1.8) (1.1) (0.3) (1.0) Depreciation and amortization expense 33.9 31.3 28.0 30.2 29.7 7.2 29.4 EBITDA $82.3 $146.8 $144.0 $164.8 $182.6 $36.6 $141.0 ($ in millions) 28 Note: EBITDA in this investor presentation is provided solely as a supplemental disclosure with respect to operating results.
EBITDA does not represent net income, as defined by U.S. GAAP and should not be considered as a substitute for net income or net loss, or as an indicator of operating performance. The Company defines EBITDA as income before income taxes and noncontrolling interest income (loss) plus net interest
expense and depreciation and amortization expense. EBITDA is not a measurement under U.S. GAAP and is not necessarily comparable with similarly titled measures of other companies.
|
 Non-GAAP Reconciliation (continued)
($ in millions) Reconciliation of Return on Total Capital Employed (ROTCE) 9/30/15 LTM LTM Average Stockholders' Equity (9/30/15, 6/30/15, 3/31/15, 12/31/14, and 9/30/14)
$451.8
LTM Average Debt (9/30/15, 6/30/15, 3/31/15, 12/31/14, and
9/30/14) 41.1
LTM Average Cash (9/30/15, 6/30/15, 3/31/15, 12/31/14, and
9/30/14) (102.9)
LTM average capital employed
$390.0
LTM Net income $83.9 Plus: LTM Interest expense, net 3.2 Less: Income taxes on interest expense, net at 38% (1.2) Actual return on capital employed = actual net income before interest expense, net, after tax
$85.9 Actual return on capital employed percentage 22.0% _____________________ Note: Return on capital employed is provided solely as a supplemental disclosure with respect to income generation because
management believes it provides useful information with respect to earnings in a form that is comparable to the Company’s cost of capital employed, which includes both equity and debt securities, net of cash. 29 |
 Cash
Flow before Financing Calculation ($ in
millions) Year Ended December 31
Trailing 12
Months
2010 2011 2012 2013 2014 9/30/15 Reconciliation of Cash Flow before Financing Net cash provided by operations $47.5 $54.6 $128.7 $152.9 $100.0 $90.1 Net cash used for investing activities (8.5) (15.9) (19.5) (26.1) (44.4) (37.2) Cash Flow before Financing $39.0 $38.7 $109.2 $126.8 $55.6 $52.9 30 |
 Supplemental Information |
 The
History of Hyster-Yale and its brands Hyster founded in Portland,
Oregon as the Willamette Ersted Company 1929
1944 Company name officially changed to Hyster Company 1875 Yale Lock Mfg. broadens its scope into materials handling 1963 Yale forklift truck business merges with Eaton Mfg. Industrial Truck Division 1971 Yale forges a partnership with Sumitomo Ltd 1989 1989 Hyster and Yale merge to form NACCO Materials Handling Group (NMHG) 32 2012 2012 1985 Yale acquired by NACCO Industries 1989 Hyster acquired by NACCO Industries Hyster-Yale formed as independent public company following spin-off by NACCO
2011 2011 NMHG introduces the UTILEV lift truck for the utility segment of the market 2014 2014 NMHG, HY’s operating company, acquires Nuvera to enter the fast-growing hydrogen fuel
cell market |
 Hyster-Yale Global Footprint
33 |
 Our
Business Has Been Transformed Comprehensive, updated product
line Average product age since last
upgrade – less than 4 years Designed to meet customer needs and provide low overall cost of ownership Multiple power solutions to meet performance, cost, and environmental needs Product Range Product Range Manufacturing Manufacturing Globally integrated, lean operations with economies of scale Assembled in market of sale Continuous efficiency improvements DFT implementation globally 34 |
 Our
Business Has Been Transformed Centralized supply chain
management Highly flexible low cost supply chain 30%+ low cost country sourcing Concentrated supplier base Intense focus on supplier quality Supply Chain Supply Chain Aftermarket Aftermarket Quality Quality Customer driven programs North America’s warranty rates reduced significantly over the last five years Model Year upgrades High first time fill % Comprehensive all makes parts program Strong Fleet management program Telematics solutions across product line 35 |
 The Basic
Philosophies That Guide Our Actions Global supplier of lift
trucks and related services Understand and address the needs of customers Brands focused on unique segments of the market Market share growth Market through exclusive, independent, certified distribution Sell direct to large customers Capture full aftermarket potential Customer Customer Internal Internal Distribution Distribution Full line product supplier to meet the needs of major customer segments Modular/scalable components to create the right product at right cost Supply chain organization to deliver high quality / low cost components Assemble in market of sale to meet customer needs quickly Product quality to deliver the best uptime in the industry An environment that motivates and retains high-quality employees 36 |
 Our
Long-Term Philosophy Long-term
growth Long-term shareholders Shareholder protection Senior management incentivized as long-term shareholders Increase shareholder value Return on Capital Employed and Market Share Increase focus 37 |
 Our
Competitive Advantages 38
• Able to meet customers needs globally • Global economies of scale • New investment in alternative energy solutions • Young/ fresh product line • Source of aftermarket profitability • Barrier to entry Global Full Product Line Field Population Dealer Relationships • Independent distribution model • Exclusive distribution • Combine OEM excellence with entrepreneurial distribution focused on customer • Long relationships • Able to meet most needs • National Account programs Customer Relationships • High performance metrics • Large fleet program Aftermarket Support Employee Relationships • Engaged workforce • Experienced leadership • Equal treatment • High return for our stockholders • Low capital employed structure • Partnership relationships to limit capital needs Focus on Return on Capital |
 Historical Consolidated Revenue
$1,780 $2,057 $2,400 $2,489 $2,720 $2,824 $1,475 $1,802 $2,541 $2,469 $2,666 $2,767 $2,644 $0 $1,000 $2,000 $3,000 2003 2004 2005 2006 2007 2008 2009 2010 2011 2012 2013 2014 2015 LTM (1) _____________________ (1) As of September 30, 2015. ($ in millions) 39 |
 Hyster-Yale Is a True Full Line Supplier
Electric Counterbalanced Rider Trucks Electric Narrow Aisle Trucks Electric Hand Trucks Internal Combustion Engine (cushion tire) Internal Combustion Engine (pneumatic tire) Electric CB 3 wheel Electric 4 wheel Electric Pallet Trucks Stackers Very Narrow Aisle Trucks Order Pickers Reach Trucks Internal Combustion Engine ICE CB Laden Container Handlers Big Trucks Empty Container Handlers Reach Stackers CLASS 1 CLASS 2 CLASS 3 CLASS 4 CLASS 5 1.0T to 5.5T 1.5T to 6.0T 1.5T to 8.0T 1.0T to 7.0T 1.0T to 52.0T Warehouse Equipment 40 Forklifts |
 Lift
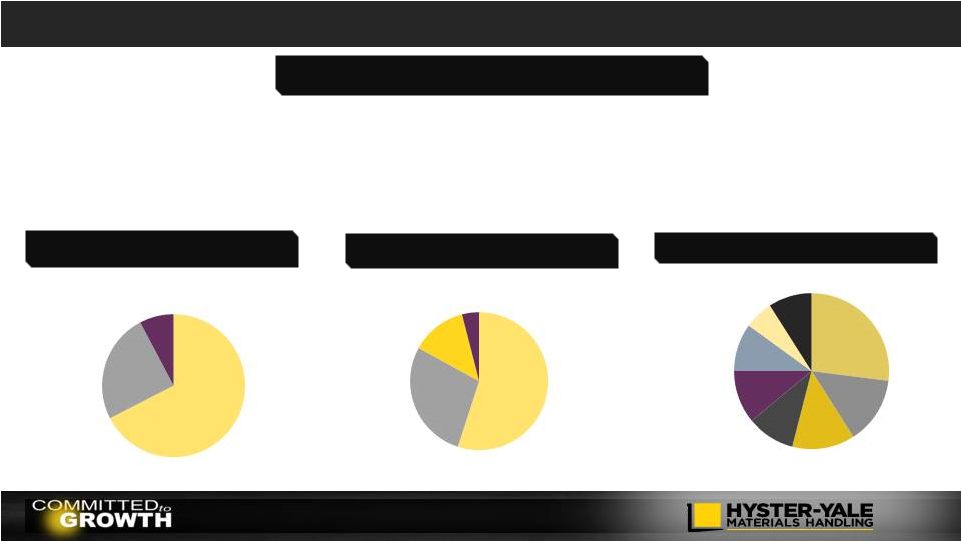
Truck Overview and Sources of Revenue 2014 Worldwide Sales by
Product 2014 Sales by Geography
2014 Retail Shipments by End Market (1) _____________________ (1) Represents Hyster-Yale North American unit shipments by industry. (2) Includes Big Truck sales that represent 11.3% of total sales. 41 • Leading global lift truck manufacturer in terms of units sold – #3 globally in 2014 – Large installed base that drives parts sales – Over 825,000 units worldwide – Sales of 87,600 units in 2014 – Sales of >4,500 units at SN JV in Japan & Asia in 2014 Key Highlights • Diverse customer and application base • Global independent dealer network • Comprehensive, updated global product line • Globally integrated operations with economies of scale • Experienced management team Manufacturing 27% Wholesale Distribution 14% Food & Beverage 13% Rental 10% Home Centers/ Retail 11% Freight & Logistics 10% Paper 6% Other 9% Americas 67% Europe, Africa & Middle East 25% Asia-Pacific 8% (2) Internal Combustion Engine Units 55% Electric Units 28% Parts 13% Other 4% |
 Key
Relationships…Our Customers The Customer
Direct to customer sales to
major accounts Account Identification Teams Solutions Groups Special Application teams Global Account teams Investment in global CRM system Blue Chip Customer Base 42 Understanding Customer Needs |
 Key
Relationships…Our Dealers The Dealer
Independent Exclusive Entrepreneurial Committed partner Dual-line or single Over 1,000 global dealer locations Enhancing performance Dealer Excellence programs Dealer incentives Term-based contracts Strengthening the distribution footprint Sales and Service territories (SSTs) Competitor conversions In-territory acquisitions More than 2,000 application
consultants
Over 11,000
service technicians
43 Strong Independent Distribution |
 44 Key Relationships…Our Financing Partners |
 Positive
Environment to Gain Share and Margin Performance Over Next Two Years
45 • Product gaps filled to position Hyster-Yale in most application segments and
improve margins • Second-tier competitors in the ICE segment more vulnerable due to their weak economies of scale position • Key warehouse segment competitors are regional • Key Big Truck segment competitors are niche Over the longer-term, as core strategic initiatives are executed and mature, share gains are expected to occur
|
 Lift
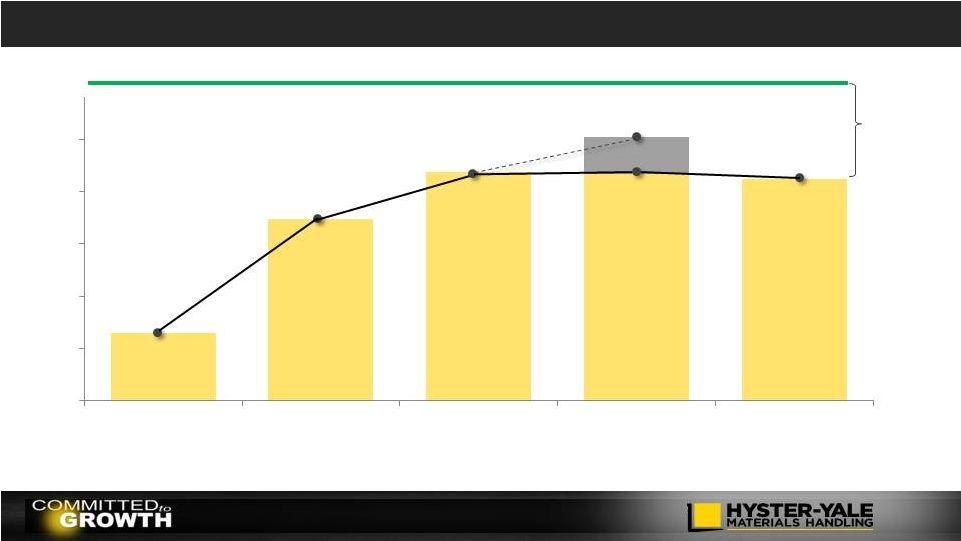
Truck Business Operating Profit Trends and % of Sales Prior Cycle Market
Peak Mid-Cycle Market
_____________________ (1) Lift Truck Segment Operating Profit, as reported (2) Adjusted Lift Truck Segment Operating Profit, which excludes a $17.7 million pre-tax gain on the sale of the Brazil land and
facility, is a non-GAAP measure and should not be considered in isolation or as a substitute for the GAAP measure. Management believes that this measure assists the investor in understanding the results of operations. For discussion
of non-GAAP items and the related reconciliations to GAAP measures, see information in the Appendix starting on page 26. 46 7% TARGET 2.1% 4.5% 4.8% 5.0% 5.5% ($ in millions) 2.0% Gap Closure 5.0% $57.3 $111.7 $134.3 $133.3 (2) $131.2 $151.0 (1) $25 $50 $75 $100 $125 $150 2007 2012 2013 2014 LTM Q3 2015 |
 Core
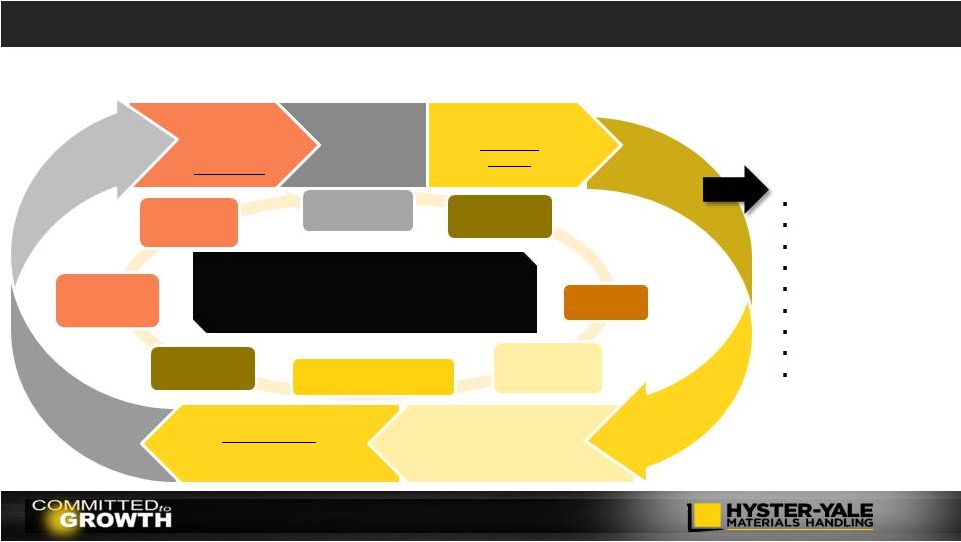
Strategic Initiatives Basic Business Areas
Design Component Commonality Supply Chain Manufacturing Quality Marketing Parts Infrastructure Capital Requirements Core strategic initiatives were designed to drive the economic engine by increasing share…
47 Worldwide Distribution Strength to Drive Market Share Geographic and Product Balance Volume Economies of Scale Succeed in Asia Low Cost of Ownership Enhance Independent Distribution Improve Warehouse Position Understand Customer Needs Our strategies are designed to drive increased share, which in turn increases the lift truck population, which drives parts and service volumes. Commercialize Nuvera’s Technology Strengthen the Sales and Marketing Organization Enhance Big Truck Market Position Parts and Service Volume Large Lift Truck Population in Service |
 Core Lift
Truck Strategic Initiatives 48
Strategic Objective Key Elements • Provide the right product and solution to meet the specific needs of different customers across multiple industries • Segmentation of products and industries • Development of Utility, Standard and Premium products • Range of options to match needs of different industries • Targeted sales and marketing effort Initiative Understand Customer Needs Strategic Objective Key Elements • Deliver lowest cost of ownership for all of our customers based on their specific application • Understand major cost drivers: • Direct (truck price, fuel, service, operator, uptime) • Indirect (safety, litigation, pollution) • Implement right solutions for lower costs Initiative Low Cost of Ownership Outcome: Win in Targeted Major Accounts and Applications Outcome: Competitive Advantage across Product Segments |
 Core Lift
Truck Strategic Initiatives 49
Strategic Objective Key Elements Initiative Strategic Objective Key Elements Initiative Outcome: Best Distribution Channels in the Industry Outcome: Be a Top Tier Global Competitor in Warehouse • Develop the strongest independent, exclusive dealer network Enhance Independent Distribution • Develop all dealers • Appoint / convert successful dealers • Expand number of dual line dealers • Enhance dealer value proposition • Combine dealer entrepreneurship with OEM support • Strengthen penetration of the growing warehouse segment Improve Warehouse Position • Enhance product ranges • Develop stronger direct sales capabilities • Develop dealer resources and specialization • Enhance marketing services and support |
 Core Lift
Truck Strategic Initiatives 50
Strategic Objective Key Elements Initiative Strategic Objective Key Elements Initiative Outcome: Increase Share and Strengthen Distribution at Accelerated Pace Outcome: Enhance leading market position in Big Trucks Succeed in Asia Enhance Big Truck Market Position • Expand market penetration throughout Asia • Increase leading market position in Big Trucks / Become vendor of choice in Big Truck segment • Organic growth through development of dealer network and direct selling capabilities • Development of long term strategic partnerships • Development of right products • Development of support
infrastructure • New products • Business unit concept in each region • Global team coordination • Focus on industry and solutions • Success with large port operators • Comprehensive Tier 4 offering |
 Core Lift
Truck Strategic Initiatives 51
Strategic Objective Key Elements Initiative Outcome: Gain momentum leading to higher unit volumes and enhanced market share Strengthen Sales and Marketing Organization • Strengthen and align sales and marketing organization in all geographic regions • Greater accountability for results through smaller sales management areas • Leaders provided with new tools and enhanced reporting capabilities • Solutions Groups to develop product specific expertise for customer clusters • Major focus on account identification and coverage • Implementing new sales approach with appropriate tools to enhance solutions selling skills |
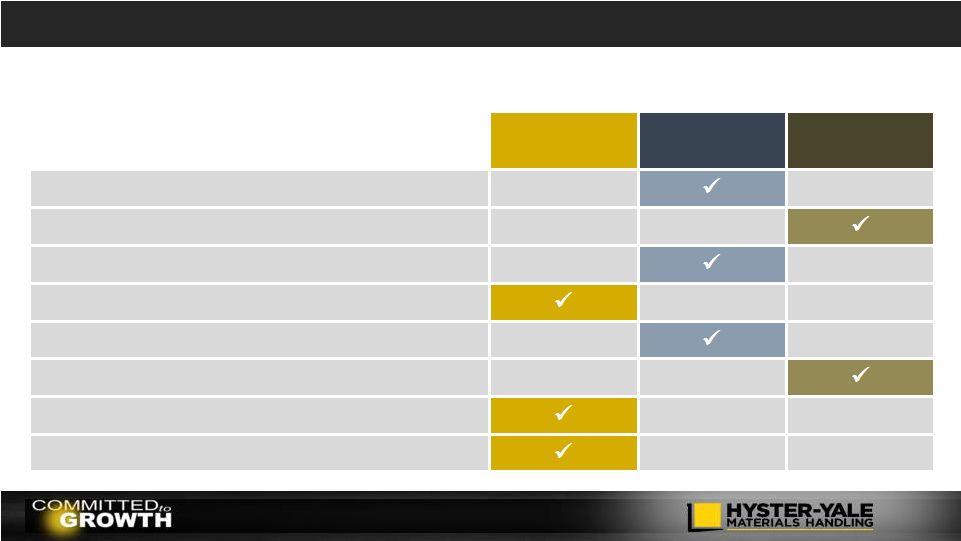 Early
Stage Mid Stage
Achieved Breakthrough Understand Customer Needs Low Cost of Ownership Enhance Independent Distribution Improve Warehouse Position Succeed in Asia Enhance Big Truck Market Position Strengthen Sales and Marketing Organization Commercialize Nuvera’s Fuel Cell Technology Our core strategic initiative flywheels are in various stages of momentum. Share gain
is expected to take place as they gain
momentum… Core Strategic Initiatives – Stages of Momentum 52 |
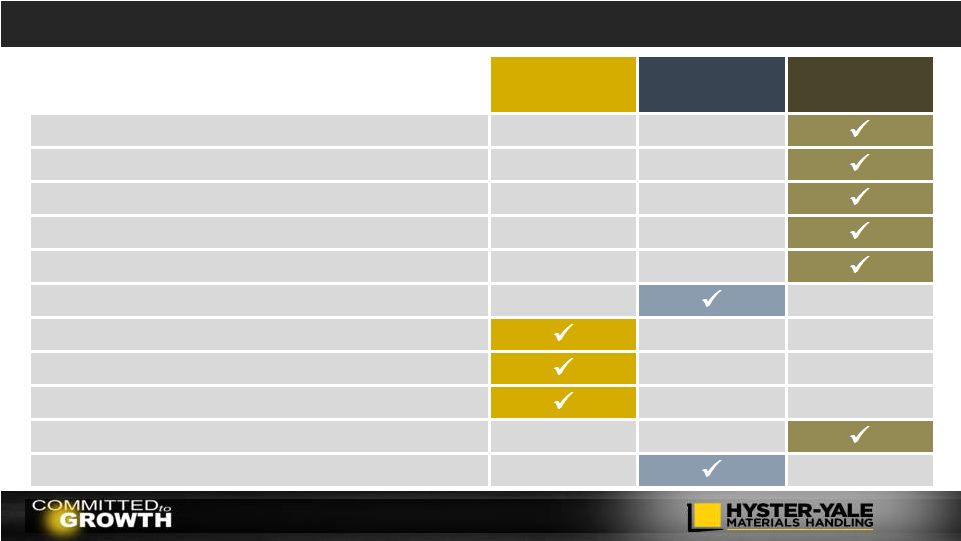 Early
Stage Mid Stage
Achieved Breakthrough Product Improvement Supply Chain Manufacturing Quality Pricing Dealer Structure and Excellence Area Sales Management Account Identification and Coverage Solutions Groups Aftermarket Fleet We believe momentum is gaining in all key areas of the business… Key Business Areas – Stages of Momentum 53 |
 Nuvera
Fuel Cells Business 54
Strategic Objective Key Elements Initiative Commercialize Nuvera’s Fuel Cell Technology • Acquired in December 2014 • Strong patent portfolio • Enables active participation in the growing hydrogen and fuel cell market • Integration of Nuvera’s technology into Hyster-Yale’s lift truck product range • Supports other key strategic initiatives Outcome: Successfully create an integrated fuel cell power solution option for customers
• Commercialize Nuvera’s technology through introduction of new fuel cell and improved hydrogen generation products and enhance our lift truck business value proposition |
 Why
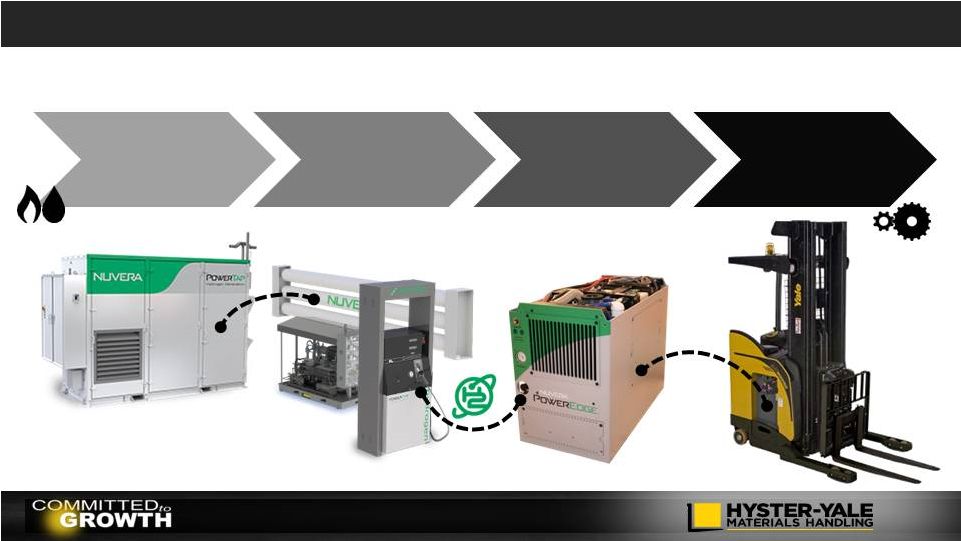
Nuvera? Nuvera’s Products – The Total Power
Solution 55
NMHG + Nuvera: One stop for your hydrogen and fuel cell needs…
GENERATION DELIVERY ELECTRIC POWER INDUSTRIAL MOBILITY |
 Nuvera
Technology Patents across hydrogen value chain
Fuel cell stack a strong fit for industrial mobility
• Metallic cell structure for robustness • Open flow field for high power density Steam methane reformation based hydrogen generation • On-site appliance • Efficient and durable solution Future Electro chemical compressor using fuel cell concepts 56 |
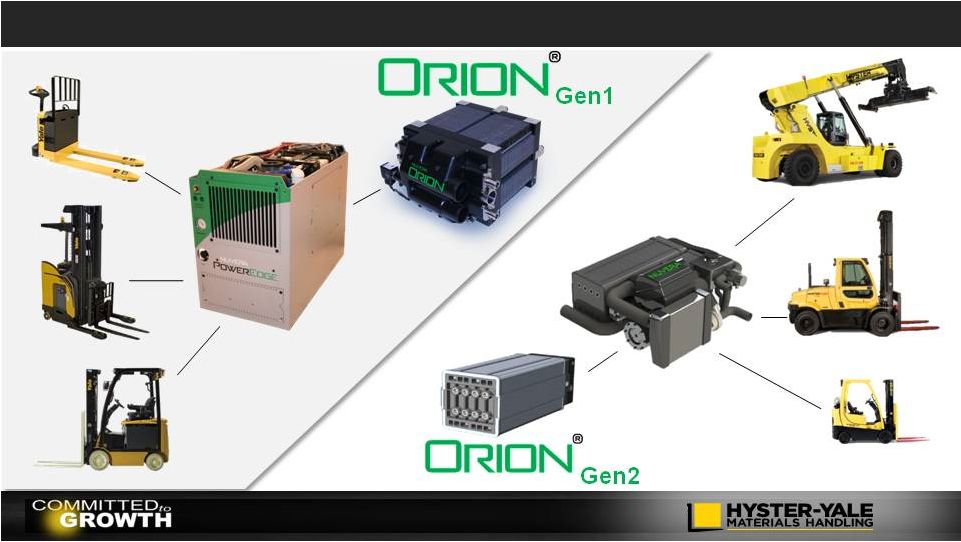 Nuvera Orion ® Technology 57 Integrated Fuel Cell Hybrid Truck Battery Box Replacement |
 Fuel Cell
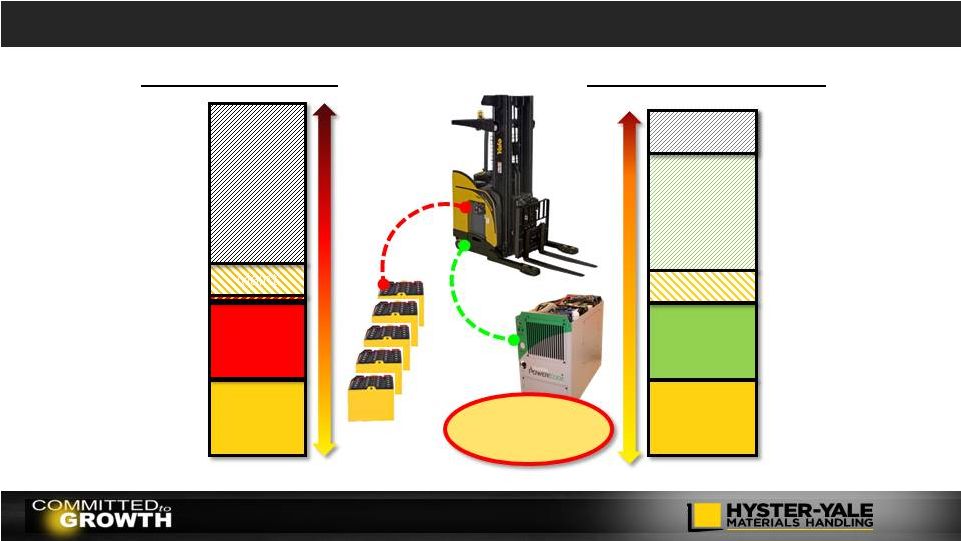
System vs. Batteries 58
Productivity Increase Time saved refueling and changing batteries Constant Power Power throughout shift and improved truck electronic life Environmentally Clean Minimal carbon footprint and zero indoor emissions Floor Space Utilization Recapture battery storage and charging floor space * Depending on application Economics Significant ROI* |
 Capturing
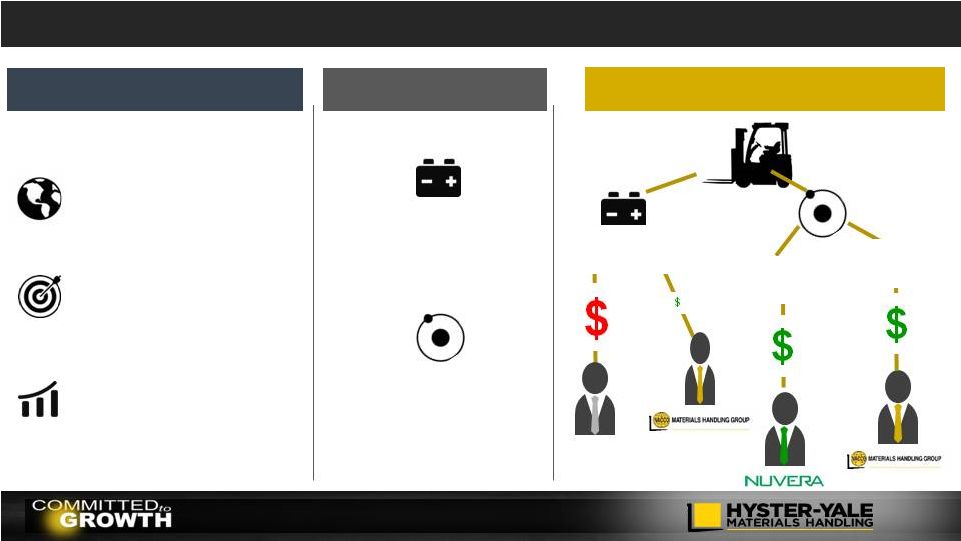
More Lifecycle Value NMHG/HY
NMHG/Dealer Utility Company Utility Company Nuvera/Dealer Nuvera NMHG/Dealer NMHG/HY Lead Acid Battery* PowerEdge ® Solution* *Representative Total Cost of Operation based on NREL 2013 report Battery Supplier 59 _____________________ (1) Currently set to expire on 1/1/17 Energy Maint Batteries & Charger Truck Eligible for 30% US Tax Credit (1) Truck PowerEdge Maint Fuel (PowerTap) Energy |
 Near-Term Fuel Cell Opportunity
Market Market Customer Targets Existing Fuel Cell Users Nuvera/ NMHG Customers High productivity applications Share Growth Target Warehouse customers Low cost of ownership North America Market 140k+ units per year 750k+ unit population Battery replacement for Class 1, 2, and 3 electric trucks Economics Economics HY Revenue HY Revenue Fuel Cell Similar acquisition costs Lower total cost of ownership Incremental revenue with H2 fuel Batteries $18-20k lifetime spend $12k for 3 batteries $6-8k for 1 charger Battery Vendor 60 Conventional Battery Incremental Truck Sales Fuel cell alternatives |