Attached files
| file | filename |
|---|---|
| 8-K - FORM 8-K - FIFTH THIRD BANCORP | d60041d8k.htm |
BancAnalysts Association of Boston Conference Tayfun Tuzun Executive Vice President & Chief Financial Officer November 6, 2015 Refer to earnings release dated October 20, 2015 for further information Exhibit 99.1
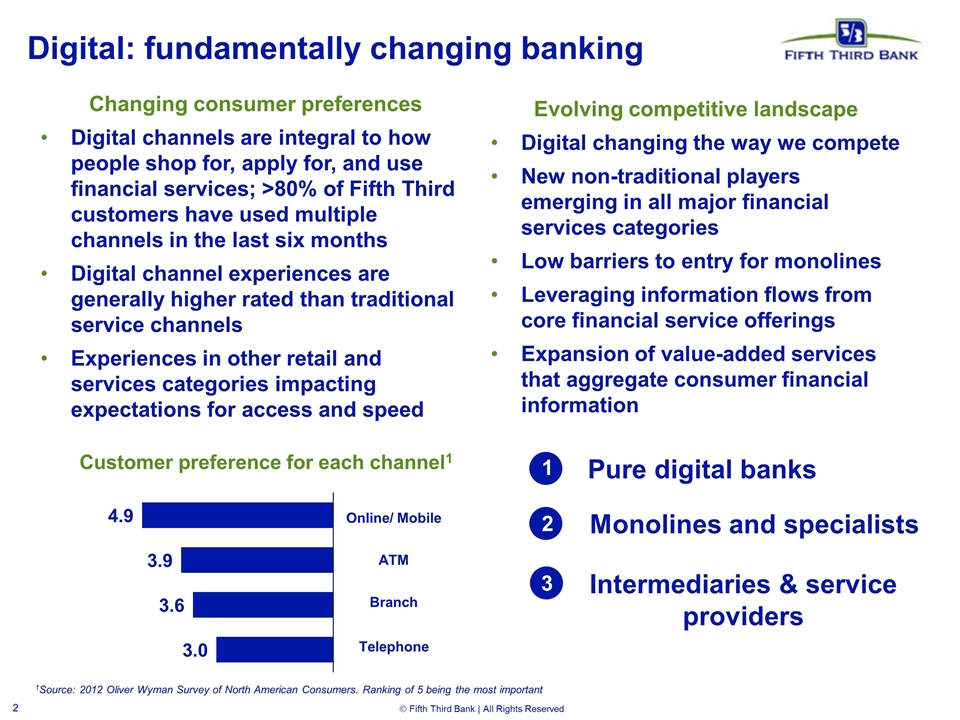
Digital: fundamentally changing banking Changing consumer preferences Digital channels are integral to how people shop for, apply for, and use financial services; >80% of Fifth Third customers have used multiple channels in the last six months Digital channel experiences are generally higher rated than traditional service channels Experiences in other retail and services categories impacting expectations for access and speed Customer preference for each channel1 Online/ Mobile ATM Branch Telephone 1Source: 2012 Oliver Wyman Survey of North American Consumers. Ranking of 5 being the most important Evolving competitive landscape Digital changing the way we compete New non-traditional players emerging in all major financial services categories Low barriers to entry for monolines Leveraging information flows from core financial service offerings Expansion of value-added services that aggregate consumer financial information 1 Pure digital banks 3 2 Monolines and specialists Intermediaries & service providers
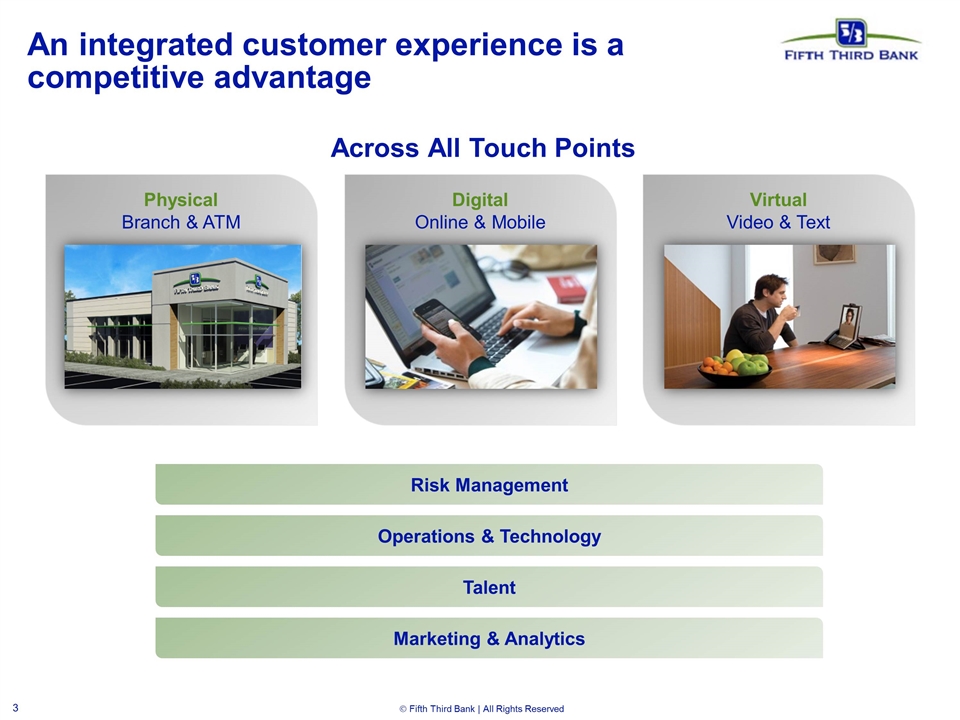
An integrated customer experience is a competitive advantage Across All Touch Points Risk Management Operations & Technology Talent Marketing & Analytics Physical Branch & ATM Virtual Video & Text Digital Online & Mobile
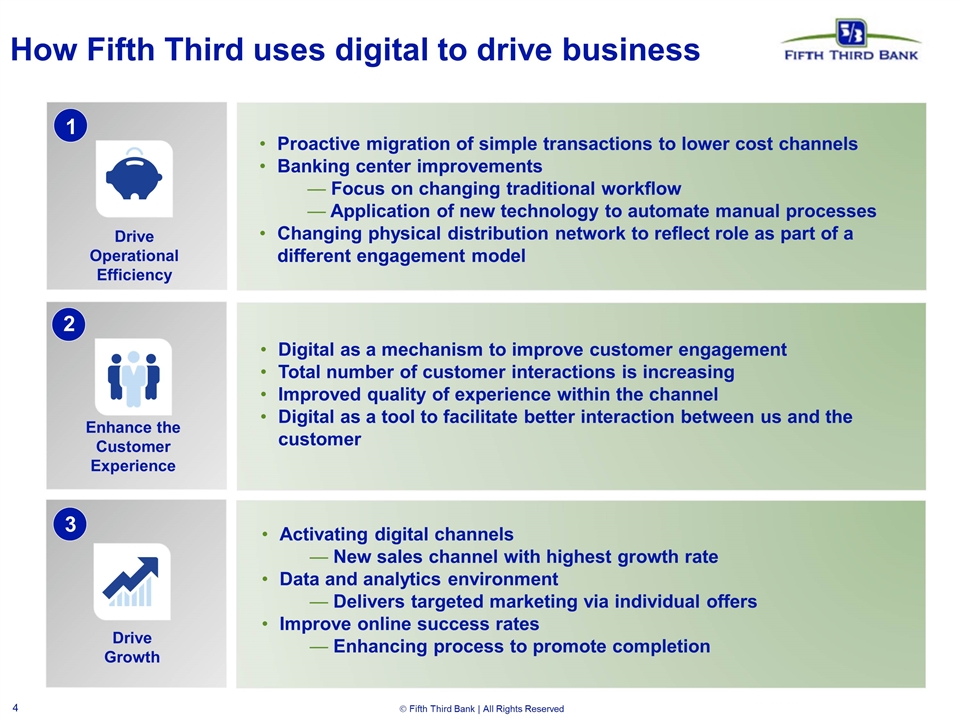
Drive Growth Activating digital channels New sales channel with highest growth rate Data and analytics environment Delivers targeted marketing via individual offers Improve online success rates Enhancing process to promote completion Enhance the Customer Experience Digital as a mechanism to improve customer engagement Total number of customer interactions is increasing Improved quality of experience within the channel Digital as a tool to facilitate better interaction between us and the customer 3 How Fifth Third uses digital to drive business 1 Drive Operational Efficiency Proactive migration of simple transactions to lower cost channels Banking center improvements Focus on changing traditional workflow Application of new technology to automate manual processes Changing physical distribution network to reflect role as part of a different engagement model 2
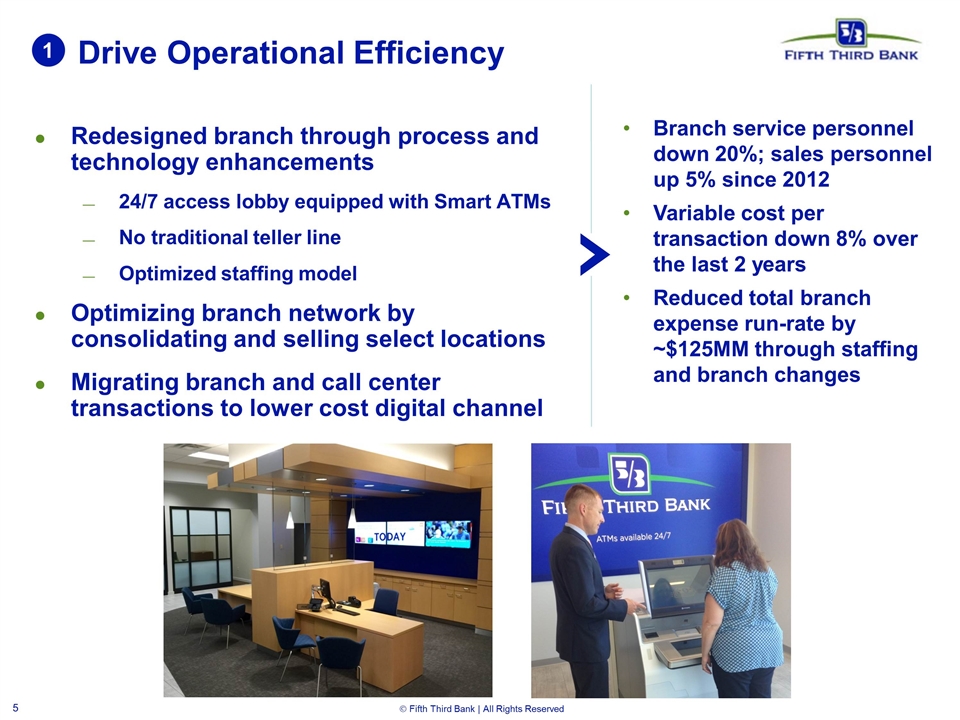
Drive Operational Efficiency Redesigned branch through process and technology enhancements 24/7 access lobby equipped with Smart ATMs No traditional teller line Optimized staffing model Optimizing branch network by consolidating and selling select locations Migrating branch and call center transactions to lower cost digital channel 1 Branch service personnel down 20%; sales personnel up 5% since 2012 Variable cost per transaction down 8% over the last 2 years Reduced total branch expense run-rate by ~$125MM through staffing and branch changes
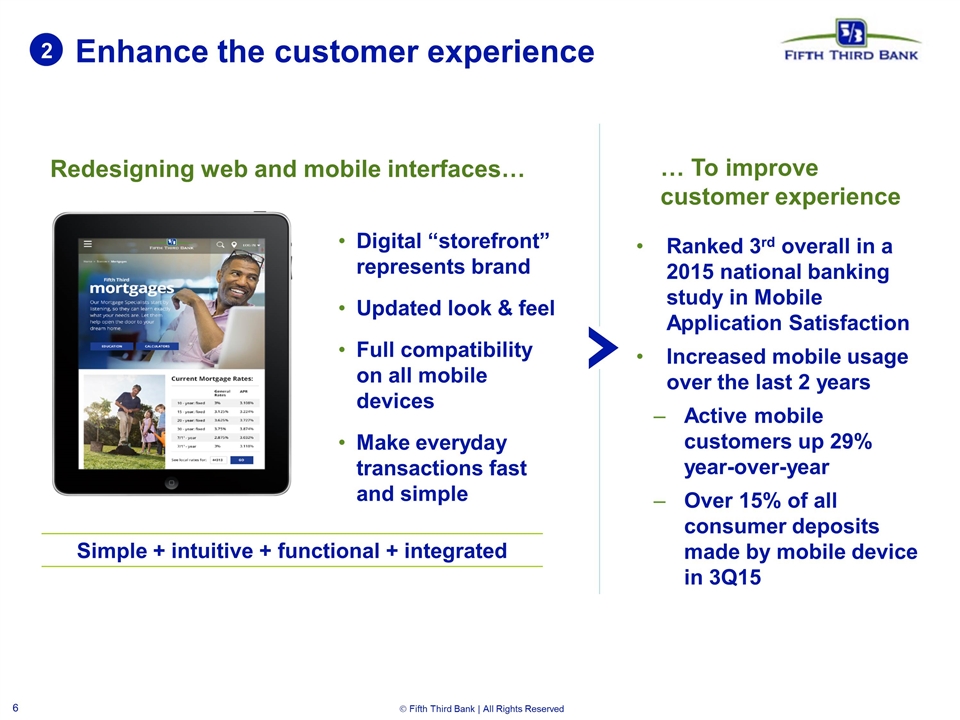
Enhance the customer experience 2 Digital “storefront” represents brand Updated look & feel Full compatibility on all mobile devices Make everyday transactions fast and simple Redesigning web and mobile interfaces… … To improve customer experience Ranked 3rd overall in a 2015 national banking study in Mobile Application Satisfaction Increased mobile usage over the last 2 years Active mobile customers up 29% year-over-year Over 15% of all consumer deposits made by mobile device in 3Q15 Simple + intuitive + functional + integrated
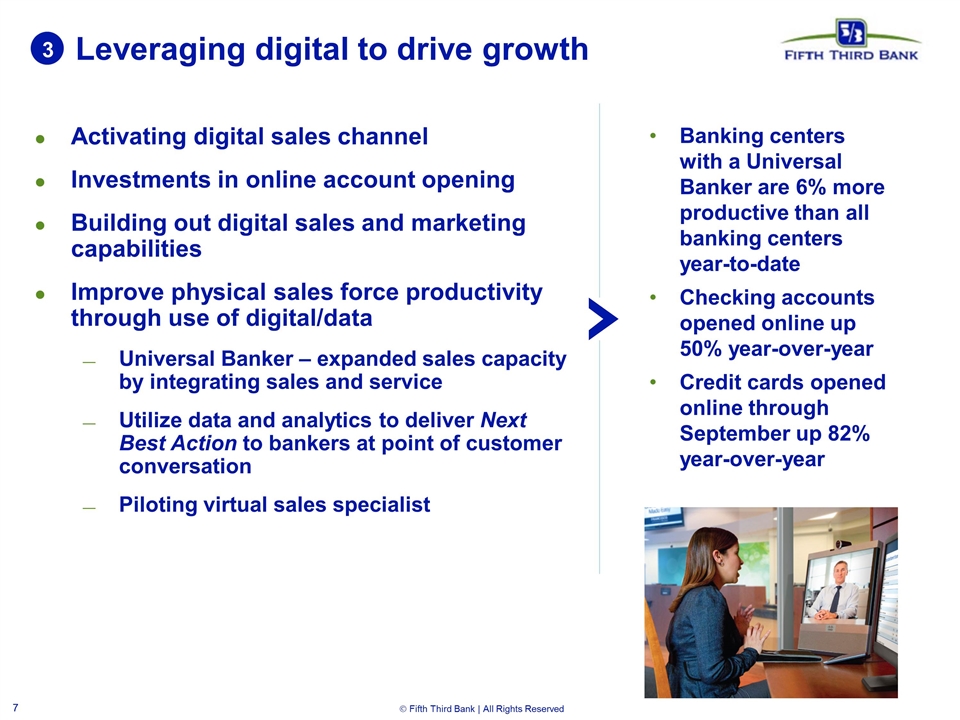
Leveraging digital to drive growth 3 Activating digital sales channel Investments in online account opening Building out digital sales and marketing capabilities Improve physical sales force productivity through use of digital/data Universal Banker – expanded sales capacity by integrating sales and service Utilize data and analytics to deliver Next Best Action to bankers at point of customer conversation Piloting virtual sales specialist Banking centers with a Universal Banker are 6% more productive than all banking centers year-to-date Checking accounts opened online up 50% year-over-year Credit cards opened online through September up 82% year-over-year
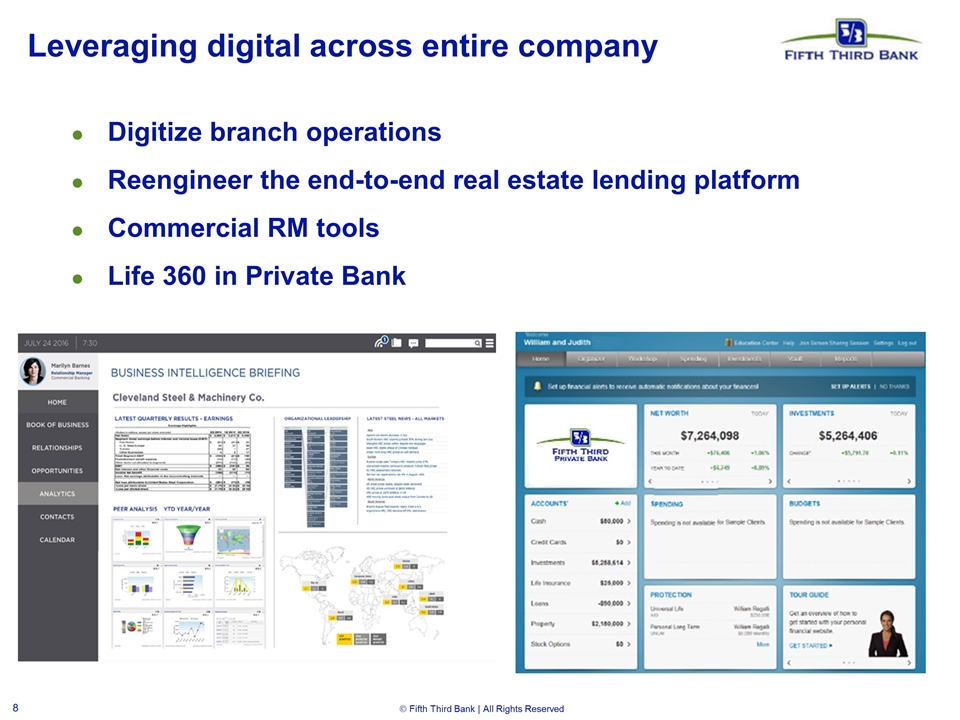
Leveraging digital across entire company Digitize branch operations Reengineer the end-to-end real estate lending platform Commercial RM tools Life 360 in Private Bank
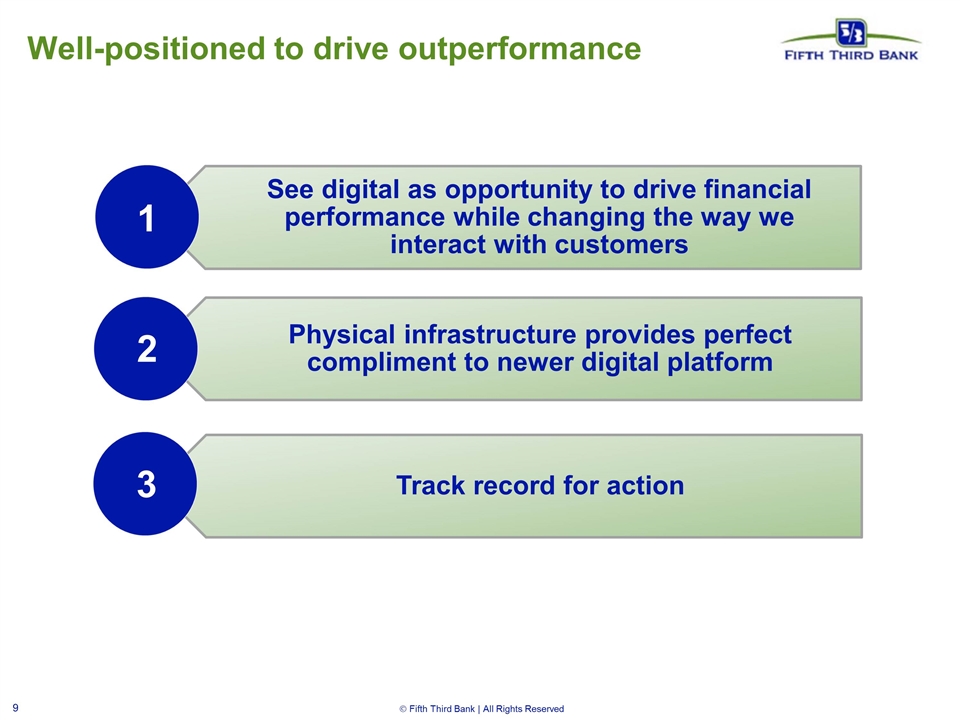
Well-positioned to drive outperformance 1 2 3 See digital as opportunity to drive financial performance while changing the way we interact with customers Physical infrastructure provides perfect compliment to newer digital platform Track record for action
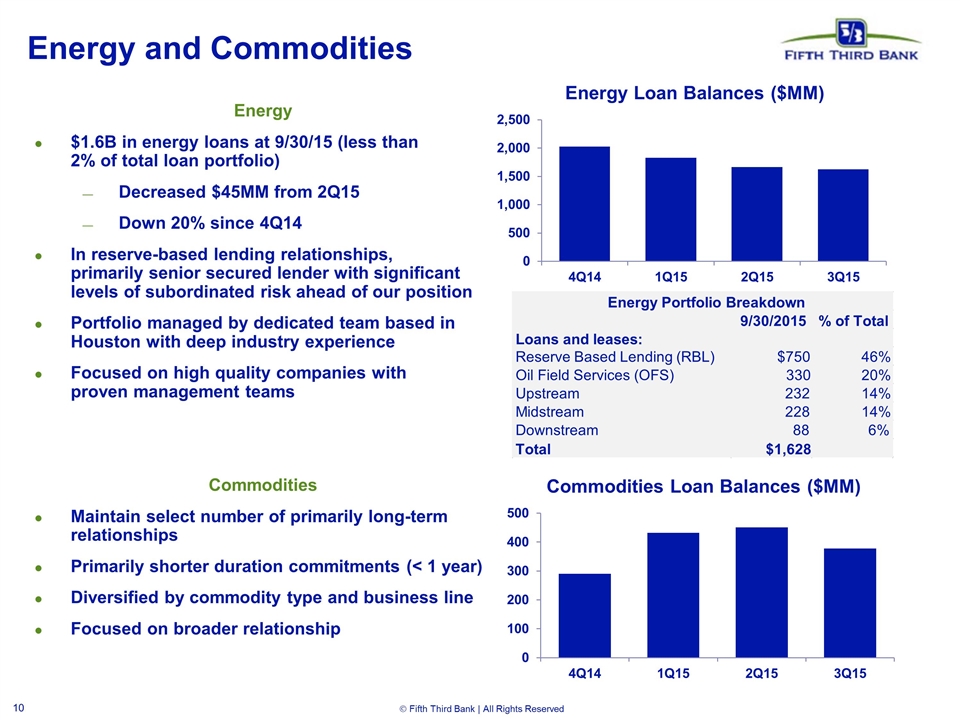
Energy and Commodities Energy $1.6B in energy loans at 9/30/15 (less than 2% of total loan portfolio) Decreased $45MM from 2Q15 Down 20% since 4Q14 In reserve-based lending relationships, primarily senior secured lender with significant levels of subordinated risk ahead of our position Portfolio managed by dedicated team based in Houston with deep industry experience Focused on high quality companies with proven management teams Commodities Maintain select number of primarily long-term relationships Primarily shorter duration commitments (< 1 year) Diversified by commodity type and business line Focused on broader relationship 9/30/2015 % of Total Loans and leases: Reserve Based Lending (RBL) $750 46% Oil Field Services (OFS) 330 20% Upstream 232 14% Midstream 228 14% Downstream 88 6% Total $1,628 Energy Portfolio Breakdown
Cautionary statement This report contains statements that we believe are “forward-looking statements” within the meaning of Section 27A of the Securities Act of 1933, as amended, and Rule 175 promulgated thereunder, and Section 21E of the Securities Exchange Act of 1934, as amended, and Rule 3b-6 promulgated thereunder. These statements relate to our financial condition, results of operations, plans, objectives, future performance or business. They usually can be identified by the use of forward-looking language such as “will likely result,” “may,” “are expected to,” “is anticipated,” “estimate,” “forecast,” “projected,” “intends to,” or may include other similar words or phrases such as “believes,” “plans,” “trend,” “objective,” “continue,” “remain,” or similar expressions, or future or conditional verbs such as “will,” “would,” “should,” “could,” “might,” “can,” or similar verbs. You should not place undue reliance on these statements, as they are subject to risks and uncertainties, including but not limited to the risk factors set forth in our most recent Annual Report on Form 10-K. When considering these forward-looking statements, you should keep in mind these risks and uncertainties, as well as any cautionary statements we may make. Moreover, you should treat these statements as speaking only as of the date they are made and based only on information then actually known to us. There are a number of important factors that could cause future results to differ materially from historical performance and these forward-looking statements. Factors that might cause such a difference include, but are not limited to: (1) general economic conditions and weakening in the economy, specifically the real estate market, either nationally or in the states in which Fifth Third, one or more acquired entities and/or the combined company do business, are less favorable than expected; (2) deteriorating credit quality; (3) political developments, wars or other hostilities may disrupt or increase volatility in securities markets or other economic conditions; (4) changes in the interest rate environment reduce interest margins; (5) prepayment speeds, loan origination and sale volumes, charge-offs and loan loss provisions; (6) Fifth Third’s ability to maintain required capital levels and adequate sources of funding and liquidity; (7) maintaining capital requirements and adequate sources of funding and liquidity may limit Fifth Third’s operations and potential growth; (8) changes and trends in capital markets; (9) problems encountered by larger or similar financial institutions may adversely affect the banking industry and/or Fifth Third; (10) competitive pressures among depository institutions increase significantly; (11) effects of critical accounting policies and judgments; (12) changes in accounting policies or procedures as may be required by the Financial Accounting Standards Board (FASB) or other regulatory agencies; (13) legislative or regulatory changes or actions, or significant litigation, adversely affect Fifth Third, one or more acquired entities and/or the combined company or the businesses in which Fifth Third, one or more acquired entities and/or the combined company are engaged, including the Dodd-Frank Wall Street Reform and Consumer Protection Act; (14) ability to maintain favorable ratings from rating agencies; (15) fluctuation of Fifth Third’s stock price; (16) ability to attract and retain key personnel; (17) ability to receive dividends from its subsidiaries; (18) potentially dilutive effect of future acquisitions on current shareholders’ ownership of Fifth Third; (19) effects of accounting or financial results of one or more acquired entities; (20) difficulties from Fifth Third’s investment in, relationship with, and nature of the operations of Vantiv, LLC; (21) loss of income from any sale or potential sale of businesses that could have an adverse effect on Fifth Third’s earnings and future growth; (22) difficulties in separating the operations of any branches or other assets divested; (23) inability to achieve expected benefits from branch consolidations and planned sales within desired timeframes, if at all; (24) ability to secure confidential information and deliver products and services through the use of computer systems and telecommunications networks; and (25) the impact of reputational risk created by these developments on such matters as business generation and retention, funding and liquidity. You should refer to our periodic and current reports filed with the Securities and Exchange Commission, or “SEC,” for further information on other factors, which could cause actual results to be significantly different from those expressed or implied by these forward-looking statements.
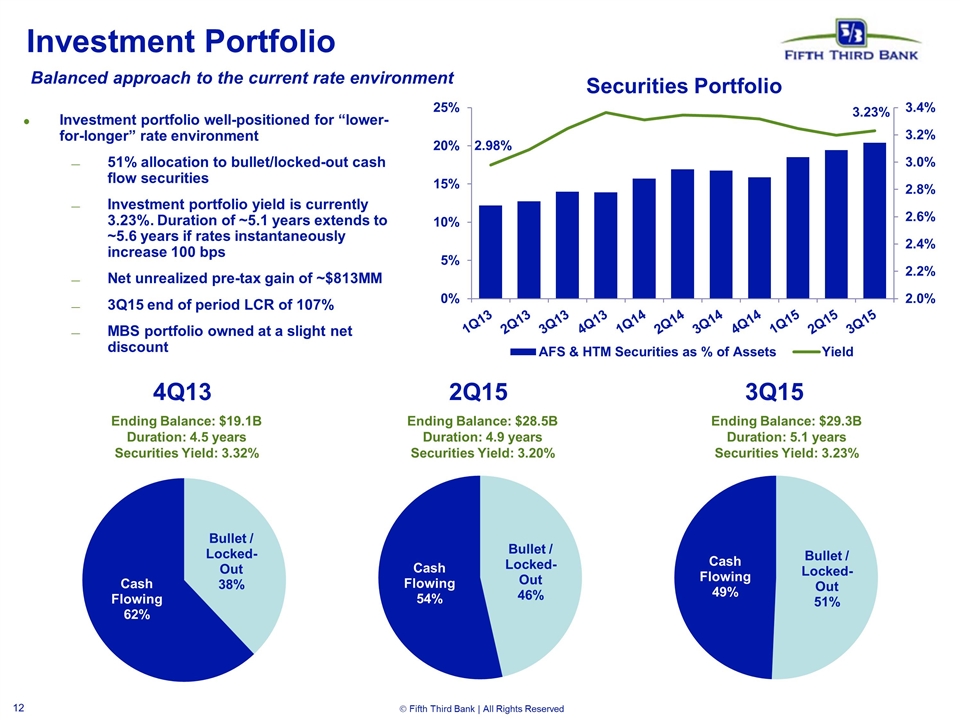
Investment Portfolio Balanced approach to the current rate environment Ending Balance: $29.3B Duration: 5.1 years Securities Yield: 3.23% Ending Balance: $28.5B Duration: 4.9 years Securities Yield: 3.20% Ending Balance: $19.1B Duration: 4.5 years Securities Yield: 3.32% Investment portfolio well-positioned for “lower-for-longer” rate environment 51% allocation to bullet/locked-out cash flow securities Investment portfolio yield is currently 3.23%. Duration of ~5.1 years extends to ~5.6 years if rates instantaneously increase 100 bps Net unrealized pre-tax gain of ~$813MM 3Q15 end of period LCR of 107% MBS portfolio owned at a slight net discount
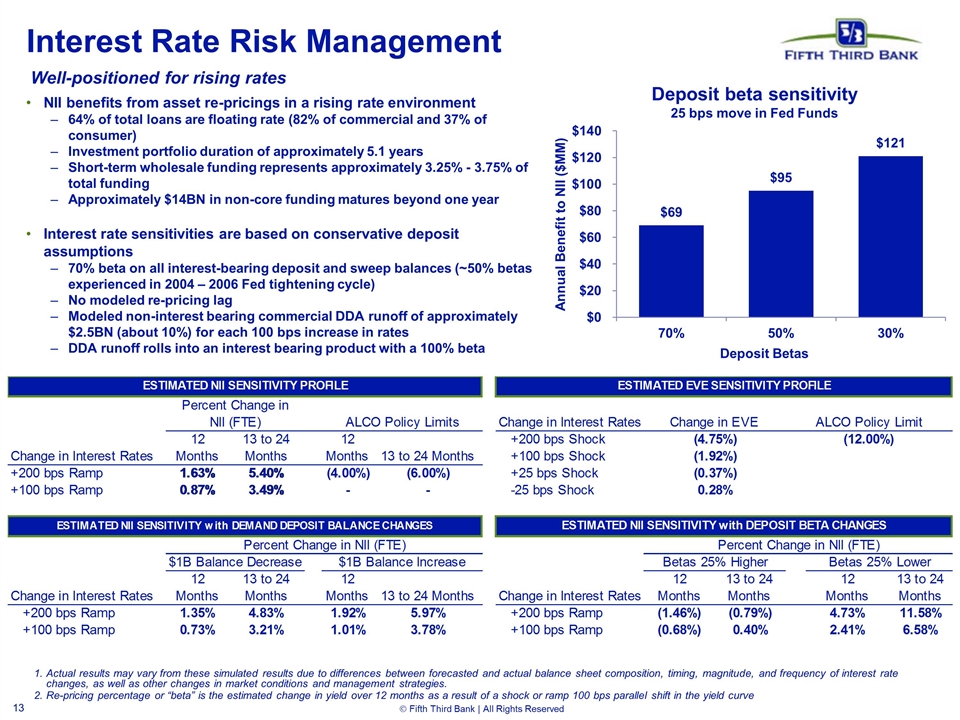
Interest Rate Risk Management Actual results may vary from these simulated results due to differences between forecasted and actual balance sheet composition, timing, magnitude, and frequency of interest rate changes, as well as other changes in market conditions and management strategies. Re-pricing percentage or “beta” is the estimated change in yield over 12 months as a result of a shock or ramp 100 bps parallel shift in the yield curve Well-positioned for rising rates NII benefits from asset re-pricings in a rising rate environment 64% of total loans are floating rate (82% of commercial and 37% of consumer) Investment portfolio duration of approximately 5.1 years Short-term wholesale funding represents approximately 3.25% - 3.75% of total funding Approximately $14BN in non-core funding matures beyond one year Interest rate sensitivities are based on conservative deposit assumptions 70% beta on all interest-bearing deposit and sweep balances (~50% betas experienced in 2004 – 2006 Fed tightening cycle) No modeled re-pricing lag Modeled non-interest bearing commercial DDA runoff of approximately $2.5BN (about 10%) for each 100 bps increase in rates DDA runoff rolls into an interest bearing product with a 100% beta Deposit beta sensitivity 25 bps move in Fed Funds
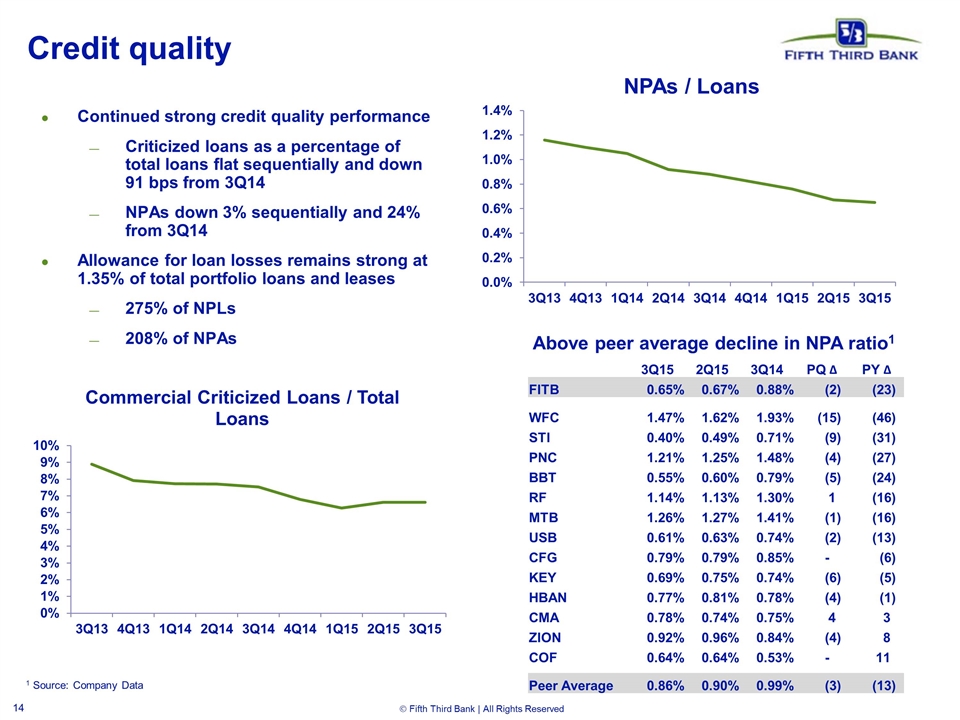
Credit quality 1 Source: Company Data Continued strong credit quality performance Criticized loans as a percentage of total loans flat sequentially and down 91 bps from 3Q14 NPAs down 3% sequentially and 24% from 3Q14 Allowance for loan losses remains strong at 1.35% of total portfolio loans and leases 275% of NPLs 208% of NPAs Above peer average decline in NPA ratio1 3Q15 2Q15 3Q14 PQ ∆ PY ∆ FITB 0.65% 0.67% 0.88% (2) (23) WFC 1.47% 1.62% 1.93% (15) (46) STI 0.40% 0.49% 0.71% (9) (31) PNC 1.21% 1.25% 1.48% (4) (27) BBT 0.55% 0.60% 0.79% (5) (24) RF 1.14% 1.13% 1.30% 1 (16) MTB 1.26% 1.27% 1.41% (1) (16) USB 0.61% 0.63% 0.74% (2) (13) CFG 0.79% 0.79% 0.85% - (6) KEY 0.69% 0.75% 0.74% (6) (5) HBAN 0.77% 0.81% 0.78% (4) (1) CMA 0.78% 0.74% 0.75% 4 3 ZION 0.92% 0.96% 0.84% (4) 8 COF 0.64% 0.64% 0.53% - 11 Peer Average 0.86% 0.90% 0.99% (3) (13)
