Attached files
| file | filename |
|---|---|
| 8-K - FORM 8-K - US BANCORP \DE\ | d32417d8k.htm |
 BancAnalysts Association
of Boston Conference November 5, 2015 Kathy Rogers Vice Chairman and CFO Exhibit 99.1 |
| Forward-looking Statements
and Additional Information
The following information appears in accordance with the Private Securities Litigation
Reform Act of 1995: This presentation contains forward-looking statements about U.S. Bancorp. Statements that are not historical or current facts,
including statements about beliefs and expectations, are
forward-looking statements and are based on the information available to, and assumptions and estimates made by, management as of the date made. These forward-looking statements cover, among other things,
anticipated future revenue and expenses and the future plans and
prospects of U.S. Bancorp. Forward-looking statements involve
inherent risks and uncertainties, and important factors could cause actual results to
differ materially from those anticipated. A reversal or slowing of
the current economic recovery or another severe contraction could adversely affect U.S. Bancorp’s revenues and the values of its assets and liabilities. Global financial markets could experience a recurrence of significant turbulence, which could reduce the
availability of funding to certain financial institutions and lead to a
tightening of credit, a reduction of business activity, and increased
market volatility. Stress in the commercial real estate markets, as well as a
downturn in the residential real estate markets, could cause credit
losses and deterioration in asset values. In addition, U.S. Bancorp’s business and financial performance is likely to be negatively impacted by recently enacted and future legislation and regulation. U.S. Bancorp’s results could also be adversely affected by
deterioration in general business and economic conditions; changes in
interest rates; deterioration in the credit quality of its loan
portfolios or in the value of the collateral securing those loans; deterioration in the
value of securities held in its investment securities portfolio; legal
and regulatory developments; litigation; increased competition from both banks and non-banks; changes in customer behavior and preferences; breaches in data security; effects of mergers and acquisitions and related integration; effects of critical
accounting policies and judgments; and management’s ability to
effectively manage credit risk, residual value risk, market risk,
operational risk, compliance risk, strategic risk, interest rate risk, liquidity risk
and reputational risk. For discussion of these and other risks that may cause actual results to differ from
expectations, refer to U.S. Bancorp’s Annual Report on Form 10-K
for the year ended December 31, 2014, on file with the Securities and Exchange Commission, including the sections entitled “Risk Factors” and “Corporate Risk Profile” contained in Exhibit 13, and all subsequent filings with the Securities
and Exchange Commission under Sections 13(a), 13(c), 14 or 15(d) of the
Securities Exchange Act of 1934. Forward-looking statements speak only as of the date they are made, and U.S. Bancorp undertakes no obligation to update them in light of new information or future events. This presentation includes non-GAAP financial measures to describe U.S. Bancorp’s performance. The calculations of these measures
are provided within or in the appendix of the presentation. These
disclosures should not be viewed as a substitute for operating results
determined in accordance with GAAP, nor are they necessarily comparable to non-GAAP
performance measures that may be presented by other companies. 2 U.S. BANCORP | |
 Agenda • Company Overview • Financial Management • Capital Management • Growth Strategies • Interest Rates • 4Q Update • Long-term Goals 3 U.S. BANCORP |
|
 U.S.
Bancorp 3Q15 Dimensions Market value as of 10/30/15
NYSE Traded USB Founded 1863 Market Value $74B Branches 3,151 ATMs 5,001 Customers 18.5M Assets $416B Deposits $295B Loans $255B 4 U.S. BANCORP |
|
 Industry
Position Source: company reports, SNL and FactSet
Assets and deposits as of 9/30/15, market value as of 10/30/15
Assets Market Value Deposits U.S. U.S. U.S. Rank Company $ Billions Rank Company $ Billions Rank Company $ Billions 1 J.P. Morgan 2,417 1 J.P. Morgan 1,273 1 Wells Fargo 279 2 Bank of America 2,153 2 Wells Fargo 1,202 2 J.P. Morgan 239 3 Citigroup 1,808 3 Bank of America 1,162 3 Bank of America 175 4 Wells Fargo 1,751 4 Citigroup 904 4 Citigroup 158 5 U.S. Bancorp 416 5 U.S. Bancorp 295 5 U.S. Bancorp 74 6 PNC 362 6 PNC 245 6 PNC 47 7 BB&T 209 7 BB&T 148 7 BB&T 29 8 SunTrust 187 8 SunTrust 146 8 SunTrust 21 9 Fifth Third 142 9 Fifth Third 101 9 Fifth Third 15 10 Regions 125 10 Regions 97 10 Regions 12 5 U.S. BANCORP |
|
 Peer
Banks Peer Bank Ticker Symbols
BAC Bank of America PNC PNC BBT BB&T RF Regions FITB Fifth Third STI SunTrust JPM J.P. Morgan USB U.S. Bancorp KEY KeyCorp WFC Wells Fargo Bank of America SunTrust Wells Fargo KeyCorp BBT Fifth Third Regions PNC J.P. Morgan U.S. Bancorp 6 U.S. BANCORP |
|
 Industry
Leading Returns 3Q15 Source: SNL and company reports; Peer banks: BAC,
BBT, FITB, JPM, KEY, PNC, RF, STI and WFC Efficiency ratio computed as
noninterest expense divided by the sum of net interest income on a taxable-equivalent basis and noninterest income excluding net securities gains (losses) Return on Average Assets 1.44% 1.32% 1.17% 1.13% 1.11% 1.07% 1.03% 0.92% 0.83% 0.82% USB Peer 1 Peer 2 Peer 3 Peer 4 Peer 5 Peer 6 Peer 7 Peer 8 Peer 9 14.1% 12.7% 11.5% 10.0% 9.6% 9.3% 8.2% 8.1% 7.0% 6.0% USB Peer 1 Peer 2 Peer 3 Peer 4 Peer 5 Peer 6 Peer 7 Peer 8 Peer 9 53.9% 56.4% 58.2% 61.3% 61.6% 64.0% 66.5% 66.7% 67.3% 67.8% USB Peer 1 Peer 2 Peer 3 Peer 4 Peer 5 Peer 6 Peer 7 Peer 8 Peer 9 Return on Average Common Equity Efficiency Ratio 7 U.S. BANCORP |
|
 Agenda • Company Overview • Financial Management • Capital Management • Growth Strategies • Interest Rates • 4Q Update • Long-term Goals 8 U.S. BANCORP |
|
 Revenue
Diversification Revenue Mix
By Business Line Consumer and Small Business Banking 42% Payment Services 30% Wealth Mgmt and Securities Services 11% Wholesale Banking and Commercial Real Estate 17% Fee Income / Total Revenue 2015 YTD, taxable-equivalent basis Business line revenue percentages exclude Treasury and Corporate Support (see slide 38)
46% 45% 45% 45% 35% 40% 45% 50% 55% 2012 2013 2014 3Q15 YTD 55% 45% 9 U.S. BANCORP |
|
 Best in
Class Debt Rating Debt ratings: holding company as of
10/30/15 USB is highest rated peer bank across all rating
agencies •
Funding advantage • Competitive advantages – Pricing – Flight-to-quality – Sales Force Confidence Holding Company Rating Outlook Rating Outlook Rating Outlook Rating Outlook USB A1 s A+ s AA s AA s WFC A2 s A+ on AA- s AA s BBT A2 s A- s A+ s A (high) s JPM A3 s A on A+ s A (high) s PNC A3 s A- s A+ s A (high) s BAC Baa1 s A- on A s A (low) s FITB Baa1 s BBB+ s A s A (low) s STI Baa1 s BBB+ s A- s A (low) s KEY Baa1 s BBB+ s A- s BBB (high) s RF Baa3 s BBB s BBB s BBB s Moody's S&P Fitch DBRS 10 U.S. BANCORP |
|
 Credit
Quality $ in millions
Net Charge-offs Nonperforming Assets $336 $308 $279 $296 $292 0.55% 0.50% 0.46% 0.48% 0.46% 0.00% 0.75% 1.50% 2.25% 3.00% 0 130 260 390 520 3Q14 4Q14 1Q15 2Q15 3Q15 $1,923 $1,808 $1,696 $1,577 $1,567 0.78% 0.73% 0.69% 0.63% 0.61% 0.00% 0.75% 1.50% 2.25% 3.00% 0 700 1,400 2,100 2,800 3Q14 4Q14 1Q15 2Q15 3Q15 Net Charge-offs (Left Scale) NCOs to Avg Loans (Right Scale) Nonperforming Assets (Left Scale) NPAs to Loans plus ORE (Right Scale) 11 U.S. BANCORP |
|
 Efficiency
53.9% 56.4% 58.2% 61.3% 61.6% 64.0% 66.5% 66.7% 67.3% 67.8% USB Peer 1 Peer 2 Peer 3 Peer 4 Peer 5 Peer 6 Peer 7 Peer 8 Peer 9 • Single processing platforms • Full consolidation of acquisitions • Operating scale in all significant businesses • Business line monthly review process Source: SNL and company reports; Peer banks: BAC, BBT, FITB, JPM, KEY, PNC, RF, STI and WFC
Efficiency ratio computed as noninterest expense divided by the sum of net interest
income on a taxable-equivalent basis and noninterest income excluding
net securities gains (losses) 3Q15 Efficiency Ratio
Sources of Competitive Advantage 12 U.S. BANCORP |
|
 Efficiency
Effort Goals
• Return to positive operating leverage • Reinvest savings into growth initiatives as economy strengthens 13 U.S. BANCORP |
|
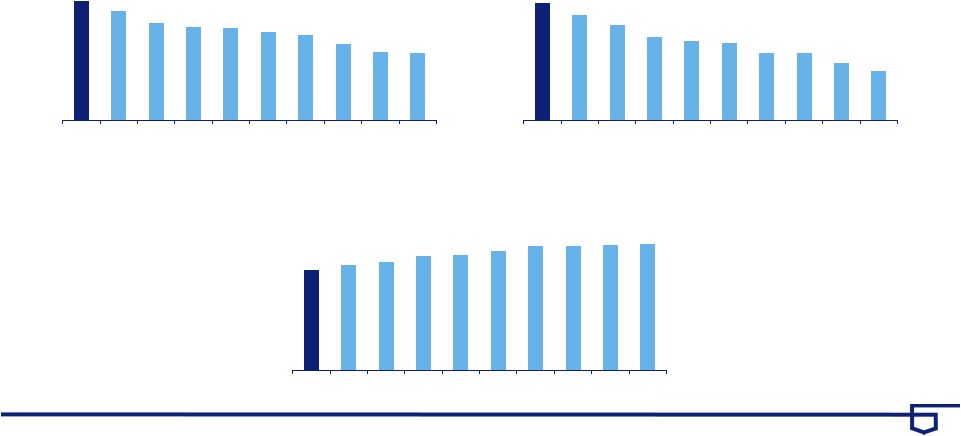
 Prior 5
Quarters Average Balances
Linked Quarter Growth
1.1% 1.0% 0.8% 0.7% 1.3% *Core
Prior 5 Years Average Balances Year-Over-Year Growth Loan Growth $ in billions * 3Q14 excludes Charter One acquisition, 1Q15 excludes the reclassification of certain municipal loans to securities, 2Q15 and 3Q15
exclude student loans which were transferred to held for sale at the end of 1Q15 and
returned to held for investment during 3Q15 $193.0
$201.4 $215.4 $227.5 $241.7 100 140 180 220 260 2010 2011 2012 2013 2014 $243.9 $246.4 $248.0 $246.6 $250.5 200 215 230 245 260 3Q14 4Q14 1Q15 2Q15 3Q15 3.9% 4.4% 6.9% 5.6% 6.3% 1.4% 1.0% 0.6% (0.6%) 1.6% 14 U.S. BANCORP |
|
 Prior 5
Quarters Average Balances
Year-Over-Year Growth
5.5% 5.5% 6.4% 7.4% 6.9% *Core Prior 5 Years Average Balances Year-Over-Year Growth Deposit Growth $ in billions * Adjusted for Charter One acquisition $184.7 $213.2 $235.7 $250.5 $266.6 140 180 220 260 300 2010 2011 2012 2013 2014 $271.0 $275.5 $278.5 $285.7 $289.7 200 230 260 290 320 3Q14 4Q14 1Q15 2Q15 3Q15 10.1% 15.4% 10.6% 6.3% 6.5% 7.4% 7.2% 8.1% 8.9% 6.9% 15 U.S. BANCORP |
|
 Prior 5
Quarters Year-Over-Year Change
2.0% 3.2% 1.9% 1.4% 1.6% *Core Prior 5 Years Year-Over-Year Change Revenue Growth $18,148 $19,108 $20,288 $19,602 $20,161 10,000 13,000 16,000 19,000 22,000 2010 2011 2012 2013 2014 $4,990 $5,169 $4,906 $5,042 $5,147 3,500 4,000 4,500 5,000 5,500 3Q14 4Q14 1Q15 2Q15 3Q15 $ in million, taxable-equivalent basis * Excluding notable items: 2Q14 Visa gain $214 million; 4Q14 Nuveen gain $124 million; and
3Q15 Visa gain $135 million and student loan market value adjustment ($58)
million 2.0%
5.7% 1.9% (2.8%) 3.1% 8.9% 5.3% 6.2% (3.4%) 2.9% 16 U.S. BANCORP |
|
 Agenda • Company Overview • Financial Management • Capital Management • Growth Strategies • Interest Rates • 4Q Update • Long-term Goals 17 U.S. BANCORP |
|
 Capital
Management Earnings
Distribution Target • Annual dividend increased from $0.98 to $1.02 per share in 2Q15, a 4.1% increase • Five-quarter authorization to repurchase up to $3.0 billion of outstanding stock effective April 1, 2015 • CET1* at 9.2% in 3Q15, above target of 8.0% Capital Actions Reinvest and Acquisitions Dividends Share Repurchases 20 - 40% 30 - 40% 30 - 40% Payout Ratio 80% 70% 76% 71% 72% * Common equity tier 1 capital to risk-weighted assets estimated for the Basel III fully implemented standardized approach
29% 31% 32% 32% 32% 42% 41% 38% 44% 48% 0% 25% 50% 75% 100% 2013 2014 1Q15 2Q15 3Q15 Dividends Share Repurchases 18 U.S. BANCORP |
|
 Agenda • Company Overview • Financial Management • Capital Management • Growth Strategies • Interest Rates • 4Q Update • Long-term Goals 19 U.S. BANCORP |
|
 Business
Mix Payment Services
• Retail Payment Solutions • Corporate Payment Systems • Global Merchant Acquiring Wealth Management and Securities Services • Wealth Management • Asset Management • Corporate Trust Services • Fund Services • Institutional Trust & Custody Consumer and Small Business Banking • Branch Banking • Small Business Banking • Consumer Lending • Mortgage Banking • Omnichannel Wholesale Banking and Commercial Real Estate • Corporate Banking • Commercial Banking • Commercial Real Estate Revenue Mix By Business Line Consumer and Small Business Banking Payment Services Wealth Mgmt and Securities Services Wholesale Banking and Commercial Real Estate 20 U.S. BANCORP |
|
 Payment
Services Business Line Summary
• Provides a full suite of payment processing services to consumers, small businesses, corporations and merchants – a unique position versus other banks • Expanding internationally in merchant acquiring through continued investment in partnerships and our international merchant payment platform • Leading player in payments innovation and emerging technologies including enhanced security and authentication Business Line Scale Ranking Annual Volume • #5 U.S. credit card issuer $64 billion • #5 U.S. debit card issuer $58 billion • #3 U.S. corporate card issuer $54 billion • #5 U.S. merchant acquirer / $375 billion #4 European merchant acquirer Retail Payment Solutions 60% Global Merchant Acquiring 30% Corporate Payment Systems 10% Revenue Contribution to USB Payment Services Revenue Mix 30% Source: The Nilson Report (Visa and MasterCard issuers) Revenue contribution and mix 3Q15 YTD; Revenue contribution percentages exclude Treasury and Corporate Support (see slide 38)
Consumer and Small Business Banking Wealth Mgmt and Securities Services Wholesale Banking and Commercial Real Estate Payment Services 21 U.S. BANCORP |
|
 Wealth
Management and Securities Services Business Line Summary
• Delivers a full array of wealth management services through differentiated service delivery models to address the needs of a broad range of clients • Leading provider of corporate trust services in the U.S. with a growing international presence • Continued opportunity to expand all businesses through new products and services, building deeper relationships and strategic acquisitions Business Line Scale • $126 billion in assets under management and $5.1 trillion in assets under administration • #1 U.S. corporate trustee • #1 U.S. municipal trustee • #1 U.S. structured trustee • #3 Third party mutual fund servicer Wealth Management 40% Fund Services 20% Corporate Trust 30% Revenue Contribution to USB Wealth Mgmt and Securities Services Revenue Mix Source: Securities Data Corp (corporate trust) based on number of issues, Investment Company Institute (fund services)
Revenue contribution and mix 3Q15 YTD; Revenue contribution percentages exclude
Treasury and Corporate Support (see slide 38) US Bank
Asset Mgmt 1% Institutional Trust & Custody 9% Consumer and Small Business Banking Wealth Mgmt and Securities Services Wholesale Banking and Commercial Real Estate Payment Services 11% 22 U.S. BANCORP |
|
 Wholesale
Banking and Commercial Real Estate Business Line Summary
• Provides products and services to 90% of the Fortune 500 and 87% of the Fortune 1,000 • Expanded loan capital markets and derivatives, enhanced foreign exchange capabilities, added high- grade fixed income and municipal bond capabilities • National Commercial Real Estate business is relationship-based and serves strong national and regional developers Business Line Scale • $3.0 billion of revenue in 2014, $84 billion in loans and $87 billion in deposits (3Q15 average balances) • A leading treasury management provider • A leading provider of banking services to federal, state and municipal governments Corporate Banking 63% Commercial Real Estate 20% Commercial Banking 17% Wholesale Banking and Commercial RE Revenue Mix Revenue contribution and mix 3Q15 YTD; Revenue contribution percentages exclude Treasury and Corporate Support (see slide 38)
Revenue Contribution to USB Consumer and Small Business Banking Wealth Mgmt and Securities Services Wholesale Banking and Commercial Real Estate Payment Services 17% 23 U.S. BANCORP |
|
 Consumer
and Small Business Banking Business Line Summary
• Provides a full suite of banking products and services to consumer and small business customers across 25-state branch footprint • Differentiating U.S. Bank from competitors through continued improvement in the customer experience, investments in innovative products and deeper customer relationships • Omnichannel strategy driving investments in industry- leading digital channel capabilities and new state-of- the-art branch formats Business Line Scale • 25 contiguous state distribution footprint; #4 U.S. branch network; #1 in-store and on-site branch network • #5 U.S. mortgage originator • #3 SBA lender Mortgage Banking 22% Community Banking 28% Consumer and Small Business Banking Revenue Mix 42% Metropolitan Banking 30% In-store and On-site Banking 7% Consumer Lending 13% Source: SNL and Inside Mortgage Finance Revenue contribution and mix 3Q15 YTD; Revenue contribution percentages exclude Treasury and Corporate Support (see slide 38)
Revenue Contribution to USB Consumer and Small Business Banking Wealth Mgmt and Securities Services Wholesale Banking and Commercial Real Estate Payment Services 24 U.S. BANCORP |
|
 Omnichannel Strategy All channels comprise ‘Omnichannel’ Online Mobile ATM Telephone Branch The customer Omnichannel: How the customer interacts both seamlessly and holistically across the bank Strategic Pillars 25 U.S. BANCORP |
|
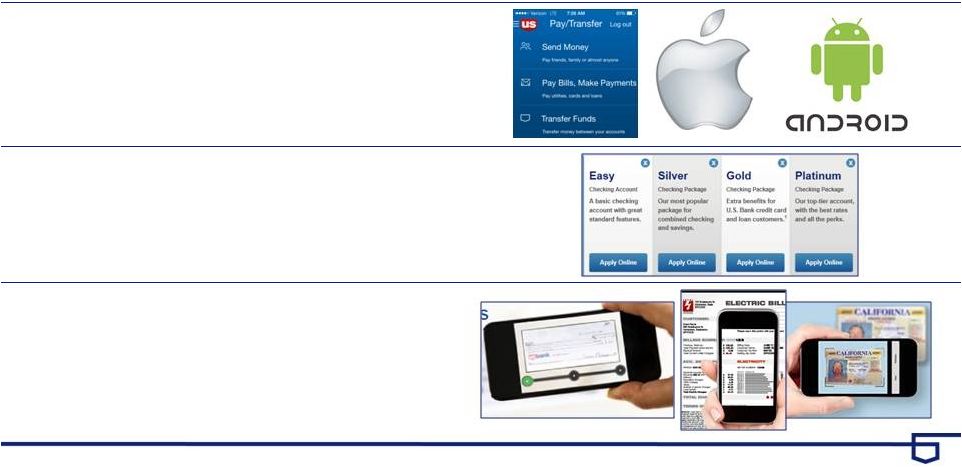 Success in
Digital is Foundational for Omnichannel
Great progress has fueled great results with more to do…
Achievements: 1. Money movement & payments • Live with real time P2P • Apple / Android pay • Mobile wizard for payments 2. Application & fulfilment • Enables digital application • Online fulfilment • Optimization for touch devices 3. Photo banking: • Mobile check deposit • Photo Bill pay • Imminent launch of ‘photo apply’ 26 U.S. BANCORP |
|
 Agenda • Company Overview • Financial Management • Capital Management • Growth Strategies • Interest Rates • 4Q Update • Long-term Goals 27 U.S. BANCORP |
|
 Net
Interest Margin – Where Are We Today?
Taxable-equivalent basis
Net Interest Income • The net interest margin was stable in 3Q15 versus 2Q15 • Two major headwinds are behind us Securities build for Liquidity Coverage Ratio is complete Checking Account Advance product discontinued 2Q14 • Expect the 4Q15 net interest margin to be relatively stable Key Points $2,748 $2,799 $2,752 $2,770 $2,821 3.16% 3.14% 3.08% 3.03% 3.04% 2.0% 2.5% 3.0% 3.5% 4.0% 2,000 2,250 2,500 2,750 3,000 3Q14 4Q14 1Q15 2Q15 3Q15 Net Interest Income Net Interest Margin 28 U.S. BANCORP |
|
 Net
Interest Income Simulation – as Rates Move
• The Company uses net interest income simulation analysis for measuring and analyzing consolidated interest rate risk, running 28 interest rate risk scenarios • Projections are largely dependent on assumptions of noninterest- bearing deposit runoff and non- maturity deposit re-pricing We are appropriately conservative • The Company is currently asset sensitive • Well positioned for rising rates Sensitivity of Net Interest Income Key Points 1.30% 1.38% 1.66% 1.71% 1.72% 1.75% 2.19% 2.37% 2.39% 0.00% 1.00% 2.00% 3.00% 4.00% 3Q14 4Q14 1Q15 2Q15 3Q15 Up 50 bps Immediate Up 200 bps Gradual 1.68% 29 U.S. BANCORP |
|
 Branch network • #4 U.S. branch network with 25 contiguous state distribution footprint • #1 in-store and on-site branch network Source: SNL Deposit Gathering Advantages: Branch Distribution 3Q15 Branches Metro traditional offices Community traditional offices In-Store and On-Site offices 3,151 U.S. Bank branch offices 5,001 U.S. Bank branded ATMs 30 U.S. BANCORP |
|
 Deposit
Gathering Advantages: Digital Distribution
• 3 million active mobile users and growing • Mobile is now the most frequently accessed channel at U.S. Bank U.S. Bank received the top score in 2015 in the Privacy and Security category for its mobile app “Coolest” Brand in Banking, 2015 U.S. Bank Innovation team named #2 for groups “shaping the future of banking”, 2015 U.S. Bank ties for top spot in Forrester Research, Inc.'s 2014 U.S. Mobile Banking Functionality Benchmark 31 U.S. BANCORP |
|
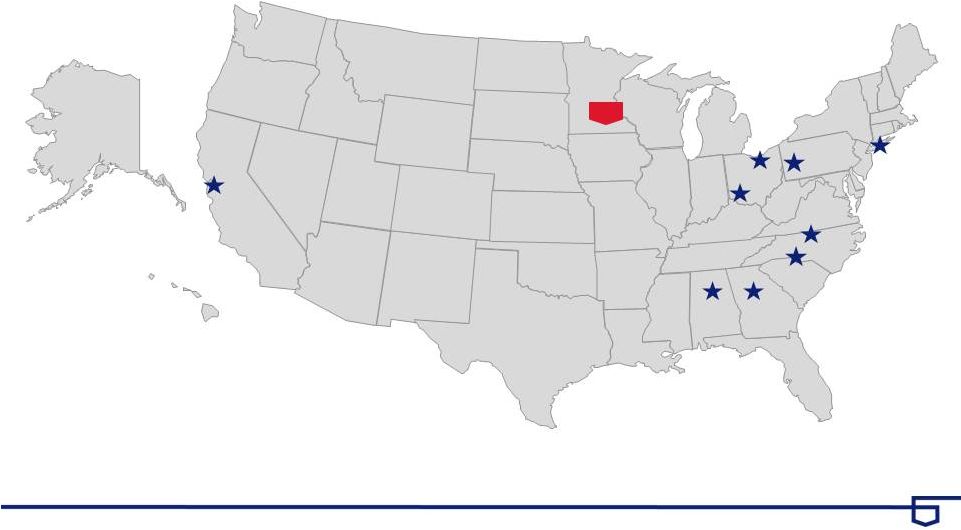
 Deposit
Growth Success •
Increased market share
#1 in 4 states Top 3 in 11 states Top 5 in 16 states Top 3 in 89 MSAs • Corporate Trust expansion through organic growth and acquisition Key Points Source: SNL Consumer and Small Business Banking 47% All Other 7% Corporate Trust 16% Wholesale Banking and Commercial Real Estate 30% 3Q15 Deposits By Business Line Change Average Balance ($B) 3Q10 3Q15 (Annualized) Noninterest-bearing 39.8 $ 80.9 $ 15.2% Total Savings 99.3 174.7 12.0% Low Cost Deposits 139.1 $ 255.6 $ 13.0% Time 43.6 34.1 -4.8% Total Deposits 182.7 $ 289.7 $ 9.7% 32 U.S. BANCORP |
|
 Agenda • Company Overview • Financial Management • Capital Management • Growth Strategies • Interest Rates • 4Q Update • Long-term Goals 33 U.S. BANCORP |
|
 • Loan Growth: 1-1.5% growth • Credit Quality: Modest increase in NCOs • Net Interest Margin: Relatively stable • Mortgage Fees: Lower 5-15% due to seasonality • Noninterest Expense: Expenses increasing vs. 3Q15 - seasonality 4Q15 Linked Quarter Update 4Q15 expense vs. 3Q15: • Seasonal increase in tax credit amortization: ~$70 - $75 million • Expected reduction in elevated 3Q15 expenses: ~$60 million • Early benefits from efficiency effort will mostly offset other expected seasonal expense increases in 4Q: Neutral 34 U.S. BANCORP |
|
 Agenda • Company Overview • Financial Management • Capital Management • Growth Strategies • Interest Rates • 4Q Update • Long-term Goals 35 U.S. BANCORP |
|
 Long-term Goals Long-term Goals • Optimal business line mix • Investments generating positive returns • Profitability: ROE 16-19% ROA 1.60-1.90% Efficiency Ratio low 50s • Capital distributions: Earnings distribution 60-80% Current Status Four simple and stable business lines Mortgage, wealth management, corporate banking, international payments, branch technology, internet and mobile channels, and select acquisitions 2014 Profitability: ROE 14.7% ROA 1.54% Efficiency Ratio 53.2% 2014 Capital distributions: Distributed 72% of earnings (dividends 31%, share repurchases 41%) 36 U.S. BANCORP |
|
 Appendix 37 U.S. BANCORP |
|
 Non-GAAP Financial Measures
Line of Business Financial Performance
Taxable-equivalent basis
$ in millions Revenue Line of Business Financial Performance 3Q15 YTD Wholesale Banking and Commercial Real Estate 2,187 $ Consumer and Small Business Banking 5,334 Wealth Management and Securities Services 1,370 Payment Services 3,911 Treasury and Corporate Support 2,293 Consolidated Company 15,095 Less Treasury and Corporate Support 2,293 Consolidated Company excluding Treasury and Corporate Support 12,802 $ Percent of Total Wholesale Banking and Commercial Real Estate 14% Consumer and Small Business Banking 36% Wealth Management and Securities Services 9% Payment Services 26% Treasury and Corporate Support 15% Total 100% Percent of Total excluding Treasury and Corporate Support Wholesale Banking and Commercial Real Estate 17% Consumer and Small Business Banking 42% Wealth Management and Securities Services 11% Payment Services 30% Total 100% 38 U.S. BANCORP |
|
 BancAnalysts Association
of Boston Conference |