Attached files
| file | filename |
|---|---|
| 8-K - FORM 8-K - NN INC | d27138d8k.htm |
| EX-99.3 - EX-99.3 - NN INC | d27138dex993.htm |
| EX-99.1 - EX-99.1 - NN INC | d27138dex991.htm |

Third Quarter 2015 Earnings Release November 4, 2015 Exhibit 99.2
Except for specific historical information, many of the matters discussed in this presentation may express or imply projections of revenues or expenditures, statements of plans and objectives or future operations or statements of future economic performance. These, and similar statements, are forward-looking statements concerning matters that involve risks, uncertainties and other factors which may cause the actual performance of NN, Inc. and its subsidiaries to differ materially from those expressed or implied by this discussion. All forward-looking information is provided by the Company pursuant to the safe harbor established under the Private Securities Litigation Reform Act of 1995 and should be evaluated in the context of these factors. Factors which could materially affect actual results include, but are not limited to: general economic conditions and economic conditions in the industrial sector, deterioration of or instability in the economy, the Company’s ability to integrate the recent acquisition of Precision Engineered Products Holdings, Inc. and achieve the anticipated benefits of that transaction, inventory levels, the Company’s compliance with applicable laws and regulations (including regulations relating to medical devices and the healthcare industry) and changes in applicable laws and regulations, regulatory compliance costs and the Company’s ability to manage these costs, start-up costs for new operations, the impact of debt obligations on operations and liquidity, competitive influences, risks that current customers will commence or increase captive production, risks of capacity underutilization, quality issues, availability and price of raw materials, currency and other risks associated with international trade, the Company’s dependence on certain major customers, and the successful implementation of the global growth plan including development of new products. Additional information regarding the factors that may cause actual results to differ materially from these forward-looking statements is available in the Company’s SEC filings, including its 2014 Annual Report on Form 10-K and Quarterly Report on Form 10-Q for the third quarter of 2015. These forward-looking statements speak only as of the date of this release, and the Company does not assume any obligation to update or revise any forward-looking statement, whether as a result of new information, future events and developments or otherwise. With respect to any non-GAAP financial measures included in the following presentation, the accompanying information required by SEC Regulation G can be found in the “Investor Relations” section of the Company’s web site, www.nninc.com, under the heading “News & Events” and subheading “Presentations.” In addition, in addressing various financial metrics the presentation describes certain of the more significant factors that impacted year-over-year performance. Please refer to the Company’s earnings release, Form 10-Q and the other related presentation materials supplementing today’s call for additional factors that impacted year-over-year performance, all of which are available in the “Investor Relations” section of the Company’s web site under the heading “News & Events” and subheading “Presentations.” Forward-Looking Statement and Non-GAAP Financial Information
3rd Quarter 2015
Highlights of 3rd Quarter 2015 Sales of $154.8M Acquisitions contributed $41.6M during the quarter Headwinds from Asia negatively impacted our Chinese, and European businesses in September CAFE related businesses continued to outperform Adjusted Earnings Per Share of $0.31 Includes the additional 7.6M shares raised in preparation for the PEP Acquisition Adjusted EBITDA of $25.5 million, up 46% compared to Q3 2014 Adjusted Operating Margin improved 140 bps year over year. Completed the acquisition of PEP to fill out our diversified end market strategy Foreign Currency impact for Q3: Net Sales impact of negative $7.8M compared to Q3 2014 Reduced EPS $0.02 due to translation effect
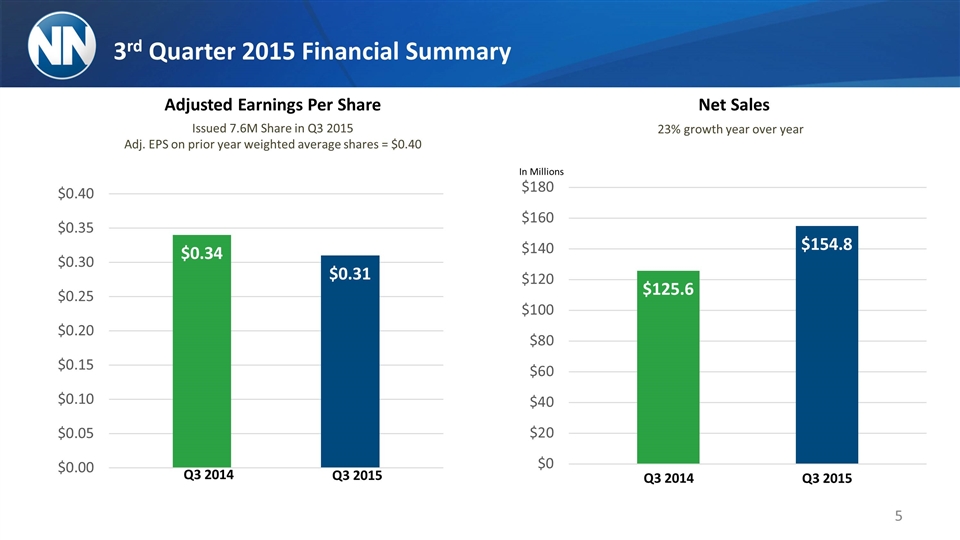
Q3 2014 Q3 2015 Adjusted Earnings Per Share Q3 2014 Q3 2015 Net Sales 23% growth year over year 3rd Quarter 2015 Financial Summary In Millions Issued 7.6M Share in Q3 2015 Adj. EPS on prior year weighted average shares = $0.40
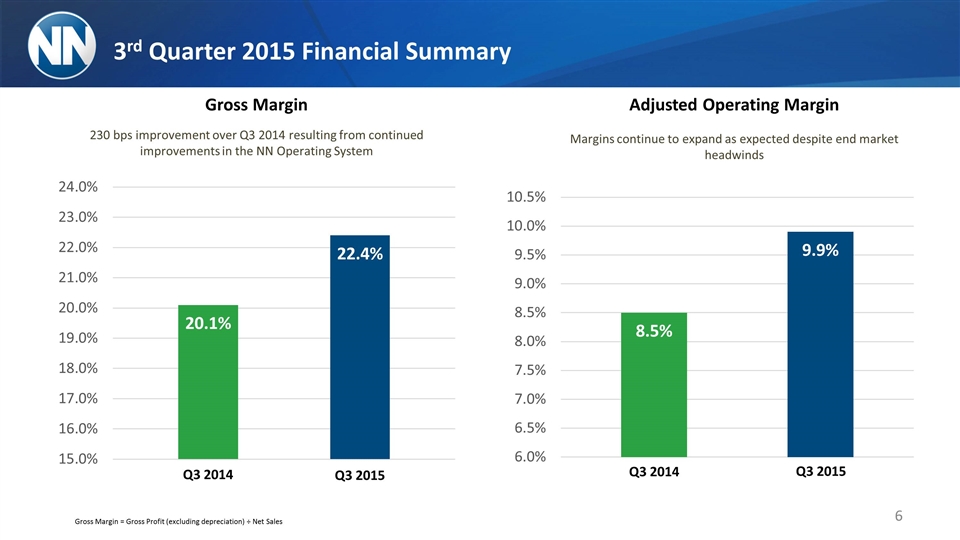
3rd Quarter 2015 Financial Summary Q3 2014 Q3 2015 Gross Margin Q3 2014 Q3 2015 Adjusted Operating Margin Margins continue to expand as expected despite end market headwinds 230 bps improvement over Q3 2014 resulting from continued improvements in the NN Operating System Gross Margin = Gross Profit (excluding depreciation) ÷ Net Sales
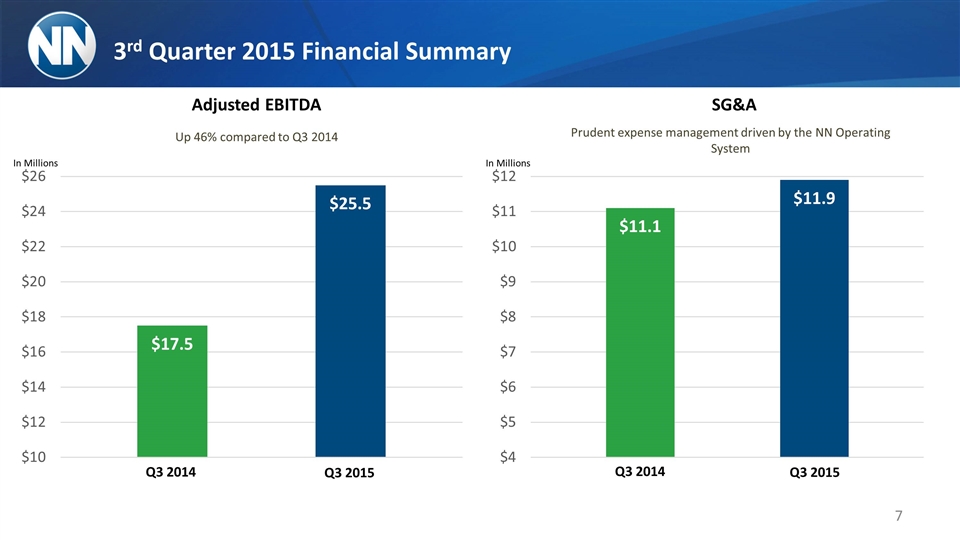
3rd Quarter 2015 Financial Summary Q3 2014 Q3 2015 Adjusted EBITDA Q3 2014 Q3 2015 SG&A Prudent expense management driven by the NN Operating System Up 46% compared to Q3 2014 In Millions In Millions
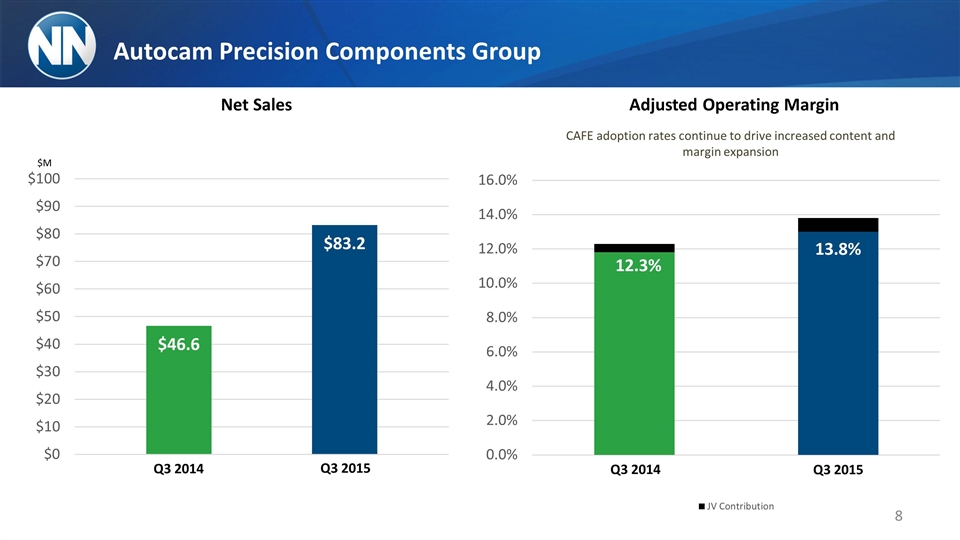
Autocam Precision Components Group Q3 2014 Q3 2015 Net Sales Q3 2014 Q3 2015 Adjusted Operating Margin CAFE adoption rates continue to drive increased content and margin expansion $M
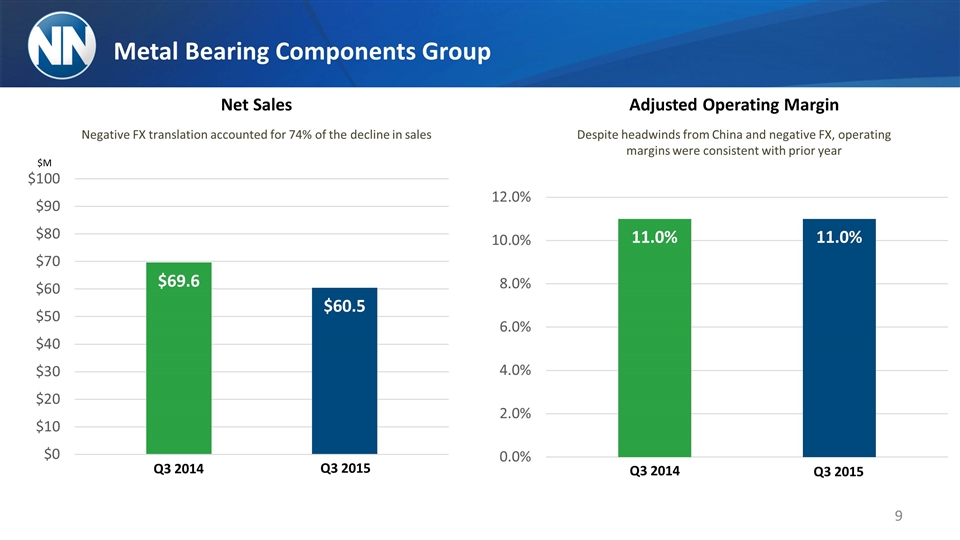
Metal Bearing Components Group Q3 2014 Q3 2015 Net Sales Adjusted Operating Margin Negative FX translation accounted for 74% of the decline in sales Q3 2014 Q3 2015 $M Despite headwinds from China and negative FX, operating margins were consistent with prior year
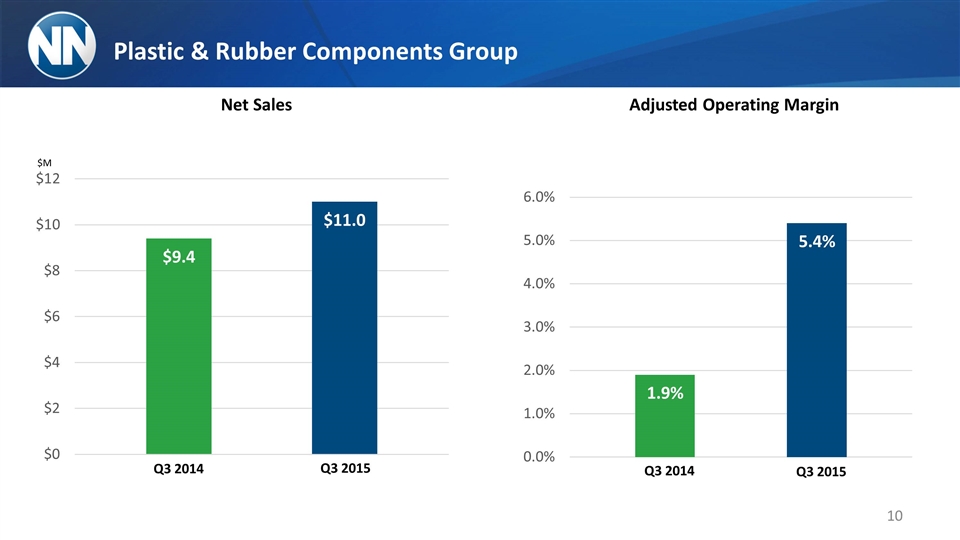
Plastic & Rubber Components Group Q3 2014 Q3 2015 Net Sales Adjusted Operating Margin Q3 2014 Q3 2015 $M
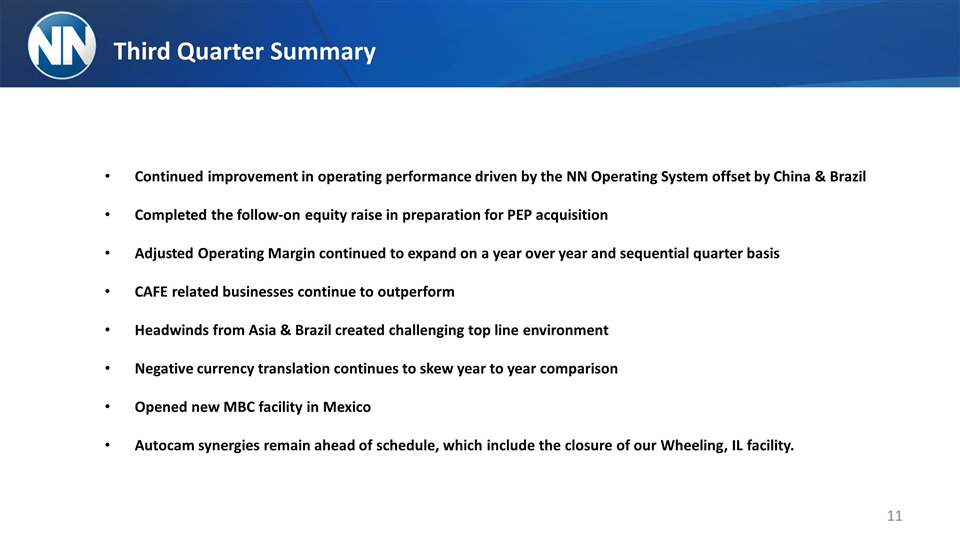
Third Quarter Summary Continued improvement in operating performance driven by the NN Operating System offset by China & Brazil Completed the follow-on equity raise in preparation for PEP acquisition Adjusted Operating Margin continued to expand on a year over year and sequential quarter basis CAFE related businesses continue to outperform Headwinds from Asia & Brazil created challenging top line environment Negative currency translation continues to skew year to year comparison Opened new MBC facility in Mexico Autocam synergies remain ahead of schedule, which include the closure of our Wheeling, IL facility.
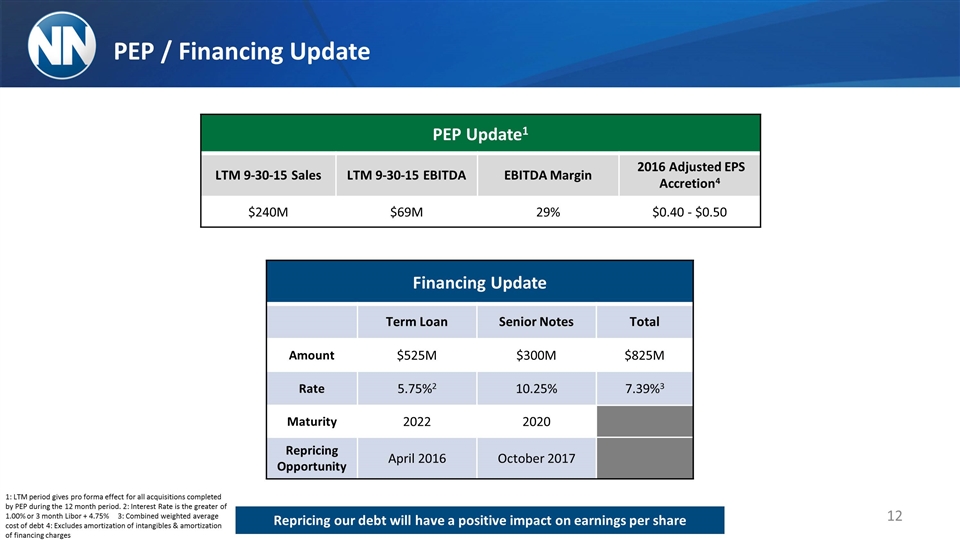
PEP / Financing Update Financing Update Term Loan Senior Notes Total Amount $525M $300M $825M Rate 5.75%2 10.25% 7.39%3 Maturity 2022 2020 Repricing Opportunity April 2016 October 2017 PEP Update1 LTM 9-30-15 Sales LTM 9-30-15 EBITDA EBITDA Margin 2016 Adjusted EPS Accretion4 $240M $69M 29% $0.40 - $0.50 1: LTM period gives pro forma effect for all acquisitions completed by PEP during the 12 month period. 2: Interest Rate is the greater of 1.00% or 3 month Libor + 4.75% 3: Combined weighted average cost of debt 4: Excludes amortization of intangibles & amortization of financing charges Repricing our debt will have a positive impact on earnings per share
Guidance
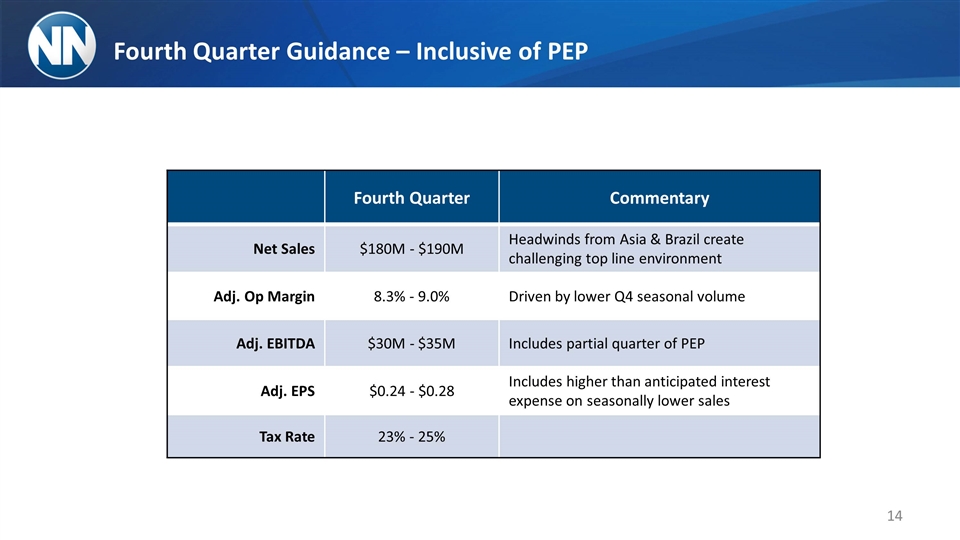
Fourth Quarter Guidance – Inclusive of PEP Fourth Quarter Commentary Net Sales $180M - $190M Headwinds from Asia & Brazil create challenging top line environment Adj. Op Margin 8.3% - 9.0% Driven by lower Q4 seasonal volume Adj. EBITDA $30M - $35M Includes partial quarter of PEP Adj. EPS $0.24 - $0.28 Includes higher than anticipated interest expense on seasonally lower sales Tax Rate 23% - 25%
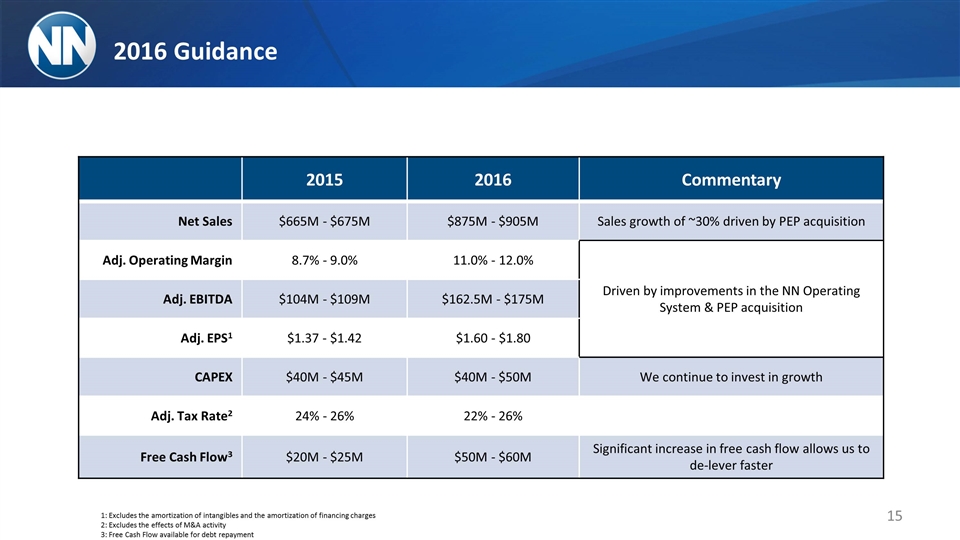
Give the Guidance 2015 2016 Commentary Net Sales $665M - $675M $875M - $905M Sales growth of ~30% driven by PEP acquisition Adj. Operating Margin 8.7% - 9.0% 11.0% - 12.0% Driven by improvements in the NN Operating System & PEP acquisition Adj. EBITDA $104M - $109M $162.5M - $175M Adj. EPS1 $1.37 - $1.42 $1.60 - $1.80 CAPEX $40M - $45M $40M - $50M We continue to invest in growth Adj. Tax Rate2 24% - 26% 22% - 26% Free Cash Flow3 $20M - $25M $50M - $60M Significant increase in free cash flow allows us to de-lever faster 2016 Guidance 1: Excludes the amortization of intangibles and the amortization of financing charges 2: Excludes the effects of M&A activity 3: Free Cash Flow available for debt repayment
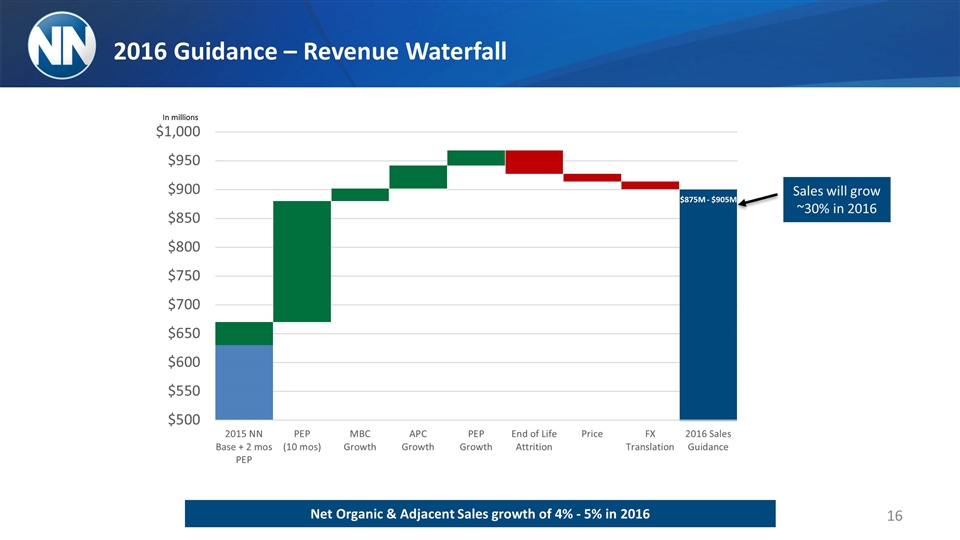
Net Organic & Adjacent Sales growth of 4% - 5% in 2016 2016 Guidance – Revenue Waterfall Sales will grow ~30% in 2016 $875M - $905M In millions
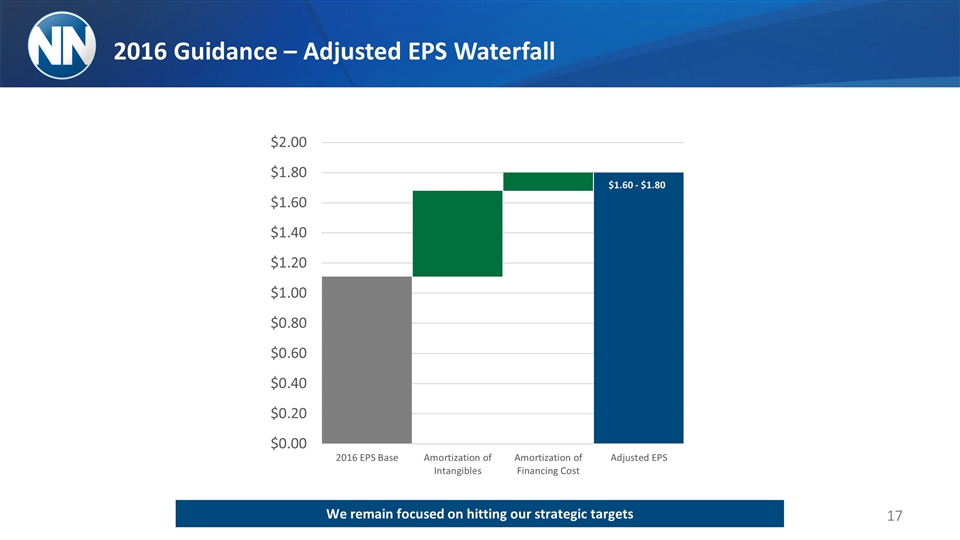
2016 Guidance – Adjusted EPS Waterfall $1.60 - $1.80 We remain focused on hitting our strategic targets
2016 Summary Sales growth of approximately 30% Strong organic and adjacent market growth of 10% - 11% Offset by 5% - 6% of attrition, price/mix and negative currency effects Adjusted earnings per share growth of 21% at midpoint of guidance 64% of our debt can be repriced in as short as 6 months Operating margin expansion of 2% - 3% Free cash flow triples, allowing us to deleverage faster

Third Quarter 2015 Earnings Release November 4, 2015
