Attached files
| file | filename |
|---|---|
| 8-K - 8-K - Globalstar, Inc. | gsat-20150930x8kxearningsr.htm |
| EX-99.2 - EXHIBIT 99.2 - Globalstar, Inc. | exhibit992young.htm |
| EX-99.1 - EXHIBIT 99.1 - Globalstar, Inc. | exhibit9913qearningsrelease.htm |

Earnings Call Presentation Third Quarter 2015 November 5, 2015

Safe Harbor Language 1 This presentation contains certain statements that are “forward-looking statements” within the meaning of the Private Securities Litigation Reform Act of 1995. These forward-looking statements are based on current expectations and assumptions that are subject to risks and uncertainties which may cause actual results to differ materially from the forward-looking statements. Forward-looking statements, such as the statements regarding our expectations with respect to actions by the FCC, future increases in our revenue and profitability and other statements contained in this presentation regarding matters that are not historical facts, involve predictions. Any forward-looking statements made in this presentation are accurate as of the date made and are not guarantees of future performance. Actual results or developments may differ materially from the expectations expressed or implied in the forward-looking statements, and we undertake no obligation to update any such statements. Additional information on factors that could influence our financial results is included in our filings with the Securities and Exchange Commission, including our Annual Report on Form 10-K, Quarterly Reports on Form 10-Q and Current Reports on Form 8-K.

2 Chicago Testing Conclusions Overview TLPS provides significant overall capacity gains and materially increases the throughput experienced by all users of the network: ‒ As an increasing number of users are moved to Channel 14, congestion is eased on Channels 1, 6 and 11 ‒ This allows for a significant improvement in the user experience for both (i) users remaining on existing Wi-Fi Channels, and (ii) users moving to Channel 14 ‒ As presented, if 3 users out of a network of 12 clients are moved to Channel 14, the average throughput experienced by each user increases 56%. Moving an additional 3 users provides a 92% increase to average throughput across all 12 clients using the 4 Channels. ‒ The uncongested nature of Channel 14 allows it to handle a load comparable to that of Channels 1, 6 and 11 combined TLPS is compatible with existing 2.4 GHz unlicensed operations: ‒ No harmful interference or compatibility issues identified with existing Wi-Fi operations ‒ No incremental interference from Channel 14 operations on Channel 11 compared to Channel 6 operations on Channel 11 ‒ No perceptible impact on Channel 11 streaming video (e.g., Skype, Hulu, YouTube) or on Bluetooth Standard and Low Energy devices

3 Chicago Testing: Downlink Average Throughput Per Device Test results: Uncongested nature of TLPS allows it to handle a load comparable to that of Channels 1, 6 and 11 combined Avg. Throughput Per Device on Channels 1, 6, 11 Avg. Throughput Per Device on Channel 14 Network Average Overall Step 1 Step 2 Step 3 Step 2 Step 3 Step 1 Step 2 Step 3 (Mbps) (Mbps) (Mbps) +9.1% +89.5% +181.2% +94.6% +56.1% +92.0% 5.7 6.3 10.9 - 6.0 12.0 18.0 Baseline 9 on Ch. 1-6-11, 3 on Ch. 14 6 on Ch. 1-6-11, 6 on Ch. 14 16.1 11.2 - 6.0 12.0 18.0 3 on Ch. 14, 9 on Ch. 1-6-11 6 on Ch. 14, 6 on Ch. 1-6-11 5.7 9.0 11.0 - 6.0 12.0 18.0 Baseline 9 on Ch. 1-6-11, 3 on Ch. 14 6 on Ch. 1-6-11, 6 on Ch. 14 Establish baseline for average device throughput on Channels 1, 6 and 11 (4 devices in each Channel) – no devices on Channel 14 Step 1 Move 3 devices to Channel 14 such that there are 3 devices in each of Channels 1, 6, 11 and 14 Step 2 Move 6 devices total to Channel 14 such that there are 2 devices in each of 1, 6 and 11 and 6 in 14 Step 3

4 Spectrogram of 2.4 GHz Band As shown below in the spectrogram from the March 2015 demonstration, there is an energy gulf between Channel 14 and Channel 11 Channel 1 Channel 6 Channel 11 Channel 14

5 NOS: Managed TLPS Solution Authentication Server Customer Data Center Internet ① User associates to the TLPS AP. ② All device MAC addresses are checked on the ViaSat and Customer Authentication Servers, to match the device identity to an existing account. ③ Existing/known user authenticates against ViaSat and Customer Authentication Server and is passed through with no login page. ④ Login Page is presented to the new/unknown/expired devices to purchase subscription or enter valid customer credentials. ⑤ After successful authentication, the user is let through the ViaSat gateway, onto the Internet. Login Page 2 1 5 New/Unknown or Expired User ViaSat Gateway All Users Authentication Server Login Page Server ViaSat Datacenter ViaSat Support 7 TLPS AP All Users 3 4 2 3 2 3 New/Unknown or Expired User User w/ Authenticated Session ViaSat Access 7 ⑥ If TLPS is suspected of causing harmful interference to adjacent or co-channel licensed or unlicensed services, then ViaSat Support can be notified via hotline. TLPS APs within likely Interference Zone, if any, are identified. ⑦ ViaSat Support may determine whether TLPS APs within the likely Interference Zone are operating pursuant to specifications and/or may remotely modify emission characteristics of those TLPS APs. Depending upon nature of reported interference, modifications may include (a) reduction in ERP, (b) migration to public Channel, or (c) deactivation. 6 Firewall Firewall Interference Report From Adjacent or Co- Channel Service Switch Authentication Interference Remediation

6 TLPS Interference Remediation ViaSat Support 7 6 Interference Report From Adjacent or Co- Channel Service TLPS AP Geographic Database Solution Model Network Controller TLPS APs Interference Zone A B C D E F A. Adjacent or co-channel operator reports suspected TLPS interference via web or telephone hotline. B. ViaSat Support Center compares interference complaint with TLPS geographic database to establish potential Interference Zone and determine whether any active TLPS APs are present within that Zone. C. ViaSat Support Center determines whether TLPS APs within potential Interference Zone are operating pursuant to specifications and network plan and, if necessary, assembled data is applied to interference solution model. D. ViaSat support evaluates solution for execution and sends remedial commands to TLPS APs within the Interference Zone. E. TLPS APs within the Interference Zone operate with modified emissions characteristics to minimize or eliminate claimed interference. F. ViaSat Support Center confirms successful implementation of remedial commands with adjacent or co-channel operator. Determination and Remediation of Claimed Harmful Interference to Licensed or Unlicensed Services
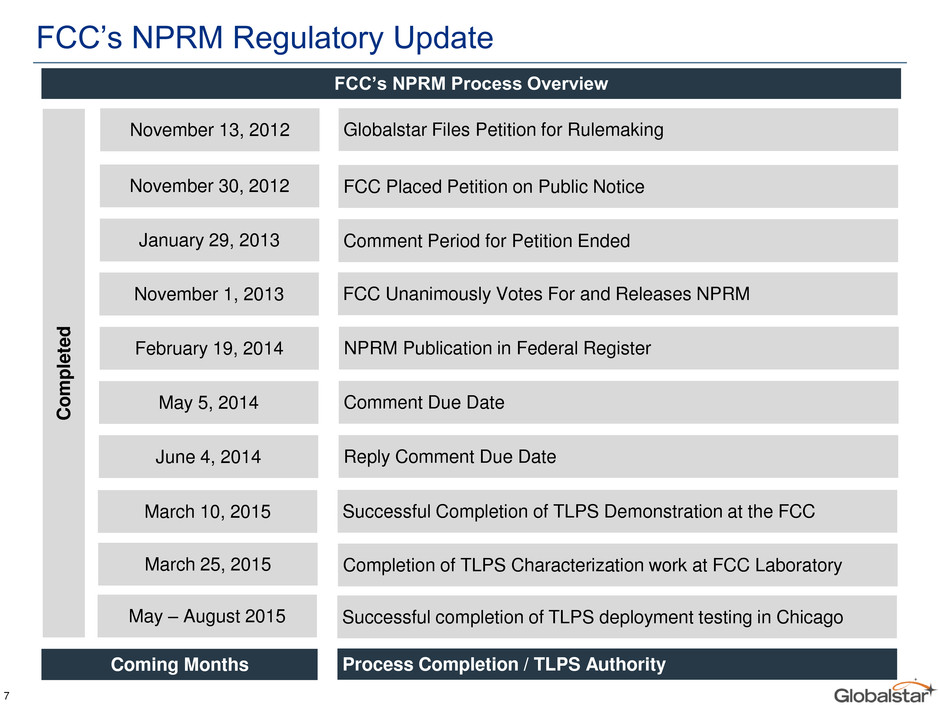
FCC’s NPRM Regulatory Update 7 November 13, 2012 Globalstar Files Petition for Rulemaking November 30, 2012 FCC Placed Petition on Public Notice November 1, 2013 FCC Unanimously Votes For and Releases NPRM February 19, 2014 NPRM Publication in Federal Register May 5, 2014 Comment Due Date June 4, 2014 Reply Comment Due Date Coming Months Process Completion / TLPS Authority C o m p lete d March 10, 2015 Successful Completion of TLPS Demonstration at the FCC January 29, 2013 Comment Period for Petition Ended FCC’s NPRM Process Overview March 25, 2015 Completion of TLPS Characterization work at FCC Laboratory May – August 2015 Successful completion of TLPS deployment testing in Chicago
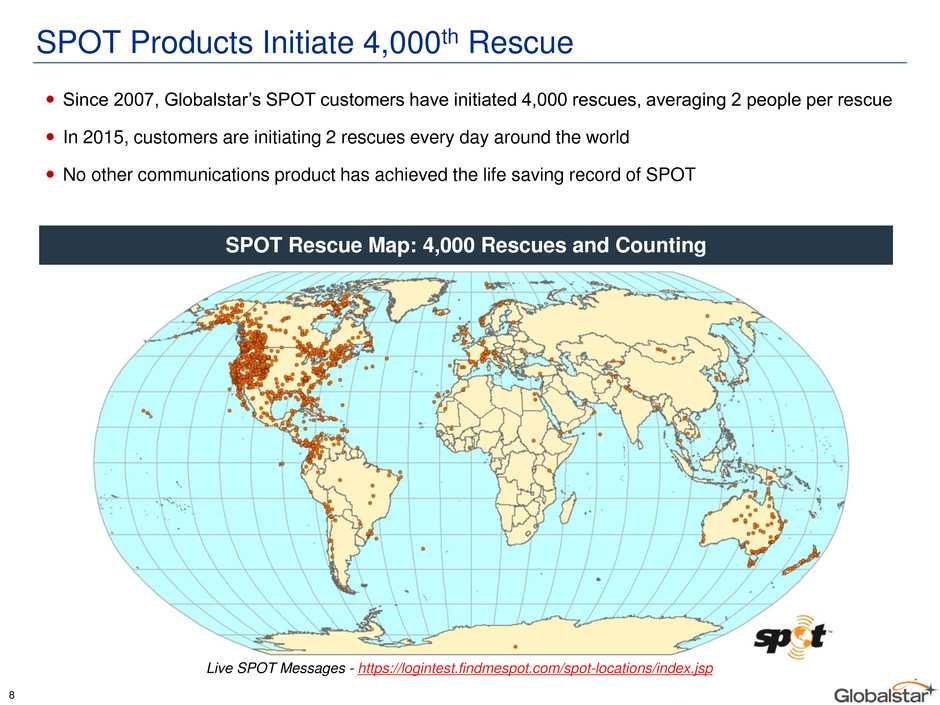
SPOT Products Initiate 4,000th Rescue Since 2007, Globalstar’s SPOT customers have initiated 4,000 rescues, averaging 2 people per rescue In 2015, customers are initiating 2 rescues every day around the world No other communications product has achieved the life saving record of SPOT SPOT Rescue Map: 4,000 Rescues and Counting Live SPOT Messages - https://logintest.findmespot.com/spot-locations/index.jsp 8

Second-Generation Ground Rollout – On Track Initial Deliveries North American Installations Rest of the World Installations Complete 2015 2016 Second-Generation Rollout Schedule Summary Successfully completed RAN installations at all North American and French gateways – final acceptance testing completed last month RAN installations at gateways in Brazil on schedule for early 2016 – over-the- air testing planned to complete mid-2016 Ground System Update Initiated final configuration acceptance testing – expected completion end of November 2015. Final production acceptance testing to be complete in December 2015. Core network equipment successfully installed at High River gateway in Canada – site acceptance to be complete in January 2016 Hardware at North American gateways expected to be completed by January 2016 Europe and Brazil expected to be completed by mid-2016 Core Network Update 9 Increased data speeds Gateway diversity Smaller, feature rich products Enhanced capacity

Satellite Product Evolution and New Products Existing / Legacy Product Line New Products: Second-Generation Simplex Duplex GSP 1600 GSP 1700 Commercial Sat-Fi Second-Generation Sat-Fi Satellite Transmitter Unit STX2 STX3 Second-Generation Simplex SPOT SPOT Personal Tracker SPOT 2 SPOT 3 Inexpensive product that turns any Wi-Fi enabled device into a satellite phone Targets mass market consumers First-of-its-kind, small bit data device Provides command and control functionality Second-Generation SPOT Enhanced data communication device with faster speeds vs. First-Generation devices – targeted towards mass market consumers Tracking and texting capabilities for emergency and off-the-grid communications 10

Second-Generation Sat-Fi Capabilities Wi-Fi 11 Low-priced Hughes-based mass market product that connects any Wi-Fi enabled device to Globalstar’s satellite network for full data services beyond the range of cellular networks, targeting 2/3rds of the planet beyond terrestrial coverage Dimensions – 3” x 4.5” x 1.3” Provides inexpensive satellite capability for people who live, work, play or travel outside terrestrial network Promotes constant data connectivity in and out of cellular range Data speeds up to 256 kbps – 25x of first-generation system Leverages near-infinitely expandable capacity of Globalstar’s satellite network for off-the-grid uses Key Product Features and Benefits Second-Generation Sat-Fi Capacity Assessment Item Value No. of Second-Generation Satellites 24 Total data minutes supported per day > 10 million Total number of SMS / text messages per day > 20 billion Second-Generation Sat-Fi Satellite communications device which turns any smartphone, laptop or tablet into a satellite phone / global data device

80% 20% 83% 17% 63% 37% 77% 23% Global Subscriber Composition 12 Note: Duplex composition for prior period excludes the deactivation of certain subscribers across Latin America during Q3 2015. Expanding focus from primarily North American markets to other regions including Latin America, Europe and Africa Two-way Duplex One-way SPOT and Simplex Gross Subscriber Additions Composition End of Period Subscriber Composition LTM Q3 2014 LTM Q3 2015 Q3 2014 Q3 2015 84% 16% 70% 30% 85% 15% 81% 19% LTM Q3 2014 LTM Q3 2015 Q3 2014 Q3 2015 North America Non North America
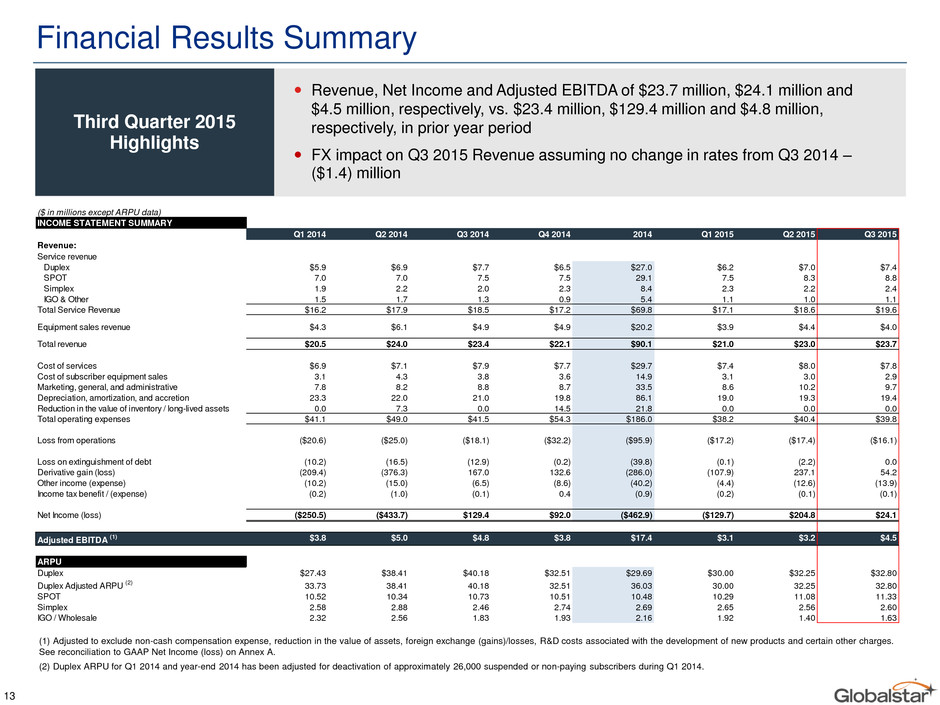
Financial Results Summary (1) Adjusted to exclude non-cash compensation expense, reduction in the value of assets, foreign exchange (gains)/losses, R&D costs associated with the development of new products and certain other charges. See reconciliation to GAAP Net Income (loss) on Annex A. (2) Duplex ARPU for Q1 2014 and year-end 2014 has been adjusted for deactivation of approximately 26,000 suspended or non-paying subscribers during Q1 2014. 13 Revenue, Net Income and Adjusted EBITDA of $23.7 million, $24.1 million and $4.5 million, respectively, vs. $23.4 million, $129.4 million and $4.8 million, respectively, in prior year period FX impact on Q3 2015 Revenue assuming no change in rates from Q3 2014 – ($1.4) million Third Quarter 2015 Highlights ($ in millions except ARPU data) INCOME STATEMENT SUMMARY Q1 2014 Q2 2014 Q3 2014 Q4 2014 2014 Q1 2015 Q2 2015 Q3 2015 Revenue: Service revenue Duplex $5.9 $6.9 $7.7 $6.5 $27.0 $6.2 $7.0 $7.4 SPOT 7.0 7.0 7.5 7.5 29.1 7.5 8.3 8.8 Simplex 1.9 2.2 2.0 2.3 8.4 2.3 2.2 2.4 IGO & Other 1.5 1.7 1.3 0.9 5.4 1.1 1.0 1.1 Total Service Revenue $16.2 $17.9 $18.5 $17.2 $69.8 $17.1 $18.6 $19.6 Equipment sales revenue $4.3 $6.1 $4.9 $4.9 $20.2 $3.9 $4.4 $4.0 Total revenue $20.5 $24.0 $23.4 $22.1 $90.1 $21.0 $23.0 $23.7 Cost of services $6.9 $7.1 $7.9 $7.7 $29.7 $7.4 $8.0 $7.8 Cost of subscriber equipment sales 3.1 4.3 3.8 3.6 14.9 3.1 3.0 2.9 Marketing, general, and administrative 7.8 8.2 8.8 8.7 33.5 8.6 10.2 9.7 Depreciation, amortization, and accretion 23.3 22.0 21.0 19.8 86.1 19.0 19.3 19.4 Reduction in the value of inventory / long-lived assets 0.0 7.3 0.0 14.5 21.8 0.0 0.0 0.0 Total operating expenses $41.1 $49.0 $41.5 $54.3 $186.0 $38.2 $40.4 $39.8 Loss from operations ($20.6) ($25.0) ($18.1) ($32.2) ($95.9) ($17.2) ($17.4) ($16.1) Loss on extinguishment of debt (10.2) (16.5) (12.9) (0.2) (39.8) (0.1) (2.2) 0.0 Derivative gain (loss) (209.4) (376.3) 167.0 132.6 (286.0) (107.9) 237.1 54.2 Other income (expense) (10.2) (15.0) (6.5) (8.6) (40.2) (4.4) (12.6) (13.9) Income tax benefit / (expense) (0.2) (1.0) (0.1) 0.4 (0.9) (0.2) (0.1) (0.1) Net Income (loss) ($250.5) ($433.7) $129.4 $92.0 ($462.9) ($129.7) $204.8 $24.1 Adjusted EBITDA (1) $3.8 $5.0 $4.8 $3.8 $17.4 $3.1 $3.2 $4.5 ARPU Duplex $27.43 $38.41 $40.18 $32.51 $29.69 $30.00 $32.25 $32.80 Duplex Adjusted ARPU (2) 33.73 38.41 40.18 32.51 36.03 30.00 32.25 32.80 SPOT 10.52 10.34 10.73 10.51 10.48 10.29 11.08 11.33 Simplex 2.58 2.88 2.46 2.74 2.69 2.65 2.56 2.60 IGO / Wholesale 2.32 2.56 1.83 1.93 2.16 1.92 1.40 1.63
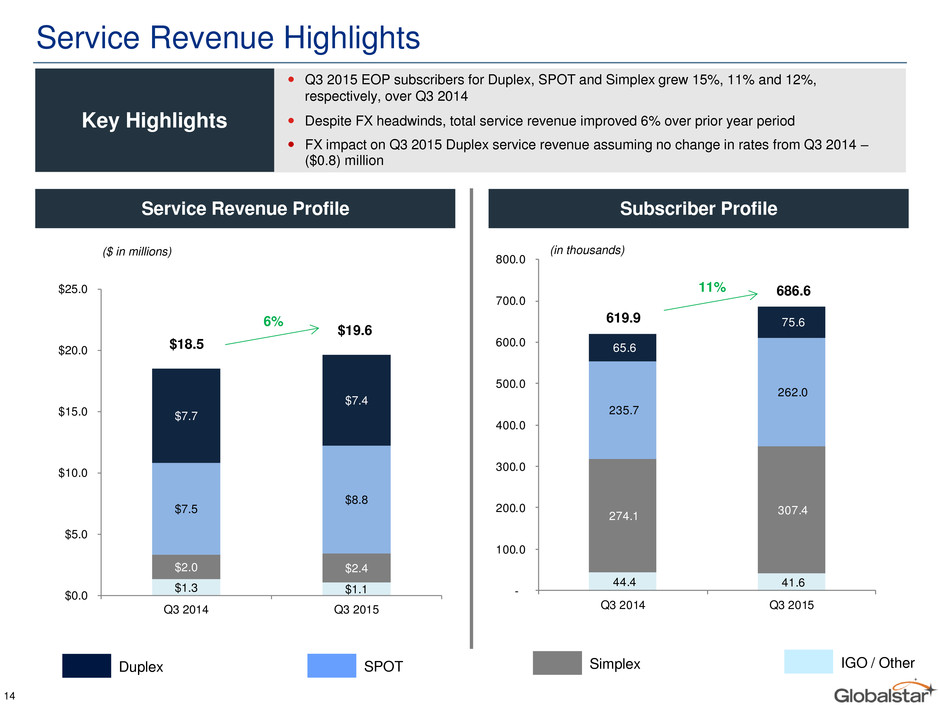
44.4 41.6 274.1 307.4 235.7 262.0 65.6 75.6 - 100.0 200.0 300.0 400.0 500.0 600.0 700.0 800.0 Q3 2014 Q3 2015 $1.3 $1.1 $2.0 $2.4 $7.5 $8.8 $7.7 $7.4 $0.0 $5.0 $10.0 $15.0 $20.0 $25.0 Q3 2014 Q3 2015 Service Revenue Highlights 14 Duplex SPOT Simplex IGO / Other ($ in millions) (in thousands) $18.5 $19.6 619.9 686.6 Service Revenue Profile Subscriber Profile 6% 11% Q3 2015 EOP subscribers for Duplex, SPOT and Simplex grew 15%, 11% and 12%, respectively, over Q3 2014 Despite FX headwinds, total service revenue improved 6% over prior year period FX impact on Q3 2015 Duplex service revenue assuming no change in rates from Q3 2014 – ($0.8) million Key Highlights
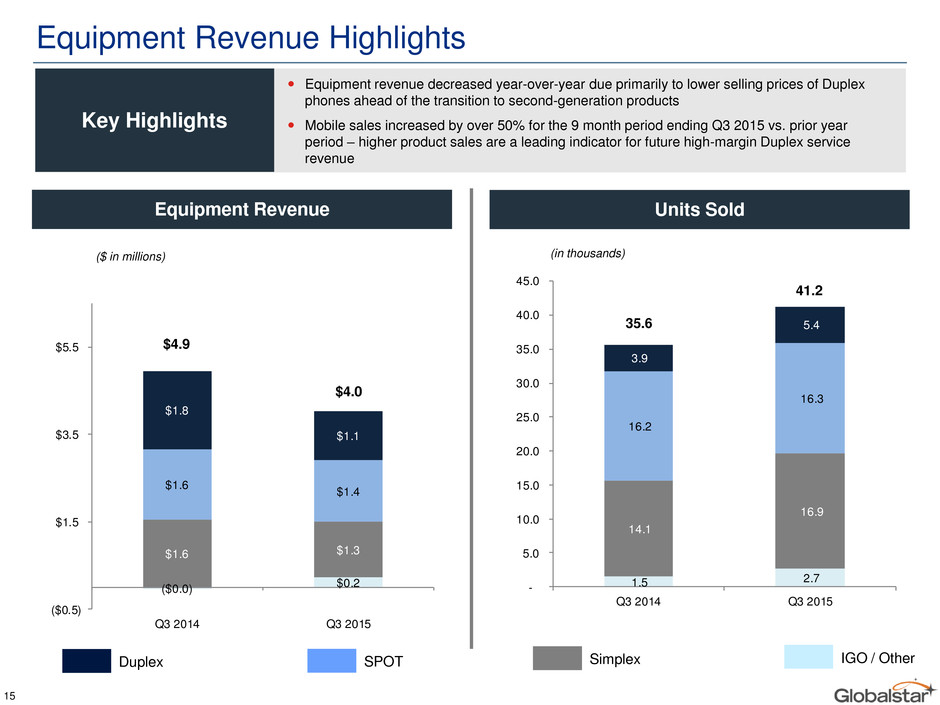
1.5 2.7 14.1 16.9 16.2 16.3 3.9 5.4 - 5.0 10.0 15.0 20.0 25.0 30.0 35.0 40.0 45.0 Q3 2014 Q3 2015 ($0.0) $0.2 $1.6 $1.3 $1.6 $1.4 $1.8 $1.1 ($0.5) $1.5 $3.5 $5.5 Q3 2014 Q3 2015 Equipment Revenue Highlights 15 Duplex SPOT Simplex IGO / Other Equipment revenue decreased year-over-year due primarily to lower selling prices of Duplex phones ahead of the transition to second-generation products Mobile sales increased by over 50% for the 9 month period ending Q3 2015 vs. prior year period – higher product sales are a leading indicator for future high-margin Duplex service revenue Key Highlights 41.2 (in thousands) 35.6 Units Sold ($ in millions) $4.0 $4.9 Equipment Revenue
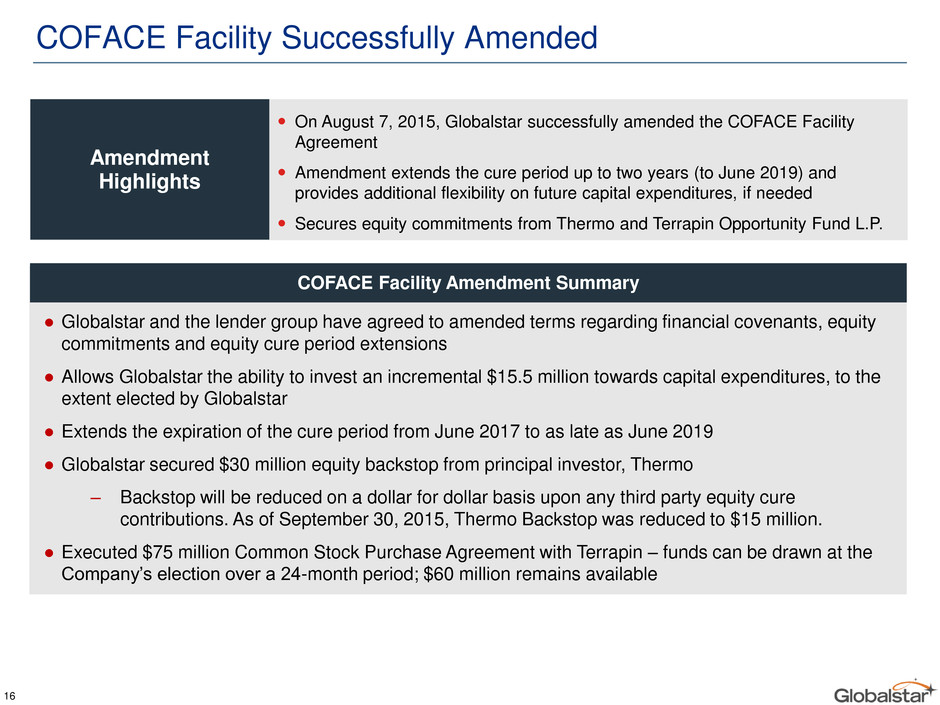
COFACE Facility Successfully Amended 16 On August 7, 2015, Globalstar successfully amended the COFACE Facility Agreement Amendment extends the cure period up to two years (to June 2019) and provides additional flexibility on future capital expenditures, if needed Secures equity commitments from Thermo and Terrapin Opportunity Fund L.P. ● Globalstar and the lender group have agreed to amended terms regarding financial covenants, equity commitments and equity cure period extensions ● Allows Globalstar the ability to invest an incremental $15.5 million towards capital expenditures, to the extent elected by Globalstar ● Extends the expiration of the cure period from June 2017 to as late as June 2019 ● Globalstar secured $30 million equity backstop from principal investor, Thermo ‒ Backstop will be reduced on a dollar for dollar basis upon any third party equity cure contributions. As of September 30, 2015, Thermo Backstop was reduced to $15 million. ● Executed $75 million Common Stock Purchase Agreement with Terrapin – funds can be drawn at the Company’s election over a 24-month period; $60 million remains available Amendment Highlights COFACE Facility Amendment Summary

Liquidity Review Liquidity and Capital Sources (1) Cash & Cash Eq. Common Stock Purchase Agreement with Terrapin Debt Service Reserve Account Total Liquidity Unrestricted Liquidity $28.0 $60.0 $37.9 $125.9 $88.0 ($ in millions) (1) This schedule excludes cash flow from operations 17

Key Value Drivers 18 Diverse product and service offerings across consumer, commercial and government markets New product offerings – Second-Generation Sat-Fi, Simplex and SPOT devices Operational focus materially expanded to include new territories, such as Latin America and Southern Africa Second-Generation upgrades materially improve data speeds and applications Significant reduction in product cost – ability to develop low-cost products for the mass consumer Materially improves call quality with built-in redundancies Expecting 2.4 GHz terrestrial authority in coming months Unique globally harmonized position Opportunity to deploy terrestrial services including TLPS after U.S. approval – leverages worldwide 802.11 standards Core MSS Operations Second-Generation Upgrades Spectrum

Annex A – Reconciliation of Adjusted EBITDA 19 ($ in millions) Q1 2014 Q2 2014 Q3 2014 Q4 2014 2014 Q1 2015 Q2 2015 Q3 2015 Net Income (loss) ($250.5) ($433.7) $129.4 $92.0 ($462.9) ($129.7) $204.8 $24.1 Interest income and expense, net 10.9 13.9 9.1 9.4 43.2 8.5 9.2 9.0 Derivative (gain) loss 209.4 376.3 (167.0) (132.6) 286.0 107.9 (237.1) (54.2) Income tax expense (benefit) 0.2 1.0 0.1 (0.4) 0.9 0.2 0.1 0.1 Depreciation, amortization, and accretion 23.3 22.0 21.0 19.8 86.1 19.0 19.3 19.4 EBITDA ($6.7) ($20.6) ($7.4) ($11.8) ($46.6) $5.9 ($3.7) ($1.5) Reduction in the value of long-lived assets & inventory $0.0 $7.3 $0.0 $14.5 $21.8 $0.0 $0.0 $0.0 Non-cash compensation 0.8 0.6 1.3 1.2 3.9 1.0 0.8 0.7 Research and development 0.1 0.1 0.1 0.2 0.5 0.3 0.5 0.5 Foreign exchange and other (income) / expense (0.7) 0.3 (2.6) (0.8) (3.8) (4.1) 0.5 2.0 Loss on extinguishment of debt 10.2 16.5 12.9 0.2 39.8 0.1 2.2 0.0 Non-cash adjustment related to international operations 0.0 0.0 0.0 0.4 0.4 0.0 0.0 0.0 Write-off of deferred financing costs 0.2 0.0 0.0 0.0 0.2 0.0 0.0 0.0 Loss on equity issuance 0.0 0.7 0.0 0.0 0.7 0.0 2.9 2.9 Brazil litigation expense accrual 0.0 0.0 0.4 0.0 0.4 0.0 0.0 0.0 Adjusted EBITDA $3.8 $5.0 $4.8 $3.8 $17.4 $3.1 $3.2 $4.5
