Attached files
| file | filename |
|---|---|
| 8-K - 8-K - Bankrate, Inc. | rate-20151105x8k.htm |
| EX-99.1 - EX-99.1 - Bankrate, Inc. | rate-20151105ex991c1b731.htm |
| EX-10.1 - EX-10.1 - Bankrate, Inc. | rate-20151105ex10196aa9a.htm |
 Bankrate, Inc. Bankrate, Inc. (NYSE:RATE) Q3 2015 Earnings Call November 2015 This document is not intended as a full business or financial review and should be viewed in the context of all of the information made available by us in our filings with the Securities and Exchange Commission (“SEC”). To the extent there is any discrepancy between this document and the content of our SEC filings, the SEC filings are the authoritative sources of information. Cautionary Statement Regarding Forward-Looking Information Certain matters included in this document may be “forward-looking statements” which involve risks and uncertainties. Those statements include statements regarding the intent, belief or current expectations of the Company and members of our management team. Such forward-looking statements include, without limitation, statements made with respect to future revenue, revenue growth, market acceptance of our products, our strategy and profitability. Investors and prospective investors are cautioned that any such forward-looking statements are not guarantees of future performance and involve risks and uncertainties, and that actual results may differ materially from those contemplated by such forward-looking statements. We derive many of our forward-looking statements from our operating budgets and forecasts, which are based upon many detailed assumptions. While we believe that our assumptions are reasonable, we caution that it is very difficult to predict the impact of known or unknown factors, and it is impossible for us to anticipate all factors that could affect our actual results. Important factors currently known to management that could cause actual results to differ materially from those in forward-looking statements include the following: the timing and outcome of, including potential expense associated with, and the potential impact on our business and stock price of any announcements regarding, the Department of Justice’s (DOJ's) investigation relating to our financial reporting during 2012; the previously identified material weakness in our internal controls over financial reporting and our ability to rectify this issue completely and promptly; the risk that a condition to closing of the Insurance business sale transaction may not be satisfied, including without limitation antitrust regulatory approval; other risks to consummation of the Insurance business sale transaction, including the risk that the transaction will not be consummated within the expected time period; the uncertainty with respect to if and when the deferred portion of the purchase price in the Insurance business sale transaction will be paid; the effects of disruption from the Insurance business sale transaction making it more difficult to maintain relationships with employees, customers, suppliers and other business partners; risks relating to the defense or litigation of lawsuits, including the putative securities class action lawsuit currently pending and described in our SEC filings, and governmental proceedings; the timing and outcome of (including potential expense associated with), and the potential impact on our business and stock price of any announcements regarding, the Consumer Financial Protection Bureau (CFPB) investigation described in our SEC filings; the willingness or interest of banks, lenders, brokers, credit card issuers, insurance carriers and agents, senior care providers and other advertisers in the business verticals in which we operate to advertise on our websites or mobile applications, or purchase our leads, clicks, calls and referrals; the rate of conversion of consumers’ visits to our websites or mobile applications into senior care referrals and the rate at which those referrals result in move-ins with our senior care customers; changes in application approval rates by our credit card issuer customers; increased competition and its effect on our website traffic, advertising rates, margins, and market share; our dependence on internet search engines to attract a significant portion of the visitors to our websites; our dependence on traffic from our partners to produce a significant portion of the company’s revenue; shift of visitors from desktop to mobile and mobile app environments; the number of consumers seeking information about the financial and senior care products we have on our websites or mobile applications; interest rate volatility; technological changes; and our ability to adapt to new or evolving technologies that affect our business environment or operations; our ability to anticipate and manage cybersecurity risk and data security risk and to mitigate and resolve issues that may arise; the effects of any security breach, data breach or any cyberattack on our systems, websites or mobile applications; our ability to manage traffic on our websites or mobile applications, and service interruptions; our ability to maintain and develop our brands and content; the fluctuations of our results of operations from period to period; our indebtedness and the effect such indebtedness may have on our business; our need and our ability to obtain or incur additional debt or equity financing; our ability to integrate the operations and realize the expected benefits of businesses that we have acquired and may acquire in the future; the effect of unexpected liabilities we assume from our acquisitions; the effect of programmatic advertising platforms on our display revenue; our ability to successfully execute on our strategies, including without limitation our insurance quality initiative, our mobile strategy and other initiatives, and the effectiveness of our strategies, including without limitation whether they result in increased revenue or profitability; our ability to attract and retain executive officers and personnel; any failure or refusal by our insurance providers to provide coverage under our insurance policies; our ability to protect our intellectual property; the effects of potential liability for content on our websites or mobile applications; our ability to establish and maintain distribution arrangements; our ability to maintain good working relationships with our customers and third-party providers and to continue to attract new customers; the effect of our operations in the United Kingdom and possible expansion to other international markets, in which we may have limited experience, and our ability to successfully execute on our business strategies in international markets; our ability to sell our operations in China in excess of its book value; the willingness of consumers to accept the Internet and our online network as a medium for obtaining financial product information; the strength of the U.S. economy in general and the financial services industry in particular; changes in monetary and fiscal policies of the U.S. government; changes in consumer spending and saving habits; review of our business and operations by regulatory authorities; changes in the legal and regulatory environment; changes in accounting principles, policies, practices or guidelines; risks relating to the ongoing reviews of our business and operations by regulatory authorities; and our ability to manage the risks involved in the foregoing. For more information about factors that could cause actual results to differ materially from our expectations, refer to our reports filed with the Securities and Exchange Commission, including the discussion without limitation under “Risk Factors” in our Annual Report on Form 10-K for the year ended December 31, 2014 along with any modifications or updates to those “Risk Factors” in our Quarterly Reports on Form 10-Q. These documents are available on the SEC’s website at www.sec.gov. Any factor described above or in our SEC reports could, by itself or together with one or more other factors, adversely affect our financial results and condition. We caution you that the foregoing list of important factors may not contain all of the material factors that are important to you. We undertake no obligation to publicly update or revise any forward-looking statements as a result of new information, future events or otherwise, except as otherwise required by law. Non-GAAP Measures To supplement Bankrate’s financial statements presented in accordance with generally accepted accounting principles (“GAAP”), Bankrate uses non-GAAP measures of certain components of financial performance, including EBITDA, Adjusted EBITDA and Adjusted EPS, which are adjusted from results based on GAAP to exclude certain expenses, gains and losses. These non-GAAP measures are provided to enhance investors’ overall understanding of Bankrate’s current financial performance and its prospects for the future. Specifically, Bankrate believes the non-GAAP results provide useful information to both management and investors by excluding certain expenses, gains and losses that may not be indicative of its core operating results. In addition, because Bankrate has historically reported certain non-GAAP results to investors, Bankrate believes the inclusion of non-GAAP measures provides consistency in its financial reporting. These measures should be considered in addition to results prepared in accordance with GAAP, but should not be considered a substitute for, or superior to, GAAP results. The non-GAAP measures included in this document have been reconciled to the nearest GAAP measure in the financial tables found in the “Supplemental Information” section of this document. FORWARD-LOOKING STATEMENTS 2
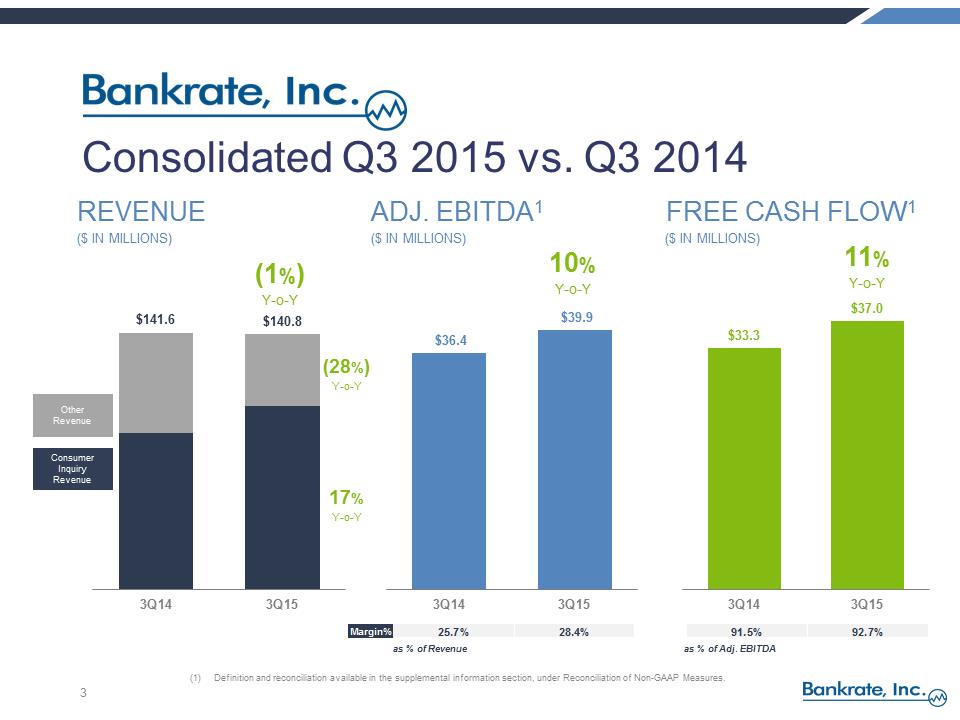
 91.5%92.7%Margin%25.7%28.4%$87 $101 $141.6 $140.8 3Q143Q15Consolidated Q3 2015 vs. Q3 2014 3 REVENUE ADJ. EBITDA1 FREE CASH FLOW1 ($ IN MILLIONS) ($ IN MILLIONS) ($ IN MILLIONS) (1%) Y-o-Y Consumer Inquiry Revenue Other Revenue 10% Y-o-Y 11% Y-o-Y (28%) Y-o-Y 17% Y-o-Y as % of Revenue as % of Adj. EBITDA (1)Definition and reconciliation available in the supplemental information section, under Reconciliation of Non-GAAP Measures. $36.4 $39.9 3Q143Q15$33.3 $37.0 3Q143Q15
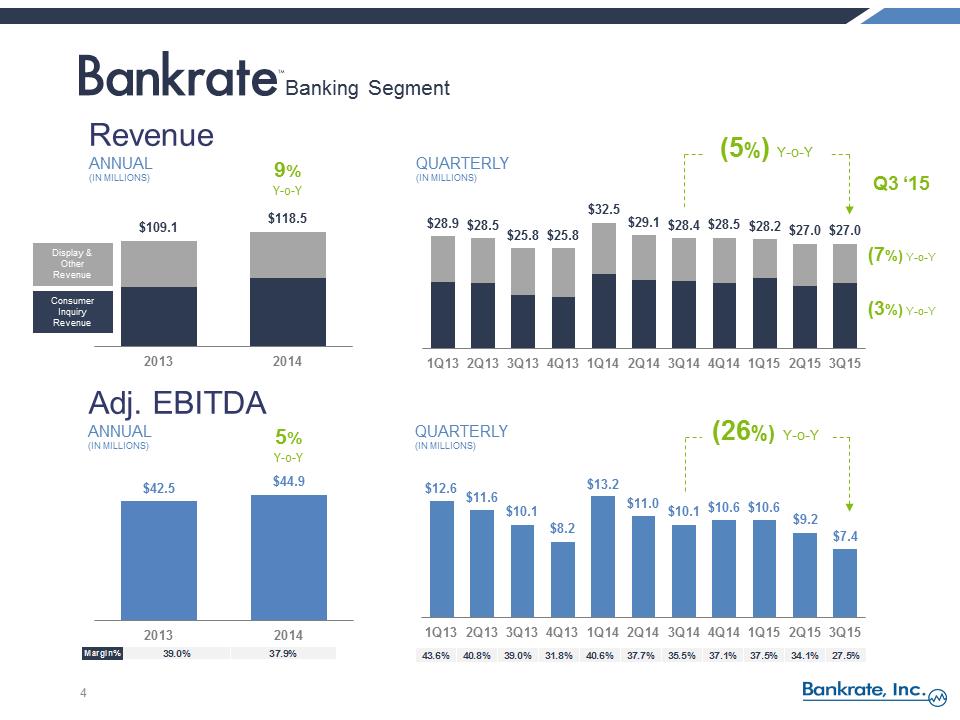
 Revenue ANNUAL (IN MILLIONS) 4 QUARTERLY (IN MILLIONS) 9% Y-o-Y Adj. EBITDA ANNUAL (IN MILLIONS) QUARTERLY (IN MILLIONS) bankrate-logo-blue.eps(5%) Y-o-Y (26%) Y-o-Y 5% Y-o-Y (7%) Y-o-Y (3%) Y-o-Y $109.1 $118.5 20132014Q3 ‘15 $42.5 $44.9 20132014Margin%39.0%37.9%Consumer Inquiry Revenue Display & Other Revenue Banking Segment $28.9 $28.5 $25.8 $25.8 $32.5 $29.1 $28.4 $28.5 $28.2 $27.0 $27.0 1Q132Q133Q134Q131Q142Q143Q144Q141Q152Q153Q15$12.6 $11.6 $10.1 $8.2 $13.2 $11.0 $10.1 $10.6 $10.6 $9.2 $7.4 1Q132Q133Q134Q131Q142Q143Q144Q141Q152Q153Q1543.6%40.8%39.0%31.8%40.6%37.7%35.5%37.1%37.5%34.1%27.5%
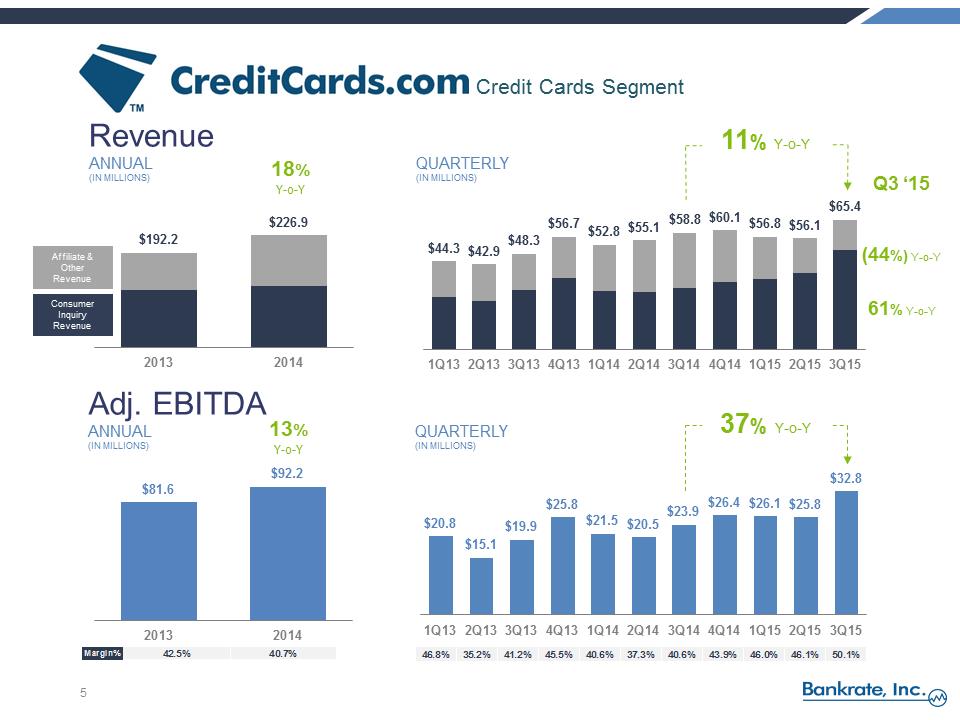
 46.8%35.2%41.2%45.5%40.6%37.3%40.6%43.9%46.0%46.1%50.1%http://www.creditcards.com/downloads/cccom-blue.jpgRevenue ANNUAL (IN MILLIONS) 5 QUARTERLY (IN MILLIONS) 18% Y-o-Y Adj. EBITDA ANNUAL (IN MILLIONS) QUARTERLY (IN MILLIONS) 13% Y-o-Y (44%) Y-o-Y 61% Y-o-Y Q3 ‘15 $192.2 $226.9 20132014Margin%42.5%40.7%Consumer Inquiry Revenue Affiliate & Other Revenue $81.6 $92.2 20132014Credit Cards Segment 11% Y-o-Y 37% Y-o-Y $20.8 $15.1 $19.9 $25.8 $21.5 $20.5 $23.9 $26.4 $26.1 $25.8 $32.8 1Q132Q133Q134Q131Q142Q143Q144Q141Q152Q153Q15$44.3 $42.9 $48.3 $56.7 $52.8 $55.1 $58.8 $60.1 $56.8 $56.1 $65.4 1Q132Q133Q134Q131Q142Q143Q144Q141Q152Q153Q15
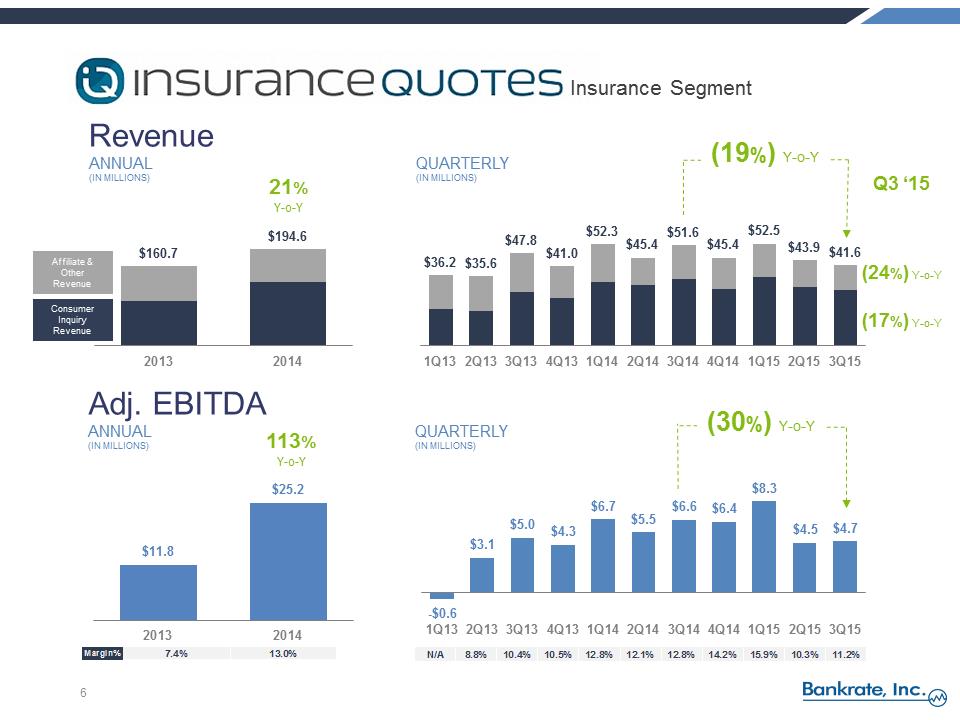
 Insurancequotes.com LogoRevenue ANNUAL (IN MILLIONS) 6 QUARTERLY (IN MILLIONS) 21% Y-o-Y Adj. EBITDA ANNUAL (IN MILLIONS) QUARTERLY (IN MILLIONS) 113% Y-o-Y (19%) Y-o-Y (30%) Y-o-Y (24%) Y-o-Y Q3 ‘15 $11.8 $25.2 20132014Margin%7.4%13.0%Consumer Inquiry Revenue Affiliate & Other Revenue $160.7 $194.6 20132014Insurance Segment (17%) Y-o-Y $36.2 $35.6 $47.8 $41.0 $52.3 $45.4 $51.6 $45.4 $52.5 $43.9 $41.6 1Q132Q133Q134Q131Q142Q143Q144Q141Q152Q153Q15-$0.6 $3.1 $5.0 $4.3 $6.7 $5.5 $6.6 $6.4 $8.3 $4.5 $4.7 1Q132Q133Q134Q131Q142Q143Q144Q141Q152Q153Q15N/A8.8%10.4%10.5%12.8%12.1%12.8%14.2%15.9%10.3%11.2%
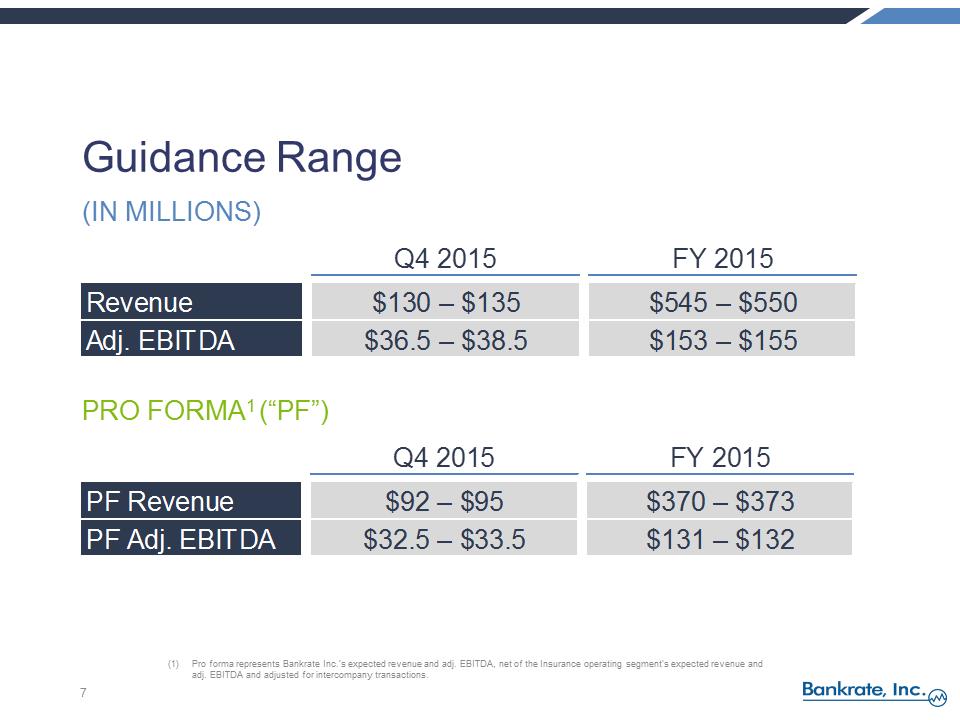
 Q4 2015FY 2015PF Revenue$92 – $95$370 – $373PF Adj. EBITDA$32.5 – $33.5$131 – $132Q4 2015FY 2015Revenue$130 – $135$545 – $550Adj. EBITDA$36.5 – $38.5$153 – $155Guidance Range (IN MILLIONS) 7 PRO FORMA1 (“PF”) (1)Pro forma represents Bankrate Inc.’s expected revenue and adj. EBITDA, net of the Insurance operating segment’s expected revenue and adj. EBITDA and adjusted for intercompany transactions. PRO FORMA1 (“PF”) (1)Pro forma represents Bankrate Inc.’s expected revenue and adj. EBITDA, net of the Insurance operating segment’s expected revenue and adj. EBITDA and adjusted for intercompany transactions.
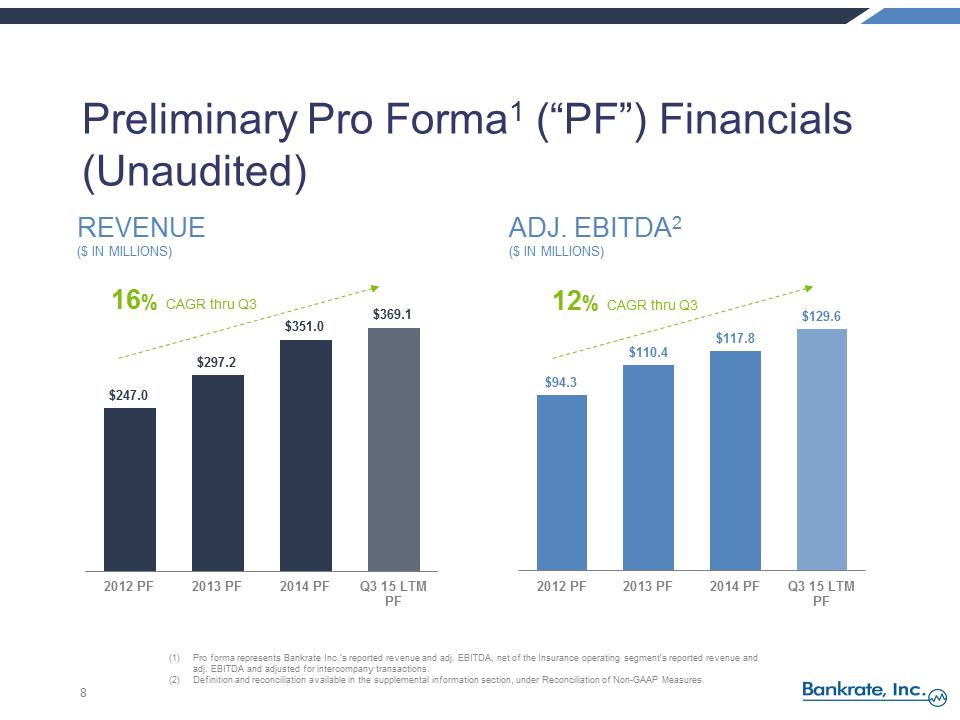
 8 Preliminary Pro Forma1 (“PF”) Financials (Unaudited) REVENUE ADJ. EBITDA2 ($ IN MILLIONS) ($ IN MILLIONS) 16% CAGR thru Q3 12% CAGR thru Q3 $247.0 $297.2 $351.0 $369.1 2012 PF2013 PF2014 PFQ3 15 LTMPF$94.3 $110.4 $117.8 $129.6 2012 PF2013 PF2014 PFQ3 15 LTMPF(1)Pro forma represents Bankrate Inc.’s reported revenue and adj. EBITDA, net of the Insurance operating segment’s reported revenue and adj. EBITDA and adjusted for intercompany transactions. (2)Definition and reconciliation available in the supplemental information section, under Reconciliation of Non-GAAP Measures.
 9 Supplemental Information Additional metrics and reconciliation of non-GAAP measures
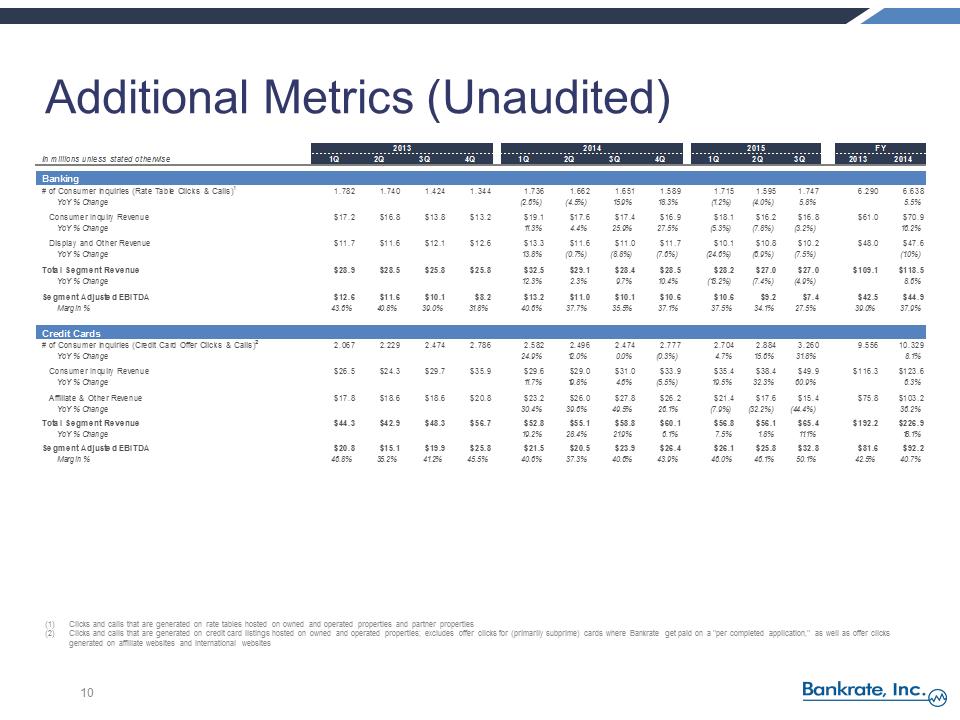
 201320142015FYIn millions unless stated otherwise1Q2Q3Q4Q1Q2Q3Q4Q1Q2Q3Q20132014Banking# of Consumer Inquiries (Rate Table Clicks & Calls)11.7821.7401.4241.3441.7361.6621.6511.5891.7151.5951.7476.2906.638YoY % Change(2.6%)(4.5%)15.9%18.3%(1.2%)(4.0%)5.8%5.5%Consumer Inquiry Revenue$17.2$16.8$13.8$13.2$19.1$17.6$17.4$16.9$18.1$16.2$16.8$61.0$70.9YoY % Change11.3%4.4%25.9%27.5%(5.3%)(7.8%)(3.2%)16.2%Display and Other Revenue$11.7$11.6$12.1$12.6$13.3$11.6$11.0$11.7$10.1$10.8$10.2$48.0$47.6YoY % Change13.8%(0.7%)(8.8%)(7.6%)(24.6%)(6.9%)(7.5%)(1.0%)Total Segment Revenue$28.9$28.5$25.8$25.8$32.5$29.1$28.4$28.5$28.2$27.0$27.0$109.1$118.5YoY % Change12.3%2.3%9.7%10.4%(13.2%)(7.4%)(4.9%)8.6%Segment Adjusted EBITDA$12.6$11.6$10.1$8.2$13.2$11.0$10.1$10.6$10.6$9.2$7.4$42.5$44.9Margin %43.6%40.8%39.0%31.8%40.6%37.7%35.5%37.1%37.5%34.1%27.5%39.0%37.9%Credit Cards# of Consumer Inquiries (Credit Card Offer Clicks & Calls)22.0672.2292.4742.7862.5822.4962.4742.7772.7042.8843.2609.55610.329YoY % Change24.9%12.0%0.0%(0.3%)4.7%15.6%31.8%8.1%Consumer Inquiry Revenue $26.5$24.3$29.7$35.9$29.6$29.0$31.0$33.9$35.4$38.4$49.9$116.3$123.6YoY % Change11.7%19.8%4.6%(5.5%)19.5%32.3%60.9%6.3%Affiliate & Other Revenue$17.8$18.6$18.6$20.8$23.2$26.0$27.8$26.2$21.4$17.6$15.4$75.8$103.2YoY % Change30.4%39.6%49.5%26.1%(7.9%)(32.2%)(44.4%)36.2%Total Segment Revenue$44.3$42.9$48.3$56.7$52.8$55.1$58.8$60.1$56.8$56.1$65.4$192.2$226.9YoY % Change19.2%28.4%21.9%6.1%7.5%1.8%11.1%18.1%Segment Adjusted EBITDA$20.8$15.1$19.9$25.8$21.5$20.5$23.9$26.4$26.1$25.8$32.8$81.6$92.2Margin %46.8%35.2%41.2%45.5%40.6%37.3%40.6%43.9%46.0%46.1%50.1%42.5%40.7%Additional Metrics (Unaudited) 10 (1)Clicks and calls that are generated on rate tables hosted on owned and operated properties and partner properties (2)Clicks and calls that are generated on credit card listings hosted on owned and operated properties; excludes offer clicks for (primarily subprime) cards where Bankrate get paid on a "per completed application," as well as offer clicks generated on affiliate websites and international websites
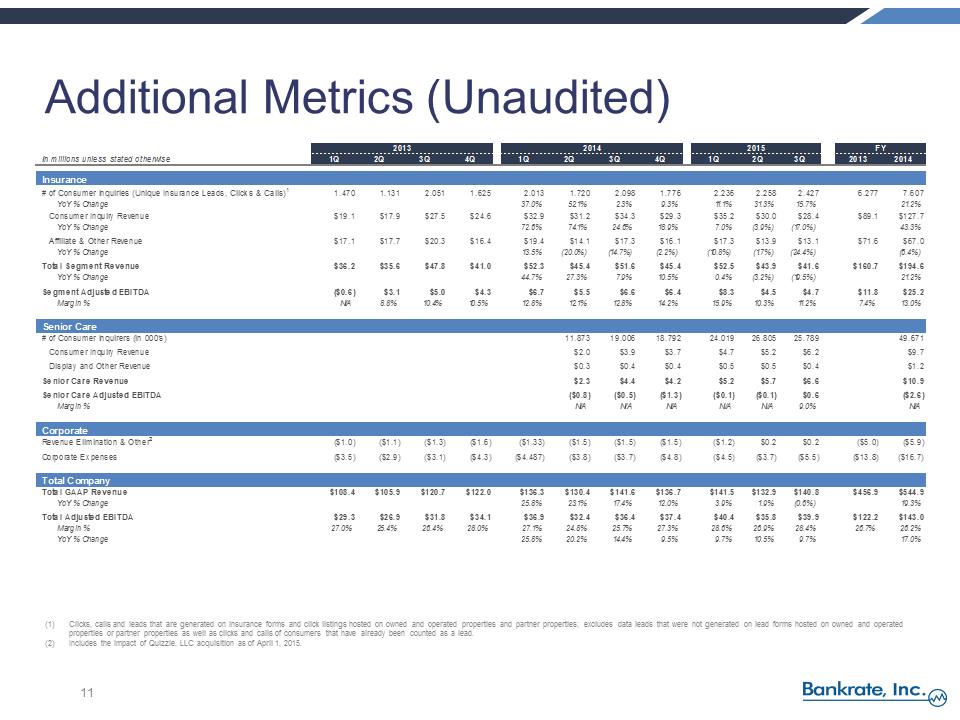
 201320142015FYIn millions unless stated otherwise1Q2Q3Q4Q1Q2Q3Q4Q1Q2Q3Q20132014Insurance# of Consumer Inquiries (Unique Insurance Leads, Clicks & Calls)11.4701.1312.0511.6252.0131.7202.0981.7762.2362.2582.4276.2777.607YoY % Change37.0%52.1%2.3%9.3%11.1%31.3%15.7%21.2%Consumer Inquiry Revenue$19.1$17.9$27.5$24.6$32.9$31.2$34.3$29.3$35.2$30.0$28.4$89.1$127.7YoY % Change72.6%74.1%24.6%18.9%7.0%(3.9%)(17.0%)43.3%Affiliate & Other Revenue$17.1$17.7$20.3$16.4$19.4$14.1$17.3$16.1$17.3$13.9$13.1$71.6$67.0YoY % Change13.5%(20.0%)(14.7%)(2.2%)(10.8%)(1.7%)(24.4%)(6.4%)Total Segment Revenue$36.2$35.6$47.8$41.0$52.3$45.4$51.6$45.4$52.5$43.9$41.6$160.7$194.6YoY % Change44.7%27.3%7.9%10.5%0.4%(3.2%)(19.5%)21.2%Segment Adjusted EBITDA($0.6)$3.1$5.0$4.3$6.7$5.5$6.6$6.4$8.3$4.5$4.7$11.8$25.2Margin %N/A8.8%10.4%10.5%12.8%12.1%12.8%14.2%15.9%10.3%11.2%7.4%13.0%Senior Care# of Consumer Inquirers (in 000's)11.87319.00618.79224.01926.80525.78949.671Consumer Inquiry Revenue$2.0$3.9$3.7$4.7$5.2$6.2$9.7Display and Other Revenue$0.3$0.4$0.4$0.5$0.5$0.4$1.2Senior Care Revenue$2.3$4.4$4.2$5.2$5.7$6.6$10.9Senior Care Adjusted EBITDA($0.8)($0.5)($1.3)($0.1)($0.1)$0.6($2.6)Margin %N/AN/AN/AN/AN/A9.0%N/ACorporate Revenue Elimination & Other2($1.0)($1.1)($1.3)($1.6)($1.33)($1.5)($1.5)($1.5)($1.2)$0.2$0.2($5.0)($5.9)Corporate Expenses($3.5)($2.9)($3.1)($4.3)($4.487)($3.8)($3.7)($4.8)($4.5)($3.7)($5.5)($13.8)($16.7)Total CompanyTotal GAAP Revenue$108.4$105.9$120.7$122.0$136.3$130.4$141.6$136.7$141.5$132.9$140.8$456.9$544.9YoY % Change25.8%23.1%17.4%12.0%3.9%1.9%(0.6%)19.3%Total Adjusted EBITDA$29.3$26.9$31.8$34.1$36.9$32.4$36.4$37.4$40.4$35.8$39.9$122.2$143.0Margin %27.0%25.4%26.4%28.0%27.1%24.8%25.7%27.3%28.6%26.9%28.4%26.7%26.2%YoY % Change25.8%20.2%14.4%9.5%9.7%10.5%9.7%17.0%Additional Metrics (Unaudited) 11 (1)Clicks, calls and leads that are generated on insurance forms and click listings hosted on owned and operated properties and partner properties; excludes data leads that were not generated on lead forms hosted on owned and operated properties or partner properties as well as clicks and calls of consumers that have already been counted as a lead. (2)Includes the impact of Quizzle, LLC acquisition as of April 1, 2015.
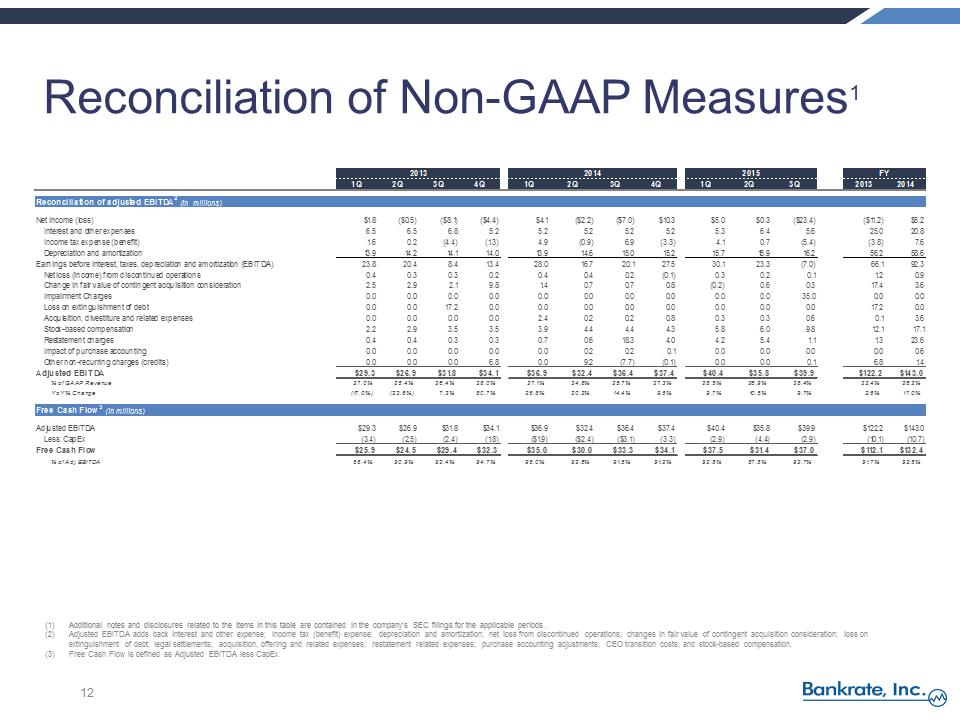
 20132014FY1Q2Q3Q4Q1Q2Q3Q4Q1Q2Q3Q20132014Reconciliation of adjusted EBITDA2 (in millions)Net income (loss) $1.8 ($0.5) ($8.1) ($4.4)$4.1 ($2.2) ($7.0)$10.3$5.0$0.3 ($23.4) ($11.2)$5.2Interest and other expenses6.56.56.85.25.25.25.25.25.36.45.625.020.8Income tax expense (benefit)1.60.2 (4.4) (1.3)4.9 (0.9)6.9 (3.3)4.10.7 (5.4) (3.8)7.6Depreciation and amortization13.914.214.114.013.914.615.015.215.715.916.256.258.6Earnings before interest, taxes, depreciation and amortization (EBITDA)23.820.48.413.428.016.720.127.530.123.3 (7.0)66.192.3Net loss (income) from discontinued operations0.40.30.30.20.40.40.2 (0.1)0.30.20.11.20.9Change in fair value of contingent acquisition consideration2.52.92.19.81.40.70.70.8 (0.2)0.60.317.43.6Impairment Charges0.00.00.00.00.00.00.00.00.00.035.00.00.0Loss on extinguishment of debt0.00.017.20.00.00.00.00.00.00.00.017.20.0Acquisition, divestiture and related expenses0.00.00.00.02.40.20.20.80.30.30.60.13.6Stock-based compensation2.22.93.53.53.94.44.44.35.86.09.812.117.1Restatement charges0.40.40.30.30.70.618.34.04.25.41.11.323.6Impact of purchase accounting0.00.00.00.00.00.20.20.10.00.00.00.00.6Other non-recurring charges (credits)0.00.00.06.80.09.2 (7.7) (0.1)0.00.00.16.81.4Adjusted EBITDA$29.3$26.9$31.8$34.1$36.9$32.4$36.4$37.4$40.4$35.8$39.9$122.2$143.0% of GAAP Revenue27.0%25.4%26.4%28.0%27.1%24.8%25.7%27.3%28.5%26.9%28.4%22.4%26.2%YoY % Change(17.0%)(23.6%)7.3%80.7%25.8%20.2%14.4%9.5%9.7%10.5%9.7%2.6%17.0%Free Cash Flow3 (in millions)Adjusted EBITDA$29.3$26.9$31.8$34.1$36.9$32.4$36.4$37.4$40.4$35.8$39.9$122.2$143.0Less: CapEx (3.4) (2.5) (2.4) (1.8) ($1.9) ($2.4) ($3.1) (3.3) (2.9) (4.4) (2.9) (10.1) (10.7)Free Cash Flow$25.9$24.5$29.4$32.3$35.0$30.0$33.3$34.1$37.5$31.4$37.0$112.1$132.4% of Adj. EBITDA88.4%90.9%92.4%94.7%95.0%92.6%91.5%91.2%92.8%87.8%92.7%91.7%92.5%201512 (1)Additional notes and disclosures related to the items in this table are contained in the company’s SEC filings for the applicable periods.. (2)Adjusted EBITDA adds back interest and other expense; income tax (benefit) expense; depreciation and amortization; net loss from discontinued operations; changes in fair value of contingent acquisition consideration; loss on extinguishment of debt; legal settlements; acquisition, offering and related expenses; restatement related expenses; purchase accounting adjustments; CEO transition costs; and stock-based compensation. (3)Free Cash Flow is defined as Adjusted EBITDA less CapEx. Reconciliation of Non-GAAP Measures1
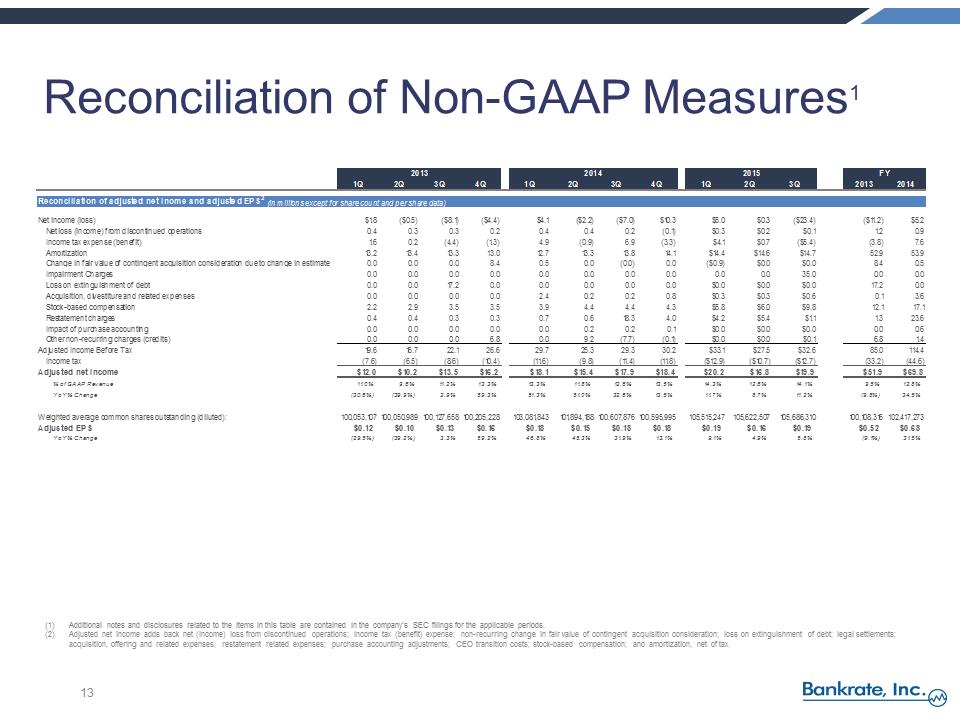
 20132014FY1Q2Q3Q4Q1Q2Q3Q4Q1Q2Q3Q20132014Reconciliation of adjusted net inome and adjusted EPS2 (in millions except for share count and per share data)Net income (loss) $1.8 ($0.5) ($8.1) ($4.4)$4.1 ($2.2) ($7.0)$10.3$5.0$0.3 ($23.4) ($11.2)$5.2Net loss (income) from discontinued operations0.40.30.30.20.40.40.2 (0.1)$0.3$0.2$0.11.20.9Income tax expense (benefit) 1.60.2 (4.4) (1.3)4.9 (0.9)6.9 (3.3)$4.1$0.7 ($5.4) (3.8)7.6Amortization13.213.413.313.012.713.313.814.1$14.4$14.6$14.752.953.9Change in fair value of contingent acquisition consideration due to change in estimate0.00.00.08.40.50.0 (0.0)0.0 ($0.9)$0.0$0.08.40.5Impairment Charges0.00.00.00.00.00.00.00.00.00.035.00.00.0Loss on extinguishment of debt0.00.017.20.00.00.00.00.0$0.0$0.0$0.017.20.0Acquisition, divestiture and related expenses0.00.00.00.02.40.20.20.8$0.3$0.3$0.60.13.6Stock-based compensation 2.22.93.53.53.94.44.44.3$5.8$6.0$9.812.117.1Restatement charges 0.40.40.30.30.70.618.34.0$4.2$5.4$1.11.323.6Impact of purchase accounting0.00.00.00.00.00.20.20.1$0.0$0.0$0.00.00.6Other non-recurring charges (credits) 0.00.00.06.80.09.2 (7.7) (0.1)$0.0$0.0$0.16.81.4Adjusted Income Before Tax19.616.722.126.629.725.329.330.2$33.1$27.5$32.685.0114.4Income tax (7.6) (6.5) (8.6) (10.4) (11.6) (9.8) (11.4) (11.8) ($12.9) ($10.7) ($12.7) (33.2) (44.6)Adjusted net income$12.0$10.2$13.5$16.2$18.1$15.4$17.9$18.4$20.2$16.8$19.9$51.9$69.8% of GAAP Revenue11.0%9.6%11.2%13.3%13.3%11.8%12.6%13.5%14.3%12.6%14.1%9.5%12.8%YoY % Change(30.6%)(39.9%)2.9%59.3%51.3%51.0%32.6%13.5%11.7%8.7%11.2%(9.8%)34.5%Weighted average common shares outstanding (diluted):100,053,107100,050,989100,127,658100,205,228103,081,843101,894,188100,607,876100,595,995105,515,247105,622,507105,686,310100,108,316102,417,273Adjusted EPS$0.12$0.10$0.13$0.16$0.18$0.15$0.18$0.18$0.19$0.16$0.19$0.52$0.68YoY % Change(29.5%)(39.2%)3.3%59.2%46.8%48.3%31.9%13.1%9.1%4.9%5.8%(9.1%)31.5%201513 (1)Additional notes and disclosures related to the items in this table are contained in the company’s SEC filings for the applicable periods. (2)Adjusted net income adds back net (income) loss from discontinued operations; income tax (benefit)
expense; non-recurring change in fair value of contingent acquisition consideration; loss on extinguishment of debt; legal settlements; acquisition, offering and related expenses; restatement related expenses; purchase accounting adjustments; CEO transition costs; stock-based compensation; and amortization, net of tax. Reconciliation of Non-GAAP Measures1