Attached files
| file | filename |
|---|---|
| 8-K - 8-K - UNITED STATES STEEL CORP | form8-kxslidesandqaforearn.htm |
| EX-99.2 - EXHIBIT 99.2 - UNITED STATES STEEL CORP | a3q2015qa.htm |

United States Steel Corporation Third Quarter 2015 Earnings Conference Call and Webcast November 4, 2015 © 2011 United States Steel Corporation Exhibit 99.1

2 Forward-looking Statements United States Steel Corporation This presentation contains information that may constitute “forward-looking statements” within the meaning of the Private Securities Litigation Reform Act of 1995. Generally, we have identified such forward-looking statements by using the words “believe,” “expect,” “intend,” “estimate,” “anticipate,” “project,” “target,” “forecast,” “aim,” “will” and similar expressions or by using future dates in connection with any discussion of, among other things, operating performance, trends, events or developments that we expect or anticipate will occur in the future, statements relating to volume growth, share of sales and earnings per share growth, and statements expressing general views about future operating results. However, the absence of these words or similar expressions does not mean that a statement is not forward-looking. Forward-looking statements are not historical facts, but instead represent only the Company’s beliefs regarding future events, many of which, by their nature, are inherently uncertain and outside of the Company’s control. It is possible that the Company’s actual results and financial condition may differ, possibly materially, from the anticipated results and financial condition indicated in these forward-looking statements. Management believes that these forward- looking statements are reasonable as of the time made. However, caution should be taken not to place undue reliance on any such forward-looking statements because such statements speak only as of the date when made. Our Company undertakes no obligation to publicly update or revise any forward- looking statements, whether as a result of new information, future events or otherwise, except as required by law. In addition, forward-looking statements are subject to certain risks and uncertainties that could cause actual results to differ materially from our Company's historical experience and our present expectations or projections. These risks and uncertainties include, but are not limited to the risks and uncertainties described in “Item 1A. Risk Factors” and “Supplementary Data - Disclosures About Forward-Looking Statements” in our Annual Report on Form 10-K for the year ended December 31, 2014, and those described from time to time in our future reports filed with the Securities and Exchange Commission.

Segment EBIT $ Millions Adjusted EBITDA $ Millions Adjusted Diluted EPS $ / Share 3Q 2015 1Q 2015 4Q 2014 4Q 2014 1Q 2015 2Q 2015 Note: For reconciliation of non-GAAP amounts see Appendix 1Q 2015 4Q 2014 2Q 2015 Third Quarter 2015 Results 3 United States Steel Corporation Adjusted Net Income $ Millions 4Q 2014 1Q 2015 3Q 2015 Improved results under more difficult market conditions 2Q 2015 LTM 3Q 2015 LTM 2Q 2015 LTM 3Q 2015 LTM Market headwinds worsened in the third quarter Note: LTM = latest twelve months Focused on improving the things we control

Cash from Operations $ Millions 2Q 2015 1Q 2015 4Q 2014 LTM 3Q 2015 Total Estimated Liquidity $ Millions 3Q 2014 3Q 2013 3Q 2012 3Q 2015 Strong Cash Position and Liquidity 4 United States Steel Corporation Cash and Cash Equivalents $ Millions Net Debt $ Millions Disciplined cash management and capital allocation strategies 3Q 2012 3Q 2013 3Q 2014 3Q 2015 3Q 2012 3Q 2013 3Q 2014 3Q 2015 Strong cash position and liquidity to weather tough market conditions Note: LTM = latest twelve months

EBIT $ Millions Average Realized Prices $ / Ton 4Q 2014 1Q 2015 2Q 2015 Third Quarter 2015 Flat-rolled Segment 4Q 2014 1Q 2015 2Q 2015 Shipments Net tons (Thousands) 4Q 2014 1Q 2015 3Q 2015 5 United States Steel Corporation EBITDA $ Millions 4Q 2014 1Q 2015 2Q 2015 3Q 2015 LTM 3Q 2015 LTM 3Q 2015 LTM 2Q 2015 LTM Note: LTM = latest twelve months Cost improvements continue to offset lower average realized prices Challenging spot market conditions continue to pressure shipment levels

EBIT $ Millions Average Realized Prices $ / Ton 4Q 2014 1Q 2015 2Q 2015 Third Quarter 2015 Tubular Segment 4Q 2014 1Q 2015 2Q 2015 Shipments Net tons (Thousands) 4Q 2014 1Q 2015 2Q 2015 6 United States Steel Corporation EBITDA $ Millions 4Q 2014 1Q 2015 2Q 2015 3Q 2015 LTM 3Q 2015 LTM 3Q 2015 LTM 3Q 2015 LTM Note: LTM = latest twelve months Significant increase in margins due to higher shipments and cost improvements High supply chain inventory levels continue to pressure prices and shipments

EBIT $ Millions Average Realized Prices $ / Ton 4Q 2014 1Q 2015 2Q 2015 Third Quarter 2015 U. S. Steel Europe Segment 4Q 2014 1Q 2015 2Q 2015 Shipments Net tons (Thousands) 4Q 2014 1Q 2015 2Q 2015 7 United States Steel Corporation EBITDA $ Millions 4Q 2014 1Q 2015 2Q 2015 3Q 2015 LTM 3Q 2015 LTM 3Q 2015 LTM 3Q 2015 LTM Note: LTM = latest twelve months Cost improvements offset lower average realized prices and shipments Consistent profitability and cash generation

3Q 2009 vs. 3Q 2015 $ Millions Note: For reconciliation of non-GAAP amounts see Appendix Carnegie Way Transformation Improving Earnings Power 8 United States Steel Corporation ($255) $188 ($31) $195 $81 ($16) 3Q09 EBITDA Price Volume Cost 3Q15 EBITDA North American Flat-rolled EBITDA Bridge Other 2Q 2015 vs. 3Q 2015 $ Millions 2Q15 EBITDA Price Volume Cost 3Q15 EBITDA Significant EBITDA margin improvement reflecting favorable commercial impacts and lower total costs, including lower raw materials and pension costs. Favorable change in costs, excluding raw materials and pension costs, of approximately $40 per ton EBITDA margin improvement despite negative commercial impacts, reflecting lower total costs, including lower raw materials costs. Favorable change in costs, excluding raw materials costs, of approximately $35 per ton $35 ($57) ($24) $127 $0 $81 Other

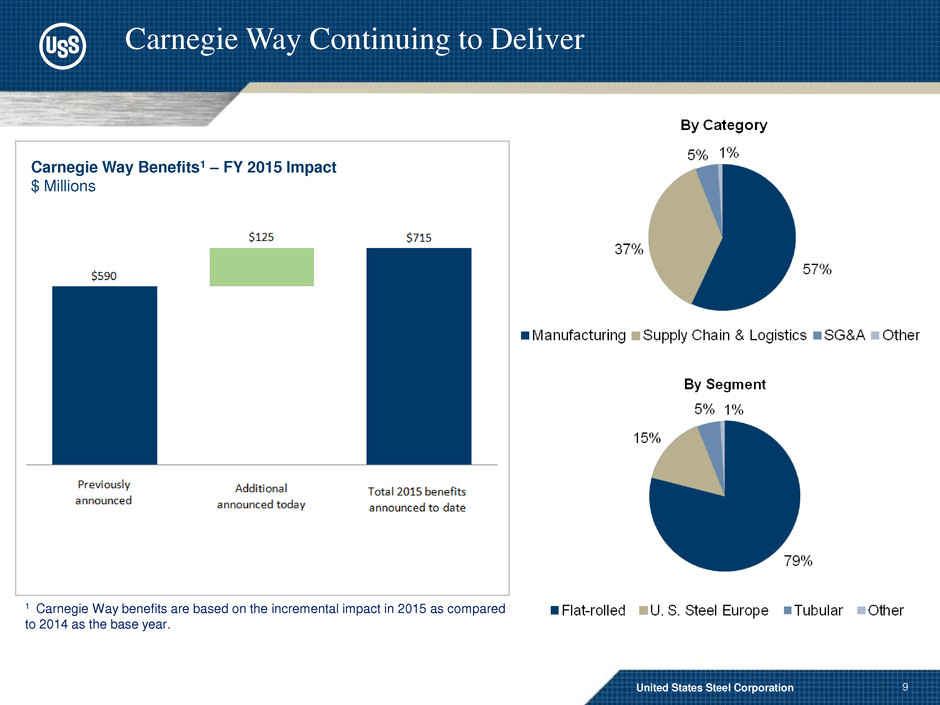
Carnegie Way Benefits1 – FY 2015 Impact $ Millions 9 Carnegie Way Continuing to Deliver 55% 12% United States Steel Corporation 1 Carnegie Way benefits are based on the incremental impact in 2015 as compared to 2014 as the base year.

10 Carnegie Way transformation Phase 1: Earning the right to grow in search of: • Economic profits • Customer satisfaction and loyalty • Process improvements and focused investment Phase 2: Driving profitable growth with: • Innovation and Technology • Differentiated customer solutions • Focused M&A Strategic Approach United States Steel Corporation

11 United States Steel Corporation Business Update Short term actions taken are expected to reduce costs in the fourth quarter of 2015 by approximately $125 million Operating updates • Steelmaking facilities • Flat-rolled finishing facilities • Tubular facilities Trade Update Recent activity

12 United States Steel Corporation Flat-rolled September auto sales highest since 2005 at an 18.1 million SAAR Construction spend has increased 9 straight months to a SAAR of $1.09 trillion in August September major unit shipments up 21% m-o-m according to the Assc. of Home Appliance Manufacturers (AHAM) Service center carbon flat-rolled inventory at 2.8 months supply; 3rd consecutive monthly increase Imports remain a headwind for all of our flat-rolled markets U. S. Steel Europe V4* car production growth expected to outpace the EU average in 2015 Appliance growth in V4 expected to outperform EU average growth in 2015 Moderate EU construction growth is expected to continue in 4Q at a rate of 2.5% y-o-y Tubular During 3Q, import share of OCTG apparent market demand is projected to exceed 47% September 2015 OCTG inventory is approximately 8-9 months of supply WTI oil prices down19% from 2Q. EIA forecasts $49.16/barrel for 2015. Market Updates Major industry summary and market fundamentals * Visegrad Group – Czech Republic, Hungary, Poland and Slovakia

13 United States Steel Corporation 2015 Outlook 2015 Adjusted EBITDA Guidance Approximately $225 million • Steel selling prices reversed direction • Import levels remained higher than expected • Slower pace of supply chain inventory rebalance • Continued deterioration of the OCTG market Actual market performance versus prior expectations

United States Steel Corporation Turning Strategy Into Action 13

United States Steel Corporation Third Quarter 2015 Earnings Conference Call and Webcast Q & A November 4, 2015 © 2011 United States Steel Corporation United States Steel Corporation 15

© 2011 United States Steel Corporation Appendix 16 United States Steel Corporation

17 Major end-markets summary North American Flat-rolled Segment United States Steel Corporation Automotive September auto sales were the highest since 2005 at an 18.1 million SAAR. October 1st inventories increased modestly by 4 days up to a still normal 59 days. 4Q build forecast is projected to be on par with 1Q 2015, and slightly higher than 4Q 2014. Industrial Equipment Mining remains very slow, with facility rationalization underway. Construction equipment demand slightly improving with construction market. 2015 railcar demand & backlogs remain steady, but not increasing. Tin Plate AISI reports that apparent consumption through July is down 4.2% on tin mill products (excl Black Plate); however domestic mill shipments are off -12% YTD. Net imports up 13.7% through August preliminary statistics. Appliance September major unit shipments were up over 21% m-o-m, according to the Association of Home Appliance Manufacturers (AHAM); YTD unit shipments are up 7.4%. Pipe and Tube Structural tubing demand reasonable due to construction market; prices under pressure. Line pipe project activity is stable. Welded OCTG producers have essentially written off 2015 in hope of better markets in 2016. Construction US Housing Starts up 6.5% in September led by multi-family units (+18.3%); permits fell 5%. The Dodge Momentum Index increased 5.8% in September; up 14% y-o-y. Construction spend has increased 9 straight months to a SAAR of $1.09 trillion in August. September Housing Market Index score of 62 the highest since October 2005. Service Center MSCI Sept Carbon Flat Rolled shipments are down 9.7% y-o-y; down 6.2% YTD. Inventory increases for the 3rd consecutive month to almost 5.93 million tons, a 2.8 months supply. Cold Rolled and Coated inventories stable and months supply reasonable; Hot Rolled is sluggish. Only positive is that it appears as though customers are keeping open order exposure small. Sources: Wards / McGrawHill / Customer Financial Reports / MSCI / NAHB US Dept of Commerce / AHAM / AISI / Railway Age / AIA

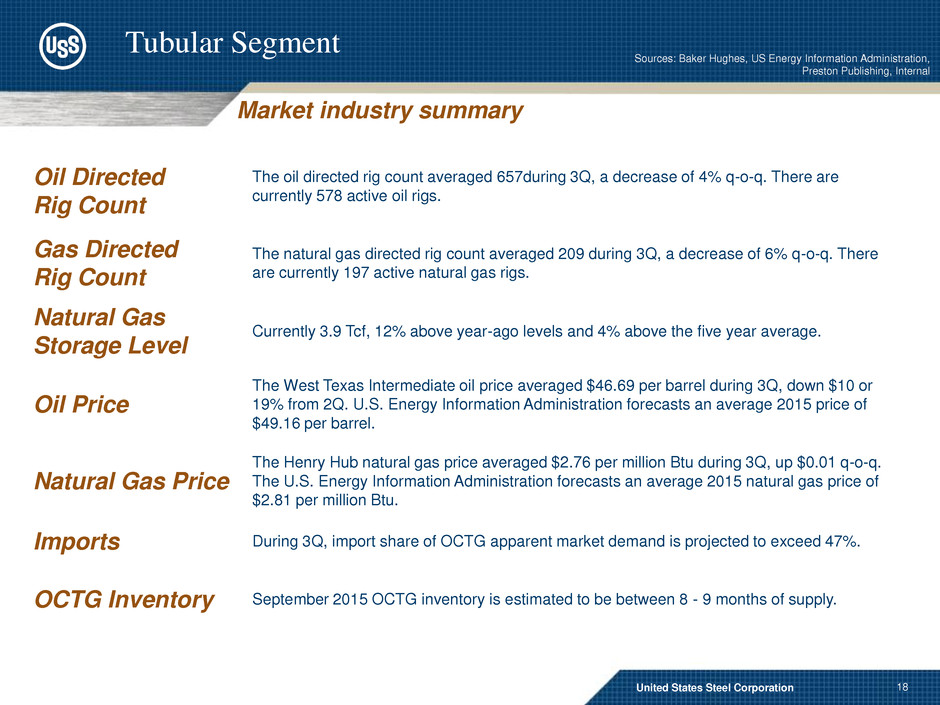
18 Market industry summary Tubular Segment United States Steel Corporation Sources: Baker Hughes, US Energy Information Administration, Preston Publishing, Internal Oil Directed Rig Count The oil directed rig count averaged 657during 3Q, a decrease of 4% q-o-q. There are currently 578 active oil rigs. Gas Directed Rig Count The natural gas directed rig count averaged 209 during 3Q, a decrease of 6% q-o-q. There are currently 197 active natural gas rigs. Natural Gas Storage Level Currently 3.9 Tcf, 12% above year-ago levels and 4% above the five year average. Oil Price The West Texas Intermediate oil price averaged $46.69 per barrel during 3Q, down $10 or 19% from 2Q. U.S. Energy Information Administration forecasts an average 2015 price of $49.16 per barrel. Natural Gas Price The Henry Hub natural gas price averaged $2.76 per million Btu during 3Q, up $0.01 q-o-q. The U.S. Energy Information Administration forecasts an average 2015 natural gas price of $2.81 per million Btu. Imports During 3Q, import share of OCTG apparent market demand is projected to exceed 47%. OCTG Inventory September 2015 OCTG inventory is estimated to be between 8 - 9 months of supply.

19 Major end-markets summary United States Steel Corporation U. S. Steel Europe Segment Sources: Eurofer, USSK Marketing, EASSC, IHS, Euroconstruct, ESTA, ACEA Automotive In 4Q, the EU car production is expected to amount to 4.3 million units, an increase of 4.2% y-o-y. In 2015, EU car production is forecasted to grow by 6.2% to roughly 17.9 million units. V4 car production is anticipated to increase by 9.9% y-o-y in 4Q and for the full year 2015 we expect 10% growth y-o-y to 3.3 million units. In 1Q 2016, the EU car production is expected to grow 2.4% y-o-y to 4.78 million units; in V4 countries by 0.3% y-o-y to 0.87 million units. Appliance In 4Q, the EU appliance sector is projected to grow by 2% y-o-y. Prospects for the EU domestic appliances market in 2015 are for the continuation of slight growth across the sector. Positive demand trends are expected in Germany, France and Austria spurred by improvement in economic conditions, consumer confidence and a better outlook for the residential property sector. Stagnation in other EU markets is mainly due to prolonged weakness of the residential construction market. In 1Q 2016, the EU appliance sector estimates growth of 1.2% y-o-y. Central Europe will continue to achieve slightly higher performance compared to the EU average. Tin Plate 4Q demand is expected to decline due to seasonal impacts by 23% q-o-q; the seasonal adjustment is typical for 4Q. Aggressively priced imports from Asia in 4Q are expected to continue across Europe with Southern Europe seeing the biggest impact. Construction Construction activity in 3Q continued to improve moderately as the recovery of the residential sector gradually gains more traction. This trend is expected to continue through the final quarter of the year; 4Q is forecast to grow y-o-y by 2.5% and 1Q 2016 by 0.4% y-o-y. Service Centers Cautious inventory management continues to define the service center segment. Fairly steady demand through 3Q has been balanced by pricing pressure brought on by imports. This trend is likely to continue through the balance of the year.

U. S. Steel Commercial – Contract vs. Spot Contract vs. spot mix by segment – twelve months ended September 30, 2015 Firm 33% Market Based Quarterly * 18% Flat-rolled Market Based Monthly * 13% Tubular U. S. Steel Europe Spot 26% Cost Based 9% Contract: 74% Spot: 26% Firm 37% Market Based Quarterly* 1% Spot 41% Cost Based 9% Program 53% Contract: 59% Spot: 41% Market Based Monthly* 12% Spot 47% Program: 53% Spot: 47% United States Steel Corporation 20 Market Based Semi-annual * 1% *Annual contract volume commitments with price adjustments in stated time frame

21 United States Steel Corporation Other Items Capital Spending Third quarter actual $133 million, 2015 estimate $500 million Depreciation, Depletion and Amortization Third quarter actual $136 million, 2015 estimate $550 million Pension and Other Benefits Costs Third quarter actual $74 million, 2015 estimate $245 million Pension and Other Benefits Cash Payments (excluding any VEBA contributions and voluntary pension contributions) Third quarter actual $85 million, 2015 estimate $300 million

22 Global OSHA Recordable Incidence Rates January 2010 through September 2015 United States Steel Corporation Safety Performance Rates Frequency of Injuries (per 200,000 manhours) Data for 2010 forward includes Lone Star Tubular Operations, Bellville Tubular Operations, Rig Site Services, Tubular Processing Houston, Offshore Operations Houston, and Wheeling Machine Products. Data for 2011 forward includes Transtar. Data for 2010 through 2011 includes U. S. Steel Serbia. 16% Improvement 2010 to 2015 Global Days Away From Work Incidence Rates January 2010 through September 2015 29% Improvement 2010 to 2015

NAFR Segment - EBITDA Bridge $ Millions Tubular Segment - EBITDA Bridge $ Millions Note: For reconciliation of non-GAAP amounts see Appendix Carnegie Way Transformation Improving Earnings Power 23 United States Steel Corporation ($255) $188 ($31) $195 $81 ($16) 3Q09 EBITDA Price Volume Cost 3Q15 EBITDA 3Q09 EBITDA Price Volume Cost 3Q15 EBITDA 3Q 2009 vs. 3Q 2015 Other ($9) ($32) $3 $0 ($36) $2 Other USSE Segment - EBITDA Bridge $ Millions $44 ($127) ($137) $275 $39 ($16) 3Q09 EBITDA Price Volume Cost Other 3Q15 EBITDA

NAFR Segment - EBITDA Bridge $ Millions Tubular Segment - EBITDA Bridge $ Millions Note: For reconciliation of non-GAAP amounts see Appendix Carnegie Way Transformation Improving Earnings Power 24 United States Steel Corporation $35 ($57) ($24) $127 $81 $0 2Q15 EBITDA Price Volume Cost 3Q15 EBITDA 2Q15 EBITDA Price Volume Cost 3Q15 EBITDA 2Q 2015 vs. 3Q 2015 Other ($49) ($36) $78 ($26) ($36) ($3) Other USSE Segment - EBITDA Bridge $ Millions $40 ($19) ($37) $53 $39 $2 2Q15 EBITDA Price Volume Cost Other 3Q15 EBITDA

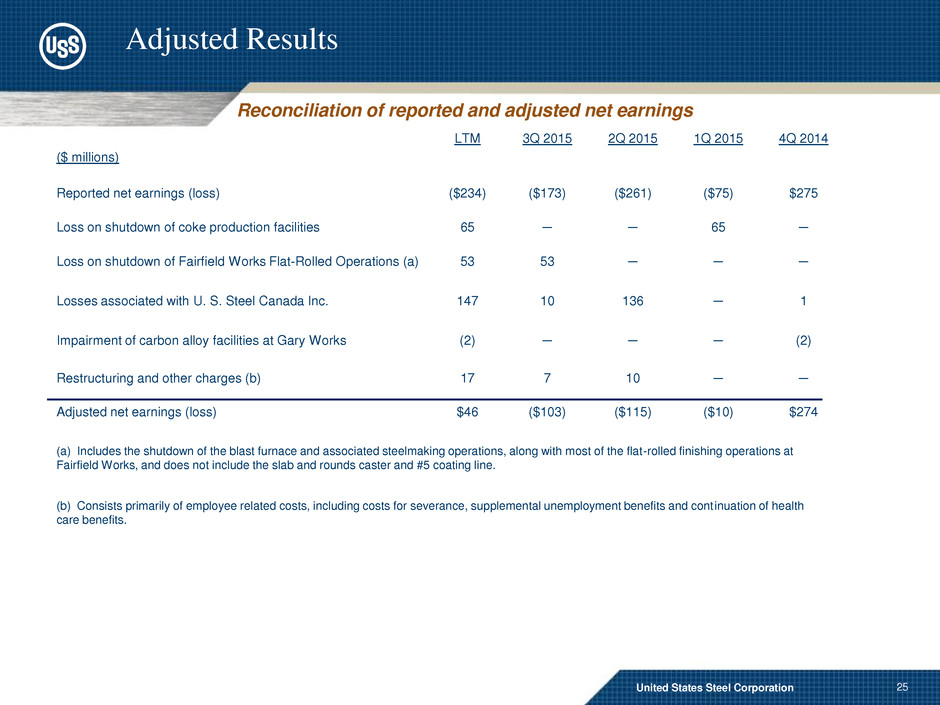
25 United States Steel Corporation Adjusted Results ($ millions) LTM 3Q 2015 2Q 2015 1Q 2015 4Q 2014 Reported net earnings (loss) ($234) ($173) ($261) ($75) $275 Loss on shutdown of coke production facilities 65 ─ ─ 65 ─ Loss on shutdown of Fairfield Works Flat-Rolled Operations (a) 53 53 ─ ─ ─ Losses associated with U. S. Steel Canada Inc. 147 10 136 ─ 1 Impairment of carbon alloy facilities at Gary Works (2) ─ ─ ─ (2) Restructuring and other charges (b) 17 7 10 ─ ─ Adjusted net earnings (loss) $46 ($103) ($115) ($10) $274 Reconciliation of reported and adjusted net earnings (b) Consists primarily of employee related costs, including costs for severance, supplemental unemployment benefits and continuation of health care benefits. (a) Includes the shutdown of the blast furnace and associated steelmaking operations, along with most of the flat-rolled finishing operations at Fairfield Works, and does not include the slab and rounds caster and #5 coating line.

26 United States Steel Corporation Adjusted Results ($ per share) LTM 3Q 2015 2Q 2015 1Q 2015 4Q 2014 Reported diluted EPS (LPS) ($1.66) ($1.18) ($1.79) ($0.52) $1.83 Loss on shutdown of coke production facilities 0.45 ─ ─ 0.45 ─ Loss on shutdown of Fairfield Works Flat-Rolled Operations (a) 0.36 0.36 ─ ─ ─ Losses associated with U. S. Steel Canada Inc. 1.01 0.07 0.93 ─ 0.01 Impairment of carbon alloy facilities at Gary Works (0.02) ─ ─ ─ (0.02) Restructuring and other charges (b) 0.12 0.05 0.07 ─ ─ Adjusted diluted EPS (LPS) $0.26 ($0.70) ($0.79) ($0.07) $1.82 Reconciliation of reported and adjusted diluted EPS (b) Consists primarily of employee related costs, including costs for severance, supplemental unemployment benefits and continuation of health care benefits. (a) Includes the shutdown of the blast furnace and associated steelmaking operations, along with most of the flat-rolled finishing operations at Fairfield Works, and does not include the slab and rounds caster and #5 coating line.

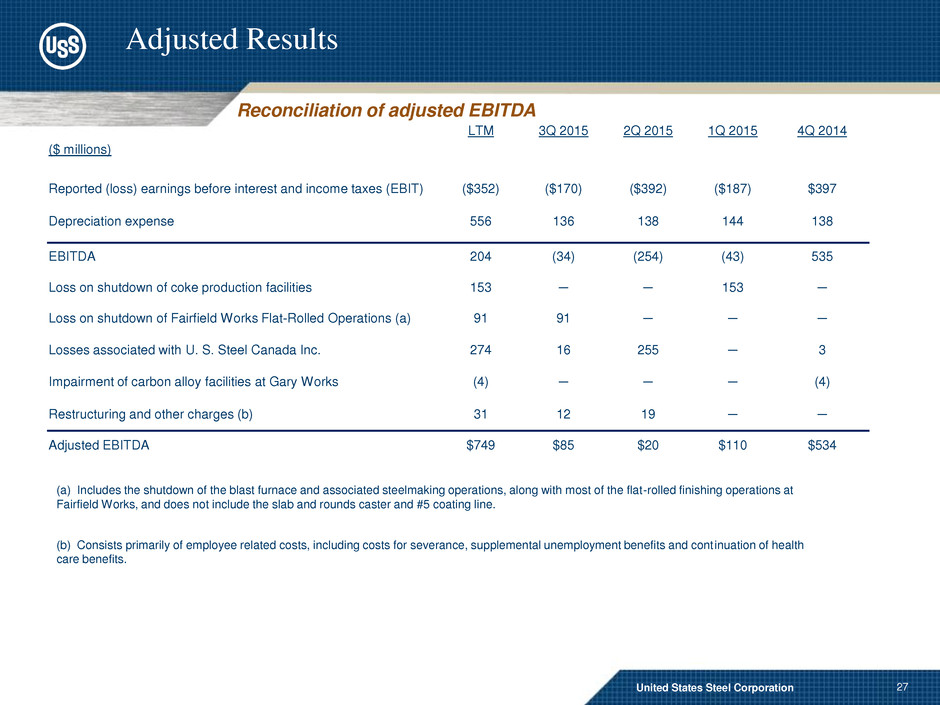
27 United States Steel Corporation Adjusted Results ($ millions) LTM 3Q 2015 2Q 2015 1Q 2015 4Q 2014 Reported (loss) earnings before interest and income taxes (EBIT) ($352) ($170) ($392) ($187) $397 Depreciation expense 556 136 138 144 138 EBITDA 204 (34) (254) (43) 535 Loss on shutdown of coke production facilities 153 ─ ─ 153 ─ Loss on shutdown of Fairfield Works Flat-Rolled Operations (a) 91 91 ─ ─ ─ Losses associated with U. S. Steel Canada Inc. 274 16 255 ─ 3 Impairment of carbon alloy facilities at Gary Works (4) ─ ─ ─ (4) Restructuring and other charges (b) 31 12 19 ─ ─ Adjusted EBITDA $749 $85 $20 $110 $534 Reconciliation of adjusted EBITDA (b) Consists primarily of employee related costs, including costs for severance, supplemental unemployment benefits and continuation of health care benefits. (a) Includes the shutdown of the blast furnace and associated steelmaking operations, along with most of the flat-rolled finishing operations at Fairfield Works, and does not include the slab and rounds caster and #5 coating line.

28 United States Steel Corporation Adjusted Results Net Debt ($ millions) 3Q 2015 2Q 2015 1Q 2015 4Q 2014 Short-term debt and current maturities of long-term debt $362 $362 $378 $378 Long-term debt, less unamortized discount 3,127 3,124 3,124 3,120 Total Debt $3,489 $3,486 $3,502 $3,498 Less: Cash and cash equivalents 1,165 1,210 1,266 1,354 Net Debt $2,324 $2,276 $2,236 $2,144 Reconciliation of net debt

29 United States Steel Corporation Adjusted Results Segment EBITDA – North America Flat-rolled ($ millions) 3Q 2015 2Q 2015 1Q 2015 4Q 2014 3Q 2009 Segment EBIT ($18) ($64) ($67) $247 ($370) Depreciation 99 99 104 96 115 Segment EBITDA $81 $35 $37 $343 ($255) Reconciliation of segment EBITDA Segment EBITDA – Tubular ($ millions) 3Q 2015 2Q 2015 1Q 2015 4Q 2014 3Q 2009 Segment EBIT ($50) ($66) $1 $121 ($21) Depreciation 14 17 17 17 12 Segment EBITDA ($36) ($49) $18 $138 ($9) Segment EBITDA – U. S. Steel Europe ($ millions) 3Q 2015 2Q 2015 1Q 2015 4Q 2014 3Q 2009 Segment EBIT $18 $20 $37 $34 $7 Depreciation 21 20 20 23 37 Segment EBITDA $39 $40 $57 $57 $44
