Attached files
| file | filename |
|---|---|
| 8-K - 8-K - KELLY SERVICES INC | form8-k2015thirdquartercov.htm |
| EX-99.1 - EXHIBIT 99.1 - KELLY SERVICES INC | a20153qearningsreleaseform.htm |

Kelly Services, Inc. Third Quarter 2015 Results 1 November 4, 2015 Exhibit 99.2
The information provided in this presentation relating to future events are subject to risks and uncertainties, such as competition; changing market and economic conditions; currency fluctuations; changes in laws and regulations, including tax laws, and other factors discussed in the company’s SEC filings. These documents contain and identify important factors that could cause actual results to differ materially from those contained in our projections or forward-looking statements and we have no intention to update these statements. Safe Harbor Statement 2
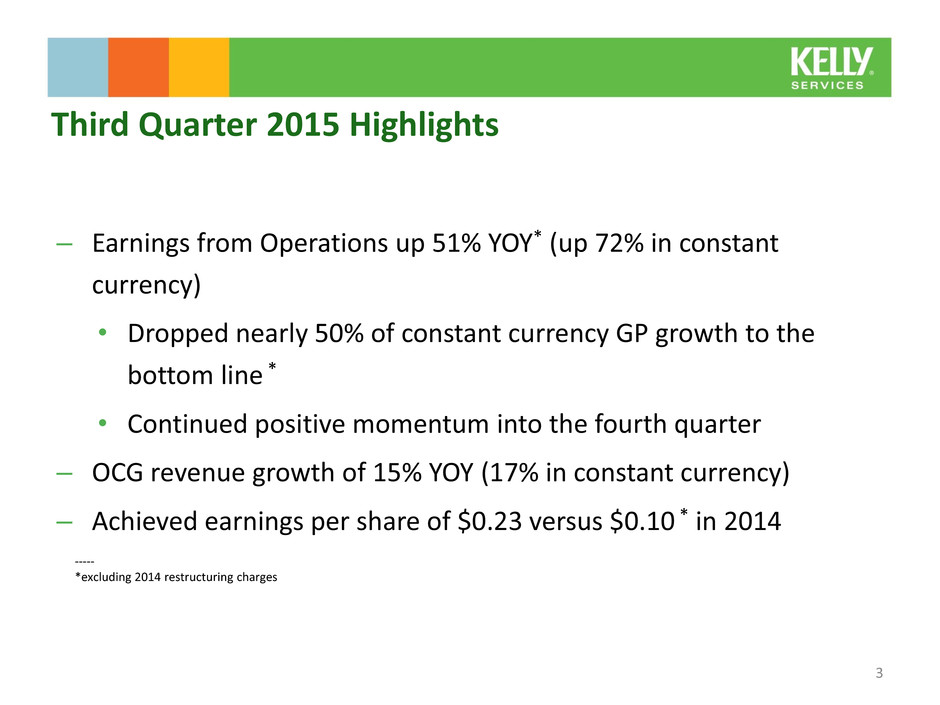
– Earnings from Operations up 51% YOY* (up 72% in constant currency) • Dropped nearly 50% of constant currency GP growth to the bottom line * • Continued positive momentum into the fourth quarter – OCG revenue growth of 15% YOY (17% in constant currency) – Achieved earnings per share of $0.23 versus $0.10 * in 2014 Third Quarter 2015 Highlights 3 ----- *excluding 2014 restructuring charges
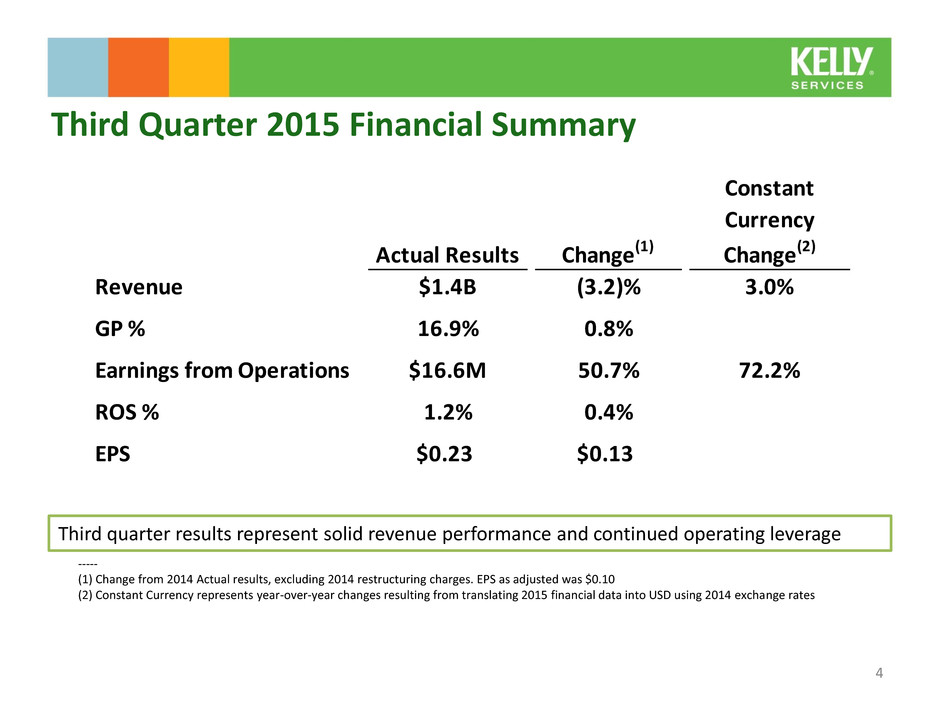
Third quarter results represent solid revenue performance and continued operating leverage Third Quarter 2015 Financial Summary 4 Actual Results Change(1) Constant Currency Change(2) Revenue $1.4B (3.2)% 3.0% GP % 16.9% 0.8% Earnings from Operations $16.6M 50.7% 72.2% ROS % 1.2% 0.4% EPS $0.23 $0.13 ----- (1) Change from 2014 Actual results, excluding 2014 restructuring charges. EPS as adjusted was $0.10 (2) Constant Currency represents year-over-year changes resulting from translating 2015 financial data into USD using 2014 exchange rates
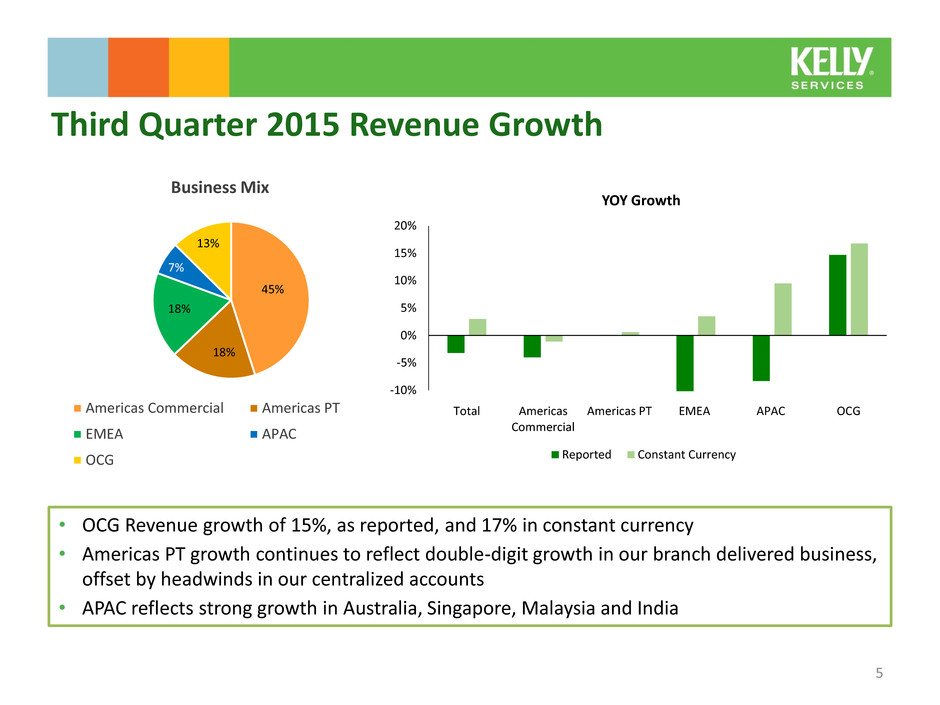
• OCG Revenue growth of 15%, as reported, and 17% in constant currency • Americas PT growth continues to reflect double-digit growth in our branch delivered business, offset by headwinds in our centralized accounts • APAC reflects strong growth in Australia, Singapore, Malaysia and India Third Quarter 2015 Revenue Growth 5 45% 18% 18% 7% 13% Business Mix Americas Commercial Americas PT EMEA APAC OCG -10% -5% 0% 5% 10% 15% 20% Total Americas Commercial Americas PT EMEA APAC OCG YOY Growth Reported Constant Currency
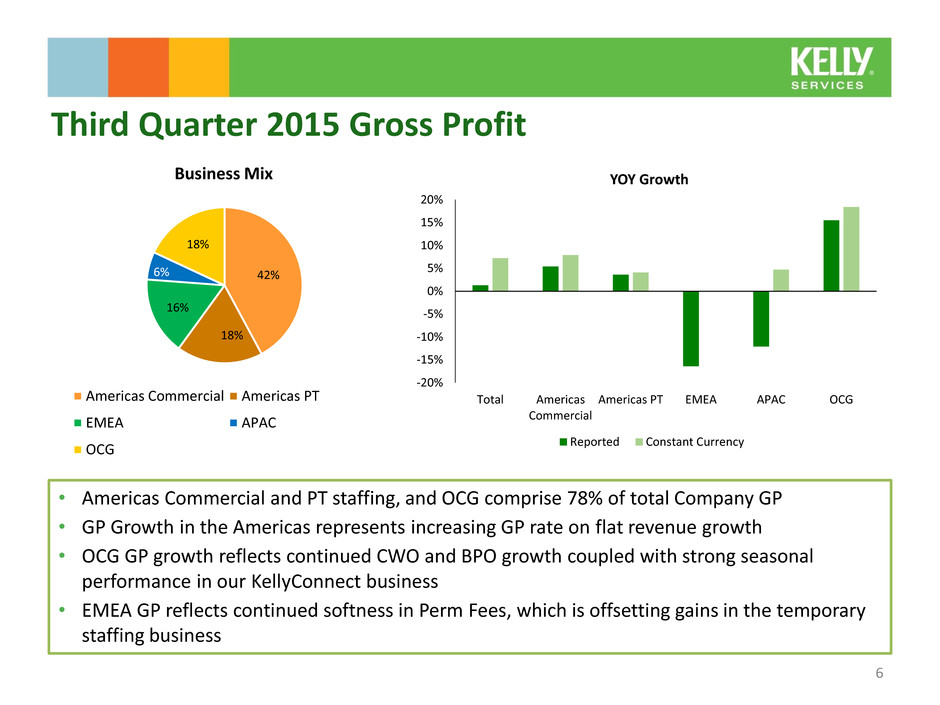
• Americas Commercial and PT staffing, and OCG comprise 78% of total Company GP • GP Growth in the Americas represents increasing GP rate on flat revenue growth • OCG GP growth reflects continued CWO and BPO growth coupled with strong seasonal performance in our KellyConnect business • EMEA GP reflects continued softness in Perm Fees, which is offsetting gains in the temporary staffing business Third Quarter 2015 Gross Profit 6 42% 18% 16% 6% 18% Business Mix Americas Commercial Americas PT EMEA APAC OCG -20% -15% -10% -5% 0% 5% 10% 15% 20% Total Americas Commercial Americas PT EMEA APAC OCG YOY Growth Reported Constant Currency
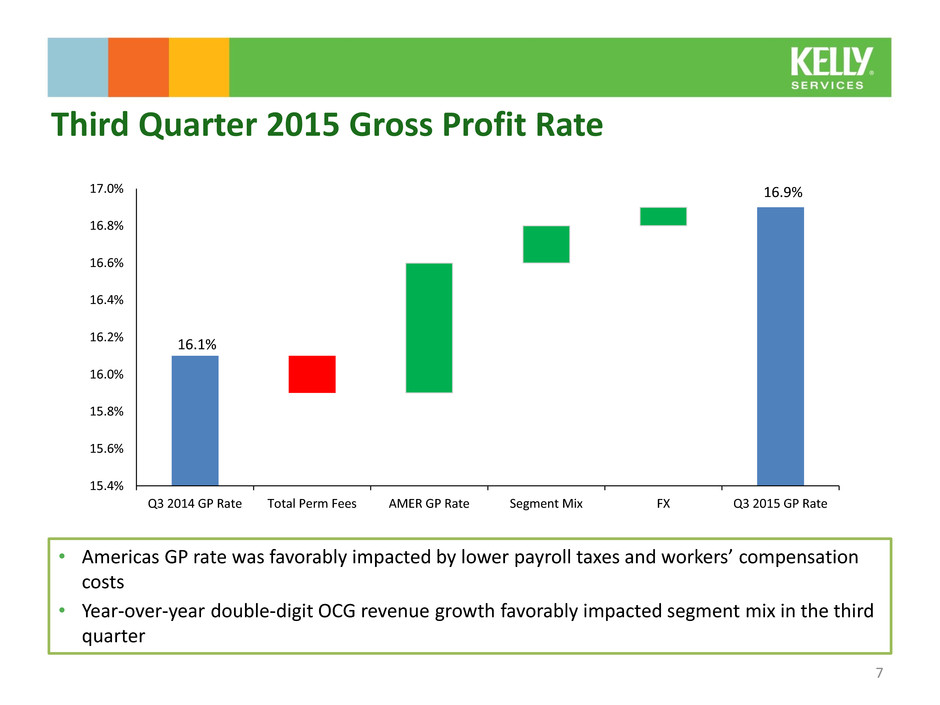
• Americas GP rate was favorably impacted by lower payroll taxes and workers’ compensation costs • Year-over-year double-digit OCG revenue growth favorably impacted segment mix in the third quarter Third Quarter 2015 Gross Profit Rate 16.1% 16.9% 7 15.4% 15.6% 15.8% 16.0% 16.2% 16.4% 16.6% 16.8% 17.0% Q3 2014 GP Rate Total Perm Fees AMER GP Rate Segment Mix FX Q3 2015 GP Rate
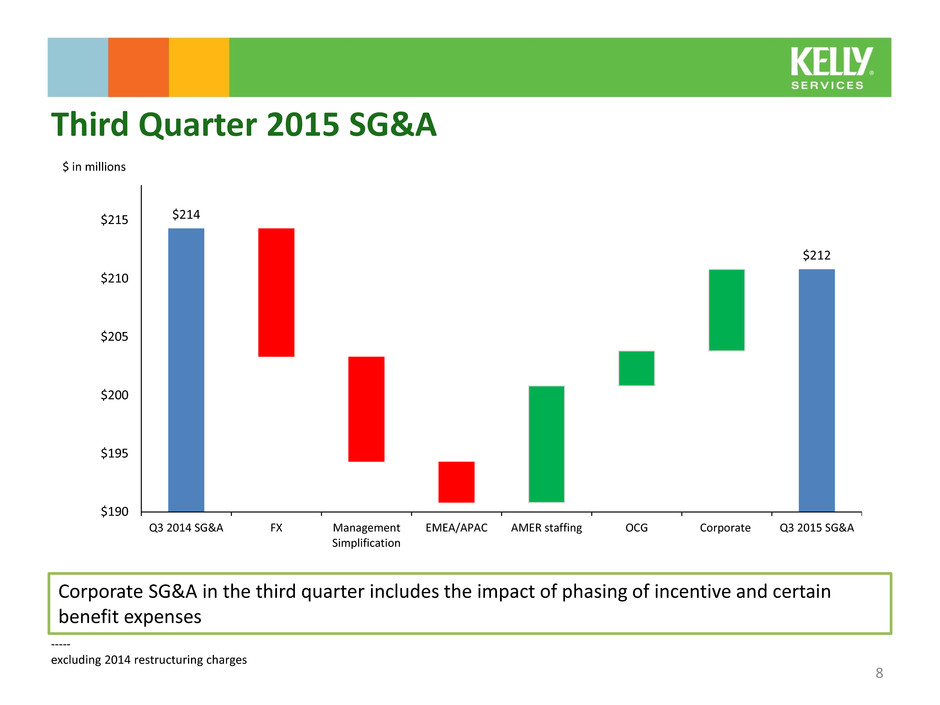
Corporate SG&A in the third quarter includes the impact of phasing of incentive and certain benefit expenses Third Quarter 2015 SG&A 8 $ in millions $214 $212 $190 $195 $200 $205 $210 $215 Q3 2014 SG&A FX Management Simplification EMEA/APAC AMER staffing OCG Corporate Q3 2015 SG&A ----- excluding 2014 restructuring charges
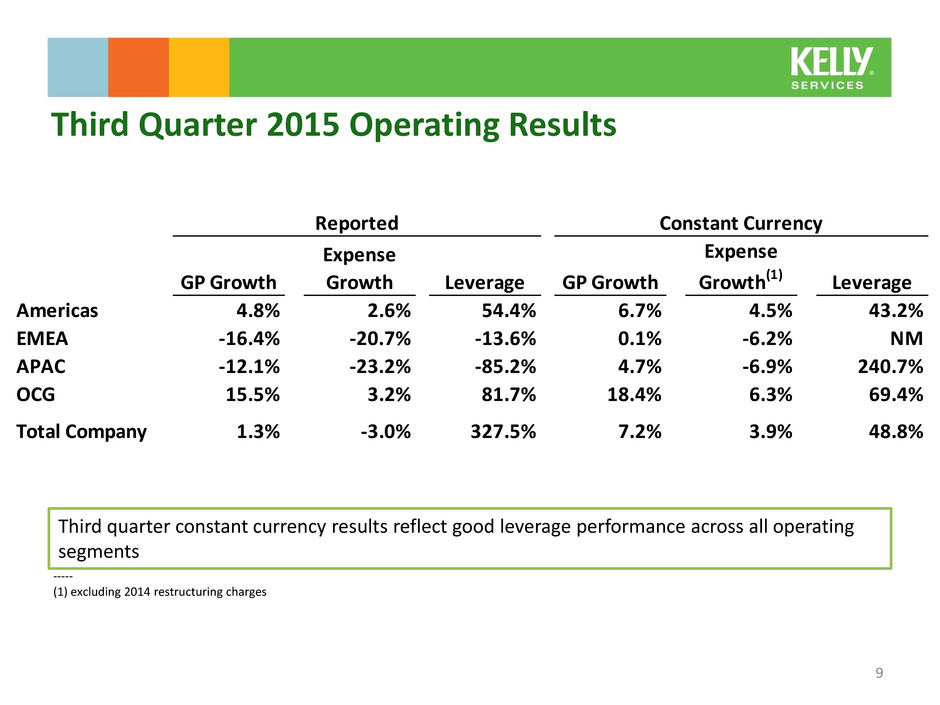
Third quarter constant currency results reflect good leverage performance across all operating segments Third Quarter 2015 Operating Results 9 ----- (1) excluding 2014 restructuring charges GP Growth Expense Growth Leverage GP Growth Expense Growth(1) Leverage Americas 4.8% 2.6% 54.4% 6.7% 4.5% 43.2% EMEA -16.4% -20.7% -13.6% 0.1% -6.2% NM APAC -12.1% -23.2% -85.2% 4.7% -6.9% 240.7% OCG 15.5% 3.2% 81.7% 18.4% 6.3% 69.4% Total Company 1.3% -3.0% 327.5% 7.2% 3.9% 48.8% Reported Constant Currency
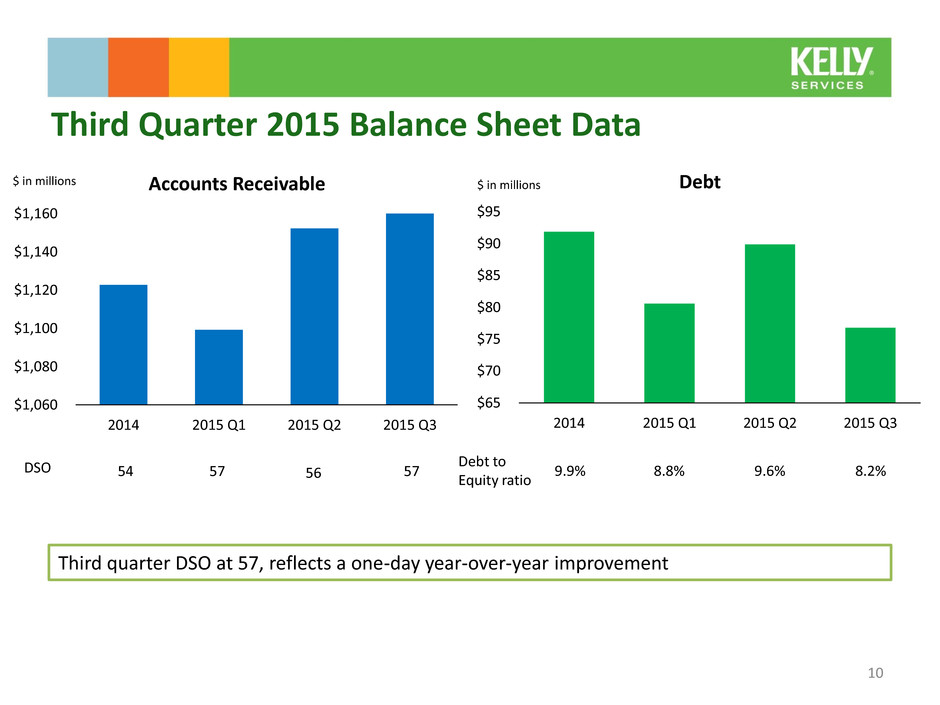
$65 $70 $75 $80 $85 $90 $95 2014 2015 Q1 2015 Q2 2015 Q3 Debt $1,060 $1,080 $1,100 $1,120 $1,140 $1,160 2014 2015 Q1 2015 Q2 2015 Q3 Accounts Receivable Third quarter DSO at 57, reflects a one-day year-over-year improvement Third Quarter 2015 Balance Sheet Data $ in millions $ in millions 10 54 57 57 56 DSO 9.9% 8.8% 9.6% 8.2% Debt to Equity ratio
• Revenue up 5.5% to 6.5% YOY in constant currency – Includes impact of 53rd week • Gross Profit Rate up YOY • SG&A up 2% to 2.5% YOY • Annual tax rate at 20%, assuming Work Opportunity Credits are enacted in 2015 Fourth Quarter 2015 Outlook 11
