Attached files
| file | filename |
|---|---|
| EX-32 - CERTIFICATION PURSUANT TO 18 U.S.C. SECTION 1350 - CHECKPOINT SYSTEMS INC | ckp-20141228xexx32restated.htm |
| EX-23 - CONSENT OF INDEPENDENT REGISTERED PUBLIC ACCOUNTING FIRM - CHECKPOINT SYSTEMS INC | ckp-20141228xexx23restated.htm |
| EX-21 - CHECKPOINT SYSTEMS, INC. SUBSIDIARIES - CHECKPOINT SYSTEMS INC | ckp-20141228xexx21restated.htm |
| EX-31.2 - CERTIFICATION OF CFO - CHECKPOINT SYSTEMS INC | ckp-20141228xexx312restated.htm |
| EX-31.1 - CERTIFICATION OF CEO - CHECKPOINT SYSTEMS INC | ckp-20141228xexx311restated.htm |
UNITED STATES
SECURITIES AND EXCHANGE COMMISSION
WASHINGTON, D.C. 20549
_______________________________
FORM 10-K/A
Amendment No. 1
ANNUAL REPORT PURSUANT TO SECTION 13 OR 15(d)
OF THE SECURITIES EXCHANGE ACT OF 1934
For the fiscal year ended December 28, 2014
Commission File No. 1-11257
CHECKPOINT SYSTEMS, INC.
(Exact name of Registrant as specified in its Articles of Incorporation)
Pennsylvania | 22-1895850 | |||
(State of Incorporation) | (IRS Employer Identification No.) | |||
101 Wolf Drive, PO Box 188, Thorofare, New Jersey | 08086 | |||
(Address of principal executive offices) | (Zip Code) | |||
856-848-1800 | ||
(Registrant’s telephone number, including area code) | ||
Securities registered pursuant to Section 12(b) of the Act:
Title of each class so registered | Name of each exchange on which registered | |||
Common Stock, Par Value $.10 Per Share | New York Stock Exchange | |||
Securities registered pursuant to Section 12(g) of the Act: None | ||
(Title of class) | ||
Indicate by check mark if the registrant is a well-known seasoned issuer, as defined in Rule 405 of the Securities Act. Yes o No þ
Indicate by check mark if the registrant is not required to file reports pursuant to Section 13 or Section 15(d) of the Exchange Act. Yes o No þ
Indicate by check mark whether the registrant (1) has filed all reports required to be filed by Section 13 or 15(d) of the Securities Exchange Act of 1934 during the preceding 12 months (or for such shorter period that the registrant was required to file such reports), and (2) has been subject to such filing requirements for the past 90 days. Yes þ No o
Indicate by check mark whether the registrant has submitted electronically and posted on its corporate Web site, if any, every Interactive Data File required to be submitted and posted pursuant to Rule 405 of Regulation S-T (§ 232.05 of this chapter) during the preceding 12 months (or for such shorter period that the registrant was required to submit and post such files). Yes þ No o
Indicate by check mark if disclosure of delinquent filers pursuant to Item 405 of Regulation S-K is not contained herein, and will not be contained, to the best of registrant’s knowledge, in definitive proxy or information statements incorporated by reference in Part III of this Form 10-K or any amendment to this Form 10-K. þ
Indicate by check mark whether the registrant is a large accelerated filer, an accelerated filer, a non-accelerated filer, or a smaller reporting company. See the definitions of “large accelerated filer,” “accelerated filer” and “smaller reporting company” in Rule 12b-2 of the Exchange Act.:
Large accelerated filer o | Accelerated filer þ | Non-accelerated filer o | Smaller reporting company o | |||
(Do not check if a smaller reporting company) | ||||||
Indicate by check mark whether the registrant is a shell company (as defined in Rule 12b-2 of the Exchange Act). Yes o No þ
As of June 29, 2014, the aggregate market value of the Common Stock held by non-affiliates of the Registrant was approximately $577,525,584.
As of March 2, 2015, there were 41,830,156 shares of the Common Stock outstanding.
DOCUMENTS INCORPORATED BY REFERENCE
Portions of the Registrant’s Definitive Proxy Statement for its 2014 Annual Meeting of Shareholders are incorporated by reference into Part III of this Form 10-K.
EXPLANATORY NOTE
Checkpoint Systems, Inc. is filing this Amendment No. 1 on Form 10-K/A (this "Amended Filing") to our Annual Report on Form 10-K for the fiscal year ended December 28, 2014 (the "Original Filing") to: (i) reissue the Report of Independent Registered Public Accounting Firm to restate the firm's opinion regarding the effectiveness of our internal control over financial reporting as of December 28, 2014; (ii) amend and restate management's conclusions regarding internal control over financial reporting and disclosure controls and procedures as of December 28, 2014; (iii) add discussion of the risks associated with a material weakness in internal control over financial reporting as of December 28, 2014; and (iv) provide certain required exhibits. This Amended Filing sets forth the Original Filing in its entirety; however, pursuant to Rule 12b-15 under the Securities Exchange Act of 1934, as amended (“Exchange Act”), this Amended Filing amends and restates only the following Items of the Original Filing:
PART I
Item 1A – Risk Factors
PART II
Item 8 – Financial Statements and Supplementary Data
Item 9A – Controls and Procedures
PART IV
Item 15 – Exhibits (with respect to Exhibits 23, 31.1, 31.2 and 32.1)
On November 2, 2015, our Audit Committee of the Board of Directors concluded, in consultation with management and after discussion with our independent registered public accounting firm (PricewaterhouseCoopers LLP), that, due to the effect of a material error in the accounting for our quarterly income tax provision, our unaudited consolidated financial statements for the quarter ended March 29, 2015 included in our Quarterly Report on Form 10-Q for the quarter ended March 29, 2015 and our unaudited consolidated financial statements for the quarter ended June 28, 2015 and the year-to-date period ended June 28, 2015 included in our Quarterly Report on Form 10-Q for the quarter ended June 28, 2015 should no longer be relied upon.
We concluded that the effect of the error on interim periods within our 2014 fiscal year were not material. There is no effect of the error on our consolidated financial statements for the year ended December 28, 2014 or any prior period.
As a result of the determination to restate these previously-issued financial statements, management re-evaluated the effectiveness of the design and operation of our internal control over financial reporting and disclosure controls and procedures and has concluded that we did not maintain effective controls over the period end financial reporting process for the quarterly periods ended March 29, 2015 and June 28, 2015. Specifically, effective controls were not maintained over the accounting for our quarterly income tax calculation surrounding the inclusion or exclusion of entities with valuation allowances. Additionally, we incorrectly calculated the valuation allowance related to a non U.S. entity with a deferred tax liability related to an indefinite lived intangible. Because of this material weakness, management, including the Chief Executive Officer and Acting Chief Financial Officer, concluded that our disclosure controls and procedures were not effective as of March 29, 2015 and June 28, 2015. These control deficiencies could have resulted in misstatements of income taxes and disclosures that would result in a material misstatement of the consolidated financial statements that would not have been prevented or detected. Accordingly, management has determined that our internal control over financial reporting and disclosure controls and procedures were not effective as of December 28, 2014. See Item 9A., “Controls and Procedures,” for discussion of management’s disclosure controls and procedures, management’s restated annual report on internal control over financial reporting, status of remediation efforts, and changes in internal control over financial reporting.
Notwithstanding the material weakness described above, our management has concluded that our consolidated financial statements included in our Annual Report on Form 10-K for the year ended December 28, 2014, as previously filed with the SEC, are fairly stated in all material respects in accordance with generally accepted accounting principles in the United States of America for each of the periods presented and that they may still be relied upon.
We are re-assessing the design of the controls and modifying processes related to the calculation of our interim effective tax rate as well as enhancing monitoring and oversight controls in the application of applicable accounting guidance related to the tax treatment of jurisdictions with valuation allowances. We believe that these initiatives will remediate the material weakness in internal control over financial reporting described above. We will test the ongoing operating effectiveness of the revised controls in future periods. The material weakness cannot be considered remediated until the applicable controls operate for a sufficient period of time and management has concluded, through testing, that these controls are operating effectively.
As required by Rule 12b-15, our Chief Executive Officer and Acting Chief Financial Officer are providing new currently dated certifications (Exhibits 31.1, 31.2 and 32.1). In addition, we are filing a reissued report and a new consent of PricewaterhouseCoopers LLP (Exhibit 23).
This Amended Filing does not modify or update other disclosures presented in the Original Filing, including the exhibits to the Original Filing, except as identified above. As such, except for the items identified above, this Amended Filing speaks as of March 5, 2015, the original filing date, and any forward-looking statements represent management's views as of that date and should not be assumed to be accurate as of any date thereafter. This Amended Filing should be read in conjunction with our other filings made with the Securities and Exchange Commission subsequent to March 5, 2015.
CHECKPOINT SYSTEMS, INC.
FORM 10-K/A
Table of Contents
Page | |||
4
PART I
CAUTIONARY NOTE REGARDING FORWARD-LOOKING STATEMENTS
This Annual Report contains forward-looking statements within the meaning of Section 21E of the Securities Exchange Act of 1934, as amended, that involve risks and uncertainties and reflect the Company’s judgment as of the date of this report. Forward-looking statements often address our expected future business and financial performance, and often contain words such as “expect,” “forecast,” “anticipate,” “intend,” “plan,” “believe,” “seek,” or “will.” By their nature, forward-looking statements address matters that are subject to risks and uncertainties. Any such forward-looking statements may involve risk and uncertainties that could cause actual results to differ materially from any future results encompassed within the forward-looking statements. Factors that could cause or contribute to such differences include, but are not limited, to the following: the impact upon operations of legal and tax compliance matters or internal controls review, improvement and remediation, including the detection of wrongdoing, improper activities, or circumvention of internal controls; our ability to successfully implement our strategic plan; our ability to manage growth effectively including our ability to integrate acquisitions and to achieve our financial and operational goals for our acquisitions; changes in economic or international business conditions; foreign currency exchange rate and interest rate fluctuations; lower than anticipated demand by retailers and other customers for our products; slower commitments of retail customers to chain-wide installations and/or source tagging adoption or expansion; possible increases in per unit product manufacturing costs due to less than full utilization of manufacturing capacity as a result of slowing economic conditions or other factors; our ability to provide and market innovative and cost-effective products; the development of new competitive technologies; our ability to maintain our intellectual property; competitive pricing pressures causing profit erosion; the availability and pricing of component parts and raw materials; possible increases in the payment time for receivables as a result of economic conditions or other market factors; our ability to comply with covenants and other requirements of our debt agreements; changes in regulations or standards applicable to our products; our ability to successfully implement global cost reductions in operating expenses including, field service, sales, and general and administrative expense, and our manufacturing and supply chain operations without significantly impacting revenue and profits; our ability to maintain effective internal control over financial reporting; risks generally associated with information systems upgrades and our company-wide implementation of an enterprise resource planning (ERP) system; and additional matters discussed more fully in this report under Item 1A. “Risk Factors Related to Our Business” and Item 7. “Management’s Discussion and Analysis.” Readers are cautioned not to place undue reliance on these forward-looking statements, which speak only as of their dates. We do not undertake to update our forward-looking statements, except as required by applicable securities laws.
Item 1. BUSINESS
Checkpoint Systems, Inc. is a leading global manufacturer and provider of technology-driven loss prevention, inventory management and labeling solutions to the retail and apparel industries. Our loss-prevention business is built on more than 40 years of radio-frequency (RF) technology expertise. The systems and services included in this business enable retailers and their suppliers to reduce shrink while leveraging real-time data generated by our systems to improve operational efficiency.
Within loss-prevention, we are a leading provider of electronic article surveillance (EAS) systems and tags using RF. We also engineer systems using RF and acousto-magnetic (AM) technology. Our loss prevention solutions enable retailers to safely display merchandise in an open environment. We also offer customers the convenience of tagging their merchandise or associated packaging at the manufacturing source.
Increasingly, retailers and manufacturers are focused on tracking assets moving through the supply chain. In response to this growing market opportunity, we provide a portfolio of inventory management solutions in the form of Radio Frequency Identification (RFID) products and services principally for closed-loop apparel retailers and department stores. Our products give customers precise details on merchandise location and quantity as it travels from the manufacturing source through to the retail store.
We manufacture and sell worldwide a variety of tickets, tags and labels for customers in the retail and apparel industry. Applications include variable data management and printing, with size, care, content, pricing information, and brand identification. In addition, we offer barcode printing and integrated EAS tags for loss prevention and integrated RFID tags for item tracking and inventory management.
In Europe, we are a leading provider of retail display systems (RDS) and hand-held labeling systems (HLS) used for retail price marking and industrial applications.
5
We operate directly in 27 countries. Our products are principally developed and manufactured in-house and sold through direct distribution and reseller channels.
COMPANY HISTORY
We were founded in 1969 and incorporated in Pennsylvania as a wholly-owned subsidiary of Logistics Industries Corporation (Logistics). In 1977, pursuant to the terms of its merger into Lydall, Inc., Logistics distributed our common stock to Logistics' shareholders as a dividend.
Historically, we have expanded our business both domestically and internationally through acquisitions, internal growth via wholly-owned subsidiaries, and independent distributors. In 1993 and 1995, we completed two acquisitions that gave us direct access into Western Europe. We acquired ID Systems International BV and ID Systems Europe BV in 1993 and Actron Group Limited in 1995. These companies manufactured, distributed, and sold EAS systems throughout Europe.
In December 1999, we acquired Meto AG, a German multinational corporation and a leading provider of value-added labeling solutions for article identification and security. This acquisition doubled our revenues and broadened our product offering and global reach.
In January 2001, we acquired A.W. Printing Inc., a U.S.-based printer of tags, labels, and packaging material for the apparel industry.
In January 2006, we completed the sale of our barcode systems business to SATO, a global leader in barcode printing, labeling, and Electronic Product Code (EPC)/ RFID solutions.
In November 2006, we acquired ADS Worldwide (ADS). Based in the U.K., ADS supplied tags, labels and trim to apparel manufacturers, retailers and brands around the world. This acquisition gave us new technological and production capabilities and enhanced our product offerings and solutions for apparel customers.
In November 2007, we acquired the Alpha S3 business from Alpha Security Products, Inc. Headquartered in the U.S., the Alpha S3 business offers security solutions designed to protect merchandise most likely to be stolen on open display in retail environments. The Alpha® S3 portfolio complements our EAS source tagging program, and is in line with our strategy to provide retailers with a comprehensive line of loss-prevention solutions.
In November 2007, we also acquired SIDEP, an established supplier of EAS systems operating in France and China, and Shanghai Asialco Electronics Co. Ltd. (Asialco), a China-based manufacturer of RF-EAS labels. With facilities in Shanghai, China, Asialco significantly increased our label manufacturing capacity in Asia. These businesses are helping us to meet growing regional demand.
In January 2008, we purchased the business of Security Corporation, Inc., a privately held company that provided technology and physical security solutions to the financial services sector and served as the foundation for the Banking Security Systems Integration business unit that was focused on the southeast region of the U.S. In October 2012, we completed the sale of this non-strategic business unit that was formerly part of our Merchandise Availability Solutions (MAS) segment.
In June 2008, we acquired OATSystems, Inc., a recognized leader in RFID-based application software. This acquisition positioned us to offer a complete end-to-end solution of RFID hardware and software, tags and labels, service and supply to closed-loop apparel retailers and department stores for inventory tracking and management purposes. We believe this single-source capability gives us an advantage over competing providers.
In August 2009, we acquired Brilliant Label Manufacturing Ltd., a China-based manufacturer of paper, fabric and woven tags and labels. Through its facilities in Hong Kong and China, Brilliant Label added capacity to Checkpoint's apparel labeling business and expanded our manufacturing footprint, enabling us to meet greater demand.
In May 2011, through the acquisition of equity and/or assets, we acquired the Shore to Shore businesses. Shore to Shore designs, manufactures and sells tags and labels, brand protection and EAS solutions for apparel and footwear application. This acquisition further expanded our tag and label production capabilities and global reach.
In April 2013, we completed the sale of our U.S. and Canada based CheckView® business, formerly part of our MAS segment, in order to focus on the growth of our core business.
6
BUSINESS STRATEGY
In 2012, we refined our business strategy to transition from a product protection business to a provider of inventory management solutions that give retailers ready insight into the on-shelf availability of merchandise in their stores. In support of this strategy, we continue to provide to retailers, manufacturers and distributors our EAS systems and consumables, Alpha® high-theft solutions, and Merchandise Visibility™ (RFID) products and services. In apparel labeling, we are focusing on those products that support our refined strategy and leveraging our competitive advantage in the transfer and printing of variable data onto apparel labels. We will also consider acquisitions that are aligned with our strategic plan.
Our solutions help customers identify, track, and protect their assets. We believe that innovative new products and expanded product offerings will provide opportunities to enhance the value of legacy products while expanding the product base in existing customer accounts. We intend to maintain our leadership position in key hard goods markets (supermarkets, drug stores, mass merchandisers, and music and electronics retailers), expand our market share in soft goods markets (specifically apparel), and maximize our position in under-penetrated markets. We also intend to continue to capitalize on our installed base of large global retailers to promote source tagging. Furthermore, we plan to leverage our knowledge of RF and identification technologies to assist retailers and manufacturers in realizing the benefits of RFID.
To achieve these objectives, we expect to continuously enhance and expand our technologies and products, and provide superior service to our customers. We intend to offer customers a wide variety of integrated shrink management solutions, apparel labeling, and retail merchandising solutions characterized by superior quality, ease-of-use, and good value, with enhanced merchandising opportunities. In 2014, we reiterated our commitment to this strategy and our focus on innovation and internally-developed technologies with the appointment of a Senior Vice President of Innovation. We are building a corporate development and mergers and acquisitions (M&A) team to complement our internally-developed innovation with targeted strategic acquisitions.
We continue to evaluate our sales, productivity, manufacturing, supply chain efficiency and overhead structure, and we will take action where specific opportunities exist to improve profitability.
Products and Offerings
We report our financial results in three segments: Merchandise Availability Solutions (MAS), Apparel Labeling Solutions (ALS), and Retail Merchandising Solutions (RMS).
Our MAS segment, which is focused on loss prevention and Merchandise Visibility™ (RFID), includes EAS systems, EAS consumables, Alpha® high-theft solutions, RFID systems and software and CheckView® in Asia. ALS includes the results of our radio frequency identification (RFID) labels business, coupled with our data management platform and network of service bureaus that manage the printing of variable information on apparel labels and tags. Our RMS segment includes hand-held labeling applicators and tags, promotional displays, and customer queuing systems. The revenues, gross profit and total assets for each of the segments are included in Note 18 of the Consolidated Financial Statements.
Each of these segments offers an assortment of products and services that in combination are designed to provide a comprehensive, single stop shop solution to help retailers, manufacturers, and distributors identify, track, and protect their assets throughout the supply chain. Each segment and its respective products and services are described below.
MERCHANDISE AVAILABILITY SOLUTIONS
Our largest segment provides shrink management and inventory management (RFID) solutions to retailers. Merchandise Availability Solutions represented approximately 66%, 67%, and 65% of total revenues in 2014, 2013, and 2012, respectively.
The diversified line of products offered in this segment is designed to help retailers in a number of ways: prevent inventory losses caused by theft, reduce selling costs through lower staff requirements, enhance consumer shopping experiences, improve inventory management, and boost sales by having the right goods available when consumers are ready to buy. These broad and flexible product lines are marketed and serviced by our direct sales and service organizations, in all major markets, complemented by an extensive distributor and franchisee network, positioning Checkpoint to be a preferred supplier to retailers around the world.
Our EAS products let retailers openly display their merchandise, which contributes to maximizing sales. We believe that we hold a significant share of installed worldwide EAS systems through the deployment of our proprietary EAS-RF technologies. EAS systems revenues accounted for 27%, 28%, and 28% of our 2014, 2013, and 2012 total revenues, respectively.
7
We offer a wide variety of EAS-RF labels and tags, collectively called EAS consumables, matched to specific retail requirements. Under our source tagging program, EAS labels and tags are attached to, or embedded in, products or packaging at the point of manufacture. Our Hard Tag @ Source™ program is designed for apparel customers who prefer to use hard tags for garment security but who also wish to avoid the expense of in-store tag application. These light-weight tags are recyclable, which is a global service program that we offer to our customers.
All participants in the retail supply chain look for ways to operate with maximum efficiency. Many of our products and services, including labels that are fully integrated with EAS and/or RFID capability, help our customers to achieve critical objectives, such as meeting tight delivery schedules and preventing losses caused by tracking failure, theft, misplacement or counterfeiting. EAS consumables revenues represented 16%, 15% and 14% of our total revenues for 2014, 2013, and 2012, respectively.
Our Alpha® solutions are focused on two niche areas in retail theft: the need to protect high-risk merchandise and the need to safely display merchandise in ways that permit consumers to pick up and handle goods before deciding to buy. For 2014, 2013, and 2012, our Alpha® business represented 19%, 19%, and 18% of our revenues, respectively.
Our U.S. and Canada CheckView® business has been divested. We will continue to provide CheckView® CCTV services in Asia in connection with EAS systems when our customers require combined security solutions.
No other product group in this segment accounted for as much as 10% of our revenues. Our Merchandise Visibility™ (RFID) business enables us to offer a complete end-to-end solution of RFID hardware and software, service and supply to our customers for inventory tracking and management purposes.
Electronic Article Surveillance Systems
We offer a wide variety of EAS-RF systems tailored to meet the varied requirements of retail store configurations in multiple market segments. Our systems are designed to act as a visible deterrent to merchandise theft. They are comprised of antennas and deactivation units which respond to or act upon our EAS tags and labels. Antennas include readers, sometimes integrated, sometimes external, that can be RFID-enabled. Our business model typically relies on customer commitments for EAS product installations in a large number of stores over a period of several months.
Our antennas and deactivators are technology-rich and upgradable. Our EVOLVE™ platform sets a new standard in retail loss prevention and customer tracking. With its advanced data analytics and networking capabilities, EVOLVE™ delivers superior performance coupled with significant energy savings. EVOLVE™ is compatible with our EAS software suite and EAS and RFID tags and labels, as well as products of other suppliers.
In 2012, we introduced a new range of antennas that provides retailers with similarly enhanced functionality. Available in varied design options, including aesthetically pleasing formats to complement our customers' retail stores, the CLASSIC IP range offers wider aisle-width protection plus the energy-savings electronics found in EVOLVETM. In 2013, we added a new floor antenna and a new dual RF/RFID pedestal series to our EVOLVE™ Exclusive Series.
Our EAS products are designed and built to comply with applicable Federal Communications Commission (FCC) and European Community (EC) regulations governing RF, signal strengths, and other factors.
Electronic Article Surveillance Consumables
We offer a wide variety of EAS-RF labels that work in combination with our EAS systems to protect a wide range of merchandise for several types of retail environments. Our diversified line of discrete, disposable labels is designed to enable retailers to protect a wide array of easily-pocketed, high-shrink merchandise. Our paper-thin EAS labels have characteristics that are easily integrated with high-speed, automated application systems. While EAS labels can be applied in retail stores and distribution centers, many customers take advantage of our source tagging program. In source tagging programs, EAS labels and hard tags are configured to customers' merchandise and specific security requirements and applied at the point of manufacture or packaging.
We believe our enhanced performance (EP) labels carry the smallest circuit design on the worldwide market, while simultaneously delivering superior performance in both detection and deactivation. These labels offer protection to health and beauty items and other small-sized merchandise. Included in this range is EP CLEAR, a see-through format that that allows brand and packaging information to remain visible. The EP CLEAR Tamper Tag features an added benefit, a strong adhesive
8
bond designed to degrade packaging if removed. This acts as a further deterrent to thieves intending to steal and then resell the merchandise.
Our Hard Tag @ Source™ (HT@S) program combines the benefits of a strong visual theft deterrent with point-of-manufacture tagging. These tags are lightweight, reusable and visually pleasing, while offering superior detection and easy removal upon purchase. HT@S ensures consistency and tagging compliance while removing the high cost of in-store tagging labor.
In 2012, we introduced our Infinite Solutions (iS) product series developed based on input from our retail customers who desired to have a merchandise protection solution for merchandise that might otherwise be left unprotected. Available in varying formats, this disposable product line offers the visual protection of a hard tag with flexible options for attaching to merchandise.
Alpha®
Alpha® high-theft solutions complement our EAS systems. Alpha® pioneered the “open display” security philosophy by providing retailers a truly safe means to bring merchandise from behind locked cabinets and openly display it. The Alpha® product line supplies retailers with innovative and technically advanced solutions to protect high-risk, and in some cases, high-value, merchandise. Applications are many and varied depending on the merchandise and location to be protected. Products include Keepers™, Spider Wraps®, Bottle Security, Cable Loks®, hard tags, NanoGates® and Showsafe™. All Alpha® products are available in AM or RF formats.
In 2013, Alpha responded to market challenges facing health and beauty merchandise (perfumes, skin care, cosmetics) with new additions to its Keepers™ category. It also launched next generation offerings of Spider Wraps® and Specialty Hard Tags.
Merchandise Visibility Solutions (RFID)
Our Merchandise Visibility™ product line gives retailers and their suppliers key insights into the location and quantity of merchandise as it travels through the supply chain. Our solutions integrate RFID at point of manufacture, through logistics and distribution operations, into and throughout the store, including exit points. Our Merchandise Visibility™ Solutions encompass a comprehensive, integrated set of hardware, software, tags and services. These solutions are based on RFID technology, and enable closed-loop apparel retailers and department stores to achieve key operational objectives including reducing out-of-stocks, maximizing on-shelf availability, reducing working capital requirements, and increasing sales.
Our Merchandise Visibility™ solutions are tailored to each retailer's unique requirements, and we take full, end-to-end responsibility for all aspects of planning, development, deployment and training. We are unique in our ability to provide and support the full range of products and services needed to implement a complete RFID solution for retailers. These solutions employ a number of innovative products and technologies, including a broad range of RFID tags and labels for a wide variety of products and applications. Among our key enabling and differentiable technologies is Wirama Radar™, a patented technology that improves tag-reading accuracy at a store's point of exit and helps retailers make better use of valuable front-of-store real estate by reducing “stray reads” and improving tag-reading integrity. Another unique capability is our RFID middleware and application software, which was the catalyst behind the Company's 2008 acquisition of RFID software pioneer OATSystems, Inc. Our Merchandise Visibility™ software automates the supply chain and in-store inventory management processes, while enabling retailers' existing systems or real-time capabilities. This software is built on the OAT Foundation Suite™.
We also have taken the important step of using our technical and applications expertise to develop solutions that seamlessly integrate Merchandise Visibility with loss prevention; the RFID Based EAS Overhead Solution helps retailers improve their operations by using a single RFID tag to deliver both benefits. In 2013, we launched our unique next generation Overhead Solution for very wide and very high openings, in addition to our best in class dual RF/RFID pedestals and a range of store compliance and on shelf availability software applications.
APPAREL LABELING SOLUTIONS
Apparel Labeling Solutions (ALS) is our second largest segment. ALS revenues represented 26%, 26%, and 27% of our total revenues for 2014, 2013, and 2012, respectively. We provide apparel retailers, brand owners, and manufacturers with a single source for their apparel labeling requirements. ALS also includes our web-based data management service and network of 19 service bureaus strategically located in 16 countries close to where apparel is manufactured. Our data management service offers order entry, logistics, and data management capabilities. It facilitates on-demand printing of variable information onto apparel tags and labels.
9
Apparel labels and the systems that manage them have many different but synergistic roles including variable data management, brand identity, merchandise visibility, shrink management and supply chain management. The apparel labeling business is growing from conveying essential information to the consumer to also sharing critical data about tagged apparel merchandise at the factory, in the store, or at any point in between. We integrate loss prevention and/or merchandise visibility functionality into traditional apparel tags, helping retailers reduce costs and improve operational synergies in their stores and throughout their supply chains. Products include graphic tags and labels, variable data tags and labels, woven labels, care and content labels, printed fabric and specialty trim labels, fully integrated tags and labels and RFID tags and labels.
In the third quarter of 2012, following an extensive strategic review, we developed a comprehensive plan to address operational performance in ALS. The business was fundamentally restructured, including consolidating certain manufacturing operations in order to provide quality merchandising products profitably and on time. We also rationalized our customer base and reviewed our product capabilities to be aligned with our on-shelf availability strategy.
In line with our refined strategy, we are leveraging our competitive advantage in the transfer and printing of variable data onto apparel labels, which increasingly serve as carriers for RFID solutions used in item-level tagging. We believe that our data management and service bureau network is one of the most robust in the industry and we believe our ability to integrate RFID as well as EAS-RF at manufacturing source will place Checkpoint Systems among just a handful of suppliers offering fully integrated, intelligent apparel labeling.
As we narrow our manufacturing focus in apparel labeling, we intend to continue offering our customers all the labeling solutions they need to effectively merchandise their products.
RETAIL MERCHANDISING SOLUTIONS
The Retail Merchandising Solutions (RMS) segment includes hand-held labeling applicators and tags, promotional displays, and customer queuing systems. RMS, which is focused on European and Asian markets, represents approximately 8% of our business, with no product group in this segment accounting for as much as 10% of our revenues. These traditional products broaden our reach among retailers, promote their products and enable them to communicate with their customers in an effective manner. Many of the products in this segment represent high-margin items with a high level of recurring sales of associated consumables such as labels. As a result of the increasing use of digital scanning technology in retail, our hand-held labeling systems serve a declining market.
Hand-held Labeling Systems
Our METO® hand-held labeling systems (HLS) include a complete line of hand-held price marking and label application solutions, primarily sold to retailers and manufacturing industry. Sales of labels, consumables, and service generate a significant source of recurring revenues. As retail scanning becomes widespread, in-store retail price marking applications continue to decline. Our HLS products possess a market-leading position in several European countries.
Retail Display Systems
Our retail display systems (RDS) include a wide range of products for customers in certain retail sectors, such as supermarkets and do-it-yourself, where high-quality signage and in-store price promotion are important. Product categories include traditional retail promotional systems for in-store communication and electronic graphics display, and customer queuing systems. Product categories include traditional in-store retail promotional systems, shelf management solutions and customer queuing systems.
PRINCIPAL MARKETS AND MARKETING STRATEGY
Our mission is to discover meaningful insights into what retailers need in order to sell more and lose less merchandise. We translate those insights into noticeably superior products and solutions that address retailers' needs with a clear return on their investment. We communicate the superiority of our solutions through compelling claims, performance demonstrations, return-on-investment analysis and superior benefit visualization.
We design, engineer, and manufacture the majority of our products. Additionally, we distribute, sell, service and support all of our products. Our core business has evolved from helping retailers reduce theft to improving retailers' merchandise availability at their stores. We do this through merchandise protection, improving inventory visibility to prevent out-of-stocks, and helping improve shoppers' experiences.
10
We offer a broad product portfolio that includes EAS systems comprised of hardware, consumables and software, Alpha® high-theft security solutions, and RFID merchandise visibility solutions including hardware, software, tags and labels. All of this is complemented by our global field services expertise in worldwide installations, maintenance and monitoring of our solutions. We invest time and resources with our partner customers in identifying their critical needs and we commission our innovation team to continue developing solutions that address those needs.
We provide major retailers, brand owners and manufacturers with a single source for their apparel labeling needs using a web-based data management platform, which automatically allocates customer orders to our global manufacturing network.
We sell our product solutions primarily to retailers worldwide in traditional brick-and-mortar stores, and also for extended use in their supply chains. As the retail marketplace continues to change, our solutions have also evolved to help retailers address new challenges. We also work closely with merchandise brand owners to apply our security and inventory management solutions at the point of manufacture, and develop innovative display merchandising that helps to promote their brand in stores. As one of the industry leaders, we earned significant market share, particularly in the supermarket, drug store, hypermarket, and mass merchandiser market segments.
In addition, we offer integrated shrink management and merchandise visibility solutions to retail customers worldwide through our Intelligent Merchandise Availability Program (iMAP). This approach entails a broadened focus within the entire retail market to deliver integrated solutions for loss prevention and inventory management, working seamlessly together to help retailers ensure they have the right merchandise available, at the right place at the right time, when consumers want to buy.
Shoplifting and employee theft are major causes of retail shrinkage. The 2013 Global Retail Theft Barometer estimates that shrink averages 1.29% of retail sales. As a result, retailers recognize that the implementation of effective electronic security solutions can significantly reduce shrinkage, increase their merchandise availability, and enhance their customers' shopping experience. These are among the ways that we help retailers lose less merchandise.
As reported by the University of Arkansas, average retail inventory accuracy is 60-65%, which can lead to out-of-stocks (lost sales) or over-stocks (that later need to be marked-down to sell) when retailers make buying decisions with imperfect data. With RFID, however, inventory accuracy typically increases to between 95% and 99%. This increase in inventory accuracy enables retailers to reduce out-of-stocks and over-stocks and increase both sales and contribution margin significantly.
We are committed to helping retailers grow profitability by providing our customers with a wide variety of solutions. Our ongoing marketing strategy includes the following:
• | Communicating the synergies within our product portfolio to demonstrate the collective value they offer in enhancing merchandise availability, preventing out-of-stocks and improving shoppers' experience |
• | Continuing to develop new product solutions that offer a compelling return-on-investment for retailers to enable us to expand penetration within existing retail accounts and gain new customer accounts |
• | Establishing business-to-business web-based capabilities to enable retailers and manufacturers to initiate and track their orders through the supply chain on a global basis |
• | Continuing to promote source tagging around the world with extensive integration and automation capabilities |
• | Providing a clear migration path from EAS to RFID and from shrink management to merchandise availability that protects retailers' past investment while improving the effectiveness of their purchased assets |
• | Assisting retailers in maximizing the benefits of merchandise visibility through their supply chain all the way to their stores' exit doors - from source to shopper |
We market our products primarily by:
• | Becoming a trusted advisor to our retail customers where we can offer actionable insights to protect merchandise, prevent out-of-stocks, and improve display merchandising |
• | Communicating, messaging and highlighting Checkpoint's unique position as a one-stop provider of integrated and complete solutions for retailers |
• | Demonstrating a return-on-investment model that will deliver proven results |
• | Helping retailers sell more merchandise by avoiding stock-outs, reducing shrink, and making merchandise available to consumers |
• | Working directly with brand owners to improve source-tagging automation |
• | Implementing sales, marketing, comprehensive public relations, and targeted trade show participation |
• | Delivering superior field service and support capabilities |
11
• | Actively participating in and supporting industry associations focused on setting standards, identifying needs, trends, and innovation |
We focus on partnering with retail suppliers worldwide in our source tagging program. Ongoing strategies to increase acceptance of source tagging are as follows:
• | Increasing installation of EAS equipment on a chain-wide basis with leading retailers around the world |
• | Offering integrated tag solutions, including custom tag conversion, that address the multiple but synergistic needs for branding, tracking, and loss prevention |
• | Assisting retailers in promoting source tagging with vendors and brand owners |
• | Broadening the penetration of existing accounts by promoting our in-house printing, global service bureau network, and labeling solution capabilities |
• | Supporting manufacturers and suppliers to speed implementation |
• | Expanding RF tag technologies and products to accommodate the needs of the packaging industry |
• | Developing compatibility with EPC/RFID technologies |
MANUFACTURING, RAW MATERIALS, AND INVENTORY
Merchandise Availability Solutions
We manufacture our EAS systems and consumables, including Alpha® and RFID products, in facilities located in Japan, China, the U.S., and Germany. Our manufacturing strategy for EAS products is to rely primarily on in-house capability for core components and to outsource manufacturing to the extent economically beneficial. We manage the integration of our in-house capability and our outsourced manufacturing in a way that provides significant control over costs, quality, and responsiveness to market demand, which we believe results in a distinct competitive advantage.
We involve customers, engineering, manufacturing, and marketing in the design and development of our products. For the majority of our RF sensor product lines, we purchase raw materials from outside suppliers and assemble electronic components at our facilities in China. The manufacture of some RF sensors sold in Europe is outsourced. For our EAS disposable tag production, we purchase raw materials and components from suppliers and complete the manufacturing process at our facilities in Japan, Germany, and China. For our Alpha® product line production, we purchase raw materials and components from suppliers and complete the manufacturing process at our facilities in the U.S. as well as using outsourced manufacturing in China. For our RFID product line, we primarily rely on outside sources for the bonding of chips to antennas to assemble wet and dry inlays. These inlays are further converted to finished products in Checkpoint facilities in Europe, North America, and Asia.
The principal raw materials and components used by us in the manufacture of our products are electronic components and circuit boards for our systems; aluminum foil, resins, paper, and hydrochloric acid solutions for our disposable tags; outsourced inlays, paper and adhesive for our RFID tags, and polymer resin and electronic components for our Alpha® products. While most of these materials are purchased from several suppliers, there are alternative sources for all such materials. The products that are not manufactured by us are sub-contracted to manufacturers selected for their manufacturing and assembly skills, quality, and price.
Apparel Labeling Solutions
We manufacture labels and tags for apparel. Our ALS network of 19 service bureaus located in 16 countries supplies apparel customers with customized apparel tags and labels to the location where their goods are manufactured. We have an expansive manufacturing presence in 16 countries, all in close proximity to garment manufacturers. Our main production facilities are located in the Netherlands, Bangladesh, and China, with other key production facilities situated in the U.S., China, Hong Kong, India, and Turkey.
Retail Merchandising Solutions
We manufacture hand-held labeling tools and price-marking labels for retail merchandising and manufacturing industry. Our main production facilities are located in Germany and Malaysia. Price-marking labels and print heads for hand-held labeling tools are manufactured in Germany. Our Malaysian facility produces standard bodies for hand-held labeling tools for the European market, completes hand-held tools for the rest of the world, and manufactures price-marking labels for the local market.
12
DISTRIBUTION
For our major product lines, we principally sell to end customers using our direct sales force of more than 350 people. To improve our sales efficiency, we also distribute products through an independent network of resellers. This distribution channel supports and services smaller customers. This indirect channel, which has primarily sold EAS solutions, is being broadened and expanded to include more product lines, including Retail Merchandising Solutions, as we focus on improved sales productivity.
Merchandise Availability Solutions
We sell our EAS systems and consumables, including Alpha® and RFID products principally throughout North America, South America, Europe, and the Asia Pacific regions. In North America, we market our EAS products through our own sales personnel and independent representatives.
Internationally, we market our EAS products principally through foreign subsidiaries which sell directly to the end user and through independent distributors. Our international sales operations are currently located in 11 European countries and in Argentina, Australia, Brazil, Canada, China, Hong Kong, India, Japan, Malaysia, Mexico, New Zealand and Turkey.
Apparel Labeling Solutions
We market our apparel labeling products to apparel retailers and manufacturers, brand owners, and department stores. Large national and international customers are handled centrally by key account sales specialists supported by appropriate business specialists.
Retail Merchandising Solutions
We market our retail merchandising solutions to customers in food retailing and other branches including do-it-yourself (DIY). Large national and international customers are handled centrally by key account sales specialists supported by appropriate business specialists. Smaller customers are served by a general sales force capable of representing all products, a valued partner such as a distributor or franchisee or, if the complexity or size of the business demands, a dedicated business specialist.
BACKLOG
Our backlog of orders was approximately $29.0 million at December 28, 2014, compared to approximately $25.3 million at December 29, 2013. We anticipate that substantially all of the backlog at the end of 2014 will be delivered during 2015. In the opinion of management, the amount of backlog is not indicative of trends in our business. Our security business generally follows the retail cycle so that revenues are weighted toward the last half of the calendar year as retailers prepare for the holiday season.
TECHNOLOGY, PATENTS & LICENSING
We believe that our patented and proprietary technologies are important to our business and future growth opportunities, and provide us with distinct competitive advantages. We continually evaluate our domestic and international patent portfolio, and where the cost of maintaining the patent exceeds its value, such patent may not be renewed. The majority of our revenues are derived from products or technologies that are patented or licensed. There can be no assurance, however, that a competitor could not develop products comparable to ours. Our competitive position is also supported by our extensive manufacturing experience and know-how.
We focus our in-house development efforts on product areas where we believe we can achieve and sustain a competitive cost and positioning advantage, and where service delivery is critical. We also develop and maintain technological expertise in areas that are believed to be important for new product development in our principal business areas. In our apparel labeling business, we have a base of technology expertise in the variable data management, flexographic, offset, laser and thermal transfer printing business and have a particular focus on RF and RFID insertion capabilities to support the development of higher value-added labels.
We license technologies relating to RFID applications and EAS products. These license arrangements have various expiration dates and royalty terms, which are not considered by us to be material.
13
SEASONALITY
Our business is subject to seasonal influences, which generally results in higher levels of sales and income in the second half of the year. The seasonality of our business substantially follows the retail cycle of our customers, which generally has revenues weighted toward the last half of the calendar year in preparation for the holiday season.
COMPETITION
Merchandise Availability Solutions
Currently, our EAS systems and consumables are sold primarily to retail establishments. Our principal global competitor in the EAS industry is Tyco International Ltd. (Tyco), through its Tyco Retail Solutions business within the NA Installation & Services and ROW Installation & Services segments. Tyco is a diversified global company with interests in security products and services, fire protection and detection products and services, valves and controls and other industrial products. Tyco’s 2014 revenues were approximately $10.3 billion, of which $7.8 billion was attributable to the NA Installation & Services and ROW Installation & Services segments.
Within the U.S. market, additional competitors include Sentry Technology Corporation and Ketec, Inc. in EAS systems and consumables, and All-Tag Security in EAS-RF labels, principally in the retail market. Within our international markets, mainly Europe, Nedap® is our most significant competitor. The largest competitors of the Alpha® product line include Universal Surveillance Systems, Vanguard Protex Global Corporation, Se-Kure Controls, Inc., Invue Security Products, and Century. The largest competitors of the RFID product line are the Tyco Retail Solutions business and Nedap®.
We believe that our product line offers a more extensive, varied range of products than our competition with robust systems, a wide variety of disposable and reusable tags and labels, integrated scan/deactivation capabilities, and RF source tagging embedded into products or packaging. As a result, we compete in marketing our products primarily on the basis of their versatility, reliability, affordability, accuracy, and integration into operations. This combination provides many system solutions and gives excellent protection against retail merchandise theft.
Apparel Labeling Solutions
We sell our apparel labeling solutions to apparel retailers, brand owners and apparel manufacturers. Major competitors are the Retail Branding and Information Solutions business at Avery Dennison Corporation, SML Group, R-Pac International Corporation, NexGen, and Fineline Technologies.
Retail Merchandising Solutions
We face no single competitor in any international market across our entire retail merchandising solutions product range. HL Display AB and VFK Renzel GMBH are our largest competitors in retail display systems, primarily in Europe. In hand-held labeling solutions, we compete with Contact Labeling Systems, SATO DCS & Labeling Worldwide, Garvey Products Inc., Hallo, Avery Dennison Corporation, and Prix International.
OTHER MATTERS
Research and Development
We spent $15.3 million, $17.5 million, and $16.4 million, in research and development activities during 2014, 2013, and 2012, respectively. Our R&D emphasis is on continually broadening our product lines, reducing costs, and expanding the markets and applications for all products. We believe that our future growth is dependent, in part, on the products and technologies resulting from these efforts.
We continue to develop and expand our product lines with new solutions, performance improvements, and the introduction of products targeted toward international growth markets. We intend to continue to develop and introduce technologies and processes that support our single source, best-in-class RFID capability.
Employees
As of December 28, 2014, we had 4,894 employees, including eight executive officers, 112 employees engaged in research and development activities, 362 field service employees, and 386 employees engaged in sales and marketing activities. There were
14
184 fewer employees on December 28, 2014 than on December 29, 2013. In the United States, none of our employees are represented by a union. In Europe, approximately 297 of our employees are represented by various unions or work councils.
Financial Information about Geographic and Business Segments
We operate both domestically and internationally in the three distinct business segments described previously. The financial information regarding our geographic and business segments, which includes net revenues and gross profit for each of the years in the three-year period ended December 28, 2014, and long-lived assets as of December 28, 2014 and December 29, 2013, is provided in Note 18 of the Consolidated Financial Statements.
Available Information
Our internet website is at www.checkpointsystems.com. Information on our website is not part of this Annual Report on Form 10-K. Investors can obtain copies of our annual report on Form 10-K, quarterly reports on Form 10-Q, current reports on Form 8-K, and any amendments to those reports filed or furnished pursuant to Section 13(a) or 15(d) of the Securities Exchange Act on our website as soon as reasonably practicable after we have filed such materials with, or furnished them to, the Securities and Exchange Commission (SEC). We will also furnish a paper copy of such filings free of charge upon request. Investors can also read and copy any materials filed by us with the SEC at the SEC's Public Reference Room which is located at 100 F Street, NE, Room 1580, Washington, DC 20549. Information about the operation of the Public Reference Room can be obtained by calling the SEC at 1-800-SEC-0330. Our filings can also be accessed at the SEC's internet website: www.sec.gov.
We have adopted a code of business conduct and ethics (the “Code of Ethics”) as required by the listing standards of the New York Stock Exchange and the rules of the SEC. This Code of Ethics applies to all of our directors, officers, and employees. We have also adopted corporate governance guidelines (the “Governance Guidelines”) and a charter for each of our Audit Committee, Compensation Committee and Governance and Nominating Committee (collectively, the “Committee Charters”). We have posted the Code of Ethics, the Governance Guidelines and each of the Committee Charters on our website at www.checkpointsystems.com, and will post on our website any amendments to, or waivers from, the Code of Ethics applicable to any of our directors or executive officers. The foregoing information will also be available in print upon request.
Executive Officers of the Company
The following table sets forth certain current information concerning our executive officers, including their ages, position, and tenure as of the date hereof:
Name | Age | Tenure with Company | Position with the Company and Date of Election to Position |
George Babich, Jr. | 62 | 8 years | President and Chief Executive Officer since February 2013; Director since 2006 |
Jeffrey O. Richard | 47 | 2 years | Executive Vice President and Chief Financial Officer since May 2013 |
Per H. Levin | 57 | 20 years | President, Merchandise Availability Solutions since January 2015 |
Farrokh Abadi | 53 | 10 years | Chief Strategy and Development Officer since January 2015 |
S. James Wrigley | 61 | 5 years | President and Chief Operating Officer, Apparel Labeling Solutions since June 2012 |
Bryan T. R. Rowland | 35 | 12 years | Vice President, General Counsel and Secretary since May 2014 |
Carol P. Roy | 63 | 7 years | Chief Human Resources Officer since February 2015 |
Uwe Sydon | 52 | 1 year | Senior Vice President of Innovation since May 2014 |
Mr. Babich was appointed President and Chief Executive Officer of Checkpoint Systems, Inc. on February 4, 2013, after serving as Interim President and Chief Executive Officer since May 3, 2012. He has served as a member of the Board of Checkpoint since 2006. Mr. Babich was President of Pep Boys - Manny Moe & Jack from 2002 until 2005; from 2000 until 2004 he was Chief Financial Officer of Pep Boys and served as an Officer of Pep Boys since 1996. Previously, he was a Financial Executive for Morgan, Lewis & Bockius, The Franklin Mint, Pepsico Inc. and Ford Motor Company. Mr. Babich has served as a member of the Board of Teleflex Inc. from 2005 to present and has served on their Audit Committee from 2005 to present. He holds a BS in Accounting from the University of Michigan.
15
Mr. Richard was appointed Executive Vice President and Chief Financial Officer on May 28, 2013. Prior to Checkpoint, Mr. Richard served as Executive Vice President and Chief Financial Officer at Safety-Kleen Systems, Inc., from 2010 to 2013, where he led a broad set of turnaround initiatives to drive profitable, sustainable growth. He recapitalized the company and led a dual-path liquidity IPO and sale plan that concluded with the sale of Safety-Kleen in December 2012. From 2006 to 2010, Mr. Richard served as Chief Operating Officer and Chief Financial Officer at Pavestone Company and previously he was Vice President of Financial Planning & Analysis at Electronic Data Systems Corp. and Chief Financial Officer and Vice President of Americas Operations at Jacuzzi Brands, Inc. Earlier in his career, Mr. Richard worked in a variety of financial positions at Tyco International Ltd., ultimately serving as Chief Financial Officer for Tyco’s $2.2 billion Plastics & Adhesives segment. Mr. Richard has a Bachelor’s degree in Business Administration from Louisiana State University.
Mr. Levin was appointed President, Merchandise Availability Solutions on January 6, 2015. He was President and Chief Sales Officer, Merchandise Availability Solutions and Merchandise Visibility from June 2012 to January 2015. He was President, Merchandise Visibility and Apparel Labeling Solutions from September 2011 until June 2012 and was President, Merchandise Visibility from September 2010 until September 2011. Mr. Levin was President, Merchandise Availability and Merchandise Visibility Solutions from March 2006 until September 2010. He was President of Europe from June 2004 until March 2006, Executive Vice President, General Manager, Europe from May 2003 until June 2004, and Vice President, General Manager, Europe from February 2001 until May 2003. Mr. Levin was Regional Director, Southern Europe from 1997 to 2001 and joined the Company in January 1995 as Managing Director of Spain.
Mr. Abadi was appointed Chief Strategy and Development Officer on January 6, 2015. He was President and Chief Operating Officer, Merchandise Availability Solutions from June 2012 to January 2015. Mr. Abadi was President, Merchandise Availability Solutions from September 2010 until June 2012. He was Senior Vice President and Chief Innovation Officer from October 2008 until September 2010. He also served as Senior Vice President, Worldwide Operations from April 2006 until October 2008 and Vice President and General Manager, Worldwide Research and Development from November 2004 until April 2006. Prior to joining Checkpoint, Mr. Abadi was Senior Vice President of Global Cross-Industry Practices at Atos Origin from February 2004 until November 2004. Mr. Abadi held various senior management positions with Schlumberger for over eighteen years.
Mr. Wrigley was appointed President and Chief Operating Officer, Apparel Labeling Solutions in June 2012. He joined Checkpoint as Group President, Global Customer Management in March 2010. Prior to joining Checkpoint, Mr. Wrigley was Vice President, EMEA and South Asia, at Avery Dennison Corporation's Retail Information Services business from June 2007 to March 2010. Prior to Avery's acquisition of Paxar Corporation in 2007, Mr. Wrigley was Group President, Global Apparel Solutions from January 2007 until June 2007. Mr. Wrigley was President, Paxar EMEA from 1996 to 2006. Mr. Wrigley served as International Director of the Pepe Group from 1991 until 1996.
Mr. Rowland was appointed Vice President, General Counsel and Secretary in May 2014. Mr. Rowland served as Associate General Counsel, Chief Compliance Officer and Corporate Secretary from September 2012 until May 2014; Assistant General Counsel from May 2011 until September 2012 and Counsel from September 2005 until May 2011. Mr. Rowland graduated from Towson University with a bachelor’s degree in Psychology and Philosophy and earned his Juris Doctor degree from Villanova University School of Law.
Ms. Roy was appointed Chief Human Resources Officer in February 2015. Ms. Roy served as Senior Vice President, Global Human Resources for Checkpoint Systems, Inc. from March 2013 until February 2015. Previously, she was Vice President, Global Human Resource Operations since August 2011 and Vice President Human Resources, The Americas and Caribbean since 2008. Prior to Checkpoint, Ms. Roy spent 11 years at Citigroup first as Vice President & Senior Human Resource Officer during the formation of Citigroup Business Services and then as Vice President, Global Flexible Work Strategies. Prior to joining Citigroup, Ms. Roy held diverse human resource roles at GE Aerospace/Lockheed Martin including University Relations, EEO & Practices, Organizational Effectiveness, Executive Development and business partnerships. During her last four years at GE, she was Division HR Director for the company’s Simulation business. Earlier in her career, Ms. Roy was an operations manager for Progressive Insurance at the company’s headquarters in Cleveland, Ohio. Ms. Roy has a Master’s degree in Personnel Services and a Bachelor of Science degree in Human Development from The Pennsylvania State University.
Mr. Sydon was appointed Senior Vice President of Innovation in May 2014. Prior to Checkpoint, Mr. Sydon served as Vice President of Product Management for BlackBerry (RIM) in Canada. Prior to his work with BlackBerry he held a variety of innovation and product management leadership positions in Siemens AG and Nokia Siemens Networks. Mr. Sydon has over 22 years of international experience in the telecom industry and has a track record of establishing operational excellence, leading product strategies for global development and launch, and driving sustainable, scalable growth in markets worldwide. Mr.
16
Sydon holds an Elektrotechnik, Nachrichtentechnik (Diplom Ingenieur), which is equivalent to a U.S. Master of Engineering from Bergische Universität Gesamthochschule, Wuppertal, Germany.
Item 1A. RISK FACTORS
The risks described below are among those that could materially and adversely affect our business, financial condition or results of operations. These risks could cause actual results to differ materially from historical experience and from results predicted by any forward-looking statements related to conditions or events that may occur in the future.
The accuracy and timeliness of our financial reports, as well as our business and the market price of our common stock, could be materially adversely affected if we are unable to maintain effective internal control over financial reporting.
Maintaining effective internal control over financial reporting is necessary for us to produce reliable financial statements and to comply with our reporting obligations under the federal securities laws. As a result of the determination to restate the previously-issued financial statements for the quarterly periods ended March 29, 2015 and June 28, 2015 and the year-to-date period ended June 28, 2015, management re-evaluated the effectiveness of the design and operation of the our internal control over financial reporting and disclosure controls and procedures and has concluded that we did not maintain effective controls over the period end financial reporting process for the quarterly periods ended March 29, 2015 and June 28, 2015. Specifically, effective controls were not maintained over the accounting for our quarterly income tax calculation surrounding the inclusion or exclusion of entities with valuation allowances. Additionally, we incorrectly calculated the valuation allowance related to a non U.S. entity with a deferred tax liability related to an indefinite lived intangible. Because of this material weakness, management, including the Chief Executive Officer and Acting Chief Financial Officer, concluded that our disclosure controls and procedures were not effective as of March 29, 2015 and June 28, 2015. This control deficiency resulted in the restatement of our consolidated financial statements for the quarterly periods ended March 29, 2015 and June 28, 2015 and the year-to-date period ended June 28, 2015. Accordingly, management concluded that these control deficiencies constitute a material weakness. Although the control deficiency did not result in a material misstatement to our consolidated financial statements for the year ended December 28, 2014, or any of the consolidated financial statements for the quarters included therein, the control deficiency could have resulted in a material misstatement of the consolidated financial statements that would not have been prevented or detected.
Although we believe that we are taking appropriate action to remediate the control deficiency, if we are unable to effectively remediate this material weakness or are otherwise unable to maintain adequate internal control over financial reporting in the future, we may not be able to prepare reliable financial statements and comply with our reporting obligations on a timely basis, which could materially adversely affect our business and the market price of our common stock through loss of public and investor confidence, as well as subject us to legal and regulatory action.
Current economic conditions could adversely impact our business and results of operations.
Our operations and results depend significantly on global market worldwide economic conditions, which have experienced deterioration in recent years. Future economic factors may continue to be less favorable than in years past and may continue to result in diminished liquidity and tighter credit conditions, leading to decreased credit availability, as well as declines in economic growth and employment levels. These conditions may increase the difficulty for us to accurately forecast and plan future business. Customer demand could be impacted by decreased spending by businesses and consumers alike, and competitive pricing pressures could increase. We are unable to predict the length or severity of the current economic conditions. A continuation or further deterioration of these economic factors may have a material and adverse effect on the liquidity and financial condition of our customers and on our results of operations, financial condition, liquidity, including our ability to refinance maturing liabilities, and access the capital markets to meet liquidity needs.
We have significant foreign operations, which are subject to political, economic and other risks inherent in operating in foreign countries.
We are a multinational manufacturer and marketer of identification, tracking security, and merchandising solutions for the retail industry. We have significant operations outside of the U.S. We currently operate directly in 27 countries, and our international operations generate approximately 71% of our revenue. We expect net revenue generated outside of the U.S. to continue to represent a significant portion of total net revenue. Business operations outside of the U.S. are subject to political, economic and other risks inherent in operating in certain countries, such as:
▪ | Difficulty in enforcing agreements, collecting receivables and protecting assets through foreign legal systems |
▪ | Trade protection measures and import or export licensing requirements |
17
▪ | Difficulty in staffing and managing widespread operations and the application of foreign labor regulations |
▪ | Compliance with a variety of foreign laws and regulations |
▪ | Compliance with the Foreign Corrupt Practices Act, the UK Bribery Act and the Office of Foreign Assets Control |
▪ | Changes in the general political and economic conditions in the countries where we operate, particularly in emerging markets |
▪ | The threat of nationalization and expropriation |
▪ | Increased costs and risks of doing business in a number of foreign jurisdictions |
▪ | Changes in enacted tax laws |
▪ | Limitations on repatriation of earnings |
▪ | Fluctuations in equity and revenues due to changes in foreign currency exchange rates |
Changes in the political or economic environments in the countries in which we operate, as well as the impact of economic conditions on underlying demand for our products could have a material adverse effect on our financial condition, results of operations or cash flows.
As we continue to explore the expansion of our global reach, an increasing focus of our business may be in emerging markets, including South America and Southern Asia. In many of these emerging markets, we may be faced with risks that are more significant than if we were to do business in developed countries, including undeveloped legal systems, unstable governments and economies, and potential governmental actions affecting the flow of goods and currency.
Our global operations expose us to risks associated with conducting business internationally, including violations of the U.S. Foreign Corrupt Practices Act and similar worldwide anti-bribery laws.
We are a multinational manufacturer and marketer of identification, tracking security, and merchandising solutions for the retail industry. We have significant operations outside of the U.S. Due to our global operations, we are subject to many laws governing international relations, including those that prohibit improper payments to government officials and commercial customers, and restrict where we can do business, what information or products we can supply to certain countries and what information we can provide to a non-U.S. government, including but not limited to the Foreign Corrupt Practices Act, U.K. Bribery Act and the U.S. Export Administration Act. Our policies mandate compliance with these anti-bribery laws. We operate in many parts of the world that have experienced governmental corruption to some degree and, in certain circumstances, strict compliance with anti-bribery laws may conflict with local customs and practices. Given the high level of complexity of these laws, there is a risk that some provisions may be inadvertently or intentionally breached, for example through fraudulent or negligent behavior of individual employees, our failure to comply with certain formal documentation requirements or otherwise. Additionally, we may be held liable for actions taken by our local dealers and partners. If we are found to be liable for FCPA or other violations (either due to our own acts or our inadvertence, or due to the acts or inadvertence of others), we could suffer from civil and criminal penalties or other sanctions, which could have a material adverse impact on our business, financial condition, and results of operations.
Volatility in currency exchange rates and interest rates may adversely affect our financial condition, results of operations or cash flows.
We are exposed to a variety of market risks, including the effects of changes in currency exchange rates and interest rates. Refer to Item 7A. Quantitative and Qualitative Disclosures about Market Risk.
Our net revenue derived from sales in non-U.S. markets is approximately 71% of our total net revenue, and we expect revenue from non-U.S. markets to continue to represent a significant portion of our net revenue. When the U.S. dollar strengthens in relation to the currencies of the foreign countries where we sell our products, our U.S. dollar reported revenue and income will decrease. Changes in the relative values of currencies occur regularly and, in some instances, may have a significant effect on our results of operations. Our financial statements reflect recalculations of items denominated in non-U.S. currencies to U.S. dollars, which is our functional currency.
We monitor these exposures as an integral part of our overall risk management program. In some cases, we enter into contracts to reduce the risks of currency fluctuations on short-term inter-company receivables and payables, and on projected future billings in non-functional currencies and use third-party borrowings in foreign currencies to hedge a portion of our net investments in, and cash flows derived from, our foreign subsidiaries. Nevertheless, changes in currency exchange rates and interest rates may have a material adverse effect on our financial condition, results of operations, or cash flows.
18
Our business could be materially adversely affected as a result of lower than anticipated demand by retailers and other customers for our products, particularly in the current economic environment.
Our business is heavily dependent on the retail marketplace. Changes in the economic environment including the liquidity and financial condition of our customers, the impact of online customer spending, or reductions in retailer spending could adversely affect our revenues and results of operations. In a period of decreased consumer spending, retailers could respond by reducing their spending on new store openings and loss prevention budgets. This reduction could directly impact our MAS business, as a reduction in new store openings will lower demand for SMS EAS systems and consumables as well as RFID solutions. Additionally, lower loss prevention budgets could reduce the amount retailers will be willing to spend to upgrade existing store technology. Label demand could also be impacted due to lower loss prevention budgets as retailers may reduce the percentage of items covered. In addition, our label volume increases as more items are sold through the retailer and lower demand decreases the volume related to the items tagged by the retailer. As retail sales volumes decline, label demand may also decline. These factors could also impact our Apparel Labeling Solutions and Retail Merchandising Solutions businesses. A decrease in the demand for our products resulting from reduced spending by retailers due to fewer store openings, reduced loss prevention budgets and slower adoption of our new technology could have a material adverse effect on our revenues and results of operations.
Our business could be materially adversely affected as a result of slower commitments of retail customers to chain-wide installations and/or source tagging adoption or expansion.
Our revenues are dependent on our ability to maintain and increase our system installation base. The SMS EAS system installation base within MAS leads to additional revenues, which we term as “recurring revenues,” through the sale of maintenance services and SMS EAS consumables, including labels and tags, as well as our Alpha® high-theft solutions. In addition, we partner with manufacturers to include our sensor tags into the product during manufacturing, an approach known as source tagging.
The level of commitments for chain-wide installations may decline due to decreased consumer spending which results in reduced spending on loss prevention by our retail customers, our failure to develop new technology that entices the customer to maintain their commitment to our loss prevention products and services, competing technologies and retailers' decisions to defer the capital investment and expense. A reduction in the commitment for chain-wide installations may also impact our ability to expand utilization of our source tagging program. A reduction in commitments to chain-wide installations and utilization of our source tagging program could have an adverse effect on our revenues and results of operations.
The markets we serve are highly competitive and we may be unable to compete effectively if we are unable to provide and market innovative and cost-effective products at competitive prices.
We face competition around the world, including competition from other large, multinational companies and other regional companies. Some of these companies may have substantially greater financial and other resources than us. We face competition in several aspects of our business. In the SMS EAS systems, Alpha® high-theft solutions and SMS EAS consumables businesses, we compete primarily on the basis of integrated security solutions and diversified, sophisticated, and quality product lines targeted at meeting the loss prevention needs of our retail customers. We also compete on the basis of merchandise visibility (RFID) solutions that meet the item level product identification and inventory management needs of our customers. In the ALS business, we compete primarily on the capability to effectively and quickly deliver retail customer specified tags and labels to manufacturing sites in multiple countries. It is possible that our competitors will be able to offer additional products, services, lower prices, or other incentives that we cannot offer or that will make our products less profitable. It is also possible that our competitors will offer incentive programs or will market and advertise their products in a way that will impact customers' preferences, and we may not be able to compete effectively.
We may be unable to anticipate the timing and scale of our competitors' activities and initiatives, or we may be unable to successfully counteract them, which could harm our business. In addition, the cost of responding to our competitors' activities may affect our financial performance in the relevant period. Our ability to compete also depends on our ability to attract and retain key talent, protect patent and trademark rights, and develop innovative and cost-effective products. A failure to compete effectively could adversely affect our growth and profitability.
19
Our long term success is largely dependent upon our ability to develop new technologies, and if we are unable to successfully develop those technologies, our business could be materially adversely affected.
Our growth depends on continued sales of existing products, as well as the successful development and introduction of new products, which face the uncertainty of retail and consumer acceptance and reaction from competitors. In addition, our ability to create new products and to sustain existing products is affected by whether we can:
• | Develop and fund technological innovations, such as those related to our next generation EAS product solutions, evolving RFID technologies, and other innovative security device, software, and systems initiatives |
• | Receive and maintain necessary patent and trademark protection |
• | Successfully anticipate customer needs and preferences |
The failure to develop and launch successful new products could hinder the growth of our business. Research and development for each of our operating segments is complex and uncertain and requires innovation and anticipation of market trends. Also, delays in the development or launch of a new product could compromise our competitive position, particularly if our competitors announce or introduce new products and services in advance of us.
An inability to acquire, protect or maintain our intellectual property, including patents, could harm our ability to compete or grow.
Because our products involve complex technology and chemistry, we rely on protections of our intellectual property and proprietary information to maintain a competitive advantage. The expiration of these patents will reduce the barriers to entry into our existing lines of business and may result in loss of market share and a decrease in our competitive abilities, thus having a potential adverse effect on our financial condition, results of operations and cash flows. At this time we do not anticipate any significant impact from the expiration of patents over the next two to three years.
There is no assurance that the patents we have obtained will provide adequate protection to ensure any competitive advantages for our products. We also cannot assure investors that those patents will not be successfully challenged, invalidated or circumvented prior to their expiration. In addition, we cannot provide assurance that competitors have not already applied for or obtained, or will not seek to apply for and obtain, patents that will prevent, limit or interfere with our ability to make, use and sell our products either in the U.S. or in international markets.
We cannot assure you that we will not become subject to patent infringement claims. The defense and prosecution of intellectual property lawsuits generally are costly and time-consuming. If other parties violate our proprietary rights, further litigation may be necessary to enforce our patents, to protect trade secrets or know-how we own or to determine the enforceability, scope and validity of the proprietary rights of others. Any litigation will be costly and cause significant diversion of effort by our technical and management personnel.
Our business could be materially adversely affected as a result of possible increases in per unit product manufacturing costs as a result of slowing economic conditions or other factors.
Our manufacturing capacity is designed to meet our current and future anticipated demands. If our product demand decreases as a result of economic conditions and other factors, it could increase our cost per unit. If an increase in our cost per unit is passed on to our customers, it may decrease our competitive position, which may have an adverse effect on our revenues and results of operations. If an increase in cost per unit is not passed on to our customers, it may reduce our gross margins, which may have an adverse effect on our results of operations. Our SMS EAS consumables, RFID consumables, Alpha® and ALS products have various low price competitors globally. In order for us to maintain and improve our market position, we need to continuously monitor and seek to improve our manufacturing effectiveness, capacity utilization and demand planning while maintaining our high quality standard. If we are unsuccessful in our efforts to improve manufacturing and supply chain effectiveness, then our cost per unit may increase which could have an adverse impact on our results of operations.
If we cannot obtain sufficient quantities of raw materials and component parts required for our manufacturing activities at competitive prices and quality and on a timely basis, our financial condition, results of operations or cash flows may suffer.
We purchase materials and component parts from third parties for use in our manufacturing operations. Our ability to grow earnings will be affected by inflationary and other increases in the cost of component parts and raw materials, including electronic components, circuit boards, aluminum foil, resins, paper, and ferric chloride, hydrochloric acid solutions and rare earth magnets. Inflationary and other increases in the costs of raw materials, labor, and energy have occurred in the past and are expected to recur, and our performance depends in part on our ability to pass these cost increases on to customers in the prices
20
for our products and to effect improvements in productivity. We may not be able to fully offset the effects of higher component parts and raw material costs through price increases, productivity improvements or cost reduction programs. If we cannot obtain sufficient quantities of these items at competitive prices and quality and on a timely basis, we may not be able to produce sufficient quantities of product to satisfy market demand, product shipments may be delayed, or our material or manufacturing costs may increase. A disruption to our supply chain could adversely affect our sales and profitability. Any of these problems could result in the loss of customers and revenue, provide an opportunity for competing products to gain market acceptance and otherwise adversely affect our financial condition, results of operations, or cash flows.
Possible increases in the payment time for receivables as a result of economic conditions or other market factors could have a material effect on our results from operations and anticipated cash from operating activities.
The majority of our customer base is in the retail marketplace. Although we have a rigorous process to administer credit granted to customers and believe our allowance for doubtful accounts is adequate, we have experienced, and in the future may experience, losses as a result of our inability to collect our accounts receivable. During the past several years, various retailers have experienced significant financial difficulties, which in some cases have resulted in bankruptcies, liquidations and store closings. The financial difficulties of a customer could result in reduced business with that customer. We may also assume higher credit risk relating to receivables of a customer experiencing financial difficulty. If these developments occur, our inability to shift sales to other customers or to collect on our trade accounts receivable from a major customer could substantially reduce our income and have a material adverse effect on our results of operations and cash flows from operating activities.
The effectiveness of our strategic plan is subject to the successful implementation of our plans and actions.
During 2012, we redefined our strategic plan and in 2014 we reiterated our commitment to this plan. Our strategic plan is designed to improve revenues and profitability, reduce costs, and improve working capital management. In addition to our restructuring plans including our Profit Enhancement Plan, we have many plans and actions underway to improve the management of our business. These include the following:
• | Margin enhancement initiatives |
• | Improved financial forecasting abilities |
• | Enhanced management reporting |
• | New sales compensation incentive plans |
• | Refined product pricing approach |
• | Continuous cost-improvement process improvement plans |
• | Systematic talent assessment process |
• | Developing a culture focused on accountability |
• | Improved supply chain management |
There is a risk that we may not be successful in our continued execution of these measures to achieve the expected results for a variety of reasons, including market developments, economic conditions, shortcomings in establishing appropriate action plans, or challenges with executing multiple initiatives simultaneously. We may not be able to acquire businesses that fit our strategic plan or divest of those that do not fit our strategic plan on acceptable business terms, and we may not achieve our other strategic priorities.
Our ability to maintain cost reductions in field services, selling, general and administrative expenses, and our manufacturing and supply chain operations may have a significant impact on our business and future revenues and profits.
We have implemented actions to rationalize our field service, improve our sales productivity, reduce our general and administrative expenses, and reconfigure our manufacturing and supply chain operations. Such rationalization actions require management judgment on the development of cost reduction strategies and precision on the execution of those strategies. We may not be able to maintain, in full or in part, the benefits from these initiatives, and other events and circumstances, such as difficulties, delays, or unexpected costs may occur, which could result in our not maintaining realization of all or any of the anticipated benefits. We also cannot predict whether we will maintain our improved operating performance as a result of any cost reduction strategies. Further, in the event the market continues to fluctuate, we may not have the appropriate level of resources and personnel to react to the change. We are also subject to the risk of business disruption in connection with our restructuring initiatives, which could have a material adverse effect on our business and future revenues and profits.
We continue to evaluate opportunities to restructure our business and rationalize our operations in an effort to optimize our cost structure and efficiencies consistent with our strategy. As a result of these evaluations, we may take similar rationalization steps
21
in the future. Future actions could result in restructuring and related charges, including but not limited to workforce reduction costs and charges relating to consolidation of excess facilities that could be significant.
If we fail to manage our growth effectively, our business could be harmed.
Our strategy is to maximize value by achieving growth both organically and through acquisitions. Our ability to effectively manage and control any future growth may be limited. To manage any growth, our management must continue to improve our operational, information and financial systems, procedures and controls and expand, train, retain and effectively manage our employees. If our systems, procedures and controls are inadequate to support our operations, any expansion could effectively decrease or stop, and investors may lose confidence in our operations or financial results. If we are unable to manage growth effectively, our business and operating results could be adversely affected, and any failure to develop and maintain adequate internal controls over financial reporting could cause the trading price of our shares to decline substantially.
Our ability to integrate acquisitions and to achieve our financial and operational goals for acquired businesses could have an impact on future revenues and profits.
Historically, we have had difficulties integrating certain of our acquisitions. Various risks, uncertainties and costs are associated with acquisitions. Effective integration of systems, key business processes, controls, objectives, personnel, management practices, product lines, markets, customers, supply chain operations, and production facilities can be difficult to achieve and the results are uncertain, particularly across our internationally diverse organization. We may not be able to retain key personnel of an acquired company and we may not be able to successfully execute integration strategies or achieve projected performance targets set for the business segment into which an acquired company is integrated. Our ability to execute the integration plans could have an impact on future revenues and profits and may adversely affect our financial condition, results of operations or cash flows. There can be no assurance that these acquisitions or others will be successful and contribute to our profitability.
Any acquisition, strategic relationship, joint venture or investment could disrupt our business and harm our financial condition.
We actively pursue acquisitions, strategic relationships, joint ventures, collaborations and investments that we believe may allow us to complement our growth strategy, increase market share in our current markets or expand into adjacent markets, or broaden our technology and intellectual property. Such transactions may be complex, time consuming and expensive, and may present numerous challenges and risks. Lack of control over the actions of our business partners in any strategic relationship, joint venture or collaboration, could significantly delay the introduction of planned products or otherwise make it difficult or impossible to realize the expected benefits of such relationship.
An impairment in the carrying value of goodwill or other assets could negatively affect our consolidated results of operations and net worth.
Pursuant to accounting principles generally accepted in the United States, we are required to annually assess our goodwill, intangibles and other long-lived assets to determine if they are impaired. In addition, interim reviews must be performed whenever events or changes in circumstances indicate that impairment may have occurred. If the testing performed indicates that impairment has occurred, we are required to record a non-cash impairment charge for the difference between the carrying value of the goodwill or other intangible assets and the implied fair value of the goodwill or other intangible assets in the period the determination is made. Disruptions to our business, end market conditions and protracted economic weakness, unexpected significant declines in operating results of reporting units, divestitures and market capitalization declines may result in additional charges for goodwill and other asset impairments. We have significant intangible assets, including goodwill with an indefinite life, which are susceptible to valuation adjustments as a result of changes in such factors and conditions. We assess the potential impairment of goodwill and indefinite lived intangible assets on an annual basis, as well as when interim events or changes in circumstances indicate that the carrying value may not be recoverable. We assess definite lived intangible assets when events or changes in circumstances indicate that the carrying value may not be recoverable.
The basis of the fair value for our impairment assessments is determined by projecting future cash flows using assumptions concerning future operating performance and economic conditions that may differ from actual cash flows. Estimated future cash flows are adjusted by an appropriate discount rate derived from our market capitalization plus a suitable control premium at the date of the evaluation. The financial and credit market volatility directly impacts our fair value measurement through our weighted average cost of capital that we use to determine our discount rate and through our stock price that we use to determine our market capitalization. Although our last analysis regarding the fair values of the goodwill and indefinite lived intangible assets for our reporting units indicates that they exceed their respective carrying values, materially different assumptions regarding the future performance of our businesses or significant declines in our stock price could result in additional goodwill
22
and intangible impairment losses. Specifically, an unanticipated deterioration in revenues and gross margins generated by our Merchandise Availability Solutions, Apparel Labeling Solutions and Retail Merchandising Solutions segments could trigger future impairment in those segments. While we currently believe that our projected results will not result in future impairment, a deterioration in results could trigger a future impairment.
Our senior secured credit facility agreement restricts certain activities, and failure to comply with this agreement may have an adverse effect on our financial condition, results of operations and cash flows.
We maintain a senior secured credit facility that contains restrictive financial covenants, including financial covenants that require us to comply with specified financial ratios. We may have to curtail some of our operations to comply with these covenants. In addition, our senior secured credit facility contains other affirmative and negative covenants that could restrict our operating and financing activities. These provisions may limit our ability to, among other things, incur future indebtedness, contingent obligations or liens, guarantee indebtedness, make certain investments, sell stock or assets and pay dividends, and consummate certain mergers or acquisitions. Because of the restrictions on our ability to create or assume liens, we may find it difficult to secure additional indebtedness if required. Furthermore, if we fail to comply with the requirements of the senior secured credit facility, we may be in default, and we may not be able to obtain the necessary amendments to the agreement or waivers of an event of default. Upon an event of default, if the agreement is not amended or the event of default is not waived, the lenders could declare all amounts outstanding, together with accrued interest, to be immediately due and payable. If this happens, we may not be able to make those payments or borrow sufficient funds from alternative sources to make those payments. Even if we were to obtain additional financing, that financing may be on unfavorable terms.
Changes in legislation or governmental regulations, policies or standards applicable to our products may have a significant impact on our ability to compete in our target markets.
We operate in regulated industries. Our U.S. operations are subject to regulation by federal, state, and local governmental agencies with respect to safety of operations and equipment, labor and employment matters, and financial responsibility. Our SMS EAS products are subject to FCC regulation, and our international operations are regulated by the countries in which they operate, including regulation of the Conformité Européene (CE) in Europe. Failure to comply with laws or regulations could result in substantial fines or revocation of our operating permits or licenses. If laws and regulations change and we fail to comply, our financial condition, results of operations, or cash flows could be materially and adversely affected.
Our future results may be affected by various legal and regulatory proceedings.
We cannot predict with certainty the outcome of litigation matters, government proceedings and investigations, and other contingencies and uncertainties that may arise out of the conduct of our business, including matters relating to intellectual property, employment, commercial and other matters. Resolution of such matters can be prolonged and costly, and the ultimate results or judgments are uncertain due to the inherent uncertainty in litigation and other proceedings. Moreover, our potential liabilities are subject to change over time due to new developments, changes in settlement strategy or the impact of evidentiary requirements, and we may be required to pay fines, damage awards or settlements, or become subject to fines, damage awards or settlements, that could have a material adverse effect on our results of operations, financial condition, and liquidity.
The failure to effectively maintain and upgrade our information systems could adversely affect our business.
Our business depends significantly on effective information systems, and we have many different information systems for our various businesses. Our information systems require an ongoing commitment of significant resources to maintain and enhance existing systems and develop new systems in order to keep pace with continuing changes in information processing technology, evolving industry and regulatory standards, and changing customer preferences. In addition, we may from time to time obtain significant portions of our systems-related or other services or facilities from independent third parties, which may make our operations vulnerable to such third parties' failure to perform adequately. Our failure to maintain effective and efficient information systems, or our failure to efficiently and effectively consolidate our information systems to eliminate redundant or obsolete applications, could have a material adverse effect on our business, financial condition and results of operations. Additionally, any disruption or failure of such networks, systems, or other technology may disrupt our operations, cause customer dissatisfaction, and loss of customer revenues.
Risks generally associated with a company-wide implementation of an enterprise resource planning (ERP) system may adversely affect our business and results of operations or the effectiveness of our internal control over financial reporting.
We have been implementing a company-wide ERP system to handle the business and financial processes within our operations and corporate functions. Our implementations for Europe and Asia have been postponed. We plan to implement our South
23
China ALS ERP system by the end of 2016. ERP implementations are complex and time-consuming projects that involve substantial expenditures on system software and implementation activities that can continue for several years. ERP implementations also require transformation of business and financial processes in order to reap the benefits of the ERP system. Our business and results of operations may be adversely affected if we experience operating problems and/or cost overruns during the ERP implementation process, decide to forgo a company-wide implementation, or if the ERP system and the associated process changes do not give rise to the benefits that we expect. Additionally, if we do not effectively implement the ERP system as planned or if the system does not operate as intended, it could adversely affect the effectiveness of our internal control over financial reporting.
Information technology failures and cyber-attacks on our networks could harm our business and results of operations.
We use information technology and other computer resources to carry out important operational and marketing activities and to maintain our business records. These information technology systems are dependent upon global communications providers, web browsers, telephone systems and other aspects of the Internet infrastructure that have experienced security breaches, cyber-attacks, significant systems failures and electrical outages in the past. Thus, maintaining the security of computers, computer networks and data storage resources is a critical issue for us and our customers and suppliers, because security breaches could result in reduced or lost ability to carry on our business and loss of and unauthorized access to confidential information. We have designed our information technology systems to protect against failures in security and service disruption. Despite the precautions we take, we may be subject to computer viruses, worms or other malicious codes, unauthorized access attempts, and cyber- or phishing-attacks, which, if successful, could compromise our confidential information, including identifiable personal information, disrupt our operations and expose us to customer, supplier, and other third party liabilities.
As a global business, we have a relatively complex tax structure, and there is a risk that tax authorities will disagree with our tax positions.
Since we conduct operations worldwide through our foreign subsidiaries, we are subject to complex transfer pricing regulations in the countries in which we operate. Transfer pricing regulations generally require that, for tax purposes, transactions between us and our foreign affiliates be priced on a basis that would be comparable to an arm's length transaction and that contemporaneous documentation be maintained to support the tax allocation. Although uniform transfer pricing standards are emerging in many of the countries in which we operate, there is still a relatively high degree of uncertainty and inherent subjectivity in complying with these rules. To the extent that any foreign tax authorities disagree with our transfer pricing policies, we could become subject to significant tax liabilities and penalties. Our tax returns are subject to review by taxing authorities in the jurisdictions in which we operate. Although we believe that we have provided for all tax exposures, the ultimate outcome of a tax review could differ materially from our provisions.
We record a valuation allowance to reduce our deferred tax assets to the amount that it is more likely than not to be realized. Our assessments about the realizability of our deferred tax assets are based on estimates of our future taxable income by tax jurisdiction, the prudence and feasibility of possible tax planning strategies, and the economic environments in which we do business. Any changes in these assessments could have a material impact on our results of operations.
Regulations that impose disclosure requirements regarding the use of “conflict” minerals mined from the Democratic Republic of Congo and adjoining countries in our products will result in additional cost and expense and could result in other significant adverse effects.
Rules adopted by the SEC implementing the Dodd-Frank Wall Street Reform and Consumer Protection Act impose diligence and disclosure requirements regarding the use of “conflict” minerals mined from the Democratic Republic of Congo and adjoining countries in our products. Compliance with these rules may result in additional cost and expense, including for due diligence to determine and verify the sources of any conflict minerals used in our products, in addition to the cost of remediation and other changes to products, processes, or sources of supply as a consequence of such verification activities. These rules may also affect the sourcing and availability of minerals used in the manufacture of our products to the extent that there may be only a limited number of suppliers offering “conflict free” metals that can be used in our products. There can be no assurance that we will be able to obtain such metals in sufficient quantities or at competitive prices. Also, since our supply chain is complex, we may face reputational challenges with our customers, stockholders and other stakeholders if we are unable to sufficiently verify the origins of the metals used in our products. We may also encounter customers who require that all of the components of our products be certified as conflict free. If we are not able to meet customer requirements, such customers may choose to disqualify us as a supplier, which could impact our sales and the value of portions of our inventory.
24
Item 1B. UNRESOLVED STAFF COMMENTS
None.
Item 2. PROPERTIES
Our principal corporate offices are located at 101 Wolf Drive, Thorofare, New Jersey. As of December 28, 2014, we owned or leased approximately 2.2 million square feet of space worldwide which is used primarily for sales, distribution, manufacturing, and general administration. These facilities include offices located throughout North and South America, Europe, Asia, and Australia. Our principal manufacturing facilities are located in Bangladesh, China, Germany, Hong Kong, India, Japan, Malaysia, the Netherlands, Turkey, the U.K. and the U.S. We believe our current manufacturing capacity will support our needs for the foreseeable future.
Item 3. LEGAL PROCEEDINGS
See Note 16 to the Consolidated Financial Statements for the discussion of legal proceedings under Contingencies, which is incorporated herein by reference.
Item 4. MINE SAFETY DISCLOSURES
Not Applicable.
25
PART II
Item 5. MARKET FOR THE REGISTRANT’S COMMON EQUITY, RELATED STOCKHOLDER MATTERS AND ISSUER PURCHASES OF EQUITY SECURITIES
Our common stock is listed on the New York Stock Exchange (NYSE) under the symbol CKP. The following table sets forth, for the periods indicated, the high and low sale prices for our common stock as reported on the NYSE Composite Tape.
Market Price Per Share | |||||||
High | Low | ||||||
Fiscal year ended December 28, 2014 | |||||||
First Quarter | $ | 15.88 | $ | 12.07 | |||
Second Quarter | $ | 14.48 | $ | 11.94 | |||
Third Quarter | $ | 14.35 | $ | 11.93 | |||
Fourth Quarter | $ | 14.12 | $ | 11.55 | |||
Fiscal year ended December 29, 2013 | |||||||
First Quarter | $ | 13.95 | $ | 10.27 | |||
Second Quarter | $ | 14.91 | $ | 10.50 | |||
Third Quarter | $ | 17.78 | $ | 14.04 | |||
Fourth Quarter | $ | 18.25 | $ | 12.81 | |||
Holders of Record
As of March 2, 2015, there were 465 holders of record of our common stock.
Dividends
We have never paid a cash dividend (except for a nominal cash distribution in April 1997 to redeem the rights outstanding under our 1988 Shareholders’ Rights Plan). On March 5, 2015 we declared a dividend of $0.50 per outstanding common share for all shareholders of record as of March 20, 2015. The dividend is payable on April 10, 2015. The declaration and payment of dividends in the future, and their amounts, will be determined by the Board of Directors in light of conditions then existing, including our earnings, our financial condition and business requirements (including working capital needs), and other factors.
Recent Sales of Unregistered Securities
There has been no sale of unregistered securities in fiscal years 2014, 2013, or 2012.
Equity Compensation Plan Information
The information required by this Item is hereby incorporated by reference to the Registrant’s Definitive Proxy Statement for its Annual Meeting of Shareholders presently scheduled to be held on June 3, 2015, which management expects to file with the SEC within 120 days of the end of the Registrant’s fiscal year.
STOCK PERFORMANCE GRAPH
The following graph compares the cumulative total shareholder return on the Common Stock of the Company for the period beginning December 27, 2009 and ending on December 28, 2014, with the cumulative total return on the Center for Research in Security Prices Index (CRSP Index) for NYSE/AMEX/NASDAQ Stock market, and the CRSP Index for NASDAQ Electronic Components and Accessories, assuming the investment of $100 in the Company’s stock, the CRSP Index for NYSE/AMEX/NASDAQ Stock market, and the CRSP Index for NASDAQ Electronic Components and Accessories and the reinvestment of all dividends.
26
Year | Checkpoint Systems, Inc. | NYSE/AMEX/NASDAQ Stock Market Index | NASDAQ Electronic Components and Accessories Index | |||||
2009 | 100.00 | 100.00 | 100.00 | |||||
2010 | 135.77 | 116.50 | 115.90 | |||||
2011 | 73.37 | 118.38 | 107.14 | |||||
2012 | 68.15 | 134.56 | 109.05 | |||||
2013 | 99.61 | 181.87 | 149.71 | |||||
2014 | 91.58 | 207.18 | 194.03 | |||||
This Stock Performance Graph shall not be deemed incorporated by reference by any general statement incorporating by reference this annual report into any filing under the Securities Act of 1933, as amended, or the Securities Exchange Act of 1934, as amended, except to the extent that the Company specifically incorporates this information by reference, and shall not otherwise be deemed filed under such Acts.
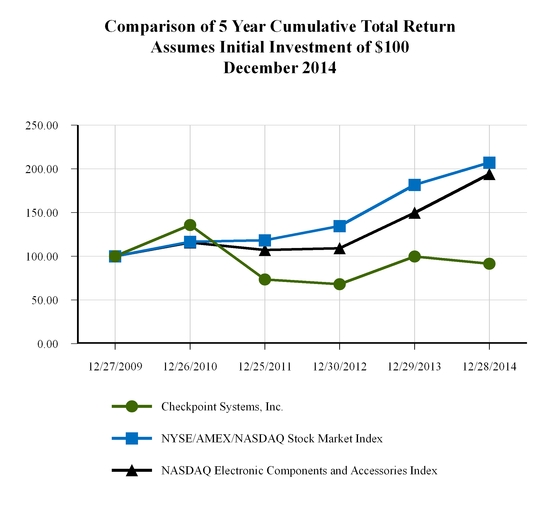
12/27/2009 | 12/26/2010 | 12/25/2011 | 12/30/2012 | 12/29/2013 | 12/28/2014 | |||||||
Checkpoint Systems, Inc. | 100.00 | 135.77 | 73.37 | 68.15 | 99.61 | 91.58 | ||||||
NYSE/AMEX/NASDAQ Stock Market Index | 100.00 | 116.50 | 118.38 | 134.56 | 181.87 | 207.18 | ||||||
NASDAQ Electronic Components and Accessories Index | 100.00 | 115.90 | 107.14 | 109.05 | 149.71 | 194.03 | ||||||
Repurchase of Securities
There has been no repurchase of securities in fiscal years 2014, 2013, or 2012.
27
Item 6. SELECTED FINANCIAL DATA
The following tables set forth our selected financial data should be read in conjunction with Management’s Discussion and Analysis of Financial Condition and Results of Operations and the Consolidated Financial Statements and Notes thereto included elsewhere herein:
(amounts in thousands, except per share data) | ||||||||||||||||||||
Year ended | December 28, 2014 | December 29, 2013 | December 30, 2012 | December 25, 2011 | December 26, 2010 | |||||||||||||||
STATEMENT OF OPERATIONS DATA | ||||||||||||||||||||
Net revenues | $ | 662,040 | $ | 689,738 | $ | 689,920 | $ | 758,400 | $ | 717,554 | ||||||||||
Earnings (loss) from continuing operations before income taxes | $ | 34,174 | $ | 1,900 | $ | (133,015 | ) | $ | (29,043 | ) | $ | 24,590 | ||||||||
Income taxes expense | $ | 23,221 | $ | 3,671 | $ | 6,005 | $ | 53,353 | $ | 4,536 | ||||||||||
Net earnings (loss) from continuing operations | $ | 10,953 | $ | (1,771 | ) | $ | (139,020 | ) | $ | (82,396 | ) | $ | 20,054 | |||||||
Earnings (loss) from discontinued operations, net of tax | $ | — | $ | (17,156 | ) | $ | (7,959 | ) | $ | (1,165 | ) | $ | 8,325 | |||||||
Net earnings (loss) attributable to Checkpoint Systems, Inc. | $ | 10,953 | (1) | $ | (18,928 | ) | (2) | $ | (146,450 | ) | (3) | $ | (83,504 | ) | (4) | $ | 28,495 | (5) | ||
Net earnings (loss) from continuing operations per share: | ||||||||||||||||||||
Basic | $ | 0.26 | $ | (0.05 | ) | $ | (3.37 | ) | $ | (2.03 | ) | $ | 0.50 | |||||||
Diluted | $ | 0.26 | $ | (0.05 | ) | $ | (3.37 | ) | $ | (2.03 | ) | $ | 0.49 | |||||||
Net earnings (loss) attributable to Checkpoint Systems, Inc. per share: | ||||||||||||||||||||
Basic | $ | 0.26 | $ | (0.46 | ) | $ | (3.57 | ) | $ | (2.06 | ) | $ | 0.71 | |||||||
Diluted | $ | 0.26 | $ | (0.46 | ) | $ | (3.57 | ) | $ | (2.06 | ) | $ | 0.70 | |||||||
Depreciation and amortization | $ | 25,150 | $ | 28,580 | $ | 32,714 | $ | 37,348 | $ | 34,477 | ||||||||||
(1) | Includes a $11.3 million valuation allowance expense, a $6.7 million restructuring charge ($5.9 million, net of tax), $2.2 million in financing liability interest expense ($1.7 million, net of tax), a $1.6 million litigation settlement ($1.6 million, net of tax), a $0.9 million asset impairment ($0.6 million, net of tax), and $0.4 million in acquisition costs ($0.4 million, net of tax). |
(2) | Includes a $10.9 million restructuring charge ($8.8 million, net of tax), a $9.2 million make-whole premium on Senior Secured Notes ($9.2 million, net of tax), a $4.8 million asset impairment ($4.6 million, net of tax), $2.1 million in financing liability interest expense ($1.5 million, net of tax), a $1.2 million charge related to our CFO transition ($1.2 million, net of tax), $1.0 million in acquisition costs ($0.9 million, net of tax), a $0.1 million valuation allowance benefit, a benefit of $6.6 million due to a litigation ruling reversal ($6.6 million, net of tax), and a $0.2 million gain on sale of our interest in the non-strategic Sri Lanka subsidiary ($0.2 million, net of tax). |
(3) | Includes a $106.3 million goodwill impairment ($106.3 million, net of tax), a $28.4 million restructuring charge ($23.9 million, net of tax), a $2.9 million charge related to our CEO transition ($2.9 million, net of tax), $1.9 million in financing liability interest expense ($1.3 million, net of tax), a $1.8 million asset impairment ($1.8 million, net of tax), a $1.1 million make-whole premium on Senior Secured Notes ($1.1 million, net of tax), a $0.3 million valuation allowance expense, $0.3 million in acquisition costs ($0.3 million, net of tax), $0.3 million litigation settlement ($0.3 million, net of tax), income of $3.9 million related to improper and fraudulent Canadian activities including insurance proceeds ($2.9 million, net of tax) and a $1.7 million gain on sale of non-strategic Suzhou, China subsidiary ($1.4 million, net of tax). |
(4) | Includes a $47.7 million valuation allowance expense, a $28.6 million restructuring charge ($25.8 million, net of tax), a $3.4 million intangible impairment ($3.2 million, net of tax), a $3.4 million goodwill impairment ($3.1 million, net of tax), a $2.3 million in acquisition costs ($2.3 million, net of tax), a $1.0 million change related to an indefinite tax reversal assertion, $1.0 million in financing liability interest expense ($0.7 million, net of tax), a $0.9 million litigation settlement ($0.9 million, net of tax), and income of $0.2 million related to improper and fraudulent Canadian activities ($0.1 million, net of tax). |
28
(5) | Includes an $8.2 million restructuring charge ($6.2 million, net of tax), a valuation allowance expense of $4.3 million, a $1.7 million tax charge, a $1.5 million expense related to improper and fraudulent Canadian activities ($1.2 million, net of tax), and a $0.8 million selling, general and administrative charge ($0.8 million, net of tax) related to adjustments to acquisition related liabilities pertaining to the period prior to the acquisition date. |
(amounts in thousands, except ratios) | December 28, 2014 | December 29, 2013 | December 30, 2012 | December 25, 2011 | December 26, 2010 | ||||||||||||||
AT YEAR END | |||||||||||||||||||
Working capital | $ | 232,551 | $ | 233,452 | $ | 229,720 | $ | 233,179 | $ | 293,836 | |||||||||
Total debt | $ | 65,397 | $ | 91,622 | $ | 113,288 | $ | 150,462 | $ | 141,949 | |||||||||
Total equity | $ | 327,931 | $ | 346,325 | $ | 354,309 | $ | 508,645 | $ | 576,714 | |||||||||
Total assets | $ | 738,666 | $ | 799,493 | $ | 869,115 | $ | 1,058,983 | $ | 1,035,993 | |||||||||
FOR THE YEAR ENDED | |||||||||||||||||||
Capital expenditures | $ | (17,971 | ) | $ | (8,946 | ) | $ | (12,401 | ) | $ | (22,981 | ) | $ | (23,712 | ) | ||||
Cash provided by (used in) operating activities | $ | 65,542 | $ | 21,070 | $ | 62,365 | $ | (20,073 | ) | $ | 11,727 | ||||||||
Cash used in investing activities | $ | (17,605 | ) | $ | (5,298 | ) | $ | (2,449 | ) | $ | (98,280 | ) | $ | (23,185 | ) | ||||
Cash (used in) provided by financing activities | $ | (24,135 | ) | $ | (11,337 | ) | $ | (35,166 | ) | $ | 37,304 | $ | 28,891 | ||||||
RATIOS | |||||||||||||||||||
Return on net sales(a) | 1.65 | % | (2.74 | )% | (21.23 | )% | (11.01 | )% | 3.97 | % | |||||||||
Return on average equity(b) | 3.25 | % | (5.40 | )% | (33.94 | )% | (15.39 | )% | 5.06 | % | |||||||||
Return on average assets(c) | 1.42 | % | (2.27 | )% | (15.19 | )% | (7.97 | )% | 2.76 | % | |||||||||
Current ratio(d) | 2.47 | 2.31 | 2.05 | 1.90 | 2.35 | ||||||||||||||
Percent of total debt to capital(e) | 16.63 | % | 20.92 | % | 24.23 | % | 22.83 | % | 19.75 | % | |||||||||
(a) | “Return on net sales” is calculated by dividing net earnings (loss) by net sales. |
(b) | “Return on average equity” is calculated by dividing net earnings (loss) by average equity. |
(c) | “Return on average assets” is calculated by dividing net earnings (loss) by average assets. |
(d) | “Current ratio” is calculated by dividing current assets by current liabilities. |
(e) | “Percent of total debt to capital” is calculated by dividing total debt by total debt and equity. |
(amounts in thousands, except employee data) | December 28, 2014 | December 29, 2013 | December 30, 2012 | December 25, 2011 | December 26, 2010 | ||||||||||||||
OTHER INFORMATION | |||||||||||||||||||
Weighted average number of shares outstanding - diluted | 42,374 | 41,903 | 41,000 | 40,532 | 40,445 | ||||||||||||||
Number of employees | 4,894 | 4,710 | 5,132 | 6,565 | 5,814 | ||||||||||||||
Backlog | $ | 28,995 | $ | 25,273 | $ | 48,212 | $ | 52,204 | $ | 47,974 | |||||||||
29
Item 7. MANAGEMENT’S DISCUSSION AND ANALYSIS OF FINANCIAL CONDITION AND RESULTS OF OPERATIONS
The following section highlights significant factors impacting the consolidated operations and financial condition of the Company and its subsidiaries. The following discussion should be read in conjunction with Item 6 “Selected Financial Data” and Item 8 “Financial Statements and Supplementary Data.”
Overview
We are a leading global manufacturer and provider of technology-driven, loss prevention, inventory management and labeling solutions to the retail and apparel industry. We provide integrated inventory management solutions to brand, track, and secure goods for retailers and consumer product manufacturers worldwide. We are a leading provider of, and earn revenues primarily from the sale of Merchandise Availability Solutions, Apparel Labeling Solutions, and Retail Merchandising Solutions. Merchandise Availability Solutions consists of electronic article surveillance (EAS) systems, EAS consumables, Alpha® solutions, and radio frequency identification (RFID) systems, software and services. Apparel Labeling Solutions includes our web-based data management service and network of service bureaus to manage the printing of variable information on price and promotional tickets, graphic tags and labels, adhesive labels, fabric and woven tags and labels, apparel branding tags, fully integrated tags and labels and RFID tags and labels. Retail Merchandising Solutions consists of hand-held labeling systems (HLS) and retail display systems (RDS). Applications of these products include primarily retail security, asset and merchandise visibility, automatic identification, and pricing and promotional labels and signage. Operating directly in 27 countries, we have a global network of subsidiaries and distributors, and provide customer service and technical support around the world.
Our results are heavily dependent upon sales to the retail market. Our customers are dependent upon retail sales, which are susceptible to economic cycles and seasonal fluctuations. Furthermore, as approximately two-thirds of our revenues and operations are located outside the U.S., fluctuations in foreign currency exchange rates have a significant impact on reported results.
We report our financial results in three segments: Merchandise Availability Solutions (MAS), Apparel Labeling Solutions (ALS), and Retail Merchandising Solutions (RMS).
Our MAS segment, which is focused on loss prevention and Merchandise Visibility™ (RFID), includes EAS systems, EAS consumables, Alpha® high-theft solutions, RFID systems and software and non-U.S. and Canada-based CheckView®. ALS includes the results of our RFID labels business, coupled with our data management platform and network of service bureaus that manage the printing of variable information on apparel labels and tags. Our RMS segment includes hand-held labeling applicators and tags, promotional displays, and customer queuing systems. The revenues, gross profit, and total assets for each of the segments are included in Note 18 of the Consolidated Financial Statements.
In 2012, we refined our business strategy, to transition from a product protection business to a provider of inventory management solutions that give retailers ready insight into the on-shelf availability of merchandise in their stores. Additionally, our business strategy is focusing on improving revenues and profitability, reducing costs, and improving working capital management. In support of this strategy, we continue to provide to retailers, manufacturers and distributors our EAS systems and consumables, Alpha® high-theft solutions, Merchandise Visibility™ (RFID) products and services, and METO® hand-held labeling products. In apparel labeling, we are focusing on those products that support our refined strategy and leveraging our competitive advantage in the transfer and printing of variable data onto apparel labels. We will also consider acquisitions that are aligned with our strategic plan.
Our solutions help customers identify, track, and protect their assets. We believe that innovative new products and expanded product offerings will provide opportunities to enhance the value of legacy products while expanding the product base in existing customer accounts. We intend to maintain our leadership position in key hard goods markets (supermarkets, drug stores, mass merchandisers, and music and electronics retailers), expand our market share in soft goods markets (specifically apparel), and maximize our position in under-penetrated markets. We also intend to continue to capitalize on our installed base with large global retailers to promote source tagging. Furthermore, we plan to leverage our knowledge of radio-frequency (RF) and identification technologies to assist retailers and manufacturers in realizing the benefits of RFID.
To achieve these objectives, we expect to continuously enhance and expand our technologies and products, and provide superior service to our customers. We intend to offer customers a wide variety of integrated shrink management solutions, apparel labeling, and retail merchandising solutions characterized by superior quality, ease-of-use, and good value, with enhanced merchandising opportunities. In 2014, we reiterated our commitment to this strategy and our focus on innovation and internally-developed technologies with the appointment of a Senior Vice President of Innovation. We are building a corporate
30
development and mergers and acquisitions (M&A) team to complement our internally-developed innovation with targeted strategic acquisitions.
Our Apparel Labeling business was assembled over the past few years through numerous acquisitions to support our penetration into the apparel industry and to support the growth of our RFID strategy. We have made changes to right-size the Apparel Labeling footprint in order to profitably provide on-time, high quality products to our apparel customers so that retailers can effectively merchandise their products. Simultaneously, we reduced our Apparel Labeling product offerings to only those that are also necessary to support our RFID strategy.
During September 2014, we initiated the Profit Enhancement Plan focused on increasing profitability through strategic headcount reductions and the streamlining of manufacturing processes. Total costs of the plan through December 28, 2014 are $5.3 million. Total annual savings of the Profit Enhancement Plan are expected to approximate $7 million, with an expected $6 million in savings to be realized in 2015.
As of December 2014, our expanded Global Restructuring Plan including Project LEAN and the SG&A Restructuring Plan have been substantially completed with total costs incurred to date of $78 million. With initiatives to stabilize sales, actively manage margins, reduce operating expense and effectively manage working capital, the plans are estimated to produce annual cost savings of $108 million.
On December 11, 2013, we entered into a new $200.0 million five-year senior secured multi-currency revolving credit facility (2013 Senior Secured Credit Facility) agreement (2013 Credit Agreement) with a syndicate of lenders. The 2013 Senior Secured Credit Facility was used to repay $32.0 million outstanding under the 2010 Senior Secured Credit Facility as well as the $55.6 million outstanding under the Senior Secured Notes. We may borrow, prepay and re-borrow under the 2013 Senior Secured Credit Facility as long as the sum of the outstanding principal amounts is less than the aggregate facility availability. The 2013 Senior Secured Credit Facility also includes an expansion option that will allow us to request an increase in the 2013 Senior Secured Credit Facility of up to an aggregate of $100.0 million, for a potential total commitment of $300.0 million.
Future financial results will be dependent upon our ability to successfully implement our strategic focus, expand the functionality of our existing product lines, develop or acquire new products for sale through our global distribution channels, convert new large chain retailers to our solutions for shrink management, merchandise visibility and apparel labeling, and reduce the cost of our products and infrastructure to respond to competitive pricing pressures.
We believe that our base of recurring revenue (revenues from the sale of consumables into the installed base of security systems, apparel tags and labels, hand-held labeling tools and services from maintenance), repeat customer business, the anticipated effect of our restructuring activities and our borrowing capacity should provide us with adequate cash flow and liquidity to execute our strategic plan.
Critical Accounting Policies and Estimates
Our discussion and analysis of our financial condition and results of operations are based upon our Consolidated Financial Statements, which have been prepared in accordance with generally accepted accounting principles (GAAP) in the United States of America. The preparation of these financial statements requires us to make estimates and judgments that affect the reported amounts of assets, liabilities, revenues and expenses, and the related disclosure of contingent assets and liabilities.
Note 1 of the Notes to the Consolidated Financial Statements describes the significant accounting policies used in the preparation of the Consolidated Financial Statements. Certain of these significant accounting policies are considered to be critical accounting policies. A critical accounting policy is defined as one that is both material to the presentation of our Consolidated Financial Statements and requires management to make difficult, subjective or complex judgments that could have a material effect on our financial condition or results of operations.
Specifically, these policies have the following attributes: (1) we are required to make assumptions about matters that are highly uncertain at the time of the estimate; and (2) different estimates we could reasonably have used, or changes in the estimate that are reasonably likely to occur, would have a material effect on our financial condition or results of operations. Estimates and assumptions about future events and their effects cannot be determined with certainty. On an on-going basis, we evaluate our estimates on historical experience and on various other assumptions believed to be applicable and reasonable under the circumstances. These estimates may change as new events occur, as additional information is obtained and as our operating environment changes. These changes have historically been minor and have been included in the Consolidated Financial Statements as soon as they became known. Senior management reviews the development and selection of our accounting
31
policies and estimates with the Audit Committee. The critical accounting policies have been consistently applied throughout the accompanying financial statements.
We believe the following accounting policies are critical to the preparation of our Consolidated Financial Statements:
Revenue Recognition. We recognize revenue when revenue is realized or realizable and earned. Revenue is realized or realizable and earned when all of the following criteria are met: persuasive evidence of an arrangement exists; delivery has occurred or services have been rendered; the price to the buyer is fixed or determinable; and collectability is reasonably assured.
We enter into contracts to sell our products and services, and, while the majority of our sales agreements contain standard terms and conditions, there are agreements that contain multiple elements or non-standard terms and conditions. As a result, significant contract interpretation is sometimes required to determine the appropriate accounting, including whether the deliverables specified in a multiple element arrangement should be treated as separate units of accounting for revenue recognition purposes, and, if so, how the selling price should be allocated among the elements and when to recognize revenue for each element.
For arrangements with multiple elements, we allocate total arrangement consideration to all deliverables based on their relative selling price using a specific hierarchy and recognize revenue when each element’s revenue recognition criteria is met. The hierarchy is as follows: vendor-specific objective evidence (VSOE), third-party evidence of selling price (TPE) or best estimate of selling price (BESP). VSOE of fair value for each element is established based on the price charged when the same element is sold separately. We recognize revenue when installation is complete or other post-shipment obligations have been satisfied. Unearned revenue is recorded when payments are received in advance of performing our service obligations and is recognized over the service period.
Products leased to customers under sales-type leases are accounted for as the equivalent of a sale. The present value of such lease revenues is recorded as net revenues, and the related cost of the products is charged to cost of revenues. The deferred finance charges applicable to these leases are recognized over the terms of the leases, or when sold. Rental revenue from products under operating leases is recognized over the term of the lease. Installation revenue from SMS EAS products is recognized when the systems are installed. Service revenue is recognized, for service contracts, on a straight-line basis over the contractual period, and, for non-contract work, as services are performed.
Revenues from software license agreements are recognized when persuasive evidence of an agreement exists, delivery of the product has occurred, no significant vendor obligations are remaining to be fulfilled, the fee is fixed or determinable, and collection is probable. Revenue from software contracts for both licenses and professional services that require significant production, modification, customization, or implementation are recognized together using the percentage of completion method based upon the ratio of labor incurred to total estimated labor to complete each contract. In instances where there is a term license combined with services, revenue is recognized ratably over the term.
We record estimated reductions to revenue for customer incentive offerings, including volume-based incentives and rebates. We record revenues net of an allowance for estimated return activities. Return activity was immaterial to revenue and results of operations for all periods presented.
We believe the following judgments and estimates have a significant effect on our Consolidated Financial Statements:
Allowance for Doubtful Accounts. We maintain allowances for doubtful accounts for estimated losses resulting from the inability of our customers to make required payments. These allowances are based on specific facts and circumstances surrounding individual customers as well as our historical experience. The adequacy of the reserves for doubtful accounts is continually assessed by periodically evaluating each customer’s receivable balance, considering our customers’ financial condition and credit history, and considering current economic conditions. Historically, our reserves have been adequate to cover all losses associated with doubtful accounts. If the financial condition of our customers was to deteriorate, impairing their ability to make payments, additional allowances may be required. If economic or political conditions were to change in the countries where we do business, it could have a significant impact on the results of operations, and our ability to realize the full value of our accounts receivable. Furthermore, we are dependent on customers in the retail markets. Economic difficulties experienced in those markets could have a significant impact on our results of operations and our ability to realize the full value of our accounts receivables. If our historical experiences changed by 10%, it would require an increase or decrease of $0.1 million to our reserve.
32
Inventory Valuation. We write down our inventory for estimated obsolescence or unmarketable items equal to the difference between the cost of the inventory and the estimated net realizable value based upon assumptions of future demand and market conditions. If actual market conditions are less favorable than those projected by management, additional inventory write-downs may be required. If our estimates were to change by 10%, it would cause a change in inventory value of $0.4 million.
Valuation of Long-lived Assets. Our long-lived assets include property, plant, and equipment, goodwill, and identified intangible assets. With the exception of goodwill and indefinite-lived intangible assets, long-lived assets are depreciated or amortized over their estimated useful lives, and are reviewed for impairment whenever changes in circumstances indicate the carrying value may not be recoverable. Recoverability is determined based upon our estimates of future undiscounted cash flows. If the carrying value is determined to be not recoverable, an impairment charge would be necessary to reduce the recorded value of the assets to their fair value. The fair value of the long-lived assets other than goodwill is based upon appraisals, quoted market prices of similar assets, or discounted cash flows.
Goodwill and indefinite-lived intangible assets are subject to tests for impairment at least annually or whenever events or changes in circumstances indicate that the carrying amount of the assets may not be recoverable. We test for impairment on an annual basis as of fiscal month end October of each fiscal year, relying on a number of factors including operating results, business plans, and anticipated future cash flows. Our management uses its judgment in assessing whether goodwill has become impaired between annual impairment tests. Reporting units are primarily determined as the geographic areas comprising our business segments, except in situations when aggregation of the reporting units is appropriate. Recoverability of goodwill is evaluated using a two-step process. The first step involves a comparison of the fair value of a reporting unit with its carrying value. If the carrying amount of the reporting unit exceeds the fair value, then the second step of the process involves a comparison of the implied fair value and carrying value of the goodwill of that reporting unit. If the carrying value of the goodwill of a reporting unit exceeds the fair value of that goodwill, an impairment loss is recognized in an amount equal to the excess. The nonrecurring fair value measurement of goodwill is developed using significant unobservable inputs (Level 3).
The implied fair value of our reporting units is dependent upon our estimate of future discounted cash flows and other factors. Our estimates of future cash flows include assumptions concerning future operating performance and economic conditions and may differ from actual future cash flows. Estimated future cash flows are adjusted by an appropriate discount rate derived from our market capitalization plus a suitable control premium at the date of evaluation. The financial and credit market volatility directly impacts our fair value measurement through our weighted average cost of capital that we use to determine our discount rate, and through our stock price that we use to determine our market capitalization. Therefore, changes in the stock price may also affect the result of the impairment test. Market capitalization is determined by multiplying the number of shares outstanding on the assessment date by the average market price of our common stock over a 30-day period before each assessment date. We use this 30-day duration to consider inherent market fluctuations that may affect any individual closing price. We believe that our market capitalization alone does not fully capture the fair value of our business as a whole, or the substantial value that an acquiring entity would obtain from its ability to obtain control of our business. The difference between the sum total of the fair value of our reporting units and our market capitalization represents the control premium. As of the date of our goodwill impairment test, management has assessed our control premium to be within a reasonable range.
We have not made any changes to our methodology used in our annual impairment test since the adoption of ASC 350. Determination of the fair value of a reporting unit is a matter of judgment and involves the use of estimates and assumptions, which are based on management’s best estimates at the time.
We use an income approach (discounted cash flow approach) for the determination of fair value of our reporting units. Our projected cash flows incorporate many assumptions, the most significant of which include variables such as future sales, growth rates, operating margin, and the discount rates applied.
Assumptions related to revenue, growth rates and operating margin are based on management’s annual and ongoing forecasting, budgeting and planning processes and represent our best estimate of the future results of operations across the company. These estimates are subject to many assumptions, such as the economic environment across the segments in which we operate, end demand for our products, and competitor actions. The use of different assumptions would increase or decrease estimated discounted future cash flows and could increase or decrease an impairment charge. If the use of these assets or the projections of future cash flows change in the future, we may be required to record impairment charges. An erosion of future business results in any of the business units or significant declines in our stock price could result in an impairment charge to goodwill or other long-lived assets. These risks are discussed in Item 1A. Risk Factors.
Our 2013 and 2014 annual impairment assessments as of October month end did not result in any recognized impairment charges. As of the date of our fiscal 2014 annual impairment test, the total estimated fair values for the reporting units in all of our segments substantially exceeded their total carrying values. Based on our most recent goodwill impairment assessment of the reporting units of our segments and our understanding of currently projected trends of the business and the economy, we do
33
not believe that there is a significant risk of impairment for these reporting units for a reasonable period of time. Although our analysis regarding the fair values of the goodwill and indefinite lived intangible assets indicates that they exceed their respective carrying values, materially different assumptions regarding the future performance of our businesses or significant declines in our stock price could result in additional goodwill impairment losses. While there is an overall significant percentage excess in comparing the discounted cash flow value to the overall book value of each reporting unit, the amount by which the Retail Merchandising Solutions Europe and International Americas reporting unit fair value exceeds its carrying value is approximately $7 million. Although our analysis regarding the fair values of the goodwill and indefinite lived intangible assets indicates that they exceed their respective carrying values, materially different assumptions regarding the future performance of our businesses or significant declines in our stock price could result in additional goodwill impairment losses. Specifically, an unanticipated deterioration in revenues and gross margins generated by our Merchandise Availability Solutions, Apparel Labeling Solutions and Retail Merchandising Solutions segments could trigger future impairment in those segments. Refer to Notes 1 and 5 of the Consolidated Financial Statements.
Income Taxes. In determining income for financial statement purposes, we must make certain estimates and judgments. These estimates and judgments affect the calculation of certain tax liabilities and the determination of recoverability of certain of the deferred tax assets, which arise from temporary differences between tax and financial statement recognition of revenue and expense. We record a valuation allowance to reduce our deferred tax assets to the amount that it is more likely than not to be realized. In assessing the realizability of deferred tax assets, we consider future taxable income by tax jurisdictions and tax planning strategies. If we were to determine that we would be able to realize deferred tax assets in the future in excess of the net recorded amount, an adjustment to the valuation allowance would increase income in the period such determination was made. Likewise, should we determine that we would not be able to realize all or part of our net deferred tax assets in the future, an adjustment to the valuation allowance would decrease income in the period such determination was made. (See Note 12 of the Consolidated Financial Statements.)
Changes in tax laws and rates could also affect recorded deferred tax assets and liabilities in the future. We are not aware of any such changes that would have a material effect on our results of operations, cash flows or financial position.
In addition, the calculation of our tax liabilities involves dealing with uncertainties in the application of complex tax regulations in a multitude of jurisdictions across our global operations. We record tax liabilities for the anticipated settlement of tax audit issues in the U.S. and other tax jurisdictions based on our estimate of whether, and the extent to which, additional taxes will be due. Our income tax expense includes amounts intended to satisfy income tax assessments that result from these audit issues. Determining the income tax expense for these potential assessments and recording the related assets and liabilities requires management judgments and estimates. Due to the complexity of some of these uncertainties, the ultimate resolution may result in a payment that is different from our estimate of tax liabilities. If payment of these amounts ultimately proves to be greater or less than the recorded amounts, the change of the liabilities would result in tax expense or benefit being recognized in that period. We have evaluated our uncertain tax positions and believe that our reserve for uncertain tax positions, including related interest and penalty, is adequate.
Pension Plans. We have various unfunded pension plans outside the U.S. These plans have significant pension costs and liabilities that are developed from actuarial valuations. Inherent in these valuations are key assumptions including discount rates, expected return on plan assets, mortality rates, and merit and promotion increases. We are required to consider current market conditions, including changes in interest rates, in selecting these assumptions. Changes in the related pension costs or liabilities may occur in the future due to changes in the assumptions. A change in discount rates of 0.25% would have less than a $0.3 million effect on pension expense. Refer to Note 13 of the Consolidated Financial Statements.
Stock Compensation. We recognize stock-based compensation expense for all share-based payment awards net of an estimated forfeiture rate and only recognize compensation cost for those shares expected to vest. Stock compensation expense is recognized for all share-based payments on a straight-line basis over the requisite service period of the award.
Determining the fair value of share-based payment awards requires the input of highly subjective assumptions, including the expected life of the share-based payment awards and stock price volatility. The assumptions used in calculating the fair value of share-based payment awards represent management’s best estimates, but these estimates involve inherent uncertainties and the application of management judgment. As a result, if factors change and we use different assumptions, our share-based compensation expense could be materially different in the future. In addition, we are required to estimate the expected forfeiture rate and only recognize expense for those shares expected to vest. If our actual forfeiture rate is materially different from our estimate, the share-based compensation expense could be significantly different from what we have recorded in the current period. A change in the estimated forfeiture rate of 10% would have a $0.1 million effect on stock compensation expense. As of December 28, 2014, there was $1.1 million and $3.3 million of unrecognized stock-based compensation
34
expense related to unvested stock options and restricted stock units, respectively. Such costs are expected to be recognized over a weighted-average period of 1.7 years and 1.7 years, respectively. Refer to Note 8 of the Consolidated Financial Statements.
Liquidity and Capital Resources
We continue to execute our strategic plan in a volatile global economic environment. Our liquidity needs have been, and are expected to continue to be driven by acquisitions, capital investments, product development costs, potential future restructuring related to the rationalization of the business, and working capital requirements. We have met our liquidity needs primarily through cash generated from operations. Based on an analysis of liquidity utilizing conservative assumptions for the next twelve months, we believe that cash on hand from operating activities and funding available under our credit agreement should be adequate to service debt and working capital needs, meet our capital investment requirements, other potential restructuring requirements, product development requirements, including internally developed innovation and targeted strategic acquisitions.
In the fourth quarter of 2011, we changed our assertion on unremitted earnings for certain foreign subsidiaries, primarily due to pressure on our leverage ratio for debt covenants. This resulted in the repatriation of foreign earnings in order to reduce worldwide debt to the levels stipulated by our covenants. Also impacting the change in assertion was the projected cash impact of our Global Restructuring Plan. As of December 28, 2014, the majority of our unremitted earnings of subsidiaries outside of the United States were deemed not to be permanently reinvested.
We believe that our base of recurring revenue (revenues from the sale of consumables into the installed base of security systems, apparel tags and labels, hand-held labeling tools and services from maintenance), repeat customer business, the anticipated effect of our restructuring activities, and our cash position and borrowing capacity should continue to provide us with adequate cash flow and liquidity to continue with the successful execution of our strategic plan. We have worked to reduce our liquidity risk by implementing working capital improvements while reducing expenses in areas that will not adversely impact the future potential of our business. We evaluate the risk and creditworthiness of all existing and potential counterparties for all debt, investment, and derivative transactions and instruments. Our policy allows us to enter into transactions with nationally recognized financial institutions with a credit rating of “A” or higher as reported by one of the credit rating agencies that is a nationally recognized statistical rating organization by the U.S. Securities and Exchange Commission. The maximum exposure permitted to any single counterparty is $50.0 million. Counterparty credit ratings and credit exposure are monitored monthly and reviewed quarterly by our Treasury Risk Committee.
As of December 28, 2014, our cash and cash equivalents were $135.5 million compared to $121.6 million as of December 29, 2013. A significant portion of this cash is held overseas and can be repatriated. We do not expect to incur material costs associated with repatriation. Cash and cash equivalents increased in 2014 primarily due to $65.5 million of cash provided by operating activities, partially offset by $24.1 million of cash used in financing activities, $17.6 million of cash used in investing activities and $9.9 million effect of foreign currency.
Cash provided by operating activities was $44.5 million more during 2014 compared to 2013. In 2014 compared to 2013, our cash from operating activities was positively impacted by the significant increase in operating income and improvements in accounts receivable collections partially offset by decreased accounts payable balances and increased inventory investments to support forecasted demand including new market share gains. The remainder of the variances is explained by changes in other current liabilities, unearned revenues, income taxes, other current assets, and the restructuring reserve.
Cash used in investing activities was $12.3 million higher during 2014 compared to 2013. This was primarily due to an increase in the acquisition of property, plant, and equipment during 2014 compared to 2013. In addition, the 2013 cash from investing activities includes proceeds from the sale of our U.S. and Canada based CheckView® business unit, sale of our 51% interest in our Shore to Shore Sri Lanka entity, and from the sale of property, plant and equipment.
Cash used in financing activities was $12.8 million higher during 2014 compared to 2013. This was due primarily to greater reductions of debt levels during 2014 compared to 2013.
Our percentage of total debt to total equity as of December 28, 2014, was 19.9% compared to 26.5% as of December 29, 2013. As of December 28, 2014, our working capital was $232.6 million compared to $233.5 million as of December 29, 2013.
We continue to reinvest in the Company through our investment in technology and process improvement. During 2014, our investment in research and development amounted to $15.3 million, as compared to $17.5 million in 2013. These amounts are reflected in cash used in operations, as we expense our research and development as it is incurred. In 2015, we anticipate spending on research and development to support the achievement of our strategic plan to be in the range of $18 million to $20 million.
35
We have various unfunded pension plans outside of the U.S. These plans have significant pension costs and liabilities that are developed from actuarial valuations. For fiscal 2014, our contribution to these plans was $4.9 million. Our funding expectation for 2015 is $4.7 million. We believe our current cash position, cash generated from operations, and the availability of cash under our revolving line of credit will be adequate to fund these requirements. The Contractual Obligation table details our anticipated funding requirements related to pension obligations for the next ten years.
Acquisition of property, plant, and equipment and intangibles during 2014 totaled $18.0 million compared to $8.9 million during 2013. During 2014, our acquisition of property, plant, and equipment and intangibles included $5.4 million of costs related to establishing a new manufacturing facility in China. We anticipate our capital expenditures, used primarily to improve our production capabilities, to be in the range of $20 million to $25 million in 2015.
2013 Senior Secured Credit Facility
On December 11, 2013, we entered into a new $200.0 million five-year senior secured multi-currency revolving credit facility (2013 Senior Secured Credit Facility) agreement (2013 Credit Agreement) with a syndicate of lenders. As of December 28, 2014, we were in compliance with all of our covenants, and although we cannot provide full assurance, we expect to be in compliance throughout 2015.
We incurred $1.8 million in fees and expenses in connection with the 2013 Senior Secured Credit Facility, which are amortized over the term of the 2013 Senior Secured Credit Facility to interest expense on the Consolidated Statement of Operations. The remaining unamortized debt issuance costs recognized in connection with the 2010 Secured Credit Facility of $0.4 million are also amortized over the term of the 2013 Senior Secured Credit Facility to interest expense on the Consolidated Statement of Operations.
2010 Senior Secured Credit Facility
On July 22, 2010, we entered into an Amended and Restated Senior Secured Credit Facility (2010 Senior Secured Credit Facility) with a syndicate of lenders. The 2010 Senior Secured Credit Facility provided us with a $125.0 million four-year senior secured multi-currency revolving credit facility.
On September 21, 2012, we repaid $6.1 million on the 2010 Senior Secured Credit Facility. In connection with the repayment, we recognized $0.2 million of unamortized debt issuance costs. The cost was recognized in interest expense on the Consolidated Statement of Operations in the third quarter of 2012.
On June 28, 2013, we repaid $3.8 million on the 2010 Senior Secured Credit Facility. In connection with the repayment, we
recognized $71 thousand of unamortized debt issuance costs. The costs were recognized in interest expense on the
Consolidated Statement of Operations in the second quarter of 2013.
On September 27, 2013, we repaid $2.7 million on the 2010 Senior Secured Credit Facility. In connection with the repayment, we recognized $38 thousand of unamortized debt issuance costs. The costs were recognized in interest expense on the Consolidated Statement of Operations in the third quarter of 2013.
On December 11, 2013, we repaid the $32.0 million outstanding under the 2010 Senior Secured Credit Facility and terminated the 2010 Senior Secured Credit Facility. In connection with the paydown, we recognized $0.3 million of unamortized debt issuance costs related to lenders that are not included in the 2013 Senior Secured Credit Facility in interest expense on the Consolidated Statement of Operations in the fourth quarter of 2013.
Senior Secured Notes
Also on July 22, 2010, we entered into a Note Purchase and Private Shelf Agreement (the Senior Secured Notes Agreement) with a lender, and certain other purchasers party thereto.
During the year ended December 30, 2012, we incurred $1.4 million in fees and expenses in connection with the July 2012
Amendment to the Senior Secured Notes, of which $0.6 million were recognized in selling, general, and administrative
expenses on the Consolidated Statement of Operations in 2012 and $0.8 million, which were capitalized and amortized
over the term of the Senior Secured Notes to interest expense on the Consolidated Statement of Operations.
On September 21, 2012, we repaid $8.9 million in principal as well as a make-whole premium of $1.1 million related to the
36
Senior Secured Notes. In connection with the repayment on the Senior Secured Notes, we recognized $0.1 million of
unamortized debt issuance costs. The unamortized debt issuance costs and make whole premium fees were recognized in
interest expense on the Consolidated Statement of Operations in 2012.
On June 28, 2013, we repaid $6.2 million in principal as well as a make-whole premium of $0.6 million related to the Senior
Secured Notes. In connection with the repayment on the Senior Secured Notes, we recognized $57 thousand of unamortized
debt issuance costs. The unamortized debt issuance costs and make-whole premium fees were recognized in interest expense on
the Consolidated Statement of Operations in the second quarter of 2013.
On September 27, 2013, we repaid $4.3 million in principal as well as a make-whole premium of $0.4 million related to the Senior Secured Notes. In connection with the repayment, we recognized $36 thousand of unamortized debt issuance costs. The unamortized debt issuance costs and make-whole premium fees were recognized in interest expense on the Consolidated Statement of Operations in the third quarter of 2013.
On December 11, 2013, we repaid the outstanding amounts of $55.6 million in principal as well as a make-whole premium of
$7.3 million related to the Senior Secured Notes and terminated the Senior Secured Notes. In connection with the repayment on
the Senior Secured Notes, we recognized $0.4 million of unamortized debt issuance costs. The unamortized debt issuance costs
and make-whole premium fees were recognized in interest expense on the Consolidated Statement of Operations in the fourth
quarter of 2013.
We have never paid a cash dividend (except for a nominal cash distribution in April 1997 to redeem the rights outstanding under our 1988 Shareholders’ Rights Plan). On March 5, 2015 we declared a dividend of $0.50 per outstanding common share for all shareholders of record as of March 20, 2015. The dividend is payable on April 10, 2015. This special dividend reflects our commitment to building stockholder value through the execution of our strategic plan and a disciplined approach to capital allocation. After the special dividend, we believe we have the appropriate level of liquidity both to fund our internal initiatives and act quickly on any inorganic strategic opportunities.
Based upon an analysis of liquidity using our current forecast, management believes that our anticipated cash needs over the next twelve months can be funded from cash and cash equivalents on hand, the availability of cash under the 2013 Senior Secured Credit Facility and cash generated from future operations.
Off-Balance Sheet Arrangements
We do not utilize material off-balance sheet arrangements apart from operating leases that have, or are reasonably likely to have, a current or future effect on our financial condition, changes in financial condition, revenue or expenses, results of operations, liquidity, capital expenditures or capital resources. We use operating leases as an alternative to purchasing certain property, plant, and equipment. Our future rental commitment under all non-cancelable operating leases was $21.1 million as of December 28, 2014. The scheduled timing of these rental commitments is detailed in our “Contractual Obligations” section.
Contractual Obligations
Our contractual obligations as of December 28, 2014 are summarized below:
Contractual Obligation (amounts in thousands) | Total | Due in less than 1 year | Due in 1-3 years | Due in 3-5 years | Due after 5 years | ||||||||||||||
Long-term debt(1) | $ | 68,874 | $ | 1,044 | $ | 1,928 | $ | 65,902 | — | ||||||||||
Capital leases(2) | 269 | 100 | 154 | 15 | — | ||||||||||||||
Operating leases | 21,065 | 8,639 | 9,184 | 2,502 | 740 | ||||||||||||||
Pension obligations(3) | 47,817 | 4,474 | 9,036 | 9,353 | 24,954 | ||||||||||||||
Purchase obligations(4) | 1,552 | 1,552 | — | — | — | ||||||||||||||
Total contractual cash obligations | $ | 139,577 | $ | 15,809 | $ | 20,302 | $ | 77,772 | $ | 25,694 | |||||||||
37
Our commercial commitments as of December 28, 2014 are summarized below:
Commercial Commitments (amounts in thousands) | Total | Due in less than 1 year | Due in 1-3 years | Due in 3-5 years | Due after 5 years | ||||||||||||||
Standby letters of credit | $ | 1,415 | $ | 1,415 | $ | — | $ | — | $ | — | |||||||||
Surety bonds | 1,064 | 867 | 197 | — | — | ||||||||||||||
Total commercial commitments | $ | 2,479 | $ | 2,282 | $ | 197 | $ | — | $ | — | |||||||||
(1) | Includes the 2013 Senior Secured Credit Facility, long-term full-recourse factoring liabilities, and related interest payments through maturity of $3.8 million. |
(2) | Includes interest payments through maturity of $20 thousand. |
(3) | Amounts represent undiscounted projected benefit payments to our unfunded plans over the next 10 years. The expected benefit payments are estimated based on the same assumptions used to measure our accumulated benefit obligation at the end of 2014 and include benefits attributable to estimated future employee service of current employees. |
(4) | Purchase obligations represent our legally binding agreements to purchase services or goods at fixed prices or minimum quantities. |
The table above excludes our gross liability for uncertain tax positions, including accrued interest and penalties, which totaled $31.3 million as of December 28, 2014, since we cannot predict with reasonable reliability the timing of cash settlements to the respective taxing authorities.
Pension Plans
We maintain several defined benefit pension plans, principally in Europe. The majority of these pension plans are unfunded. Our pension expense for 2014, 2013, and 2012 was $6.2 million, $6.3 million, and $5.1 million, respectively.
We review our pension assumptions annually. Our assumptions for the year ended December 28, 2014, were a discount rate of 3.52%, an expected return of 3.90% and an expected rate of increase in future compensation of 2.53%. In developing the discount rate assumption for each country, we use a yield curve approach. The yield curve is based on the AA rated bonds underlying the Barclays Capital corporate bond index. As of December 28, 2014 and December 29, 2013, the weighted average discount rate was 2.01% and 3.52%, respectively. We calculate the weighted average duration of the plans in each country, and then select the discount rate from the appropriate yield curve which best corresponds to the plans' liability profile. The expected rate of the return was developed using the historical rate of returns of the foreign government bonds currently held.
The primary components of the unrecognized losses are actuarial losses and prior period service costs. Unrecognized losses are amortized over the average remaining service period of the employees expected to receive the benefit in accordance with pension accounting rules. The weighted average remaining service period is approximately 10 years. The impact of recognizing the actuarial losses on 2014, 2013, and 2012 pension expense was $1.5 million, $1.6 million, and $0.3 million, respectively. The total projected amortization for these losses in 2015 is approximately $3.3 million.
Exposure to Foreign Currency
We manufacture products in the U.S., Europe, and the Asia Pacific region for both the local marketplace and for export to our foreign subsidiaries. The foreign subsidiaries, in turn, sell these products to customers in their respective geographic areas of operation, generally in local currencies. This method of sale and resale gives rise to the risk of gains or losses as a result of currency exchange rate fluctuations on inter-company receivables and payables. Additionally, the sourcing of product in one currency and the sales of product in a different currency can cause gross margin fluctuations due to changes in currency exchange rates.
We selectively purchase currency forward exchange contracts to reduce the risks of currency fluctuations on short-term inter-company receivables and payables. These contracts guarantee a predetermined exchange rate at the time the contract is purchased. This allows us to shift the effect of positive or negative currency fluctuations to a third party. Transaction gains or losses resulting from these contracts are recognized at the end of each reporting period. We use the fair value method of accounting, recording realized and unrealized gains and losses on these contracts. These gains and losses are included in other
38
gain (loss), net on our Consolidated Statements of Operations. As of December 28, 2014, we had currency forward exchange contracts with notional amounts totaling approximately $3.6 million. The fair values of the forward exchange contracts were reflected as a $55 thousand asset and a $23 thousand liability included in other current assets and other current liabilities in the accompanying Consolidated Balance Sheets. The contracts are in the various local currencies covering primarily our operations in the U.S. and Western Europe. Historically, we have not purchased currency forward exchange contracts where it is not economically efficient, specifically for our operations in South America and Asia, with the exception of Japan.
Hedging Activity
Beginning in the second quarter of 2008, we entered into various foreign currency contracts to reduce our exposure to forecasted Euro-denominated inter-company revenues. As of December 28, 2014, there were no outstanding foreign currency revenue forecast contracts. These cash flow hedging instruments are marked to market and the changes are recorded in other comprehensive income. Amounts recorded in other comprehensive income are recognized in cost of goods sold as the inventory is sold to external parties. Any hedge ineffectiveness is charged to other gain (loss), net on our Consolidated Statements of Operations. As of December 28, 2014, there were no unrealized gains or losses recorded in other comprehensive income. During the year ended December 28, 2014, no benefit related to these foreign currency hedges was recorded to cost of goods sold as the inventory was sold to external parties. We recognized no hedge ineffectiveness during the year ended December 28, 2014.
Provision for Restructuring
During September 2014, we initiated the Profit Enhancement Plan focused on increasing profitability through strategic headcount reductions and the streamlining of manufacturing processes. Total costs of the plan through December 28, 2014 are $5.3 million. Total annual savings of the Profit Enhancement Plan are expected to approximate $7 million, with an expected $6 million in savings to be realized in 2015.
As of December 2014, our expanded Global Restructuring Plan including Project LEAN and the SG&A Restructuring Plan have been substantially completed with total costs incurred to date of $78 million. With initiatives to stabilize sales, actively manage margins, reduce operating expense and effectively manage working capital, the estimated cost savings over the life of the plans is $108 million. Refer to Note 15 of the Consolidated Financial Statements.
Goodwill Impairments
We perform an assessment of goodwill by comparing each individual reporting unit’s carrying amount of net assets, including goodwill, to their estimated fair value at least annually during the fourth quarter of each fiscal year and whenever events or changes in circumstances indicate that the carrying value may not be recoverable.
Our 2014 and 2013 annual assessments did not result in impairment charges. Future annual assessments could result in impairment charges, which would be accounted for as operating expense.
As a result of the plan to divest our U.S. and Canada based CheckView® business unit in 2012, we assessed the related goodwill asset for impairment in the fourth quarter of 2012. We determined that there was a $3.3 million non-cash goodwill impairment charge within our Merchandise Availability Solutions segment. This impairment charge was included in discontinued operations on the Consolidated Statement of Operations.
Our annual impairment test in 2012 resulted in a $38.3 million non-cash goodwill impairment charge within our Retail Merchandising Solutions segment. The impairment was due to the decline in estimated future cash flows of our European Retail Merchandising Solutions reporting unit impacted by economic conditions in Europe resulting in decreased customer investments in new stores and refurbishments, as well as increased competition and pricing pressures.
In the second quarter of 2012, we performed an interim impairment assessment as a result of the deterioration in revenues, gross margins and operating results in each of our segments as compared to the forecasted amounts in the previous year's impairment test. As a result of our interim impairment test, a $64.4 million non-cash goodwill impairment charge was recorded in our Apparel Labeling Solutions segment. The impairment was due to a decline in estimated future Apparel Labeling Solutions cash flow impacted by our plan to refocus the business, coupled with declines in revenue and profitability.
As a result of the plan to divest the Banking Security Systems Integration business unit, we performed interim impairment testing in the second quarter of 2012. We determined that there was a $0.4 million non-cash goodwill impairment charge within
39
our Merchandise Availability Solutions segment. This impairment charge was included in discontinued operations on the Consolidated Statement of Operations.
Asset Impairments
In December 2014, as a result of our annual impairment test of our indefinite-lived trade names, we recorded a $0.9 million impairment charge to the value of the OAT trade name. The impairment charge was recorded in asset impairment expense in the Merchandise Availability Solutions segment on the Consolidated Statement of Operations. The impairment is due to minimal anticipated growth in our legacy OAT asset tracking business, as our Merchandising Visibility focus shifts towards end-to-end retail inventory visibility solutions.
In the fourth quarter of 2013, through the budgeting process, working capital prioritization activities, and other strategic direction reviews, it was determined that our ERP system implementation was no longer a strategic priority for 2014 through 2016. Therefore, during the fourth quarter of 2013, we recorded an impairment of the $4.7 million in internal-use software related to the European ERP system implementation. The impairment charge was recorded in asset impairment expense in the Consolidated Statement of Operations.
In December 2013, as a result of our annual impairment test of our indefinite-lived trade names, we recorded a $0.1 million impairment charge to the remaining value of the SIDEP trade name. This charge was recorded in asset impairment expense on the Consolidated Statement of Operations.
In the fourth quarter of 2012, as a result of the plan to divest our U.S. and Canada based CheckView® business unit, we performed impairment testing of the long-lived assets and recorded a $0.3 million impairment charge to the property, plant and equipment in our Merchandise Availability Solutions segment. This impairment charge was included in discontinued operations on the Consolidated Statement of Operations.
In 2012, as a result of the plan to divest the Banking Security Systems Integration business unit, we performed interim impairment testing of the long-lived assets and recorded impairment charges to the customer relationship intangible assets of $0.7 million and $0.8 million in the second and third quarters, respectively. These impairment charges were included in discontinued operations on the Consolidated Statement of Operations.
Results of Operations
(All comparisons are with the previous fiscal year, unless otherwise stated.)
Net Revenues
Our unit volume is driven by product offerings, number of direct sales personnel, recurring sales and, to some extent, pricing. Our base of installed systems provides a source of recurring revenues from the sale of disposable tags, labels, and service revenues.
Our customers are substantially dependent on retail sales, which are seasonal, subject to significant fluctuations, and difficult to predict. In addition, current economic trends have particularly affected our customers, and consequently our net revenues have been, and may continue to be impacted in the future. Historically, we have experienced lower sales in the first half of each year.
40
Analysis of Statement of Operations
The following table presents for the periods indicated certain items in the Consolidated Statement of Operations as a percentage of total revenues and the percentage change in dollar amounts of such items compared to the indicated prior period:
Percentage of Total Revenues | Percentage Change in Dollar Amount | |||||||||||||
Year ended | December 28, 2014 (Fiscal 2014) | December 29, 2013 (Fiscal 2013) | December 30, 2012 (Fiscal 2012) | Fiscal 2014 vs. Fiscal 2013 | Fiscal 2013 vs. Fiscal 2012 | |||||||||
Net revenues: | ||||||||||||||
Merchandise Availability Solutions | 66.2 | % | 66.2 | % | 64.8 | % | (3.8 | )% | 2.1 | % | ||||
Apparel Labeling Solutions | 26.4 | 26.4 | 27.1 | (4.3 | ) | (2.8 | ) | |||||||
Retail Merchandising Solutions | 7.4 | 7.4 | 8.1 | (4.9 | ) | (7.8 | ) | |||||||
Net revenues | 100.0 | 100.0 | 100.0 | (4.0 | ) | — | ||||||||
Cost of revenues | 56.9 | 61.0 | 60.9 | (10.4 | ) | 0.1 | ||||||||
Total gross profit | 43.1 | 39.0 | 39.1 | 5.9 | (0.3 | ) | ||||||||
Selling, general, and administrative expenses | 33.5 | 31.7 | 36.0 | 1.3 | (11.8 | ) | ||||||||
Research and development | 2.3 | 2.5 | 2.4 | (12.7 | ) | 6.9 | ||||||||
Restructuring expense | 1.0 | 1.6 | 4.1 | (38.8 | ) | (61.8 | ) | |||||||
Asset impairment | 0.1 | 0.7 | — | (82.1 | ) | N/A | ||||||||
Goodwill impairment | — | — | 14.9 | N/A | (100.0 | ) | ||||||||
Litigation settlement | 0.2 | (0.9 | ) | — | (124.3 | ) | N/A | |||||||
Acquisition costs | 0.1 | 0.1 | 0.1 | (62.1 | ) | 189.2 | ||||||||
Other income | — | — | (0.6 | ) | N/A | (100.0 | ) | |||||||
Other operating income | — | (0.1 | ) | (0.3 | ) | (100.0 | ) | (71.7 | ) | |||||
Operating income (loss) | 5.9 | 3.4 | (17.5 | ) | 66.4 | (119.3 | ) | |||||||
Interest income | 0.2 | 0.2 | 0.3 | (22.1 | ) | (13.8 | ) | |||||||
Interest expense | 0.7 | 2.7 | 1.8 | (75.5 | ) | 51.2 | ||||||||
Other gain (loss), net | (0.2 | ) | (0.6 | ) | (0.3 | ) | (72.0 | ) | 127.4 | |||||
Earnings (loss) from continuing operations before income taxes | 5.2 | 0.3 | (19.3 | ) | 1,698.6 | (101.4 | ) | |||||||
Income taxes expense | 3.5 | 0.5 | 0.9 | 532.6 | (38.9 | ) | ||||||||
Net earnings (loss) from continuing operations | 1.7 | (0.2 | ) | (20.2 | ) | (718.5 | ) | (98.7 | ) | |||||
Loss from discontinued operations, net of tax (benefit) expense of $0, ($68), and $247 | — | (2.5 | ) | (1.1 | ) | (100.0 | ) | 115.6 | ||||||
Net earnings (loss) | 1.7 | (2.7 | ) | (21.3 | ) | (157.9 | ) | (87.1 | ) | |||||
Less: gain (loss) attributable to non-controlling interests | — | — | (0.1 | ) | (100.0 | ) | (100.2 | ) | ||||||
Net earnings (loss) attributable to Checkpoint Systems, Inc. | 1.7 | % | (2.7 | )% | (21.2 | )% | (157.9 | ) | (87.1 | )% | ||||
N/A - Comparative percentages are not meaningful.
41
Fiscal 2014 compared to Fiscal 2013
Net Revenues
During 2014, revenues decreased by $27.7 million, or 4.0%, to $662.0 million from $689.7 million. Foreign currency translation had a negative impact on revenues of $7.8 million for the full year of 2014.
(amounts in millions) | ||||||||||||||
Year ended | December 28, 2014 (Fiscal 2014) | December 29, 2013 (Fiscal 2013) | Dollar Amount Change Fiscal 2014 vs. Fiscal 2013 | Percentage Change Fiscal 2014 vs. Fiscal 2013 | ||||||||||
Net Revenues: | ||||||||||||||
Merchandise Availability Solutions | $ | 438.8 | $ | 456.1 | $ | (17.3 | ) | (3.8 | )% | |||||
Apparel Labeling Solutions | 174.3 | 182.2 | (7.9 | ) | (4.3 | )% | ||||||||
Retail Merchandising Solutions | 48.9 | 51.4 | (2.5 | ) | (4.9 | )% | ||||||||
Net Revenues | $ | 662.0 | $ | 689.7 | $ | (27.7 | ) | (4.0 | )% | |||||
Merchandise Availability Solutions
Merchandise Availability Solutions (MAS) revenues decreased $17.3 million, or 3.8% in 2014 compared to 2013. Foreign currency translation had a negative impact of $6.2 million for the year. The adjusted decrease of $11.1 million in MAS was primarily due to decreases in EAS Systems and Merchandise Visibility (RFID). There were also decreases to a lesser extent in Alpha® and CheckView®. These decreases were partially offset by an increase in EAS consumables.
EAS Systems revenues decreased due to the completion of two major 2013 chain-wide installations. This decrease was partially offset by a major U.S. chain-wide installation that occurred primarily in 2014.
EAS consumable revenues grew considerably in the U.S. and Europe due to the new, recurring business as a result of the three major chain-wide installations which occurred in 2013 and 2014. We expect operational and financial challenges faced by key retailers in certain markets to put pressure on our consumables volumes. We expect to largely mitigate these challenges by gains in recurring consumables business resulting from recent competitive EAS Systems wins and chain-wide roll-outs.
The Merchandise Visibility (RFID) revenues decreased primarily due to a substantial roll-out with RFID enabled technology at a major retailer in the U.S. that was completed in 2013 compared to less significant roll-outs in 2014. The decrease was partially offset by increases in Europe as the business continues to gain traction with installations at several major retailers. Overall, RFID installation revenues are lower than expected in 2014 as retailers are being extremely cautious with their in-store capital investments. We continue to expand the number of retailers piloting with RFID-based inventory management solutions. We remain confident in our ability to grow this business as our solutions continue to deliver strong return on investment results to our customers. The rate of adoption remains under pressure due to financial challenges at key retail customers.
Alpha® revenues decreased due to weaker sales in the U.S. and Europe. The decrease is primarily due to large build-up orders in 2013 without comparable orders in 2014. We expect our global Alpha® revenues in 2015 to remain constant despite significant competition entering the market. Growth is expected to be hindered due to lack of certain new customer build-ups which occurred in previous years and increased competitive pressure.
We now only provide CheckView® CCTV services in Asia in connection with EAS systems when our customers require a combined security solution. Our CheckView® Asia revenues decreased due to our decreased focus on this business.
Apparel Labeling Solutions
Apparel Labeling Solutions revenues decreased $7.9 million, or 4.3% in 2014 compared to 2013. After considering the foreign currency translation negative impact of $1.3 million, the $6.6 million decrease in revenues is driven by declines in legacy labeling business sales volumes in the U.S., Europe, and Asia due to the effect of some market share loss and the impact of customers moving to lower priced trim solutions. The decrease was partially offset by increases in RFID labels revenue in Asia and Europe resulting from higher demand for RFID labels due to a substantial customer roll-out with RFID enabled technology. However, the U.S. saw a decline in RFID labels revenue due to a substantial roll-out with RFID enabled technology in 2013,
42
without a comparable roll-out in 2014. We expect modest growth in Apparel Labeling Solutions as we focus on winning increased share with existing customers and build on some recent wins in both our core and RFID labels business.
Retail Merchandising Solutions
Retail Merchandising Solutions revenues decreased $2.5 million, or 4.9% in 2014 compared to 2013. After considering the foreign currency translation negative impact of $0.3 million for the year, the $2.2 million decrease in revenues is primarily due to the impact of the movement of a portion of this business to a distributor model and pricing pressures. Our Retail Merchandising Solutions business has also been negatively impacted by soft economic conditions in Europe resulting in fewer new store openings and remodels of existing stores at our European customers. Hand-held Labeling Solutions (HLS) revenues increased slightly in 2014 compared to 2013, but is expected to face difficult revenue trends due to the continued shifts in market demand for HLS products.
Gross Profit
During 2014, gross profit increased $16.0 million, or 5.9%, to $285.1 million from $269.1 million. The negative impact of foreign currency translation on gross profit was $3.2 million for the year. Gross profit, as a percentage of net revenues, increased to 43.1% from 39.0%.
Merchandise Availability Solutions
Merchandise Availability Solutions gross profit as a percentage of Merchandise Availability Solutions revenues increased to 47.2% in 2014 from 42.9% in 2013. The increase in the gross profit percentage was driven by continued cost reduction efforts across all product lines as well as a major focus on margin enhancement initiatives, which include pricing, new product, field service, and freight initiatives. We expect to maintain approximately level margins through 2015 as our continued focus on margin enhancement initiatives is expected to mitigate the negative impact of increased competition and wage and material inflation at key manufacturing sites.
Apparel Labeling Solutions
Apparel Labeling Solutions gross profit as a percentage of Apparel Labeling Solutions revenues increased to 34.5% in 2014 from 30.0% in 2013. Due to the recent actions of Project LEAN to restructure and right size our manufacturing footprint we are beginning to see positive gross margin impact most notably from business rationalization, inventory management, improved manufacturing efficiencies, and supply chain optimization. We expect a more modest growth in margins through targeted productivity initiatives and further supply chain improvements.
Retail Merchandising Solutions
The Retail Merchandising Solutions gross profit as a percentage of Retail Merchandising Solutions revenues slightly decreased to 36.4% in 2014 from 36.7% in 2013. The decrease in Retail Merchandising Solutions gross profit percentage was primarily due to market pricing pressures, as well as the movement of a portion of this business to a distributor model, partially offset by margin enhancement initiatives. We expect the trends in pricing pressures to continue to impact this business in 2015.
Selling, General, and Administrative Expenses
Selling, general, and administrative (SG&A) expenses increased $2.8 million, or 1.3% in 2014 compared to 2013. Foreign currency translation decreased SG&A expenses by $1.9 million for the year. The adjusted increase in SG&A expenses of $4.7 million was primarily due to increases in employee-related costs including increases in staffing and performance incentive compensation as well as management consulting costs. Partly offsetting these increases, the SG&A and enhanced Global Restructuring programs continued to reduce SG&A expenses by approximately $9.8 million. Also offsetting the decrease was a reduction in CFO transition costs recorded in the second quarter of 2013 without comparable expense in 2014 as well as a reduction of stock-based compensation expense.
Research and Development Expenses
Research and development (R&D) expenses were $15.3 million, or 2.3% of revenues, in 2014 compared to $17.5 million, or 2.5% of revenues, in 2013. This decrease is the result of focus placed on operational efficiency specifically through our Global Restructuring Plan including Project LEAN.
43
Restructuring Expense
Restructuring expense was $6.7 million, or 1.0% of revenues, in 2014 compared to $10.9 million, or 1.6% of revenues, in 2013. The decrease is a result of the completion of our Global Restructuring Plan including Project LEAN partially offset by additional expense incurred related to the initiation of our Profit Enhancement Plan in 2014.
Asset Impairment
Asset impairment expense was $0.9 million, or 0.1% of revenues, in 2014 compared to $4.8 million, or 0.7% of revenues, in 2013. Both the 2014 and 2013 expenses are detailed in the "Asset Impairments" section of Item 7 following "Liquidity and Capital Resources".
Litigation Settlement
Litigation settlement in 2014 was a net expense of $1.6 million compared to $6.6 million of litigation settlement benefit in 2013. The 2014 litigation settlement expense, net is attributable to three separate matters in which settlements were reached during the fourth quarter of 2014. On November 20, 2014, we reached a settlement agreement in a commercial matter against one of our competitors for an amount in our favor of $0.6 million. On December 22, 2014, a settlement was reached with All-Tag Security Americas related to the patent infringement suit whereby we agreed to pay $1.2 million in exchange for a full and final settlement of all claims. Lastly, on December 28, 2014, we reached a settlement agreement related to a commercial matter in the amount of $1.0 million. The 2013 benefit is related to the All-Tag Security S.A., et al litigation in which a decision was reversed in our favor. As a result, we reversed previously accrued charges for the attorneys' fees and costs of the defendants.
Acquisition Costs
Acquisition costs in 2014 were $0.4 million compared to $1.0 million in 2013. The decrease in acquisition costs was primarily due to the timing of legal and professional services costs incurred in connection with the ongoing EBITDA contingent payment arbitration process related to the acquisition of the Shore to Shore businesses in May 2011.
Other Operating Income
Other operating income was $0.6 million, or 0.1% of revenues in 2013, without a comparable amount in 2014. The 2013 other operating income includes $0.3 million of income attributable to the renewal and extension of sales-type lease arrangements and a $0.2 million gain on sale of our interest in the non-strategic Sri Lanka subsidiary.
Interest Income and Interest Expense
Interest income in 2014 decreased $0.3 million from the comparable period in 2013. The decrease in interest income was primarily due to a decrease in interest income recognized for sales-type leases.
Interest expense for 2014 decreased $14.3 million from the comparable period in 2013. The decrease in interest expense was primarily due to make-whole premiums and write off of debt issuance costs of $9.2 million in 2013 in connection with payments of the 2010 Senior Secured Credit Facility and Senior Secured Notes, without a comparable amount incurred in 2014. The remaining decrease in interest expense was due to securing the new Senior Secured Credit Facility in December 2013, which reduced the cost of debt from approximately 6% to 2%.
Other Gain (Loss), net
Other gain (loss), net was a net loss of $1.1 million in 2014 compared to a net loss of $3.9 million in 2013. There was a $1.0 million foreign exchange loss during 2014 compared to a $4.1 million foreign exchange loss during 2013. The decreased foreign exchange loss is primarily attributed to decreased volatility of currencies in the emerging markets versus the U.S. dollar and the Euro.
Income Taxes
The effective tax rate was 67.9% for 2014 as compared to negative 193.2% for 2013. The 2014 effective tax rate was impacted by changes in valuation allowance assertions primarily related to a valuation allowance of $14.0 million recorded against the German net deferred tax assets, net of a release of the valuation allowance recorded against the Netherlands net deferred tax
44
assets of $2.4 million. The 2013 effective tax rate was impacted by $9.2 million of debt modification expense without a tax benefit due to the U.S. valuation allowance.
Loss from Discontinued Operations, Net of Tax
Loss from discontinued operations, net of tax, was $17.2 million in 2013, without a comparable amount in 2014. Consistent with our refined strategy to focus on inventory management systems relating to on-shelf availability, we decided to reduce our emphasis on CheckView® services and solutions. In April 2013, we completed the sale of our U.S. and Canada based CheckView® business so that we can focus on the growth of our core business. We recognized a loss of $13.6 million on the sale of our U.S. and Canada based CheckView® business in 2013, including selling costs of $1.1 million, as well as $0.4 million of costs incurred to carve-out the U.S. and Canada CheckView® business from our enterprise resource planning system. The results of operations for the CheckView® business from 2013, which was previously included in our MAS segment, was excluded from continuing operations and reported within loss from discontinued operations, net of tax.
Net Earnings (Loss) Attributable to Checkpoint Systems, Inc.
Net earnings (loss) attributable to Checkpoint Systems, Inc. was $11.0 million, or $0.26 per diluted share, during 2014 compared to a net loss of $18.9 million, or $(0.46) per diluted share, during 2013. The weighted-average number of shares used in the diluted earnings per share computation was 42.4 million and 41.5 million for 2014 and 2013, respectively.
Fiscal 2013 compared to Fiscal 2012
Net Revenues
During 2013, revenues decreased slightly by $0.2 million, or 0.0%, from $689.9 million to $689.7 million. Foreign currency translation had a negative impact on revenues of $2.3 million for the full year of 2013.
(amounts in millions) | ||||||||||||||
Year ended | December 29, 2013 (Fiscal 2013) | December 30, 2012 (Fiscal 2012) | Dollar Amount Change Fiscal 2013 vs. Fiscal 2012 | Percentage Change Fiscal 2013 vs. Fiscal 2012 | ||||||||||
Net Revenues: | ||||||||||||||
Merchandise Availability Solutions | $ | 456.1 | $ | 446.8 | $ | 9.3 | 2.1 | % | ||||||
Apparel Labeling Solutions | 182.2 | 187.4 | (5.2 | ) | (2.8 | ) | ||||||||
Retail Merchandising Solutions | 51.4 | 55.7 | (4.3 | ) | (7.8 | ) | ||||||||
Net Revenues | $ | 689.7 | $ | 689.9 | $ | (0.2 | ) | — | % | |||||
Merchandise Availability Solutions
Merchandise Availability Solutions (MAS) revenues increased $9.3 million, or 2.1%, in 2013 compared to 2012. Foreign currency translation had a negative impact of approximately $3.6 million. The adjusted increase of $12.9 million in MAS was due to increases in EAS consumables, Alpha® and Merchandise Visibility (RFID). These increases were partially offset by a decrease in our business that supports shrink management in libraries (Library), CheckView® and EAS Systems.
EAS consumables revenues increased in 2013 as compared to 2012, primarily due to increased Hard Tag @ Source™ revenues in the U.S., Asia, and Europe resulting from increased volumes from both new and existing customers. EAS label revenues in the U.S. and Europe also contributed to the increase as a result of new protection programs with new and existing customers including the impact of recent market share wins in EAS systems. The increase in EAS label revenues was partially offset by decreased demand in Asia. Economic uncertainty and soft markets present an ongoing challenge to our revenue growth in consumable products.
Alpha® revenues increased in 2013 as compared to 2012 due to strong sales in the U.S. with key customers in 2013 without comparable levels of demand in 2012. The increase was offset by declines in Europe and International Americas primarily due to large orders in 2012 without comparable demand in 2013.
45
The Merchandise Visibility (RFID) revenues increased in 2013 as compared to 2012, primarily due to a substantial roll-out with RFID enabled technology in the U.S. The increase was partially offset by overall declines in Europe, primarily due to a substantial roll-out with RFID enabled technology in 2012, with less significant roll-outs in 2013. Our RFID business continues to gain traction with installations at several major retailers, with a significant roll-out with a major U.S. retailer completed, a significant roll-out with a major European retailer underway and the initial stages of a U.S. asset tracking roll-out also underway.
Library revenues decreased in 2013 as compared to 2012, primarily due to the expiration of a licensing agreement in the U.S. We do not consider our Library business to be strategically important to our operations.
We sold our U.S. and Canada CheckView® business in 2013. The results of this business are included in discontinued operations. We will continue to provide CheckView® CCTV services in Asia in connection with EAS systems when our customers require a combined security solution. Due to our decreased focus on this business, our CheckView® Asia revenues decreased in 2013 as compared to 2012.
EAS Systems revenues decreased in 2013 as compared to 2012, primarily due to a decline in Europe resulting from the lower volume of new product installations with existing customers. The decrease was offset by increases in the U.S. and Asia due to large roll-outs in 2013, including the impact of the initial stages of a large U.S. roll-out during the fourth quarter of 2013.
Apparel Labeling Solutions
Apparel Labeling Solutions revenues decreased $5.2 million, or 2.8%, in 2013 as compared to 2012. After considering the foreign currency translation positive impact of approximately $0.4 million, the $5.6 million decrease in revenues is driven by declines in sales volumes in the U.S. and Europe, as well as International Americas where we closed operations in 2012 as part of our Global Restructuring Plan. The weakness in these markets is broad based, but the decline in ALS revenues can also be attributed to the effects of our ALS business rationalization, including the deliberate strategic loss of certain customers and the downsizing of our woven business. The decrease was partially offset by an increase of ALS revenues in Asia as the result of increased sales with our strategic key accounts. The impact of revenue reductions that resulted from our ALS business rationalization more than offset the growth in key account revenue in Asia. We are experiencing strong demand from certain customers, with a continued cautious approach from others. The decrease in ALS revenues is also partially offset by increased RFID labels revenue in the U.S., Asia, and Europe resulting from higher demand for RFID labels due to substantial roll-outs with RFID enabled technology. We expect modest growth in our Apparel Labeling Solutions business as we complete our business rationalization process and switch our focus to building on recent new business development in both our core and RFID labels businesses.
Retail Merchandising Solutions
Retail Merchandising Solutions revenues decreased $4.3 million, or 7.8%, in 2013 as compared to 2012. After considering the foreign currency translation positive impact of $0.9 million, the $5.2 million decrease in revenues is primarily related to the impact of the movement of a portion of this business to a distributor model and a decrease in Hand-held Labeling Solutions (HLS). We anticipate HLS will face difficult revenue trends due to the continued shifts in market demand for HLS products. Our Retail Merchandising Solutions business has also been negatively impacted by soft economic conditions in Europe resulting in fewer new store openings and remodels of existing stores at our European customers.
Gross Profit
During 2013, gross profit decreased $0.7 million, or 0.3%, from $269.8 million to $269.1 million. The negative impact of foreign currency translation on gross profit was approximately $1.9 million. Gross profit, as a percentage of net revenues, decreased slightly from 39.1% to 39.0%.
Merchandise Availability Solutions
Merchandise Availability Solutions gross profit as a percentage of Merchandise Availability Solutions revenues decreased to 42.9% in 2013, from 44.2% in 2012. The decrease in the gross profit percentage of Merchandise Availability Solutions was due primarily to lower margins in EAS systems, Library, and RFID. The decrease was partially offset by higher margins in Alpha® and EAS consumables. EAS systems and RFID margins were lower due to product and customer mix offset partially by a reduction in low margin roll-outs in Europe as well as the effects of our cost reductions. RFID margins were also negatively impacted as we continue pilot programs and make additional investments with new and existing customers. RFID margins were also impacted by increased field service costs resulting from a significant roll-out in the U.S. Library margins decreased,
46
primarily due to the expiration of a licensing agreement in the U.S. Alpha® margins increased due to product mix and favorable manufacturing variances. EAS consumables margins increased due primarily to favorable manufacturing variances, driven by high volumes and improved utilization of our manufacturing facilities as a result of our restructuring activities.
Apparel Labeling Solutions
Apparel Labeling Solutions gross profit as a percentage of Apparel Labeling Solutions revenues increased to 30.0% in 2013, from 25.1% in 2012. Due to the recent actions of Project LEAN to restructure and right size our manufacturing footprint, we are beginning to see positive gross margin impact most notably from business rationalization, inventory management, and improved efficiencies.
Retail Merchandising Solutions
Retail Merchandising Solutions gross profit as a percentage of Retail Merchandising Solutions revenues decreased to 36.7% in 2013, from 45.7% in 2012. The decrease in Retail Merchandising Solutions gross profit percentage was primarily due to the full year impact of the movement of a portion of this business to a distributor model in 2012 and increased pension costs. Further, lower margins in 2013 were caused by increased inventory costs and unfavorable manufacturing variances related to lower volumes in HLS.
Selling, General, and Administrative Expenses
Selling, general, and administrative (SG&A) expenses decreased $29.3 million, or 11.8%, during 2013 compared to 2012. Foreign currency translation decreased SG&A expenses by approximately $0.2 million. The SG&A and enhanced Global Restructuring programs reduced expenses by approximately $30.4 million. Offsetting these cost reductions were increases in long-term incentive compensation, increased marketing efforts, costs associated with the CFO transition, and increases in external tax services. These increases were partially offset by decreases in SG&A expenses due to CEO transition costs recorded in 2012 without comparable expense in 2013, less amortization expense in 2013 due to fully amortized intangible assets, reductions in performance incentive compensation, reductions in bad debt expense of $0.3 million due to improved collection efforts, reductions in external legal and audit services and decreased payroll related costs associated with the 53 week fiscal year 2012.
Research and Development Expenses
Research and development (R&D) expenses were $17.5 million, or 2.5% of revenues, in 2013 and $16.4 million, or 2.4% of revenues in 2012, as we have increased our investment in the development of new products and solutions.
Restructuring Expense
Restructuring expense was $10.9 million, or 1.6% of revenues in 2013 compared to $28.4 million or 4.1% of revenues in 2012. The decrease is due to the expansion of the Global Restructuring Plan to include Project LEAN during the second quarter of 2012.
Asset Impairment
Asset impairment expense was $4.8 million, or 0.7% of revenues in 2013, without a comparable charge in 2012. The 2013 expense is detailed in the “Asset Impairments” section of Item 7 following “Liquidity and Capital Resources.”
Goodwill Impairment
Goodwill impairment expense was $102.7 million, or 14.9% of revenues in 2012, without a comparable charge in 2013. The non-cash impairment expense in 2012 is detailed in the “Goodwill Impairments” section of Item 7.
Litigation Settlement
Litigation settlement in 2013 was a benefit of $6.6 million compared to $0.3 million of litigation settlement expense in 2012. The 2013 benefit is related to the All-Tag Security S.A., et al litigation in which a decision was reversed in our favor. As a result, we reversed previously accrued charges for the attorneys' fees and costs of the defendants. The 2012 litigation settlement expense is attributable to a $0.3 million accrual recorded during the fourth quarter of 2012 related to the settlement of a service contract termination dispute.
47
Acquisition Costs
Acquisition costs in 2013 were $1.0 million compared to $0.3 million in 2012. The increase in acquisition costs was primarily due to legal and other arbitration-related costs incurred in connection with the ongoing EBITDA contingent payment arbitration process related to the acquisition of the Shore to Shore businesses in May 2011.
Other (Income) Expense
Other income was $3.9 million in 2012 without comparable expense in 2013. During 2012, compensation received from our insurance provider of $4.7 million for the financial impact of the fraudulent Canadian activities was partially offset by legal and forensic costs incurred in connection with the Canada matter.
Other Operating Income
Other operating income was $0.6 million, or 0.1% of revenues in 2013 compared to $2.0 million, or 0.3% of revenues in 2012. The 2013 other operating income includes $0.3 million of income attributable to the renewal and extension of sales-type lease arrangements and a $0.2 million gain on sale of our interest in the non-strategic Sri Lanka subsidiary.
The 2012 other operating income represents the gain on sale of our non-strategic Suzhou, China subsidiary, as well as income attributable to the renewal and extension of sales-type lease arrangements.
Interest Income and Interest Expense
Interest income in 2013 decreased $0.2 million from the comparable period in 2012. The decrease in interest income was primarily due to decreased interest income recognized for sales-type leases during 2013 compared to 2012.
Interest expense for 2013 increased $6.4 million from the comparable period in 2012. The increase in interest expense was primarily due to make-whole premiums and write off of debt issuance costs of $9.2 million in 2013 in connection with payments of the 2010 Senior Secured Credit Facility and Senior Secured Notes compared to $2.3 million in make-whole premiums and write off of debt issuance costs in 2012.
Other Gain (Loss), net
Other gain (loss), net was a net loss of $3.9 million in 2013 compared to a net loss of $1.7 million in 2012. There was a $4.1 million foreign exchange loss during 2013 compared to a $1.7 million foreign exchange loss during 2012. The increased foreign exchange loss is primarily attributable to U.S. Dollar and Euro fluctuations versus currencies in emerging markets where hedging is either impossible or impractical.
Income Taxes
The effective tax rate for 2013 was 193.2% as compared to negative 4.5% for 2012. The 2013 effective tax rate was impacted by $9.2 million of debt modification expense without a tax benefit due to the U.S. valuation allowance. The 2012 tax rate was impacted by the 2012 goodwill impairment charges.
Loss from Discontinued Operations, Net of Tax
Loss from discontinued operations, net of tax, was $17.2 million and $8.0 million in 2013 and 2012, respectively. Consistent with our refined strategy to focus on inventory management systems relating to on-shelf availability, we decided to reduce our emphasis on CheckView® services and solutions. In April 2013, we completed the sale of our U.S. and Canada based CheckView® business so that we can focus on the growth of our core business. We recognized a loss of $13.6 million on the sale of our U.S. and Canada based CheckView® business in 2013, including selling costs of $1.1 million, as well as $0.4 million of costs incurred to carve-out the U.S. and Canada CheckView® business from our enterprise resource planning system. In October 2012, we completed the sale of the Banking Security Systems Integration business unit, which was focused on the financial services sector and previously was part of our CheckView® business. As such, both businesses, which were included in our Merchandise Availability Solutions segment, are excluded from continuing operations.
48
Net (Loss) Earnings Attributable to Checkpoint Systems, Inc.
Net loss attributable to Checkpoint Systems, Inc. was $18.9 million, or $0.46 per diluted share, during 2013 compared to $146.5 million, or $3.57 per diluted share, during 2012. The weighted-average number of shares used in the diluted earnings per share computation was 41.5 million and 41.0 million for 2013 and 2012, respectively.
Recently Adopted Accounting Standards
See Note 1 to the Consolidated Financial Statements for additional information related to recently adopted accounting standards, which is incorporated herein by reference.
New Accounting Pronouncements and Other Standards
See Note 1 to the Consolidated Financial Statements for additional information related to new accounting pronouncements and other standards, which is incorporated herein by reference.
Item 7A. QUANTITATIVE AND QUALITATIVE DISCLOSURES ABOUT MARKET RISK
Market Risk Factors
Fluctuations in interest and foreign currency exchange rates affect our financial position and results of operations. We enter into forward exchange contracts denominated in foreign currency to reduce the risks of currency fluctuations on short-term inter-company receivables and payables. We also enter into various foreign currency contracts to reduce our exposure to forecasted Euro-denominated inter-company revenues. We have historically not used financial instruments to minimize our exposure to currency fluctuations on our net investments in and cash flows derived from our foreign subsidiaries. We have used third party borrowings in foreign currencies to hedge a portion of our net investments in and cash flows derived from our foreign subsidiaries. As of December 28, 2014, substantially all third party borrowings were in the functional currency of the subsidiary borrower. Additionally, we enter, on occasion, into interest rate swaps to reduce the risk of significant interest rate increases in connection with our floating rate debt. Based on the contractual interest rates on the floating rate debt at December 28, 2014, a hypothetical 10% increase in rates would increase cash outflows by approximately $0.1 million over a twelve-month period.
We are subject to foreign currency exchange risk on our foreign currency forward exchange contracts which represent a $55 thousand asset position and $23 thousand liability position as of December 28, 2014, and a $18 thousand liability position as of December 29, 2013. The sensitivity analysis assumes an instantaneous 10% change in foreign currency exchange rates from year-end levels, with all other variables held constant. At December 28, 2014, a 10% strengthening or 10% weakening of the U.S. dollar versus other currencies would result in an immaterial impact in the net asset position.
Foreign exchange forward contracts are used to hedge certain of our firm foreign currency cash flows. Thus, there is either an asset or cash flow exposure related to all the financial instruments in the above sensitivity analysis for which the impact of a movement in exchange rates would be in the opposite direction and substantially equal to the impact on the instruments in the analysis. Certain of our foreign subsidiaries have restrictions on the remittance of funds generated by our operations outside of the U.S. At December 28, 2014, the majority of our unremitted earnings of subsidiaries outside the U.S. were deemed not to be permanently reinvested.
49
Item 8. FINANCIAL STATEMENTS AND SUPPLEMENTARY DATA
Index to Consolidated Financial Statements
50
Report of Independent Registered Public Accounting Firm
To the Board of Directors and Stockholders of Checkpoint Systems, Inc.
In our opinion, the accompanying consolidated balance sheets and the related consolidated statements of operations, comprehensive income (loss), equity and cash flows present fairly, in all material respects, the financial position of Checkpoint Systems, Inc. and its subsidiaries at December 28, 2014 and December 29, 2013, and the results of their operations and their cash flows for each of the three years in the period ended December 28, 2014 in conformity with accounting principles generally accepted in the United States of America. In addition, in our opinion, the financial statement schedule listed in the accompanying index presents fairly, in all material respects, the information set forth therein when read in conjunction with the related consolidated financial statements. Management and we previously concluded that the Company maintained effective internal control over financial reporting as of December 28, 2014. However, management has subsequently determined that a material weakness in internal control over financial reporting related to the determination of the Company’s income tax provision existed as of that date. Accordingly, management’s report has been restated and our opinion on internal control over financial reporting, as presented herein, is different from that expressed in our previous report. Also in our opinion, the Company did not maintain, in all material respects, effective internal control over financial reporting as of December 28, 2014, based on criteria established in Internal Control - Integrated Framework (2013) issued by the Committee of Sponsoring Organizations of the Treadway Commission (COSO) because a material weakness in internal control over financial reporting related to the determination of the Company’s income tax provision existed as of that date. A material weakness is a deficiency, or a combination of deficiencies, in internal control over financial reporting, such that there is a reasonable possibility that a material misstatement of the annual or interim financial statements will not be prevented or detected on a timely basis. The material weakness referred to above is described in Management’s Annual Report on Internal Control over Financial Reporting appearing under Item 9A. We considered this material weakness in determining the nature, timing and extent of audit tests applied in our audit of the 2014 consolidated financial statements, and our opinion regarding the effectiveness of the Company’s internal control over financial reporting does not affect our opinion on those consolidated financial statements. The Company's management is responsible for these financial statements and financial statement schedule, for maintaining effective internal control over financial reporting and for its assessment of the effectiveness of internal control over financial reporting, included in management’s report referred to above. Our responsibility is to express opinions on these financial statements, on the financial statement schedule, and on the Company's internal control over financial reporting based on our integrated audits. We conducted our audits in accordance with the standards of the Public Company Accounting Oversight Board (United States). Those standards require that we plan and perform the audits to obtain reasonable assurance about whether the financial statements are free of material misstatement and whether effective internal control over financial reporting was maintained in all material respects. Our audits of the financial statements included examining, on a test basis, evidence supporting the amounts and disclosures in the financial statements, assessing the accounting principles used and significant estimates made by management, and evaluating the overall financial statement presentation. Our audit of internal control over financial reporting included obtaining an understanding of internal control over financial reporting, assessing the risk that a material weakness exists, and testing and evaluating the design and operating effectiveness of internal control based on the assessed risk. Our audits also included performing such other procedures as we considered necessary in the circumstances. We believe that our audits provide a reasonable basis for our opinions.
A company’s internal control over financial reporting is a process designed to provide reasonable assurance regarding the reliability of financial reporting and the preparation of financial statements for external purposes in accordance with generally accepted accounting principles. A company’s internal control over financial reporting includes those policies and procedures that (i) pertain to the maintenance of records that, in reasonable detail, accurately and fairly reflect the transactions and dispositions of the assets of the company; (ii) provide reasonable assurance that transactions are recorded as necessary to permit preparation of financial statements in accordance with generally accepted accounting principles, and that receipts and expenditures of the company are being made only in accordance with authorizations of management and directors of the company; and (iii) provide reasonable assurance regarding prevention or timely detection of unauthorized acquisition, use, or disposition of the company’s assets that could have a material effect on the financial statements.
Because of its inherent limitations, internal control over financial reporting may not prevent or detect misstatements. Also, projections of any evaluation of effectiveness to future periods are subject to the risk that controls may become inadequate because of changes in conditions, or that the degree of compliance with the policies or procedures may deteriorate.

PricewaterhouseCoopers LLP
Philadelphia, Pennsylvania
March 5, 2015, except with respect to our opinion on internal control over financial reporting insofar as it relates to the matter described in the third paragraph of Management's Annual Report on Internal Control Over Financial Reporting, as to which the date is November 3, 2015
51
CHECKPOINT SYSTEMS, INC.
CONSOLIDATED BALANCE SHEETS
(amounts in thousands) | December 28, 2014 | December 29, 2013 | |||||
ASSETS | |||||||
CURRENT ASSETS: | |||||||
Cash and cash equivalents | $ | 135,537 | $ | 121,573 | |||
Accounts receivable, net of allowance of $8,526 and $12,404 | 131,720 | 167,864 | |||||
Inventories | 91,860 | 83,521 | |||||
Other current assets | 25,928 | 29,119 | |||||
Deferred income taxes | 5,557 | 9,108 | |||||
Total Current Assets | 390,602 | 411,185 | |||||
REVENUE EQUIPMENT ON OPERATING LEASE, net | 1,057 | 1,267 | |||||
PROPERTY, PLANT, AND EQUIPMENT, net | 76,332 | 75,067 | |||||
GOODWILL | 173,569 | 185,864 | |||||
OTHER INTANGIBLES, net | 64,940 | 78,166 | |||||
DEFERRED INCOME TAXES | 25,284 | 38,131 | |||||
OTHER ASSETS | 6,882 | 9,813 | |||||
TOTAL ASSETS | $ | 738,666 | $ | 799,493 | |||
LIABILITIES AND EQUITY | |||||||
CURRENT LIABILITIES: | |||||||
Short-term borrowings and current portion of long-term debt | $ | 236 | $ | 435 | |||
Accounts payable | 48,928 | 67,203 | |||||
Accrued compensation and related taxes | 27,511 | 24,341 | |||||
Other accrued expenses | 44,204 | 41,580 | |||||
Income taxes | 1,278 | 2,439 | |||||
Unearned revenues | 7,663 | 9,011 | |||||
Restructuring reserve | 6,255 | 8,175 | |||||
Accrued pensions — current | 4,472 | 5,013 | |||||
Other current liabilities | 17,504 | 19,536 | |||||
Total Current Liabilities | 158,051 | 177,733 | |||||
LONG-TERM DEBT, LESS CURRENT MATURITIES | 65,161 | 91,187 | |||||
FINANCING LIABILITY | 33,094 | 35,068 | |||||
ACCRUED PENSIONS | 108,920 | 99,677 | |||||
OTHER LONG-TERM LIABILITIES | 30,140 | 36,436 | |||||
DEFERRED INCOME TAXES | 15,369 | 13,067 | |||||
COMMITMENTS AND CONTINGENCIES | — | — | |||||
CHECKPOINT SYSTEMS, INC. STOCKHOLDERS’ EQUITY: | |||||||
Preferred stock, no par value, 500,000 shares authorized, none issued | — | — | |||||
Common stock, $.10 par value, 100,000,000 shares authorized, 45,840,171 and 45,484,524 shares issued, 41,804,259 and 41,448,612 shares outstanding | 4,584 | 4,548 | |||||
Additional capital | 441,882 | 434,336 | |||||
Accumulated deficit | (12,331 | ) | (23,284 | ) | |||
Common stock in treasury, at cost, 4,035,912 and 4,035,912 shares | (71,520 | ) | (71,520 | ) | |||
Accumulated other comprehensive income, net of tax | (34,684 | ) | 2,245 | ||||
TOTAL STOCKHOLDERS’ EQUITY | 327,931 | 346,325 | |||||
TOTAL LIABILITIES AND STOCKHOLDERS' EQUITY | $ | 738,666 | $ | 799,493 | |||
See Notes to the Consolidated Financial Statements.
52
CHECKPOINT SYSTEMS, INC.
CONSOLIDATED STATEMENTS OF OPERATIONS
(amounts in thousands, except per share data) | |||||||||||
Year ended | December 28, 2014 | December 29, 2013 | December 30, 2012 | ||||||||
Net revenues | $ | 662,040 | $ | 689,738 | $ | 689,920 | |||||
Cost of revenues | 376,956 | 420,647 | 420,084 | ||||||||
Gross profit | 285,084 | 269,091 | 269,836 | ||||||||
Selling, general, and administrative expenses | 221,566 | 218,807 | 248,107 | ||||||||
Research and development | 15,303 | 17,524 | 16,400 | ||||||||
Restructuring expense | 6,654 | 10,866 | 28,438 | ||||||||
Asset impairment | 864 | 4,820 | — | ||||||||
Goodwill impairment | — | — | 102,715 | ||||||||
Litigation settlement | 1,600 | (6,584 | ) | 295 | |||||||
Acquisition costs | 364 | 960 | 332 | ||||||||
Other income | — | — | (3,907 | ) | |||||||
Other operating income | — | (578 | ) | (2,043 | ) | ||||||
Operating income (loss) | 38,733 | 23,276 | (120,501 | ) | |||||||
Interest income | 1,180 | 1,515 | 1,757 | ||||||||
Interest expense | 4,637 | 18,955 | 12,540 | ||||||||
Other gain (loss), net | (1,102 | ) | (3,936 | ) | (1,731 | ) | |||||
Earnings (loss) from continuing operations before income taxes | 34,174 | 1,900 | (133,015 | ) | |||||||
Income taxes expense | 23,221 | 3,671 | 6,005 | ||||||||
Net earnings (loss) from continuing operations | 10,953 | (1,771 | ) | (139,020 | ) | ||||||
Loss from discontinued operations, net of tax (benefit) expense of $0, ($68), and $247 | — | (17,156 | ) | (7,959 | ) | ||||||
Net earnings (loss) | 10,953 | (18,927 | ) | (146,979 | ) | ||||||
Less: gain (loss) attributable to non-controlling interests | — | 1 | (529 | ) | |||||||
Net earnings (loss) attributable to Checkpoint Systems, Inc. | $ | 10,953 | $ | (18,928 | ) | $ | (146,450 | ) | |||
Basic earnings (loss) attributable to Checkpoint Systems, Inc. per share: | |||||||||||
Earnings (loss) from continuing operations | $ | 0.26 | $ | (0.05 | ) | $ | (3.37 | ) | |||
Loss from discontinued operations, net of tax | $ | — | $ | (0.41 | ) | $ | (0.20 | ) | |||
Basic earnings (loss) attributable to Checkpoint Systems, Inc. per share | $ | 0.26 | $ | (0.46 | ) | $ | (3.57 | ) | |||
Diluted earnings (loss) attributable to Checkpoint Systems, Inc. per share: | |||||||||||
Earnings (loss) from continuing operations | $ | 0.26 | $ | (0.05 | ) | $ | (3.37 | ) | |||
Loss from discontinued operations, net of tax | $ | — | $ | (0.41 | ) | $ | (0.20 | ) | |||
Diluted earnings (loss) attributable to Checkpoint Systems, Inc. per share | $ | 0.26 | $ | (0.46 | ) | $ | (3.57 | ) | |||
See Notes to the Consolidated Financial Statements.
53
CHECKPOINT SYSTEMS, INC.
CONSOLIDATED STATEMENTS OF COMPREHENSIVE INCOME (LOSS)
(amounts in thousands) | |||||||||||
Year ended | December 28, 2014 | December 29, 2013 | December 30, 2012 | ||||||||
Net earnings (loss) | $ | 10,953 | $ | (18,927 | ) | $ | (146,979 | ) | |||
Other comprehensive income (loss), net of tax: | |||||||||||
Amortization of pension plan actuarial losses, net of tax expense of $6, $449, and $65 | 1,501 | 1,120 | 218 | ||||||||
Change in realized and unrealized losses on derivative hedges, net of tax expense (benefit) of $0, $139, and ($71) | — | (21 | ) | (1,521 | ) | ||||||
Recognized (loss) gain on pension, net of tax (benefit) expense of ($219), $547, and ($5,098) | (22,334 | ) | 1,403 | (12,797 | ) | ||||||
Prior service cost arising during period, net of tax benefit of $77, $0, and $0 | (229 | ) | (158 | ) | — | ||||||
Foreign currency translation adjustment | (15,867 | ) | (578 | ) | 187 | ||||||
Total other comprehensive (loss) income, net of tax | $ | (36,929 | ) | $ | 1,766 | $ | (13,913 | ) | |||
Comprehensive loss | $ | (25,976 | ) | $ | (17,161 | ) | $ | (160,892 | ) | ||
Less: comprehensive loss attributable to non-controlling interests | — | (172 | ) | (528 | ) | ||||||
Comprehensive loss attributable to Checkpoint Systems, Inc. | $ | (25,976 | ) | $ | (16,989 | ) | $ | (160,364 | ) | ||
See Notes to the Consolidated Financial Statements.
54
CHECKPOINT SYSTEMS, INC.
CONSOLIDATED STATEMENTS OF EQUITY
(amounts in thousands) | Checkpoint Systems, Inc. Stockholders | ||||||||||||||||||||||||
Common Stock | Additional Capital | Retained Earnings | Treasury Stock | Accumulated Other Comprehensive Income | Non-controlling Interests | Total Equity | |||||||||||||||||||
Shares | Amount | Shares | Amount | ||||||||||||||||||||||
Balance, December 25, 2011 | 44,241 | $ | 4,424 | $ | 418,211 | $ | 142,094 | 4,036 | $ | (71,520 | ) | $ | 14,220 | $ | 1,216 | $ | 508,645 | ||||||||
Net loss | (146,450 | ) | (529 | ) | (146,979 | ) | |||||||||||||||||||
Exercise of stock-based compensation and awards released | 522 | 52 | 1,108 | 1,160 | |||||||||||||||||||||
Tax benefit of stock-based compensation | (306 | ) | (306 | ) | |||||||||||||||||||||
Stock-based compensation expense | 4,837 | 4,837 | |||||||||||||||||||||||
Deferred compensation plan | 865 | 865 | |||||||||||||||||||||||
Amortization of pension plan actuarial losses, net of tax | 218 | 218 | |||||||||||||||||||||||
Change in realized and unrealized gains on derivative hedges, net of tax | (1,521 | ) | (1,521 | ) | |||||||||||||||||||||
Recognized loss on pension, net of tax | (12,797 | ) | (12,797 | ) | |||||||||||||||||||||
Foreign currency translation adjustment | 186 | 1 | 187 | ||||||||||||||||||||||
Balance, December 30, 2012 | 44,763 | $ | 4,476 | $ | 424,715 | $ | (4,356 | ) | 4,036 | $ | (71,520 | ) | $ | 306 | $ | 688 | $ | 354,309 | |||||||
Net loss (earnings) | (18,928 | ) | 1 | (18,927 | ) | ||||||||||||||||||||
Exercise of stock-based compensation and awards released | 721 | 72 | 2,489 | 2,561 | |||||||||||||||||||||
Tax benefit on stock-based compensation | 82 | 82 | |||||||||||||||||||||||
Stock-based compensation expense | 6,369 | 6,369 | |||||||||||||||||||||||
Deferred compensation plan | 681 | 681 | |||||||||||||||||||||||
Sale of interest in subsidiary | (516 | ) | (516 | ) | |||||||||||||||||||||
Amortization of pension plan actuarial losses, net of tax | 1,120 | 1,120 | |||||||||||||||||||||||
Change in realized and unrealized loss on derivative hedges, net of tax | (21 | ) | (21 | ) | |||||||||||||||||||||
Recognized loss on pension, net of tax | 1,403 | 1,403 | |||||||||||||||||||||||
Prior service cost arising during period, net of tax | (158 | ) | (158 | ) | |||||||||||||||||||||
Foreign currency translation adjustment | (405 | ) | (173 | ) | (578 | ) | |||||||||||||||||||
Balance, December 29, 2013 | 45,484 | $ | 4,548 | $ | 434,336 | $ | (23,284 | ) | 4,036 | $ | (71,520 | ) | $ | 2,245 | $ | — | $ | 346,325 | |||||||
Net earnings | 10,953 | — | 10,953 | ||||||||||||||||||||||
Exercise of stock-based compensation and awards released | 356 | 36 | 907 | 943 | |||||||||||||||||||||
Tax benefit on stock-based compensation | (14 | ) | (14 | ) | |||||||||||||||||||||
Stock-based compensation expense | 5,781 | 5,781 | |||||||||||||||||||||||
Deferred compensation plan | 872 | 872 | |||||||||||||||||||||||
Amortization of pension plan actuarial losses, net of tax | 1,501 | 1,501 | |||||||||||||||||||||||
Recognized loss on pension, net of tax | (22,334 | ) | (22,334 | ) | |||||||||||||||||||||
Prior service cost arising during period, net of tax | (229 | ) | (229 | ) | |||||||||||||||||||||
Foreign currency translation adjustment | (15,867 | ) | (15,867 | ) | |||||||||||||||||||||
Balance, December 28, 2014 | 45,840 | $ | 4,584 | $ | 441,882 | $ | (12,331 | ) | 4,036 | $ | (71,520 | ) | $ | (34,684 | ) | $ | — | $ | 327,931 | ||||||
See Notes to the Consolidated Financial Statements.
55
CHECKPOINT SYSTEMS, INC.
CONSOLIDATED STATEMENTS OF CASH FLOWS
(amounts in thousands) | |||||||||||
Year ended | December 28, 2014 | December 29, 2013 | December 30, 2012 | ||||||||
Cash flows from operating activities: | |||||||||||
Net earnings (loss) | $ | 10,953 | $ | (18,927 | ) | $ | (146,979 | ) | |||
Adjustments to reconcile net earnings (loss) to net cash provided by operating activities: | |||||||||||
Depreciation and amortization | 25,150 | 26,373 | 30,369 | ||||||||
Amortization of debt issuance costs | 433 | 2,207 | 2,345 | ||||||||
Interest on financing liability | 2,222 | 2,082 | 1,893 | ||||||||
Deferred taxes | 17,373 | (3,565 | ) | (2,930 | ) | ||||||
Stock-based compensation | 5,781 | 6,369 | 4,753 | ||||||||
Provision for losses on accounts receivable | (144 | ) | (435 | ) | 3,024 | ||||||
Excess tax benefit on stock compensation | (214 | ) | (600 | ) | (98 | ) | |||||
Loss (gain) on disposal of fixed assets | 220 | 564 | (1,326 | ) | |||||||
Litigation settlement | 2,200 | (6,584 | ) | 295 | |||||||
Asset impairment | 864 | 4,820 | 1,771 | ||||||||
Goodwill impairment | — | — | 106,348 | ||||||||
Gain on sale of subsidiary | — | (248 | ) | (1,657 | ) | ||||||
Loss on sale of discontinued operations | — | 13,598 | 15 | ||||||||
Restructuring-related asset impairment | 172 | 1,211 | 6,506 | ||||||||
Decrease (increase) in operating assets, net of the effects of acquired companies: | |||||||||||
Accounts receivable | 26,626 | 12,903 | 26,317 | ||||||||
Inventories | (14,198 | ) | (948 | ) | 37,947 | ||||||
Other assets | 2,879 | 4,947 | 7,828 | ||||||||
(Decrease) increase in operating liabilities, net of the effects of acquired companies: | |||||||||||
Accounts payable | (16,177 | ) | 1,954 | (2,185 | ) | ||||||
Income taxes | (2,314 | ) | (198 | ) | (1,502 | ) | |||||
Unearned revenues - current | (667 | ) | (6,244 | ) | (6,923 | ) | |||||
Restructuring reserve | (1,164 | ) | (1,598 | ) | (8,178 | ) | |||||
Other liabilities | 5,547 | (16,611 | ) | 4,732 | |||||||
Net cash provided by operating activities | 65,542 | 21,070 | 62,365 | ||||||||
Cash flows from investing activities: | |||||||||||
Acquisition of property, plant, and equipment and intangibles | (17,971 | ) | (8,946 | ) | (12,401 | ) | |||||
Change in restricted cash | — | — | 291 | ||||||||
Proceeds from sale of real estate | — | — | 4,560 | ||||||||
Net cash proceeds from the sale of discontinued operations | 283 | 1,573 | 1,180 | ||||||||
Net cash proceeds from the sale of subsidiary | — | 227 | 2,250 | ||||||||
Other investing activities | 83 | 1,848 | 1,671 | ||||||||
Net cash used in investing activities | (17,605 | ) | (5,298 | ) | (2,449 | ) | |||||
Cash flows from financing activities: | |||||||||||
Proceeds from stock issuances | 1,980 | 4,073 | 1,653 | ||||||||
Excess tax benefit on stock compensation | 214 | 600 | 98 | ||||||||
Proceeds from short-term debt | — | 2,759 | 3,467 | ||||||||
Payment of short-term debt | — | (2,561 | ) | (11,869 | ) | ||||||
Net change in factoring and overdrafts | (94 | ) | (877 | ) | (8,932 | ) | |||||
Proceeds from long-term debt | 1,000 | 99,098 | 3,000 | ||||||||
Payment of long-term debt | (27,235 | ) | (112,664 | ) | (20,498 | ) | |||||
Debt issuance costs | — | (1,765 | ) | (2,085 | ) | ||||||
Net cash used in financing activities | (24,135 | ) | (11,337 | ) | (35,166 | ) | |||||
Effect of foreign currency rate fluctuations on cash and cash equivalents | (9,838 | ) | (1,691 | ) | 747 | ||||||
Net increase in cash and cash equivalents | 13,964 | 2,744 | 25,497 | ||||||||
Cash and cash equivalents: | |||||||||||
Beginning of period | 121,573 | 118,829 | 93,332 | ||||||||
End of period | $ | 135,537 | $ | 121,573 | $ | 118,829 | |||||
See Notes to the Consolidated Financial Statements.
56
CHECKPOINT SYSTEMS, INC.
NOTES TO CONSOLIDATED FINANCIAL STATEMENTS
Note 1. SUMMARY OF SIGNIFICANT ACCOUNTING POLICIES
Nature of Operations
We are a leading global manufacturer and provider of technology-driven, loss prevention, inventory management and labeling solutions to the retail and apparel industry. We provide integrated inventory management solutions to brand, track, and secure goods for retailers and consumer product manufacturers worldwide. We are a leading provider of, and earn revenues primarily from the sale of Merchandise Availability, Apparel Labeling, and Retail Merchandising Solutions. Merchandise Availability Solutions consists of electronic article surveillance (EAS) systems, EAS consumables, Alpha® high-theft solutions, store security system installations and monitoring solutions (CheckView®) in Asia, and radio frequency identification (RFID) systems, software, and tags. Apparel Labeling Solutions includes the results of our RFID labels business, coupled with our data management network of service bureaus that manage the printing of variable information on apparel labels and tags. Retail Merchandising Solutions consists of hand-held labeling systems (HLS) and retail display systems (RDS). Applications of these products include primarily retail security, asset and merchandise visibility, automatic identification, and pricing and promotional labels and signage. Operating directly in 27 countries, we have a global network of subsidiaries and distributors, and provide customer service and technical support around the world.
Principles of Consolidation
The Consolidated Financial Statements include the accounts of Checkpoint Systems, Inc. and its majority-owned subsidiaries (Company). All inter-company transactions are eliminated in consolidation.
Use of Estimates
The preparation of financial statements in conformity with accounting principles generally accepted in the United States of America requires management to make estimates and judgments that affect the reported amounts of assets and liabilities and disclosure of contingent assets and liabilities at the date of the financial statements and the reported amounts of revenues and expenses during the reporting period. Actual results could differ from those estimates.
Fiscal Year
Our fiscal year is the 52 or 53 week period ending the last Sunday of December. References to 2014 and 2013 are for the 52 weeks ended December 28, 2014 and December 29, 2013, respectively; while references to 2012 are for the 53 weeks ended December 30, 2012.
Out of Period Adjustments
During the third quarter of 2014, we recorded adjustments related to a maintenance agreement for the period from 2009 through 2014 and a revenue cut-off error in the second quarter of 2014, offset by certain adjustments to accrued expenses. These had a net impact of a reduction in revenues of $1.8 million, a decrease in gross profit of $0.6 million and a reduction in operating expenses of $1.1 million. These adjustments were not material to any previously issued interim or annual financial statements, to the third quarter or full year 2014 consolidated financial statements.
During the fourth quarter of 2014, we recorded out of period adjustments relating to maintenance agreements for the second and third quarters of 2014 and credit memo adjustments relating to the first and second quarters of 2014. These were offset by adjustments to 2012 and 2013 inventory reserves, accounts payable adjustments related to costing errors in the first three quarters of 2014 and accrual adjustments recognized during 2012 and 2013. These adjustments had a net impact on our fourth quarter results of a reduction in revenues of $0.5 million, a reduction in cost of goods sold of $1.0 million and a reduction in operating expenses of $0.5 million. These adjustments, together with the third quarter of 2014 out of period adjustments, were not material to any previously issued interim or annual financial statements, to the fourth quarter or full year of our fiscal 2014 consolidated financial statements.
57
Discontinued Operations
We evaluate our businesses and product lines periodically for their strategic fit within our operations. In December 2011, we began actively marketing our Banking Security Systems Integration business unit and we completed its sale in October 2012. In December 2012, our U.S. and Canada based CheckView® business met held for sale reporting criteria. In connection with our decisions to sell these businesses, for all periods presented, the operating results associated with these businesses have been reclassified into earnings from discontinued operations, net of tax in the Consolidated Statements of Operations. The assets and liabilities associated with the U.S. and Canada based CheckView® business were adjusted to fair value, less costs to sell, and reclassified into assets of discontinued operations, net of tax and liabilities of discontinued operations, net of tax, as appropriate, in the Consolidated Balance Sheets. In April 2013, we completed the sale of our U.S and Canada based CheckView® business unit. Refer to Note 19 of the Consolidated Financial Statements.
Assets Held For Sale
As a result of our restructuring plans, certain long-lived assets of our manufacturing facilities met held for sale criteria during the second quarter ended June 24, 2012 and $3.7 million of property, plant, and equipment, net was reclassified into other current assets on the Consolidated Balance Sheet. In the third quarter ended September 23, 2012, these long-lived assets of our manufacturing facilities were sold, resulting in a gain on sale of $0.8 million that was recognized in other exit costs within restructuring expense on the Consolidated Statement of Operations.
Sale of Subsidiary
On November 15, 2012, we sold our Suzhou, China subsidiary, resulting in a gain on sale of $1.7 million that was recognized in other operating income on the Consolidated Statement of Operations.
Non-controlling Interests
On May 16, 2011, Checkpoint Holland Holding B.V., a wholly-owned subsidiary, acquired 51% of the outstanding voting shares of Shore to Shore PVT Ltd. (Sri Lanka) in exchange for $1.7 million in cash.
In January 2013, we entered into an agreement to sell our 51% interest in Sri Lanka to the unrelated party holding the non-controlling interest. On June 24, 2013, we completed the sale of our 51% interest for which we received cash proceeds of $0.2 million (net of a stamp duty). The gain on sale of $0.2 million is recorded within other operating income on the Consolidated Statement of Operations.
Subsequent Events
We perform a review of subsequent events in connection with the preparation of our financial statements. The accounting for and disclosure of events that occur after the balance sheet date, but before our financial statements are issued, are reflected where appropriate or required in our financial statements. Refer to Note 20 of the consolidated financial statements.
Cash and Cash Equivalents
Cash in excess of operating requirements is invested in short-term, income-producing instruments or used to pay down debt. Cash equivalents include commercial paper and other securities with original maturities of three months or less at the time of purchase. Book value approximates fair value because of the short maturity of those instruments.
Accounts Receivable
Accounts receivables are recorded at net realizable values. We maintain an allowance for doubtful accounts for estimated losses resulting from the inability of our customers to make required payments. These allowances are based on specific facts and circumstances surrounding individual customers as well as our historical experience. Provisions for the losses on receivables are charged to income to maintain the allowance at a level considered adequate to cover losses. Receivables are charged off against the reserve when they are deemed uncollectible. From time to time, we sell customer related receivables to third party financial institutions and evaluate these transactions to determine if they meet the criteria for sale accounting treatment. If it is determined that the criteria for sale treatment is met, the receivables are removed from the Consolidated Balance Sheet and earnings are reported on the Consolidated Statement of Operations. If it is determined that the criteria for sale accounting treatment are not met, the receivables remain on the Consolidated Balance Sheet and the transaction is treated as a secured financing.
58
Cash proceeds from the sale of accounts receivable related to sales-type leases with customers to third party financial institutions totaled $17.4 million, $29.3 million, and $23.4 million for the years ended December 28, 2014, December 29, 2013 and December 30, 2012, respectively. Proceeds from the initial sale of the accounts receivables are used to fund operations. These transactions meet the criteria for sale accounting treatment. We have presented the earnings of $0.4 million recognized on the sale of the receivables separately in other operating income on the Consolidated Statements of Operations for the year ended December 29, 2013. There was no comparable earnings for the years ended December 28, 2014 and December 30, 2012.
Inventories
Inventories are stated at the lower of cost (first-in, first-out method) or market. A provision is made to reduce excess or obsolete inventory to its net realizable value.
Revenue Equipment on Operating Lease
The cost of the equipment leased to customers under operating leases is depreciated on a straight-line basis over the lesser of the length of the contract or estimated useful life of the asset, which is usually between three and five years.
Property, Plant, and Equipment
Property, plant, and equipment is carried at cost less accumulated depreciation. Maintenance, repairs, and minor renewals are expensed as incurred. Additions, improvements, and major renewals are capitalized. Depreciation is provided on a straight-line basis over the estimated useful lives of the assets. Assets subject to capital leases are depreciated over the lesser of the estimated useful life of the asset or length of the contract. Buildings, equipment rented to customers, and leased equipment on capitalized leases use the following estimated useful lives of fifteen to thirty years, three to five years, and five years, respectively. Machinery and equipment estimated useful lives range from three to ten years. Leasehold improvement useful lives are the lesser of the minimum lease term or the useful life of the item. The cost and accumulated depreciation applicable to assets retired are removed from the accounts and the gain or loss on disposition is included in income.
We review our property, plant, and equipment for impairment whenever events or changes in circumstances indicate that the carrying amount of the assets may not be recoverable. If it is determined that an impairment, based on expected future undiscounted cash flows, exists, then the loss is recognized on the Consolidated Statements of Operations. The amount of the impairment is the excess of the carrying amount of the impaired asset over its fair value.
Internal-Use Software
Included in intangible assets is the capitalized cost of internal-use software. We capitalize costs incurred during the application development stage of internal-use software and amortize these costs over their estimated useful lives, which generally range from three to seven years. Costs incurred related to planning, maintenance, training, and ongoing support of internal-use software is expensed as incurred.
During 2009, we announced that we were in the initial stages of implementing a company-wide ERP system to handle the business and finance processes within our operations and corporate functions. As of December 28, 2014 and December 29, 2013, $8.5 million and $11.0 million, respectively, were recorded in intangibles related to portions of the ERP system that were placed in service. In the fourth quarter of 2013, through the budgeting process, working capital prioritization activities, and other strategic direction reviews, it was determined that our European ERP system implementation was no longer a strategic priority for 2014 through 2016. Therefore, during the fourth quarter of 2013, we recorded an impairment of the $4.7 million in internal-use software related to the European ERP system implementation. The impairment charge was recorded in asset impairment expense in the Consolidated Statement of Operations. We plan to implement our South China ALS ERP system by the end of 2016.
Costs of Software to Be Sold
Internal costs incurred to create computer software are charged to expense when incurred until technological feasibility has been established for the product. After technological feasibility is established, costs of coding and testing and other costs of producing product masters that are material in nature are capitalized. Cost capitalization ceases when the product is available for general release to customers. Capitalized software costs are amortized on a product-by-product basis, starting when the product is available for general release to customers. Annual amortization is the greater of straight-line over the product's estimated useful life or the percent of the product's current-year revenues as compared to the product's anticipated future revenues.
59
Goodwill
Goodwill is carried at cost and is not amortized. We test goodwill for impairment on an annual basis as of fiscal month end October of each fiscal year, relying on a number of factors including operating results, business plans and anticipated future cash flows. Company management uses its judgment in assessing whether goodwill has become impaired between annual impairment tests. Reporting units are primarily determined as the geographic areas comprising our business segments, except in situations when aggregation of the reporting units is appropriate. Recoverability of goodwill is evaluated using a two-step process when we conclude a qualitative analysis is not sufficient. We decided not to perform a qualitative assessment of goodwill and proceed to Step 1 for all reporting units. The first step involves a comparison of the fair value of a reporting unit with its carrying value. If the carrying amount of the reporting unit exceeds its fair value, then the second step of the process involves a comparison of the implied fair value and carrying value of the goodwill of that reporting unit. If the carrying value of the goodwill of a reporting unit exceeds the implied fair value of that goodwill, an impairment loss is recognized in an amount equal to the excess. The nonrecurring fair value measurement of goodwill is developed using significant unobservable inputs (Level 3).
The fair value of our reporting units is dependent upon our estimate of future discounted cash flows and other factors. Our estimates of future cash flows include assumptions concerning future operating performance and economic conditions and may differ from actual future cash flows. Estimated future cash flows are adjusted by an appropriate discount rate derived from our market capitalization plus a suitable control premium at the date of evaluation. The financial and credit market volatility directly impacts our fair value measurement through our weighted average cost of capital that we use to determine our discount rate and through our stock price that we use to determine our market capitalization. Therefore, changes in the stock price may also affect the amount of impairment recorded. Market capitalization is determined by multiplying the shares outstanding on the assessment date by the average market price of our common stock over a 30-day period before each assessment date. We use this 30-day duration to consider inherent market fluctuations that may affect any individual closing price. We believe that our market capitalization alone does not fully capture the fair value of our business as a whole, or the substantial value that an acquirer would obtain from its ability to obtain control of our business. As such, in determining fair value, we add a control premium to our market capitalization. To estimate the control premium, we considered our unique competitive advantages that would likely provide synergies to a market participant. In addition, we considered external market factors which we believe contributed to the decline and volatility in our stock price that did not reflect our underlying fair value. Refer to Note 5 of the Consolidated Financial Statements.
Other Intangibles
Indefinite-lived intangible assets are carried at cost and are not amortized, but are subject to tests for impairment at least annually or whenever events or changes in circumstances indicate that the carrying amount of the assets may not be recoverable.
Definite-lived intangibles are amortized on a straight-line basis over their useful lives (or legal lives if shorter). We review our other intangible assets for impairment whenever events or changes in circumstances indicate that the carrying amount of the assets may not be recoverable.
If it is determined that an impairment, based on expected future cash flows, exists, then the loss is recognized on the Consolidated Statements of Operations. The amount of the impairment is the excess of the carrying amount of the impaired asset over the fair value of the asset. The fair value represents expected future cash flows from the use of the assets, discounted at the rate used to evaluate potential investments. Refer to Note 5 of the Consolidated Financial Statements.
Other Assets
Included in other assets are $1.4 million and $3.5 million of net long-term customer-based receivables at December 28, 2014 and December 29, 2013, respectively.
Deferred Financing Costs
Financing costs are capitalized and amortized to interest expense over the life of the debt. The net deferred financing costs at December 28, 2014 and December 29, 2013 were $1.7 million and $2.1 million, respectively. The financing cost amortization expense was $0.4 million, $2.2 million, and $2.3 million, for 2014, 2013, and 2012, respectively.
60
Revenue Recognition
We recognize revenue when revenue is realized or realizable and earned. Revenue is realized or realizable and earned when all of the following criteria are met: persuasive evidence of an arrangement exists; delivery has occurred or services have been rendered; the price to the buyer is fixed or determinable; and collectability is reasonably assured.
We enter into contracts to sell our products and services, and, while the majority of our sales agreements contain standard terms and conditions, there are agreements that contain multiple elements or non-standard terms and conditions. As a result, significant contract interpretation is sometimes required to determine the appropriate accounting, including whether the deliverables specified in a multiple element arrangement should be treated as separate units of accounting for revenue recognition purposes, and, if so, how the selling price should be allocated among the elements and when to recognize revenue for each element.
For arrangements with multiple elements, we allocate total arrangement consideration to all deliverables based on their relative selling price using a specific hierarchy and recognize revenue when each element’s revenue recognition criteria are met. The hierarchy is as follows: vendor-specific objective evidence (“VSOE”), third-party evidence of selling price (“TPE”) or best estimate of selling price (“BESP”). VSOE of fair value for each element is established based on the price charged when the same element is sold separately. We recognize revenue when installation is complete or other post-shipment obligations have been satisfied. Unearned revenue is recorded when payments are received in advance of performing our service obligations and is recognized over the service period.
Products leased to customers under sales-type leases are accounted for as the equivalent of a sale. The present value of such lease revenues is recorded as net revenues, and the related cost of the products is charged to cost of revenues. The deferred finance charges applicable to these leases are recognized over the terms of the leases. Rental revenue from products under operating leases is recognized over the term of the lease. Installation revenue from SMS EAS products is recognized when the systems are installed. Service revenue is recognized, for service contracts, on a straight-line basis over the contractual period, and, for non-contract work, as services are performed.
Revenues from software license agreements are recognized when persuasive evidence of an agreement exists, delivery of the product has occurred, no significant vendor obligations are remaining to be fulfilled, the fee is fixed or determinable, and collection is probable. Revenue from software contracts for both licenses and professional services that require significant production, modification, customization, or implementation are recognized together using the percentage of completion method based upon the ratio of labor incurred to total estimated labor to complete each contract. In instances where there is a term license combined with services, revenue is recognized ratably over the term.
We record estimated reductions to revenue for customer incentive offerings, including volume-based incentives and rebates. The accrual for these incentives and rebates, which are included in the Other Accrued Expenses section of our Consolidated Balance Sheet, was $12.5 million, and $11.1 million as of December 28, 2014 and December 29, 2013, respectively. We record revenues net of an allowance for estimated return activities and pricing adjustments. Return activity was immaterial to revenue and results of operations for all periods presented.
Shipping and Handling Fees and Costs
Shipping and handling fees charged to our customers are accounted for in net revenues and shipping and handling costs in cost of revenues.
Cost of Revenues
The principal elements of cost of revenues are product cost, field service and installation cost, freight, and product royalties paid to third parties.
Warranty Reserves
We provide product warranties for our various products. These warranties vary in length depending on product and geographical region. We establish our warranty reserves based on historical data of warranty transactions.
61
The following table sets forth the movement in the warranty reserve which is located in the Other Accrued Expenses section of our Consolidated Balance Sheet:
(amounts in thousands) | December 28, 2014 | December 29, 2013 | |||||
Balance at beginning of year | $ | 4,521 | $ | 3,995 | |||
Accruals for warranties issued | 4,044 | 4,665 | |||||
Settlements made | (3,867 | ) | (4,148 | ) | |||
Foreign currency translation adjustment | (319 | ) | 9 | ||||
Balance at end of period | $ | 4,379 | $ | 4,521 | |||
Royalty Expense
Royalty expenses related to security products approximated $0.8 million, $0.6 million, and $0.2 million, in 2014, 2013, and 2012, respectively. These expenses are included as part of cost of revenues.
Research and Development Costs
Research and development costs are expensed as incurred and consist of development work associated with our existing and potential products and processes. Our research and development expenses relate primarily to payroll costs for engineering personnel, costs associated with various projects, including testing, developing prototypes and related expenses.
Stock Options
We recognize stock-based compensation expense for the grant date fair value of all share-based payments net of an estimated forfeiture rate. Stock compensation expense is recognized for all share-based payments on a straight-line basis over the requisite service period of the award.
We use the Black-Scholes option pricing model to value all stock options. The table below presents the weighted average expected life in years. The expected life computation is based on historical exercise patterns and post-vesting termination behavior. Volatility is determined using changes in historical stock prices. The interest rate for periods within the expected life of the award is based on the U.S. Treasury yield curve in effect at the time of grant.
The fair value of share-based payment units was estimated using the Black-Scholes option pricing model with the following assumptions and weighted average fair values as follows:
Year Ended | December 28, 2014 | December 29, 2013 | December 30, 2012 | ||||||||
Weighted-average fair value of grants | $ | 6.41 | $ | 5.46 | $ | 4.38 | |||||
Valuation assumptions: | |||||||||||
Expected dividend yield | 0.00 | % | 0.00 | % | 0.00 | % | |||||
Expected volatility | 48.09 | % | 50.79 | % | 52.08 | % | |||||
Expected life (in years) | 5.12 | 5.08 | 5.06 | ||||||||
Risk-free interest rate | 1.465 | % | 0.835 | % | 0.750 | % | |||||
Refer to Note 8 of the Consolidated Financial Statements.
Income Taxes
Deferred tax liabilities and assets are determined based on the difference between the financial statement basis and the tax basis of assets and liabilities, using enacted statutory tax rates in effect at the balance sheet date. Changes in enacted tax rates are reflected in the tax provision as they occur. A valuation allowance is recorded to reduce deferred tax assets when it is more likely than not that a tax benefit will not be realized. The effect on deferred tax assets and liabilities of a change in tax rates is recognized in income in the period when the change is enacted.
62
We utilize a two-step approach to recognizing and measuring uncertain tax positions (tax contingencies). The first step is to evaluate the tax position for recognition by determining if the weight of available evidence indicates it is more likely than not that the position will be sustained on audit, including resolution of related appeals or litigation processes. The second step is to measure the tax benefit as the largest amount which is more than 50% likely of being realized upon ultimate settlement. We include interest and penalties related to our tax contingencies in income tax expense.
Sales and Value Added Taxes Collected from Customers
Sales and value added taxes collected from customers are excluded from revenues. The obligation is included in other current liabilities until the taxes are remitted to the appropriate taxing authorities.
Foreign Currency Translation and Transactions
Our balance sheet accounts of foreign subsidiaries are translated into U.S. dollars at the rate of exchange in effect at the balance sheet dates. Revenues, costs, and expenses of our foreign subsidiaries are translated into U.S. dollars at the year-to-date average rate of exchange. The resulting translation adjustments are recorded as a separate component of shareholders’ equity. Gains or losses on certain long-term inter-company transactions are excluded from the net earnings (loss) and accumulated in the cumulative translation adjustment as a separate component of Consolidated Stockholders’ Equity. All other foreign currency transaction gains and losses are included in net earnings (loss) on our Consolidated Statement of Operations.
Accounting for Hedging Activities
We enter into certain foreign exchange forward contracts in order to hedge anticipated rate fluctuations in Western Europe, Canada, Japan and Australia. Transaction gains or losses resulting from these contracts are recognized at the end of each reporting period. We use the fair value method of accounting, recording realized and unrealized gains and losses on these contracts. These gains and losses are included in other gain (loss), net on our Consolidated Statements of Operations.
We enter into various foreign currency contracts to reduce our exposure to forecasted Euro-denominated inter-company revenues. These cash flow hedging instruments are marked to market and the changes are recorded in other comprehensive income. Amounts recorded in other comprehensive income are recognized in cost of goods sold as the inventory is sold to external parties. Any hedge ineffectiveness is charged to other gain (loss), net on our Consolidated Statements of Operations.
We enter, on occasion, into interest rate swaps to reduce the risk of significant interest rate increases in connection with floating rate debt. This cash flow hedging instrument is marked to market and the changes are recorded in other comprehensive income. Any hedge ineffectiveness is charged to interest expense. Refer to Note 14 of the Consolidated Financial Statements.
Accumulated Other Comprehensive Income (Loss)
The components of accumulated other comprehensive income (loss), net of tax, for the year ended December 28, 2014 were as follows:
(amounts in thousands) | Pension Plan | Foreign currency translation adjustment | Total accumulated other comprehensive income | |||||||||
Balance, December 29, 2013 | $ | (17,773 | ) | $ | 20,018 | $ | 2,245 | |||||
Other comprehensive (loss) income before reclassifications | (18,764 | ) | (19,666 | ) | (38,430 | ) | ||||||
Amounts reclassified from other comprehensive income (loss) | 1,501 | — | 1,501 | |||||||||
Net other comprehensive income (loss) | (17,263 | ) | (19,666 | ) | (36,929 | ) | ||||||
Balance, December 28, 2014 | $ | (35,036 | ) | $ | 352 | $ | (34,684 | ) | ||||
63
The significant items reclassified from each component of other comprehensive income (loss) for the year ended December 28, 2014 were as follows:
(amounts in thousands) | |||||
Details about accumulated other comprehensive income (loss) components | Amount reclassified from accumulated other comprehensive income (loss) | Affected line item in the statement where net loss is presented | |||
Amortization of pension plan items | |||||
Actuarial loss (1) | $ | (1,495 | ) | ||
Prior service cost (1) | (12 | ) | |||
(1,507 | ) | Total before tax | |||
6 | Tax benefit | ||||
$ | (1,501 | ) | Net of tax | ||
Total reclassifications for the period | $ | (1,501 | ) | ||
(1) | These accumulated other comprehensive income components are included in the computation of net periodic pension costs. Refer to Note 13 of the Consolidated Financial Statements. |
Other Income
In December of 2011, we identified errors in our financial statements resulting from improper and fraudulent activities of a certain former employee of our Canada sales subsidiary as part of the transition of our Canadian operations into our shared service environment in North America. In the period from 2005 through the fourth quarter of 2011, the then Controller of our Canadian operations was able to misappropriate cash through various schemes. The defalcation of cash was concealed by overriding internal controls at the subsidiary which had the effect of misstating certain accounts including cash, accounts receivable, and inventories as well as income taxes and non-income taxes payable and operating expenses.
The total cumulative gross financial statement impact of the improper and fraudulent activities was approximately $5.2 million and impacted fiscal years 2005 through 2011 of which $1.1 million was recovered by us from the perpetrator during the fourth quarter of 2011, resulting in a net cumulative financial statement impact of $4.1 million. The fiscal year 2011 financial statement impact was $0.2 million income due to the recovery of $1.1 million offset by expense of $0.9 million. We incurred additional expenses related to the improper and fraudulent activities of $0.7 million during 2012. The financial statement impacts of the improper and fraudulent Canadian activities have been included in other income in the Consolidated Statements of Operations. We filed a claim during the second quarter of 2012 with our insurance provider for the unrecovered amount of the loss. On October 10, 2012, we received compensation of $4.7 million for the financial impact of the fraudulent Canadian activities from our insurance provider.
Recently Adopted Accounting Standards
In December 2011, the FASB issued ASU 2011-11, "Balance Sheet – Disclosures about Offsetting Assets and Liabilities (Topic 210-20)," (ASU 2011-11). ASU 2011-11 requires an entity to disclose information about offsetting and related arrangements to enable users of its financial statements to understand the effect of those arrangements on its financial position. ASU 2011-11 is effective for fiscal years beginning on or after January 1, 2013, which for us was December 30, 2013, the first day of our 2014 fiscal year. The adoption of this standard has not had a material effect on our consolidated results of operations and financial condition.
In February 2013, the FASB issued ASU 2013-04, “Obligations Resulting From Joint and Several Liability Arrangements for Which the Total Amount of the Obligation is Fixed at the Reporting Date,” (ASU 2013-04). The update requires an entity to measure obligations resulting from joint and several liability arrangements for which the total amount of the obligation is fixed as of the reporting date as the sum of the obligation the entity agreed to pay among its co-obligors and any additional amount the entity expects to pay on behalf of its co-obligors. This ASU is effective for annual and interim periods beginning after December 15, 2013, which for us was December 30, 2013, the first day of our 2014 fiscal year. The adoption of this standard has not had a material effect on our consolidated results of operations and financial condition.
64
In March 2013, the FASB issued ASU 2013-05, “Parent's Accounting for the Cumulative Translation Adjustment upon Derecognition of Certain Subsidiaries or Groups of Assets within a Foreign Entity or of an Investment in a Foreign Entity,” (ASU 2013-05). The update clarifies that complete or substantially complete liquidation of a foreign entity is required to release the cumulative translation adjustment (CTA) for transactions occurring within a foreign entity. However, transactions impacting investments in a foreign entity may result in a full or partial release of CTA even though complete or substantially complete liquidation of the foreign entity has not occurred. Furthermore, for transactions involving step acquisitions, the CTA associated with the previous equity-method investment will be fully released when control is obtained and consolidation occurs. This ASU is effective for fiscal years beginning after December 15, 2013, which for us was December 30, 2013, the first day of our 2014 fiscal year. The adoption of this standard has not had a material effect on our consolidated results of operations and financial condition.
In April 2013, the FASB issued ASU 2013-07, “Liquidation Basis of Accounting,” (ASU 2013-07). The objective of ASU 2013-07 is to clarify when an entity should apply the liquidation basis of accounting and to provide principles for the measurement of assets and liabilities under the liquidation basis of accounting, as well as any required disclosures. The ASU is effective prospectively for entities that determine liquidation is imminent during annual and interim reporting periods beginning after December 15, 2013, which for us was December 30, 2013, the first day of our 2014 fiscal year. The adoption of this standard has not had a material effect on our consolidated results of operations and financial condition.
In March 2014, the FASB issued ASU 2014-06, "Technical Corrections and Improvements Related to Glossary Terms," (ASU 2014-06). This ASU provides technical corrections and improvements to Accounting Standards Codification glossary terms. Our adoption of this standard, effective March 14, 2014, has not had a material impact on our consolidated results of operations and financial condition.
In November 2014, the FASB issued ASU 2014-17, “Business Combinations (Topic 805) - Pushdown Accounting,” (ASU 2014-17). This ASU provides an acquired entity with the option to apply pushdown accounting in its separate financial statements upon occurrence of an event in which an acquirer obtains control of the acquired entity. The election to apply pushdown accounting can be made either in the period in which the change of control occurred, or in a subsequent period. ASU 2014-17 was effective on November 18, 2014. The adoption of this standard has not had a material effect on our consolidated results of operations and financial condition.
New Accounting Pronouncements and Other Standards
In April 2014, the FASB issued ASU 2014-08, "Reporting Discontinued Operations and Disclosures of Disposals of Components of an Entity," (ASU 2014-08). Under ASU 2014-08, only disposals representing a strategic shift in operations should be presented as discontinued operations. Those strategic shifts should have a major effect on the organization’s operations and financial results. Additionally, ASU 2014-08 requires expanded disclosures about discontinued operations that will provide financial statement users with more information about the assets, liabilities, income, and expenses of discontinued operations, including disclosure of pretax profit or loss of an individually significant component of an entity that does not qualify for discontinued operations reporting. ASU 2014-08 is effective for fiscal and interim periods beginning on or after December 15, 2014. The impact of the adoption of this ASU on our consolidated results of operations and financial condition will be based on our future disposal activity.
In May 2014, the FASB issued ASU 2014-09, “Revenue from Contracts with Customers,” (ASU 2014-09), which creates a new Topic, Accounting Standards Codification Topic 606. The standard is principle-based and provides a five-step model to determine when and how revenue is recognized. The core principle of ASU 2014-09 is that an entity should recognize revenue to depict the transfer of promised goods or services to customers in an amount that reflects the consideration to which the entity expects to be entitled in exchange for those goods or services. The accounting standard is effective for annual and interim periods beginning after December 15, 2016. Early adoption is not permitted. We are currently evaluating the impact of adopting this guidance.
In June 2014, the FASB issued ASU 2014-12, “Accounting for Share-Based Payments When the Terms of an Award Provide That a Performance Target Could Be Achieved after the Requisite Service Period,” (ASU 2014-12). ASU 2014-12 requires that a performance target that affects vesting, and that could be achieved after the requisite service period, be treated as a performance condition. As such, the performance target should not be reflected in estimating the grant date fair value of the award. This update further clarifies that compensation cost should be recognized in the period in which it becomes probable that the performance target will be achieved and should represent the compensation cost attributable to the period(s) for which the requisite service has already been rendered. The amendments in ASU 2014-12 are effective for annual periods and interim periods beginning after December 15, 2015. Early adoption is permitted. Entities may apply the amendments in ASU 2014-12 either: (a) prospectively to all awards granted or modified after the effective date; or (b) retrospectively to all awards with
65
performance targets that are outstanding as of the beginning of the earliest annual period presented in the financial statements and to all new or modified awards thereafter. The adoption of this standard is not expected to have a material effect on our consolidated results of operations and financial condition.
In August 2014, the FASB issued ASU 2014-15, "Preparation of Financial Statements - Going Concern (Subtopic 205-40), Disclosure of Uncertainties about an Entity’s Ability to Continue as a Going Concern," (ASU 2014-15). Continuation of a reporting entity as a going concern is presumed as the basis for preparing financial statements unless and until the entity’s liquidation becomes imminent. Preparation of financial statements under this presumption is commonly referred to as the going concern basis of accounting. If and when an entity’s liquidation becomes imminent, financial statements should be prepared under the liquidation basis of accounting in accordance with Subtopic 205-30, "Presentation of Financial Statements-Liquidation Basis of Accounting". Even when an entity’s liquidation is not imminent, there may be conditions or events that raise substantial doubt about the entity’s ability to continue as a going concern. In those situations, financial statements should continue to be prepared under the going concern basis of accounting, but the new criteria in ASU 2014-15 should be followed to determine whether to disclose information about the relevant conditions and events. ASU 2014-15 is effective for the annual period ending after December 15, 2016, and for annual periods and interim periods thereafter. Early application is permitted. We are in the process of evaluating the adoption of this ASU, and do not expect this to have a material effect on our consolidated results of operations and financial condition.
In January 2015, the FASB issued ASU 2015-01, "Income Statement--Extraordinary and Unusual Items (Subtopic 225-20)," (ASU 2015-01). The amendments in ASU 2015-01 eliminate from GAAP the concept of extraordinary items. Although the amendments will eliminate the requirements in Subtopic 225-20 for reporting entities to consider whether an underlying event or transaction is extraordinary, the presentation and disclosure guidance for items that are unusual in nature or occur infrequently will be retained and will be expanded to include items that are both unusual in nature and infrequently occurring. ASU 2015-01 is effective for fiscal years, and interim periods within those years, beginning after December 15, 2015. Early adoption is permitted provided that the guidance is applied from the beginning of the fiscal year of adoption. The adoption of this standard is not expected to have a material impact on our consolidated results of operations and financial condition.
In February 2015, the FASB issued ASU 2015-02, “Consolidation (Topic 810) - Amendments to the Consolidation Analysis,” (ASU 2015-02). ASU 2015-02 modifies existing consolidation guidance related to (i) limited partnerships and similar legal entities, (ii) the evaluation of variable interests for fees paid to decision makers or service providers, (iii) the effect of fee arrangements and related parties on the primary beneficiary determination, and (iv) certain investment funds. These changes reduce the number of consolidation models from four to two and place more emphasis on the risk of loss when determining a controlling financial interest. This guidance is effective for public companies for fiscal years beginning after December 15, 2015. The adoption of this standard is not expected to have a material effect on our consolidated results of operations and financial condition.
Note 2. ACQUISITIONS
The May 2011 acquisition of the Shore to Shore businesses included a purchase price payment to escrow of $17.5 million related to the 2010 performance of the acquired business. This amount is subject to adjustment pending final determination of the 2010 performance and could result in an additional purchase price payment of up to $6.3 million. We are currently involved in an arbitration process in order to require the seller to provide audited financial information related to the 2010 performance. Once the final information is received and the calculation of the final purchase price is agreed to by both parties, the final adjustment to the purchase price will be recognized through earnings. Acquisition related costs incurred in connection with the transaction, including legal and other arbitration-related costs, are recognized within acquisition costs in the Consolidated Statement of Operations and approximate $0.4 million and $1.0 million for the years ended December 28, 2014 and December 29, 2013, respectively.
As we owned 51% of the outstanding voting shares of Shore to Shore PVT Ltd. (Sri Lanka), we classified the non-controlling interests as equity on our Consolidated Balance Sheet, and presented net income attributable to non-controlling interests separately on our Consolidated Statement of Operations. On June 24, 2013, we completed the sale of our 51% interest in Shore to Shore PVT Ltd. for which we received cash proceeds of $0.2 million (net of a stamp duty). The gain on sale of $0.2 million was recorded within other operating income on the Consolidated Statement of Operations.
66
Note 3. INVENTORIES
Inventories consist of the following:
(amounts in thousands) | December 28, 2014 | December 29, 2013 | |||||
Raw materials | $ | 21,085 | $ | 18,040 | |||
Work-in-process | 3,264 | 2,901 | |||||
Finished goods | 67,511 | 62,580 | |||||
Total | $ | 91,860 | $ | 83,521 | |||
Note 4. REVENUE EQUIPMENT ON OPERATING LEASE AND PROPERTY, PLANT, AND EQUIPMENT
The major classes of revenue equipment on operating lease and property, plant and equipment are:
(amounts in thousands) | December 28, 2014 | December 29, 2013 | |||||
Revenue equipment on operating lease | |||||||
Equipment rented to customers | $ | 3,818 | $ | 4,691 | |||
Accumulated depreciation | (2,761 | ) | (3,424 | ) | |||
Total revenue equipment on operating lease | $ | 1,057 | $ | 1,267 | |||
Property, plant, and equipment | |||||||
Land | $ | 6,657 | $ | 7,529 | |||
Buildings | 51,645 | 54,470 | |||||
Machinery and equipment | 138,432 | 141,393 | |||||
Leasehold improvements | 13,836 | 15,329 | |||||
Construction in progress | 6,922 | 1,400 | |||||
217,492 | 220,121 | ||||||
Accumulated depreciation | (141,160 | ) | (145,054 | ) | |||
Total property, plant, and equipment | $ | 76,332 | $ | 75,067 | |||
Property, plant, and equipment under capital lease had gross values of $1.4 million and $1.4 million and accumulated depreciation of $1.2 million and $1.2 million, as of December 28, 2014 and December 29, 2013, respectively.
Included in property, plant, and equipment as of December 28, 2014 and December 29, 2013, is the impact of asset impairment adjustments of $0.2 million and $1.2 million, respectively, related to our restructuring activities.
Depreciation expense on our revenue equipment on operating lease and property, plant, and equipment was $14.1 million, $14.6 million, and $17.3 million, for 2014, 2013, and 2012, respectively.
67
Note 5. GOODWILL AND OTHER INTANGIBLE ASSETS
We had intangible assets with a net book value of $64.9 million, and $78.2 million as of December 28, 2014 and December 29, 2013, respectively.
The following table reflects the components of intangible assets as of December 28, 2014 and December 29, 2013:
December 28, 2014 | December 29, 2013 | ||||||||||||||||
(amounts in thousands) | Amortizable Life (years) | Gross Amount | Gross Accumulated Amortization | Gross Amount | Gross Accumulated Amortization | ||||||||||||
Finite-lived intangible assets: | |||||||||||||||||
Customer lists | 6 to 20 | $ | 79,110 | $ | 58,873 | $ | 83,063 | $ | 56,798 | ||||||||
Trade names | 1 to 30 | 27,172 | 18,031 | 30,256 | 19,346 | ||||||||||||
Patents, license agreements | 3 to 14 | 58,060 | 52,448 | 61,820 | 54,225 | ||||||||||||
Internal-use software | 3 to 7 | 24,034 | 14,758 | 24,039 | 12,358 | ||||||||||||
Other | 2 to 6 | 7,029 | 6,867 | 7,132 | 6,793 | ||||||||||||
Total amortized finite-lived intangible assets | 195,405 | 150,977 | 206,310 | 149,520 | |||||||||||||
Indefinite-lived intangible assets: | |||||||||||||||||
Trade names | 20,512 | — | 21,376 | — | |||||||||||||
Total identifiable intangible assets | $ | 215,917 | $ | 150,977 | $ | 227,686 | $ | 149,520 | |||||||||
We recorded $12.0 million, $11.8 million, and $14.3 million of amortization expense for 2014, 2013, and 2012, respectively.
In December 2014, as a result of our annual impairment test of our indefinite-lived trade names, we recorded a $0.9 million impairment charge to the value of the OAT trade name. The impairment charge was recorded in asset impairment expense in the Merchandise Availability Solutions segment on the Consolidated Statement of Operations. The impairment is due to minimal anticipated growth in our legacy OAT Asset Tracking business, as our Merchandising Visibility focus shifts towards end-to-end retail inventory visibility solutions.
In the fourth quarter of 2013, through the budgeting process, working capital prioritization activities, and other strategic direction reviews, it was determined that our European ERP system implementation was no longer a strategic priority for 2014 through 2016. Therefore, during the fourth quarter of 2013, we recorded an impairment of $4.7 million recorded in internal-use software related to this portion of the ERP system implementation. The impairment charge was recorded in asset impairment expense on the Consolidated Statement of Operations. We plan to implement our South China ALS ERP system by the end of 2016.
In December 2013, as a result of our annual impairment test of our indefinite-lived trade names, we recorded a $0.1 million impairment charge to the remaining value of the SIDEP trade name. The impairment charges were recorded in asset impairment expense in the Merchandise Availability Solutions segment on the Consolidated Statement of Operations.
Estimated amortization expense for each of the five succeeding years is anticipated to be:
(amounts in thousands) | |||
2015 | $ | 11,350 | |
2016 | $ | 11,015 | |
2017 | $ | 10,604 | |
2018 | $ | 9,530 | |
2019 | $ | 3,665 | |
Historically, we have reported our results of operations in three segments: Shrink Management Solutions (SMS), Apparel Labeling Solutions (ALS), and Retail Merchandising Solutions (RMS). During the third quarter of 2013, we adjusted the product allocation between our SMS and ALS segments, renamed the SMS segment Merchandise Availability Solutions (MAS)
68
and began reporting our segments as: Merchandise Availability Solutions, Apparel Labeling Solutions, and Retail Merchandising Solutions.
The changes in the carrying amount of goodwill by segments are as follows:
(amounts in thousands) | Merchandise Availability Solutions | Apparel Labeling Solutions | Retail Merchandising Solutions | Total | |||||||||||
Balance as of December 30, 2012 | $ | 159,031 | $ | — | $ | 23,710 | $ | 182,741 | |||||||
Segment reallocation | (2,116 | ) | 2,116 | — | — | ||||||||||
Translation adjustments | 2,242 | — | 881 | 3,123 | |||||||||||
Balance as of December 29, 2013 | $ | 159,157 | $ | 2,116 | $ | 24,591 | $ | 185,864 | |||||||
Translation adjustments | (9,511 | ) | — | (2,784 | ) | (12,295 | ) | ||||||||
Balance as of December 28, 2014 | $ | 149,646 | $ | 2,116 | $ | 21,807 | $ | 173,569 | |||||||
The following table reflects the components of goodwill as of December 28, 2014 and December 29, 2013:
December 28, 2014 | December 29, 2013 | ||||||||||||||||||||||
(amounts in thousands) | Gross Amount | Accumulated Impairment Losses | Goodwill, Net | Gross Amount | Accumulated Impairment Losses | Goodwill, net | |||||||||||||||||
Merchandise Availability Solutions | $ | 192,303 | $ | 42,657 | $ | 149,646 | $ | 207,589 | $ | 48,432 | $ | 159,157 | |||||||||||
Apparel Labeling Solutions | 84,407 | 82,291 | 2,116 | 86,764 | 84,648 | 2,116 | |||||||||||||||||
Retail Merchandising Solutions | 124,127 | 102,320 | 21,807 | 138,098 | 113,507 | 24,591 | |||||||||||||||||
Total goodwill | $ | 400,837 | $ | 227,268 | $ | 173,569 | $ | 432,451 | $ | 246,587 | $ | 185,864 | |||||||||||
We perform an assessment of goodwill by comparing each individual reporting unit’s carrying amount of net assets, including goodwill, to their fair value at least annually during the October month-end close and whenever events or changes in circumstances indicate that the carrying value may not be recoverable. The 2014 and 2013 annual assessments did not result in an impairment charge.
As of the date of our fiscal 2014 annual impairment test, the total estimated fair values for the reporting units in all of our segments substantially exceeded their total carrying values. Based on our most recent goodwill impairment assessment of the reporting units of our segments and our understanding of currently projected trends of the business and the economy, we do not believe that there is a significant risk of impairment for these reporting units for a reasonable period of time. While there is an overall significant percentage excess in comparing the discounted cash flow value to the overall book value of each reporting unit, the amount by which the Retail Merchandising Solutions Europe and International Americas reporting unit fair value exceeds its carrying value is approximately $7 million. Although our analysis regarding the fair values of the goodwill and indefinite lived intangible assets indicates that they exceed their respective carrying values, materially different assumptions regarding the future performance of our businesses or significant declines in our stock price could result in additional goodwill impairment losses. Specifically, an unanticipated deterioration in revenues and gross margins generated by our Merchandise Availability Solutions, Apparel Labeling Solutions, and Retail Merchandising Solutions segments could trigger future impairment in those segments.
Determining the fair value of a reporting unit is a matter of judgment and involves the use of significant estimates and assumptions. The use of different assumptions would increase or decrease estimated discounted future cash flows and could increase or decrease an impairment charge. If the use of these assets or the projections of future cash flows change in the future, we may be required to record additional impairment charges. An erosion of future business results in any of the business units could create impairment in goodwill or other long-lived assets and require a significant charge in future periods.
69
Note 6. SHORT-TERM BORROWINGS AND CURRENT PORTION OF LONG-TERM DEBT
Short-term borrowings and current portion of long-term debt at December 28, 2014 and at December 29, 2013 consisted of the following:
(amounts in thousands) | December 28, 2014 | December 29, 2013 | |||||
Overdraft | $ | 65 | $ | — | |||
Current portion of long-term debt | 171 | 435 | |||||
Total short-term borrowings and current portion of long-term debt | $ | 236 | $ | 435 | |||
In December 2011, we entered into a new five-year Hong Kong banking facility. In June 2012, $8.0 million (HKD 61.8 million) was paid in order to extinguish our existing Hong Kong term loan.
In March 2013, we entered into a new $2.3 million Sri Lanka term loan. Borrowings under this loan were used to pay down the Sri Lanka banking facility in the second quarter of 2013. In June 2013, in connection with the sale of our 51% interest in our Shore to Shore Sri Lanka entity, the outstanding balance of the term loan was transferred to the entity holding the non-controlling interest. The balance of the term loan at the date of transfer was $2.2 million.
In October 2009, we entered into a $12.0 million (€8.0 million) full-recourse factoring arrangement in Germany. In September 2012, $7.4 million (€5.7 million) was paid in order to extinguish this short-term full-recourse factoring agreement.
Note 7. LONG-TERM DEBT AND FINANCING LIABILITIES
Long-term debt at December 28, 2014 and December 29, 2013 consisted of the following:
(amounts in thousands) | December 28, 2014 | December 29, 2013 | |||||
2013 Senior Secured Credit Facility: | |||||||
$200 million variable interest rate revolving credit facility maturing in 2018 | $ | 65,000 | $ | 90,000 | |||
Full-recourse factoring liabilities | 83 | 257 | |||||
Other capital leases with maturities through 2019 | 249 | 1,365 | |||||
Total(1) | 65,332 | 91,622 | |||||
Less current portion | 171 | 435 | |||||
Total long-term portion | $ | 65,161 | $ | 91,187 | |||
(1) | The weighted average interest rates for 2014 and 2013 were 1.5% and 2.2%, respectively. |
2013 Senior Secured Credit Facility
On December 11, 2013, we entered into a new $200.0 million five-year senior secured multi-currency revolving credit facility (2013 Senior Secured Credit Facility) agreement (2013 Credit Agreement) with a syndicate of lenders. The 2013 Senior Secured Credit Facility was used to repay $32.0 million outstanding under the 2010 Senior Secured Credit Facility as well as the $55.6 million outstanding under the Senior Secured Notes. We may borrow, prepay and re-borrow under the 2013 Senior Secured Credit Facility as long as the sum of the outstanding principal amounts is less than the aggregate facility availability. The 2013 Senior Secured Credit Facility also includes an expansion option that will allow us to request an increase in the 2013 Senior Secured Credit Facility of up to an aggregate of $100.0 million, for a potential total commitment of $300.0 million.
All obligations under the 2013 Senior Secured Credit Facility are irrevocably and unconditionally guaranteed on a joint and several basis by certain domestic subsidiaries. Collateral under the 2013 Senior Secured Credit Facility includes a 100% stock pledge of domestic subsidiaries and a 65% stock pledge of all first-tier foreign subsidiaries, excluding our Japanese subsidiary. All domestic tangible and intangible personal property, excluding any real property with a value of less than $5 million, are also pledged as collateral.
Borrowings under the 2013 Senior Secured Credit Facility, other than swingline loans, bear interest at our option of either (i) a spread ranging from 0.25% to 1.25% over the Base Rate (as described below), or (ii) a spread ranging from 1.25% to 2.25%
70
over the LIBOR rate, and in each case fluctuating in accordance with changes in our leverage ratio, as defined in the 2013 Credit Agreement. The “Base Rate” is the highest of (a) the Federal Funds Rate, plus 0.50%, (b) the Administrative Agent’s prime rate, and (c) a daily rate equal to the one-month LIBOR rate, plus 1.00%. Swingline loans bear interest of (i) a spread ranging from 0.25% to 1.25% over the Base Rate. We pay an unused line fee ranging from 0.20% to 0.40% per annum on the unused portion of the 2013 Senior Secured Credit Facility.
Pursuant to the terms of the 2013 Senior Secured Credit Facility, we are subject to various requirements, including covenants requiring the maintenance of (i) a maximum total leverage ratio of 3.00 and (ii) a minimum interest coverage ratio of 3.00. We are in compliance with the maximum total leverage ratio and minimum interest coverage ratio as of December 28, 2014. The 2013 Senior Secured Credit Facility also contains customary representations and warranties, affirmative and negative covenants, notice provisions and events of default, including change of control, cross-defaults to other debt, and judgment defaults. Upon a default under the 2013 Senior Secured Credit Facility, including the non-payment of principal or interest, our obligations under the 2013 Credit Agreement may be accelerated and the assets securing such obligations may be sold.
We incurred $1.8 million in fees and expenses in connection with the 2013 Senior Secured Credit Facility, which are amortized over the term of the 2013 Senior Secured Credit Facility to interest expense on the Consolidated Statement of Operations. The remaining unamortized debt issuance costs recognized in connection with the 2010 Secured Credit Facility of $0.4 million are amortized over the term of the 2013 Senior Secured Credit Facility to interest expense on the Consolidated Statement of Operations.
As of December 28, 2014, $1.4 million issued in letters of credit were outstanding under the 2013 Senior Secured Credit Facility.
2010 Senior Secured Credit Facility
On July 22, 2010, we entered into an Amended and Restated Senior Secured Credit Facility (2010 Senior Secured Credit Facility) with a syndicate of lenders. The 2010 Senior Secured Credit Facility provided us with a $125.0 million four-year senior secured multi-currency revolving credit facility.
On December 11, 2013, we repaid the $32.0 million outstanding under the 2010 Senior Secured Credit Facility and terminated the 2010 Senior Secured Credit Facility. In connection with the paydown, we recognized $0.3 million of unamortized debt issuance costs related to lenders that are not included in the 2013 Senior Secured Credit Facility in interest expense on the Consolidated Statement of Operations in the fourth quarter of 2013. The remaining unamortized debt issuance costs recognized in connection with the 2010 Secured Credit Facility of $0.4 million are amortized over the term of the 2013 Senior Secured Credit Facility to interest expense on the Consolidated Statement of Operations.
Senior Secured Notes
Also on July 22, 2010, we entered into a Note Purchase and Private Shelf Agreement (the Senior Secured Notes Agreement) with a lender, and certain other purchasers party thereto (together with the lender, the Purchasers).
On December 11, 2013, we repaid the outstanding amounts of $55.6 million in principal as well as a make-whole premium of $7.3 million related to the Senior Secured Notes and terminated the Senior Secured Notes. In connection with the repayment on the Senior Secured Notes, we recognized $0.4 million of unamortized debt issuance costs. The unamortized debt issuance costs and make-whole premium fees were recognized in interest expense on the Consolidated Statement of Operations in the fourth quarter of 2013.
Other Long-Term Debt
In December 2013, we entered into a sale-lease-back transaction in Spain. As of December 29, 2013, the lease had a balance of $1.2 million (€0.9 million), of which $0.2 million (€0.2 million) was included in the current portion of long-term debt and $1.0 million (€0.7 million) was included in long-term borrowings in the accompanying Consolidated Balance Sheets. In January 2014, the balance of the sale-lease-back obligation was repaid and no liability exists as of December 28, 2014.
71
The aggregate maturities on all long-term debt (including current portion) are:
(amounts in thousands) | Debt | Capital Leases | Total Debt(1) | ||||||||
2015 | $ | 83 | $ | 88 | $ | 171 | |||||
2016 | — | 98 | 98 | ||||||||
2017 | — | 48 | 48 | ||||||||
2018 | 65,000 | 13 | 65,013 | ||||||||
2019 | — | 2 | 2 | ||||||||
Thereafter | — | — | — | ||||||||
Total | $ | 65,083 | $ | 249 | $ | 65,332 | |||||
(1) | Excludes Overdraft, included in Short-term borrowings and current portion of long-term debt in the Consolidated Balance Sheets. |
Financing Liability
In June 2011, we sold, to a financial institution in Spain, rights to future customer receivables resulting from the negotiated extension of previously executed sales-type lease arrangements, whose receivables were previously sold. The 2011 transaction qualified as a legal sale without recourse. However, until the receivables are recognized, the proceeds from the fiscal 2011 legal sale are accounted for as a financing arrangement and reflected as a financing liability in our consolidated balance sheet. The balance of the financing liability is $33.1 million and $35.1 million as of December 28, 2014 and December 29, 2013, respectively. We impute a non-cash interest charge on the financing liability using a rate of 6.365%, which we recognize as interest expense, until our right to recognize the legal sales permits us to de-recognize the liability and record operating income on the sale. We recognized interest expense related to the financing liability of $2.2 million and $2.1 million in the years ended December 28, 2014 and December 29, 2013, respectively.
During fiscal 2016 through 2018, when we are permitted to recognize the lease receivables upon the commencement of the lease extensions, we expect to de-recognize both the associated receivables and the related financing liability and record other operating income on the sale. At this point, our obligation under the financing liability will have been extinguished.
Note 8. STOCK-BASED COMPENSATION
At December 28, 2014, we had stock-based employee compensation plans as described below. For the years ended December 28, 2014, December 29, 2013, and December 30, 2012, the total compensation expense (included in selling, general, and administrative expense) related to these plans was $5.8 million, $6.4 million, and $4.7 million ($5.8 million, $6.1 million, and $4.5 million, net of tax), respectively.
Stock Plans
The Checkpoint Systems, Inc. Amended and Restated 2004 Omnibus Incentive Compensation Plan (the 2004 Plan) is designed to provide incentives to employees, and non-employee directors through the award of stock options, stock appreciation rights, stock units, phantom shares, dividend equivalent rights and cash awards. The Compensation Committee of our Board of Directors administers the 2004 Plan and determines the terms and conditions of each award. Stock options issued under the 2004 Plan primarily vest over a three-year period and expire not more than 10 years from date of grant. Restricted stock units (RSUs) vest over three to five year periods from date of grant. There is an aggregate of 6,687,956 shares reserved for issuance under the 2004 Plan. As of December 28, 2014, there were 2,625,011 shares available for grant under the 2004 Plan. Key terms of the 2004 Plan include the following:
• | The terms of outstanding awards may not be amended to (i) reduce the exercise price of outstanding stock options or stock appreciation rights (SARs), or (ii) cancel, exchange, substitute, buy out or surrender outstanding options or SARs in exchange for cash, other awards, stock options or SARs with an exercise price that is less than the exercise price of the original stock options or SARs (as applicable) without shareholder approval |
• | Shares of the Company’s common stock are limited from again being made available for issuance under the 2004 Plan when: (i) shares of common stock not issued or delivered as a result of the net settlement of an outstanding SAR or stock option, (ii) shares of common stock used to pay the exercise price or withholding taxes related to an |
72
outstanding award, or (iii) shares of common stock repurchased on the open market with the proceeds of the stock option exercise price
• | There is a minimum exercise price with respect to stock options or SARs to be granted under the 2004 Plan such that no stock option or SAR may be granted under the Plan with a per share exercise price that is less than 100% of the fair market value of one share of the Company’s common stock on the date of grant |
• | There is a limitation against the payment of any cash dividend or dividend equivalent right (DER) with respect to awards that vest based upon the attainment of one or more performance measures such that no awards granted under the 2004 Plan based upon the attainment of one or more performance measures will be entitled to receive payment of any cash dividends or DERs with respect to such awards unless and until such awards vest. |
We also have a Long-Term Incentive Plan (LTIP) under which restricted stock units (RSUs) are awarded to eligible executives and eligible key employees. The RSUs that vest under this plan reduce the shares available to grant under the 2004 Plan.
RSUs were awarded to certain key employees as part of the LTIP 2010, LTIP 2011, and LTIP 2012 plans with company-specific performance goals set for each plan over three-year performance periods. The value of these units weas charged to compensation expense on a straight-line basis over the vesting period with periodic adjustments to account for changes in anticipated award amounts and estimated forfeitures rates. No RSUs were earned under the LTIP 2010, LTIP 2011, and LTIP 2012 plans. In 2013 and 2012, we reversed $0.5 million and $1.1 million, respectively, of previously recognized compensation cost for these RSUs when we determined the specific relative performance goals would not be achieved.
Additional RSUs were awarded to certain of our key employees as part of the LTIP Second Half 2012 plan. The performance measures for this plan set specific goals for employees who can influence key metrics set forth in the new business strategy during the July 2012 to December 2012 performance period. For fiscal year 2012, $0.6 million was charged to compensation expense for the LTIP Second Half 2012 plan. Final assessment of these goals was completed in the second quarter of 2013, resulting in a reversal of $0.1 million of compensation expense. At May 1, 2013, 74,321 units vested at a grant price of $7.59 per share.
On February 27, 2013, RSUs were awarded to certain of our key employees as part of the LTIP 2013 plan. These awards have a market condition. The number of shares for these units varies based on the relative ranking of our total shareholder return (TSR) against the TSRs of the constituents of the Russell 2000 Index during the January 2013 to December 2015 performance period. The final value of these units will be determined by the number of shares earned. The value of these units is charged to compensation expense on a straight-line basis over the vesting period with periodic adjustments to account for changes in anticipated award amounts and estimated forfeitures rates. The grant date fair value for these RSUs was $11.91 per share. Additional RSUs related to the LTIP 2013 plan were awarded on May 28, 2013, with a grant date fair value of $11.56 per share. Compensation expense of $80 thousand and $42 thousand was recognized in connection with these RSUs for the years ended December 28, 2014 and December 29, 2013, respectively. As of December 28, 2014, total unamortized compensation expense for these grants was $0.1 million. As of December 28, 2014, the maximum achievable RSUs outstanding under this plan are 26,400 units.
To determine the fair value of RSUs with market conditions that were awarded on February 27, 2013, we used a Monte Carlo simulation using the following assumptions: (i) expected volatility of 47.01%, (ii) risk-free rate of 0.35%, and (iii) an expected dividend yield of zero.
To determine the fair value of RSUs with market conditions that were awarded on May 28, 2013, we used a Monte Carlo simulation using the following assumptions: (i) expected volatility of 45.23%, (ii) risk-free rate of 0.41%, and (iii) an expected dividend yield of zero.
On May 2, 2013, a cash-based performance award was awarded to our CEO under the terms of our 2013 LTIP plan. Our relative TSR performance determines the payout as a percentage of an established target cash amount of $0.4 million. Because the final payout of the award is made in cash, the award is classified as a liability and the fair value is marked-to-market each reporting period. As of December 28, 2014, the fair value of the award is $0.47 per dollar of the target cash amount awarded. The value of this award is charged to compensation expense on a straight-line basis over the vesting period. Compensation expense of $0.1 million and $0.1 million was recognized in connection with this award for the years ended December 28, 2014 and December 29, 2013, respectively. The associated liability is included in Accrued Compensation and Related Taxes in the accompanying Consolidated Balance Sheets.
73
To determine the fair value of the cash-based performance award as of December 28, 2014, we used a Monte Carlo simulation using the following assumptions: (i) expected volatility of 38.42%, (ii) risk-free rate of 0.26%, and (iii) an expected dividend yield of zero.
On February 27, 2014, RSUs were awarded to certain key employees as part of the LTIP 2014 plan. The number of shares for these units varies based on the growth of our earnings before interest, taxes, depreciation, and amortization (EBITDA) during the January 2014 to December 2016 performance period. The final value of these units will be determined by the number of shares earned. The value of these units is charged to compensation expense on a straight-line basis over the vesting period with periodic adjustments to account for changes in anticipated award amounts and estimated forfeitures rates. The weighted average price for these RSUs was $14.90 per share. Compensation expense of $0.3 million was recognized in connection with these RSUs for the year ended December 28, 2014. As of December 28, 2014, total unamortized compensation expense for this grant was $0.8 million. As of December 28, 2014, the maximum achievable RSUs outstanding under this plan are 153,820 units.
Stock Options
Option activity under the principal option plans as of December 28, 2014 and changes during the year then ended were as follows:
Number of Shares | Weighted- Average Exercise Price | Weighted- Average Remaining Contractual Term (in years) | Aggregate Intrinsic Value (in thousands) | |||||||||
Outstanding at December 29, 2013 | 2,450,660 | $ | 17.70 | 4.35 | $ | 4,285 | ||||||
Granted | 212,080 | 14.78 | ||||||||||
Exercised | (69,836 | ) | 9.05 | |||||||||
Forfeited or expired | (243,457 | ) | 16.93 | |||||||||
Outstanding at December 28, 2014 | 2,349,447 | $ | 17.77 | 3.98 | $ | 2,716 | ||||||
Vested and expected to vest at December 28, 2014 | 2,312,566 | $ | 17.85 | 3.90 | $ | 2,642 | ||||||
Exercisable at December 28, 2014 | 1,932,834 | $ | 18.89 | 3.02 | $ | 1,971 | ||||||
The aggregate intrinsic value in the table above represents the total pretax intrinsic value (the difference between our closing stock price on the last trading day of fiscal 2014 and the exercise price, multiplied by the number of in-the-money options) that would have been received by the option holders had all option holders exercised their options on December 28, 2014. This amount changes based on the fair market value of our stock. The total intrinsic value of options exercised for the years ended December 28, 2014, December 29, 2013, and December 30, 2012, was $0.3 million, $0.8 million, and $0.1 million, respectively.
As of December 28, 2014, $1.1 million of total unrecognized compensation cost related to stock options is expected to be recognized over a weighted-average period of 1.7 years.
Tax benefits resulting from tax deductions in excess of the compensation cost recognized for those options are classified as financing cash flows. Cash received from option exercises and purchases under the ESPP for the year ended December 28, 2014 was $2.0 million. The actual tax benefit realized for the tax deduction from option exercises of the share-based payment units totaled $0.1 million and $0.3 million for the fiscal years ended December 28, 2014 and December 29, 2013. We have applied the “Short-cut” method in calculating the historical windfall tax benefits. All tax short falls will be applied against this windfall before being charged to earnings.
Restricted Stock Units
We issue service-based restricted stock units with vesting periods up to five years. These awards are valued using their intrinsic value on the date of grant. The compensation expense is recognized straight-line over the vesting term.
74
Nonvested service-based restricted stock units as of December 28, 2014 and changes during the year ended December 28, 2014 were as follows:
Number of Shares | Weighted- Average Vest Date (in years) | Weighted- Average Grant Date Fair Value | |||||||
Nonvested at December 29, 2013 | 852,508 | 0.64 | $ | 17.36 | |||||
Granted | 349,040 | $ | 14.38 | ||||||
Vested | (198,353 | ) | $ | 14.73 | |||||
Forfeited | (62,338 | ) | $ | 12.81 | |||||
Nonvested at December 28, 2014 | 940,857 | 0.56 | $ | 17.11 | |||||
Vested and expected to vest at December 28, 2014 | 905,394 | 0.51 | |||||||
Vested at December 28, 2014 | 61,250 | — | |||||||
The total fair value of restricted stock awards vested during 2014 was $2.9 million as compared to $4.2 million during 2013. As of December 28, 2014, there was $3.3 million unrecognized stock-based compensation expense related to nonvested restricted stock units. That cost is expected to be recognized over a weighted-average period of 1.7 years.
Other Compensation Arrangements
During fiscal 2010, we initiated a plan in which time-vested cash unit awards were granted to eligible employees. The time-vested cash unit awards under this plan vest evenly over two or three years from the date of grant. The total amount accrued related to the plan equaled $0.9 million at December 28, 2014, of which $1.1 million, $1.2 million, and $1.2 million was expensed for the years ended December 28, 2014, December 29, 2013, and December 30, 2012, respectively. The associated liability is included in Accrued Compensation and Related Taxes in the accompanying Consolidated Balance Sheets.
Note 9. SUPPLEMENTAL CASH FLOW INFORMATION
Cash payments in 2014, 2013, and 2012 include payments for interest of $1.8 million, $16.3 million, and $8.7 million, respectively, and also includes payments for income taxes of $10.7 million, $10.8 million, and $10.8 million, respectively.
At December 28, 2014, December 29, 2013 and December 30, 2012, we accrued $1.6 million, $1.1 million and $0.5 million, respectively, of capital expenditures. These amounts were excluded from the Consolidated Statements of Cash Flows at December 28, 2014, December 29, 2013, and December 30, 2012 since they represent non-cash investing activities. Accrued capital expenditures at December 28, 2014, December 29, 2013, and December 30, 2012 are included in accounts payable and other accrued expenses on the Consolidated Balance Sheets.
Also excluded from the Consolidated Statements of Cash Flows for the years ended December 28, 2014, December 29, 2013, and December 30, 2012 are $0.2 million, $0.1 million, and $27 thousand, respectively, of new capital lease obligations and related capitalized assets.
Note 10. STOCKHOLDERS’ EQUITY
The components of accumulated other comprehensive income at December 28, 2014 and at December 29, 2013 are as follows:
(amounts in thousands) | December 28, 2014 | December 29, 2013 | |||||
Actuarial losses on pension plans, net of tax | $ | (35,036 | ) | $ | (17,773 | ) | |
Foreign currency translation adjustment | 352 | 20,018 | |||||
Total | $ | (34,684 | ) | $ | 2,245 | ||
75
Note 11. EARNINGS PER SHARE
For fiscal years 2014, 2013, and 2012, basic earnings per share are based on net earnings divided by the weighted average number of shares outstanding during the period. The following data shows the amounts used in computing earnings per share and the affect on net earnings from continuing operations and the weighted average number of shares of dilutive potential common stock:
(amounts in thousands, except per share data) | December 28, 2014 | December 29, 2013 | December 30, 2012 | ||||||||
Basic earnings (loss) from continuing operations attributable to Checkpoint Systems, Inc. available to common stockholders | $ | 10,953 | $ | (1,772 | ) | $ | (138,491 | ) | |||
Basic loss from discontinued operations, net of tax (benefit) expense of $0, ($68), and $247 | $ | — | $ | (17,156 | ) | $ | (7,959 | ) | |||
Diluted earnings (loss) from continuing operations attributable to Checkpoint Systems, Inc. available to common stockholders | $ | 10,953 | $ | (1,772 | ) | $ | (138,491 | ) | |||
Diluted loss from discontinued operations, net of tax (benefit) expense of $0, ($68), and $247 | $ | — | $ | (17,156 | ) | $ | (7,959 | ) | |||
Shares: | |||||||||||
Weighted average number of common shares outstanding | 41,683 | 41,128 | 40,476 | ||||||||
Shares issuable under deferred compensation agreements | 368 | 393 | 524 | ||||||||
Basic weighted average number of common shares outstanding | 42,051 | 41,521 | 41,000 | ||||||||
Common shares assumed upon exercise of stock options and awards | 312 | — | — | ||||||||
Unvested shares issuable under deferred compensation arrangements | 11 | — | — | ||||||||
Dilutive weighted average number of common shares outstanding | 42,374 | 41,521 | 41,000 | ||||||||
Basic earnings (loss) attributable to Checkpoint Systems, Inc. per share: | |||||||||||
Earnings (loss) from continuing operations | $ | 0.26 | $ | (0.05 | ) | $ | (3.37 | ) | |||
Loss from discontinued operations, net of tax | — | (0.41 | ) | (0.20 | ) | ||||||
Basic earnings (loss) attributable to Checkpoint Systems, Inc. per share | $ | 0.26 | $ | (0.46 | ) | $ | (3.57 | ) | |||
Diluted earnings (loss) attributable to Checkpoint Systems, Inc. per share: | |||||||||||
Earnings (loss) from continuing operations | $ | 0.26 | $ | (0.05 | ) | $ | (3.37 | ) | |||
Loss from discontinued operations, net of tax | — | (0.41 | ) | (0.20 | ) | ||||||
Diluted earnings (loss) attributable to Checkpoint Systems, Inc. per share | $ | 0.26 | $ | (0.46 | ) | $ | (3.57 | ) | |||
Anti-dilutive potential common shares are not included in our earnings per share calculation. The Long-term Incentive Plan restricted stock units were excluded from our calculation due to the performance of vesting criteria not being met.
The number of anti-dilutive potential common shares for the years ended December 28, 2014, December 29, 2013, and December 30, 2012 were as follows:
(amounts in thousands) | December 28, 2014 | December 29, 2013 | December 30, 2012 | |||||
Weighted average potential common shares associated with anti-dilutive stock options and restricted stock units excluded from the computation of diluted EPS(1) | 1,959 | 2,368 | 3,107 | |||||
(1) | Adjustments for stock options and awards of 361 shares and 61 shares and deferred compensation arrangements of 21 shares and 12 shares were anti-dilutive in fiscal 2013 and 2012, respectively. These shares were therefore excluded from the earnings per share calculation due to our net loss for the years. |
76
Note 12. INCOME TAXES
The domestic and foreign components of earnings from continuing operations before income taxes are:
(amounts in thousands) | December 28, 2014 | December 29, 2013 | December 30, 2012 | ||||||||
Domestic | $ | 14,200 | $ | (11,014 | ) | $ | (54,066 | ) | |||
Foreign | 19,974 | 12,914 | (78,949 | ) | |||||||
Total | $ | 34,174 | $ | 1,900 | $ | (133,015 | ) | ||||
Provision for income taxes:
(amounts in thousands) | December 28, 2014 | December 29, 2013 | December 30, 2012 | ||||||||
Currently payable | |||||||||||
Federal | $ | (41 | ) | $ | (2,218 | ) | $ | 2,544 | |||
State | 63 | 73 | 88 | ||||||||
Puerto Rico | 77 | (275 | ) | 354 | |||||||
Foreign | 5,746 | 9,519 | 5,949 | ||||||||
Total currently payable | 5,845 | 7,099 | 8,935 | ||||||||
Deferred | |||||||||||
Federal | 2,145 | 3,701 | (792 | ) | |||||||
State | 14 | 35 | 227 | ||||||||
Puerto Rico | — | 314 | 763 | ||||||||
Foreign | 15,217 | (7,478 | ) | (3,128 | ) | ||||||
Total deferred | 17,376 | (3,428 | ) | (2,930 | ) | ||||||
Total provision | $ | 23,221 | $ | 3,671 | $ | 6,005 | |||||
77
Deferred tax assets/liabilities at December 28, 2014 and December 29, 2013 consist of:
(amounts in thousands) | December 28, 2014 | December 29, 2013 | |||||
Inventory | $ | 3,821 | $ | 4,472 | |||
Accounts receivable | 1,093 | 2,279 | |||||
Capitalized research and development costs | 23,938 | 22,986 | |||||
Financing liability | 7,276 | 9,168 | |||||
Net operating loss and foreign tax credit carryforwards | 88,442 | 101,396 | |||||
Interest carryforward | 4,661 | 6,691 | |||||
Deferred revenue | 1,455 | 988 | |||||
Pension | 17,967 | 13,221 | |||||
Uncertain tax positions | 11,628 | 11,190 | |||||
Deferred compensation | 3,278 | 2,871 | |||||
Stock based compensation | 8,861 | 8,756 | |||||
Depreciation | 1,623 | 1,851 | |||||
Other | 4,557 | 4,847 | |||||
Valuation allowance | (148,838 | ) | (145,508 | ) | |||
Deferred tax assets | 29,762 | 45,208 | |||||
Intangibles | 10,831 | 10,756 | |||||
Unremitted earnings | 6,177 | 2,983 | |||||
Deferred tax liabilities | 17,008 | 13,739 | |||||
Net deferred tax assets | $ | 12,754 | $ | 31,469 | |||
At December 28, 2014, we had $25.5 million of net operating loss carryforwards (tax effected) in certain non-U.S. jurisdictions. Of these, $18.2 million have no expiration, and the remaining $7.3 million will expire in future years through 2034. In the U.S., there were approximately $4.8 million of federal net operating loss carryforwards certain of which are subject to IRC § 382 limitations and $5.8 million of state net operating loss carryforwards, which will expire in future years through 2034.
In the U.S., a $1.5 million, $1.1 million and $3.5 million windfall benefit on stock compensation occurred in 2013, 2011 and 2010, respectively. We have not recorded these amounts to additional capital or increased its related net operating loss carryforward due to the fact that the windfall benefits have not reduced income taxes payable. There was no windfall benefit on stock compensation in 2014 or 2012. We have adopted a “with and without” approach with regards to the utilization of windfall benefits.
At December 28, 2014, we had U.S. foreign tax credit carryforwards of $51.5 million with expiration dates ranging from 2015 to 2024.
We operate under tax holidays in other countries, which are effective through dates ranging from 2015 through 2017, and may be extended if certain additional requirements are satisfied. The tax holidays are conditional upon our meeting certain employment and investment thresholds. The impact of the tax holidays is a benefit of $0.02 and $0.01 per share for the years ended December 28, 2014 and December 29, 2013.
We evaluate our deferred income taxes quarterly to determine if valuation allowances are required or should be adjusted. ASC 740 requires that companies assess whether valuation allowances should be established against their deferred tax assets based on all available evidence, both positive and negative, using a “more likely than not” standard. In the assessment for a valuation allowance, appropriate consideration is given to all positive and negative evidence related to the realization of the deferred tax assets. This assessment considers, among other matters, the nature, frequency and severity of current and cumulative losses, forecasts of future profitability, the duration of statutory carryforward periods, our experience with loss carryforwards not expiring and tax planning alternatives. We operate and derive income from multiple lines of business across multiple jurisdictions. As each of the respective lines of business experiences changes in operating results across their geographic footprint, we may encounter losses in jurisdictions that have been historically profitable, and as a result might require
78
additional valuation allowances to be recorded against certain deferred tax asset balances. We are committed to implementing tax planning actions, when deemed appropriate, in jurisdictions that experience losses in order to realize deferred tax assets prior to their expiration. At December 28, 2014 and December 29, 2013, we had net deferred tax assets of $12.8 million and $31.5 million, respectively.
At December 28, 2014, the U.S. had a valuation allowance of $108.3 million recorded against its net deferred tax assets of $96.1 million. The amount of valuation allowance recorded was greater than the net domestic deferred tax asset after consideration of deferred tax liabilities associated with non amortizable assets such as goodwill and indefinite lived intangibles. The valuation allowance is reviewed quarterly and will be maintained until there is sufficient positive evidence to support a release. At each reporting date, we consider new evidence, both positive and negative, that could impact the future realization of deferred tax assets. We will consider a release of the valuation allowance once there is sufficient positive evidence that it is more likely than not that the deferred tax assets will be realized. Due to improvements in the U.S. operating results over the past three years, management believes a reasonable possibility exists that, in the near future, sufficient positive evidence may become available to reach a conclusion that all or some portion of the U.S. valuation allowance will no longer be needed. Any release of the valuation allowance will be recorded as a tax benefit increasing net income or other comprehensive income.
During 2012, negative evidence arose in the form of cumulative losses in the Netherlands, with net deferred assets of $0.3 million. During the quarter ending June 24, 2012, a valuation allowance was established related to certain components of the Netherlands deferred tax asset based on the determination after the above considerations that it was more likely than not that the net deferred tax assets would not be fully utilized.
During 2013, negative evidence arose in the form of cumulative losses in various jurisdictions in which we established $0.9 million of valuation allowance during the year. Offsetting this amount is a $1.0 million release in valuation allowance related to Belgium, as positive evidence arose in the form of cumulative income.
During 2014, we determined that income related to certain warehousing operations which were historically operated out of Germany would be moved to the Netherlands beginning in fiscal 2015. The impacts of this change will result in a significant decrease in forecasted future pre-taxable income in Germany. As a result, we determined that it was no longer more likely than not that the deferred tax assets in Germany would be recoverable. Accordingly, we recorded a valuation allowance in Germany of $14.0 million as of the end of the third quarter of 2014 which also resulted in a corresponding increase to tax expense. As the change also results in an increase in future taxable income in the Netherlands, we evaluated the impact of the change on the valuation allowance in the Netherlands of $2.4 million and concluded that the impact of the increased taxable income provides sufficient evidence to reverse the full amount of Netherlands valuation allowance. We also recorded a valuation allowance reversal of $0.3 million in Canada during the third quarter of 2014.
Undistributed earnings of certain foreign subsidiaries for which taxes have not been provided approximate $4.0 million as of December 28, 2014. Such undistributed earnings are considered to be indefinitely reinvested in foreign operations. A liability of approximately $0.4 million could arise if our intention to permanently reinvest such earnings were to change and amounts are distributed by such subsidiaries or if such subsidiaries are ultimately disposed.
In the fourth quarter of 2011, we changed our assertion on unremitted earnings for certain foreign subsidiaries, primarily due to pressure on our leverage ratio for debt covenants. This resulted in the repatriation of foreign earnings in order to reduce worldwide debt to the levels stipulated by our covenants and the projected future cash impact of our refined business strategy. Our assertion on unremitted earnings remains unchanged in 2014.
As of December 28, 2014, we provided a deferred tax liability of approximately $6.2 million consisting of $3.2 million of withholding taxes associated with future repatriation of earnings for certain subsidiaries and $3.0 million of taxes related to unremitted earnings. We have not provided deferred tax liabilities for temporary differences related to basis differences in investments in subsidiaries, as the investments are essentially permanent in nature, or we have concluded that no additional tax liability will arise as a result of the distribution of such earnings.
79
A reconciliation of the tax provision at the statutory U.S. Federal income tax rate with the tax provision at the effective income tax rate follows:
(amounts in thousands) | December 28, 2014 | December 29, 2013 | December 30, 2012 | ||||||||
Tax provision at the statutory federal income tax rate | $ | 11,961 | $ | 665 | $ | (46,555 | ) | ||||
Unremitted earnings | 4,281 | 60 | 690 | ||||||||
Non-deductible permanent items | 1,220 | 1,677 | 1,566 | ||||||||
Non-deductible goodwill impairment | — | — | 32,503 | ||||||||
State and local income taxes, net of federal benefit | 55 | 82 | (467 | ) | |||||||
Current year income or losses with no tax benefit or expense recognized due to valuation allowance | (8,551 | ) | (165 | ) | 38,606 | ||||||
Effect of foreign operations | 3,143 | 1,041 | (19,198 | ) | |||||||
Potential tax contingencies | (634 | ) | 160 | (1,052 | ) | ||||||
Change in valuation allowance | 11,297 | (125 | ) | 283 | |||||||
Stock based compensation | 316 | 315 | 994 | ||||||||
Other | 133 | (39 | ) | (1,365 | ) | ||||||
Tax provision at the effective tax rate | $ | 23,221 | $ | 3,671 | $ | 6,005 | |||||
Included in the effect of foreign operations is the U.S. tax impact of certain foreign income inclusions. Due to the U.S. valuation allowance, there was no related impact on overall tax expense in 2014, 2013 and 2012.
A reconciliation of the beginning and ending amount of unrecognized tax benefits is as follows:
(amounts in thousands) | December 28, 2014 | December 29, 2013 | December 30, 2012 | ||||||||
Gross unrecognized tax benefits at beginning of year | $ | 26,592 | $ | 24,436 | $ | 22,543 | |||||
Increases in tax positions for prior years | 585 | 910 | 225 | ||||||||
Decreases in tax positions for prior years | — | (1,083 | ) | (1,068 | ) | ||||||
Increases in tax positions for current year | 1,164 | 4,003 | 5,209 | ||||||||
Settlements | — | — | (683 | ) | |||||||
Acquisition reserves | — | — | 1,166 | ||||||||
Lapse in statute of limitations | (2,442 | ) | (1,674 | ) | (2,956 | ) | |||||
Gross unrecognized tax benefits at end of year | $ | 25,899 | $ | 26,592 | $ | 24,436 | |||||
As of December 28, 2014 and December 29, 2013, $16.1 million and $19.6 million, respectively, of our unrecognized tax benefits, penalties, and interest were recorded as a component of other long term liabilities on the consolidated balance sheet.
The total amount of gross unrecognized tax benefits that, if recognized, would affect the effective tax rate was $16.4 million and $18.1 million at December 28, 2014 and December 29, 2013, respectively. Penalties and tax-related interest expense are reported as a component of income tax expense. During fiscal years ended December 28, 2014, December 29, 2013 and December 30, 2012, we recognized interest and penalties of $(0.1) million, $0.1 million, and $(0.8) million, respectively, in the statement of operations. At December 28, 2014 and December 29, 2013, we have accrued interest and penalties related to unrecognized tax benefits of $4.3 million and $4.4 million, respectively.
We file income tax returns in the U.S. and in various states, local, and foreign jurisdictions. We are routinely examined by tax authorities in these jurisdictions. It is possible that these examinations may be resolved within the next twelve months. Due to the potential for resolution of Federal, state and foreign examinations, and the expiration of various statutes of limitation, it is reasonably possible that the gross unrecognized tax benefits balance may change within the next twelve months by a range of $3.7 million to $11.3 million.
We are currently under audit in the following major jurisdictions: Germany - 2006 to 2009, Finland - 2005 to 2009, India - 2010 to 2013, and Canada - 2011 to 2014. The following major jurisdictions have tax years that remain subject to examination:
80
Germany - 2006 to 2014, United States - 2011 to 2014, China - 2011 to 2014 and Hong Kong - 2008 to 2014. Our tax returns for open years in all jurisdictions are subject to changes upon examination.
Note 13. EMPLOYEE BENEFIT PLANS
Under our defined contribution savings plans, eligible employees may make basic (up to 6% of an employee’s earnings) and supplemental contributions. We match in cash 50% of the participant’s basic contributions. Company contributions vest to participants in increasing percentages over one to five years of service. Our contributions under the plans approximated $1.1 million, $1.1 million, and $1.4 million, in 2014, 2013, and 2012, respectively.
Generally, all employees in the U.S. may participate in our U.S. Savings Plan. All full-time employees of the Canada subsidiary who have completed three months of service may participate in our Registered Retirement Savings Plan.
We maintain a 423(b) Employee Stock Purchase Plan (ESPP). This plan replaces the non-qualified Employee Stock Purchase Plan. Under the provisions of the 423(b) plan, eligible employees may contribute from 1% to 25% of their base compensation to purchase shares of our common stock at 85% of the fair market value on the offering date or the exercise date of the offering period, whichever is lower.
On May 31, 2012, at the 2012 Annual Meeting of Shareholders of Checkpoint, our shareholders amended the ESPP in order to increase the number of shares of the Company’s common stock reserved for issuance under the ESPP by 400,000 shares to an aggregate of 1,050,000 shares. Our expense for this plan in fiscal 2014, 2013 and 2012 was $0.6 million, $0.4 million, and $0.4 million, respectively. As of December 28, 2014, there were 107,987 shares authorized and available to be issued. During fiscal year 2014, 123,210 shares were issued under this plan as compared to 169,143 shares in 2013 and 139,135 shares in 2012.
We maintain deferred compensation plans for executives and non-employee directors. The executive deferred compensation plan allows certain executives to defer portions of their salary and bonus (up to 50% and 100%, respectively) into a deferred stock account. All deferrals in this plan are matched 25% by the Company. The match vests in thirds at each calendar year end for three years following the match. For executives over the age of 55 years old, the matching contribution vests immediately. The settlement of this deferred stock account is required by the plan to be made only in Company common stock. The deferral shares held in the deferred compensation plan are considered outstanding for purposes of calculating basic and diluted earnings per share. The unvested match is considered in the calculation of diluted earnings per share. Our match into the deferred stock account under the executive plan for fiscal years 2014, 2013, and 2012 were approximately $0.1 million, $0.1 million, and $0.2 million, respectively. The match will be expensed ratably over a three year vesting period for executives under 55 years old and immediate for those older than 55 years.
The director deferred compensation plan allows non-employee directors to defer their compensation into a deferred stock account. All deferrals in this plan are matched 25% by the Company. The match vests immediately. The settlement of this deferred stock account is required by the plan to be made only in Company common stock. The deferral shares held in the deferred compensation plan are considered outstanding for purposes of calculating basic and diluted earnings per share. Our match into the deferred stock account under the director’s plan approximated $69 thousand, $56 thousand, and $24 thousand for fiscal years 2014, 2013, and 2012, respectively.
Pension Plans
We maintain several defined benefit pension plans, principally in Europe. The plans covered approximately 5% of the total workforce at December 28, 2014. The benefits accrue according to the length of service, age, and remuneration of the employee. We recognize the funded status of our defined benefit postretirement plans in our consolidated balance sheet.
81
The amounts recognized in accumulated other comprehensive income at December 28, 2014, and December 29, 2013 consist of:
(amounts in thousands) | December 28, 2014 | December 29, 2013 | |||||
Prior service costs | $ | 421 | $ | 172 | |||
Actuarial losses | 42,718 | 26,452 | |||||
Total | 43,139 | 26,624 | |||||
Deferred tax | (8,103 | ) | (8,851 | ) | |||
Net | $ | 35,036 | $ | 17,773 | |||
The amounts included in accumulated other comprehensive income at December 28, 2014 and expected to be recognized in net periodic pension cost during the year ending December 27, 2015 is as follows:
(amounts in thousands) | December 27, 2015 | ||
Prior service costs | $ | 28 | |
Actuarial loss | 3,230 | ||
Total | $ | 3,258 | |
We expect to make contributions of $4.7 million during the year ending December 27, 2015.
The pension plans included the following net cost components:
(amounts in thousands) | December 28, 2014 | December 29, 2013 | December 30, 2012 | ||||||||
Service cost | $ | 1,097 | $ | 1,081 | $ | 851 | |||||
Interest cost | 3,555 | 3,537 | 3,874 | ||||||||
Expected return on plan assets | (1 | ) | 103 | 41 | |||||||
Amortization of actuarial loss | 1,495 | 1,567 | 224 | ||||||||
Amortization of transition obligation | — | — | 57 | ||||||||
Amortization of prior service costs | 12 | 2 | 2 | ||||||||
Net periodic pension cost | 6,158 | 6,290 | 5,049 | ||||||||
Curtailment loss | — | — | 72 | ||||||||
Total pension expense | $ | 6,158 | $ | 6,290 | $ | 5,121 | |||||
82
The tables below set forth the funded status of our plans and amounts recognized in the accompanying Consolidated Balance Sheets.
(amounts in thousands) | December 28, 2014 | December 29, 2013 | |||||
Change in benefit obligation | |||||||
Net benefit obligation at beginning of year | $ | 107,029 | $ | 104,364 | |||
Service cost | 1,097 | 1,081 | |||||
Interest cost | 3,555 | 3,537 | |||||
Actuarial loss (gain) | 23,975 | (1,538 | ) | ||||
Gross benefits paid | (4,743 | ) | (4,773 | ) | |||
Plan amendments | 306 | 158 | |||||
Foreign currency exchange rate changes | (14,270 | ) | 4,200 | ||||
Net benefit obligation at end of year | $ | 116,949 | $ | 107,029 | |||
Change in plan assets | |||||||
Fair value of plan assets at beginning of year | $ | 2,339 | $ | 1,488 | |||
Actual return on assets | 1,422 | 330 | |||||
Employer contributions | 4,942 | 5,206 | |||||
Gross benefits paid | (4,743 | ) | (4,773 | ) | |||
Foreign currency exchange rate changes | (403 | ) | 88 | ||||
Fair value of plan assets at end of year | $ | 3,557 | $ | 2,339 | |||
Reconciliation of funded status | |||||||
Funded status at end of year | $ | (113,392 | ) | $ | (104,690 | ) | |
(amounts in thousands) | December 28, 2014 | December 29, 2013 | |||||
Amounts recognized in accrued benefit consist of: | |||||||
Accrued pensions — current | $ | 4,472 | $ | 5,013 | |||
Accrued pensions | 108,920 | 99,677 | |||||
Net amount recognized at end of year | $ | 113,392 | $ | 104,690 | |||
Other comprehensive income attributable to prior service cost arising during year | $ | 306 | $ | 158 | |||
Accumulated benefit obligation at end of year | $ | 110,204 | $ | 101,341 | |||
The following table sets forth additional fiscal year-ended information for pension plans for which the accumulated benefit is in excess of plan assets:
(amounts in thousands) | December 28, 2014 | December 29, 2013 | |||||
Projected benefit obligation | $ | 116,949 | $ | 107,029 | |||
Accumulated benefit obligation | $ | 110,204 | $ | 101,341 | |||
Fair value of plan assets | $ | 3,557 | $ | 2,339 | |||
83
The weighted average rate assumptions used in determining pension costs and the projected benefit obligation are as follows:
December 28, 2014 | December 29, 2013 | December 30, 2012 | ||||||
Weighted average assumptions for year-end benefit obligations: | ||||||||
Discount rate(1) | 2.01 | % | 3.52 | % | ||||
Expected rate of increase in future compensation levels | 2.52 | % | 2.53 | % | ||||
Weighted average assumptions for net periodic benefit cost development: | ||||||||
Discount rate(1) | 3.52 | % | 3.53 | % | 4.77 | % | ||
Expected rate of return on plan assets | 3.90 | % | 4.50 | % | 5.25 | % | ||
Expected rate of increase in future compensation levels | 2.53 | % | 2.52 | % | 2.52 | % | ||
Measurement Date: | December 31, 2014 | December 31, 2013 | December 31, 2012 | |||||
(1) | Represents the weighted average rate for all pension plans. |
In developing the discount rate assumption for each country, we use a yield curve approach. The yield curve is based on the AA rated bonds underlying the Barclays Capital corporate bond index. The weighted average discount rate was 2.01% in 2014 and 3.52% in 2013. We calculate the weighted average duration of the plans in each country, then select the discount rate from the appropriate yield curve which best corresponds to the plans' liability profile.
The majority of our pension plans are unfunded plans. The expected rate of the return was developed using the historical rate of returns of the foreign government bonds currently held. This resulted in the selection of the 3.90% long-term rate of return on asset assumption. For funded plans, all assets are held in foreign government bonds.
The benefits expected to be paid over the next five years and the five aggregated years after:
(amounts in thousands) | |||
2015 | $ | 4,474 | |
2016 | $ | 4,455 | |
2017 | $ | 4,581 | |
2018 | $ | 4,655 | |
2019 | $ | 4,698 | |
2020 through 2024 | $ | 24,954 | |
The following table provides a summary of the fair value of our pension plan assets at December 28, 2014 utilizing the fair value hierarchy discussed in Note 14 of the Consolidated Financial Statements:
(amounts in thousands) | Total Fair Value Measurement December 28, 2014 | Quoted Prices In Active Markets for Identical Assets (Level 1) | Significant Other Observable Inputs (Level 2) | Significant Unobservable Inputs (Level 3) | |||||||||||
Global insurance assets | $ | 3,557 | $ | — | $ | — | $ | 3,557 | |||||||
All investments consist of fixed-income global insurance. The investment objective of fixed-income funds is to maximize investment return while preserving investment principal.
84
Additional information pertaining to the changes in the fair value of the pension plan assets classified as Level 3 for the year ended December 28, 2014 is presented below:
(amounts in thousands) | Balance as of December 29, 2013 | Actual Return on Plan Assets, Relating to Assets Still Held at the Reporting Date | Actual Return on Plan Assets, Relating to Assets Sold During the Period | Purchases, Sales and Settlements | Transfer into / (out of) Level 3 | Change due to Exchange Rate Changes | Balance as of December 28, 2014 | ||||||||||||||||||||
Asset Category | |||||||||||||||||||||||||||
Global insurance assets | $ | 2,339 | $ | 1,423 | $ | — | $ | 261 | $ | (62 | ) | $ | (404 | ) | $ | 3,557 | |||||||||||
Total Level 3 Assets | $ | 2,339 | $ | 1,423 | $ | — | $ | 261 | $ | (62 | ) | $ | (404 | ) | $ | 3,557 | |||||||||||
Note 14. FAIR VALUE MEASUREMENT, FINANCIAL INSTRUMENTS AND RISK MANAGEMENT
Fair Value Measurement
We utilize the market approach to measure fair value for our financial assets and liabilities. The market approach uses prices and other relevant information generated by market transactions involving identical or comparable assets or liabilities.
The fair value hierarchy is intended to increase consistency and comparability in fair value measurements and related disclosures. The fair value hierarchy is based on inputs to valuation techniques that are used to measure fair value that are either observable or unobservable. Observable inputs reflect assumptions market participants would use in pricing an asset or liability based on market data obtained from independent sources while unobservable inputs reflect a reporting entity’s pricing based upon their own market assumptions. The fair value hierarchy consists of the following three levels:
Level 1 | Inputs are quoted prices in active markets for identical assets or liabilities. | |
Level 2 | Inputs are quoted prices for similar assets or liabilities in an active market, quoted prices for identical or similar assets or liabilities in markets that are not active, inputs other than quoted prices that are observable and market-corroborated inputs which are derived principally from or corroborated by observable market data. | |
Level 3 | Inputs are derived from valuation techniques in which one or more significant inputs or value drivers are unobservable. | |
Because our derivatives are not listed on an exchange, we values these instruments using a valuation model with pricing inputs that are observable in the market or that can be derived principally from or corroborated by observable market data. Our methodology also incorporates the impact of both the Company’s and the counterparty’s credit standing.
The following tables represent our assets and liabilities measured at fair value on a recurring basis as of December 28, 2014 and the basis for that measurement:
(amounts in thousands) | Total Fair Value Measurement December 28, 2014 | Quoted Prices In Active Markets for Identical Assets (Level 1) | Significant Other Observable Inputs (Level 2) | Significant Unobservable Inputs (Level 3) | |||||||||||
Foreign currency forward exchange contracts | $ | 55 | $ | — | $ | 55 | $ | — | |||||||
Total assets | $ | 55 | $ | — | $ | 55 | $ | — | |||||||
Foreign currency forward exchange contracts | $ | 23 | $ | — | $ | 23 | $ | — | |||||||
Total liabilities | $ | 23 | $ | — | $ | 23 | $ | — | |||||||
85
The following tables represent our assets and liabilities measured at fair value on a recurring basis as of December 29, 2013 and the basis for that measurement:
(amounts in thousands) | Total Fair Value Measurement December 29, 2013 | Quoted Prices In Active Markets for Identical Assets (Level 1) | Significant Other Observable Inputs (Level 2) | Significant Unobservable Inputs (Level 3) | |||||||||||
Foreign currency forward exchange contracts | $ | — | $ | — | $ | — | $ | — | |||||||
Total assets | $ | — | $ | — | $ | — | $ | — | |||||||
Foreign currency forward exchange contracts | $ | 18 | $ | — | $ | 18 | $ | — | |||||||
Total liabilities | $ | 18 | $ | — | $ | 18 | $ | — | |||||||
The following table provides a summary of the activity associated with all of our designated cash flow hedges (foreign currency) reflected in accumulated other comprehensive income for the years ended December 28, 2014 and December 29, 2013:
(amounts in thousands) | December 28, 2014 | December 29, 2013 | |||||
Beginning balance, net of tax | $ | — | $ | 21 | |||
Changes in fair value gain, net of tax | — | — | |||||
Reclass to earnings, net of tax | — | (21 | ) | ||||
Ending balance, net of tax | $ | — | $ | — | |||
We believe that the fair values of our current assets and current liabilities (cash, accounts receivable, accounts payable, and other current liabilities) approximate their reported carrying amounts. The carrying values and the estimated fair values of non-current financial assets and liabilities that qualify as financial instruments and are not measured at fair value on a recurring basis at December 28, 2014 and December 29, 2013 are summarized in the following table:
December 28, 2014 | December 29, 2013 | ||||||||||||||
(amounts in thousands) | Carrying Amount | Estimated Fair Value | Carrying Amount | Estimated Fair Value | |||||||||||
Long-term debt (including current maturities and excluding capital leases and factoring)(1) | |||||||||||||||
2013 Senior secured credit facility | $ | 65,000 | $ | 65,000 | $ | 90,000 | $ | 90,000 | |||||||
(1) | The carrying amounts are reported on the balance sheet under the indicated captions. |
Long-term debt is carried at the original offering price, less any payments of principal. The carrying amount of the Senior Secured Credit Facility approximates fair value due to the variable rate nature of its interest at current market rates. The related fair value measurement has generally been classified as Level 2.
Nonrecurring Fair Value Measurements
In 2014, as a result of our annual impairment test, we wrote the OAT indefinite-lived trade name down to its impaired fair value of $1.1 million. This resulted in a $0.9 million impairment charge that was recorded in asset impairment in the Merchandise Availability Solutions segment on the Consolidated Statement of Operations. The nonrecurring fair value measurement was developed using significant unobservable inputs (Level 3). The fair value was computed using the relief from royalty income valuation approach. Refer to Note 5 of the Consolidated Financial Statements.
In the fourth quarter of 2013, through the budgeting process, working capital prioritization activities, and other strategic direction reviews, a portion of our ERP system implementation costs with a carrying amount of $4.7 million was written down to its implied fair value of zero. This resulted in an impairment charge of $4.7 million that was recorded in asset impairment expense in the on the Consolidated Statement of Operations. The nonrecurring fair value measurement was developed using
86
significant unobservable inputs (Level 3). The fair value was computed using a discounted cash flow valuation methodology. Refer to Note 5 of the Consolidated Financial Statements.
Severance costs included in our restructuring charges are calculated using internal estimates and are therefore classified as Level 3 in the fair value hierarchy. Refer to Note 15 of the Consolidated Financial Statements.
In connection with our restructuring plans, we have recorded impairment losses in restructuring expense during the year ended December 28, 2014 of $0.2 million due to the impairment of certain long-lived assets for which the carrying value of those assets may not be recoverable based upon our estimated cash flows. Assets with carrying amounts of $0.2 million were written down to their fair values of $21 thousand. Given that the impairment losses were determined using internal estimates of future cash flows or upon non-identical assets using significant unobservable inputs, we have classified the remaining fair value of long-lived assets as Level 3 in the fair value hierarchy. Refer to Note 15 of the Consolidated Financial Statements.
Financial Instruments and Risk Management
We manufacture products in the U.S., Europe, and the Asia Pacific region for both the local marketplace and for export to our foreign subsidiaries. The foreign subsidiaries, in turn, sell these products to customers in their respective geographic areas of operation, generally in local currencies. This method of sale and resale gives rise to the risk of gains or losses as a result of currency exchange rate fluctuations on inter-company receivables and payables. Additionally, the sourcing of product in one currency and the sales of product in a different currency can cause gross margin fluctuations due to changes in currency exchange rates.
Our major market risk exposures are movements in foreign currency and interest rates. We have historically not used financial instruments to minimize our exposure to currency fluctuations on our net investments in and cash flows derived from our foreign subsidiaries. We have used third-party borrowings in foreign currencies to hedge a portion of our net investments in and cash flows derived from our foreign subsidiaries. A reduction in our third party foreign currency borrowings will result in an increase of foreign currency fluctuations on our net investments in and cash flows derived from our foreign subsidiaries.
We enter into forward exchange contracts to reduce the risks of currency fluctuations on short-term inter-company receivables and payables. These contracts are entered into with major financial institutions, thereby minimizing the risk of credit loss. We will consider using interest rate derivatives to manage interest rate risks when there is a disproportionate ratio of floating and fixed-rate debt. We do not hold or issue derivative financial instruments for speculative or trading purposes. We are subject to other foreign exchange market risk exposure resulting from anticipated non-financial instrument foreign currency cash flows which are difficult to reasonably predict, and have therefore not been included in the table of fair values. All listed items described are non-trading.
87
The following table presents the fair values of derivative instruments included within the Consolidated Balance Sheets as of December 28, 2014 and December 29, 2013:
December 28, 2014 | December 29, 2013 | ||||||||||||||||||||||
Asset Derivatives | Liability Derivatives | Asset Derivatives | Liability Derivatives | ||||||||||||||||||||
(amounts in thousands) | Balance Sheet Location | Fair Value | Balance Sheet Location | Fair Value | Balance Sheet Location | Fair Value | Balance Sheet Location | Fair Value | |||||||||||||||
Derivatives designated as hedging instruments | |||||||||||||||||||||||
Foreign currency revenue forecast contracts | Other current assets | $ | — | Other current liabilities | $ | — | Other current assets | $ | — | Other current liabilities | $ | — | |||||||||||
Total derivatives designated as hedging instruments | — | — | — | — | |||||||||||||||||||
Derivatives not designated as hedging instruments | |||||||||||||||||||||||
Foreign currency forward exchange contracts | Other current assets | 55 | Other current liabilities | 23 | Other current assets | — | Other current liabilities | 18 | |||||||||||||||
Total derivatives not designated as hedging instruments | 55 | 23 | — | 18 | |||||||||||||||||||
Total derivatives | $ | 55 | $ | 23 | $ | — | $ | 18 | |||||||||||||||
The following tables present the amounts affecting the Consolidated Statement of Operations for the years ended December 28, 2014, December 29, 2013, and December 30, 2012:
December 28, 2014 | |||||||||||||
(amounts in thousands) | Amount of Gain (Loss) Recognized in Other Comprehensive Income on Derivatives | Location of Gain (Loss) Reclassified From Accumulated Other Comprehensive Income into Income | Amount of Gain (Loss) Reclassified From Accumulated Other Comprehensive Income into Income | Amount of Forward Points Recognized in Other Gain (Loss), net | |||||||||
Derivatives designated as cash flow hedges | |||||||||||||
Foreign currency revenue forecast contracts | $ | — | Cost of sales | $ | — | $ | — | ||||||
December 29, 2013 | |||||||||||||
(amounts in thousands) | Amount of Gain (Loss) Recognized in Other Comprehensive Income on Derivatives | Location of Gain (Loss) Reclassified From Accumulated Other Comprehensive Income into Income | Amount of Gain (Loss) Reclassified From Accumulated Other Comprehensive Income into Income | Amount of Forward Points Recognized in Other Gain (Loss), net | |||||||||
Derivatives designated as cash flow hedges | |||||||||||||
Foreign currency revenue forecast contracts | $ | — | Cost of sales | $ | (161 | ) | $ | 11 | |||||
88
December 30, 2012 | |||||||||||||
(amounts in thousands) | Amount of Gain (Loss) Recognized in Other Comprehensive Income on Derivatives | Location of Gain (Loss) Reclassified From Accumulated Other Comprehensive Income into Income | Amount of Gain (Loss) Reclassified From Accumulated Other Comprehensive Income into Income | Amount of Forward Points Recognized in Other Gain (Loss), net | |||||||||
Derivatives designated as cash flow hedges | |||||||||||||
Foreign currency revenue forecast contracts | $ | 507 | Cost of sales | $ | (1,994 | ) | $ | 102 | |||||
December 28, 2014 | December 29, 2013 | December 30, 2012 | |||||||||||||||
(amounts in thousands) | Amount of Gain (Loss) Recognized in Income on Derivatives | Location of Gain (Loss) Recognized in Income on Derivatives | Amount of Gain (Loss) Recognized in Income on Derivatives | Location of Gain(Loss) Recognized in Income on Derivatives | Amount of Gain (Loss) Recognized in Income on Derivatives | Location of Gain(Loss) Recognized in Income on Derivatives | |||||||||||
Derivatives not designated as hedging instruments | |||||||||||||||||
Foreign exchange forwards and options | $ | 425 | Other gain (loss), net | $ | (404 | ) | Other gain (loss), net | $ | 261 | Other gain (loss), net | |||||||
We selectively purchase currency forward exchange contracts to reduce the risks of currency fluctuations on short-term inter-company receivables and payables. These contracts guarantee a predetermined exchange rate at the time the contract is purchased. This allows us to shift the effect of positive or negative currency fluctuations to a third party. Transaction gains or losses resulting from these contracts are recognized at the end of each reporting period. We use the fair value method of accounting, recording realized and unrealized gains and losses on these contracts. These gains and losses are included in other gain (loss), net on our Consolidated Statements of Operations. As of December 28, 2014, we had currency forward exchange contracts with notional amounts totaling approximately $3.6 million. The fair values of the forward exchange contracts were reflected as a $55 thousand asset and a $23 thousand liability included in other current assets and other current liabilities in the accompanying Consolidated Balance Sheets. The contracts are in the various local currencies covering primarily our operations in the U.S. and Western Europe. Historically, we have not purchased currency forward exchange contracts where it is not economically efficient, specifically for our operations in South America and Asia, with the exception of Japan.
Beginning in the second quarter of 2008, we entered into various foreign currency contracts to reduce our exposure to forecasted Euro-denominated inter-company revenues. These contracts were designated as cash flow hedges. As of December 28, 2014, there were no outstanding foreign currency revenue forecast contracts. The purpose of these cash flow hedges is to eliminate the currency risk associated with Euro-denominated forecasted inter-company revenues due to changes in exchange rates. These cash flow hedging instruments are marked to market and the changes are recorded in other comprehensive income. Amounts recorded in other comprehensive income are recognized in cost of goods sold as the inventory is sold to external parties. Any hedge ineffectiveness is charged to other gain (loss), net on our Consolidated Statements of Operations. As of December 28, 2014, there were no unrealized gains or losses recorded in other comprehensive income. During the year ended December 28, 2014, no benefit related to these foreign currency hedges was recorded to cost of goods sold as the inventory was sold to external parties. We recognized no hedge ineffectiveness during the year ended December 28, 2014.
Aggregate foreign currency transaction losses in 2014, 2013, and 2012, were $1.0 million, $4.1 million, and $1.7 million, respectively, and are included in other gain (loss), net on the Consolidated Statements of Operations.
Additionally, there were no deferrals of gains or losses on currency forward exchange contracts at December 28, 2014.
Note 15. PROVISION FOR RESTRUCTURING
During September 2014, we initiated the Profit Enhancement Plan focused on increasing profitability through strategic headcount reductions and the streamlining of manufacturing processes. The projects included in this plan are currently underway, with final headcount reductions expected to be recognized by the fourth quarter of 2015. Total costs of the plan are $5.3 million through the end of the fourth quarter of 2014.
89
During September 2011, we initiated the Global Restructuring Plan focused on further reducing our overall operating expenses by including manufacturing and other cost reduction initiatives, such as consolidating certain manufacturing facilities and administrative functions to improve efficiencies. This plan was further expanded in the first quarter of 2012 and again during the second quarter of 2012 to include Project LEAN. All projects in our Global Restructuring Plan including Project LEAN have been substantially completed.
The Global Restructuring Plan including Project LEAN and the SG&A Restructuring Plan have impacted over 2,600 existing employees since inception. Total costs of the projects are $78 million through the end of the fourth quarter of 2014, with $60 million in total costs for the Global Restructuring Plan and $18 million of costs incurred for the SG&A Restructuring Plan.
Restructuring expense for the years ended December 28, 2014, December 29, 2013, and December 30, 2012 was as follows:
(amounts in thousands) | December 28, 2014 | December 29, 2013 | December 30, 2012 | ||||||||
Profit Enhancement Plan | |||||||||||
Severance and other employee-related charges | $ | 5,181 | $ | — | $ | — | |||||
Other exit costs | 101 | — | — | ||||||||
Global Restructuring Plan (including LEAN) | |||||||||||
Severance and other employee-related charges | 976 | 7,421 | 16,945 | ||||||||
Asset impairments | 172 | 1,210 | 6,506 | ||||||||
Other exit costs | 231 | 2,389 | 5,084 | ||||||||
SG&A Restructuring Plan | |||||||||||
Severance and other employee-related charges | (7 | ) | (222 | ) | (86 | ) | |||||
Other exit costs | — | 68 | 64 | ||||||||
Manufacturing Restructuring Plan | |||||||||||
Other exit costs | — | — | (75 | ) | |||||||
Total | $ | 6,654 | $ | 10,866 | $ | 28,438 | |||||
Restructuring accrual activity for the year ended December 28, 2014 was as follows:
(amounts in thousands) | |||||||||||||||||||||||
Fiscal 2014 | Accrual at Beginning of Year | Charged to Earnings | Charge Reversed to Earnings | Cash Payments | Exchange Rate Changes | Accrual at December 28, 2014 | |||||||||||||||||
Profit Enhancement Plan | |||||||||||||||||||||||
Severance and other employee-related charges(2) | $ | — | $ | 5,233 | $ | (52 | ) | $ | (770 | ) | $ | (329 | ) | $ | 4,082 | ||||||||
Other exit costs(1) | — | 101 | — | (101 | ) | — | — | ||||||||||||||||
Global Restructuring Plan (including LEAN) | |||||||||||||||||||||||
Severance and other employee-related charges(2) | 7,901 | 2,917 | (1,941 | ) | (6,434 | ) | (393 | ) | 2,050 | ||||||||||||||
Other exit costs(1) | 66 | 231 | — | (285 | ) | 3 | 15 | ||||||||||||||||
SG&A Restructuring Plan | |||||||||||||||||||||||
Severance and other employee-related charges(2) | 208 | 42 | (49 | ) | (67 | ) | (26 | ) | 108 | ||||||||||||||
Total | $ | 8,175 | $ | 8,524 | $ | (2,042 | ) | $ | (7,657 | ) | $ | (745 | ) | $ | 6,255 | ||||||||
(1) | During 2014, there was a net charge to earnings of $0.3 million primarily due to outplacement and legal costs in connection with the restructuring plan. |
(2) | During 2014, there was a severance charge reversed to earnings of $2.0 million primarily due to eliminations of individuals from the plans, replacements of individuals in the plans with other individuals, resignations, and other final accrual adjustments. |
90
Restructuring accrual activity for the year ended December 29, 2013 was as follows:
(amounts in thousands) | |||||||||||||||||||||||
Fiscal 2013 | Accrual at Beginning of Year | Charged to Earnings | Charge Reversed to Earnings | Cash Payments | Exchange Rate Changes | Accrual at December 29, 2013 | |||||||||||||||||
Global Restructuring Plan (including LEAN) | |||||||||||||||||||||||
Severance and other employee-related charges(3) | $ | 7,752 | $ | 9,799 | $ | (2,378 | ) | $ | (7,469 | ) | $ | 197 | $ | 7,901 | |||||||||
Other exit costs(1) | 460 | 2,389 | — | (2,763 | ) | (20 | ) | 66 | |||||||||||||||
SG&A Restructuring Plan | |||||||||||||||||||||||
Severance and other employee-related charges(3) | 1,206 | 104 | (326 | ) | (780 | ) | 4 | 208 | |||||||||||||||
Other exit costs(2) | 161 | 68 | — | (228 | ) | (1 | ) | — | |||||||||||||||
Total | $ | 9,579 | $ | 12,360 | $ | (2,704 | ) | $ | (11,240 | ) | $ | 180 | $ | 8,175 | |||||||||
(1) | During 2013, there was a net charge to earnings of $2.4 million primarily due to lease termination costs, inventory and equipment moving costs, restructuring agent costs, legal costs, and gains/losses on sale of assets in connection with the restructuring plan. |
(2) | During 2013, there was a net charge to earnings of $0.1 million primarily due to lease termination costs in connection with the restructuring plan. |
(3) | During 2013, there was a severance charge reversed to earnings of $2.7 million primarily due to eliminations of individuals from the plans, replacements of individuals in the plans with other individuals, resignations, and other final accrual adjustments. The eliminations and replacements were primarily the result of our change in management and strategic vision in 2013. |
Profit Enhancement Plan
During September 2014, we initiated the Profit Enhancement Plan focused on increasing profitability through strategic headcount reductions and streamlining manufacturing processes. The first phase of this plan was implemented in the third quarter of 2014 with the remaining phases of the plan, including headcount reductions, expected to be substantially completed by the fourth quarter of 2015. As of December 28, 2014, the net charge to earnings of $5.3 million represents the current year activity related to the Profit Enhancement Plan.
Global Restructuring Plan (including LEAN)
During September 2011, we initiated the Global Restructuring Plan focused on further reducing our overall operating expenses by including manufacturing and other cost reduction initiatives, such as consolidating certain manufacturing facilities and administrative functions to improve efficiencies. This plan was further expanded in the first quarter of 2012 and again during the second quarter of 2012 to include Project LEAN. The first phase of this plan was implemented in the third quarter of 2011 with the remaining phases of the plan, including final headcount terminations, substantially completed by the fourth quarter of 2014.
As of December 28, 2014, the net charge to earnings of $1.4 million represents the current year activity related to the Global Restructuring Plan including Project LEAN. Total costs related to the plan of $60.3 million have been incurred through December 28, 2014. The total number of employees planned to be affected by the Global Restructuring Plan including Project LEAN since inception is approximately 2,250, of which 2,244 have been terminated. Termination benefits are planned to be paid one month to 24 months after termination.
SG&A Restructuring Plan
During 2009, we initiated the SG&A Restructuring Plan focused on reducing our overall operating expenses by consolidating certain administrative functions to improve efficiencies. The first phase of this plan was implemented in the fourth quarter of 2009 with the remaining phases of the plan substantially completed by the end of the first quarter of 2012.
As of December 28, 2014, the net charge reversed to earnings of $7 thousand represents the current year activity related to the SG&A Restructuring Plan. Total costs related to the plan of $18 million have been incurred through December 28, 2014. The total number of employees affected by the SG&A Restructuring Plan was 369, all of which have been terminated. Termination benefits are planned to be paid one month to 24 months after termination.
91
Note 16. COMMITMENTS AND CONTINGENCIES
We lease certain production facilities, offices, distribution centers, and equipment. Rental expense for all operating leases approximated $9.8 million, $10.9 million, and $15.4 million, in 2014, 2013, and 2012, respectively.
Future minimum payments for operating leases and capital leases having non-cancelable terms in excess of one year at December 28, 2014 are:
(amounts in thousands) | Capital Leases | Operating Leases | Total | ||||||||
2015 | $ | 100 | $ | 8,639 | $ | 8,739 | |||||
2016 | 104 | 6,011 | 6,115 | ||||||||
2017 | 50 | 3,173 | 3,223 | ||||||||
2018 | 13 | 1,658 | 1,671 | ||||||||
2019 | 2 | 844 | 846 | ||||||||
Thereafter | — | 740 | 740 | ||||||||
Total minimum lease payments | $ | 269 | $ | 21,065 | $ | 21,334 | |||||
Less: amounts representing interest | 20 | ||||||||||
Present value of minimum lease payments | $ | 249 | |||||||||
Contingencies
We are involved in certain legal and regulatory actions, all of which have arisen in the ordinary course of business, except for the matters described in the following paragraphs.
Additionally, management believes that the ultimate resolution of such matters is unlikely to have a material adverse effect on our consolidated results of operations and/or financial condition, except as described below.
Matters related to All-Tag Security S.A. and All-Tag Security Americas, Inc.
We originally filed suit on May 1, 2001, alleging that the disposable, deactivatable radio frequency security tag manufactured by All-Tag Security S.A. and All-Tag Security Americas, Inc.'s (jointly All-Tag) and sold by Sensormatic Electronics Corporation (Sensormatic) infringed on a U.S. Patent No. 4,876,555 (the 555 Patent) owned by us. On April 22, 2004, the United States District Court for the Eastern District of Pennsylvania (the Pennsylvania Court) granted summary judgment to defendants All-Tag and Sensormatic on the ground that the 555 Patent was invalid for incorrect inventorship. We appealed this decision. On June 20, 2005, we won an appeal when the United States Court of Appeals for the Federal Circuit (the Appellate Court) reversed the grant of summary judgment and remanded the case to the Pennsylvania Court for further proceedings. On January 29, 2007 the case went to trial, and on February 13, 2007, a jury found in favor of the defendants on infringement, the validity of the 555 Patent and the enforceability of the 555 Patent. On June 20, 2008, the Pennsylvania Court entered judgment in favor of defendants based on the jury's infringement and enforceability findings. On February 10, 2009, the Pennsylvania Court granted defendants' motions for attorneys' fees designating the case as an exceptional case and awarding an unspecified portion of defendants' attorneys' fees under 35 U.S.C. § 285. Defendants sought approximately $5.7 million plus interest. We recognized this amount during the fourth fiscal quarter ended December 28, 2008 in litigation settlements on the Consolidated Statement of Operations. On March 6, 2009, we filed objections to the defendants' bill of attorneys' fees. On November 2, 2011, the Pennsylvania Court finalized the decision to order us to pay the attorneys' fees and costs of the defendants in the amount of $6.6 million. The additional amount of $0.9 million was recorded in the fourth quarter ended December 25, 2011 in the Consolidated Statement of Operations. On November 15, 2011, we filed objections to and appealed the Pennsylvania Court's award of attorneys' fees to the defendants. Following the filing of briefs and the completion of oral arguments, the Appellate Court reversed the decision of the Pennsylvania Court on March 25, 2013. As a result of the final decision, we reversed the All-Tag reserve of $6.6 million in the first quarter ended March 31, 2013. The Appellate Court decision was appealed by All-Tag and Sensormatic to the U.S. Supreme Court.
While the appeal was still pending, the U.S. Supreme Court agreed to hear two cases (Octane Fitness, LLC v. ICON Health & Fitness, Inc. and Highmark, Inc. v. Allcare Health Management Systems) arguing that the governing standard for finding a case exceptional under 35 U.S.C. § 285 was too rigid. On December 30, 2013, based on the Supreme Court’s willingness to re-evaluate the exceptional case standard, defendants requested that the Supreme Court also hear our case. On April 29, 2014, the
92
Supreme Court issued its rulings in Octane Fitness and Highmark and relaxed the standard for determining when a case is exceptional. As a result, on May 5, 2014, the Supreme Court vacated the judgment of the Appellate Court in our case (reinstating the Pennsylvania Court’s exceptional case finding) and sent the case back to the Appellate Court for further consideration in light of the new standards set forth in Octane Fitness and Highmark. On June 10, 2014, defendants filed a motion in the Appellate Court asking that the Appellate Court either affirm the Pennsylvania Court’s exceptional case finding outright or send the case back to the Pennsylvania Court so that it could consider the case again under the new exceptional case standard. On June 23, 2014, we filed our opposition to the motion to remand and moved the Appellate Court to once again reverse the Pennsylvania Court’s exceptional case finding. On October 14, 2014, the Appellate Court remanded the case to the Pennsylvania Court for further proceedings. We do not believe it is probable that the case will ultimately be decided against us and therefore there is no amount reserved for this matter as of December 28, 2014.
On July 31, 2014, All-Tag Security Americas, Inc. (All-Tag Security Americas) filed a patent infringement suit against the Company in the United States District Court for the Southern District of Florida, under the caption All-Tag Security Americas, Inc. v. Checkpoint Systems, Inc., C.A. No. 9:14-cv-81004-DMM. All-Tag Security Americas alleged that one of our products, the Micro EP PST label, infringes U.S. Patent No. 7,495,566 (the 556 Patent), one of All-Tag Security Americas’ patents. On October 10, 2014, All-Tag Security Americas filed a second patent infringement suit against the Company in the United States District Court for the Southern District of Florida. This second suit was filed for procedural reasons and involved the same subject matter as All-Tag Security Americas' July 31, 2014 suit. On December 22, 2014, the parties entered into a settlement agreement whereby Checkpoint agreed to pay $1.2 million to settle these outstanding cases.
Matter related to Universal Surveillance Corporation EAS RF Anti-trust Litigation
Universal Surveillance Corporation (USS) filed a complaint against us in the United States Federal District Court of the Northern District of Ohio (the Ohio Court) on August 19, 2011. USS claims that, in connection with our competition in the electronic article surveillance market, we violated the federal antitrust laws (Sherman Act and Clayton Act) and state antitrust laws (Ohio Valentine Act). USS also claims that we violated the federal Lanham Act, the Ohio Deceptive Trade Practices Act, and the Ohio Trade Secrets Act, and engaged in conduct that allegedly disparaged USS and tortiously interfered with USS's business relationships and contracts. USS is seeking injunctive relief as well as approximately $65 million in claimed damages for alleged lost profits, plus treble damages and attorney's fees under the Sherman Act. We have neither recorded a reserve for this matter nor do we believe that there is a reasonable possibility that a loss has been incurred.
Our legal fees related to the USS matter are being paid pursuant to our coverage under insurance policies with American Home Assurance Company and National Union Fire Insurance Company of Pittsburgh, Pa. (AIG). On July 9, 2014, AIG filed a complaint against us in the Superior Court of New Jersey (the New Jersey Court) claiming that AIG has no duty to defend or indemnify us under the insurance policies as they relate to the USS matter. AIG also claims reimbursement of legal fees, costs, and expenses previously paid by AIG on our behalf that are not covered by insurance as well as our reimbursement of AIG’s legal costs related to this matter. AIG has continued to pay on our behalf most of our legal fees, costs, and expenses related to this matter and we expect AIG to continue to pay on our behalf most of our legal fees, costs, and expenses until such time as the matter is resolved. We believe the claims in this case lack merit. Although it is too early to determine the outcome of this matter or a range of possible losses, an unfavorable outcome could have a material impact on our financial results and cash flows.
Matter related to Zucker Derivative Suit
On June 24, 2014, a complaint was filed by Lawrence Zucker in a shareholder derivative suit on behalf of himself, others who are similarly situated and derivatively on behalf of us, of which we are also a nominal defendant, against our Board of Directors (the Board of Directors) in the Court of Common Pleas of Allegheny County, Pennsylvania, under the caption Zucker v. Checkpoint Systems, Inc., et al., No. GD-14-11035. The plaintiff generally asserts claims for breach of fiduciary duty, waste of corporate assets, and unjust enrichment against our Board of Directors for allegedly exceeding its authority under our Amended and Restated 2004 Omnibus Incentive Compensation Plan (the Plan).
The plaintiff seeks, in addition to other relief, (i) a declaration that certain of the awards granted under the Plan in 2013 were ultra vires; (ii) rescission of awards allegedly granted in violation of the Plan; (iii) monetary damages; (iv) equitable or injunctive relief; (v) direction by the court that we reform our corporate governance and internal procedures and (vi) an award of attorneys’ fees and other fees and costs. The outcome of this matter cannot be predicted with any certainty. We intend to defend vigorously our interests in this matter.
93
Note 17. CONCENTRATION OF CREDIT RISK
Our foreign subsidiaries, along with many foreign distributors, provide diversified international sales, thus minimizing the potential credit risk of one or a few distributors. Our sales are well diversified among numerous retailers in the apparel, drug, home entertainment, mass merchandise, music, shoe, supermarket, and video markets. We perform ongoing credit evaluations of our customers’ financial condition and generally require no collateral from our customers.
Note 18. BUSINESS SEGMENTS AND GEOGRAPHIC INFORMATION
We report our financial results in three segments: Merchandise Availability Solutions (MAS), Apparel Labeling Solutions (ALS), and Retail Merchandising Solutions (RMS).
Our MAS segment, which is focused on loss prevention and Merchandise Visibility™ (RFID), includes EAS systems, EAS consumables, Alpha® high-theft solutions, RFID systems and software and non-U.S. and Canada-based CheckView®. ALS includes the results of our radio frequency identification (RFID) labels business, coupled with our data management platform and network of service bureaus that manage the printing of variable information on apparel labels and tags. Our RMS segment includes hand-held labeling applicators and tags, promotional displays, and customer queuing systems.
The business segment information set forth below is that viewed by the chief operating decision maker:
(A) | Business Segments |
(amounts in thousands) | December 28, 2014 | December 29, 2013 | December 30, 2012 | |||||||||
Business segment net revenue: | ||||||||||||
Merchandise Availability Solutions | $ | 438,847 | (1) | $ | 456,101 | (2) | $ | 446,798 | (3) | |||
Apparel Labeling Solutions | 174,287 | 182,259 | 187,419 | |||||||||
Retail Merchandising Solutions | 48,906 | 51,378 | 55,703 | |||||||||
Total | $ | 662,040 | $ | 689,738 | $ | 689,920 | ||||||
Business segment gross profit: | ||||||||||||
Merchandise Availability Solutions | $ | 207,113 | $ | 195,568 | $ | 197,308 | ||||||
Apparel Labeling Solutions | 60,179 | 54,672 | 47,050 | |||||||||
Retail Merchandising Solutions | 17,792 | 18,851 | 25,478 | |||||||||
Total gross profit | 285,084 | 269,091 | 269,836 | |||||||||
Operating expenses | 246,351 | (4) | 245,815 | (5) | 390,337 | (6) | ||||||
Interest expense | (3,457 | ) | (17,440 | ) | (10,783 | ) | ||||||
Other gain (loss), net | (1,102 | ) | (3,936 | ) | (1,731 | ) | ||||||
Earnings (loss) from continuing operations before income taxes | $ | 34,174 | $ | 1,900 | $ | (133,015 | ) | |||||
Business segment total assets: | ||||||||||||
Merchandise Availability Solutions | $ | 500,795 | $ | 550,801 | ||||||||
Apparel Labeling Solutions | 175,411 | 174,797 | ||||||||||
Retail Merchandising Solutions | 62,460 | 73,895 | ||||||||||
Total | $ | 738,666 | $ | 799,493 | ||||||||
(1) | Includes net revenue from EAS systems, Alpha® and EAS consumables of $179.0 million, $125.3 million and $107.8 million, respectively, representing more than 10% of total revenue. |
(2) | Includes net revenue from EAS systems, Alpha® and EAS consumables of $192.9 million, $128.1 million and $102.3 million, respectively, representing more than 10% of total revenue. |
(3) | Includes net revenue from EAS systems, Alpha® and EAS consumables of $194.9 million, $121.4 million and $95.9 million, respectively, representing more than 10% of total revenue. |
(4) | Includes a $6.7 million restructuring charge, a $1.6 million litigation settlement charge, a $0.9 million asset impairment, and a $0.4 million acquisition charge. |
94
(5) | Includes a $10.9 million restructuring charge, a $4.8 million asset impairment, a $1.2 million charge related to our CFO transition, $1.0 million in acquisition charge, a benefit of $6.6 million due to a litigation ruling reversal, and a $0.2 million gain on sale of our interest in the non-strategic Sri Lanka subsidiary. |
(6) | Includes a $102.7 million goodwill impairment charge, a $28.4 million restructuring charge, a $2.9 million charge related to our CEO transition, $0.3 million in acquisition costs, a $0.3 million litigation settlement charge, $3.9 million of income resulting from compensation for the financial impact of the fraudulent Canadian activities received from our insurance provider, partially offset by charges for forensic and legal fees associated with the improper and fraudulent Canadian activities, and a $1.7 million gain on sale of our non-strategic Suzhou, China subsidiary. |
(B) Geographic Information
Operating results are prepared on a “country of domicile” basis, meaning that net revenues are included in the geographic area where the selling entity is located. Assets are included in the geographic area in which the producing entities are located. A direct sale from the U.S. to an unaffiliated customer in South America is reported as a sale in the U.S. Inter-area sales between our locations are made at transfer prices that approximate market price and have been eliminated from consolidated net revenues. International Americas is defined as all countries in North and South America, excluding the United States, Puerto Rico, and Dominican Republic.
The following table shows net revenues, and other financial information by geographic area for the years 2014, 2013, and 2012:
(amounts in thousands) | United States, Puerto Rico, & Dominican Republic | Europe | International Americas | Asia Pacific | Total | ||||||||||||||
2014 | |||||||||||||||||||
Net revenues from unaffiliated customers | $ | 191,037 | (1) | $ | 247,413 | (2) | $ | 27,078 | $ | 196,512 | $ | 662,040 | |||||||
Long-lived assets | $ | 7,491 | $ | 11,328 | $ | 1,343 | $ | 57,227 | (3) | $ | 77,389 | ||||||||
2013 | |||||||||||||||||||
Net revenues from unaffiliated customers | $ | 203,171 | (4) | $ | 255,610 | (5) | $ | 32,523 | $ | 198,434 | $ | 689,738 | |||||||
Long-lived assets | $ | 8,430 | (6) | $ | 13,524 | $ | 1,432 | $ | 52,948 | (7) | $ | 76,334 | |||||||
2012 | |||||||||||||||||||
Net revenues from unaffiliated customers | $ | 184,905 | (8) | $ | 276,028 | $ | 37,131 | $ | 191,856 | $ | 689,920 | ||||||||
(1) | Includes net revenue from the United States of $191.0 million. |
(2) | Includes net revenue from Germany of $77.1 million. |
(3) | Includes long-lived assets from China and Japan of $37.4 million and $8.3 million, respectively. |
(4) | Includes net revenue from the United States of $203.2 million. |
(5) | Includes net revenue from Germany of $81.7 million. |
(6) | Includes long-lived assets from the United States of $8.4 million. |
(7) | Includes long-lived assets from China and Japan of $33.8 million and $9.8 million, respectively. |
(8) | Includes net revenue from the United States of $184.9 million. |
Note 19. DISCONTINUED OPERATIONS
Banking Security Systems Integration
On October 1, 2012, we completed the sale of the Banking Security Systems Integration business unit for $3.5 million. We received cash proceeds of $1.2 million (net of selling costs) and a promissory note of $1.4 million from the purchaser. The note receivable, which bears interest at the 30 day LIBOR rate plus 5.5%, matures in consecutive monthly installments through October 1, 2017. The loss on sale of the Banking Security Systems Integration business unit of $15 thousand was recorded through discontinued operations on the Consolidated Statement of Operations for the year ended December 30, 2012. The selling price also had a contingent consideration payment up to a maximum amount of $0.9 million. In the fourth quarter of 2013, we received the contingent payment of $13 thousand, which is recorded through discontinued operations in the Consolidated Statement of Operations for the year ended December 29, 2013. We received $0.3 million and $0.3 million of
95
principal on the note receivable for the years ended December 28, 2014 and December 29, 2013, respectively. The proceeds are included in cash proceeds from the sale of discontinued operations on the Consolidated Statement of Cash Flows.
Our discontinued operations reflect the operating results for the disposal group through the date of disposition and impairment charges recognized in 2012. The impairment charges include write-downs to goodwill and our customer relationships intangible asset reflecting estimates of fair value less costs to sell the Banking Security Systems Integration business unit. These nonrecurring fair value measurements, which fall within Level 3 of the fair value hierarchy, were determined utilizing an expected selling price less costs to sell approach.
The results for the years ended December 29, 2013, and December 30, 2012 have been reclassified to show the results of operations for the Banking Security Systems Integration business unit as discontinued operations, net of tax, on the Consolidated Statement of Operations. Below is a summary of these results:
(amounts in thousands) | December 29, 2013 | December 30, 2012 | ||||||
Net revenue | $ | — | $ | 10,751 | ||||
Gross profit | — | 1,335 | ||||||
Selling, general, & administrative expense | — | 2,550 | ||||||
Asset impairment | — | 1,442 | ||||||
Goodwill impairment | — | 370 | ||||||
Operating loss | — | (3,027 | ) | |||||
Gain (loss) on disposal | 13 | (15 | ) | |||||
Gain (loss) from discontinued operations before income taxes | 13 | (3,042 | ) | |||||
Gain (loss) from discontinued operations, net of tax (1) | $ | 13 | $ | (3,042 | ) | |||
(1) | As this business was located in the U.S. and a full valuation allowance was recorded in the U.S., there was no tax impact on the discontinued operations for the years ended December 29, 2013 and December 30, 2012. |
U.S and Canada CheckView®
In December of 2012, our U.S. and Canada based CheckView® business included in our Merchandise Availability Solutions segment met the criteria for classification as discontinued operations. The classification of this business as discontinued operations was determined to be a triggering event for testing goodwill impairment. As a result of this impairment test, we determined that there was a $3.3 million impairment charge of goodwill in our Merchandise Availability Solutions segment and a $0.3 million impairment of property, plant and equipment. These impairment charges were included in discontinued operations on the Consolidated Statement of Operations.
Our discontinued operations reflect the operating results for the disposal group. Impairments in 2012 reflect write-downs to estimates of fair value less costs to sell the U.S. and Canada based CheckView® business. These nonrecurring fair value measurements, which fall within Level 3 of the fair value hierarchy, were determined utilizing an expected selling price less costs to sell approach.
On March 19, 2013, we entered into an asset purchase agreement for the sale of our U.S. and Canada based CheckView® business for $5.4 million in cash, subject to a working capital adjustment to the extent that the net working capital of the business deviates from targeted working capital of $17.9 million.
On April 28, 2013, we completed the sale of our U.S. and Canada based CheckView® business unit for $5.4 million less a working capital adjustment of $4.1 million to arrive at cash proceeds of $1.3 million received on April 29, 2013. We initially recorded a receivable from the buyer of $0.2 million as a working capital adjustment based on the closing balance sheet. In the fourth quarter of 2013, the buyer disputed some amounts on the closing balance sheet. As a result, we recorded a payable to the buyer of $0.9 million as a working capital adjustment based on the buyer’s preliminary review of the final closing balance sheet. We have incurred selling costs of $1.1 million in connection with the transaction. We also issued a guarantee to the lessor of the related facilities and executed a transition services agreement with the buyer to provide services including but not limited to standalone information technology environment setup access, systems modifications, human resources and payroll processing support. The transition services, which started in the first quarter of 2012, have various contract periods, ranging from 60 days to one year. The leases on the facilities for which we issued a guarantee terminate in 2018. Our maximum
96
potential future payments under the guarantee are $3.5 million as of December 28, 2014. We have a lease guarantee liability of $0.1 million recorded in other current liabilities and other long term liabilities on the Consolidated Balance Sheets as of December 28, 2014. Direct costs incurred by us in connection with this agreement will be billed to the buyer on a monthly basis. Transition services expense, net of transition services income, was $13 thousand expense and $132 thousand income for the years ended December 28, 2014 and December 29, 2013. This amount is included within other gain (loss), net on the Consolidated Statement of Operations for the years ended December 28, 2014 and December 29, 2013. Costs incurred to carve-out the CheckView® business from our enterprise resource planning system for the buyer totaled $0.4 million and is recorded through discontinued operations on the Consolidated Statement of Operations for the year ended December 29, 2013. The loss on our sale of the U.S. and Canada based CheckView® business of $13.6 million is recorded through discontinued operations on the Consolidated Statement of Operations for the year ended December 29, 2013.
The results for the years ended December 29, 2013, and December 30, 2012 have been reclassified to show the results of operations for the U.S. and Canada based CheckView® business as discontinued operations, net of tax, on the Consolidated Statement of Operations. Below is a summary of these results:
(amounts in thousands) | December 29, 2013 | December 30, 2012 | ||||
Net revenue | 16,084 | 76,519 | ||||
Gross profit | 449 | 11,585 | ||||
Selling, general, & administrative expense | 3,970 | 12,253 | ||||
Research and development | 105 | 410 | ||||
Asset impairment | — | 329 | ||||
Goodwill impairment | — | 3,263 | ||||
Operating loss | (3,626 | ) | (4,670 | ) | ||
Loss on disposal | (13,611 | ) | — | |||
Loss from discontinued operations before income taxes | (17,237 | ) | (4,670 | ) | ||
Loss from discontinued operations, net of tax | (17,169 | ) | (4,917 | ) | ||
Net cash flows of our discontinued operations from each of the categories of operating, investing and financing activities were not significant.
Note 20. SUBSEQUENT EVENTS
On March 5, 2015 we declared a dividend of $0.50 per outstanding common share for all shareholders of record as of March 20, 2015. The dividend is payable on April 10, 2015.
97
Note 21. QUARTERLY INFORMATION (UNAUDITED)
QUARTERS (unaudited) | |||||||||||||||||||
(amounts in thousands, except per share data) | First | Second | Third | Fourth | Year | ||||||||||||||
2014 | |||||||||||||||||||
Net revenues | $ | 147,406 | $ | 170,925 | $ | 160,595 | $ | 183,114 | $ | 662,040 | |||||||||
Gross profit | 62,286 | 72,507 | 70,965 | 79,326 | 285,084 | ||||||||||||||
Net (loss) earnings from continuing operations | (129 | ) | (1) | 9,854 | (2) | (4,075 | ) | (3) | 5,303 | (4) | 10,953 | ||||||||
Net (loss) earnings attributable to Checkpoint Systems, Inc. | (129 | ) | (1) | 9,854 | (2) | (4,075 | ) | (3) | 5,303 | (4) | 10,953 | ||||||||
Net earnings (loss) from continuing operations per share: | |||||||||||||||||||
Basic | $ | — | $ | 0.23 | $ | (0.10 | ) | $ | 0.13 | $ | 0.26 | ||||||||
Diluted | $ | — | $ | 0.23 | $ | (0.10 | ) | $ | 0.12 | $ | 0.26 | ||||||||
Net earnings (loss) attributable to Checkpoint Systems, Inc. per share: | |||||||||||||||||||
Basic | $ | — | $ | 0.23 | $ | (0.10 | ) | $ | 0.13 | $ | 0.26 | ||||||||
Diluted | $ | — | $ | 0.23 | $ | (0.10 | ) | $ | 0.12 | $ | 0.26 | ||||||||
First | Second | Third | Fourth | Year | |||||||||||||||
2013 | |||||||||||||||||||
Net revenues | $ | 148,173 | $ | 172,290 | $ | 174,888 | $ | 194,387 | $ | 689,738 | |||||||||
Gross profit | 53,266 | 69,891 | 70,532 | 75,402 | 269,091 | ||||||||||||||
Net (loss) earnings from continuing operations | (4,925 | ) | (5) | 897 | (6) | 7,232 | (7) | (4,975 | ) | (8) | (1,771 | ) | |||||||
Net (loss) earnings attributable to Checkpoint Systems, Inc. | (7,423 | ) | (5) | (13,491 | ) | (6) | 7,132 | (7) | (5,146 | ) | (8) | (18,928 | ) | ||||||
Net (loss) earnings from continuing operations per share: | |||||||||||||||||||
Basic | $ | (0.12 | ) | $ | 0.02 | $ | 0.17 | $ | (0.12 | ) | $ | (0.05 | ) | ||||||
Diluted | $ | (0.12 | ) | $ | 0.02 | $ | 0.17 | $ | (0.12 | ) | $ | (0.05 | ) | ||||||
Net (loss) earnings attributable to Checkpoint Systems, Inc. per share: | |||||||||||||||||||
Basic | $ | (0.18 | ) | $ | (0.33 | ) | $ | 0.17 | $ | (0.12 | ) | $ | (0.46 | ) | |||||
Diluted | $ | (0.18 | ) | $ | (0.32 | ) | $ | 0.17 | $ | (0.12 | ) | $ | (0.46 | ) | |||||
(1) | Includes a $1.4 million restructuring charge (net of tax), and $0.4 million in financing liability interest expense (net of tax). |
(2) | Includes $0.4 million in financing liability interest expense (net of tax), and a $0.2 million restructuring charge (net of tax). |
(3) | Includes a $11.6 million valuation allowance expense, a $1.0 million restructuring charge (net of tax), $0.4 million in financing liability interest expense (net of tax), and $0.3 million in acquisition costs (net of tax). |
(4) | Includes a $3.3 million restructuring charge (net of tax), a $1.6 million litigation settlement charge (net of tax), a $0.6 million asset impairment charge (net of tax), $0.5 million in financing liability interest expense (net of tax), a $0.3 million valuation allowance benefit, and $0.1 million in acquisition costs (net of tax). |
(5) | Includes $1.7 million restructuring charge (net of tax), $0.4 million in financing liability interest expense (net of tax), $0.2 million in acquisition costs (net of tax), and a benefit of $6.6 million due to a litigation ruling reversal (net of tax). |
(6) | Includes a $1.2 million restructuring charge (net of tax), a $1.2 million charge related to our CFO transition (net of tax), a $0.6 million make-whole premium on debt charge (net of tax), $0.4 million in financing liability interest expense (net of tax), a $0.3 million valuation allowance expense, $0.3 million in acquisition costs (net of tax), and a $0.2 million gain on sale of our interest in the non-strategic Sri Lanka subsidiary (net of tax). |
98
(7) | Includes a $0.8 million restructuring charge (net of tax), a $0.4 million make-whole premium on debt charges (net of tax), $0.4 million in financing liability interest expense (net of tax), and $0.3 million in acquisition costs (net of tax). |
(8) | Includes a $8.0 million make-whole premium on debt charge (net of tax), $5.1 million restructuring charge (net of tax), a $4.6 million asset impairment charge (net of tax), a $0.4 million valuation allowance benefit, $0.4 million in financing liability interest expense (net of tax), and $0.3 million in acquisition costs (net of tax). |
Item 9. CHANGES IN AND DISAGREEMENTS WITH ACCOUNTANTS ON ACCOUNTING AND FINANCIAL DISCLOSURE
There are no changes or disagreements to report under this item.
Item 9A. CONTROLS AND PROCEDURES
Evaluation of Disclosure Controls and Procedures
Management, with the participation of the Chief Executive Officer and Chief Financial Officer, conducted an evaluation of the effectiveness of our disclosure controls and procedures (as defined in Rule 13a-15(e) under the Securities Exchange Act of 1934, as amended) as of the end of the period covered by this report. At the time that our Annual Report on Form 10-K for the year ended December 28, 2014 was filed on March 5, 2015, our Chief Executive Officer and Chief Financial Officer concluded that our disclosure controls and procedures were effective as of December 28, 2014. Subsequent to that evaluation, our Chief Executive Officer and Acting Chief Financial Officer concluded that our disclosure controls and procedures were not effective as of December 28, 2014 because of the subsequently-discovered material weakness in our internal control over financial reporting described below. Accordingly, management is restating its conclusions in this Amendment No. 1 to our Annual Report on Form 10-K for the year ended December 28, 2014.
Management's Annual Report on Internal Control Over Financial Reporting
Management is responsible for establishing and maintaining adequate internal control over financial reporting, as such term is defined in Exchange Act Rule 13a-15(f). Our internal control over financial reporting is designed to provide reasonable assurance as to the reliability of our financial reporting and the preparation of the consolidated financial statements for external purposes in accordance with generally accepted accounting principles. Because of its inherent limitations, internal control over financial reporting may not prevent or detect misstatements. Also, projections of any evaluation of effectiveness to future periods are subject to the risk that controls may become inadequate because of changes in conditions, or that the degree of compliance with the policies or procedures may deteriorate.
Management performed an assessment of the effectiveness of our internal control over financial reporting as of December 28, 2014 using criteria established in the Internal Control - Integrated Framework (2013) issued by the Committee of Sponsoring Organizations of the Treadway Commission (COSO). Management re-evaluated the effectiveness of the design and operation of our internal control over financial reporting and disclosure controls and procedures and concluded that we did not maintain effective controls over the period end financial reporting process for the quarterly periods ended March 29, 2015 and June 28, 2015 that resulted in a material misstatement of the 2015 interim financial statements. Specifically, effective controls were not maintained over the accounting for our quarterly income tax calculation surrounding the inclusion or exclusion of entities with valuation allowances. Additionally, we incorrectly calculated the valuation allowance related to a non U.S. entity with a deferred tax liability related to an indefinite lived intangible. Because of this material weakness, management, including the Chief Executive Officer and Acting Chief Financial Officer, concluded that our disclosure controls and procedures were not effective as of March 29, 2015 and June 28, 2015. The control deficiency constituted a material weakness, but did not result in a material misstatement in our audited consolidated financial statements for the year ended December 28, 2014, or any of the interim unaudited consolidated financial statements for the quarters included therein. However, the control deficiency could have resulted in a material misstatement to the annual or interim consolidated financial statements that would not have been prevented or detected. Accordingly, our management has determined that this deficiency constitutes a material weakness. A material weakness is a deficiency, or combination of deficiencies, in internal control over financial reporting, such that there is a reasonable possibility that a material misstatement of our annual or interim financial statements will not be prevented or detected on a timely basis.
The effectiveness of our internal control over financial reporting as of December 28, 2014 has been audited by PricewaterhouseCoopers LLP, an independent registered public accounting firm, as stated in their report which appears under Item 8. The report of PricewaterhouseCoopers LLP contained in this Amendment No. 1 to our Annual Report on Form 10-K for
99
the year ended December 31, 2014 has been restated from the report of PricewaterhouseCoopers LLP that was contained in our original filing.
Remediation of the 2014 Material Weakness
We are committed to remediating the material weakness over the accounting for our quarterly income tax calculation by implementing changes to our internal control over financial reporting. We are re-assessing the design of the controls and modifying processes related to the calculation of our interim effective tax rate as well as enhancing monitoring and oversight controls in the application of applicable accounting guidance related to the tax treatment of jurisdictions with valuation allowances. We believe that these initiatives will remediate the material weakness in internal control over financial reporting described above. We will test the ongoing operating effectiveness of the revised controls in future periods. The material weakness cannot be considered remediated until the applicable controls operate for a sufficient period of time and management has concluded, through testing, that these controls are operating effectively.
Remediation of the 2013 Material Weakness
A material weakness is a deficiency, or combination of deficiencies, in internal control over financial reporting, such that there is a reasonable possibility that a material misstatement of our annual or interim financial statements will not be prevented or detected on a timely basis. Management previously identified and disclosed a material weakness in our internal control over financial reporting over the accounting for the occurrence, valuation, rights and obligations and presentation and disclosure of non-routine complex transactions. Specifically, we did not have effective controls surrounding the documentation, evaluation and review of the technical accounting considerations that were adequately designed to determine whether the transactions were accounted for appropriately. In response to this material weakness, changes were made to our internal control over financial reporting, including the following:
• | Instituted additional training programs for accounting and finance personnel including global business unit controllers; |
• | Re-designed controls to identify, research, evaluate and review the appropriate accounting related to non-routine complex transactions and technical accounting matters. These include matters in the areas of leasing, the sale of financial assets, and revenue recognition, as well as other areas. Additionally, we hired an Accounting Policy and Financial Reporting Manager during the third quarter to augment our current staff, whose responsibilities include among other things, evaluating the accounting for non-routine complex transactions. |
We have completed the documentation and testing of the corrective actions described above and, as of December 28, 2014, have concluded that the remediation activities implemented are sufficient to conclude that the previously disclosed material weakness has been remediated as of December 28, 2014.
Changes in Internal Control Over Financial Reporting
There have been no changes in our internal control over financial reporting, during the fiscal quarter ended December 28, 2014, that has materially affected, or are reasonably likely to materially affect, our internal control over financial reporting.
Item 9B. OTHER INFORMATION
None.
PART III
Item 10. DIRECTORS, EXECUTIVE OFFICERS AND CORPORATE GOVERNANCE
The information required by this Item (except for the information regarding executive officers called for by Item 401(b) of Regulation S-K, which is included in Part I hereof in accordance with General Instruction G (3)) is hereby incorporated by reference to the Company's Definitive Proxy Statement for its Annual Meeting of Shareholders presently scheduled to be held on June 3, 2015, which management expects to file with the SEC within 120 days of the end of the Company's fiscal year.
We have posted the Code of Ethics, the Governance Guidelines and each of the Committee Charters on our website at www.checkpointsystems.com, and will post on our website any amendments to, or waivers from, the Code of Ethics applicable to any of its directors or executive officers. The foregoing information will also be available in print upon request.
Item 11. EXECUTIVE COMPENSATION
100
The information required by this Item is hereby incorporated by reference to the Company's Definitive Proxy Statement for its Annual Meeting of Shareholders presently scheduled to be held on June 3, 2015, which management expects to file with the SEC within 120 days of the end of the Company's fiscal year.
Note that the section of our Definitive Proxy Statement entitled “Compensation Committee Report” pursuant to Regulation S-K Item 407(e)(5) is not deemed “soliciting material” or “filed” as part of this report.
Item 12. SECURITY OWNERSHIP OF CERTAIN BENEFICIAL OWNERS AND MANAGEMENT
The information required by this Item is hereby incorporated by reference to the Company's Definitive Proxy Statement for its Annual Meeting of Shareholders presently scheduled to be held on June 3, 2015, which management expects to file with the SEC within 120 days of the end of the Company's fiscal year.
Item 13. CERTAIN RELATIONSHIPS AND RELATED TRANSACTIONS, AND DIRECTOR INDEPENDENCE
The information required by this Item is hereby incorporated by reference to the Company's Definitive Proxy Statement for its Annual Meeting of Shareholders presently scheduled to be held on June 3, 2015, which management expects to file with the SEC within 120 days of the end of the Company's fiscal year.
Item 14. PRINCIPAL ACCOUNTING FEES AND SERVICES
The information required by this Item is hereby incorporated by reference to the Company's Definitive Proxy Statement for its Annual Meeting of Shareholders presently scheduled to be held on June 3, 2015, which management expects to file with the SEC within 120 days of the end of the Company's fiscal year.
101
PART IV
Item 15. EXHIBITS AND FINANCIAL STATEMENT SCHEDULES
All other schedules are omitted either because they are not applicable, not required, or because the required information is included in the financial statements or notes thereto:
1. | The following Consolidated Financial Statements of Checkpoint Systems, Inc. were included in Item 8: | |
2. | ||
3. | The following Consolidated Financial Statements schedules of Checkpoint Systems, Inc. are included: | |
102
SIGNATURES
Pursuant to the requirements of Section 13 or 15(d) of the Securities Exchange Act of 1934, the Registrant has duly caused this Amendment No. 1 to Annual Report on Form 10K/A to be signed on its behalf by the undersigned, thereunto duly authorized on November 3, 2015.
CHECKPOINT SYSTEMS, INC. | |
/s/ George Babich, Jr. | |
George Babich, Jr. | |
President and Chief Executive Officer | |
103
3. Exhibits
Exhibit 2.1 | Amendment to Asset Purchase Agreement dated as of April 28, 2013, by and among Checkpoint Systems, Inc., Checkpoint Systems Canada, ULC, Checkview Intermediate Holding II Corporation, and Checkview ULC is incorporated herein by reference to Exhibit 2.02 of the Company's Current Report on Form 8-K dated May 2, 2013. |
Exhibit 2.2 | Asset Purchase Agreement dated as of March 19, 2013, by and among Checkpoint Systems, Inc., Checkpoint Systems Canada, ULC, Checkview Intermediate Holding II Corporation, and a Nova Scotia corporation to be formed prior to closing is incorporated herein by reference to Exhibit 2.01 of the Company's Current Report on Form 8-K dated May 2, 2013. |
Exhibit 3.1 | Articles of Incorporation, as amended, are hereby incorporated by reference to Exhibit 3(i) of the Registrant’s 1990 Form 10-K, filed with the SEC on March 14, 1991. |
Exhibit 3.2 | By-Laws, as Amended and Restated, are hereby incorporated by reference to Exhibit 3.1 of the Registrant’s Current Report on Form 8-K filed with the SEC on August 4, 2010. |
Exhibit 3.3 | Articles of Amendment to the Articles of Incorporation are hereby incorporated by reference to Item 5.03, Exhibit 3.1 of the Registrant’s Current Report on Form 8-K filed with the SEC on December 28, 2007. |
Exhibit 10.1 | Consulting and Deferred Compensation Agreement with Albert E. Wolf, are incorporated by reference to Item(a), Exhibit 10(c) of the Registrant’s 1994 Form 10-K. |
Exhibit 10.2(1) | Employment Agreement with Per Harold Levin is incorporated by reference to Item 6(a), Exhibit 10.4 of the Registrant’s Form 10-Q filed on May 13, 2004. |
Exhibit 10.3(1) | Amendment to Employment Agreement with Per Harold Levin is incorporated by reference to Item 6(a), Exhibit 10.5 of the Registrant’s Form 10-Q filed on May 13, 2004. |
Exhibit 10.4(1) | Employment Agreement by and between S. James Wrigley and Checkpoint Systems, Inc. dated March 11, 2011 is incorporated by reference to Registrant’s Form 10-Q, filed with the SEC on May 4, 2010. |
Exhibit 10.5(1) | Employment Agreement by and between Checkpoint Systems, Inc. and George Babich, Jr. February 4, 2013 is incorporated by reference to Registrant’s Form 8-K filed with the SEC on February 8, 2013. |
Exhibit 10.6(1) | Checkpoint Systems, Inc. Amended and Restated 2004 Omnibus Incentive Compensation Plan is hereby incorporated by reference from Appendix A to Checkpoint Systems, Inc.’s definitive proxy statement for the 2010 Annual Meeting of Shareholders filed with the SEC on April 26, 2010. |
Exhibit 10.7(1) | Amended and Restated Checkpoint Systems, Inc. 423 Employee Stock Purchase Plan, is hereby incorporated by reference from Appendix A to Checkpoint System, Inc.’s definitive proxy statement for the 2012 Annual Meeting of Shareholders filed with the SEC on April 23, 2012 |
Exhibit 10.8(1) | Offer Letter dated May 8, 2013 by and between Checkpoint Systems, Inc. and Jeffrey O. Richard, is incorporated by reference to Registrant’s Form 8-K filed with the SEC on June 10, 2013. |
Exhibit 10.9 | Credit Agreement dated December 11, 2013, among the Registrant, as borrower, certain subsidiaries of the borrower as designated borrowers, and certain subsidiaries of the borrower as the guarantors and Bank of America, N.A. as Administrative Agent, Swingline Lender and Letter of Credit Issuer, and Bank of America Merrill Lynch, as Joint Lead Arranger and Joint Book Manager, Fifth Third Bank, as Joint Lead Arranger and Joint Book Manager, and HSBC Bank USA, National Association as Joint Lead Arranger and Joint Book Manager, is incorporated by reference to Registrant’s Form 8-K filed with the SEC on December 16, 2013. |
Exhibit 10.10(1) | Amended and Restated Employment Agreement by and between Checkpoint Systems, Inc. and George Babich, Jr. dated December 31, 2014, is incorporated by reference to Registant’s Form 8-K filed with the SEC on January 7, 2015. |
Exhibit 21 | Subsidiaries of Registrant. |
Exhibit 23 | Consent of Independent Registered Public Accounting Firm. |
Exhibit 31.1 | Certification of the Chief Executive Officer pursuant to Rule 13a-14(a) of the Exchange Act, as enacted by Section 302 of the Sarbanes-Oxley Act of 2002. |
Exhibit 31.2 | Certification of the Chief Financial Officer pursuant to Rule 13a-14(a) of the Exchange Act, as enacted by Section 302 of the Sarbanes-Oxley Act of 2002. |
Exhibit 32.1 | Certification of the Chief Executive Officer and Chief Financial Officer pursuant to 18 United States Code Section 1350, as enacted by Section 906 of the Sarbanes-Oxley Act of 2002. |
104
Exhibit 101.INS | XBRL Instance Document.(2) |
Exhibit 101.SCH | XBRL Taxonomy Extension Schema Document.(2) |
Exhibit 101.CAL | XBRL Taxonomy Extension Calculation Linkbase Document.(2) |
Exhibit 101.LAB | XBRL Taxonomy Extension Label Linkbase Document.(2) |
Exhibit 101.PRE | XBRL Taxonomy Extension Presentation Linkbase Document.(2) |
Exhibit 101.DEF | XBRL Taxonomy Extension Definition Document.(2) |
(1) | Management contract or compensatory plan or arrangement. |
(2) | Pursuant to Rule 406T of Regulation S-T, the XBRL related information in Exhibit 101 to this Annual Report on Form 10-K shall not be deemed to be “filed” for purposes of Section 18 of the Exchange Act, or otherwise subject to the liability of that section, and shall not be deemed part of a registration statement, prospectus or other document filed under the Securities Act or the Exchange Act, except as may be expressly set forth by specific reference in such filings. |
105
SCHEDULE II VALUATION AND QUALIFYING ACCOUNTS
Allowance for Doubtful Accounts
(amounts in thousands) | |||||||||||||||||||||||
Year | Balance at Beginning of Year | Additions Through Acquisition | Charged to Costs and Expenses | Deductions (Write-Offs and Recoveries, net) | Adjustment for Discontinued Operations | Balance at End of Year | |||||||||||||||||
2014 | $ | 12,404 | $ | — | $ | (144 | ) | $ | (3,734 | ) | $ | — | $ | 8,526 | |||||||||
2013 | $ | 13,242 | $ | — | $ | (435 | ) | $ | (403 | ) | $ | — | $ | 12,404 | |||||||||
2012 | $ | 12,627 | $ | — | $ | 3,024 | $ | (603 | ) | $ | (1,806 | ) | $ | 13,242 | |||||||||
Deferred Tax Valuation Allowance
(amounts in thousands) | ||||||||||||||||||||||
Year | Balance at Beginning of Year | Additions Through Acquisition | (Benefit) Expense Recorded on Current Year (Income) Losses | Change in Valuation Allowance | Impact of CTA | Balance at End of Year | ||||||||||||||||
2014 | $ | 145,508 | $ | — | $ | (9,799 | ) | $ | 11,297 | 1,832 | $ | 148,838 | ||||||||||
2013 | $ | 141,474 | $ | — | $ | 4,173 | $ | (125 | ) | (14 | ) | $ | 145,508 | |||||||||
2012 | $ | 102,148 | $ | — | $ | 38,926 | $ | 283 | 117 | $ | 141,474 | |||||||||||
106