Attached files
| file | filename |
|---|---|
| EX-5.1 - EX-5.1 - loanDepot, Inc. | d53727dex51.htm |
| EX-4.1 - EX-4.1 - loanDepot, Inc. | d53727dex41.htm |
| EX-10.1 - EX-10.1 - loanDepot, Inc. | d53727dex101.htm |
| EX-10.4 - EX-10.4 - loanDepot, Inc. | d53727dex104.htm |
| EX-10.19 - EX-10.19 - loanDepot, Inc. | d53727dex1019.htm |
| EX-10.47 - EX-10.47 - loanDepot, Inc. | d53727dex1047.htm |
| EX-10.21 - EX-10.21 - loanDepot, Inc. | d53727dex1021.htm |
| EX-10.45 - EX-10.45 - loanDepot, Inc. | d53727dex1045.htm |
| EX-10.35.6 - EX-10.35.6 - loanDepot, Inc. | d53727dex10356.htm |
| EX-23.5 - EX-23.5 - loanDepot, Inc. | d53727dex235.htm |
| EX-23.4 - EX-23.4 - loanDepot, Inc. | d53727dex234.htm |
| EX-23.3 - EX-23.3 - loanDepot, Inc. | d53727dex233.htm |
| EX-23.1 - EX-23.1 - loanDepot, Inc. | d53727dex231.htm |
| EX-23.2 - EX-23.2 - loanDepot, Inc. | d53727dex232.htm |
| EX-10.48 - EX-10.48 - loanDepot, Inc. | d53727dex1048.htm |
| EX-10.49 - EX-10.49 - loanDepot, Inc. | d53727dex1049.htm |
| EX-10.50 - EX-10.50 - loanDepot, Inc. | d53727dex1050.htm |
Table of Contents
As filed with the Securities and Exchange Commission on November 3, 2015
No. 333-207343
UNITED STATES
SECURITIES AND EXCHANGE COMMISSION
Washington, D.C. 20549
Amendment No. 3
to
FORM S-1
REGISTRATION STATEMENT
UNDER
THE SECURITIES ACT OF 1933
loanDepot, Inc.
(Exact name of registrant as specified in its charter)
| Delaware | 6199 |
38-3977115 | ||
| (State or other jurisdiction of incorporation or organization) |
(Primary Standard Industrial Classification Code Number) |
(I.R.S. Employer Identification No.) |
26642 Towne Centre Drive
Foothill Ranch, California 92610
(888) 337-6888
(Address, including zip code, and telephone number, including area code, of registrant’s principal executive offices)
Peter A. L. Macdonald
Executive Vice President, General Counsel
26642 Towne Centre Drive
Foothill Ranch, California 92610
(888) 337-6888
(Name, address, including zip code, and telephone number, including area code, of agent for service)
With copies to:
| Joshua N. Korff Michael Kim Kirkland & Ellis LLP 601 Lexington Avenue New York, New York 10022 (212) 446-4800 |
John J. Hentrich David H. Sands Sheppard, Mullin, Richter & Hampton LLP 12275 El Camino Real, Suite 200 San Diego, California 92130 (858) 720-8900 |
Michael Kaplan Sarah K. Solum Davis Polk & Wardwell LLP 450 Lexington Avenue New York, New York 10017 (212) 450-4000 |
Approximate date of commencement of proposed sale to the public: As soon as practicable after this Registration Statement becomes effective.
If any of the securities being registered on this Form are to be offered on a delayed or continuous basis pursuant to Rule 415 under the Securities Act of 1933, check the following box: ¨
If this Form is filed to register additional securities for an offering pursuant to Rule 462(b) under the Securities Act, please check the following box and list the Securities Act registration statement number of the earlier effective registration statement for the same offering. ¨
If this Form is a post-effective amendment filed pursuant to Rule 462(c) under the Securities Act, check the following box and list the Securities Act registration statement number of the earlier effective registration statement for the same offering. ¨
If this Form is a post-effective amendment filed pursuant to Rule 462(d) under the Securities Act, check the following box and list the Securities Act registration statement number of the earlier effective registration statement for the same offering. ¨
Indicate by check mark whether the registrant is a large accelerated filer, an accelerated filer, a non-accelerated filer, or a smaller reporting company. See the definitions of “large accelerated filer,” “accelerated filer” and “smaller reporting company” in Rule 12b-2 of the Exchange Act. (Check one):
| Large accelerated filer | ¨ | Accelerated filer | ¨ | |||
| Non-accelerated filer | x (Do not check if a smaller reporting company) | Smaller reporting company | ¨ | |||
CALCULATION OF REGISTRATION FEE
|
| ||||||||
| Title of Each Class of Securities to be Registered |
Amount to be Registered(1)(2) |
Proposed Maximum Offering |
Proposed Maximum Aggregate Offering Price(1)(2) |
Amount of Registration Fee(3) | ||||
| Class A Common Stock, $0.001 par value per share |
34,500,000 | $18.00 | $621,000,000 | $62,535 | ||||
|
| ||||||||
|
| ||||||||
| (1) | Estimated solely for the purpose of calculating the registration fee pursuant to Rule 457(a) under the Securities Act of 1933, as amended. |
| (2) | Includes additional shares of Class A common stock that the underwriters have the option to purchase. |
| (3) | $10,070 previously paid in connection with the initial filing of this Registration Statement. |
The Registrant hereby amends this Registration Statement on such date or dates as may be necessary to delay its effective date until the Registrant shall file a further amendment which specifically states that this Registration Statement shall thereafter become effective in accordance with Section 8(a) of the Securities Act of 1933 or until this Registration Statement shall become effective on such date as the Commission, acting pursuant to said Section 8(a), may determine.
Table of Contents
The information in this preliminary prospectus is not complete and may be changed. These securities may not be sold until the registration statement filed with the Securities and Exchange Commission is effective. This preliminary prospectus is not an offer to sell and does not seek an offer to buy these securities and it is not soliciting an offer to buy these securities in any jurisdiction where the offer or sale thereof is not permitted.
PRELIMINARY PROSPECTUS
Subject to Completion, dated November 3, 2015
30,000,000 Shares

loanDepot, Inc.
Class A Common Stock
This is an initial public offering of shares of Class A common stock of loanDepot, Inc. We are offering 26,400,000 shares of our Class A common stock. The selling stockholders identified in this prospectus are offering an additional 3,600,000 shares of Class A common stock. We will not receive any of the proceeds from the sale of shares being sold by the selling stockholders. As described herein, we will use a portion of the net proceeds from our sale of our Class A common stock to purchase 3,253,086 Holdco Units (as defined herein), together with an equal number of shares of our Class B common stock, from certain holders of Holdco Units (the ‘‘Exchanging Members’’), including our Chief Executive Officer and certain of our other officers, and to redeem 3,067,227 shares of our Class A common stock from certain related parties.
Prior to this offering, there has been no public market for our Class A common stock. The initial public offering price per share of the Class A common stock is expected to be between $16.00 and $18.00. We have been approved to list our Class A common stock on the New York Stock Exchange (the “NYSE”) under the symbol “LDI”.
We have two authorized classes of common stock: Class A and Class B. Holders of our Class A common stock and holders of our Class B common stock are each entitled to one vote per share of the applicable class of common stock and all such holders will vote together as a single class. However, holders of our Class B common stock do not have any right to receive dividends or distributions upon our liquidation or winding up. Each share of Class B common stock is, from time to time, exchangeable, when paired together with one Holdco Unit of loanDepot Holdings, LLC (“LD Holdings”), our direct subsidiary, for one share of Class A common stock, subject to customary adjustment for stock splits, stock dividends and reclassifications.
We will be a holding company and our principal asset will be our Holdco Units in LD Holdings. Immediately following this offering, the holders of our Class A common stock will collectively own 100% of the economic interests in loanDepot, Inc., which will own 42.1% of the economic interests in LD Holdings, and have 42.1% of the voting power of loanDepot, Inc. The holders of our Class B common stock will collectively have the remaining 57.9% of the voting power of loanDepot, Inc. and own 57.9% of the economic interests in LD Holdings. Upon completion of this offering, we will be a “controlled company” under the NYSE corporate governance standards.
We are an “emerging growth company,” as that term is defined under the federal securities laws and, as such, may elect to comply with certain reduced public company reporting requirements.
Investing in our Class A common stock involves risks. See “Risk Factors” beginning on page 30.
Neither the Securities and Exchange Commission nor any state securities commission nor any other regulatory body has approved or disapproved of these securities or passed upon the accuracy or adequacy of this prospectus. Any representation to the contrary is a criminal offense.
| Per Share | Total | |||||||
| Initial public offering price |
$ | $ | ||||||
| Underwriting discounts and commissions(1) |
$ | $ | ||||||
| Proceeds, before expenses, to us(2) |
$ | $ | ||||||
| Proceeds, before expenses, to the selling stockholders |
$ | $ | ||||||
| (1) | See “Underwriting” for a full description of compensation payable in connection with this offering. |
| (2) | As described herein, we will use a portion of the net proceeds from our sale of Class A common stock to purchase Holdco Units and an equal number of shares of our Class B common stock from the Exchanging Members and to redeem shares of our Class A common stock from certain related parties. The price for each Holdco Unit (other than Holdco Units converted from Class P, Class P-2 and Class W common units of loanDepot.com, LLC (“LDLLC”), our operating subsidiary, such Holdco Units referred to herein as “Premium Holdco Units”) surrendered for purchase by an Exchanging Member along with a share of Class B common stock will be equal to the price per share of our Class A common stock in this offering less underwriting discounts and commissions. |
The underwriters have an option to purchase up to 4,500,000 additional shares from us and the selling stockholders at the initial public offering price, less underwriting discounts and commissions. The underwriters can exercise this option at any time and from time to time within 30 days from the date of this prospectus.
If the underwriters exercise in full their option to purchase additional shares, we intend to use the net proceeds from our sale of 2,340,000 additional shares to purchase an additional 900,000 newly issued Holdco Units from LD Holdings and 1,440,000 Holdco Units and an equal number of shares of our Class B common stock, from the Exchanging Members at the same price per Holdco Unit as set forth in note 2 above, and the remaining 2,160,000 shares will be sold by the selling stockholders upon exercise of such option. We will not retain any proceeds from the sale of shares of our Class A common stock by the selling stockholders. See ‘‘Use of Proceeds.’’
The underwriters expect to deliver the shares of Class A common stock against payment therefor in New York, New York on or about , 2015.
Joint Book-Running Managers
| Morgan Stanley | Goldman, Sachs & Co. | Wells Fargo Securities | Barclays |
| UBS Investment Bank | Citigroup |
Co-Managers
| BMO Capital Markets | JMP Securities | Raymond James | William Blair | |||
The date of this prospectus is , 2015
Table of Contents
Through and including , 2015 (the 25th day after the date of this prospectus), all dealers effecting transactions in these securities, whether or not participating in the offering, may be required to deliver a prospectus. This is in addition to a dealer’s obligation to deliver a prospectus when acting as an underwriter and with respect to any unsold allotment or subscription.
Neither we, the selling stockholders nor the underwriters have authorized anyone to provide any information or to make any representations other than those contained in this prospectus or in any free writing prospectuses we have prepared. Neither we, the selling stockholders nor the underwriters take any responsibility for, nor can we or they provide any assurance as to the reliability of, any other information that others may give you. This prospectus is an offer to sell only the shares offered hereby, but only under circumstances and in jurisdictions where it is lawful to do so. The information contained in this prospectus is current only as of its date. Our business, prospects, financial condition and results of operations may have changed since that date.
i
Table of Contents
MARKET, INDUSTRY AND OTHER DATA
This prospectus contains statistical data and estimates, including those relating to market size, competitive position and growth rates of the markets in which we participate, that we obtained from our own internal estimates and research, as well as from industry and general publications and research, surveys and studies conducted by third parties. Industry publications, studies and surveys generally state that they have been obtained from sources believed to be reliable, although they do not guarantee the accuracy or completeness of such information. While we believe that each of these studies and publications is reliable, we have not independently verified market and industry data from third-party sources. While we believe our internal company research is reliable and the definitions of our market and industry are appropriate, neither this research nor these definitions have been verified by any independent source.
TRADEMARKS, SERVICE MARKS AND TRADE NAMES
We own the trademarks, service marks and trade names that we use in connection with the operation of our business, including our corporate names, logos and website names. This prospectus may also contain trademarks, service marks, trade names and copyrights of other companies, which are the property of their respective owners. Solely for convenience, the trademarks, service marks, trade names and copyrights referred to in this prospectus are listed without the TM, SM, © and ® symbols, but we will assert, to the fullest extent under applicable law, our rights or the rights of the applicable licensors, if any, to these trademarks, service marks, trade names and copyrights.
BASIS OF PRESENTATION
In this prospectus, unless otherwise noted or indicated by the context, references to terms such as ‘‘originate,’’ “facilitate,” ‘‘fund,’’ ‘‘provide,’’ ‘‘extend’’ or ‘‘finance’’ are to the generation of all of our loans, regardless of form and whether originated directly by us or facilitated from a third party.
The following industry terms are used in this prospectus unless otherwise noted or indicated by the context:
“CFPB” refers to the Consumer Financial Protection Bureau;
“ECOA” refers to Equal Credit Opportunity Act;
“Fannie Mae” refers to the Federal National Mortgage Association;
“FDIC” refers to Federal Deposit Insurance Corporation;
“Federal Reserve Board” refers to the Board of Governors of the Federal Reserve System;
“FHA” refers to the Federal Housing Administration;
“FHFA” refers to the Federal Housing Finance Agency;
“Freddie Mac” refers to the Federal Home Loan Mortgage Corporation;
“Ginnie Mae” refers to the Government National Mortgage Association;
“GSEs” refers to Government Sponsored Enterprises, namely Fannie Mae and Freddie Mac;
“HAMP” refers to the Home Affordable Modification Program;
“HARP” refers to the Home Affordable Refinance Program;
“HOEPA” refers to the Home Ownership and Equity Protection Act of 1994;
“HUD” refers to the Department of Housing and Urban Development;
ii
Table of Contents
“IRLCs” refers to interest rate lock commitments;
“LHFS” refers to loans held for sale;
“LTV” refers to loan-to-value;
“MBS” refers to mortgage-backed securities;
“OIG” refers to the U.S. Department of Housing and Urban Development’s Office of the Inspector General;
“QRM” refers to a qualified residential mortgage;
“RESPA” refers to the Real Estate Settlement Procedures Act;
“TILA” refers to the Truth in Lending Act;
“UPB” refers to unpaid principal balance;
“VA” refers to the Department of Veterans Affairs; and
“Warehouse Lines” refer to the warehouse lines of credit that we use to finance most of our loan originations on a short-term basis.
Numerical figures included in this prospectus have been subject to rounding adjustments. Accordingly, numerical figures shown as totals in various tables may not be arithmetic aggregations of the figures that precede them.
All references to years in this prospectus, unless otherwise noted or indicated by the context, refer to our fiscal years, which end on December 31.
iii
Table of Contents
This summary highlights material information about our business and the offering of our Class A common stock. This is a summary of material information contained elsewhere in this prospectus and is not complete and does not contain all of the information that you should consider before deciding to invest in our Class A common stock. For a more complete understanding of our business and the offering, you should read this entire prospectus, including the section entitled “Risk Factors,” as well as the consolidated financial statements and the related notes thereto, before making an investment decision.
In this prospectus, unless otherwise noted or indicated by the context, the terms “loanDepot,” the “Company,” “we,” “our,” and “us” refer (1) prior to the consummation of the Offering Transactions described under “Organizational Structure—Offering Transactions,” to loanDepot.com, LLC (“LDLLC”) and its consolidated subsidiaries, and (2) after the Offering Transactions described under “Organizational Structure—Offering Transactions,” to loanDepot, Inc., the issuer of the Class A common stock offered hereby, and its consolidated subsidiaries, including LDLLC. We refer to the members of LDLLC (excluding LD Investment Holdings, Inc. and the holders of LDLLC’s Class I common units) prior to the Offering Transactions, collectively as the “Continuing LLC Members.”
OUR MISSION
To become America’s Consumer Lending Platform by leveraging our technology to provide consumers with credit products best suited for their financial needs.
OUR COMPANY
loanDepot is a leading technology-enabled U.S. consumer lending platform. We launched our business in 2010 to provide credit solutions to consumers who were not satisfied with the service offered by banks and other traditional market participants. We are the nation’s second largest direct-to-consumer non-bank originator by annual funded loan amount and have facilitated over $50 billion in total funding since inception. We currently offer a broad suite of consumer credit products to our customers, ranging from home loans to unsecured personal loans. Our hybrid originate-to-sell and marketplace business model allows us to generate significant loan volume with less capital than traditional market participants. For the twelve months ended June 30, 2015, we originated $22.1 billion in loans, representing 125% year-over-year growth. Moreover, we have generated this substantial growth while maintaining profitability since 2012.
The consumer lending market in the United States is massive, with more than $11.8 trillion in household debt outstanding as of June 30, 2015. We believe that banks and other traditional market participants continue to be ineffective in adequately addressing consumer needs due to increasing capital requirements, regulatory constraints, legacy systems and antiquated processes. In addition, we expect our addressable market to expand, as consumer debt in our target markets was $1.6 trillion lower at June 30, 2015 than at December 31, 2008. This represents a compelling opportunity for us to disrupt the market and gain share by both displacing incumbent participants and addressing unmet demand.
Given this significant opportunity and our management team’s experience in providing home loan products, we identified home lending as our most effective entry into the broader U.S. consumer lending market because: (i) it has the largest addressable market with $8.6 trillion outstanding as of June 30, 2015; (ii) its complexity and licensing requirements present significant barriers to entry, which our management team has had significant experience and success in addressing; (iii) consumer dissatisfaction with banks and traditional lenders provides an opportunity for significant disruption; and (iv) home loan products provide a foundation for direct customer
1
Table of Contents
relationships and powerful cross-selling opportunities for other loan products, thereby increasing customer lifetime value. Building on these direct customer relationships and the success of our existing home loan products, we continue to broaden our product suite, which now includes home equity and unsecured personal loans. By providing a robust suite of secured and unsecured loan products and leveraging technology to provide a better and more efficient customer experience, we strive to become America’s Consumer Lending Platform.
We have built our operations to be significantly automated, including the application process, product identification and selection, credit decisioning and scoring, loan funding, servicing, regulatory compliance and fraud detection. We further leverage our technology to address and comply with licensing and complex regulatory requirements. We believe that our platform and technology also provide an improved customer experience and enhances the lifetime value of our customer relationships through repeat and cross-sell opportunities. We believe our Net Promoter Score (“NPS”), an index that measures customer satisfaction and loyalty, of 59.5 for the six months ended June 30, 2015 and 63.5 for the year ended December 31, 2014 (for those channels we primarily operated in at the time) demonstrates our strong direct customer relationships and success in providing a better experience and compares favorably to the 2014 annual industry averages of approximately 16 for national banks and approximately 22 for regional banks.
Our multi-channel platform allows our customers to engage with us through their preferred channel, enabling a better customer experience, while matching consumers’ diverse borrowing needs with efficient and lower-cost sources of capital. This model offers three convenient options for consumers: (i) our direct retail channel comprising our online platform, loanDepot.com, and our proprietary customer contact centers; (ii) our distributed retail channel comprising nearly 1,000 members of our licensed loan officer sales force (our “sales force”) strategically located across the United States and our joint ventures; and (iii) our wholesale channel, LD Wholesale, comprising our nationwide network of independent home loan brokers. For the six months ended June 30, 2015, 41.3% of loans were originated through our direct retail channel, 48.3% were originated through our distributed retail channel and 10.4% were originated through our wholesale channel. Currently, home loans are originated through all of our distribution channels, personal loans are facilitated through both of our retail channels and home equity loans are originated through our direct retail channel. In the future, we expect that all of our consumer credit products will be available across all of our distribution channels. Our more than 1,500 employee sales force across both our direct and distributed retail channels provides a competitive advantage in our go-to-market strategy. We have invested heavily in both training our sales force and providing them with multiple state licenses to optimize workflow, which we believe creates a better consumer experience and differentiates our offerings in the marketplace.
Both our technology and multi-channel distribution platform are complemented by our scaled marketing effort. We currently invest significantly in both online and offline marketing strategies, which has resulted in loanDepot becoming a nationally recognized consumer brand. We believe our highly targeted marketing strategies are more effective than many of our competitors’ traditional marketing efforts. We currently generate over 300,000 customer leads each month and continue to grow our proprietary database, which currently exceeds 11 million consumer contacts. By effectively utilizing our lead-generation sources, proprietary lead management technology and automated product-decisioning capabilities, we are able to drive revenue while executing our customer acquisition strategy. Our extensive database and proprietary technology also proactively identify and facilitate opportunities to cross-sell and resell our products, which further reduces our average customer acquisition costs and thereby increases the lifetime value of our customer.
We have historically derived substantially all of our revenues from originating, selling and servicing home loans. However, in May 2015, we began facilitating personal loans, and, in large part due to the success of cross-selling opportunities, we have seen significant growth in units without a substantial increase in marketing expense. For the six months ended June 30, 2015, we funded over $14.3 billion in home loans and facilitated over $13.9 million in personal loans. Since the launch of our personal loan product through September 30, 2015, we have facilitated over $140 million in personal loans. Based on our successful experience with personal loans, we believe a similar cross-selling opportunity exists with the origination of our home equity loan products, which we recently launched in September 2015.
2
Table of Contents
We believe our broad suite of consumer loan products is a competitive advantage, and we expect that originating and facilitating multiple loan products will lead to:
| • | improved customer experience and brand awareness; |
| • | savings for our customers; |
| • | greater customer conversion and retention; |
| • | enhanced data optimization, analytics and credit decisioning; and |
| • | lower average customer acquisition costs. |
Our business has scaled rapidly and has been funded primarily by internally generated profits from operations. For the twelve months ended June 30, 2015, we originated $22.1 billion of loans, representing year-over-year growth of 125% relative to the twelve months ended June 30, 2014. Our growth has been supported by our balance-sheet light model, which utilizes diverse funding sources, our ability to provide what we believe is a superior customer experience and our strategic acquisitions. For the year ended December 31, 2014, we originated $13.2 billion of loans and recorded total net revenues of $544.5 million, Adjusted EBITDA of $50.2 million, Adjusted Net Income of $17.6 million (giving effect to net income as if we were taxed as a C-Corp) and net income of $21.7 million. For the six months ended June 30, 2015, we originated $14.3 billion of loans and recorded total net revenues of $489.6 million, Adjusted EBITDA of $101.1 million, Adjusted Net Income of $51.7 million (giving effect to net income as if we were taxed as a C-Corp) and net income of $69.2 million. See “—Summary Historical Consolidated Financial and Other Data” for a reconciliation of Adjusted EBITDA and Adjusted Net Income to net income.
INDUSTRY BACKGROUND & TRENDS
Massive Consumer Lending Market Poised for Growth as the U.S. Economy and Consumer Confidence Recover
The consumer lending market in the United States is massive with more than $11.8 trillion in household debt outstanding as of June 30, 2015. We believe this market is poised for growth as borrowings in our target markets (consumer debt excluding automotive and student loans) was $1.6 trillion lower at June 30, 2015 as compared to December 31, 2008, during the height of the 2008-2009 financial crisis (the “Financial Crisis”).
Consumer credit is an important driver of the U.S. economy. The loan products we currently provide target some of the largest components of U.S. consumer credit, including home loan debt ($8.1 trillion outstanding as of June 30, 2015), consumer credit excluding home, automotive and student loan debt ($1.0 trillion outstanding as of June 30, 2015) and home equity lines of credit ($0.5 trillion outstanding as of June 30, 2015), which collectively account for over 80% of the total consumer lending market. Following the Financial Crisis, U.S. households focused on stabilizing their financial positions by lowering their household debt, which has resulted in current household debt service ratios of 9.9%, the lowest level since 1980. Similarly, consumer confidence, which has historically served as a strong indicator of improving economic conditions and a precursor to increased desire to access credit, has improved steadily since 2009. This increased confidence along with higher employment levels and promising wage growth has led to increased consumer spending, which has recently driven increased demand for credit, particularly in the consumer credit products we provide.
When interest rates rise, rate and term refinancings become less attractive to consumers after a historically long period of low interest rates. However, rising interest rates are also indicative of overall economic growth and inflation that should create more opportunities with respect to cash-out refinancings. In addition, inflation reflecting increases in asset prices and stronger economic growth (leading to higher consumer confidence) typically should generate more purchase-focused transactions requiring loans and greater opportunities for home equity loans, which we expect may offset, at least in part, any decline in rate and term refinancings in a rising interest rate environment. We also believe that rising interest rates will not have a material impact on market
3
Table of Contents
opportunities for personal loans because those are fixed rate products; however, if consumer debt in the aggregate began to decrease due to rising interest rates, we may see a reduction in personal loan volume because such loans are primarily used for consolidating debt.
Consumers Have Not Been Adequately Served
We believe the traditional banking and consumer lending system is burdened by high fixed costs and antiquated processes, in part due to extensive legacy infrastructure and labor-intensive processes. Post-Financial Crisis, this burden has been compounded by an increasingly complex regulatory environment. During the Financial Crisis, banks and other traditional market participants were forced to tighten credit and, in some cases, exit certain markets and lending products. As a result, despite continued strong demand for credit, many consumers have had fewer borrowing choices and declining access to credit product, creating an opportunity for non-bank lending platforms like us to fill the void left by traditional lenders.
The Home Loan Market is Undergoing a Substantial Transformation
The home loan market is the largest component of U.S. consumer borrowing and requires originators and servicers to have various licenses as well as substantial training and expertise. Following the Financial Crisis, the GSEs, government agencies (collectively with the GSEs, the “Agencies” and each, an “Agency”) and federal and state regulators have imposed substantial compliance and capital requirements on banks and other market participants which has raised origination costs and reduced economic returns. We believe that increasing regulation and stricter lending policies provide a compelling opportunity for a non-bank consumer lender of scale like us to take market share. Evidencing this, non-bank lenders have grown market share from 10% of the consumer lending market in 2009 to 42% in 2014. Additionally, as more consumers are becoming increasingly comfortable obtaining credit products through technology-driven platforms, there has been a significant increase in the share of the home loan market originated through the direct/indirect channels, including internet-based platforms.
Impact of Emerging Disruptive Business Models
Online marketplaces and other disruptive business models have emerged to connect buyers and sellers across many industries to increase consumer choice and improve customer satisfaction. Specifically in the financial sector, many of these platforms have focused on consumer lending. The majority of these platforms have sought to increase availability of unsecured personal loans to consumers via online marketplaces relative to alternatives such as credit cards, while still offering attractive yields to support investor return requirements. As a result, the consumer experience has improved, costs have been lowered and consumers have become increasingly comfortable using online platforms and technology to fulfill their financial needs.
Reemergence of Historically Important Lending Products
Since December 31, 2011, the home equity of U.S. consumers has increased by approximately $5.3 trillion as of March 31, 2015. Despite this, home equity lines of credit, which provide consumers with significant capacity to borrow against their home’s equity, generally at more attractive terms than those available with credit cards and unsecured loans, have declined 29% since December 31, 2008, to approximately $500 billion, as of June 30, 2015. As the market for home equity loans recovers, we believe consumers will utilize their increased home equity to more cost-efficiently meet their borrowing needs.
Additionally, in 2014, Agency home loans represented 96% of all home loans originated, well above the 2006 level of 44%. We believe that the current record level of U.S. government and Agency involvement in the home loan market will abate as private investors seek to invest in the improving housing market, allowing borrowers greater choice and access to non-Agency products.
4
Table of Contents
While many new entrants have been able to grow quickly in the personal loan space due to the lower barriers to entry, originating home loans, home equity loans and other home loan products requires licensing, training and significant operational and regulatory expertise, which we believe these competitors generally lack.
OUR COMPETITIVE STRENGTHS
Full-Service Consumer Lending Platform of Scale with National Brand Awareness
We are currently the second largest direct-to-consumer non-bank originator, and we have underwritten and facilitated over $50 billion in total loan funding since our launch in 2010. The regulated nature and complexity of the home loan market create a significant barrier to entry, as competitors must have substantial scale and expertise in order to effectively compete. We have invested in our infrastructure, licensed personnel, national brand and technology platform as well as in direct customer relationships to position ourselves for future growth. Given our expertise in complex home loan products and our extensive consumer database, we believe that we are well positioned to continue our expansion into additional loan products. Together, we believe our brand, strong online and offline presence, full service capabilities and breadth of operations provide us significant advantages over competitors which we believe are unable to achieve the same benefits and cost advantages of scale.
Powerful, Efficient and Scalable Technology
Our proprietary technology systems, which were built de novo to address the post-Financial Crisis consumer lending environment, provide us substantial competitive advantages. Our technology significantly automates historically labor-intensive processes including the application process, credit decisioning and scoring, product identification and selection, loan funding, servicing, regulatory compliance and fraud detection, enabling us to be more efficient. Specifically, our technology allows us to instantly determine the optimal products to offer our potential customers, improving lead conversion and ultimately lowering average customer acquisition costs. Our systems continuously update our comprehensive database of financial and contact information for millions of consumers, which we monitor and analyze to identify attractive future lending opportunities.
Superior Customer Experience
We believe that our robust distribution and service model allows us to provide a superior customer experience throughout the lending life cycle. We employ a multi-channel model, consisting of our online platform, a sales force of more than 1,500 licensed employees located across the United States, strong relationships with affinity partners and our network of independent home loan brokers. We believe this model provides our customers with both optionality and convenience, as customers may pursue a loan through the channel of their choice. Further, our platform improves speed to close and increases funding certainty for our customers. We believe our customer-centric approach has been validated by our NPS score of 59.5 for the six months ended June 30, 2015. We expect that this continuous high level of service and resulting customer satisfaction positions us well to be successful in expanding our offering of loan products and services to our customer base.
Low-Cost Customer Acquisition Capabilities
Through our multi-channel origination platform, we drive acquisition costs lower through process automation and superior product decisioning technology. Our technology allows us to leverage our over 300,000 leads per month by providing customer-level intelligence to our platform prior to customer contact, which allows us to better understand a borrower’s financial profile and borrowing needs. Ultimately, we believe this drives superior lead conversion, a better customer service experience, improved retention and recapture rates
5
Table of Contents
and higher customer lifetime values. Moreover, as we continue to expand our product suite, we believe that we will be able to better leverage our database and cross-sell opportunities, and thereby further increase customer conversions and further reduce our average customer acquisition costs.
Proprietary Workflow Solution Supports Flexible Business Model
Our dynamic workflow solutions make our platform more flexible than those of many of our competitors. Utilizing both technology and our workforce, we optimize our capacity utilization and workflow capabilities to efficiently process significantly higher loan volume. Through our proprietary decisioning technology and expansive database, we are able to identify consumers that would benefit from a particular lending product. Our sales force proactively contacts these customers and highlights the attractiveness of these particular products. Whereas many loan officers are licensed in only one or two states, we have built a bespoke training program that licenses our sales force in several states for multiple credit products. This allows us to quickly reallocate resources to specific geographic areas based on demand, which is important particularly in the home loan market in which a licensed loan officer is required to handle each transaction. For the six months ended June 30, 2015, approximately 40% of our aggregate home loan origination was secured by properties concentrated in the states of California, Texas and Arizona. The properties securing the aggregate outstanding UPB of our home loan servicing rights portfolio have a similar geographic concentration.
Capital-Light Model, Driven by Stable and Diverse Funding Base
Our combination of an efficient, originate-to-sell business model in home loans and home equity loans and marketplace model with stable and diverse investors in personal loans allows us to generate significant loan volume with less capital than traditional market lenders. Currently, home loan products remain on our balance sheet for 17.3 days on average, and our personal loan products are funded directly by our issuing bank partner and then sold to investors, requiring no use of our balance sheet. We have developed a stable and diverse funding base and built an experienced capital markets team which has cultivated strong relationships with private investors, the GSEs, government agencies and more than 80 financial institutions globally.
Proven and Visionary Management Team
Our senior management team brings extensive experience from numerous high-growth, technology-enabled consumer lending companies as well as extensive capital markets and financing expertise throughout multiple credit environments over the past three decades. Our founder, Chairman and CEO, Anthony Hsieh, has nearly 30 years of consumer lending experience and previously founded two successful technology-enabled consumer lending companies, one of which was the first to underwrite a consumer loan online.
OUR STRATEGY FOR GROWTH
Increase Customer Penetration and Distribution in Existing Products and Markets
We initially focused on the $8.1 trillion U.S. home loan market and have entered the $1.0 trillion unsecured consumer lending market and $0.5 trillion home equity market where together we believe there is considerable opportunity for continued growth and further market penetration. We had an estimated 2.0% market share in the home loan origination market as of June 30, 2015, as compared to approximately 1.0% as of June 30, 2014. In addition, we launched our personal loan products in the second quarter of 2015, and through September 30, 2015, we have facilitated over $140 million in personal loans. We believe that our technology platform and growing proprietary database of more than 11 million consumers will allow us to further distribute our existing products to both new and existing customers. As banks have retreated, as evidenced by their decline in market share from 90% to 58% in the home loan market and 45% to 40% in the non-home loan consumer finance market from 2010
6
Table of Contents
to 2014, we expect that consumer lending will continue to migrate towards technology-enabled, marketplace platforms and non-bank lenders such as ourselves. We also believe that origination volumes in the home loan and personal lending markets are below historical averages and that there will be a significant opportunity to increase volume through overall industry growth as the U.S. economy improves.
Introduce Additional Products to Our Platform
Our platform has been developed to allow us to expand into new product categories with minimal incremental cost, as evidenced by the recent launches of our personal loan and home equity products. We currently offer the bookends of consumer credit, ranging from home loans to unsecured personal loans. As we continue to expand our product suite, our consumer lending capabilities will provide a broad range of credit solutions that will serve much of a typical U.S. consumer’s borrowing needs. As we launch additional products, we will be able to leverage our proprietary database and technology, as well as our sales force to efficiently identify and engage with consumers that could benefit from our expanded product suite. As a result, we expect to continue to reduce our average customer acquisition costs as we scale, improve customer conversion rates and become increasingly efficient.
Investing in Our Brand
We utilize highly targeted and sophisticated marketing strategies, which include internet, broadcast and new media, strategic alliances and a national television campaign. During 2014, we invested over $93 million on marketing, representing 17% of our total net revenue. This investment has helped us attract customers and we expect to continue to invest in our brand. As customers continue to associate our brand with high quality service and a consumer-oriented approach, as evidenced by our NPS, we believe this will allow us to further increase market penetration and support our product expansion.
Further Expand Industry Partnerships
We have established relationships with key industry partners, including leading homebuilders, real estate brokerage firms and independent home loan brokers. Once we establish a relationship with a customer through an industry partnership, we have the ability to cross-sell additional and repeat products which enhances the lifetime value of that customer. We believe there is significant opportunity to deepen our existing relationships and develop additional partnerships in a capital-light manner.
Expand Our Distribution Capabilities
We currently have a nationwide distribution network and believe there are additional opportunities to strategically deepen our presence in key markets. We plan to leverage our diversified product offerings and scalable platform to attract industry talent. We have grown organically and effectively pursued and integrated strategic acquisition opportunities, as demonstrated by our launch of LDWholesale and our acquisitions of imortgage.com, Inc. (“imortgage”) and Mortgage Master, Inc. (“Mortgage Master”).
Grow Our Investment in Technology and Training
We plan to continue to invest significantly in our technology, which is designed to provide a best-in-class customer experience, reduce average customer acquisition costs and enhance profitability. This investment will also focus on improving our proprietary algorithms to increase our cutting edge product optimization and decisioning, as well as further enhanced credit modeling. We also plan to continue to invest considerably in our people and training as we believe that the training system we have developed in-house is a key advantage that enhances our multi-channel business model.
7
Table of Contents
OUR CURRENT PRODUCTS AND SERVICES
We offer a broad suite of consumer loan products, including what we consider to be the bookends of consumer finance, serving a wide range of borrowers through a variety of market environments. In addition to our nationwide presence in the U.S. residential home loan market, we also provide customers with other consumer loan products and services. We believe that expanding into new consumer products and services is a natural extension of our core brand that will be attractive to both existing and new customers. For more detail on each of our products and services described below, see “Business—Our Current Products and Services.”
Home Loans
We offer customers a range of home loan products, secured either by a first or second lien against a residential property. We expect our extensive home loan capabilities, combined with our consumer-direct distribution model, will further grow our presence in the home loan market and increase our current rate of growth in market share. We sell the home loans that we originate to secondary market investors, including a variety of institutional investors, generally within 15-20 days of origination. Our current product suite includes: (i) conventional agency loans, (ii) FHA & VA loans and (iii) conventional prime jumbo loans.
Home Equity Loans
In the third quarter of 2015, we expanded our product suite to include home equity loans. We originate certain home equity loans that are designed to provide homeowners access to efficient capital by accessing the home equity that borrowers have accumulated in their homes. Home equity products can take a number of forms including, but not limited to, home improvement loans designed to fund renovations to an existing property, closed end second lien loans that sit behind an existing first lien loan, or home equity lines of credit that allow borrowers to draw funds against their home equity on a revolving basis. We believe many home equity loan products offer borrowers attractive costs of funds relative to other loan products besides first lien home loans. We also believe that as the home loan market continues to recover, home equity loans will become an increasingly attractive financial product for our customers.
Personal Loans
In the second quarter of 2015, we expanded our product suite to include personal loans, which are offered through a bank partnership model. This personal loan product is designed to meet customers’ credit needs, regardless of whether they own a home. The personal loan product typically offers customers access to between $5,000 and $35,000 of unsecured credit, is fully amortizing, has a term of three to five years, includes no prepayment penalties and generally provides a lower interest rate than other unsecured borrowing alternatives such as credit cards. Currently, personal loans that are approved through our program are generally extended to borrowers who have a minimum FICO score of 660 or higher, satisfactory debt-to-income ratios and many other elements that contribute to our proprietary credit decisioning and scoring. We believe that these loans are simple, fair and responsible credit products that make it easier for many consumers to lower their monthly borrowing costs and meet their financial goals.
Loan Servicing
Prior to 2012, we sold substantially all the servicing rights associated with our home loan products. In 2012, we began retaining a portion of this servicing in order to complement our home loan business. While our net income is predominantly attributable to gain on origination and sale of loans (87% of total net revenues for the six months ended June 30, 2015), by maintaining a relationship with our customers through the servicing function, we are able to preserve and improve repeat origination and cross-sell opportunities, thereby increasing
8
Table of Contents
the lifetime value of our customers. Home loan servicing includes the performance of a variety of loan administration and servicing functions, including the collection and remittance of loan payments, responding to customer inquiries, and accounting for principal and interest, among other responsibilities. Home loan servicing produces strong recurring, contractual fee-based revenue with minimal credit risk. For the six months ended June 30, 2015, we earned $14.5 million in servicing income, net of subservicing expenses (which do not include certain administrative expenses related to oversight of our subservicing relationship) and excluding servicing losses of $19.3 million from fair value changes and sale of our servicing rights, out of total net income of $69.2 million. Origination income, net and servicing income represented 9% and 4%, respectively, of total net revenues for the six months ended June 30, 2015. We entered the personal loan servicing market in the second quarter of 2015 when we began to facilitate personal loans. Similar to our home loan servicing, we are able to enhance the lifetime value of the customer through the servicing relationship. Personal loan servicing is comprised of account maintenance, collection and processing of payments from borrowers and remittance of payments to investors. We engage third-parties as subservicers for both home loans and personal loans, which allows us to generate revenue in an operationally efficient manner while maintaining ongoing relationships with our customers. We are currently able to service loans in all 50 states.
RISK FACTORS
An investment in our Class A common stock involves a high degree of risk. Any of the factors set forth under “Risk Factors” may limit our ability to successfully execute our business strategy. You should carefully consider all of the information set forth in this prospectus and, in particular, should evaluate the specific factors set forth under “Risk Factors” in deciding whether to invest in our Class A common stock. Among these important risks are the following:
| • | We have experienced rapid growth which may be difficult to sustain and which may place significant demands on our resources; |
| • | We may not be able to continue to grow our loan production volume; |
| • | Our new loan products and enhancements may not achieve market acceptance; |
| • | Our indebtedness and other financial obligations may limit our financial and operating activities and our ability to incur additional debt to fund future needs; |
| • | Our home loan origination revenues are highly dependent on macroeconomic and U.S. residential real estate market conditions; |
| • | We depend on the programs of GSEs and governmental agencies (such as Fannie Mae, Freddie Mac and Ginnie Mae), and discontinuation, or changes in the roles or practices of these entities, without comparable private sector substitutes, could materially and negatively affect us; |
| • | We are dependent on warehouse lines of credit and other sources of capital and liquidity to meet the financing requirements of our business, and our inability to access such capital and liquidity would materially and adversely affect our business; |
| • | Our hedging strategies may not be successful in mitigating our risks associated with changes in interest rates; |
| • | Our servicing rights are highly volatile assets with continually changing values which could affect our financial condition and results of operations; |
| • | We operate in a highly regulated industry, and a material or continued failure to comply with applicable laws and regulations could subject us to lawsuits or governmental actions, which could materially and adversely affect us; |
9
Table of Contents
| • | Unlike our competitors that are depository institutions, we are subject to state licensing and operational requirements that result in substantial compliance costs and our business would be adversely affected if our licenses are impaired; |
| • | We may be held responsible for the actions of the companies with which we do business, including the subservicers who service substantially all of our servicing rights; |
| • | We face litigation and legal proceedings that could have a material adverse effect on us; and |
| • | We will be a “controlled company” and, as a result, qualify for, and intend to rely on, exemptions from certain corporate governance requirements. You will not have the same protections afforded to stockholders of companies that are subject to such requirements. |
IMPLICATIONS OF BEING AN EMERGING GROWTH COMPANY
We qualify as an emerging growth company as defined in the Jumpstart Our Business Startups Act of 2012 (the “JOBS Act”). For as long as we remain an emerging growth company, we may take advantage of certain limited exemptions from various reporting requirements that are applicable to other public companies. These provisions include:
| • | a requirement to have only two years of audited financial statements and only two years of related selected financial data and management’s discussion and analysis of financial condition and results of operations disclosure; |
| • | an exemption from the auditor attestation requirement in the assessment of our internal control over financial reporting pursuant to the Sarbanes-Oxley Act of 2002 (the “Sarbanes-Oxley Act”); |
| • | an exemption from new or revised financial accounting standards until they would apply to private companies and from compliance with any new requirements adopted by the Public Company Accounting Oversight Board requiring mandatory audit firm rotation; |
| • | reduced disclosure about the emerging growth company’s executive compensation arrangements; and |
| • | no requirement to seek non-binding advisory votes on executive compensation or golden parachute arrangements. |
The JOBS Act permits emerging growth companies to take advantage of an extended transition period to comply with new or revised accounting standards applicable to public companies. We are choosing to “opt out” of this provision, and as a result, we plan to comply with new or revised accounting standards as required when they are adopted. This decision to opt out of the extended transition period is irrevocable.
We have elected to adopt certain of the reduced disclosure requirements available to emerging growth companies. As a result of these elections, the information that we provide in this prospectus may be different than the information you may receive from other public companies in which you hold equity interests. In addition, it is possible that some investors will find our common stock less attractive as a result of our elections, which may result in a less active trading market for our common stock and more volatility in our stock price.
We will remain an emerging growth company until the earliest of (i) the end of the fiscal year following the fifth anniversary of the completion of this offering, (ii) the first fiscal year after our annual gross revenues exceed $1.0 billion, (iii) the date on which we have, during the previous three-year period, issued more than $1.0 billion in non-convertible debt securities or (iv) the end of any fiscal year in which the market value of our Class A common stock held by non-affiliates exceeded $700 million as of the end of the second quarter of that fiscal year.
10
Table of Contents
ORGANIZATIONAL STRUCTURE
Following the offering, loanDepot, Inc. will be a holding company and its sole material asset will be an equity interest in LD Holdings, which will be a holding company and have no material assets other than its equity interests in LDLLC and LD Intermediate, LLC (“Intermediate LLC”). Intermediate LLC will also be a holding company with no material assets other than its equity interest in LDLLC. Through its ability to appoint the board of managers of LD Holdings, which will have the ability to appoint the board of managers of LDLLC, our operating subsidiary that conducts all of our operations directly, loanDepot, Inc. will indirectly operate and control all of the business and affairs and consolidate the financial results of LD Holdings and its subsidiaries, including LDLLC.
Prior to the offering, (i) the sixth amended and restated limited liability company agreement of LDLLC (the “6th LLC Agreement”) will be further amended and restated as the seventh amended and restated limited liability company agreement of LDLLC (“7th LLC Agreement”) to, among other things, modify its capital structure by replacing the different classes of interests (other than the Class I common units of LDLLC) with a single new class of Class A common units that we refer to as “LLC Units,” (ii) LD Investment Holdings, Inc. (“Parthenon Blocker”) and the Continuing LLC Members will contribute to LD Holdings, a newly formed Delaware limited liability company, all of their respective units in LDLLC in exchange for a single class of Class A common units to be issued by LD Holdings (“Holdco Units”) on a one-for-one basis and (iii) the holders of Class I common units of LDLLC will simultaneously contribute all of their respective Class I common units of LDLLC for substantially identical Class I common units of LD Holdings. In connection with such exchange transactions, which will result in LDLLC becoming a wholly owned subsidiary of LD Holdings, each of Parthenon Blocker, the Continuing LLC Members and the holders of Class I common units of LD Holdings will enter into the limited liability company agreement of LD Holdings (the “Holdings LLC Agreement”). After completing these exchange transactions, LD Holdings will further amend and restate the 7th LLC Agreement to simplify the equity arrangements of LDLLC as a subsidiary company and to create two classes of common units of LDLLC, Class A common units which will have voting and economic rights and Class B common units which will have voting rights only and no economic rights (as amended and restated, the “8th LLC Agreement”).
In connection with the exchange transactions set forth above, we will issue to the Continuing LLC Members a number of shares of loanDepot, Inc. Class B common stock equal to the number of Holdco Units held by such Continuing LLC Members. Our Class B common stock will entitle holders thereof to one vote per share and will vote as a single class with our Class A common stock. However, the Class B common stock will not have any economic rights. Pursuant to the terms of the Holdings LLC Agreement, the Continuing LLC Members will have the right to exchange one Holdco Unit and one share of Class B common stock together for one share of our Class A common stock, subject to customary conversion rate adjustments for stock splits, stock dividends and reclassifications. Any Holdco Units exchanged under the exchange provisions described above will thereafter be owned by loanDepot, Inc. Any shares of Class B common stock exchanged will be cancelled.
Following the exchange transactions set forth above, in order to facilitate certain HUD regulatory compliance matters for LDLLC, (i) LD Holdings will form Intermediate LLC, a Delaware limited liability company, (ii) LDLLC will issue 999 Class A common units to LD Holdings in exchange for all of the LDLLC units then held by LD Holdings, representing 99.9% of the management and voting power of LDLLC and 100.0% of the economic interest of LDLLC, and (iii) LDLLC will issue one Class B common unit to Intermediate LLC for $1.00 in cash, representing 0.1% of the management and voting power of LDLLC.
Thereafter, Parthenon Blocker and loanDepot, Inc. will engage in a series of transactions that will result in Parthenon Blocker merging with and into loanDepot, Inc., with loanDepot, Inc. remaining as the surviving corporation. As a result of such transactions, affiliates of Parthenon Capital Partners (the “Parthenon Stockholders”) will exchange all of the equity interests of Parthenon Blocker in return for shares of loanDepot, Inc. Class A common stock.
11
Table of Contents
The diagram below depicts our simplified organizational structure immediately following this offering after giving effect to the use of proceeds to us therefrom and assuming no exercise by the underwriters of their option to purchase additional shares of Class A common stock. See “Organizational Structure.”
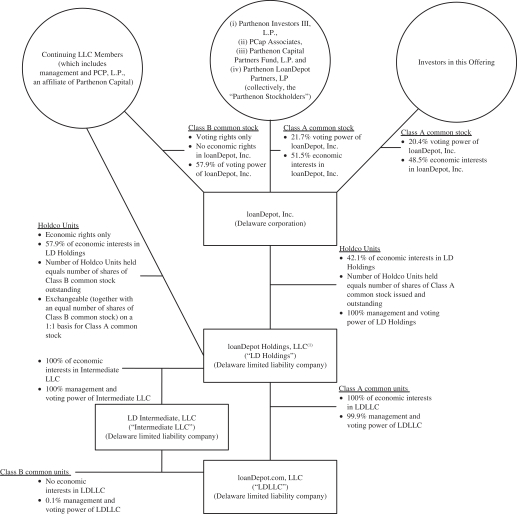
| (1) | Class I common units will remain outstanding following the Reorganization Transactions and this offering as units of LD Holdings. Holders of such units will only be entitled to the fixed payment rights set forth in the Holdings LLC Agreement and are not otherwise entitled to any distributions or residual interest in LD Holdings. See “Certain Relationships and Related Party Transactions—imortgage Settlement Agreement.” |
12
Table of Contents
RECENT DEVELOPMENTS
Preliminary Third Quarter Results
For the Three and Nine Months Ended September 30, 2015
The following table presents ranges for our expected total net revenues, net (loss) income, Adjusted EBITDA, Adjusted Net (Loss) Income, gain on origination and sale of loans, net and origination income, net—personal loans for the three and nine months ended September 30, 2015 compared to actual results for the three and nine months ended September 30, 2014. See “—Non GAAP Measures Reconciliation” for a reconciliation of Adjusted EBITDA and Adjusted Net (Loss) Income to net income.
| Three Months | Nine Months | |||||||||||||||||||||||
| Three Months Ended | Nine Months Ended | Ended | Ended | |||||||||||||||||||||
| September 30, 2015 | September 30, 2015 | September 30, 2014 | September 30, 2014 | |||||||||||||||||||||
| (Dollars in millions) | Low | High | Low | High | Actual | Actual | ||||||||||||||||||
| Unaudited Financial Data |
||||||||||||||||||||||||
| Total net revenues |
$ | 212.7 | $ | 226.0 | $ | 702.4 | $ | 715.7 | $ | 150.3 | $ | 394.5 | ||||||||||||
| Net (loss) income |
(5.2 | ) | 8.1 | 64.0 | 77.3 | 11.0 | 21.2 | |||||||||||||||||
| Adjusted EBITDA |
(1.0 | ) | 12.4 | 99.8 | 113.8 | 18.1 | 41.6 | |||||||||||||||||
| Adjusted Net (Loss) Income |
(5.2 | ) | 2.6 | 46.4 | 54.4 | 7.6 | 15.9 | |||||||||||||||||
| Gain on origination and sale of loans, net |
190.4 | 202.3 | 615.8 | 627.7 | 112.3 | 306.2 | ||||||||||||||||||
| Origination income, net - Personal loans |
4.9 | 5.2 | 5.4 | 5.7 | — | — | ||||||||||||||||||
The following table presents sequential quarterly results for ranges of our expected total net revenues, net (loss) income, Adjusted EBITDA, Adjusted Net (Loss) Income, gain on origination and sale of loans, net and origination income, net—personal loans for the three months ended September 30, 2015 compared to actual results for the three months ended June 30, 2015.
| Three Months | ||||||||||||
| Three Months Ended | Ended | |||||||||||
| September 30, 2015 | June 30, 2015 | |||||||||||
| (Dollars in millions) | Low | High | Actual | |||||||||
| Unaudited Financial Data |
||||||||||||
| Total net revenues |
$ | 212.7 | $ | 226.0 | $ | 244.0 | ||||||
| Net (loss) income |
(5.2 | ) | 8.1 | 11.4 | ||||||||
| Adjusted EBITDA |
(1.0 | ) | 12.4 | 34.2 | ||||||||
| Adjusted Net (Loss) Income |
(5.2 | ) | 2.6 | 16.0 | ||||||||
| Gain on origination and sale of loans, net |
190.4 | 202.3 | 199.4 | |||||||||
| Origination income, net - Personal loans |
4.9 | 5.2 | 0.6 | |||||||||
The following table presents other financial data related to the loans we originated and facilitated and the number of customers we serviced for the three and nine months ended September 30, 2015 and 2014 and the three months ended June 30, 2015.
13
Table of Contents
| Three Months Ended | Nine Months Ended | |||||||||||||||
| September 30, | September 30, | |||||||||||||||
| (Dollars in millions) | 2015 | 2014 | 2015 | 2014 | ||||||||||||
| Unaudited Financial Data |
||||||||||||||||
| Fundings by Product(1): |
||||||||||||||||
| Home loans |
$ | 7,265.7 | $ | 3,543.9 | $ | 21,582.4 | $ | 8,912.7 | ||||||||
| Personal loans |
126.6 | — | 140.4 | — | ||||||||||||
|
|
|
|
|
|
|
|
|
|||||||||
| Total fundings |
$ | 7,392.3 | $ | 3,543.9 | $ | 21,722.8 | $ | 8,912.7 | ||||||||
|
|
|
|
|
|
|
|
|
|||||||||
| Three Months Ended | ||||||||
| September 30, 2015 |
June 30, 2015 |
|||||||
| Fundings by Product(1): |
||||||||
| Home loans |
$ | 7,265.7 | $ | 7,914.8 | ||||
| Personal loans |
126.6 | 13.9 | ||||||
|
|
|
|
|
|||||
| Total fundings |
$ | 7,392.3 | $ | 7,928.7 | ||||
|
|
|
|
|
|||||
| Nine Months Ended September 30, |
Six Months Ended June 30, 2015 |
|||||||||||
| 2015 | 2014 | |||||||||||
| Number of Customers Serviced by Product(1)(2): |
||||||||||||
| Home loans |
89,175 | 51,623 | 75,761 | |||||||||
| Personal loans |
8,971 | — | 840 | |||||||||
|
|
|
|
|
|
|
|||||||
| Total Number of Customers Serviced |
98,146 | 51,623 | 76,601 | |||||||||
|
|
|
|
|
|
|
|||||||
| (1) | Does not reflect our home equity loan product, which was recently launched in September 2015. |
| (2) | Measured by number of home loan and personal loan units serviced. |
Three Months Ended September 30, 2015 Compared to Three Months Ended September 30, 2014
We expect total net revenues for the three months ended September 30, 2015 to be between $212.7 million and $226.0 million, representing an increase of between 42% and 50% compared to the same period in 2014.
For the three months ended September 30, 2015, our net (loss) income is estimated to be between ($5.2) million and $8.1 million, representing a decrease of between 147% and 26% compared to the same period in 2014.
The increase in estimated total net revenues compared to the 2014 period is attributable to an increase in loan origination volumes due to the continued growth across all our existing channels along with the acquisition of Mortgage Master. The decrease in estimated net income is attributable to increased costs related to the expansion and growth of our home loan and consumer loan platforms as well as the development of our home equity loan product; increased personnel costs and stock-based compensation; and unrealized mark-to-market losses on servicing rights due to a decrease in interest rates on a higher balance of servicing rights during the current period.
We expect our Adjusted EBITDA for the three months ended September 30, 2015 to be between ($1.0) million and $12.4 million, representing a decrease of between 106% and 32% compared to the same period in 2014.
14
Table of Contents
For the three months ended September 30, 2015, our Adjusted Net (Loss) Income is estimated to be between ($5.2) million and $2.6 million, representing a decrease of between 168% and 65% compared to the same period in 2014. See “—Non GAAP Measures Reconciliation” for a reconciliation of Adjusted EBITDA and Adjusted Net (Loss) Income to net income.
Nine Months Ended September 30, 2015 Compared to Nine Months Ended September 30, 2014
We expect total net revenues for the nine months ended September 30, 2015 to be between $702.4 million and $715.7 million, representing an increase of between 78% and 81% compared to the same period in 2014.
For the nine months ended September 30, 2015, our net income is estimated to be between $64.0 million and $77.3 million, representing an increase of between 202% and 265% compared to the same period in 2014.
The increase in estimated total net revenues and estimated net income is attributable to an increase in loan origination volumes due to the continued growth across all our existing channels along with the acquisition of Mortgage Master.
We expect our Adjusted EBITDA for the nine months ended September 30, 2015 to be between $99.8 million and $113.8 million, representing an increase of between 140% and 174% compared to the same period in 2014.
For the nine months ended September 30, 2015, our Adjusted Net Income is estimated to be between $46.4 million and $54.4 million, representing an increase of between 193% and 243% compared to the same period in 2014. See “—Non GAAP Measures Reconciliation” for a reconciliation of Adjusted EBITDA and Adjusted Net Income to net income.
Three Months Ended September 30, 2015 Compared to Three Months Ended June 30, 2015
We expect total net revenues for the three months ended September 30, 2015 to be between $212.7 million and $226.0 million, representing a decrease of between 13% and 7% compared to the three months ended June 30, 2015.
For the three months ended September 30, 2015, our net (loss) income is estimated to be between ($5.2) million and $8.1 million, representing a decrease of between 145% and 29% compared to the three months ended June 30, 2015.
The decrease in estimated total net revenues compared to the three months ended June 30, 2015 is primarily attributable to unrealized mark-to-market losses on servicing rights due to a decrease in interest rates on a higher balance of servicing rights and a generally weaker home loan market during the three months ended September 30, 2015 as compared to the three months ended June 30, 2015.
We expect our Adjusted EBITDA for the three months ended September 30, 2015 to be between ($1.0) million and $12.4 million, representing a decrease of between 103% and 64% compared to the three months ended June 30, 2015.
For the three months ended September 30, 2015, our Adjusted Net (Loss) Income is estimated to be between ($5.2) million and $2.6 million, representing a decrease of between 132% and 84% compared to the three months ended June 30, 2015. See “—Non GAAP Measures Reconciliation” for a reconciliation of Adjusted EBITDA and Adjusted Net (Loss) Income to net income.
15
Table of Contents
The information and estimates are subject to revision as we prepare our consolidated financial statements and other disclosures as of and for the three months and nine months ended September 30, 2015, including all disclosures required by GAAP. Because we have not completed our normal quarterly closing and review procedures for the three months and nine months ended September 30, 2015, and subsequent events may occur that require material adjustments to these results, the final results and other disclosures for the three months and nine months ended September 30, 2015 may differ materially from these estimates. In addition, the preliminary financial and other data set forth above and below has been prepared by, and is the responsibility of, our management. The information and estimates have not been compiled or examined by our independent registered public accounting firm nor has our independent registered public accounting firm performed any procedures with respect to this information or expressed any opinion or any form of assurance on such information. These estimates should not be viewed as a substitute for full financial statements prepared in accordance with GAAP or as a measure of performance. In addition, these estimated results of operations for the three months and nine months ended September 30, 2015 are not necessarily indicative of the results to be achieved for any future period. See “Cautionary Statement Regarding Forward-Looking Statements.” These estimated results of operations should be read together with “Selected Financial Data,” “Management’s Discussion and Analysis of Financial Condition and Results of Operations” and our audited consolidated financial statements and related notes included elsewhere in this prospectus.
Adjusted EBITDA and Adjusted Net (Loss) Income are non-GAAP financial measures. For a description of these measures and their limitations, see “—Summary Historical Consolidated Financial and Other Data.”
Non-GAAP Measures Reconciliation
The following table reconciles net (loss) income to Adjusted EBITDA for the periods presented:
| Three Months | Nine Months | |||||||||||||||||||||||
| Three Months Ended | Nine Months Ended | Ended | Ended | |||||||||||||||||||||
| September 30, 2015 | September 30, 2015 | September 30, 2014 | September 30, 2014 | |||||||||||||||||||||
| (Dollars in millions) | Low | High | Low | High | Actual | Actual | ||||||||||||||||||
| Unaudited Financial Data |
||||||||||||||||||||||||
| Adjusted EBITDA: |
||||||||||||||||||||||||
| Net (loss) income |
$ | (5.2 | ) | $ | 8.1 | $ | 64.0 | $ | 77.3 | $ | 11.0 | $ | 21.2 | |||||||||||
| Other interest expense |
2.6 | 2.7 | 7.7 | 7.8 | 2.2 | 6.6 | ||||||||||||||||||
| Provision for income taxes |
— | — | 0.2 | 0.2 | 0.1 | 0.6 | ||||||||||||||||||
| Depreciation and amortization |
5.2 | 5.3 | 13.7 | 14.0 | 3.1 | 8.3 | ||||||||||||||||||
|
|
|
|
|
|
|
|
|
|
|
|
|
|||||||||||||
| EBITDA |
2.6 | 16.1 | 85.6 | 99.3 | 16.4 | 36.7 | ||||||||||||||||||
| Equity-based compensation expense |
4.7 | 4.8 | 16.4 | 16.8 | 1.3 | 3.9 | ||||||||||||||||||
| Acquisition related expense |
(7.7 | ) | (7.9 | ) | (6.4 | ) | (6.5 | ) | — | 0.1 | ||||||||||||||
| Litigation reserve |
(0.7 | ) | (0.7 | ) | 2.1 | 2.1 | — | — | ||||||||||||||||
| New product and channel development costs |
— | — | 1.2 | 1.2 | 0.2 | 0.5 | ||||||||||||||||||
| Other expense |
0.1 | 0.1 | 0.9 | 0.9 | 0.2 | 0.4 | ||||||||||||||||||
|
|
|
|
|
|
|
|
|
|
|
|
|
|||||||||||||
| Adjusted EBITDA |
$ | (1.0 | ) | $ | 12.4 | $ | 99.8 | $ | 113.8 | $ | 18.1 | $ | 41.6 | |||||||||||
|
|
|
|
|
|
|
|
|
|
|
|
|
|||||||||||||
| Adjusted EBITDA Margin: |
||||||||||||||||||||||||
| Adjusted EBITDA |
$ | (1.0 | ) | $ | 12.4 | $ | 99.8 | $ | 113.8 | $ | 18.1 | $ | 41.6 | |||||||||||
| Total net revenues |
212.7 | 226.0 | 702.4 | 715.7 | 150.3 | 394.5 | ||||||||||||||||||
| Adjusted EBITDA Margin |
0 | % | 5 | % | 14 | % | 16 | % | 12 | % | 11 | % | ||||||||||||
16
Table of Contents
| Three Months Ended June 30, 2015 |
||||
| (Dollars in millions) |
Actual | |||
| Unaudited Financial Data |
||||
| Adjusted EBITDA: |
||||
| Net income |
$ | 11.4 | ||
| Other interest expense |
2.6 | |||
| Provision for income taxes |
— | |||
| Depreciation and amortization |
4.5 | |||
|
|
|
|||
| EBITDA |
18.5 | |||
| Equity-based compensation expense |
10.6 | |||
| Acquisition related expense |
1.3 | |||
| Litigation reserve |
2.8 | |||
| New product and channel development costs |
0.4 | |||
| Other expense |
0.6 | |||
|
|
|
|||
| Adjusted EBITDA |
$ | 34.2 | ||
|
|
|
|||
| Adjusted EBITDA Margin: |
||||
| Adjusted EBITDA |
$ | 34.2 | ||
| Total net revenues |
244.0 | |||
| Adjusted EBITDA Margin |
14 | % | ||
The following table reconciles net income to Adjusted Net (Loss) Income for the periods presented:
| Three Months | Nine Months | |||||||||||||||||||||||
| Three Months Ended | Nine Months Ended | Ended | Ended | |||||||||||||||||||||
| September 30, 2015 | September 30, 2015 | September 30, 2014 | September 30, 2014 | |||||||||||||||||||||
| (Dollars in millions) | Low | High | Low | High | Actual | Actual | ||||||||||||||||||
| Unaudited Financial Data |
||||||||||||||||||||||||
| Adjusted Net Income(1): |
||||||||||||||||||||||||
| (Loss) income before income taxes |
$ | (5.2 | ) | $ | 8.1 | $ | 64.2 | $ | 77.5 | $ | 11.0 | $ | 21.8 | |||||||||||
| Estimated tax provision |
(2.1 | ) | 3.3 | 26.3 | 31.8 | 4.5 | 8.9 | |||||||||||||||||
|
|
|
|
|
|
|
|
|
|
|
|
|
|||||||||||||
| After tax net (loss) income |
(3.1 | ) | 4.8 | 37.9 | 45.7 | 6.5 | 12.9 | |||||||||||||||||
| Equity-based compensation expense |
2.8 | 2.8 | 9.7 | 9.9 | 0.8 | 2.3 | ||||||||||||||||||
| Acquisition related expense |
(4.6 | ) | (4.7 | ) | (3.8 | ) | (3.9 | ) | — | — | ||||||||||||||
| Litigation reserve |
(0.4 | ) | (0.4 | ) | 1.2 | 1.3 | — | — | ||||||||||||||||
| New product and channel development costs |
— | — | 0.7 | 0.7 | 0.1 | 0.3 | ||||||||||||||||||
| Other expense |
— | — | 0.5 | 0.5 | 0.1 | 0.2 | ||||||||||||||||||
| Amortization of intangible assets |
0.1 | 0.1 | 0.2 | 0.2 | 0.1 | 0.2 | ||||||||||||||||||
|
|
|
|
|
|
|
|
|
|
|
|
|
|||||||||||||
| Adjusted Net (Loss) Income |
$ | (5.2 | ) | $ | 2.6 | $ | 46.4 | $ | 54.4 | $ | 7.6 | $ | 15.9 | |||||||||||
|
|
|
|
|
|
|
|
|
|
|
|
|
|||||||||||||
| Adjusted Net Income Margin: |
||||||||||||||||||||||||
| Adjusted Net (Loss) Income |
$ | (5.2 | ) | $ | 2.6 | $ | 46.4 | $ | 54.4 | $ | 7.6 | $ | 15.9 | |||||||||||
| Total net revenues |
212.7 | 226.0 | 702.4 | 715.7 | 150.3 | 394.5 | ||||||||||||||||||
| Adjusted Net (Loss) Income Margin |
-2 | % | 1 | % | 7 | % | 8 | % | 5 | % | 4 | % | ||||||||||||
17
Table of Contents
| Three Months | ||||
| Ended | ||||
| June 30, 2015 | ||||
| (Dollars in millions) | Actual | |||
| Unaudited Financial Data |
||||
| Adjusted Net Income(1): |
||||
| Income before income taxes |
$ | 11.5 | ||
| Estimated tax provision |
4.7 | |||
|
|
|
|||
| After tax net income |
6.8 | |||
| Equity-based compensation expense |
6.3 | |||
| Acquisition related expense |
0.7 | |||
| Litigation reserve |
1.6 | |||
| New product and channel development costs |
0.2 | |||
| Other expense |
0.3 | |||
| Amortization of intangible assets |
0.1 | |||
|
|
|
|||
| Adjusted Net Income |
$ | 16.0 | ||
|
|
|
|||
| Adjusted Net Income Margin: |
||||
| Adjusted Net Income |
$ | 16.0 | ||
| Total net revenues |
244.0 | |||
| Adjusted Net Income Margin |
7 | % | ||
| (1) | loanDepot, Inc. was incorporated on July 10, 2015 and did not conduct any business transactions or activities and had no material assets or liabilities prior to the Reorganization Transactions and this offering. loanDepot, Inc. is a C-Corp under the Internal Revenue Code of 1986, as amended (the “Code”), and will be subject to income taxes. Estimated tax provision, adjustments and Adjusted Net Income were computed as if we were subject to federal income tax as a subchapter C corporation for the periods presented using a federal tax rate of 35.0% and an estimated effective state tax rate of 6.0%, net of the federal tax benefit. |
Appointment of New Chief Financial Officer
On October 26, 2015, we appointed Bryan Sullivan as our new Executive Vice President, Chief Financial Officer, effective as of October 27, 2015. Mr. Sullivan previously served as our Executive Vice President, Chief Investment and Strategy Officer since joining us in October 2013. Prior to Mr. Sullivan’s appointment, Jon Frojen resigned his position as Chief Financial Officer. Mr. Frojen will remain in our accounting and finance department working with Mr. Sullivan during a transition period that could extend into the first quarter of 2016. The change in Chief Financial Officer was a strategic decision of our management and our board of directors prior to our initial public offering and was not a result of any disagreements between management or our independent registered public accounting firm.
OUR SPONSOR
An affiliate of Parthenon Capital Partners (along with its associated investment funds, “Parthenon Capital”) acquired its interest in us in December 2009. Parthenon Capital is a private equity investment firm with approximately $2 billion of capital under management. Parthenon Capital was founded in March 1998 and focuses on investing in select middle-market companies. The firm invests in a variety of industry sectors with particular expertise in business and financial services, healthcare, distribution/logistics and technology-enabled services. The Parthenon Stockholders will participate as selling stockholders and receive net proceeds of approximately $57.5 million from the sale of their shares of Class A common stock in this offering. In addition, we will use approximately $52.1 million of our net proceeds from the offering to redeem a number of shares of Class A common stock from the Parthenon Stockholders. See “Use of Proceeds” and “Principal and Selling Stockholders.”
18
Table of Contents
CORPORATE INFORMATION
loanDepot, Inc. was incorporated on July 10, 2015 and has had no business transactions or activities and had no material assets or liabilities prior to the Reorganization Transactions and this offering. Our principal executive offices are located at 26642 Towne Centre Drive, Foothill Ranch, California 92610. Our telephone number is (888) 337-6888. The address of our main website is www.loandepot.com. The information contained on or accessible through our website does not constitute a part of this prospectus.
19
Table of Contents
THE OFFERING
| Issuer |
loanDepot, Inc. |
| Class A common stock offered by us |
26,400,000 shares of Class A common stock (or 28,740,000 shares if the underwriters’ option is exercised in full). |
| Class A common stock offered by the selling stockholders |
3,600,000 shares of Class A common stock (or 5,760,000 shares if the underwriters’ option is exercised in full). |
| Underwriters’ option to purchase additional shares |
We and the selling stockholders have granted the underwriters a 30-day option to purchase up to an additional 4,500,000 shares of Class A common stock at the public offering price less underwriting discounts and commissions, of which 2,340,000 shares will be offered by us and 2,160,000 shares will be offered by the selling stockholders. |
| Common stock to be outstanding after giving effect to this offering and the use of proceeds to us therefrom |
61,881,376 shares of Class A common stock (or 64,221,376 shares if the underwriters’ option is exercised in full), including 30,000,000 shares of Class A common stock (or 34,500,000 shares if the underwriters’ option is exercised in full) to be sold in this offering and 31,881,376 shares of Class A common stock (or 29,721,376 shares if the underwriters’ option is exercised in full) to be held by the Parthenon Stockholders. If all outstanding Holdco Units and Class B common stock held by the Continuing LLC Members were exchanged for newly-issued shares of Class A common stock on a one-for-one basis, 147,058,824 shares of Class A common stock (or 147,958,824 shares if the underwriters’ option is exercised in full) would be outstanding. |
| 85,177,447 shares of Class B common stock (or 83,737,447 shares if the underwriters’ option is exercised in full), equal to one share per Holdco Unit (other than any Holdco Units owned by loanDepot, Inc.). |
| Directed share program |
At our request, the underwriters have reserved 1,500,000 shares of Class A common stock, or approximately 5% of the shares of Class A common stock, offered by this prospectus for sale, at the initial public offering price, to our directors, officers, employees, business associates and related persons. |
| Voting |
One vote per share; Class A and Class B common stock vote together as a single class. |
20
Table of Contents
| Voting power held by holders of Class A common stock after giving effect to this offering and the use of proceeds to us therefrom |
42.1% (or 100% if all outstanding Holdco Units and Class B common stock held by the Continuing LLC Members were exchanged for newly-issued shares of Class A common stock on a one-for-one basis). |
| Voting power held by holders of Class B common stock after giving effect to this offering and the use of proceeds to us therefrom |
57.9% (or 0% if all outstanding Holdco Units and Class B common stock held by the Continuing LLC Members were exchanged for newly-issued shares of Class A common stock on a one-for-one basis). |
| Use of proceeds |
We estimate that the net proceeds to us from the offering will be approximately $412.7 million (or approximately $449.3 million if the underwriters exercise in full their option to purchase additional shares of Class A common stock), assuming an initial public offering price of $17.00 per share, which is the midpoint of the estimated price range set forth on the cover page of this prospectus, after deducting underwriting discounts and commissions and estimated offering expenses. We will not receive any proceeds from the sale of shares by the selling stockholders. |
We intend to use net proceeds of approximately (1) $52.1 million to redeem 3,067,227 shares of our Class A common stock from the Parthenon Stockholders, (2) $38.4 million to purchase 2.4 million Holdco Units, together with an equal number of shares of our Class B common stock, from the Exchanging Members, including our Chief Executive Officer and certain of our other officers (at a purchase price per unit and share of Class B common stock, based on the midpoint of the estimated price range set forth on the cover page of this prospectus, net of underwriting discounts and commissions), and (3) up to $14.5 million to purchase Premium Holdco Units from certain holders, including our Chief Executive Officer and certain of our other officers. We will contribute the remaining net proceeds to LD Holdings and LDLLC, who intend to use net proceeds of approximately (1) $63.5 million representing the purchase price related to a prior acquisition to holders of LDLLC’s Class I common units, (2) $32.2 million for contingent consideration and to repay in full promissory notes issued as part of the consideration related to our prior acquisition of Mortgage Master (the “Seller Notes”), and (3) $212.0 million (based on the midpoint of the estimated price range set forth on the cover page of this prospectus) for general corporate purposes. See “Use of Proceeds.”
21
Table of Contents
| Dividend policy |
We have no current plans to pay dividends on our Class A common stock. Any future determination to pay dividends will be made at the discretion of our board of directors, subject to applicable laws, and will depend on a number of factors, including our financial condition, results of operations, capital requirements, contractual restrictions, general business conditions and other factors that our board of directors may deem relevant. See “Dividend Policy.” |
| Listing |
We have been approved to list our Class A common stock on the NYSE under the symbol “LDI”. |
| Exchange rights of the Continuing LLC Members |
Prior to the offering, we will conduct the reorganization described in “Organizational Structure” which will provide, among other things, that each Continuing LLC Member will have the right to cause us and LD Holdings to exchange its Holdco Units and Class B common stock for shares of Class A common stock of loanDepot, Inc. on a one-for-one basis, subject to customary adjustment for stock splits, stock dividends and reclassifications. See “Certain Relationships and Related Party Transactions—Limited Liability Company Agreement of LD Holdings.” |
| Tax receivable agreement |
Our purchase of Holdco Units from the Exchanging Members using a portion of the net proceeds from this offering and any future exchanges of Holdco Units for our Class A common stock pursuant to the exchange rights described above and our potential purchase of Class I common units of LD Holdings pursuant to our election described under “Certain Relationships and Related Party Transactions—imortgage Settlement Agreement” are expected to result in increases in loanDepot, Inc.’s allocable tax basis in the assets of LD Holdings. These increases in tax basis are expected to increase (for tax purposes) depreciation and amortization deductions allocable to loanDepot, Inc. and therefore reduce the amount of tax that loanDepot, Inc. otherwise would be required to pay in the future. This increase in tax basis may also decrease gain (or increase loss) on future dispositions of certain assets to the extent tax basis is allocated to those assets. We and LD Holdings will enter into a tax receivable agreement with the Parthenon Stockholders and certain of the Continuing LLC Members, whereby loanDepot, Inc. will agree to pay to such parties or their permitted assignees, 85% of the amount of cash tax savings, if any, in U.S. federal, state and local taxes that loanDepot, Inc. realizes or is deemed to realize as a result of these increases in tax basis, increases in basis from such payments and deemed interest deductions arising from such payments. See “Certain Relationships and Related Party Transactions—Tax Receivable Agreement.” |
| Risk factors |
Please read the section entitled “Risk Factors” for a discussion of some of the factors you should carefully consider before deciding to invest in our Class A common stock. |
22
Table of Contents
In this prospectus, unless otherwise indicated or the context otherwise requires, the number of shares of Class A common stock outstanding and the other information based thereon:
| • | assumes an initial offering price of $17.00 per share, the midpoint of the estimated price range set forth on the cover of this prospectus; |
| • | assumes that the underwriters’ option to purchase 4,500,000 additional shares of Class A common stock from us and the selling stockholders is not exercised; |
| • | excludes 85,177,447 shares of Class A common stock issuable upon the exchange of 85,177,447 Holdco Units and an equal number of shares of Class B common stock that will be held by the Continuing LLC Members immediately following this offering and the use of proceeds to us therefrom; |
| • | excludes 14,705,882 shares of Class A common stock reserved as of the date of this prospectus for future issuance under the loanDepot, Inc. 2015 Omnibus Incentive Plan (the “2015 Omnibus Incentive Plan”) (including any LTIP Units, which may be granted thereunder) (see “Executive Compensation—Employee Benefit Plans—2015 Omnibus Incentive Plan—Available Shares”); and |
| • | excludes 3,676,470 shares of Class A common stock reserved for future issuance under the loanDepot, Inc. Employee Stock Purchase Plan (the “LD ESPP”) (see “Executive Compensation—Employee Benefit Plans—Employee Stock Purchase Plan”). |
23
Table of Contents
SUMMARY HISTORICAL CONSOLIDATED FINANCIAL AND OTHER DATA
The following tables set forth summary historical consolidated financial and other data of LDLLC at the dates and for the periods indicated. LDLLC will be considered our predecessor for accounting purposes, and its consolidated financial statements will be our historical consolidated financial statements following the offering. The statements of operating data for the years ended December 31, 2014 and 2013 and balance sheet data as of December 31, 2014 and 2013 are derived from the audited consolidated financial statements of LDLLC and related notes included elsewhere in this prospectus. The statement of operating data for the six months ended June 30, 2015 and the balance sheet data as of June 30, 2015 are derived from the audited consolidated financial statements of LDLLC and related notes included elsewhere in this prospectus. The statement of operating data for the six months ended June 30, 2014 and the balance sheet data as of June 30, 2014 are derived from the unaudited consolidated financial statements of LDLLC and related notes included elsewhere in this prospectus. The unaudited consolidated financial statements of LDLLC have been prepared on substantially the same basis as the audited consolidated financial statements of LDLLC and include all adjustments that we consider necessary for a fair presentation of LDLLC’s consolidated financial position and results of operations for all periods presented. The summary historical financial data of loanDepot, Inc. have not been presented because loanDepot, Inc. is a newly incorporated entity, has had no business transactions or activities and had no material assets or liabilities during the periods presented in this section.
The summary unaudited pro forma consolidated statements of operations data for the fiscal year ended December 31, 2014 and the six months ended June 30, 2015 present our consolidated results of operations after giving pro forma effect to (i) the Mortgage Master acquisition, as described under “Management’s Discussion and Analysis of Financial Condition and Results of Operations—Key Factors Influencing Our Results of Operations—Acquisitions and Industry Partnerships—Acquisition of Mortgage Master,” (ii) the Reorganization Transactions and Offering Transactions, as described under “Organizational Structure,” (iii) the use of the estimated net proceeds to us from the offering, as described under “Use of Proceeds,” and (iv) a provision for corporate income taxes on the income attributable to loanDepot, Inc. at an effective rate of 41.0%, inclusive of all U.S. federal, state and local income taxes, as if such transactions occurred on January 1, 2014. The summary unaudited pro forma consolidated balance sheet data as of June 30, 2015 presents our consolidated financial position giving pro forma effect to (i) the Reorganization Transactions and Offering Transactions, as described under “Organizational Structure,” (ii) the use of the estimated net proceeds to us from the offering, as described under “Use of Proceeds” and (iii) the effects of the tax receivable agreement, as described under “Certain Relationships and Related Party Transactions—Tax Receivable Agreement,” as if such transactions occurred on June 30, 2015. The pro forma adjustments are based on available information and upon assumptions that our management believes are reasonable in order to reflect, on a pro forma basis, the impact of these transactions on the historical financial information of LDLLC. The summary unaudited pro forma consolidated financial information is included for informational purposes only and does not purport to reflect the results of operations or financial position of loanDepot, Inc. that would have occurred had we been in existence or operated as a public company or otherwise during the periods presented. The unaudited pro forma consolidated financial information should not be relied upon as being indicative of our results of operations or financial position had the described transactions occurred on the dates assumed. The unaudited pro forma consolidated financial information also does not project our results of operations or financial position for any future period or date.
The following summary historical consolidated financial and other data are qualified in their entirety by reference to, and should be read in conjunction with, our audited consolidated financial statements and related notes, our unaudited condensed consolidated financial statements and related notes, imortgage’s audited consolidated financial statements and related notes, Mortgage Master’s audited consolidated financial statements and related notes and the information under “Management’s Discussion and Analysis of Financial Condition and Results of Operations,” “Selected Financial Data,” “Unaudited Pro Forma Consolidated Financial Information”
24
Table of Contents
and other financial information included in this prospectus. Historical results included below and elsewhere in this prospectus are not necessarily indicative of our future performance and the results for any interim period are not necessarily indicative of the operating results to be expected for the full fiscal year.
| Historical Consolidated LDLLC | Pro Forma loanDepot, Inc. | |||||||||||||||||||||||
| Six Months Ended June 30, |
Year Ended December 31, |
Six Months Ended June 30, 2015 |
Year Ended December 31, 2014 |
|||||||||||||||||||||
| 2015 | 2014 | 2014 | 2013 | |||||||||||||||||||||
| (Unaudited) | (Unaudited) | (Unaudited) | ||||||||||||||||||||||
| (Dollars in thousands, except share and per share amounts) | ||||||||||||||||||||||||
| Statement of Operation Data: |
||||||||||||||||||||||||
| Revenues: |
||||||||||||||||||||||||
| Interest income |
$ | 30,815 | $ | 14,462 | $ | 34,416 | $ | 18,902 | $ | 30,815 | $ | 42,816 | ||||||||||||
| Interest expense |
(20,651 | ) | (8,132 | ) | (19,966 | ) | (12,692 | ) | (19,851 | ) | (23,066 | ) | ||||||||||||
|
|
|
|
|
|
|
|
|
|
|
|
|
|||||||||||||
| Net interest income |
10,164 | 6,330 | 14,450 | 6,209 | 10,964 | 19,750 | ||||||||||||||||||
| Gain on origination and sale of loans, net |
425,438 | 193,849 | 435,462 | 246,478 | 425,438 | 515,661 | ||||||||||||||||||
| Origination income, net |
41,649 | 34,635 | 75,064 | 51,995 | 41,649 | 81,264 | ||||||||||||||||||
| Servicing income |
20,195 | 12,652 | 28,517 | 12,914 | 20,195 | 28,517 | ||||||||||||||||||
| Servicing (losses) gains |
(19,284 | ) | (10,368 | ) | (26,522 | ) | 10,667 | (19,284 | ) | (26,521 | ) | |||||||||||||
| Other income |
11,471 | 7,122 | 17,504 | 10,232 | 11,451 | 17,554 | ||||||||||||||||||
|
|
|
|
|
|
|
|
|
|
|
|
|
|||||||||||||
| Total net revenues |
$ | 489,633 | $ | 244,220 | $ | 544,475 | $ | 338,496 | $ | 490,413 | $ | 636,225 | ||||||||||||
|
|
|
|
|
|
|
|
|
|
|
|
|
|||||||||||||
| Expenses: |
||||||||||||||||||||||||
| Personnel expense |
$ | 273,182 | $ | 130,210 | $ | 293,552 | $ | 153,179 | $ | 273,182 | $ | 364,052 | ||||||||||||
| Marketing and advertising expense |
54,369 | 43,024 | 93,906 | 51,265 | 54,369 | 95,706 | ||||||||||||||||||
| Direct origination expense |
28,594 | 20,503 | 43,893 | 22,907 | 28,594 | 53,793 | ||||||||||||||||||
| General and administrative expense |
33,618 | 18,127 | 44,070 | 17,769 | 33,618 | 51,969 | ||||||||||||||||||
| Occupancy expense |
11,118 | 7,065 | 15,083 | 5,716 | 11,118 | 19,383 | ||||||||||||||||||
| Depreciation and amortization |
8,593 | 5,207 | 11,692 | 5,778 | 8,593 | 13,592 | ||||||||||||||||||
| Subservicing expense |
5,651 | 4,919 | 11,157 | 6,884 | 5,651 | 11,227 | ||||||||||||||||||
| Other interest expense |
5,124 | 4,400 | 8,930 | 1,967 | 5,044 | 8,840 | ||||||||||||||||||
|
|
|
|
|
|
|
|
|
|
|
|
|
|||||||||||||
| Total expenses |
$ | 420,249 | $ | 233,454 | $ | 522,282 | $ | 265,465 | $ | 420,169 | $ | 618,562 | ||||||||||||
|
|
|
|
|
|
|
|
|
|
|
|
|
|||||||||||||
| Income before income taxes |
$ | 69,384 | $ | 10,766 | $ | 22,193 | $ | 73,031 | $ | 70,244 | $ | 17,663 | ||||||||||||
| Provision for income taxes |
216 | 598 | 509 | 773 | 12,144 | 3,063 | ||||||||||||||||||
|
|
|
|
|
|
|
|
|
|
|
|
|
|||||||||||||
| Net income |
$ | 69,168 | $ | 10,168 | $ | 21,684 | $ | 72,258 | $ | 58,100 | $ | 14,600 | ||||||||||||
|
|
|
|
|
|
|
|
|
|
|
|
|
|||||||||||||
| Net income attributable to non-controlling interest |
40,651 | 10,248 | ||||||||||||||||||||||
|
|
|
|
|
|||||||||||||||||||||
| Net income attributable to loanDepot, Inc. |
$ | 17,449 | $ | 4,352 | ||||||||||||||||||||
|
|
|
|
|
|||||||||||||||||||||
| Per Share Data: |
||||||||||||||||||||||||
| Weighted average shares outstanding: |
||||||||||||||||||||||||
| Basic |
61,881,376 | 61,881,376 | ||||||||||||||||||||||
| Diluted |
147,058,824 | 147,058,824 | ||||||||||||||||||||||
| Net income available to Class A common stock per share: |
||||||||||||||||||||||||
| Basic |
$ | 0.28 | $ | 0.07 | ||||||||||||||||||||
| Diluted |
$ | 0.28 | $ | 0.07 | ||||||||||||||||||||
| Balance Sheet Data (end of period): |
||||||||||||||||||||||||
| Cash and cash equivalents |
$ | 53,350 | $ | 24,225 | $ | 28,637 | $ | 40,885 | $ | 255,951 | ||||||||||||||
| Loans held for sale, at fair value |
1,504,603 | 883,585 | 1,004,195 | 741,509 | 1,504,603 | |||||||||||||||||||
| Servicing rights, at fair value |
194,093 | 108,361 | 138,837 | 93,823 | 194,093 | |||||||||||||||||||
| Total assets |
2,076,376 | 1,186,927 | 1,370,356 | 1,023,337 | 2,301,481 | |||||||||||||||||||
| Total liabilities |
1,786,222 | 1,011,694 | 1,181,162 | 860,028 | 1,804,517 | |||||||||||||||||||
| Total liabilities, redeemable units and unitholders’ equity |
2,076,376 | 1,186,927 | 1,370,356 | 1,023,337 | 496,964 | |||||||||||||||||||
| Cash Flow Data: |
||||||||||||||||||||||||
| Net cash used in operating activities |
$ | (559,772 | ) | $ | (162,923 | ) | $ | (314,555 | ) | $ | (217,083 | ) | ||||||||||||
| Net cash provided by (used in) investing activities |
69,729 | 20,797 | 44,215 | (34,026 | ) | |||||||||||||||||||
| Net cash provided by financing activities |
514,756 | 125,466 | 258,091 | 264,349 | ||||||||||||||||||||
25
Table of Contents
| Historical Consolidated LDLLC | ||||||||||||||||
| Six Months Ended June 30, |
Year Ended December 31, |
|||||||||||||||
| 2015 | 2014 | 2014 | 2013 | |||||||||||||
| (Dollars in thousands) | ||||||||||||||||
| Other Financial Data (Unaudited): | ||||||||||||||||
| Fundings by Product(1): |
||||||||||||||||
| Home loans(2) |
$ | 14,317,688 | $ | 5,368,825 | $ | 13,160,987 | $ | 8,374,121 | ||||||||
| Personal loans |
13,873 | — | — | — | ||||||||||||
|
|
|
|
|
|
|
|
|
|||||||||
| Total fundings |
$ | 14,331,561 | $ | 5,368,825 | $ | 13,160,987 | $ | 8,374,121 | ||||||||
|
|
|
|
|
|
|
|
|
|||||||||
| Number of Customers Serviced by Product(1)(3): |
||||||||||||||||
| Home loans |
75,761 | 50,069 | 64,373 | 37,069 | ||||||||||||
| Personal loans |
840 | — | — | — | ||||||||||||
|
|
|
|
|
|
|
|
|
|||||||||
| Total Number of Customers Serviced |
76,601 | 50,069 | 64,373 | 37,069 | ||||||||||||
|
|
|
|
|
|
|
|
|
|||||||||
| Gain on Sale Margin(4)(5) |
2.96 | % | 3.80 | % | 3.68 | % | 3.50 | % | ||||||||
| Adjusted EBITDA(5) |
$ | 101,108 | $ | 23,480 | $ | 50,201 | $ | 84,666 | ||||||||
| Adjusted EBITDA Margin(5) |
21 | % | 10 | % | 9 | % | 25 | % | ||||||||
| Adjusted Net Income(5) |
$ | 51,678 | $ | 8,272 | $ | 17,626 | $ | 45,426 | ||||||||
| Adjusted Net Income Margin(5) |
11 | % | 3 | % | 3 | % | 13 | % | ||||||||
| (1) | Does not reflect our home equity loan product, which was recently launched in September 2015. |
| (2) | Includes brokered loans of $17.7 million and $14.2 million for the six months ended June 30, 2015 and June 30, 2014, respectively, and $36.5 million and $7.4 million for the year ended December 31, 2014 and December 31, 2013, respectively. |
| (3) | Measured by number of home loan and personal loan units serviced. |
| (4) | Gain on sale (“GOS”) margin is a loan origination revenue metric which we believe provides useful information for assessing our performance (including our home loan origination, hedging and sales activities) within the overall home loan origination and sales market. We measure GOS margin for home loans in a given period by dividing the (i) revenue from the origination and sale of the home loan by (ii) the volume of home loans sold plus the change in the notional amount of loans held for sale during the period plus the change in the notional amount of pull-through rate adjusted interest rate lock commitments during the period. Revenue from the origination and sale of home loans includes (i) gain on origination and sale of loans, net from home loans, (ii) origination income, net from home loans and (iii) servicing gains (losses) resulting from our servicing rights utilized for hedging, excluding changes in servicing rights fair value from fallout and decay (other changes in fair value) and any realized gain or loss from the sale of servicing rights during the period. We calculate GOS margin in this manner because it most appropriately represents all home loan economic revenue items divided by an appropriate notional amount of the related home loans and interest rate lock commitments responsible for this revenue. |
| The following table provides a reconciliation of GOS Margin for the periods presented: |
| Six Months Ended June 30, |
Year Ended December 31, |
|||||||||||||||
| 2015 | 2014 | 2014 | 2013 | |||||||||||||
| (Dollars in thousands) | ||||||||||||||||
| Gain on Sale Margin: |
||||||||||||||||
| Gain on origination and sale of loans, net |
$ | 425,438 | $ | 193,849 | $ | 435,462 | $ | 246,478 | ||||||||
| Origination income, net(a) |
41,088 | 34,635 | 75,064 | 51,995 | ||||||||||||
| Servicing gains (losses)(b) |
2,053 | (7,165 | ) | (14,496 | ) | — | ||||||||||
|
|
|
|
|
|
|
|
|
|||||||||
| Numerator |
$ | 468,579 | $ | 221,319 | $ | 496,030 | $ | 298,473 | ||||||||
|
|
|
|
|
|
|
|
|
|||||||||
| Sales of home loans(c) |
$ | 13,788,285 | $ | 5,232,656 | $ | 12,876,497 | $ | 8,147,782 | ||||||||
| Change in UPB of loans held for sale(d) |
505,648 | 123,198 | 240,383 | 212,346 | ||||||||||||
| Change notional balance of IRLCs(e)(f) |
1,539,471 | 467,942 | 363,035 | 168,812 | ||||||||||||
|
|
|
|
|
|
|
|
|
|||||||||
| Denominator |
$ | 15,833,404 | $ | 5,823,796 | $ | 13,479,915 | $ | 8,528,940 | ||||||||
|
|
|
|
|
|
|
|
|
|||||||||
| Gain on Sale Margin |
2.96 | % | 3.80 | % | 3.68 | % | 3.50 | % | ||||||||
| (a) | Excludes origination income, net from personal loans. |
26
Table of Contents
| (b) | Includes changes in fair value of servicing rights utilized for hedging. Excludes changes in fair value from fallout and decay (other changes in fair value) and any realized gains or losses from the sale of servicing rights. |
| (c) | Represents principal balance of home loans sold during the period. |
| (d) | Represents change in unpaid principal balance of loans held for sale during the period. |
| (e) | Includes change in notional amount of pull-through weighted interest rate lock commitments during the period. |
| (f) | For the six months ended June 30, 2015, excludes $526.2 million of notional amount pull-through weighted interest rate lock commitments acquired in the Mortgage Master acquisition. |
| (5) | We present Adjusted EBITDA, Adjusted EBITDA Margin, Adjusted Net Income and Adjusted Net Income Margin as supplemental measures of performance. Adjusted EBITDA is defined as net income plus (i) other interest expense, (ii) provision for income taxes and (iii) depreciation and amortization, as further adjusted to eliminate the impact of certain non-cash and other items that we do not consider indicative of our ongoing operating performance. Adjusted EBITDA Margin is defined as, for any period, the Adjusted EBITDA for that period divided by the total net revenues for that period. Adjusted Net Income is defined as net income plus (i) estimated tax provision, (ii) equity-based compensation expense, (iii) acquisition related expenses, (iv) litigation reserve, (v) new product and channel development costs and (vi) certain non-cash and other items that we do not consider indicative of our ongoing operations. Adjusted Net Income Margin is defined as, for any period, the Adjusted Net Income for that period divided by the total net revenues for that period. We describe these adjustments reconciling net income to Adjusted EBITDA and Adjusted Net Income in the table below. You are encouraged to evaluate these adjustments and the reasons we consider them appropriate for supplemental analysis. In evaluating Adjusted EBITDA, Adjusted EBITDA Margin, Adjusted Net Income and Adjusted Net Income Margin, you should be aware that in the future we may incur expenses that are the same as or similar to some of the adjustments in this presentation. |
27
Table of Contents
| The following table provides reconciliations of net income to Adjusted EBITDA, Adjusted EBITDA Margin, Adjusted Net Income and Adjusted Net Income Margin for the periods presented: |
| Six Months Ended June 30, |
Year Ended December 31, |
|||||||||||||||
| 2015 | 2014 | 2014 | 2013 | |||||||||||||
| (Dollars in thousands) | ||||||||||||||||
| Adjusted EBITDA: | ||||||||||||||||
| Net income |
$ | 69,168 | $ | 10,168 | $ | 21,684 | $ | 72,258 | ||||||||
| Other interest expense |
5,124 | 4,400 | 8,930 | 1,967 | ||||||||||||
| Provision for income taxes |
216 | 598 | 509 | 773 | ||||||||||||
| Depreciation and amortization |
8,593 | 5,207 | 11,692 | 5,778 | ||||||||||||
|
|
|
|
|
|
|
|
|
|||||||||
| EBITDA |
$ | 83,101 | $ | 20,373 | $ | 42,815 | $ | 80,775 | ||||||||
| Equity-based compensation expense |
11,888 | 2,643 | 5,263 | 1,612 | ||||||||||||
| Acquisition related expense(a) |
1,310 | 15 | 510 | 1,807 | ||||||||||||
| Litigation reserve(b) |
2,858 | — | — | — | ||||||||||||
| New product and channel development costs(c) |
1,175 | 313 | 1,032 | — | ||||||||||||
| Other expense(d) |
775 | 136 | 581 | 472 | ||||||||||||
|
|
|
|
|
|
|
|
|
|||||||||
| Adjusted EBITDA |
$ | 101,108 | $ | 23,480 | $ | 50,201 | $ | 84,666 | ||||||||
|
|
|
|
|
|
|
|
|
|||||||||
| Adjusted EBITDA Margin: |
||||||||||||||||
| Adjusted EBITDA |
$ | 101,108 | $ | 23,480 | $ | 50,201 | $ | 84,666 | ||||||||
| Total net revenues |
489,633 | 244,220 | 544,475 | 338,496 | ||||||||||||
| Adjusted EBITDA Margin |
21 | % | 10 | % | 9 | % | 25 | % | ||||||||
| Six Months Ended June 30, |
Year Ended December 31, |
|||||||||||||||
| 2015 | 2014 | 2014 | 2013 | |||||||||||||
| (Dollars in thousands) | ||||||||||||||||
| Adjusted Net Income: |
||||||||||||||||
| Income before income taxes |
$ | 69,384 | $ | 10,766 | $ | 22,193 | $ | 73,031 | ||||||||
| Estimated tax provision(e) |
(28,447 | ) | (4,414 | ) | (9,099 | ) | (29,943 | ) | ||||||||
|
|
|
|
|
|
|
|
|
|||||||||
| After tax net income(e) |
40,937 | 6,352 | 13,094 | 43,088 | ||||||||||||
| Equity-based compensation expense(e) |
7,014 | 1,560 | 3,105 | 951 | ||||||||||||
| Acquisition related expense(a)(e) |
773 | 9 | 301 | 1,066 | ||||||||||||
| Litigation reserve(b)(e) |
1,686 | — | — | — | ||||||||||||
| New product and channel development costs(c)(e) |
693 | 184 | 609 | — | ||||||||||||
| Other expense(d)(e) |
458 | 80 | 343 | 278 | ||||||||||||
| Amortization of intangible assets(e) |
117 | 87 | 174 | 43 | ||||||||||||
|
|
|
|
|
|
|
|
|
|||||||||
| Adjusted Net Income(e) |
$ | 51,678 | $ | 8,272 | $ | 17,626 | $ | 45,426 | ||||||||
|
|
|
|
|
|
|
|
|
|||||||||
| Adjusted Net Income Margin: |
||||||||||||||||
| Adjusted Net Income |
$ | 51,678 | $ | 8,272 | $ | 17,626 | $ | 45,426 | ||||||||
| Total net revenues |
489,633 | 244,220 | 544,475 | 338,496 | ||||||||||||
| Adjusted Net Income Margin |
11 | % | 3 | % | 3 | % | 13 | % | ||||||||
| (a) | Represents acquisition costs, including changes in the estimated fair value of future payments or contingent consideration that may be required to be made to former stockholders of certain acquired entities. |
| (b) | Represents management’s estimate of the future settlement cost of litigation. |
| (c) | Represents expenses related to pre-launch development of new products and product distribution channels. |
| (d) | Represents certain non-cash and other items that we do not consider indicative of our ongoing operating performance, including debt transaction fee, early stage advisory expenses in connection with this offering and management fees and expenses of our sponsor, which will no longer be payable after the consummation of this offering. |
| (e) | loanDepot, Inc. was incorporated on July 10, 2015 and did not conduct any business transactions or activities and had no material assets or liabilities prior to the Reorganization Transactions and this offering. loanDepot, Inc. is a C-Corp under the Code, and will be subject to income taxes. Estimated tax provision, adjustments and Adjusted Net Income were computed as if we were subject to federal income tax as a subchapter C corporation for the periods presented using a federal tax rate of 35.0% and an estimated effective state tax rate of 6.0%, net of the federal tax benefit. |
28
Table of Contents
| EBITDA, Adjusted EBITDA, Adjusted EBITDA Margin, Adjusted Net Income, Adjusted Net Income Margin and GOS Margin are supplemental measures of our performance that are not required by, or presented in accordance with, United States generally accepted accounting principles (“GAAP”). They are also not a measurement of our financial performance under GAAP and should not be considered as an alternative to operating profit, net income or any other performance measures derived in accordance with GAAP nor as an alternative to cash flows from operating activities as a measure of our liquidity. We believe that EBITDA, Adjusted EBITDA, Adjusted EBITDA Margin, Adjusted Net Income, Adjusted Net Income Margin and GOS Margin provide meaningful information to assist investors in understanding our financial results and assessing our prospects for future performance. Management believes EBITDA, Adjusted EBITDA, Adjusted EBITDA Margin, Adjusted Net Income, Adjusted Net Income Margin and GOS Margin are important indicators of our operations because they exclude items that may not be indicative of, or are unrelated to, our core operating results, and provide a baseline for analyzing trends in our underlying business from period to period. EBITDA, Adjusted EBITDA, Adjusted EBITDA Margin, Adjusted Net Income, Adjusted Net Income Margin and GOS Margin reflect an additional way of viewing an aspect of our operations that, when viewed with our GAAP results and the reconciliation contained above to our net income, provides a more complete understanding of our business. |
| EBITDA, Adjusted EBITDA, Adjusted EBITDA Margin, Adjusted Net Income, Adjusted Net Income Margin and GOS Margin measures have limitations as analytical tools, and you should not consider them in isolation, or as a substitute for analysis of our results as reported under GAAP. Some of these limitations are: |
| • | they do not reflect costs or cash outlays for capital expenditures or contractual commitments; |
| • | they do not reflect changes in, or cash requirements for, our working capital needs; |
| • | they do not reflect the interest expense, or the cash requirements necessary to service interest or principal payments, on our debt; |
| • | they do not reflect period-to-period changes in taxes, income tax expense or the cash necessary to pay income taxes; |
| • | they do not reflect the impact of earnings or charges resulting from matters we consider not to be indicative of our ongoing operations; |
| • | although depreciation and amortization are non-cash charges, the assets being depreciated and amortized will often have to be replaced in the future, and they do not reflect cash requirements for such replacements; |
| • | non-cash compensation may be a key element of our overall long-term incentive compensation package, although we exclude it as an expense when evaluating our ongoing operating performance for a particular period; |
| • | they do not reflect the impact of certain cash charges resulting from matters we consider not to be indicative of our ongoing operations; and |
| • | other companies in our industry may calculate these measures differently than we do, limiting their usefulness as comparative measures. |
| Because of these limitations, EBITDA, Adjusted EBITDA, Adjusted EBITDA Margin, Adjusted Net Income, Adjusted Net Income Margin and GOS Margin should not be considered in isolation or as a substitute for performance measures calculated in accordance with GAAP. Our presentation of EBITDA, Adjusted EBITDA, Adjusted EBITDA Margin, Adjusted Net Income, Adjusted Net Income Margin and GOS Margin should not be construed as an inference that our future results will be unaffected by unusual or non-recurring items. |
29
Table of Contents
An investment in our Class A common stock involves risk. You should carefully consider the following risks as well as the other information included in this prospectus, including “Selected Financial Data,” “Unaudited Pro Forma Consolidated Financial Information,” “Management’s Discussion and Analysis of Financial Condition and Results of Operations” and the financial statements and related notes contained elsewhere in this prospectus, before investing in our Class A common stock. Any of the following risks could materially and adversely affect our business, financial condition or results of operations. However, the selected risks described below are not the only risks facing us. Additional risks and uncertainties not currently known to us or those we currently view to be immaterial may also materially and adversely affect our business, financial condition or results of operations. In such a case, the trading price of the Class A common stock could decline and you may lose all or part of your investment in our company.
Risks Related to Our Business
We have experienced rapid growth, which may be difficult to sustain and which may place significant demands on our operational, administrative and financial resources.
Our annual loan production and servicing portfolio (each, measured in UPB) have grown (i) from approximately $8.4 billion and $8.3 billion, respectively, as of and for the year ended December 31, 2013 to $13.2 billion and $13.6 billion, respectively, as of and for the year ended December 31, 2014 and (ii) from approximately $5.4 billion and $10.7 billion, respectively, as of and for the six months ended June 30, 2014 to $14.3 billion and $16.6 billion, respectively, as of and for the six months ended June 30, 2015. Our rapid growth has caused, and if it continues will continue to cause, significant demands on our operational, legal, and accounting infrastructure, and will result in increased expenses. In addition, we are required to continuously develop our systems and infrastructure in response to the increasing sophistication of the lending markets and legal, accounting and regulatory developments relating to all of our existing and projected business activities. Our future growth will depend, among other things, on our ability to maintain an operating platform and management system sufficient to address our growth and will require us to incur significant additional expenses and to commit additional senior management and operational resources. As a result, we face significant challenges in:
| • | securing funding to maintain our operations and future growth; |
| • | maintaining and improving our retention and recapture rates; |
| • | maintaining and scaling adequate financial, business and risk controls; |
| • | implementing new or updated information and financial systems and procedures; |
| • | training, managing and appropriately sizing our work force and other components of our business on a timely and cost-effective basis; |
| • | navigating complex and evolving regulatory and competitive environments; |
| • | increasing the number of borrowers utilizing our products and services; |
| • | increasing the volume of loans originated and facilitated through us; |
| • | entering into new markets and introducing new loan products; |
| • | continuing to revise our proprietary credit decisioning and scoring models; |
| • | continuing to develop, maintain and scale our platform; |
| • | effectively using limited personnel and technology resources; |
| • | effectively maintaining and scaling our financial and risk management controls and procedures; |
30
Table of Contents
| • | maintaining the security of our platform and the confidentiality of the information (including personally identifiable information) provided and utilized across our platform; and |
| • | attracting, integrating and retaining an appropriate number of qualified employees. |
We may not be able to manage our expanding operations effectively and we may not be able to continue to grow, and any failure to do so could adversely affect our ability to generate revenue and control our expenses.
We may not be able to continue to grow our loan production volume, which could negatively affect our business, financial condition and results of operations.
Our loan originations, particularly our refinance home loan volume, are dependent on interest rates and are expected to decline if interest rates increase. Our loan origination activities are also subject to overall market factors that can impact our ability to grow our loan production volume. For example, increased competition from new and existing market participants, slow growth in the level of new home purchase activity or reductions in the overall level of refinancing activity can impact our ability to continue to grow our loan origination volume, and we may be forced to accept lower margins in order to continue to compete and keep our volume of activity consistent with past or projected levels.
Our home loan originations also depend on the referral-driven nature of the home loan industry. The origination of purchase money home loans is greatly influenced by traditional market participants in the home buying process such as real estate agents and builders. As a result, our ability to maintain existing, and secure new, relationships with such traditional market participants will influence our ability to grow our purchase money home loan volume and, thus, our distributed retail originations business. Recent regulatory developments have also imposed limits on our ability to enter into marketing services agreements with referral sources, which could adversely impact us. See “Business—Supervision and Regulation—Federal, State and Local Regulation—Real Estate Settlement Procedures Act.” In addition, we will need to convert leads regarding prospective borrowers into funded loans and that depends on the pricing that we will be able to offer relative to the pricing of our competitors and our ability to process, underwrite and close loans on a timely basis. Institutions that compete with us in this regard may have significantly greater access to capital or resources than we do, which may give them the benefit of a lower cost of operations.
If new loan products and enhancements do not achieve sufficient market acceptance, our financial results and competitive position will be harmed.
Until recently, we have derived substantially all of our revenue from originating, selling and servicing traditional home loans. Efforts to expand into new consumer credit products, such as personal loans and home equity loans, may not succeed and may reduce expected revenue growth. Furthermore, we incur expenses and expend resources upfront to develop, acquire and market new loan products and platform enhancements to incorporate additional features, improve functionality or otherwise make our loan products more desirable to consumers. In particular, we recently launched new loan initiatives, through which we commenced facilitation of personal loans in May 2015 and origination of home equity loans in September 2015. For more information regarding our home loan and personal loan production operations, see “Business—Our Current Products and Services” and “—Our Distribution Channels.” New loan products must achieve high levels of market acceptance in order for us to recoup our investment in developing and bringing them to market. If we are unable to grow our loan production volumes or if our margins become compressed, then our business, financial condition and results of operations could be adversely affected.
Recently launched and future loan products could fail to attain sufficient market acceptance for many reasons, including:
| • | our failure to predict market demand accurately or to supply loan products that meet market demand in a timely fashion; |
31
Table of Contents
| • | negative publicity about our loan products’ performance or effectiveness or our customer experience; |
| • | our ability to obtain financing sources to support such loans; |
| • | regulatory hurdles; |
| • | delays in releasing to the market new loan products; and |
| • | the introduction or anticipated introduction of competing products by our competitors. |
If our new and recently launched loan products do not achieve adequate acceptance in the market, our competitive position, revenue and operating results could be harmed. The adverse effect on our financial results may be particularly acute because of the significant development, marketing, sales and other expenses we will have incurred in connection with the new loan products or enhancements before such products or enhancements generate sufficient revenue.
We rely on warehouse lines of credit and other sources of capital and liquidity to meet the financing requirements of our business.
Our ability to finance our operations and repay maturing obligations rests on our ability to borrow money and secure investors to purchase loans we originate or facilitate. We are generally required to renew our Warehouse Lines each year, which exposes us to refinancing, interest rate, and counterparty risks. As of June 30, 2015, we had eight Warehouse Lines which provide an aggregate available home loan lending facility of $2.2 billion, and all of our Warehouse Lines allow drawings to fund loans at closing of the consumer’s home loan. We rely on two such Warehouse Line providers to provide 48% of our aggregate available home lending facility. If any Warehouse Line provider ceased doing business with us, our business, operations, and results of operations would materially suffer. See “Management’s Discussion and Analysis of Financial Condition and Results of Operations—Liquidity and Capital Resources—Warehouse Lines.” Our ability to extend or renew existing Warehouse Lines and obtain new Warehouse Lines is affected by a variety of factors including:
| • | limitations imposed on us under our Warehouse Lines and other debt agreements contain restrictive covenants and borrowing conditions, which limit our ability to raise additional debt and require that we maintain certain financial results, including minimum tangible net worth, minimum liquidity, minimum pre-tax net income, minimum debt service coverage ratio, and maximum total liabilities to tangible net worth ratio as well as require us to maintain committed warehouse facilities with third party lenders; |
| • | changes in financial covenants mandated by Warehouse Line lenders, which we may not be able to achieve; |
| • | any decrease in liquidity in the credit markets; |
| • | potential valuation changes to our home loans, servicing rights or other collateral; |
| • | prevailing interest rates; |
| • | the strength of the Warehouse Line lenders from whom we borrow, and the regulatory environment in which they operate, including proposed capital strengthening requirements; |
| • | Warehouse Line lenders seeking to reduce their exposure to residential loans due to other reasons, including a change in such lender’s strategic plan or lines of business; and |
| • | accounting changes that may impact calculations of covenants in our Warehouse Lines and other debt agreements which result in our ability to continue to satisfy such covenants. |
Warehouse Lines may not be available to us with counterparties on acceptable terms or at all. While we believe that our current ability to access Warehouse Lines for our home loan products has been enhanced due to our operating history, experience and performance under the Warehouse Line facilities, it is possible that this advantage will dissipate as new home loan products are developed and introduced, as the cost and terms of credit with respect to those new home loan products may prove to be less favorable than the terms we have for our current home loan products, or the terms that our competitors may have on their new home loan products.
32
Table of Contents
Our access to and our ability to renew our existing Warehouse Lines could suffer in the event of: (i) the deterioration in the performance of the home loans underlying the Warehouse Lines; (ii) our failure to maintain sufficient levels of eligible assets or credit enhancements; (iii) our inability to access the secondary market for home loans; or (iv) termination of our role as servicer of the underlying home loan assets in the event that (a) we default in the performance of our servicing obligations or (b) we declare bankruptcy or become insolvent.
Furthermore, we have obtained one Warehouse Line and anticipate obtaining one or more additional Warehouse Lines to support our home equity loan business which was launched in September 2015. Initially, we are likely to be reliant upon a single Warehouse Line lender to provide the entire facility for our home equity loan business. In the event we are unable to obtain sufficient Warehouse Line facilities to support our home equity loan business, the growth of such business will materially suffer. We will be unable to effectively operate and grow our home equity loan business without access to Warehouse Line facilities or other sources of capital to fund home equity loans that we originate.
An event of default, an adverse action by a regulatory authority or a general deterioration in the economy that constricts the availability of credit, similar to the market conditions in 2007 through 2010, may increase our cost of funds and make it difficult or impossible for us to renew existing Warehouse Lines or obtain new Warehouse Lines, any of which would have a material adverse effect on our business, results of operations, and the trading price of our common stock, and would result in substantial diversion of our management’s attention. Additionally, a significant new acquisition may require us to raise additional capital to facilitate such a transaction, which may not be available on acceptable terms or at all.
Our existing credit facilities, including Warehouse Lines, also impose financial and non-financial covenants and restrictions on us that limit the amount of indebtedness that we may incur, impact our liquidity through minimum cash reserve requirements, and impact our flexibility to determine our operating policies and investment strategies. If we default on one of our obligations under a Warehouse Line or breach our representations and warranties contained therein, the lender may be able to terminate the transaction, accelerate any amounts outstanding, require us to prematurely repurchase the loans, and cease entering into any other repurchase transactions with us. Because our Warehouse Lines typically contain cross-default provisions, a default that occurs under any one agreement could allow the lenders under our other agreements to also declare a default. Additional Warehouse Lines, bank credit facilities or other debt facilities that we may enter into in the future may contain additional covenants and restrictions. If we fail to meet or satisfy any of these covenants, we would be in default under these agreements, and our lenders could elect to declare outstanding amounts due and payable, terminate their commitments, require the posting of additional collateral and enforce their interests against existing collateral. Any losses that we incur on our Warehouse Lines could materially adversely affect our financial condition and results of operations.
Certain of our Warehouse Lines contain financial covenants under which net income or net income before income taxes for the applicable measurement period must be $1.00 or more. In “Prospectus Summary — Recent Developments,” we have disclosed an estimated range of net income for the three months ended September 30, 2015 of $(5.2) million and $8.1 million. If net income or net income before income taxes is less than $1.00 for the applicable measurement period in violation of any such covenant, we would be required to seek a waiver or amendment of such covenant to avoid an event of default, the occurrence of which would expose us to the risks described in the preceding paragraph. Additionally, certain of the Reorganization Transactions and Offering Transactions require the consent of the counterparties under our Warehouse Lines and other financing arrangements to avoid an event of default thereunder and, although we are in the process of negotiating such consents and expect to have them executed and in place prior to the completion of the offering, if we are unable to secure any such consents prior to the completion of this offering then we could be placed in default under the applicable Warehouse Line or other financing arrangement, the occurrence of which would expose us to the risks described in the preceding paragraph.
We rely on other sources of capital and liquidity in addition to Warehouse Lines and cash provided by operations. We are party to a $30 million secured revolving line of credit (the “Original Secured Credit Facility”)
33
Table of Contents
and a $50 million secured revolving line of credit under one of our Warehouse Lines (the “New Secured Credit Facility” and together with the Original Secured Credit Facility, the “Secured Credit Facilities”) both of which we use to fund retaining servicing rights and for other working capital and general corporate purposes. We also have entered into our $80 million unsecured term loan facility (the “Unsecured Term Loan”) which we used to fund the acquisition of imortgage, retain servicing rights and for working capital and general corporate purposes. Additionally, we have raised $32.5 million in equity capital from related parties. See “Management’s Discussion and Analysis of Financial Condition and Results of Operations—Liquidity and Capital Resources—Debt Obligations” and “Certain Relationships and Related Party Transactions—Purchase of Premium Holdco Units and Class B Common Stock and Redemption of Class A Common Stock” for more information about these and other financing arrangements. If we are unable to access such other sources of capital and liquidity, our business, financial condition and results of operations may be negatively impacted.
We will need to increase the aggregate dollar amount of investment in personal loans funded through our issuing bank, and secure additional funding sources, to meet anticipated demand for 2016.
Investors willing to purchase personal loans from our issuing bank, Cross River Bank, are of vital importance for the day-to-day operations of our personal loan facilitation business launched in May 2015 as we do not fund these loans ourselves. Two investors currently account for the aggregate investment in personal loans originated and funded by Cross River Bank. If these investors cease investing in personal loans over a short period of time, our business could be temporarily interrupted as new investors complete the administrative and diligence updating processes necessary to enable their investments. Any such event could have a material and adverse effect on our business, financial condition and results of operations.
If we are unable to continue sourcing investors willing to purchase personal loans from Cross River Bank, or any other issuing bank we may collaborate with in the future, our personal loan facilitation business would be substantially reduced or we may need to cease our involvement with such personal loans. Our issuing bank has no responsibility to locate such investors. Investors may decide to discontinue purchasing personal loans that we facilitate from our issuing bank for a variety of reasons, including increased regulatory requirements, adverse regulatory or judicial determinations which may prevent investors from enforcing the personal loans according to their terms, or other business or market conditions which make personal loan portfolios less attractive than other investment opportunities these investors may have. We have expended considerable time and effort to launch our personal loan facilitation business. If current investors cease purchasing personal loans from Cross River Bank (or any future issuing bank), or if we fail to attract additional investors to purchase personal loans from Cross River Bank (or any future issuing bank), we would suffer substantial losses and diversion of management attention.
The departure or change in the responsibilities of Anthony Hsieh, our Chief Executive Officer, and certain other changes in our ownership or in our board of directors may cause one or more events of default under our current Warehouse Lines and other financing arrangements.
Certain changes in the management of LDLLC (such as Anthony Hsieh no longer being employed by our company or involved in our day to day activities), the board of directors of LDLLC and/or the ownership of LDLLC (such as (i) Parthenon Blocker or Anthony Hsieh and their affiliates holding below a specified percentage of equity interests or (ii) a percentage change in the outstanding equity interests of LDLLC as low as a 10%) may cause an event of default under one or more of our current Warehouse Lines and other financing arrangements, which may in turn cause events of default under many (potentially all) of our other Warehouse Lines and financing arrangements due to standard cross-default provisions. Uncured events of default under our Warehouse Lines and other financing arrangements would cause a material adverse effect on our business, financial condition and results of operations.
Additionally, as highlighted by the recent Delaware Chancery Court decision Pontiac General Employees Retirement Fund v. Healthways, we may receive stockholder demands or face stockholder litigation regarding the
34
Table of Contents
existence of “proxy put” provisions in our financing arrangements, meaning any provision that allows a lender to accelerate and demand full payment of outstanding indebtedness upon a substantial change in the composition of the board of directors, any of which could distract management and otherwise negatively impact our business.
Although we are in the process of negotiating with the counterparties under our Warehouse Lines and other financing arrangements to amend or remove these provisions in connection with this offering, we may not be able to successfully amend or remove each of these provisions prior to the closing of this offering.
Our indebtedness and other financial obligations may limit our financial and operating activities and our ability to incur additional debt to fund future needs.
As of June 30, 2015, on a pro forma as adjusted basis to give effect to this offering and the use of proceeds to us therefrom, we had $1.5 billion of outstanding indebtedness, of which $1.4 billion was secured, short-term indebtedness under our Warehouse Lines, $48.8 million was secured indebtedness under the Secured Credit Facilities and $80.0 million was unsecured indebtedness under our Unsecured Term Loan. We are also obligated to pay $26.5 million to the holders of Class I common units following this offering, as described further under “Certain Relationships and Related Party Transactions—imortgage Settlement Agreement.” For more information regarding our financing arrangements, see “—Warehouse Lines” and “—Debt Obligations” under “Management’s Discussion and Analysis of Financial Condition and Results of Operations—Liquidity and Capital Resources.” In addition, we are able to incur additional indebtedness in the future, subject to the limitations contained in the agreements governing our indebtedness.
Our existing indebtedness and any future indebtedness we incur could:
| • | require us to dedicate a substantial portion of cash flow from operations to the payment of principal and interest on indebtedness, including indebtedness we may incur in the future, thereby reducing the funds available for other purposes; |
| • | limit our ability to obtain short-term credit, including renewing or replacing Warehouse Lines; |
| • | increase our vulnerability to fluctuations in market interest rates, to the extent that the spread we earn between the interest we receive on our loans held for sale (“LHFS”) and the interest we pay under our indebtedness is reduced; |
| • | place us at a competitive disadvantage to competitors with relatively less debt in economic downturns, adverse industry conditions or catastrophic external events; or |
| • | reduce our flexibility in planning for, or responding to, changing business, industry and economic conditions. |
In addition, our indebtedness could limit our ability to obtain additional financing on acceptable terms, or at all, to fund our day-to-day loan origination operations, future acquisitions, working capital, capital expenditures, debt service requirements, general corporate and other purposes, any of which would have a material adverse effect on our business and financial condition. Our liquidity needs could vary significantly and may be affected by general economic conditions, industry trends, performance and many other factors not within our control. Further, our Warehouse Lines are short-term debt that must to be renewed by our lenders on a regular basis, typically once a year.
Obligations under our indebtedness could have other important consequences. For example, our failure to comply with the restrictive covenants in the agreements governing our indebtedness that limit our ability to incur liens, to incur debt and to sell assets, among other things, could result in an event of default that, if not cured or waived, could harm our business or prospects and could result in our bankruptcy. In addition, if we defaulted on our obligations under any of our secured debt, our secured lenders could proceed against the collateral granted to them to secure that indebtedness. Furthermore, if we default on our obligations under one debt agreement, it may trigger defaults under our other debt agreements which include cross-default provisions.
35
Table of Contents
The success and growth of our business will depend upon our ability to adapt to and implement technological changes.
All of our loan distribution channels are dependent upon and are becoming increasingly dependent upon technological advancement, such as our ability to process applications over the internet, accept electronic signatures, provide process status updates instantly and other conveniences expected by borrowers and counterparties. We must ensure that our technology facilitates a borrower experience that equals or exceeds the borrower experience provided by our competitors. Maintaining and improving this technology will require significant capital expenditures. As these requirements increase in the future, we will have to fully develop these technological capabilities to remain competitive and any failure to do so could adversely affect our business, financial condition and results of operations.
If we fail to promote and maintain our brands in a cost-effective manner, or if we experience negative publicity, we may lose market share and our revenue may decrease.
We believe that developing and maintaining awareness of our brands in a cost-effective manner is critical to attracting new and retaining existing consumers. Successful promotion of our brands will depend largely on the effectiveness of our marketing efforts and the experience of our consumers. Our efforts to build our brands have involved significant expense, and our future marketing efforts will require us to maintain or incur significant additional expense. These brand promotion activities may not result in increased revenue and, even if they do, any increases may not offset the expenses incurred. If we fail to successfully promote and maintain our brands or if we incur substantial expenses in an unsuccessful attempt to promote and maintain our brands, we may lose our existing consumers to our competitors or be unable to attract new consumers.
Additionally, reputational risk, or the risk to our business, results of operation and financial condition from negative public opinion, is inherent in our business. Negative public opinion can result from actual or alleged conduct by our employees or representatives in any number of activities, including lending and debt collection practices, marketing and promotion practices, corporate governance and actions taken by government regulators and community organizations in response to those activities. Negative public opinion can also result from media coverage, whether accurate or not. Negative public opinion can adversely affect our ability to attract and retain borrowers and employees and can expose us to litigation and regulatory action.
We may grow by making acquisitions, and we may not be able to identify or consummate acquisitions or otherwise manage our growth effectively.
Part of our growth strategy has included acquisitions, including the imortgage and Mortgage Master acquisitions described elsewhere in this prospectus, and we may acquire additional companies or businesses. We may not be successful in identifying origination platforms or businesses, or other businesses that meet our acquisition criteria in the future. In addition, even after a potential acquisition target has been identified, we may not be successful in completing or integrating the acquisition. We face significant competition for attractive acquisition opportunities from other well-capitalized companies, many of which have greater financial resources and a greater access to debt and equity capital to secure and complete acquisitions than we do. As a result of such competition, we may be unable to acquire certain assets or businesses that we deem attractive or the purchase price may be significantly elevated or other terms may be substantially more onerous. Any delay or failure on our part to identify, negotiate, finance on favorable terms, consummate and integrate such acquisitions could impede our growth.
There can be no assurance that we will be able to manage our expanding operations effectively or that we will be able to continue to grow, and any failure to do so could adversely affect our ability to generate revenue and control our expenses. Furthermore, we may be responsible for any legacy liabilities of businesses we acquire. The existence or amount of these liabilities may not be known at the time of acquisition and may have a material adverse effect on our consolidated financial position, results of operations or cash flow.
36
Table of Contents
Our hedging strategies may not be successful in mitigating our risks associated with changes in interest rates.
Our profitability is directly affected by the level of, and changes in, interest rates. The market value of a closed loan held for sale and interest rate lock commitments (“IRLCs”) generally decline as interest rates rise, and fixed-rate loans are more sensitive to changes in market interest rates than adjustable-rate loans. When we promise a client an interest rate for a loan before an investor has promised to buy the loan from us at a stated price, a gain or loss on the sale of the loan may result from changes in interest rates during the period between the date the interest rate is fixed and the date we receive a commitment to buy the loan at an agreed upon price.
Changes in interest rates could also lead to increased prepayment rates, which could materially and adversely affect the value of our servicing rights and could have a material adverse effect on our financial position, results of operations or cash flows. Historically, the value of servicing rights has increased when interest rates rise as higher interest rates lead to decreased prepayment rates, and have decreased when interest rates decline as lower interest rates lead to increased prepayment rates (for example, as consumers refinance their home loans to take advantage of lower interest rates). The value of our servicing rights is affected by a home loan refinance since the servicing income stops on the old loan when a consumer refinances into a new loan. As a result, substantial volatility in interest rates materially affects our consolidated financial position, results of operations and cash flows.
We employ various economic hedging strategies to mitigate the interest rate and fall-out risk that is inherent in many of our assets, including our commitments to fund loans and our home loans held for sale. These derivative instruments involve elements of interest rate and credit risk. Interest rate risk represents a component of market risk and represents the possibility that changes in interest rates will cause unfavorable changes in net income and in the value of our interest-rate-sensitive assets. Rising mortgage rates result in falling prices for those interest-rate-sensitive assets, which negatively affect their value.
Our derivative instruments, which currently consist of home loan forwards and options on U.S. Treasury futures, are accounted for as free-standing derivatives and are included on our consolidated balance sheet at fair market value. Our operating results may suffer because the losses on the derivatives we enter into may not be offset by a change in the fair value of the related hedged transaction. We use options on U.S. Treasury futures in hedging the interest rate risk exposure in volatile markets. Utilization of options on U.S. Treasury futures involve some degree of basis risk. Basis risk is defined as the risk that the hedge instrument’s price does not move in parallel with the increase or decrease in the market price of the hedged financial instrument. We calculate an expected hedge ratio to attempt to mitigate a portion of this risk. We also use mortgage forwards in hedging our interest rate risk exposure on our fixed rate and other adjustable rate commitments. Utilization of home loan forwards also involves some degree of basis risk. We calculate an expected hedge ratio to attempt to mitigate a portion of this risk. The success of our interest rate risk management strategy is largely dependent on our ability to predict the earnings sensitivity of loan production activities in various interest rate environments. Our hedging strategies also rely on assumptions and projections regarding our assets and general market factors.
Our hedging activities in the future may include entering into interest rate swaps, caps and floors, options to purchase these items, and/or purchasing or selling U.S. Treasury securities. Our hedging decisions in the future will be determined in light of the facts and circumstances existing at the time and may differ from our current hedging strategy. Moreover, our hedging strategies may not be effective in mitigating the risks related to changes in interest rates and could affect our profitability and financial condition. Poorly designed strategies or improperly executed transactions could actually increase our risk and losses. Further, the significant and atypical volatility in the current interest rate marketplace can negatively impact our hedging effectiveness. Finally, derivatives may expose us to counterparty risk, which is defined as the possibility that a loss may occur from the failure of another party to perform in accordance with the terms of the contract, which exceeds the value of existing collateral, if any.
37
Table of Contents
The geographic concentration of our loan originations may adversely affect our retail lending business, which would adversely affect our financial condition and results of operations.
For the year ended December 31, 2014 and the six months ended June 30, 2015, respectively, approximately 53% and 40% of our aggregate home loan origination was secured by properties concentrated in the states of California, Texas and Arizona. The properties securing the aggregate outstanding UPB of our home loan servicing rights portfolio have a similar geographic concentration. During the Financial Crisis, the states of California and Arizona experienced severe declines in property values and a disproportionately high rate of delinquencies and foreclosures relative to other states. To the extent that the states of California and Arizona continue to experience weaker economic conditions or greater rates of decline in real estate values than the United States generally, the concentration of loans that we service in those states may decrease the value of our servicing rights and adversely affect our retail lending business. The impact of property value declines may increase in magnitude and it may continue for a long period of time. Additionally, if states in which we have greater concentrations of business were to change their licensing or other regulatory requirements to make our business cost-prohibitive, we may be required to stop doing business in those states or may be subject to a higher cost of doing business in those states, which could materially adversely affect our business, financial condition and results of operations.
We may be required to indemnify the purchasers of loans that we originate, or repurchase those loans, if those loans fail to meet certain criteria or characteristics or under other circumstances.
Our contracts with purchasers of home loans that we originate, including the GSEs and other financial institutions that purchase home loans for investor or private label securitization, contain provisions that require us to indemnify the purchaser of the home loans or to repurchase the home loans under certain circumstances. We also pool FHA-insured and VA-guaranteed home loans, which back securities guaranteed by Ginnie Mae. While our contracts vary, they generally contain provisions that require us to indemnify these parties, or repurchase these home loans, if:
| • | our representations and warranties concerning home loan quality and home loan characteristics are inaccurate or are otherwise breached and not remedied within any applicable cure period (usually 90 days or less) after we receive notice of the breach; |
| • | we fail to secure adequate mortgage insurance within a certain period after closing of the applicable home loan; |
| • | a mortgage insurance provider denies coverage; or |
| • | the home loans fail to comply with underwriting or regulatory requirements. |
We believe that, as a result of the current market environment, many purchasers of home loans are particularly aware of the conditions under which home loan originators or sellers must indemnify them against losses related to purchased home loans, or repurchase those home loans, and would benefit from enforcing any repurchase remedies they may have.
Repurchased loans typically can only be resold at a steep discount to their repurchase price, if at all. They are also typically sold at a significant discount to the UPB. To recognize these potential indemnification and repurchase losses, we have recorded reserves of $10.3 million and $14.0 million as of December 31, 2014 and June 30, 2015, respectively. Our liability for repurchase losses is assessed quarterly. Although not all home loans repurchased are in arrears or default, as a practical matter most have been. Factors that we consider in evaluating our reserve for such losses include default expectations, expected investor repurchase demands (influenced by, among other things, current and expected home loan file requests and home loan insurance rescission notices) and appeals success rates (where the investor rescinds the demand based on a cure of the defect or acknowledges that the home loan satisfies the investor’s applicable representations and warranties), reimbursement by third party originators and projected loss severity. Also, although we re-evaluate our reserves for repurchase losses each quarter, evaluations of that sort necessarily are estimates and there remains a risk that the reserves will not be adequate.
38
Table of Contents
Additionally, if home values decrease, our realized home loan losses from home loan indemnifications and repurchases may increase. As such, our indemnification and repurchase costs may increase beyond our current expectations. See “Management’s Discussion and Analysis of Financial Condition and Results of Operations—Critical Accounting Policies and Estimates—Reserve for Loan Loss Obligations.” If we are required to indemnify the GSEs or other purchasers against loan losses, or repurchase loans, that result in losses that exceed our reserve, this could materially adversely affect our business, financial condition and results of operations.
Additionally, we may not be able to recover amounts from some third parties, such as brokers through our wholesale channel, from whom we may seek indemnification or against whom we may assert a loan repurchase demand in connection with a breach of a representation or warranty due to financial difficulties or otherwise. As a result, we are exposed to counterparty risk in the event of non-performance by counterparties to our various contracts, including, without limitation, as a result of the rejection of an agreement or transaction in bankruptcy proceedings, which could result in substantial losses for which we may not have insurance coverage.
If we are unable to maintain our relationship with the issuing bank of our personal loan products, our business will suffer.
We rely on an issuing bank to originate all personal loans and to comply with various federal, state and other laws. Our current issuing bank is Cross River Bank, a federally-insured New Jersey state-chartered bank, which handles a variety of consumer and commercial financing programs.
Our current agreement with Cross River Bank has an initial term ending in May 2018, with the possibility of two, successive two-year renewal terms, unless either party notifies the other of its intent to terminate the agreement at least 150 days prior to the end of the term. Cross River Bank could decide that working with us is not in its interest, could make working with it cost prohibitive or could decide to enter into exclusive or more favorable relationships with our competitors. Further, federal or state regulators could require Cross River Bank to terminate its relationship with us. In addition, Cross River Bank may not perform as expected under our agreements including potentially being unable to accommodate our projected growth in personal loan volume. We could in the future have disagreements or disputes with Cross River Bank, which could negatively impact or threaten our relationship.
The current agreement with Cross River Bank is non-exclusive, but if we establish a program to facilitate personal loans that is substantially similar to and/or competes with the Cross River Bank personal loan program, then we are required to pay a specified fee to Cross River Bank.
Cross River Bank is subject to oversight by the FDIC, the Consumer Financial Protection Bureau (“CFPB”) and the New Jersey Department of Banking and Insurance and must comply with complex rules and regulations, licensing and examination requirements, including requirements to maintain a certain amount of regulatory capital relative to its outstanding loans. We are a service provider to Cross River Bank, and as such, we are subject to audit by Cross River Bank in accordance with FDIC and CFPB guidance related to management of third-party vendors. We may also be subject to the examination and enforcement authority of the FDIC as a bank service company covered by the Bank Service Company Act and by the CFPB as a service provider to a covered institution. If Cross River Bank were to suspend, limit or cease its operations or if our relationship with Cross River Bank were to otherwise terminate, we would need to implement a substantially similar arrangement with another issuing bank, obtain additional state licenses, alter the terms at which personal loans are offered or curtail our operations. If we need to enter into alternative arrangements with a different issuing bank to replace our existing arrangements with Cross River Bank, we may not be able to negotiate a comparable alternative arrangement in a timely fashion, on commercial reasonable terms, or at all. Transitioning loan originations to a new issuing bank is untested and may result in delays in the issuance of loans or, if our platform becomes inoperable, may result in our inability to facilitate loans through our platform which would cause irreparable harm to our brand and reputation and would result in a material adverse effect on our results of operations. If we were unable to enter in an alternative arrangement with a different issuing bank, we would need to obtain
39
Table of Contents
additional state licenses in order to enable us to originate personal loans, as well to identify and comply with additional regulatory obligations under other state and federal laws, which would be costly and time-consuming. If we are unsuccessful in maintaining our relationships with Cross River Bank or other issuing banks, our ability to facilitate personal loan products could be materially impaired and our operating results would suffer.
If the credit decisioning and scoring models we use contain errors or are otherwise ineffective, our reputation and relationships with borrowers and investors could be harmed and our market share could decline.
Our ability to attract borrowers and investors to, and build trust in, our consumer loan products is significantly dependent on our ability to effectively evaluate a borrower’s credit profile and likelihood of default. To conduct this evaluation, we use credit decisioning and scoring models that assign each loan a grade and a corresponding interest rate. Our credit decisioning and scoring models are based on algorithms that evaluate a number of factors, including behavioral data, transactional data and employment information, which may not effectively predict future loan losses. We have only recently launched our personal loan and home equity products and our algorithms may prove inaccurate. If we are unable to effectively segment borrowers into relative risk profiles, we may be unable to offer attractive interests rates for borrowers and returns for investors in the loans. We refine these algorithms based on new data and changing macro and economic conditions. If any of these credit decisioning and scoring models contain programming or other errors, are ineffective or the data provided by borrowers or third parties is incorrect or stale, or if we are unable to obtain the data from borrowers or third parties, our loan pricing and approval process could be negatively affected, resulting in mispriced or misclassified loans or incorrect approvals or denials of loans. If any of these errors were to occur in the future, investors may try to rescind their affected investments or decide not to invest in loans or borrowers may seek to revise the terms of their loans or reduce the use of our loans.
If the personal loans we facilitate experience an increase in defaults, the return on investment for investors in those loans would be adversely affected and investors may not find investing in the personal loans we facilitate desirable.
Investors in the personal loans we facilitate have a variety of attractive investment options. An investor may become dissatisfied with us if a loan underlying its investment is not repaid and it does not receive full payment. As a result, our reputation may suffer and we may lose investor confidence, which could adversely affect investor participation as investors may seek more desirable investment options. Loss of investors would cause irreparable harm to our personal loan facilitation business.
If personal loan default rates are in excess of the expected default rates, we may be unable to collect our entire servicing fee.
Personal loans funded by our issuing bank (Cross River Bank) are not secured by any collateral, not guaranteed or insured by any third party and not backed by any governmental authority in any way. Our subservicer is therefore limited in its ability to collect on the loans if a borrower is unwilling or unable to repay. A borrower’s ability to repay can be negatively impacted by increases in their payment obligations to other lenders under home, credit card and other loans, including student loans and home equity lines of credit, loss of job or other sources of income, adverse health conditions, or other reasons. Changes in a borrower’s ability to repay personal loans facilitated by us could also result from increases in base lending rates or structured increases in payment obligations and could reduce the ability of our borrowers to meet their payment obligations to other lenders and to us. If a borrower defaults on a personal loan, our subservicer outsources subsequent servicing efforts to third-party collection agencies, which may be unsuccessful in their efforts to collect the amount of the personal loan. Because our servicing fees depend on the collectability of the personal loans, if we experience an unexpected significant increase in the number of borrowers who fail to repay their personal loans or an increase in the principal amount of the personal loans that are not repaid, we will be unable to collect our entire servicing fee for such personal loans and our revenue would be adversely affected.
40
Table of Contents
Our servicing rights are highly volatile assets with continually changing values, and these changes in value, or inaccuracies in our estimates of their value, could adversely affect our financial condition and results of operations.
The value of our servicing rights is based on the cash flows projected to result from the servicing of the related loans and continually fluctuates due to a number of factors. Our servicing portfolio is subject to “run off,” meaning that loans serviced by us (or our subservicer) may be prepaid prior to maturity, refinanced with a loan not serviced by us or liquidated through foreclosure, deed-in-lieu of foreclosure or other liquidation process or repaid through standard amortization of principal. As a result, our ability to maintain the size of our servicing portfolio depends on our ability to originate additional mortgages. In determining the value for our servicing rights and subservicing agreement, management makes certain assumptions, many of which are beyond our control, including, among other things:
| • | the speed of prepayment and repayment within the underlying pools of loans; |
| • | projected and actual rates of delinquencies, defaults and liquidations; |
| • | future interest rates and other market conditions; |
| • | our cost to service the loans; |
| • | ancillary fee income; and |
| • | amounts of future servicing advances. |
We use external, third-party valuations that utilize market participant data to value our servicing rights for purposes of financial reporting. We also benchmark these valuations to internal financial models. These models are complex and use asset-specific collateral data and market inputs for interest and discount rates. In addition, the modeling requirements of servicing rights are complex because of the high number of variables that drive cash flows associated with servicing rights. Even if the general accuracy of our valuation models is validated, valuations are highly dependent upon the reasonableness of the assumptions and the results of the models utilized in such valuations.
If loan delinquencies or prepayment speeds are higher than anticipated or other factors perform worse than modeled, the recorded value of our servicing rights would decrease, which would adversely affect our financial condition and results of operations.
We have made, and expect to continue to make, significant investments in personnel and our technology platform to allow us to retain additional servicing rights. In particular, we invest significant resources in recruiting, training, technology and systems. We may not realize the expected benefits of these investments to the extent we are unable to increase the pool of home loans serviced, we are delayed in obtaining the right to service such home loans or the servicing rights that we retain or the subservicing agreements we enter into are not appropriately valued. Any of the foregoing could adversely affect our financial condition and results of operations.
Substantially all of our loan servicing operations are conducted pursuant to subservicing contracts with subservicers, and any termination by our subservicers of these contracts, or a material change in the terms thereof that is adverse to us, would adversely affect our business, financial condition, liquidity and results of operations.
Substantially all of our loan servicing operations are currently conducted pursuant to a subservicing contract with Cenlar (for home loans) and a subservicing contract with First Associates (for personal loans), each an unaffiliated third party loan servicing provider. We are responsible for ensuring each subservicer’s compliance with the applicable servicing criteria and applicable law, and we are required to have procedures in place to provide reasonable assurance that its activities comply in all material respects with applicable servicing criteria and applicable law. In the event that a subservicer’s activities do not comply with the servicing criteria or
41
Table of Contents
applicable law for a home loan, it could negatively impact our agreements with the GSEs, Agencies or other investors. In addition, because our subservicers maintain the primary contact with the borrower of a serviced loan throughout the life of the loan, we have less ability to become involved with any potential loss mitigation. Therefore, we may not have control over a rise in delinquencies and/or claims among non-performing loans, both of which could have a material adverse effect on our business, financial condition, liquidity and results of operations.
Further, our subservicers may, under certain circumstances, terminate their subservicing contracts with or without cause, with little notice and in some instances with no compensation to us. Upon any such termination, it would be difficult to replace a large volume of subservicing on comparable terms in a short period of time, or perhaps at all.
In addition, for home loans, the approval of the GSEs or other investors that own the home loans underlying our servicing rights would be required to transfer our servicing rights portfolio from our subservicer to another subservicer. Such approval would be in the applicable investor’s discretion, and there is no assurance that such approval could be obtained if and when necessary. If we were to have our subservicing contract terminated by our subservicer, or if there was a change in the terms under which our subservicer performs subservicing that was materially adverse to us, it would adversely affect our business, financial condition and results of operations.
In order to be able to maintain or grow our servicing business, our servicing rights must be replaced as the loans that we service are repaid or refinanced, and if our loan business loses market share, our servicing business would also be impacted.
Our servicing portfolio is subject to “run-off,” meaning that loans serviced by us may be repaid at maturity, prepaid prior to maturity, refinanced with a loan not serviced by us or liquidated through foreclosure, deed-in-lieu of foreclosure or other liquidation process or repaid through standard amortization of principal. As a result, our ability to maintain the size of our servicing portfolio depends on our ability to originate loans with respect to which we retain the servicing rights.
If our loan business loses market share, or if the volume of loan originations otherwise decreases or if the loans underlying our servicing portfolio are repaid or refinanced at a faster pace, we may not be able to maintain or grow the size of our servicing portfolio, which could have a material adverse effect on our business, financial condition and results of operations.
We are required to make servicing advances that can be subject to delays in recovery or, to a lesser extent, may not be recoverable in certain circumstances, which could adversely affect our liquidity, business, financial condition and results of operations.
For home loans, during any period in which a borrower is not making payments, we are required under most of our servicing agreements in respect of our servicing rights to advance our own funds to meet contractual principal and interest remittance requirements for investors, pay property taxes and insurance premiums, legal expenses and other protective advances. We also advance funds under these agreements to maintain, repair and market real estate properties on behalf of investors. As home values change, we may have to reconsider certain of the assumptions underlying our decisions to make advances. In addition, if a home loan serviced by us is in default or becomes delinquent, the repayment to us of the advance may be delayed until the home loan is repaid or refinanced, foreclosure or a liquidation occurs. If we receive requests for advances in excess of amounts that we are able to fund at that time, we may not be able to fund these advance requests, which could materially and adversely affect our home loan servicing activities and our status as an approved servicer by Fannie Mae and Freddie Mac. A delay in our ability to collect an advance may adversely affect our liquidity, and our inability to be reimbursed for an advance could adversely affect our business, financial condition and results of operations.
42
Table of Contents
Our counterparties may terminate our servicing rights, which could adversely affect our business, financial condition and results of operations.
The owners of the home loans for which we have retained servicing rights, may, under certain circumstances, terminate our right to service the home loans. As is standard in the industry, under the terms of our master servicing agreements with the GSEs in respect of the servicing rights for home loans that we retain, the GSEs have the right to terminate us as servicer of the home loans we service on their behalf at any time (and, in certain instances, without the payment of any termination fee) and also have the right to cause us to sell the servicing rights to a third party. In addition, failure to comply with servicing standards could result in termination of our agreements with the GSEs with little or no notice and without any compensation. Currently, a subservicer performs the servicing activities on the home loans underlying our servicing rights portfolio. However, we are responsible to the GSEs that own the underlying loans for such activities. Consequently, in the event of a default by our subservicer, the GSE could terminate our servicing rights or require that our servicing rights be transferred to another subservicer.
The owners of the personal loans for which we have servicing rights may also under certain circumstances, generally related to our insolvency or a material breach, terminate our right to service the personal loans.
If we were to have our servicing rights terminated on a material portion of our servicing portfolio, the value of our servicing rights could be reduced or, potentially, eliminated entirely and our business, financial condition and results of operations could be adversely affected.
Our servicing rights portfolio has a limited performance history, which makes our future results of operations more difficult to predict.
With respect to home loans, the likelihood of delinquencies and defaults, and the associated risks to our business, including higher costs to service such home loans and a greater risk that we may incur losses due to repurchase or indemnification demands, changes as home loans season, or increase in age. Newly originated home loans typically exhibit low delinquency and default rates as the changes in economic conditions, individual financial circumstances and other factors that drive borrower delinquency often do not appear for months or years. Most of the home loans underlying our servicing rights portfolio were originated in recent years. As a result, we expect the delinquency rate and defaults of the loans underlying the servicing rights portfolio to increase in future periods as the portfolio seasons, but we cannot predict the magnitude of this impact on our results of operations. In addition, because most of the home loans in our portfolios are recently originated, it may be difficult to compare our business to our home loan originator competitors and others that have weathered the economic difficulties in our industry over the last several years. Such competitors may have better ability to model delinquency and default risk based on their longer operating histories and may have a better ability than we do in establishing appropriate loss reserves on their financial statements. Any inadequacy of our loss reserves established for delinquencies and defaults may result in future financial restatements or other adverse events.
We began servicing personal loans in May 2015 and do not yet have an operational track record.
We may incur increased costs and related losses if a borrower challenges the validity of a foreclosure action on a home loan or if a court overturns a foreclosure, which could adversely affect our business, financial condition, liquidity and results of operations.
We may incur costs if we are required to, or if we elect to, execute or re-file documents or take other action in our capacity as a servicer in connection with pending or completed foreclosures on home loans. We may incur litigation costs if the validity of a foreclosure action is challenged by a borrower. If a court overturns a foreclosure because of errors or deficiencies in the foreclosure process, we may have liability to a title insurer or the purchaser of the property sold in foreclosure. These costs and liabilities may not be legally or otherwise reimbursable to us, particularly to the extent they relate to securitized home loans. In addition, if certain documents required for a foreclosure action are missing or defective, we could be obligated to cure the defect or
43
Table of Contents
repurchase the home loan. A significant increase in litigation costs could adversely affect our liquidity, and our inability to be reimbursed for an advance could adversely affect our business, financial condition and results of operations. We may also incur the aforementioned costs and liabilities to the extent that they may be incurred by our subservicer under certain circumstances.
We rely on joint ventures with industry partners through which we originate home loans. If any of these joint ventures are terminated, our revenues could decline.
As of June 30, 2015, we were party to joint ventures with four industry partners (three home builders and one real estate broker). For the year ended December 31, 2014, revenue from loans originated through these joint ventures totaling $6.5 million represented approximately 1.2% of our total revenues; and for the six months ended June 30, 2015, revenue from loans originated through these joint ventures totaling $3.4 million represented approximately 0.7% of our total revenues. The termination of any of these joint ventures (including as a result of one of our partners exiting the industry), or a decline in the activity of the building industry generally, could cause revenue from loans originated through these joint ventures to decline, which would negatively impact our business.
Challenges to the MERS System could materially and adversely affect our business, results of operations and financial condition.
MERSCORP, Inc. is a privately held company that maintains an electronic registry, referred to as the MERS System, which tracks servicing rights and ownership of home loans in the United States. Mortgage Electronic Registration Systems, Inc. (“MERS”), a wholly owned subsidiary of MERSCORP, Inc., can serve as a nominee for the owner of a home loan and in that role initiate foreclosures or become the mortgagee of record for the loan in local land records. We and/or our subservicer have in the past and may continue to use MERS as a nominee. The MERS System is widely used by participants in the mortgage finance industry.
Several legal challenges in the courts and by governmental authorities have been made disputing MERS’s legal standing to initiate foreclosures or act as nominee for lenders in mortgages and deeds of trust recorded in local land records. These challenges have focused public attention on MERS and on how home loans are recorded in local land records. Although most legal decisions have accepted MERS as mortgagee, these challenges could result in delays and additional costs in commencing, prosecuting and completing foreclosure proceedings, conducting foreclosure sales of mortgaged properties and submitting proofs of claim in borrower bankruptcy cases.
We depend on the accuracy and completeness of information about borrowers and any misrepresented information could adversely affect our business, financial condition and results of operations.
In deciding whether to extend credit or to enter into other transactions with borrowers, we rely on information furnished to us by or on behalf of borrowers, including credit, identification, employment and other relevant information. Some of the information regarding borrowers provided to us is also used in our proprietary credit decisioning and scoring models, which we use to determine whether to lend to borrowers and the risk profiles of such borrowers. Such risk profiles are subsequently utilized by Warehouse Line counterparties who lend us capital to fund home loans and by our issuing bank partner to fund personal loans. We also may rely on representations of borrowers as to the accuracy and completeness of that information.
While we have a practice of seeking to independently verify some of the borrower information that we use in deciding whether to extend credit or to agree to a loan modification, including employment, assets, income and credit score, not all borrower information is independently verified, and if any of the information that is independently verified (or any other information considered in the loan review process) is misrepresented and such misrepresentation is not detected prior to loan funding, the value of the loan may be significantly lower than expected. Additionally, there is a risk that, following the date of the credit report that we obtain and review, a borrower may have become delinquent in the payment of an outstanding obligation, defaulted on a pre-existing
44
Table of Contents
debt obligation, taken on additional debt, lost his or her job or other sources of income; or sustained other adverse financial events. Whether a misrepresentation is made by the loan applicant, another third party or one of our employees, we generally bear the risk of loss associated with the misrepresentation. We may not detect all misrepresented information in our home loan originations or from service providers we engage to assist in the loan approval process. Any such misrepresented information could adversely affect our business, financial condition and results of operations.
We are also subject to the risk of fraudulent activity associated with the origination of loans. The level of our fraud charge-offs and results of operations could be materially adversely affected if fraudulent activity were to significantly increase. High profile fraudulent activity or significant increases in fraudulent activity could lead to regulatory intervention, negatively impact our operating results, brand and reputation and lead us to take steps to reduce fraud risk, which could increase our costs.
Our financial statements are based in part on assumptions and estimates made by our management, including those used in determining the fair values of a substantial portion of our assets. If the assumptions or estimates are subsequently proven incorrect or inaccurate, there could be a material adverse effect on our business, financial position, results of operations or cash flows.
Accounting rules for home loan sales and securitizations, valuations of financial instruments and servicing rights, and other aspects of our operations are highly complex and involve significant judgment and assumptions. For example, we utilize certain assumptions and estimates in preparing our financial statements, including when determining the fair values of certain assets and liabilities and reserves related to home loan representations and warranty claims and to litigation claims and assessments. These complexities and significant assumptions could lead to a delay in the preparation of financial information and also increase the risk of errors and restatements, as well as the cost of compliance. Changes in accounting interpretations or assumptions could impact our financial statements and our ability to timely prepare our financial statements. If the assumptions or estimates underlying our financial statements are incorrect, we may experience significant losses as the ultimate realization of value may be materially different than the amounts reflected in our consolidated statement of financial position as of any particular date, and there could be a material adverse effect on our business, financial position, results of operations or cash flows.
A substantial portion of our assets are recorded at fair value based upon significant estimates and assumptions with changes in fair value included in our consolidated results of operations. As of December 31, 2014 and June 30, 2015, respectively, 87.3% and 86.0% of our total assets were measured at fair value on a recurring basis, including $191.7 million and $281.5 million of assets representing our servicing rights and derivative assets which are valued using significant unobservable inputs and management’s judgment of the assumptions market participants would use in pricing the asset. The determination of the fair value of our assets involves numerous estimates and assumptions made by our management. Such estimates and assumptions include, without limitation, estimates of future cash flows associated with our servicing rights and derivative assets based upon assumptions involving, among other things, discount rates, prepayment speeds, cost of servicing of the underlying serviced home loans, pull-through rates and direct origination expenses. The use of different estimates or assumptions in connection with the valuation of these assets could produce materially different fair values, or our fair value estimates may not be realized in an actual sale or settlement, either of which could have a material adverse effect on our consolidated financial position, results of operations or cash flows.
Reserves are established for home loan representations and warranty claims when it is probable that a loss has been incurred and the amount of such loss can be reasonably estimated. In light of the inherent uncertainties involved in loan repurchase claims related to representations and warranties, it is not always possible to determine a reasonable estimate of the amount of a probable loss, and we may estimate a range of possible loss for consideration in our estimates. The estimates are based upon currently available information and involve significant judgment taking into account the varying stages and inherent uncertainties of such repurchase and
45
Table of Contents
indemnification requests. Accordingly, our estimates may change from time to time and such changes may be material to our consolidated results of operations, and the ultimate settlement of such matters may have a material adverse effect on our consolidated financial position, results of operations or cash flows.
Reserves are established for pending or threatened litigation, claims or assessments when it is probable that a loss has been incurred and the amount of such loss can be reasonably estimated. In light of the inherent uncertainties involved in litigation and other legal proceedings, it is not always possible to determine a reasonable estimate of the amount of a probable loss, and we may estimate a range of possible loss for consideration in its estimates. The estimates are based upon currently available information and involve significant judgment taking into account the varying stages and inherent uncertainties of such matters. Accordingly, our estimates may change from time to time and such changes may be material to our consolidated results of operations, and the ultimate settlement of such matters may have a material adverse effect on our consolidated financial position, results of operations or cash flows.
For additional information on the key areas for which assumptions and estimates are used in preparing our financial statements, see “Management’s Discussion and Analysis of Financial Condition and Results of Operations—Critical Accounting Policies and Estimates.”
Our vendor relationships subject us to a variety of risks and the failure of third parties to provide various services that are important to our operations could have a material adverse effect on our business.
We have significant vendors that, among other things, provide us with financial, technology and other services to support our loan servicing and originations activities. In April 2012, the CFPB issued guidance stating that institutions under its supervision may be held responsible for the actions of the companies with which they contract. Accordingly, we could be adversely impacted to the extent our vendors are unfamiliar with legal requirements applicable to the particular products or services being offered or fail to take efforts to implement such requirements effectively. In addition, if our current vendors were to stop providing services to us on acceptable terms, including as a result of one or more vendor bankruptcies due to poor economic conditions, we may be unable to procure alternatives from other vendors in a timely and efficient manner and on acceptable terms, or at all. Further, we may incur significant costs to resolve any such disruptions in service and this could adversely affect our business, financial condition and results of operations.
Some services important to our business are outsourced to third-party vendors. For example, substantially all of our home loan servicing operations are currently conducted by Cenlar. It would be difficult and disruptive for us to replace some of our third-party vendors, particularly Cenlar, in a timely manner if they were unwilling or unable to provide us with these services in the future (as a result of their financial or business conditions or otherwise), and our business and operations likely would be materially adversely affected. Our principal agreement with Cenlar automatically renewed for another three-year term in 2015 and will automatically renew itself for successive three-year terms until terminated by us or Cenlar. In our personal loan business, we rely upon Cross River Bank for loan origination and funding and First Associates for collection of monthly payments and other subservicing. Our principal agreement with Cross River Bank expires under its existing terms (assuming automatic renewals) in 2022, and our agreement with First Associates expires under its existing terms in 2017 but automatically renews for incremental one-year terms unless terminated by us or First Associates. In addition, if a third-party provider fails to provide the services we require, fails to meet contractual requirements, such as compliance with applicable laws and regulations, or suffers a cyber-attack or other security breach, our business could suffer economic and reputational harm that could have a material adverse effect on our business and results of operations. See “—Risks Related to Our Business—Substantially all of our loan servicing operations are conducted pursuant to subservicing contracts with subservicers, and any termination by our subservicers of these contracts, or a material change in the terms thereof that is adverse to us, would adversely affect our business, financial condition, liquidity and results of operations.”
46
Table of Contents
The loss of the services of our senior management could adversely affect our business.
The experience of our senior management, including Anthony Hsieh, our Chief Executive Officer, is a valuable asset to us. Our management team has significant experience in the residential home loan production and servicing industry and the investment management industry. Furthermore, certain of our Warehouse Lines specify that a substantial change in the management responsibilities of Mr. Hsieh constitutes an event of default. We do not maintain key life insurance policies relating to our senior management. See “—Risks Related to Our Business—The departure or change in the responsibilities of Anthony Hsieh, our Chief Executive Officer, and certain other changes in our ownership or in our board of directors may cause one or more events of default under our Warehouse Lines and other financing arrangements.”
Our business could suffer if we fail to attract and retain a highly skilled workforce.
Our future success will depend on our ability to identify, hire, develop, motivate and retain highly qualified personnel for all areas of our organization, in particular skilled managers, loan officers and underwriters. Trained and experienced personnel are in high demand and may be in short supply in some areas. Many of the companies with which we compete for experienced employees have greater resources than we have and may be able to offer more attractive terms of employment. In addition, we invest significant time and expense in training our employees, which increases their value to competitors who may seek to recruit them. We may not be able to attract, develop and maintain an adequate skilled workforce necessary to operate our business and labor expenses may increase as a result of a shortage in the supply of qualified personnel. If we are unable to attract and retain such personnel, we may not be able to take advantage of acquisitions and other growth opportunities that may be presented to us and this could materially affect our business, financial condition and results of operations.
Technology failures, including failure of internal security measures, could damage our business operations and increase our costs, which could adversely affect our business, financial condition and results of operations.
The financial services industry as a whole is characterized by rapidly changing technologies and system disruptions and failures caused by fire, power loss, telecommunications failures, unauthorized intrusion, computer viruses and disabling devices, natural disasters and other similar events may interrupt or delay our ability to provide services to our customers. Security breaches, acts of vandalism and developments in computer capabilities could result in a compromise or breach of the technology that we use to protect our customers’ personal information and transaction data. Despite our efforts to ensure the integrity of our systems, it is possible that we may not be able to anticipate or implement effective preventive measures against all security breaches, especially because the methods of attack change frequently or are not recognized until launched, and because security attacks can originate from a wide variety of sources, including third parties such as persons involved with organized crime or associated with external service providers. Those parties may also attempt to fraudulently induce employees, customers or other users of our systems to disclose sensitive information in order to gain access to our data or that of our borrowers. These risks may increase in the future as we continue to increase our reliance on the internet and use of web-based product offerings.
A successful penetration or circumvention of the security of our systems or a defect in the integrity of our systems or cyber security could cause serious negative consequences for our business, including significant disruption of our operations, misappropriation of our confidential information or that of our borrowers or damage to our computers or operating systems and to those of our borrowers and counterparties.
In the ordinary course of our business, we receive and store certain non-public personal information concerning borrowers. Additionally, we enter into third party relationships to assist with various aspects of our business, some of which require the exchange of confidential borrower information. If a third party were to compromise or breach our security measures or those of the vendors, through electronic, physical or other means, and misappropriate such information, it could cause interruptions in our operations and expose us to significant liabilities, reporting obligations, remediation costs and damage to our reputation.
47
Table of Contents
Any of the foregoing events could result in violations of applicable privacy and other laws, financial loss to us or to our borrowers, loss of confidence in our security measures, customer dissatisfaction, significant litigation exposure and harm to our reputation, and diversion of management attention, all of which could adversely affect our business, financial condition and results of operations.
We face litigation and legal proceedings that could have a material adverse effect on our revenues, financial condition, cash flows and results of operations.
We are routinely and currently involved in legal proceedings concerning matters that arise in the ordinary course of our business. See “Business—Legal Proceedings.” These legal proceedings range from actions involving a single plaintiff to class action lawsuits with potentially tens of thousands of class members. These actions and proceedings are generally based on alleged violations of consumer protection, employment, contract and other laws. Additionally, along with others in our industry, we are subject to repurchase claims and may continue to receive claims in the future. Our business in general exposes us to both formal and informal periodic inquiries, from various state and federal agencies as part of those agencies’ oversight of the origination and sale of home loans and servicing activities. See “—Risks Related to Our Regulatory Environment” below. An adverse result in governmental investigations or examinations or private lawsuits, including purported class action lawsuits, may adversely affect our financial results. In addition, a number of participants in our industry have been the subject of purported class action lawsuits and regulatory actions by state regulators, and other industry participants have been the subject of actions by state Attorneys General. Litigation and other proceedings may require that we pay settlement costs, legal fees, damages, penalties or other charges, any or all of which could adversely affect our financial results. In particular, legal proceedings brought under state consumer protection statutes may result in a separate fine for each violation of the statute, which, particularly in the case of class action lawsuits, could result in damages substantially in excess of the amounts we earned from the underlying activities and that could have a material adverse effect on our liquidity, financial position and results of operations.
We may be unable to sufficiently protect our proprietary rights and we may encounter disputes from time to time relating to our use of the intellectual property of third parties.
We rely on a combination of copyrights, trademarks, service marks, trade secrets, domain names and agreements with employees and third parties to protect our proprietary rights. We have trademark and service mark registrations and pending applications for additional registrations in the United States and select foreign jurisdictions. We also own the domain name rights for our institutions, as well as other words and phrases important to our business. Nonetheless, as new challenges arise in protecting these proprietary rights online, we cannot assure you that these measures will be adequate to protect our proprietary rights, that we have secured, or will be able to secure, appropriate protections for all of our proprietary rights or that third parties will not infringe upon or violate our proprietary rights. Despite our efforts to protect these rights, unauthorized third parties may attempt to duplicate or copy the proprietary aspects of our technology, curricula, and online resource material, among others. Our management’s attention may be diverted by these attempts, and we may need to expend funds in litigation to protect our proprietary rights against any infringement or violation.
We may also encounter disputes from time to time over rights and obligations concerning intellectual property, and we may not prevail in these disputes. Third parties may raise claims against us alleging an infringement or violation of their intellectual property. Some third-party intellectual property rights may be extremely broad, and it may not be possible for us to conduct our operations in such a way as to avoid all alleged violations of such intellectual property rights. Any such intellectual property claim could subject us to costly litigation and impose a significant strain on our financial resources and management personnel regardless of whether such claim has merit. Our insurance may not cover potential claims of this type adequately or at all, and we may be required to pay monetary damages, which may be significant, or our institutions may be required to alter the content of their classes to be non-infringing.
48
Table of Contents
Terrorist attacks and other acts of violence or war may affect the real estate industry generally and our business, financial condition and results of operations.
The terrorist attacks on September 11, 2001 disrupted the U.S. financial markets, including the real estate capital markets, and negatively impacted the U.S. economy in general. Any future terrorist attacks, the anticipation of any such attacks, the consequences of any military or other response by the United States and its allies, and other armed conflicts could cause consumer confidence and spending to decrease or result in increased volatility in the United States and worldwide financial markets and economy. The economic impact of these events could also adversely affect the credit quality of some of our loans and investments and the properties underlying our interests.
We may suffer losses as a result of the adverse impact of any future attacks and these losses may adversely impact our performance. A prolonged economic slowdown, recession or declining real estate values could impair the performance of our investments and harm our financial condition and results of operations, increase our funding costs, limit our access to the capital markets or result in a decision by lenders not to extend credit to us. We cannot predict the severity of the effect that potential future armed conflicts and terrorist attacks would have on us. Losses resulting from these types of events may not be fully insurable.
Risks Related to the Home Loan and Personal Loan Industries
Our home loan origination revenues are highly dependent on macroeconomic and U.S. residential real estate market conditions.
Our results of operations are materially affected by conditions in the home loan and real estate markets, the financial markets and the economy generally. During the Financial Crisis for example, a decline in home prices led to an increase in delinquencies and defaults, which led to further home price declines and losses for creditors. This depressed home loan origination activity and general access to credit. Post-Financial Crisis, the disruption in the capital markets and secondary mortgage markets has also reduced liquidity and investor demand for mortgage loans and MBS, while yield requirements for these products have increased. Continuing concerns about declines in the real estate market, as well as inflation, energy costs, geopolitical issues and the availability and cost of credit, have contributed to increased volatility and diminished expectations for the economy and markets going forward. Although the U.S. and global economies have shown improvement, the recovery remains modest and uncertain. If present U.S. and global economic uncertainties persist, loan origination activity may remain muted. Should any of these situations occur, our loan originations and revenue would decline and our business would be negatively impacted.
Our earnings may decrease because of changes in prevailing interest rates.
We generate a sizeable portion of our revenues from loans we make to clients that are used to refinance existing home loans. Generally, the refinance market experiences significant fluctuations. As interest rates rise, refinancing volumes generally decrease as fewer consumers are incentivized to refinance their mortgages. This could adversely affect our revenues or require us to increase marketing expenditures in an attempt to maintain refinancing related origination volumes. Higher interest rates may also reduce demand for purchase home loans as home ownership becomes more expensive and could also reduce demand for our home equity and personal loans. Decreases in interest rates can also potentially adversely affect our business as the stream of servicing fees and correspondingly, the value of servicing rights, decreases as interest rates decrease.
For more information regarding how changes in interest rates may negatively affect our financial condition and results of operations, see “Management’s Discussion and Analysis of Financial Condition and Results of Operations—Key Factors Influencing Our Results of Operations” and “—Quantitative and Qualitative Disclosures About Market Risk.”
49
Table of Contents
The industries in which we operate are highly competitive, and are likely to become more competitive, and our inability to compete successfully or decreased margins resulting from increased competition could adversely affect our business, financial condition and results of operations.
We operate in highly competitive industries that could become even more competitive as a result of economic, legislative, regulatory and technological changes. With respect to our home loan, home equity loan and personal loan businesses, we face competition in such areas as loan product offerings, rates, fees and customer service. With respect to servicing, we face competition in areas such as fees, compliance capabilities and performance in reducing delinquencies.
Competition in originating loans comes from large commercial banks and savings institutions and other independent loan originators and servicers. Many of these institutions have significantly greater resources and access to capital than we do, which gives them the benefit of a lower cost of funds. Commercial banks and savings institutions may also have significantly greater access to potential customers given their deposit-taking and other banking functions. Also, some of these competitors are less reliant than we are on the sale of home loans into the secondary markets to maintain their liquidity and may be able to participate in government programs that we are unable to participate in because we are not a state or federally chartered depository institution, all of which may place us at a competitive disadvantage. The advantages of our largest competitors include, but are not limited to, their ability to hold new loan originations in an investment portfolio and their access to lower rate bank deposits as a source of liquidity.
Additionally, more restrictive loan underwriting standards have resulted in a more homogenous product offering, which has increased competition across the home loan industry for loan originations. Furthermore, our existing and potential competitors may decide to modify their business models to compete more directly with our loan origination and servicing models. Since the withdrawal of a number of large participants from these markets following the Financial Crisis, there have been relatively few large nonbank participants.
In addition, technological advances and heightened e-commerce activities have increased consumers’ accessibility to products and services. This has intensified competition among banks and nonbanks in offering home loans. We may be unable to compete successfully in our industries and this could adversely affect our business, financial condition and results of operations.
Increases in delinquencies and defaults may adversely affect our business, financial condition and results of operations.
The level of home prices and home price appreciation affects performance in the home loan industry. For example, falling home prices between 2007 and 2011 across the United States resulted in higher LTV ratios, lower recoveries in foreclosure and an increase in loss severities above those that would have been realized had property values remained the same or continued to increase. Though housing values have stabilized and risen in many markets, many borrowers do not yet have sufficient equity in their homes to permit them to refinance their existing loans, which prevents them from financing into more affordable loans. There is also a risk that the current recovery in housing prices reverses and the U.S. experiences another decline in housing prices further reducing borrower equity and incentive to repay. Additionally, adverse macroeconomic conditions may further reduce borrowers’ ability to pay. Further, if rates rise borrowers with adjustable rate home loans may face higher monthly payments as the interest rates on those home loans adjust upward from their initial fixed rates or low introductory rates. All of these factors could potentially contribute to an increase in home loan delinquencies and correspondingly, defaults and foreclosures.
Increased home loan delinquencies, defaults and foreclosures may result in lower revenue for loans that we service for the Agencies, such as Fannie Mae or Freddie Mac, because we only collect servicing fees from the Agencies for performing loans. Additionally, while increased delinquencies generate higher ancillary fees, including late fees, these fees are not likely to be recoverable in the event that the related loan is liquidated. Also, increased home loan defaults may ultimately reduce the number of home loans that we service.
50
Table of Contents
Increased home loan delinquencies, defaults and foreclosures will also result in a higher cost to service those loans due to the increased time and effort required to collect payments from delinquent borrowers and to liquidate properties or otherwise resolve loan defaults if payment collection is unsuccessful, and only a portion of these increased costs are recoverable under our servicing agreements. Any loan level advances made on defaulted loans within the allowable levels provided by investors and insurers are recoverable either from the borrower in a reinstatement or the investors/insurers in a liquidation. Increased home loan delinquencies, defaults and foreclosures may also result in an increase in our interest expense and affect our liquidity if we are required to borrow to fund an increase in our advancing obligations. Any additional cost to service these loans, including interest expense on loan level advances, are generally not recoverable and are considered a cost of doing business.
In addition, we are subject to risks of borrower defaults and bankruptcies in cases where we might be required to repurchase loans sold with recourse or under representations and warranties. In these cases, a borrower filing for bankruptcy during foreclosure could have the effect of staying the foreclosure and thereby delaying the foreclosure process, which may potentially result in a reduction or discharge of a borrower’s home loan debt. Even if we are successful in directing a foreclosure on a home loan that has been repurchased, the liquidation proceeds upon sale of the underlying real estate may not be sufficient to recover our cost basis in the loan, resulting in a loss to us. Furthermore, any costs or delays involved in the foreclosure of the home loan or a liquidation of the underlying property will further reduce the net proceeds and, thus, increase the loss. If these risks materialize, they could have a material adverse effect on our business, financial condition and results of operations.
In the event we originate home loans that we are unable to sell, we will bear the risk of loss of principal on such home loans. An increase in delinquency rates could therefore adversely affect our business, financial condition and results of operations.
Similarly, an increase in defaults or delinquencies may impact the performance of our personal loan business. If delinquencies or defaults on personal loans increase, it has the potential to decrease investor interest in the asset class and make the sale of personal loans to investors more difficult, potentially reducing fee income relating to the origination of personal loans.
Our underwriting guidelines may not be able to accurately predict the likelihood of defaults on some of the home loans in our portfolio.
We originate and sell Agency-eligible residential home loans, which meet the underwriting guidelines defined by the Agencies. In addition, our underwriting policies include additional requirements designed to predict a borrower’s ability to repay. In spite of these standards, our underwriting guidelines may not always correlate with home loan defaults. For example, FICO scores, which we obtain on all loans, purport only to be a measurement of the relative degree of risk a borrower represents to a lender (i.e., that a borrower with a higher score is statistically expected to be less likely to default in payment than a borrower with a lower score). Underwriting guidelines cannot predict two of the most common reasons for a default on a home loan: loss of employment and serious medical illness. Any increase in default rates could have a material adverse effect on our business, financial condition, liquidity and results of operations.
Adverse developments in the secondary home loan market, including the MBS market, could have a material adverse effect on our business, financial position, results of operations and cash flows.
We historically have relied on selling or securitizing our home loans into the secondary market in order to generate liquidity to fund maturities of our indebtedness, the origination and warehousing of home loans, the retention of servicing rights and for general working capital purposes. We bear the risk of being unable to sell or securitize our home loans at advantageous times and prices or in a timely manner. Demand in the secondary market and our ability to complete the sale or securitization of our home loans depends on a number of factors, many of which are beyond our control, including general economic conditions, general conditions in the banking
51
Table of Contents
system, the willingness of lenders to provide funding for home loans, the willingness of investors to purchase home loans and MBS and changes in regulatory requirements. If it is not possible or economical for us to complete the sale or securitization of certain of our LHFS, we may lack liquidity under our Warehouse Lines to continue to fund such home loans and our revenues and margins on new loan originations would be materially and negatively impacted, which would materially and negatively impact our consolidated net revenue and net income and also have a material adverse effect on our overall business and our consolidated financial position. The severity of the impact would be most significant to the extent we were unable to sell conforming home loans to the GSEs or securitize such loans pursuant to Agency-sponsored programs.
During 2014 and the six months ended June 30, 2015 approximately 56% and 59%, respectively, of the loans that we originated were delivered to Fannie Mae or Freddie Mac to be pooled into agency MBS and 36% and 29%, respectively, of our loans were originated to FHA guidelines and pooled into Ginnie Mae MBS. Disruptions in the general MBS market have occurred in the past. Any significant disruption or period of illiquidity in the general MBS market would directly affect our liquidity because no existing alternative secondary market would likely be able to accommodate on a timely basis the volume of loans that we typically sell in any given period. Accordingly, if the MBS market experiences a period of illiquidity, we might be prevented from selling the loans that we produce into the secondary market in a timely manner or at favorable prices, which could materially adversely affect our business, financial condition and results of operations.
Risks Related to Our Regulatory Environment
We operate in a highly regulated industry that is undergoing regulatory transformation which has created inherent uncertainty. Changing federal, state and local laws, as well as changing regulatory enforcement policies and priorities, may negatively impact the management of our business, results of operations and ability to compete.
We are required to comply with a wide array of federal, state and local laws and regulations that regulate, among other things, the manner in which we conduct our loan origination and servicing activities, the terms of our loans and the fees that we may charge. See “Business—Supervision and Regulation.” A material or continued failure to comply with any of these laws or regulations could subject us to lawsuits or governmental actions and/or damage our reputation, which could materially adversely affect our business, financial condition and results of operations.
Additionally, federal, state and local governments and regulatory agencies have recently proposed or enacted numerous new laws, regulations and rules related to home loans and personal loans. Federal and state regulators are also enforcing existing laws, regulations and rules more aggressively and enhancing their supervisory expectations regarding the management of legal and regulatory compliance risks. Consumer finance regulation is constantly changing, and new laws or regulations, or new interpretations of existing laws or regulations, could have a materially adverse impact on our ability to operate as we currently intend.
These regulatory changes and uncertainties make our business planning more difficult and could result in changes to our business model and potentially adversely impact our result of operations. New laws or regulations also require us to incur significant expenses to ensure compliance. Accordingly, uncertainty persists regarding the competitive impact of new laws or regulations. As compared to our competitors, we could be subject to more stringent state or local regulations, or could incur marginally greater compliance costs as a result of regulatory changes. In addition, our failure to comply (or to ensure that our agents and third party service providers comply) with these laws or regulations may result in costly litigation or enforcement actions, the penalties for which could include but are not limited to: revocation of required licenses; fines and other monetary penalties; civil and criminal liability; substantially reduced payments by borrowers; modification of the original terms of loans, permanent forgiveness of debt, or inability to directly or indirectly collect all or a part of the principal of or interest on loans; delays in the foreclosure process and increased servicing advances; and increased repurchase and indemnification claims.
52
Table of Contents
Proposals to change the statutes affecting financial services companies are frequently introduced in Congress and state legislatures and, if enacted, may affect our operating environment in substantial and unpredictable ways. In addition, numerous federal and state regulators have the authority to pass or change regulations that could affect our operating environment in substantial and unpredictable ways. We cannot determine whether any such legislative or regulatory proposals will be enacted and, if enacted, the ultimate impact that any such potential legislation or implementing regulations, or any such potential regulatory actions by federal or state regulators, would have upon our financial condition or results of operations.
With respect to state regulation, although we seek to comply with applicable state loan, loan broker, home loan originator, servicing, debt collection and similar statutes in all U.S. jurisdictions, and with licensing or other requirements that we believe may be applicable to us, if we are found to not have complied with applicable laws, we could lose one or more of our licenses or authorizations or face other sanctions or penalties or be required to obtain a license in such jurisdiction, which may have an adverse effect on our ability to continue to originate home loans and to facilitate personal loans, perform our servicing obligations or make our loan platform available to borrowers in particular states, which may adversely impact our business.
We depend on the programs of the GSEs and Agencies. Discontinuation, or changes in the roles or practices, of these entities, without comparable private sector substitutes, could materially and negatively affect our results of operations and ability to compete.
We sell home loans to various entities, including Fannie Mae and Freddie Mac, which include the home loans in GSE-guaranteed securitizations. In addition, we pool FHA insured and VA guaranteed home loans, which back securities guaranteed by Ginnie Mae. During the year ended December 31, 2014 and the six months ended June 30, 2015, respectively, 56% and 59% of our home loan originations were sold to Fannie Mae and Freddie Mac and 36% and 29% of our home loan originations were FHA insured or VA guaranteed loans. We derive material financial benefits from our relationships with the Agencies, as our ability to originate and sell home loans under their programs reduces our credit exposure and home loans inventory financing costs. In addition, we receive compensation for servicing loans on behalf of Fannie Mae, Freddie Mac and Ginnie Mae.
The future of the GSEs and the role of the Agencies in the U.S. mortgage markets are uncertain. In 2008, Fannie Mae and Freddie Mac experienced catastrophic credit losses and were placed in the conservatorship of the FHFA. The FHA also was severely impacted by credit losses following the downturn in the U.S. housing market. The Obama Administration proposed in 2011 a plan to responsibly reduce the role of the GSEs in the mortgage market and, ultimately, wind down both institutions, which would be replaced by a new, yet-undefined housing finance model. In addition, proposals have been introduced by members of Congress recently to reform the role of the GSEs in the U.S. housing sector. It is not yet possible to determine whether or when any such proposals, or any additional federal legislative proposals, may be enacted, what form any final legislation or policies might take and how any such proposals, legislation or policies may impact our business, operations and financial condition.
The roles of the GSEs (including as insurers or guarantors of MBS) could be eliminated, or significantly reduced as a consequence of proposed reforms to the housing market. Additional reforms, some of which could be implemented through changes to the GSEs’ guidelines, might include: (i) further reductions in conforming loan limits; (ii) further tightening of underwriting standards and down payment requirements; (iii) increases in insurance premiums or guarantee fees; or (iv) changes to other servicer charges or compensation. In January 2011, the FHFA directed Fannie Mae and Freddie Mac to develop a joint initiative to consider alternatives for future mortgage servicing structures and compensation. Under this proposal, the GSEs are considering potential structures in which the minimum service fee would be reduced or eliminated altogether. This would provide home loan servicers with the ability to either sell all or a portion of the retained servicing fee for cash up front, or retain an excess servicing fee. While the proposal provides additional flexibility in managing liquidity and capital requirements, it is unclear how the various options might impact MBS pricing and the related pricing of excess servicing fees. The proposal may also have implications for the valuation of our existing servicing assets. The GSEs are also considering different pricing options for non-performing loans to better align servicer incentives
53
Table of Contents
with MBS investors and provide the loan guarantor the ability to transfer non-performing servicing. The FHFA has indicated that any change in the servicing compensation structure would be prospective and the changes, if implemented, could have a significant impact on the entire home loan industry and on the results of operations and cash flows of our home loan business.
The extent and timing of any reform regarding the GSEs, FHA and/or the home mortgage market are uncertain, which makes our business planning more difficult. Discontinuation, or significant changes in the roles or practices, of the Agencies, including changes to their guidelines and other proposed reforms, could require us to revise our business models, which could ultimately negatively impact our results of operations. Significant uncertainty also persists regarding the competitive impact of proposals to eliminate the GSEs in favor of private sector models.
Changes in GSE or Ginnie Mae selling and/or servicing guidelines or guarantees could adversely affect our business, financial condition and results of operations.
The Agencies require us to follow specific guidelines, which may be changed at any time. The Agencies have the ability to provide monetary incentives for loan servicers that perform well and to assess penalties for those that do not, including compensatory penalties against loan servicers in connection with the failure to meet specified timelines relating to delinquent loans and foreclosure proceedings and other breaches of servicing obligations. We generally cannot negotiate the terms of these guidelines or predict the penalties that the Agencies might impose for a failure to comply with those guidelines. Any failure by us to conform to these guidelines would materially adversely affect us.
We are required to follow specific guidelines that impact the way that we originate and service Agency loans, including guidelines with respect to:
| • | credit standards for home loans; |
| • | our staffing levels and other origination and servicing practices; |
| • | the fees that we may charge to consumers or pass-through to the Agencies; |
| • | our modification standards and procedures; |
| • | the amount of non-reimbursable advances; and |
| • | internal controls such as data security, compliance, quality control and internal audit. |
Our selling and servicing obligations under our contracts with the Agencies may be amended, restated, supplemented or otherwise modified by the Agencies from time to time without our specific consent. A significant modification to our selling and/or servicing obligations under our Agency contracts could adversely affect our business, financial condition and results of operations.
In particular, the FHFA has directed the GSEs to align their guidelines for servicing delinquent home loans that they own or that back securities which they guarantee, which can result in monetary incentives for servicers that perform well and penalties for those that do not. In addition, the FHFA has directed Fannie Mae to assess compensatory penalties against servicers in connection with the failure to meet specified timelines relating to delinquent loans and foreclosure proceedings and other breaches of servicing obligations. A significant change in these guidelines that has the effect of decreasing the fees we charge or requires us to expend additional resources in providing home loan services could decrease our revenues or increase our costs, which would adversely affect our business, financial condition and results of operations.
In addition, changes in the nature or extent of the guarantees provided by the GSEs or the insurance provided by the FHA could also have broad adverse market implications. The fees that we are required to pay to the GSEs for these guarantees have increased significantly over time and any future increases in these fees would adversely affect our business, financial condition and results of operations.
54
Table of Contents
We are subject to regulatory investigations and inquiries and may incur fines, penalties and increased costs that could negatively impact our future liquidity, financial position and results of operations or damage our reputation.
Federal and state agencies have broad enforcement powers over us and others in the loan origination and servicing industry, including powers to investigate our lending and servicing practices and broad discretion to deem particular practices unfair, deceptive, abusive or otherwise not in accordance with the law. See “Business—Supervision and Regulation.” The continued focus of regulators on the practices of the loan origination and servicing industry have resulted and could continue to result in new enforcement actions that could directly or indirectly affect the manner in which we conduct our business and increase the costs of defending and settling any such matters, which could impact our reputation and/or results of operations.
In addition, the laws and regulations applicable to us are subject to administrative or judicial interpretation, but some of these laws and regulations have been enacted only recently and may not yet have been interpreted or may be interpreted infrequently. As a result of infrequent or sparse interpretations, ambiguities in these laws and regulations may leave uncertainty with respect to permitted or restricted conduct under them. Any ambiguity under a law to which we are subject may lead to regulatory investigations, governmental enforcement actions or private causes of action, such as class action lawsuits, with respect to our compliance with applicable laws and regulations. Provisions that by their terms, or as interpreted, apply to lenders or servicers of loans may be construed in a manner that favors our borrowers and customers over loan originators and servicers. Furthermore, provisions of our loan agreements could be construed as unenforceable by a court.
The OIG recently completed two compliance audits of our operations in order to determine: (i) whether we originated FHA loans containing down payment assistance (“DPA”) in accordance with HUD FHA regulations; and (ii) whether we originated FHA loans containing Golden State Finance Authority DPA in accordance with HUD FHA regulations.
In connection with each audit, the OIG found that the FHA loans we originated did not always meet HUD requirements, alleging that the DPA used for certain loans constituted ineligible gifts and secondary financing funds which improperly resulted in a premium interest rate for the borrower. Specifically, the OIG contends that funds provided by State Housing Finance Agencies (“HFAs”) cannot properly be considered DPA funds. Accordingly, the OIG (i) recommended that HUD’s Associate General Counsel for Program Enforcement determine legal sufficiency and, if legally sufficient, pursue civil and administrative remedies, civil monetary penalties or both against us and our principals or both and (ii) recommended that HUD’s Deputy Assistance Secretary for Single Family Housing require us to cease originating FHA loans with the allegedly ineligible assistance; indemnify HUD for all FHA loans identified by the OIG as ineligible and any other loans that likely contain ineligible assistance (which could result in an indemnification obligation exceeding $100,000,000); reimburse amounts (less than $100,000 in the aggregate) to borrowers for fees that the OIG alleges were not customary or reasonable or were not representative of their intended purpose; collaborate with loan servicers to reduce interest rates for borrowers that the OIG asserts received DPA and were charged a premium interest rate; reimburse borrowers for overpaid interest payments as a result of any premium interest rate; and update our internal checklists to include specific HUD requirements on gifts, secondary financing, premium rates, and allowable fees. For more information, see “Business—Supervision and Regulation—Supervision and Enforcement.” Based on public statements that HUD has made in similar contexts, the outcome of the compliance audits is uncertain, and any actions taken against us by HUD based on the OIG’s recommendations could harm our reputation and otherwise negatively impact our business.
55
Table of Contents
The CFPB continues to be more active in its monitoring of the home loan and personal loan origination and servicing sectors. New rules and regulations, such as the TILA-RESPA Integrated Disclosure rules, and/or more stringent enforcement of existing rules and regulations by the CFPB, including with respect to vendor management, could result in increased compliance costs, enforcement actions, fines, penalties and the inherent reputational risk that results from such actions.
The CFPB is charged, in part, with enforcing certain federal laws involving consumer financial products and services and is empowered with examination, enforcement and rulemaking authority. The CFPB has taken an active role in lending markets. For example, the CFPB sends examiners to banks and other financial institutions that service and/or originate home loans to determine compliance with applicable federal consumer financial laws and to assess whether consumers’ interests are protected.
Among other things, the CFPB issued final rules that took effect on January 10, 2014 amending Regulation X, which implements RESPA, and Regulation Z, which implements TILA. These final rules implement provisions of the Dodd-Frank Wall Street Reform and Consumer Protection Act of 2010 (the “Dodd-Frank Act”) regarding home loan servicing, including periodic billing statements, certain notices and acknowledgements, prompt crediting of borrowers’ accounts for payments received, additional notice, availability and loss mitigation options for delinquent borrowers, prompt investigation of complaints by borrowers, prompt responses to inquiries by borrowers and required additional steps to be taken before purchasing insurance to protect the lender’s interest in the property. On November 20, 2014 the CFPB issued proposed amendments to these rules and expects the amendments to take effect in 2016 or early 2017. The CFPB has also provided for stricter rules governing marketing services arrangements which could impact our businesses practices. See “Business—Supervision and Regulation.”
The CFPB also has enforcement authority with respect to the conduct of third-party service providers of financial institutions. The CFPB has made it clear that it expects non-bank entities to maintain an effective process for managing risks associated with third-party vendor relationships, including compliance-related risks. In connection with this vendor risk management process, we are expected to perform due diligence reviews of potential vendors, review vendors’ policies and procedures and internal training materials to confirm compliance-related focus, include enforceable consequences in contracts with vendors regarding failure to comply with consumer protection requirements, and take prompt action, including terminating the relationship, in the event that vendors fail to meet our expectations. The CFPB is also applying greater scrutiny to compensation payments to third-party providers for marketing services and has issued guidance that potentially narrows the range of acceptable payments to third-party providers as part of marketing services agreements, lead generation agreements and other third-party marketer relationships. Specifically, in October 2015, the CFPB issued a compliance bulletin stating that, although the CFPB did not say that all marketing services agreements are illegal, the CFPB has grave concerns about the use of marketing services agreements in ways that avoid the requirements of RESPA, and intends to actively scrutinize the use of such agreements. We generate a significant amount of our business through third-party marketer relationships, of which marketing services agreements represent a relatively small portion. If the CFPB were to alter the forms of acceptable payment under arrangements beyond marketing services agreements, it could have a materially adverse impact on our business.
Additionally, in November 2013, the CFPB finalized its TILA-RESPA Integrated Disclosure (“TRID”) rule, which is intended to improve the way consumers receive information about home loans both when they apply and when they are getting ready to close. The TRID rule (also known as the Know Before You Owe Mortgage Disclosure Rule) became effective on October 3, 2015 and represents a comprehensive overhaul of not only the existing home loan disclosure rules, but the entire home loan origination process, and requires industry wide changes to the way in which home loan brokers, lenders, settlement agents and service providers must work with each other. The rule has required, and will continue to require, substantial expense and effort in order to implement.
We have relied on several third party vendors, in addition to our internal resources, to implement all of the home loan disclosure changes required by TRID. Failure of our vendors to properly integrate the various information technology systems required for us to effectively implement the TRID rule could result in additional
56
Table of Contents
expense and diversion of management attention in order to ensure we have appropriately implemented the TRID rule. In addition, any such failure of these information technology systems to be effectively integrated could result in our failure to have implemented the TRID rule prior to the CFPB mandated deadline, which may subject us to serious adverse consequences.
The TRID rule and other regulations promulgated under the Dodd-Frank Act or by the CFPB and actions by the CFPB could materially and adversely affect the manner in which we conduct our business, result in heightened federal regulation and oversight of our business activities, and in increased costs and potential litigation associated with our business activities. Our failure to comply with the laws, rules or regulations to which we are subject, whether actual or alleged, would expose us to fines, penalties or potential litigation liabilities, including costs, settlements and judgments, any of which could have a material adverse effect on our business, financial position, results of operations or cash flows and our ability to make distributions to our stockholders.
The federal government is increasingly seeking significant monetary damages and penalties against home loan lenders and servicers under the Financial Institutions Reform, Recovery, and Enforcement Act of 1989 (“FIRREA”) and the False Claims Act (“FCA”) for making false statements and seeking reimbursement for ineligible costs and expenses.
The federal government has initiated a number of actions against home loan lenders and servicers alleging violations of FIRREA and the FCA. Some of the actions against lenders allege that the lenders sold defective loans to Fannie Mae and Freddie Mac, while representing that the loans complied with the GSE’s underwriting guidelines. The federal government has also brought actions against lenders asserting that they submitted claims for FHA-insured loans that the lender falsely certified to HUD met FHA underwriting requirements that resulted in FHA paying out millions of dollars in insurance claims to cover the defaulted loans. HUD’s Office of Inspector General has commenced an audit of our operations and has advised us of instances of non-compliance with applicable rules. See “Business—Supervision and Regulation—Supervision and Enforcement” and the risk factor captioned “—We are subject to regulatory investigations and inquiries and may incur fines, penalties and increased costs that could negatively impact our future liquidity, financial position and results of operations or damage our reputation.” Other allegations involve the HAMP, which is a federal program established to help eligible homeowners impacted by financial hardship by offering them loan modifications on their home loans. HAMP requires participating home loan servicers to file annual certifications that they have been truthful and accurate in their HAMP-related activities, including reports they submitted to the government in which they acknowledged that providing false or fraudulent information may violate the FCA. Actions have also been filed against certain banks alleging they improperly denied borrowers access to HAMP services, and submitted fraudulent certifications and accepted financial incentives for HAMP participation. Because these actions carry the possibility for treble damages, many have resulted in settlements totaling in the hundreds of millions of dollars, as well as required lenders and servicers to make significant changes in their practices.
Federal and state legislative and agency initiatives in MBS, servicing eligibility standards and securitization may adversely affect our financial condition and results of operations.
There are federal and state legislative and agency initiatives related to MBS that could, once fully implemented, adversely affect our business. For instance, the risk retention requirement under the Dodd-Frank Act requires securitizers to retain a minimum beneficial interest in MBS they sell through a securitization, absent certain QRM exemptions. The rule also permits securitizers to share a portion of the risk retention requirement with certain originators. Once implemented, the risk retention requirement may result in higher costs of certain origination operations and impose on us additional compliance requirements to meet servicing and origination criteria for QRMs. The risk retention requirements become effective, for MBS, in December 2015. Additionally, the amendments to Regulation AB relating to the registration statement required to be filed by issuers of asset-backed securities (“ABS”) adopted by the SEC pursuant to the Dodd-Frank Act increases compliance costs for ABS issuers, which in turn increases our cost of funding and operations. Lastly, certain proposed federal legislation would permit
57
Table of Contents
borrowers in bankruptcy to restructure home loans secured by primary residences. Bankruptcy courts could, if this legislation is enacted, reduce the principal balance of a home loan that is secured by a lien on real property, reduce the home loan interest rate, extend the term to maturity or otherwise modify the terms of a bankrupt borrower’s home loan. Any of the foregoing could materially affect our financial condition and results of operations.
Discontinuation of, and changes to, government home loan modification and refinance programs could adversely affect our future revenues and business.
The federal government has introduced a number of programs intended to assist homeowners in modifying or refinancing their existing home loans or taking other steps to avoid foreclosure. Most of these programs provide incentives to lenders and servicers. Under the Making Home Affordable Plan, an official program of the U.S. Departments of the Treasury and HUD, which includes HAMP and HARP, a participating servicer may be entitled to receive financial incentives in connection with any modification plans that it enters into with eligible borrowers and subsequent success fees to the extent that a borrower remains current in any agreed upon loan modification. The existing HARP facilitates refinancing, which boosts our refinance revenues, but may negatively impact the valuation of our home loan servicing rights to the extent it increases home loan prepayment speeds. It may also result in our servicing portfolio becoming increasingly subject to run-off if we are not successful in recapturing our existing loans that are refinanced. The FHA also has a negative equity refinance program that facilitates refinancing of loans to borrower with little or negative equity in their homes.
Although for the year ended December 31, 2014 and the six months ended June 30, 2015, only 8.7% and 3.5%, respectively, of our originations volume was attributable to these programs, changes to the terms or requirements of these programs and their currently scheduled expiration at the end of 2016 for HAMP and HARP and at the end of 2016 for FHA’s negative equity refinance program could adversely affect our future revenues and business as we are likely to face increased competition by other market participants who have derived a greater portion of their revenues from these programs.
Unlike our competitors that are depository institutions, we are subject to state licensing and operational requirements that result in substantial compliance costs and our business would be adversely affected if our licenses are impaired.
Because we are not a federally chartered depository institution, we generally do not benefit from federal preemption of state home loan banking, loan servicing or debt collection licensing and regulatory requirements. We must comply with state licensing requirements and varying compliance requirements in all the states in which we operate and the District of Columbia, and we are sensitive to regulatory changes that may increase our costs through stricter licensing laws, disclosure laws or increased fees or that may impose conditions to licensing that we or our personnel are unable to meet. Further, our reliance on warehouse lines of credit for purposes of funding loans contains certain risks, as the recent home loan crisis resulted in warehouse lenders refusing to honor lines of credit for non-banks without a deposit base.
In most states in which we operate, a regulatory agency or agencies regulate and enforce laws relating to loan servicers, brokers and originators. These rules and regulations, which vary from state to state, generally provide for, but are not limited to: licensing as a loan servicer, loan originator or broker (including individual-level licensure for employees engaging in loan origination activities), loan modification processor/underwriter or third-party debt default specialist (or a combination thereof); requirements as to the form and content of contracts and other documentation; licensing of our employees and independent contractors with whom we contract; and employee hiring background checks. They also set forth restrictions on origination, brokering and collection practices, restrictions related to fees and charges, and disclosure and record-keeping requirements. They establish a variety of borrowers’ rights in the event of violations of such rules. Future state legislation and changes in existing regulation may significantly increase our compliance costs or reduce the amount of ancillary fees, including late fees that we may charge to borrowers. This could make our business cost-prohibitive in the affected state or states and could materially affect our business.
58
Table of Contents
In addition, we are subject to periodic examinations by state and other regulators in the jurisdictions in which we conduct business, which can result in increases in our administrative costs and refunds to borrowers of certain fees earned by us, and we may be required to pay substantial penalties imposed by those regulators due to compliance errors, or we may lose our license or our ability to do business in the jurisdiction otherwise may be impaired. Fines and penalties incurred in one jurisdiction may cause investigations or other actions by regulators in other jurisdictions.
We may not be able to maintain all currently requisite licenses and permits. In addition, the states that currently do not provide extensive regulation of our business may later choose to do so, and if such states so act, we may not be able to obtain or maintain all requisite licenses and permits, which could require us to modify or limit our activities in the relevant state(s). The failure to satisfy those and other regulatory requirements could result in a default under our Warehouse Lines, other financial arrangements and/or servicing agreements and thereby have a material adverse effect on our business, financial condition and results of operations.
We may be subject to liability for potential violations of predatory lending laws, which could adversely impact our results of operations, financial condition and business.
Various U.S. federal, state and local laws have been enacted that are designed to discourage predatory lending practices. The HOEPA amended TILA to prohibit inclusion of certain provisions in “high cost home loans” that have interest rates or origination costs in excess of prescribed levels, and require that borrowers receiving such loans be given certain disclosures, in addition to the standard TILA home loan disclosures, prior to origination. It also provides that an assignee of such a “high cost home loan” is subject to all claims and any defense which the borrower could assert against the original creditor, which has severely constrained the secondary market for such loans. Some states have enacted, or may enact, similar laws or regulations, which in some cases impose restrictions and requirements greater than those in HOEPA. In addition, under the anti-predatory lending laws of some states, the origination of certain home loans, including loans that are not classified as “high-cost” loans under applicable law, must satisfy a net tangible benefit test with respect to the related borrower. Such tests may be highly subjective and open to interpretation. As a result, a court may determine that a residential home loan, for example, does not meet the test even if the related originator reasonably believed that the test was satisfied. If any of our home loans are found to have been originated in violation of predatory or abusive lending laws, we could incur losses, which could adversely impact our results of operations, financial condition and business. If any of our home loans are found to exceed high-cost thresholds under HOEPA or equivalent state laws, we may be unable to sell them on the secondary market and/or be required to repurchase them from our investors.
The conduct of the brokers through whom we originate our wholesale home loans could subject us to fines or other penalties.
The brokers through whom we originate wholesale home loans have parallel and separate legal obligations to which they are subject. While these laws may not explicitly hold the originating lenders responsible for the legal violations of such brokers, U.S. federal and state agencies increasingly have sought to impose such liability. The U.S. Department of Justice (“DOJ”), through its use of a disparate impact theory under the ECOA and the Fair Housing Act, is actively holding home loan lenders responsible for the pricing practices of brokers, alleging that the lender is directly responsible for the total fees and charges paid by the borrower even if the lender neither dictated what the broker could charge nor kept the money for its own account. In addition, under the new TRID rule, we may be held responsible for improper disclosures made to consumers by brokers. We may be subject to claims for fines or other penalties based upon the conduct of the independent home loan brokers with which we do business.
59
Table of Contents
If the personal loan products we facilitate are found to violate state usury laws or other state consumer protection laws, we may have to make restitution, pay fines and/or alter our business model, with resulting harm to our financial condition and operations.
The personal loans we make available are originated by Cross River Bank and sold by Cross River Bank shortly after origination to third-party investors. Because Cross River Bank is an FDIC-insured bank chartered by the State of New Jersey, we believe that the interest rates on these loans are governed nationwide by Section 27 of the Federal Deposit Insurance Act (“Section 27”), without regard to more restrictive laws that might otherwise apply. Section 27 provides that an FDIC-insured state bank may charge interest at the rates allowed by the laws of the state where it is located. New Jersey allows its state banks to charge interest at a rate of 30% per annum on loans to individuals and 50% per annum on loans to corporations, limited liability companies and limited liability partnerships.
The applicability of Section 27 to the personal loans originated through our platform can be challenged on two potential bases: First, it could be argued that, notwithstanding Cross River Bank’s funding of the loans and its formal status as the lender, as a matter of substance either loanDepot or the nonbank assignee and not Cross River Bank should be treated as the “true lender,” with the result that state usury laws and not Section 27 would apply. Second, it could be argued that, even if Cross River Bank is the “true lender,” Section 27 ceases to apply once Cross River Bank sells the loan to a nonbank assignee, again with the result that state usury laws would apply.
The “true lender” argument has been litigated in a number of courts, most commonly (but not always) in cases involving short-term “payday loans” offered at triple-digit annual percentage rates, where the nonbank partner of the bank nominally making the loan provides turnkey marketing, billing, collection and accounting services in connection with the loans and also acquires the predominant if not entire economic interest in the loans. While our program involves neither payday loans nor the sales of loans to us, there nevertheless remains a risk that a court in one or more jurisdictions could conclude that the loans are unlawful because Cross River Bank is not the “true lender.”
In May 2015, the United States Court of Appeals for the Second Circuit issued a decision in Madden v. Midland Funding, holding that a nonbank loan purchaser cannot rely on federal law to continue charging the interest the bank lender can charge under federal law. As a result of Madden, Cross River Bank limits the maximum interest rates charged on personal loans to borrowers in the Second Circuit (i.e., New York, Connecticut and Vermont). It is unclear at this stage: (i) whether the Madden decision will be adopted by courts outside the Second Circuit; (ii) whether, notwithstanding Madden, nonbank loan purchasers can continue to charge the interest Cross River Bank can charge as a matter of state common law; or (iii) what long-term effects this ruling will have on the personal loans we facilitate, especially outside the Second Circuit. To date, approximately $16.8 million in UPB of personal loans that we have facilitated would have exceeded the maximum interest rates permitted under state law if Madden was applied nationally. We have not facilitated any personal loans in excess of the maximum interest rates permitted under state law in states located in the Second Circuit.
If a state attorney general or other authority (or a borrower suing on a class basis once our arbitration agreements no longer protect us against class actions) were to successfully challenge our program with Cross River Bank on the basis of either or both of the foregoing arguments, we could be compelled in the state in question to pay restitution and/or usury penalties as to existing loans (and any new loans originated at rates that are not permitted under the laws of the states in question), subject to applicable statutes of limitation. We could also be required to lower the maximum rates and fees charged on personal loans offered through the platform, obtain additional licenses and/or make other changes to our mode of operation. These changes could reduce our profits and operating efficiency with respect to personal loans.
Additional state consumer protection laws would be applicable to the loans facilitated through our personal loan program if we were re-characterized as a lender, and the loans could be voidable or unenforceable. In addition, we could be subject to claims by borrowers, as well as enforcement actions by regulators. Even if we
60
Table of Contents
were not required to cease doing business with residents of certain states or to change our business practices to comply with applicable laws and regulations, we could be required to register or obtain licenses or regulatory approvals that could impose a substantial cost on us.
Regulatory agencies and consumer advocacy groups are becoming more aggressive in asserting claims that the practices of lenders and loan servicers result in a disparate impact on protected classes.
Antidiscrimination statutes, such as the Fair Housing Act and the ECOA, prohibit creditors from discriminating against loan applicants and borrowers based on certain characteristics, such as race, religion and national origin. Various federal regulatory agencies and departments, including the DOJ and CFPB, take the position that these laws apply not only to intentional discrimination, but also to neutral practices that have a disparate impact on a group that shares a characteristic that a creditor may not consider in making credit decisions protected classes (i.e., creditor or servicing practices that have a disproportionate negative affect on a protected class of individuals).
These regulatory agencies, as well as consumer advocacy groups and plaintiffs’ attorneys, are focusing greater attention on “disparate impact” claims. The U.S. Supreme Court recently confirmed that the “disparate impact” theory applies to cases brought under the Fair Housing Act, while emphasizing that a causal relationship must be shown between a specific policy of the defendant and a discriminatory result that is not justified by a legitimate objective of the defendant. Although it is still unclear whether the theory applies under ECOA, regulatory agencies and private plaintiffs can be expected to continue to apply it to both the Fair Housing Act and ECOA in the context of home loan lending and servicing. To extent that the “disparate impact” theory continues to apply, we may be faced with significant administrative burdens in attempting to comply and potential liability for failures to comply.
Furthermore, many industry observers believe that the “ability to pay” rule issued by the CFPB, discussed above, will have the unintended consequence of having a disparate impact on protected classes. Specifically, it is possible that lenders that make only qualified mortgages may be exposed to discrimination claims under a disparate impact theory.
In addition to reputational harm, violations of the ECOA and the Fair Housing Act can result in actual damages, punitive damages, injunctive or equitable relief, attorneys’ fees and civil money penalties.
The Dodd-Frank Act prevents us from using arbitration agreements to protect against class actions on residential real estate loans and will likely result in the next few years in the adoption of a CFPB rule that will prevent us from using arbitration agreements to protect against class actions on other loans.
At present, where permitted by applicable law, companies providing consumer products and services, including consumer loans, frequently require their customers to agree to arbitrate any disputes on an individual basis rather than pursuing lawsuits, including class actions. Such agreements are binding in accordance with their terms as a matter of federal law, even where state law provides otherwise. Thus, arbitration agreements can serve as a vehicle for eliminating class action exposure.
Under the Dodd-Frank Act, arbitration agreements are not permitted for residential real estate loans. Accordingly, in the event of a purported violation of applicable law with respect to our real estate lending activities, we could be subject to class action liability.
While Cross River Bank’s personal loan agreements currently include arbitration agreements, the Dodd-Frank Act explicitly authorizes the CFPB to adopt a rule prohibiting the use of arbitration agreements in consumer financial services contracts. We expect the CFPB to adopt such a rule in the next few years. Any such rule, assuming it survives judicial challenge, would apply prospectively to contracts entered into at least 181 days after the rule becomes final; it would not apply to existing arbitration agreements or agreements entered into
61
Table of Contents
within 180 days after the rule becomes final. Accordingly, in the next few years, we expect to encounter a renewed risk of class action lawsuits attacking the personal loan program. This will significantly increase legal risks associated with this program.
In recent years, federal regulators and the DOJ have increased their focus on enforcing the Servicemembers Civil Relief Act (“SCRA”) against loan owners and servicers. Similarly, state legislatures have taken steps to strengthen their own state-specific versions of the SCRA.
The DOJ and federal regulators have entered into significant settlements with a number of loan servicers alleging violations of the SCRA. Some of the settlements have alleged that the servicers did not correctly apply the SCRA’s 6% interest rate cap, while other settlements have alleged that servicers did not comply with the SCRA’s foreclosure and default judgment protections when seeking to foreclose upon a home loan note or collect payment of a debt. Recent settlements indicate that the DOJ and federal regulators broadly interpret the scope of the substantive protections under the SCRA and are moving aggressively both to identify instances in which loan servicers have not complied with the SCRA. Alleged SCRA non-compliance was a focal point of the National Mortgage Settlement by the DOJ as well as the Independent Foreclosure Review jointly supervised by the Office of the Comptroller of the Currency and the Board of Governors of the Federal Reserve, and several additional SCRA-related settlements continue to make this a significant area of scrutiny for both regulatory examinations and public enforcement actions.
In addition, most state legislatures have their own versions of the SCRA. In most instances these laws extend some or all of the substantive benefits of the federal SCRA to members of the state National Guard who are in state service, but certain states also provide greater substantive protections to National Guard members or individuals who are in federal military service. Recent years have seen states revise their laws to increase the potential benefits to individuals, and these changes pose additional compliance burdens on creditors as they seek to comply with both the federal and relevant state versions of the SCRA.
Privacy and information security are an increasing focus of regulators at the federal and state levels.
Privacy requirements under the Gramm-Leach-Bliley Act (“GLBA”) and Fair Credit Reporting Act (“FCRA”) are within the regulatory and enforcement authority of the CFPB and are a standard part of CFPB examinations. Information security requirements under GLBA and FCRA are, for non-depository mortgage lenders, generally under the regulatory and enforcement authority of the Federal Trade Commission (“FTC”). The FTC has taken several actions against financial institutions and other companies for failure to adequately safeguard personal information. State entities may also initiate actions for alleged violations of privacy or security requirements under state law. Failure to comply with applicable privacy requirements may have a material adverse effect on our business, financial condition and results of operations.
A cyber-attack, information or security breach, or a technology failure of ours or of a third party could adversely affect our ability to conduct our business, manage our exposure to risk or expand our businesses, result in the disclosure or misuse of confidential or proprietary information, increase our costs to maintain and update our operational and security systems and infrastructure, and adversely impact our results of operations, as well as cause reputational harm.
We are dependent on the security and efficacy of our infrastructure, computer and data management systems, as well as those of third parties with whom we interact. Cyber security risks have significantly increased in recent years. We devote significant resources to maintain and regularly update our systems and processes that are designed to protect the security of our computer systems, software, networks and other technology assets against attempts by unauthorized parties to obtain access to confidential information, destroy data, disrupt or degrade service, sabotage systems or cause other damage. From time to time we, our vendors (including service providers located offshore who conduct support services for us) and other companies that store or process confidential borrower personal and transactional data are targeted by unauthorized parties using malicious code
62
Table of Contents
and viruses or otherwise attempting to breach the security of our or our vendors’ systems and data. We employ extensive layered security at all levels within our organization to help us detect malicious activity, both from within the organization and from external sources. Although we have established, and continue to establish on an ongoing basis, defenses to identify and mitigate cyber-attacks, loss, unauthorized access to, or misuse of confidential or personal information could disrupt our operations, damage our reputation, and expose us to claims from customers, financial institutions, regulators, employees and other persons, any of which could have an adverse effect on our business, financial condition and results of operations.
Risks Related to Our Organizational Structure
We are a holding company with no operations of our own and, as such, we depend on our subsidiaries for cash to fund all of our operations and expenses, including future dividend payments, if any.
We will be a holding company and will have no material assets other than our equity interest in LD Holdings, which will be a holding company and will have no material assets other than its equity interests in LDLLC and Intermediate LLC. Intermediate LLC will also be a holding company with no material assets other than its equity interest in LDLLC. We have no independent means of generating revenue. We intend to cause LDLLC to make distributions to LD Holdings and Intermediate LLC and to cause Intermediate LLC to make distributions to LD Holdings, and LD Holdings to make distributions to its unitholders in an amount sufficient to cover all applicable taxes payable by them determined according to assumed rates, payments owing under the tax receivable agreement, and dividends, if any, declared by us. To the extent that we need funds, and LDLLC or LD Holdings are restricted from making such distributions under applicable law or regulation, or are otherwise unable to provide such funds, it could materially and adversely affect our liquidity and financial condition.
We will be a “controlled company” and, as a result, qualify for, and intend to rely on, exemptions from certain corporate governance requirements. You will not have the same protections afforded to stockholders of companies that are subject to such requirements.
After completion of this offering and the use of proceeds to us therefrom, the Parthenon Stockholders, PCP, L.P. and Anthony Hsieh and his affiliates, collectively as a group, will continue to control a majority of the voting power of our outstanding common stock. As a result, we will be a “controlled company” within the meaning of the NYSE corporate governance standards. Under these rules, a company of which more than 50% of the voting power is held by an individual, group or another company is a ‘‘controlled company’’ and may elect not to comply with certain corporate governance requirements, including:
| • | the requirement that a majority of the board of directors consists of independent directors; |
| • | the requirement that our director nominees be selected, or recommended for our board of directors’ selection by a nominating and governance committee comprised solely of independent directors with a written charter addressing the nomination process; |
| • | the requirement that the compensation of our executive officers be determined, or recommended to our board of directors for determination, by a compensation committee comprised solely of independent directors; and |
| • | the requirement for an annual performance evaluation of the nominating/corporate governance and compensation committees. |
Following this offering, we intend to use these exemptions. As a result, we may not have a majority of independent directors, our governance and nominating committee and compensation committee may not consist entirely of independent directors and such committees will not be subject to annual performance evaluations. Accordingly, you will not have the same protections afforded to stockholders of companies that are subject to all of the corporate governance requirements.
63
Table of Contents
In addition, in 2012, the SEC passed final rules implementing provisions of the Dodd-Frank Act pertaining to compensation committee independence and the role and disclosure of compensation consultants and other advisers to the compensation committee. The SEC’s rules direct each of the national securities exchanges to develop listing standards requiring, among other things, that:
| • | compensation committees be composed of fully independent directors, as determined pursuant to new independence requirements; |
| • | compensation committees be explicitly charged with hiring and overseeing compensation consultants, legal counsel and other committee advisors; and |
| • | compensation committees be required to consider, when engaging compensation consultants, legal counsel or other advisors, certain independence factors, including factors that examine the relationship between the consultant or advisor’s employer and us. |
As a “controlled company,” we will not be subject to these compensation committee independence requirements.
The Parthenon Stockholders and the Continuing LLC Members control us and their interests may conflict with yours in the future.
Immediately following the offering and the application of net proceeds to us from the offering, the Parthenon Stockholders and the Continuing LLC Members will own approximately 79.6% of the combined voting power of our Class A and Class B common stock (or 76.7% if the underwriters’ option is exercised in full). Accordingly, the Parthenon Stockholders and the Continuing LLC Members, if voting in the same manner, will be able to control the election and removal of our directors and thereby determine our corporate and management policies, including potential mergers or acquisitions, payment of dividends, assets sales, amendment of our certificate of incorporation or bylaws and other significant corporate transactions for so long as the Parthenon Stockholders and the Continuing LLC Members retain significant ownership of us. This concentration of ownership may delay or deter possible changes in control of our company, which may reduce the value of an investment in our common stock. So long as the Parthenon Stockholders and the Continuing LLC Members continue to own a significant amount of our combined voting power, even if such amount is less than 50%, they will continue to be able to strongly influence or effectively control our decisions.
In particular, the Parthenon Stockholders and PCP, L.P. (collectively with their affiliates, the “Parthenon Group”) and Mr. Hsieh and his affiliates (collectively, the “Hsieh Group”) will each be parties to our stockholders agreement, and under that agreement will each have the right to designate nominees for election to our eight person board of directors equal to: (i) two nominees so long as such group owns at least 50% of the total voting power of common stock immediately held by such group following the completion of this offering and (ii) otherwise one nominee so long as such group owns at least 5% of the total voting power of the then-outstanding common stock, and in each case, we will agree to take certain actions to support those nominees for election and include the nominees in the relevant proxy statements. The Parthenon Group and the Hsieh Group will each additionally agree to take all necessary action, including voting their respective shares of common stock, to cause the election of the director nominated by such other group in accordance with the terms of the stockholders agreement, and will each be entitled to designate the replacement for any of its board designees whose board service terminates prior to the end of the director’s term. Because of these and other rights under the stockholders agreement, the Parthenon Group and the Hsieh Group will continue to be able to strongly influence or effectively control our decisions, even if they own less than 50% of our combined voting power. See “Certain Relationships and Related Party Transactions—Stockholders Agreement.”
In addition, immediately following the offering and the application of net proceeds to us from the offering, the Continuing LLC Members will own 57.9% of the Holdco Units (or 56.6% if the underwriters’ option is exercised in full). Because they hold their ownership interest in our business through LD Holdings, rather than
64
Table of Contents
us, these existing unitholders may have conflicting interests with holders of our Class A common stock. For example, the Continuing LLC Members may have different tax positions from us which could influence their decisions regarding whether and when to dispose of assets, and whether and when to incur new or refinance existing indebtedness, especially in light of the existence of the tax receivable agreement. In addition, the structuring of future transactions may take into consideration these existing unitholders’ tax considerations even where no similar benefit would accrue to us. See “Certain Relationships and Related Party Transactions—Tax Receivable Agreement.”
Certain of our stockholders have the right to engage or invest in the same or similar businesses as us.
In the ordinary course of its business activities, Parthenon Capital and its affiliates may engage in activities where its interests conflict with our interests or those of our stockholders. Our amended and restated certificate of incorporation will provide that Parthenon Capital or any of its officers, directors, agents, stockholders, members, partners, affiliates and subsidiaries will have no duty to refrain from engaging directly or indirectly in the same or similar business activities or lines of business as us or any of our subsidiaries, even if the opportunity is one that we might reasonably have pursued or had the ability or desire to pursue if granted the opportunity to do so. No such person will be liable to us for breach of any fiduciary or other duty, as a director or officer or otherwise, by reason of the fact that such person, acting in good faith, pursues or acquires any such business opportunity, directs any such business opportunity to another person or fails to present any such business opportunity, or information regarding any such business opportunity, to us unless, in the case of any such person who is our director or officer, any such business opportunity is expressly offered to such director or officer solely in his or her capacity as our director or officer. See “Description of Capital Stock—Corporate Opportunity.”
We will be required to pay certain Continuing LLC Members for certain tax benefits we may claim arising in connection with our purchase of Holdco Units and future exchanges of Holdco Units under the Holdings LLC Agreement and the potential purchase of Class I common units of LD Holdings, which payments could be substantial.
The Continuing LLC Members may from time to time cause LD Holdings to exchange an equal number of Holdco Units and Class B common stock for Class A common stock of loanDepot, Inc. on a one-for-one basis (as described in more detail in “Certain Relationships and Related Party Transactions—Limited Liability Company Agreement of LD Holdings”). In addition, we intend to purchase Holdco Units from the Exchanging Members and we may purchase Class I common units of LD Holdings pursuant to our election described under “Certain Relationships and Related Party Transactions—imortgage Settlement Agreement.” As a result of these transactions, we expect to become entitled to certain tax basis adjustments reflecting the difference between the price we pay to acquire Holdco Units or Class I common units of LD Holdings and the proportionate share of LD Holdings’ tax basis allocable to such units at the time of the exchange. As a result, the amount of tax that we would otherwise be required to pay in the future may be reduced by the increase (for tax purposes) in depreciation and amortization deductions attributable to our interests in LD Holdings, although the U.S. Internal Revenue Service (“IRS”) may challenge all or part of that tax basis adjustment, and a court could sustain such a challenge.
We and LD Holdings will enter into a tax receivable agreement with the Parthenon Stockholders and certain of the Continuing LLC Members that will provide for the payment by us to such parties or their permitted assignees of 85% of the amount of cash savings, if any, in U.S. federal, state and local tax that we realize or are deemed to realize as a result of (i) the tax basis adjustments referred to above, (ii) any incremental tax basis adjustments attributable to payments made pursuant to the tax receivable agreement and (iii) any deemed interest deductions arising from payments made by us pursuant to the tax receivable agreement. While the actual amount of the adjusted tax basis, as well as the amount and timing of any payments under this agreement will vary depending upon a number of factors, including the basis of our proportionate share of LD Holdings’ assets on the dates of exchanges, the timing of exchanges, the price of shares of our Class A common stock at the time of each exchange, the extent to which such exchanges are taxable, whether we elect to purchase Class I common units of LD Holdings (and if so, the timing of such a purchase and the price of such units), the deductions and other adjustments to taxable
65
Table of Contents
income to which LD Holdings is entitled, and the amount and timing of our income, we expect that during the anticipated term of the tax receivable agreement, the payments that we may make to the Parthenon Stockholders and certain of the Continuing LLC Members or their permitted assignees could be substantial. Payments under the tax receivable agreement may give rise to additional tax benefits and therefore to additional potential payments under the tax receivable agreement. In addition, the tax receivable agreement will provide for interest accrued from the due date (without extensions) of the corresponding tax return for the taxable year with respect to which the payment obligation arises to the date of payment under the agreement. Assuming no material changes in the relevant tax law and that we earn sufficient taxable income to realize all tax benefits that are subject to the tax receivable agreement, we expect that the tax savings associated with the purchase of Holdco Units from the Exchanging Members in connection with this offering and future exchanges of Holdco Units and Class B common stock as described above would aggregate to approximately $666.5 million over 15 years from the date of this offering based on offering price of $17.00 per share of our Class A common stock, which is the midpoint of the estimated price range set forth on the cover page of this prospectus, and assuming all future exchanges would occur one year after this offering. Under such scenario we would be required to pay to the Parthenon Stockholders and certain of the Continuing LLC Members or their permitted assignees approximately 85% of such amount, or approximately $566.5 million, over the 15 year period from the date of this offering.
Further, upon consummation of the offering and after giving effect to the use of proceeds to us therefrom, loanDepot, Inc. will have acquired a significant equity interest in LD Holdings from Parthenon Blocker after a series of transactions that will result in Parthenon Blocker merging with and into loanDepot, Inc., with loanDepot, Inc. remaining as the surviving corporation. See “Organizational Structure—Reorganization Transactions at LDLLC.” The Company will not realize any of the cash savings in U.S. federal, state and local tax described above regarding tax basis adjustments and deemed interest deductions in relation to any Class A common stock received by the Parthenon Stockholders in the Reorganization Transactions. The Parthenon Stockholders or their permitted assignees, however, will be entitled to receive payments under the tax receivable agreement in respect of the cash tax savings, if any, that we realize or are deemed to realize as a result of future exchanges of Holdco Units and Class B common stock for Class A common stock of loanDepot, Inc.
There may be a material negative effect on our liquidity if, as a result of timing discrepancies or otherwise, (i) the payments under the tax receivable agreement exceed the actual benefits we realize in respect of the tax attributes subject to the tax receivable agreement, and/or (ii) distributions to us by LDLLC and LD Holdings are not sufficient to permit us to make payments under the tax receivable agreement after it has paid its taxes and other obligations. For example, were the IRS to challenge a tax basis adjustment, or other deductions or adjustments to taxable income of LDLLC, none of the parties to the tax receivable agreement will reimburse us for any payments that may previously have been made under the tax receivable agreement, except that excess payments made to the Parthenon Stockholders and certain of the Continuing LLC Members or their permitted assignees will be netted against payments otherwise to be made, if any, after our determination of such excess. As a result, in certain circumstances we could make payments to the Parthenon Stockholders and certain of the Continuing LLC Members or their permitted assignees under the tax receivable agreement in excess of our ultimate cash tax savings. In addition, the payments under the tax receivable agreement are not conditioned upon any recipient’s continued ownership of interests in us or LD Holdings. The Parthenon Stockholders and certain of the Continuing LLC Members will receive payments under the tax receivable agreement until such time that they validly assign or otherwise transfer their rights to receive such payments.
In certain circumstances, including certain changes of control of the Company, payments by us under the tax receivable agreement may be accelerated and/or significantly exceed the actual benefits we realize in respect of the tax attributes subject to the tax receivable agreement.
The tax receivable agreement will provide that (i) in the event that we materially breach any of our material obligations under the agreement, whether as a result of failure to make any payment, failure to honor any other material obligation required thereunder or by operation of law as a result of the rejection of the agreements in a bankruptcy or otherwise, (ii) if, at any time, we elect an early termination of the agreement, or (iii) upon certain changes of control of the Company our (or our successor’s) obligations under the agreements (with respect to all
66
Table of Contents
Holdco Units and all Class I common units of LD Holdings, whether or not such units have been exchanged or acquired before or after such transaction) would accelerate and become payable in a lump sum amount equal to the present value of the anticipated future tax benefits calculated based on certain assumptions. These assumptions include the assumptions that (i) we (or our successor) will have sufficient taxable income to fully utilize the deductions arising from the increased tax deductions and tax basis and other benefits subject to the tax receivable agreement, (ii) we (or our successor) will utilize any loss carryovers generated by the increased tax deductions and tax basis and other benefits in the earliest possible tax year, and (iii) LD Holdings and its subsidiaries will sell certain nonamortizable assets (and realize certain related tax benefits) no later than a specified date. As a result of the foregoing, if we materially breach a material obligation under the agreement, if we elect to terminate the agreement early, or if we undergo a change of control we would be required to make an immediate lump sum payment equal to the present value of the anticipated future tax savings, which payment may be made significantly in advance of the actual realization of such future tax savings. In these situations, our obligations under the tax receivable agreement could have a substantial negative impact on our liquidity. There can be no assurance that we will be able to fund or finance our obligations under the tax receivable agreement. Additionally, the obligation to make a lump sum payment on a change of control may deter potential acquirors, which could negatively affect our stockholders’ potential returns. If we were to elect to terminate the tax receivable agreement immediately after this offering and the use of proceeds to us therefrom, based on the offering price of $17.00 per share of our Class A common stock, which is the midpoint of the estimated price range set forth on the cover page of this prospectus, we estimate that we would be required to pay approximately $392.0 million in the aggregate under the tax receivable agreement.
In certain circumstances, LD Holdings will be required to make distributions to us and the other holders of Holdco Units and the distributions that LD Holdings will be required to make may be substantial.
The holders of Holdco Units, including loanDepot, Inc., will incur U.S. federal, state and local income taxes on their proportionate share of any taxable income of LD Holdings. Net profits and net losses of LD Holdings will generally be allocated to the holders of Holdco Units (including loanDepot, Inc.) pro rata in accordance with their respective share of the net profits and net losses of LD Holdings. The Holdings LLC Agreement will provide for cash distributions, which we refer to as “tax distributions,” based on certain assumptions, to the holders of Holdco Units (including loanDepot, Inc.) pro rata based on their Holdco Units. Generally, these tax distributions to holders of Holdco Units will be an amount equal to our estimate of the taxable income of LD Holdings, net of taxable losses, allocable per Holdco Unit multiplied by an assumed tax rate equal to the highest effective marginal combined U.S. federal, state and local income tax rate prescribed for an individual resident in California (taking into account the non-deductibility of certain expenses). In determining taxable income, LD Holdings will adopt and use the “traditional” method of allocating items under Section 704(c) of the Code, as described in U.S. Treasury Regulations Section 1.704-3(b). Because tax distributions will be determined based on the holder of Holdco Units who is allocated the largest amount of taxable income on a per unit basis (taking into account and including allocations under Section 704(c) of the Code), LD Holdings may be required to make tax distributions that, in the aggregate, may exceed the amount of taxes that LD Holdings would have paid if it were taxed on its net income at the assumed rate.
Funds used by LD Holdings to satisfy its tax distribution obligations will not be available for reinvestment in our business. Moreover, the tax distributions that LD Holdings will be required to make may be substantial, and may exceed (as a percentage of LD Holdings’ income) the overall effective tax rate applicable to a similarly situated corporate taxpayer.
Tax distributions to us may exceed the sum of our tax liabilities to various taxing authorities and the amount we are required to pay under the tax receivable agreement. This may lead, under certain scenarios, to us having significant cash on hand in excess of our current operating needs. We will, in the sole discretion of our board of directors, use this cash to invest in our business, pay dividends to our stockholders or retain such cash for business exigencies in the future.
67
Table of Contents
Certain provisions of our amended and restated certificate of incorporation and our amended and restated bylaws could hinder, delay or prevent a change in control of us, which could adversely affect the price of our Class A common stock.
Certain provisions of our amended and restated certificate of incorporation and our amended and restated bylaws contain provisions that could make it more difficult for a third party to acquire us without the consent of our board of directors. These provisions:
| • | authorize the issuance of undesignated preferred stock, the terms of which may be established and the shares of which may be issued without stockholder approval, and which may include super voting, special approval, dividend, or other rights or preferences superior to the rights of the holders of common stock; |
| • | prohibit stockholder action by written consent, requiring all stockholder actions be taken at a meeting of our stockholders, if Parthenon Capital, Anthony Hsieh and their respective affiliates cease collectively to beneficially own more than 50% of our voting common stock; |
| • | provide that the board of directors is expressly authorized to make, alter or repeal our amended and restated bylaws; |
| • | establish advance notice requirements for nominations for elections to our board of directors or for proposing matters that can be acted upon by stockholders at stockholder meetings; |
| • | establish a classified board of directors, as a result of which our board of directors will be divided into three classes, with each class serving for staggered three-year terms, which prevents stockholders from electing an entirely new board of directors at an annual meeting; |
| • | limit the ability of stockholders to remove directors; |
| • | make it more difficult for a person who would be an “interested stockholder” to effect various business combinations with us for a three-year period; |
| • | prohibit stockholders from calling special meetings of stockholders; and |
| • | require the approval of holders of at least 75% of the outstanding shares of our voting common stock to amend the amended and restated bylaws and certain provisions of the amended and restated certificate of incorporation. |
In addition, these provisions may make it difficult and expensive for a third party to pursue a tender offer, change in control or takeover attempt that is opposed by our management or our board of directors. Stockholders who might desire to participate in these types of transactions may not have an opportunity to do so, even if the transaction is favorable to stockholders. These anti-takeover provisions could substantially impede the ability of stockholders to benefit from a change in control or change our management and board of directors and, as a result, may adversely affect the market price of our Class A common stock and your ability to realize any potential change of control premium. See “Description of Capital Stock—Anti-Takeover Effects of Certain Provisions of Delaware Law and Our Amended and Restated Certificate of Incorporation and Amended and Restated Bylaws.”
Risks Related to this Offering and Our Class A Common Stock
An active trading market for our Class A common stock may never develop or be sustained, which may cause shares of our Class A common stock to trade at a discount from the initial public offering price and make it difficult to sell the shares of Class A common stock you purchase.
Prior to this offering, there has not been a public trading market for shares of our Class A common stock. It is possible that an active trading market for our Class A common stock will not develop or continue, or, if developed, that any market will be sustained that would make it difficult for you to sell your shares of Class A
68
Table of Contents
common stock at an attractive price or at all. The initial public offering price per share of our Class A common stock will be determined by agreement among us, the selling stockholders and the underwriters, and may not be indicative of the price at which shares of our Class A common stock will trade in the public market after this offering. The market price of our Class A common stock may decline below the initial public offering price and you may not be able to sell your shares of our common stock at or above the price you paid in this offering, or at all.
The market price of our Class A common stock may be volatile, which could cause the value of your investment to decline.
Even if a trading market develops, the market price of our Class A common stock may be highly volatile and could be subject to wide fluctuations. In addition, the trading volume in our Class A common stock may fluctuate and cause significant price variations to occur. Securities markets worldwide experience significant price and volume fluctuations. This market volatility, as well as general economic, market or political conditions, could reduce the market price of shares of our Class A common stock in spite of our operating performance. In addition, our results of operations could be below the expectations of public market analysts and investors due to a number of potential factors, including variations in our quarterly or annual results of operations, additions or departures of key management personnel, changes in our earnings estimates (if provided) or failure to meet analysts’ earnings estimates, publication of research reports about our industry, litigation and government investigations, changes or proposed changes in laws or regulations or differing interpretations or enforcement thereof affecting our business, adverse market reaction to any indebtedness we may incur or securities we may issue in the future, changes in market valuations of similar companies or speculation in the press or the investment community with respect to us or our industry, adverse announcements by us or others and developments affecting us, announcements by our competitors of significant contracts, acquisitions, dispositions, strategic partnership, joint ventures or capital commitments, actions by institutional stockholders, increases in market interest rates that may lead investors in our shares to demand a higher yield, and in response the market price of shares of our Class A common stock could decreases significantly. You may be unable to resell your shares of Class A common stock at or above the initial public offering price, or at all.
These broad market and industry factors may decrease the market price of our Class A common stock, regardless of our actual operating performance. The stock market in general has from time to time experienced extreme price and volume fluctuations, including in recent months. In addition, in the past, following periods of volatility in the overall market and the market price of a company’s securities, securities class action litigation has often been instituted against these companies. This litigation, if instituted against us, could result in substantial costs and a diversion of our management’s attention and resources.
We will incur increased costs and become subject to additional regulations and requirements as a result of becoming a public company, and our management will be required to devote substantial time to new compliance matters, which could lower profits or make it more difficult to run our business.
As a public company, we expect to incur significant legal, accounting, reporting and other expenses that we have not incurred as a private company, including costs associated with public company reporting requirements and costs of recruiting and retaining non-executive directors. We also have incurred and will incur costs associated with compliance with the Sarbanes-Oxley Act and rules and regulations of the SEC, and various other costs of a public company. The expenses incurred by public companies generally for reporting and corporate governance purposes have been increasing. We expect these rules and regulations to increase our legal and financial compliance costs and to make some activities more time-consuming and costly, although we are currently unable to estimate these costs with any degree of certainty. Our management will need to devote a substantial amount of time to ensure that we comply with all of these requirements. These laws and regulations also could make it more difficult or costly for us to obtain certain types of insurance, including director and officer liability insurance, and we may be forced to accept reduced policy limits and coverage or incur substantially higher costs to obtain the same or similar coverage. These laws and regulations could also make it
69
Table of Contents
more difficult to attract and retain qualified persons to serve on our board of directors, our board committees or as executive officers. Furthermore, if we are unable to satisfy our obligations as a public company, we could be subject to delisting of our Class A common stock, fines, sanctions and other regulatory action and potentially civil litigation.
Failure to comply with the requirements to design, implement and maintain effective internal controls could have a material adverse effect on our business and stock price.
As a public company, we will have significant requirements for enhanced financial reporting and internal controls. The process of designing and implementing effective internal controls is a continuous effort that requires us to anticipate and react to changes in our business and the economic and regulatory environments and to expend significant resources to maintain a system of internal controls that is adequate to satisfy our reporting obligations as a public company.
If we are unable to establish or maintain appropriate internal financial reporting controls and procedures, it could cause us to fail to meet our reporting obligations on a timely basis, result in material misstatements in our consolidated financial statements and harm our operating results. In addition, we will be required pursuant to Section 404 of the Sarbanes-Oxley Act, or Section 404, to furnish a report by management on, among other things, the effectiveness of our internal control over financial reporting for the first fiscal year beginning after the effective date of this offering. This assessment will need to include disclosure of any material weaknesses identified by our management in an internal control over financial reporting. In addition, our independent registered public accounting firm will be required to formally attest to the effectiveness of our internal control over financial reporting pursuant to Section 404(b) commencing the later of the year following our first annual report required to be filed with the SEC, or the date we are no longer an “emerging growth company” as defined in the JOBS Act if we take advantage of the exemptions contained in the JOBS Act, as we currently intend. See “—We are an “emerging growth company” as defined in the Securities Act of 1933, as amended, and we cannot be certain if the reduced disclosure requirements applicable to emerging growth companies will make our Class A common stock less attractive to investors.” Testing and maintaining internal controls may divert our management’s attention from other matters that are important to our business. We may not be able to conclude on an ongoing basis that we have effective internal control over financial reporting in accordance with Section 404 or our independent registered public accounting firm may not issue an unqualified opinion. If either we are unable to conclude that we have effective internal control over financial reporting or our independent registered public accounting firm is unable to provide us with an unqualified report, investors could lose confidence in our reported financial information, which could cause the price of our common stock to decline, and we may be subject to investigation or sanctions by the SEC.
We are an “emerging growth company” as defined in the Securities Act of 1933, as amended, and we cannot be certain if the reduced disclosure requirements applicable to emerging growth companies will make our Class A common stock less attractive to investors.
We are an “emerging growth company” as defined in the Securities Act of 1933, as amended (the “Securities Act”), and we may take advantage of certain exemptions from various reporting requirements that are applicable to other public companies that are not emerging growth companies including, among other things, not being required to comply with the auditor attestation requirements of Section 404(b), reduced disclosure obligations regarding executive compensation and exemptions from the requirements of holding a non-binding stockholder advisory vote on executive compensation and stockholder approval of any golden parachute payments not previously approved. As a result, our stockholders may not have access to certain information that they may deem important.
An emerging growth company can utilize the extended transition period provided in the Securities Act for complying with new or revised accounting standards. However, we are choosing to “opt out” of such extended transition period, and, as a result, we will comply with new or revised accounting standards on the relevant dates
70
Table of Contents
on which adoption of such standards is required for companies that are not emerging growth companies. Our decision to opt out of the extended transition period for complying with new or revised accounting standards is irrevocable.
We could be an emerging growth company for up to five years following the date of this prospectus, although circumstances could cause us to lose that status earlier, including if our total annual gross revenues exceed $1.0 billion, if we issue more than $1.0 billion in non-convertible debt during any three-year period or if the market value of our Class A common stock held by non-affiliates exceeds $700 million as of any June 30 before that time. We cannot predict if investors will find our Class A common stock less attractive because we may rely on these exemptions. If some investors find our Class A common stock less attractive as a result, there may be a less active trading market for our Class A common stock, our stock price may be more volatile and the price of our Class A common stock may decline.
Investors in this offering will experience immediate and substantial dilution.
The initial public offering price of our Class A common stock will be substantially higher than the pro forma as adjusted net tangible book value per share of our Class A common stock immediately after this offering. As a result, you will pay a price per share of Class A common stock that substantially exceeds the per share book value of our tangible assets after subtracting our liabilities. In addition, you will pay more for your shares of Class A common stock than the amounts paid by our existing owners. Assuming an offering price of $17.00 per share of Class A common stock, which is the midpoint of the estimated price range set forth on the cover page of this prospectus, you will incur immediate and substantial dilution in an amount of $14.08 per share of Class A common stock. See “Dilution.”
You may be diluted by the future issuance of additional Class A common stock in connection with our incentive plans, acquisitions or otherwise.
After the offering and the use of proceeds to us therefrom, we will have an aggregate of 688,118,624 shares of Class A common stock authorized but unissued, including 85,177,447 shares of Class A common stock issuable upon exchange of Holdco Units and Class B common stock that will be held by the Continuing LLC Members. Our amended and restated certificate of incorporation authorizes us to issue these shares of Class A common stock and options, rights, warrants and appreciation rights relating to Class A common stock for the consideration and on the terms and conditions established by our board of directors in its sole discretion, whether in connection with acquisitions or otherwise. We have reserved 14,705,882 shares of Class A common stock for issuance under our 2015 Omnibus Incentive Plan (including any LTIP Units, which may be granted thereunder), which amount is subject to adjustment in certain events, and 3,676,470 shares of Class A common stock for issuance under the LD ESPP. See “Executive Compensation—Employee Benefit Plans—2015 Omnibus Incentive Plan” and “—Employee Stock Purchase Plan.” Any Class A common stock that we issue, including under the LD ESPP, our 2015 Omnibus Incentive Plan or other equity incentive plans that we may adopt in the future, would dilute the percentage ownership held by the investors who purchase Class A common stock in the offering.
Because we have no current plans to pay cash dividends on our Class A common stock, you may not receive any return on investment unless you sell your Class A common stock for a price greater than that which you paid for it.
We have no current plans to pay cash dividends on our Class A common stock. The declaration, amount and payment of any future dividends will be at the sole discretion of our board of directors. Our board of directors may take into account general and economic conditions, our financial condition and operating results, our available cash, current and anticipated cash needs, capital requirements, contractual, legal, tax and regulatory restrictions, implications on the payment of dividends by us to our stockholders or by our subsidiary to us and
71
Table of Contents
such other factors as the board may deem relevant. In addition, the terms of our existing financing arrangements restrict or limit our ability to pay cash dividends. Accordingly, we may not pay any dividends on our Class A common stock in the foreseeable future. See “Dividend Policy.”
Future offerings of debt or equity securities by us may adversely affect the market price of our Class A common stock.
In the future, we may attempt to obtain financing or to further increase our capital resources by issuing additional shares of our Class A common stock or offering debt or other equity securities, including commercial paper, medium-term notes, senior or subordinated notes, debt securities convertible into equity or shares of preferred stock. Future acquisitions could require substantial additional capital in excess of cash from operations. We would expect to obtain the capital required for acquisitions through a combination of additional issuances of equity, corporate indebtedness and/or cash from operations.
Issuing additional shares of our Class A common stock or other equity securities or securities convertible into equity may dilute the economic and voting rights of our existing stockholders or reduce the market price of our Class A common stock or both. Upon liquidation, holders of such debt securities and preferred shares, if issued, and lenders with respect to other borrowings would receive a distribution of our available assets prior to the holders of our Class A common stock. Debt securities convertible into equity could be subject to adjustments in the conversion ratio pursuant to which certain events may increase the number of equity securities issuable upon conversion. Preferred shares, if issued, could have a preference with respect to liquidating distributions or a preference with respect to dividend payments that could limit our ability to pay dividends to the holders of our Class A common stock. Our decision to issue securities in any future offering will depend on market conditions and other factors beyond our control, which may adversely affect the amount, timing or nature of our future offerings.
Future sales, or the perception of future sales, of shares of our Class A common stock by existing stockholders could cause the market price of our Class A common stock to decline.
The sale of substantial amounts of shares of our Class A common stock in the public market, or the perception that such sales could occur, including sales by the Parthenon Stockholders and the Continuing LLC Members, could harm the prevailing market price of shares of our Class A common stock. These sales, or the possibility that these sales may occur, also might make it more difficult for us to sell equity securities in the future at a time and at a price we deem appropriate. Upon completion of this offering after giving effect to the use of proceeds to us therefrom, we will have outstanding a total of 61,881,376 shares of Class A common stock. Of the outstanding shares, the 30,000,000 shares of Class A common stock sold in this offering by us and the selling stockholders, or 34,500,000 shares if the underwriters exercise their option to purchase additional shares in full, will be freely tradable without restriction or further registration under the Securities Act of 1933, as amended, or the Securities Act, except that any shares held by our affiliates, as that term is defined under Rule 144 of the Securities Act, may be sold only in compliance with the limitations described in “Shares Eligible for Future Sale.” In addition, subject to certain limitations and exceptions, pursuant to certain provisions of the Holdings LLC Agreement, the Continuing LLC Members may exchange an equal number of Holdco Units and Class B common stock for shares of our Class A common stock on a one-for-one basis, subject to customary conversion rate adjustments for stock splits, stock dividends and reclassifications. Upon consummation of the offering and after giving effect to the use of proceeds to us therefrom, the Continuing LLC Members will beneficially own 85,177,447 Holdco Units, or 83,737,447 Holdco Units if the underwriters exercise their option to purchase additional shares in full, all of which will be exchangeable for shares of our Class A common stock at any time and from time to time (subject to the terms of the Holdings LLC Agreement).
Our amended and restated certificate of incorporation authorizes us to issue additional shares of Class A common stock and options, rights, warrants and appreciation rights relating to Class A common stock for the consideration and on the terms and conditions established by our board of directors in its sole discretion. In accordance with the Delaware General Corporation Law (“DGCL”) and the provisions of our certificate of
72
Table of Contents
incorporation, we may also issue preferred stock that has designations, preferences, rights, powers and duties that are different from, and may be senior to, those applicable to shares of Class A common stock. Similarly, the Holdings LLC Agreement permits LD Holdings to issue an unlimited number of additional limited liability company interests of LD Holdings with designations, preferences, rights, powers and duties that are different from, and may be senior to, those applicable to the Holdco Units, and which may be exchangeable for shares of our Class A common stock.
Each of our directors and officers, and substantially all of our stockholders, including all of the selling stockholders, have entered into lock-up agreements with the underwriters that restrict their ability to sell or transfer their shares of Class A common stock. The lock-up agreements pertaining to this offering will expire 180 days from the date of this prospectus. Morgan Stanley & Co. LLC and Goldman, Sachs & Co., however, may, in their sole discretion, permit our officers, directors and other current stockholders who are subject to the contractual lock-up to sell shares prior to the expiration of the lock-up agreements. See “Underwriting” for a description of these lock-up agreements.
After the lock-up agreements expire, up to an additional 117,058,824 shares of Class A common stock (assuming all outstanding Holdco Units together with an equal number of shares of Class B common stock are exchanged for shares of Class A common stock) will be eligible for sale in the public market, approximately 105 million of which are held by our executive officers, directors and their affiliated entities, and will be subject to volume limitations under Rule 144 under the Securities Act and various vesting agreements. These holders will have registration rights that will permit them to sell the securities into the open market. See “Certain Relationships and Related Party Transactions—Registration Rights Agreement.”
We intend to file one or more registration statements on Form S-8 under the Securities Act to register shares of our Class A common stock or securities convertible or exchangeable for shares of our Class A common stock issued pursuant to our 2015 Omnibus Incentive Plan and the LD ESPP. See “Executive Compensation—Employee Benefit Plans—2015 Omnibus Incentive Plan—Available Shares” and “—Employee Stock Purchase Plan.” Any such Form S-8 registration statements will automatically become effective upon filing. Accordingly, shares registered under such registration statements will be available for sale in the open market. We expect that the initial registration statement on Form S-8 will cover shares of our Class A common stock.
As restrictions on resale end, the market price of our shares of Class A common stock could drop significantly if the holders of these restricted shares sell them or are perceived by the market as intending to sell them. These factors could also make it more difficult for us to raise additional funds through future offerings or our shares of Class A common stock or other securities.
If securities or industry analysts do not publish research or publish inaccurate or unfavorable research about our business, our stock price and trading volume could decline.
The trading market for our common stock will depend in part on the research and reports that securities or industry analysts publish about us or our business. Securities and industry analysts do not currently, and may never, publish research on our company. If no securities or industry analysts commence coverage of our company, the trading price of our stock would likely be negatively impacted. In the event securities or industry analysts initiate coverage, if one or more of the analysts who cover us downgrade our stock or publish inaccurate or unfavorable research about our business, our stock price would likely decline. If one or more of these analysts cease coverage of our company or fail to publish reports on us regularly, demand for our stock could decrease, which might cause our stock price and trading volume to decline.
73
Table of Contents
CAUTIONARY STATEMENT REGARDING FORWARD-LOOKING STATEMENTS
This prospectus contains forward-looking statements, which reflect our current views with respect to, among other things, our operations and financial performance. You can identify these statements by the use of words such as “outlook,” “potential,” “continue,” “may,” “seek,” “approximately,” “predict,” “believe,” “expect,” “plan,” “intend,” “estimate” or “anticipate” and similar expressions or the negative versions of these words or comparable words, as well as future or conditional verbs such as “will,” “should,” “would” and “could.” These statements may be found under “Management’s Discussion and Analysis of Financial Condition and Results of Operations” and “Business,” as well as in this prospectus generally, and are subject to certain risks and uncertainties that could cause actual results to differ materially from those included in the forward-looking statements. These risks and uncertainties include, but are not limited to, those risks described under the section entitled “Risk Factors” set forth herein. The forward-looking statements speak only as of the date on which they are made, and, except to the extent required by federal securities laws, we undertake no obligation to update any forward-looking statement to reflect events or circumstances after the date on which the statement is made or to reflect the occurrence of unanticipated events. In light of these risks and uncertainties, there can be no assurance that the forward-looking statements contained in this prospectus will in fact occur. You should not place undue reliance on these forward-looking statements. If one or more of these risks or uncertainties materialize or our underlying assumptions prove to be incorrect, our actual results may vary materially from what we may have expressed or implied by these forward-looking statements. We qualify all of the forward-looking statements in this prospectus by the cautionary statements and risks set forth in the section entitled “Risk Factors” and elsewhere in this prospectus. Forward-looking statements in this prospectus include, but are not limited to, statements regarding:
| • | ranges for our expected total net revenues, net (loss) income, Adjusted EBITDA, Adjusted (Loss) Income and gain on origination and sale of loans, net and origination income, net-personal loans for the three and nine months ended September 30, 2015, as set forth under “Prospectus Summary—Recent Developments”; |
| • | our reliance on Warehouse Lines and other sources of capital and liquidity to meet the financial requirements of our business; |
| • | difficulties inherent in growing our personal and home equity loan businesses; |
| • | our level of indebtedness; |
| • | our recent rapid growth; |
| • | the continually changing federal, state and local laws and regulations applicable to the highly regulated industry in which we operate; |
| • | lawsuits or governmental actions if we do not comply with the laws and regulations applicable to our businesses; |
| • | the creation of the CFPB, its recently issued and future rules and the enforcement thereof by the CFPB; |
| • | changes in existing U.S. government-sponsored entities, their current roles or their guarantees or guidelines; |
| • | the licensing and operational requirements of states and other jurisdictions applicable to our businesses, to which our bank competitors are not subject; |
| • | changes in macroeconomic and U.S. residential real estate market conditions; |
| • | difficulties inherent in growing loan production volume; |
| • | changes in prevailing interest rates; |
| • | increases in loan delinquencies and defaults; and |
| • | any required additional capital and liquidity to support business growth that may not be available on acceptable terms, if at all. |
74
Table of Contents
The Private Securities Litigation Reform Act of 1995 and Section 27A of the Securities Act do not protect any forward-looking statements that we make in connection with this offering.
You should read this prospectus and the documents that we reference in this prospectus and the documents we have filed as exhibits to the registration statement, of which this prospectus is a part, completely and with the understanding that our actual future results may be materially different from what we expect.
75
Table of Contents
loanDepot, Inc. was formed as a Delaware corporation on July 10, 2015. LD Holdings was formed as a Delaware limited liability company on October 16, 2015. Following the Reorganization Transactions and the Offering Transactions described below, we will be a holding company and our sole material asset will be an equity interest in LD Holdings, which will be a holding company and have no material assets other than its equity interest in LDLLC and Intermediate LLC. Intermediate LLC will also be a holding company with no material assets other than its equity interest in LDLLC. loanDepot, Inc. has not engaged in any other business or other activities except in connection with the Reorganization Transactions and the Offering Transactions described below. Following the offering, through our ability to appoint the board of managers of LD Holdings, which will have the ability to appoint the board of managers of LDLLC, our operating subsidiary that conducts all of our operations directly, we will indirectly operate and control all of the business and affairs and consolidate the financial results of LD Holdings and its subsidiaries, including LDLLC. The ownership interest of the members of LD Holdings (other than loanDepot, Inc.) will be reflected as a non-controlling interest in our consolidated financial statements.
The diagram below depicts our simplified organizational structure immediately following the Reorganization Transactions and the offering after giving effect to the use of proceeds to us therefrom and assuming no exercise by the underwriters of their option to purchase additional shares of Class A common stock. As discussed in greater detail below, prior to the completion of this offering, (i) the 6th LLC Agreement of LDLLC will be further amended and restated as the 7th LLC Agreement to, among other things, modify its capital structure by replacing the different classes of interests (other than the Class I common units of LDLLC) that had been held by Parthenon Blocker and the Continuing LLC Members with a single new class of LLC Units, (ii) Parthenon Blocker and the Continuing LLC Members will contribute to the newly formed LD Holdings all of their respective LLC Units in exchange for Holdco Units of LD Holdings on a one-for-one-basis and (iii) the holders of Class I common units of LDLLC will simultaneously contribute all of their respective Class I common units of LDLLC for substantially identical Class I common units of LD Holdings. In connection with such exchange transactions, which will result in LDLLC becoming a wholly owned subsidiary of LD Holdings, each of Parthenon Blocker, the Continuing LLC Members and the holders of Class I common units of LD Holdings will enter into the Holdings LLC Agreement. After completing these exchange transactions, LD Holdings will further amend and restate the 7th LLC Agreement as the 8th LLC Agreement to simplify the equity arrangements of LDLLC as a subsidiary company and to create two classes of common units of LDLLC, Class A common units which will have voting and economic rights and Class B common units which will have voting rights only and no economic rights.
In connection with the exchange transactions set forth above, we will issue to the Continuing LLC Members a number of shares of loanDepot, Inc. Class B common stock equal to the number of Holdco Units held by such Continuing LLC Members. Our Class B common stock will entitle holders to one vote per share and will vote as a single class with our Class A common stock. However, the Class B common stock will not have any economic rights. The Holdings LLC Agreement will also provide that each of the Continuing LLC Members will have the right to exchange one Holdco Unit and one share of Class B common stock together for one share of our Class A common stock, subject to customary conversion rate adjustments for stock splits, stock dividends and reclassifications. Any Holdco Units exchanged under the exchange provisions described above will thereafter be owned by loanDepot, Inc. Any shares of Class B common stock exchanged will be cancelled.
Following the exchange transactions set forth above, in order to facilitate certain HUD regulatory compliance matters for LDLLC, (i) LD Holdings will form Intermediate LLC, a Delaware limited liability company, (ii) LDLLC will issue 999 Class A common units to LD Holdings in exchange for all of the LDLLC units then held by LD Holdings, representing 99.9% of the management and voting power of LDLLC and 100.0% of the economic interest of LDLLC, and (iii) LDLLC will issue one Class B common unit to Intermediate LLC for $1.00 in cash, representing 0.1% of the management and voting power of LDLLC.
76
Table of Contents
Thereafter, Parthenon Blocker and loanDepot, Inc. will engage in a series of transactions that will result in Parthenon Blocker merging with and into loanDepot, Inc., with loanDepot, Inc. remaining as the surviving corporation. As a result of such transactions, the Parthenon Stockholders will exchange all of the equity interests of Parthenon Blocker in return for shares of loanDepot, Inc. Class A common stock.
In connection with the offering, loanDepot, Inc. will acquire a number of Holdco Units from LD Holdings and the Exchanging Members that is equal to the number of shares of Class A common stock that are issued and outstanding (including shares sold in this offering) and the Continuing LLC Members will own the remaining outstanding Holdco Units. The Class I common units of LD Holdings will only be entitled to the fixed payment rights set forth in the Holdings LLC Agreement and are not otherwise entitled to any distributions or residual interest in LD Holdings. See “Certain Relationships and Related Party Transactions—imortgage Settlement Agreement.” LD Holdings will own the equity interests of LDLLC and Intermediate LLC as set forth below. loanDepot, Inc., through its significant equity interest in LD Holdings, will benefit from the income of LDLLC and its consolidated subsidiaries to the extent of any distributions made in respect of our holdings of Holdco Units. Any such distributions will be distributed to all holders of Holdco Units, including the Continuing LLC Members, pro rata based on their holdings of Holdco Units.
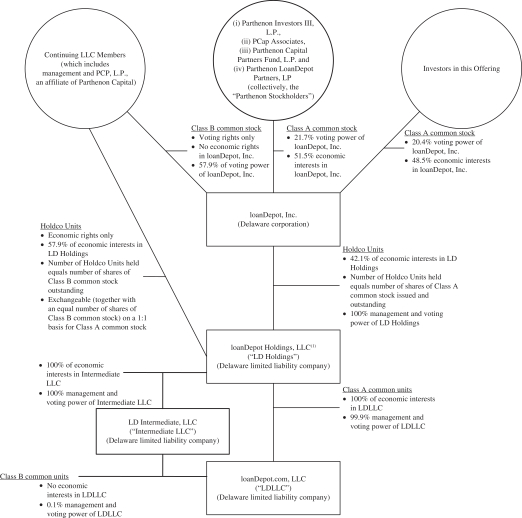
| (1) | Class I common units will remain outstanding following the Reorganization Transactions and this offering as units of LD Holdings. Holders of such units will only be entitled to the fixed payment rights set forth in |
77
Table of Contents
| the Holdings LLC Agreement and are not otherwise entitled to any distributions or residual interest in LD Holdings. See “Certain Relationships and Related Party Transactions—imortgage Settlement Agreement.” |
Reorganization Transactions at LDLLC
Immediately prior to the offering, LDLLC and its direct and indirect equity holders will effect certain transactions, which we collectively refer to as the “Reorganization Transactions.” Currently, LDLLC’s capital structure consists of different classes of membership interests, each of which has different capital accounts and amounts of aggregate distributions above which its holders share in future distributions. The entry into the 7th LLC Agreement, as part of the Reorganization Transactions, will result in the conversion of the current multiple-class structure (other than the Class I common units of LDLLC) into a single new class of LLC Units in LDLLC. The Class I common units of LDLLC will remain outstanding following the entry into the 7th LLC Agreement. The conversion ratios of all of the different classes of units of LDLLC (other than the Class I common units of LDLLC) into a single class will be based on the proceeds that each unit would receive in a hypothetical liquidation (pursuant to the distribution provisions set forth in the 6th LLC Agreement) of 100% of LDLLC based on the initial public offering price of the Class A common stock. The number of LLC Units issued upon conversion per class of outstanding units will be determined pursuant to the distribution provisions set forth in the 6th LLC Agreement. Immediately after such conversion is effected, each holder of LLC Units will exchange such LLC Units on a one-for-one basis for Holdco Units. Simultaneously, the holders of LDLLC’s Class I common units will also contribute all of their respective Class I common units of LDLLC to LD Holdings for substantially identical Class I common units of LD Holdings. In connection with such exchange transactions, which will result in LDLLC becoming a wholly owned subsidiary of LD Holdings, each of Parthenon Blocker, the Continuing LLC Members and the holders of Class I common units of LD Holdings will enter into the Holdings LLC Agreement. After completing these exchange transactions, LD Holdings will further amend and restate the 7th LLC Agreement as the 8th LLC Agreement to simplify the equity arrangements of LDLLC as a subsidiary company and create two classes of common units at LDLLC, Class A common units which will have voting and economic rights and Class B common units which will have voting rights only and no economic rights.
In connection with the exchange transactions set forth above, we will issue to the Continuing LLC Members a number of shares of loanDepot, Inc. Class B common stock equal to the number of Holdco Units held by such Continuing LLC Members. Our Class B common stock will entitle holders to one vote per share and will vote as a single class with our Class A common stock. However, the Class B common stock will not have any economic rights. The Holdings LLC Agreement will also provide that each of the Continuing LLC Members will have the right to exchange one Holdco Unit and one share of Class B common stock together for one share of our Class A common stock, subject to customary conversion rate adjustments for stock splits, stock dividends and reclassifications. Any Holdco Units exchanged under the exchange provisions described above will thereafter be owned by loanDepot, Inc. Any shares of Class B common stock exchanged will be cancelled.
Following the exchange transactions set forth above, in order to facilitate certain HUD regulatory compliance matters for LDLLC, (i) LD Holdings will form Intermediate LLC, a Delaware limited liability company, (ii) LDLLC will issue 999 Class A common units to LD Holdings in exchange for all of the LDLLC units then held by LD Holdings, representing 99.9% of the management and voting power of LDLLC and 100.0% of the economic interest of LDLLC, and (iii) LDLLC will issue one Class B common unit to Intermediate LLC for $1.00 in cash, representing 0.1% of the management and voting power of LDLLC.
Thereafter, (i) Parthenon Blocker and loanDepot, Inc. will engage in a series of transactions that will result in Parthenon Blocker merging with and into loanDepot, Inc., with loanDepot, Inc. remaining as the surviving corporation, (ii) the Parthenon Stockholders and loanDepot, Inc. will cause to be terminated an existing call option providing the Parthenon Stockholders the option to purchase, from Parthenon Blocker (and loanDepot, Inc. after the merger described in clause (i) above), its equity interest in LDLLC, and (iii) loanDepot, Inc. and LD Holdings will enter into the tax receivable agreement with (a) the Parthenon Stockholders in exchange for the satisfaction of promissory notes previously issued by Parthenon Blocker to the Parthenon Stockholders in an aggregate principal amount of approximately $20.8 million, which notes will be cancelled after such exchange,
78
Table of Contents
and (b) following the completion of the offering, certain of the Continuing LLC Members as part of the consideration received by such Continuing LLC Members in exchange for the sale of Holdco Units to loanDepot, Inc. As a result of the transactions described in clause (i) above, the Parthenon Stockholders will receive 38,548,603 shares of our Class A common stock. loanDepot, Inc. will own one Holdco Unit for each share of Class A common stock so issued to the Parthenon Stockholders. As a result of the transaction described in clause (ii) above, loanDepot, Inc. will be required to recognize and pay taxes on $5.2 million of taxable income, which corresponds to the initial purchase price paid by the Parthenon Stockholders to acquire the call option from Parthenon Blocker in 2009.
The following table summarizes the number of membership interests by class outstanding prior to the Reorganization Transactions, the conversion ratio for each class, and the number of shares of Class A common stock and Class I common units of LD Holdings that will be outstanding after the Reorganization Transactions and before this offering, assuming (i) that all Holdco Units owned by the Continuing LLC Members, together with an equal number of shares of Class B common stock, are exchanged for shares of Class A common stock and (ii) the sale of shares of Class A common stock in this offering, including by the selling stockholders, at a price per share to the public of $17.00, which is the midpoint of the estimated price range set forth on the cover page of this prospectus.
| Members of LDLLC |
Number of applicable units before the Reorganization Transactions as of October 30, 2015 |
Conversion Ratio in the Reorganization Transactions |
Number of shares of Class A common stock outstanding after the Reorganization Transactions and before the Offering |
|||||||||
| Holders of Class A Common Units |
269,000 | 198.43 | 53,378,576 | |||||||||
| Holders of Class B Common Units |
50,000 | 201.49 | 10,074,741 | |||||||||
| Holders of Class P Common Units |
12,500 | 218.49 | 2,731,092 | |||||||||
| Holders of Class P-2 Common Units |
19,800 | 151.26 | 2,994,958 | |||||||||
| Holders of Class W Common Units |
10,000 | (1) | 5.88 | 58,824 | (2) | |||||||
| Holders of Class X Common Units |
2,880,433,367 | (1) | 0.02 | 49,201,428 | (3) | |||||||
| Holders of Class Y Common Units |
14,567 | (1) | 23.24 | 338,542 | (4) | |||||||
| Holders of Class Z-1 Common Units |
44,502 | (1) | 7.44 | 331,142 | (5) | |||||||
| Holders of Class Z-2 Common Units |
83,189 | (1) | 7.52 | 625,490 | (6) | |||||||
| Holders of Class Z-3 Common Units |
133,789 | (1) | 7.55 | 1,010,407 | (7) | |||||||
| Holders of Class Z-4 Common Units |
268,239 | (1) | 23.24 | 6,233,935 | (8) | |||||||
| Holders of Class I Common Units |
1,190,093 | (9) | N/A | — | ||||||||
| Holders of Class J Common Units |
— | N/A | — | |||||||||
| Holders of Class K Common Units |
— | N/A | — | |||||||||
|
|
|
|||||||||||
| Total |
126,979,136 | |||||||||||
|
|
|
|||||||||||
| (1) | The numbers shown include both vested and unvested common units. The Reorganization Transactions will not affect applicable vesting timelines. |
| (2) | With respect to these 58,824 Holdco Units, 24,514 will be vested and 34,310 will be unvested as of the completion of this offering. |
| (3) | With respect to these 49,201,428 Holdco Units, 38,609,378 will be vested and 10,592,050 will be unvested as of the completion of this offering. |
| (4) | With respect to these 338,542 Holdco Units, 193,214 will be vested and 145,328 will be unvested as of the completion of this offering. |
| (5) | With respect to these 331,142 Holdco Units, 321,664 will be vested and 9,478 will be unvested as of the completion of this offering. |
| (6) | With respect to these 625,490 Holdco Units, 610,779 will be vested and 14,711 will be unvested as of the completion of this offering. |
| (7) | With respect to these 1,010,407 Holdco Units, 988,854 will be vested and 21,553 will be unvested as of the completion of this offering. |
79
Table of Contents
| (8) | With respect to these 6,233,935 Holdco Units, 6,117,858 will be vested and 116,077 will be unvested as of the completion of this offering. |
| (9) | 1,190,093 Class I common units of LDLLC will be exchanged for substantially identical Class I common units of LD Holdings as part of the Reorganization Transactions and will remain outstanding upon completion of this offering. For more information, see “Certain Relationships and Related Party Transactions—imortgage Settlement Agreement.” |
Incorporation of loanDepot, Inc.
loanDepot, Inc. was incorporated as a Delaware corporation on July 10, 2015. loanDepot, Inc. has not engaged in any business or other activities except in connection with its formation. The amended and restated certificate of incorporation of loanDepot, Inc. at the time of the offering will authorize two classes of common stock, Class A common stock and Class B common stock and one or more series of preferred stock, each having the terms described in “Description of Capital Stock.”
Prior to completion of the offering, a number of shares of Class B common stock equal to the number of outstanding Holdco Units owned by the Continuing LLC Members will be issued to the Continuing LLC Members in order to provide them with voting rights in loanDepot, Inc. Each Continuing LLC Member will receive a number of shares of Class B common stock equal to the number of Holdco Units held by such Continuing LLC Member. See “Description of Capital Stock—Common Stock—Class B Common Stock.” Holders of our Class A and Class B common stock each have one vote per share of Class A and Class B common stock, respectively, and vote together as a single class on all matters presented to our stockholders for their vote or approval, except as otherwise required by applicable law.
Formation of LD Holdings
LD Holdings was formed as a Delaware limited liability company on October 16, 2015. The Holdings LLC Agreement designates loanDepot, Inc. as the member of LD Holdings which is entitled to appoint the board of managers of LD Holdings and provides for Holdco Units and Class I common units of LD Holdings. Following the offering, the board of managers of LD Holdings will have the right to determine the timing and amount of any distributions (other than tax distributions as described in “—Holding Company Structure”) to be made to holders of the Holdco Units from LD Holdings, subject to the distribution preference with respect to the Class I common units. Profits and losses of LD Holdings will be allocated, and all distributions with respect to Holdco Units (which, other than tax distributions, LD Holdings will generally only be permitted to pay after all distributions to the Class I common units have been made) will be made, pro rata to the holders of the Holdco Units. See “Certain Relationships and Related Party Transactions— Limited Liability Company Agreement of LD Holdings.”
Formation of Intermediate LLC
Intermediate LLC was formed as a Delaware limited liability company on October 8, 2015 in order to facilitate certain HUD regulatory compliance matters for LDLLC. Prior to completion of the offering, (i) LDLLC will issue 999 Class A common units to LD Holdings in exchange for all of the LDLLC units then held by LD Holdings, representing 99.9% of the management and voting power of LDLLC and 100% of the economic interest of LDLLC and (ii) LDLLC will issue one Class B common unit to Intermediate LLC for $1.00 in cash, representing 0.1% of the management and voting power of LDLLC.
Offering Transactions
At the time of the offering, we intend to use a portion of the net proceeds to us from the offering to purchase a number of newly issued Holdco Units from LD Holdings and to use the remaining net proceeds to us from the offering to purchase 853,086 Premium Holdco Units and 2,400,000 Holdco Units, in each case, together with an equal number of shares of Class B common stock, from the Exchanging Members, including our Chief Executive Officer and certain
80
Table of Contents
of our other officers, and to redeem 3,067,227 shares of our Class A common stock from the Parthenon Stockholders. The number of such Holdco Units acquired from LD Holdings and the Exchanging Members will be equal to the number of shares of Class A common stock issued in this offering. See “Use of Proceeds.” Any Holdco Units purchased by us from the Exchanging Members will thereafter be owned by loanDepot, Inc. The corresponding equal number of shares of Class B common stock purchased from the Exchanging Members will be cancelled. Any shares of Class A common stock redeemed by us from the Parthenon Stockholders will thereafter be held by loanDepot, Inc. as treasury stock or cancelled. Following the offering, each of the Continuing LLC Members may from time to time (subject to the terms of the Holdings LLC Agreement) exchange an equal number of their Holdco Units and Class B common stock for shares of our Class A common stock on a one-for-one basis, subject to customary adjustments for stock splits, stock dividends and reclassifications. See “Certain Relationships and Related Party Transactions—Limited Liability Company Agreement of LD Holdings.” Any Holdco Units exchanged under the exchange provisions described above will thereafter be owned by loanDepot, Inc. Any Class B shares exchanged will be cancelled. Our purchase of Holdco Units from the Exchanging Members in connection with this offering and any exchanges of Holdco Units for shares of Class A common stock are expected to result, with respect to loanDepot, Inc., in increases in the tax basis of the assets of LD Holdings that otherwise would not have been available. These increases in tax basis may reduce the amount of tax that loanDepot, Inc. would otherwise be required to pay in the future. These increases in tax basis may also decrease gains (or increase losses) on future dispositions of certain assets to the extent tax basis is allocated to those assets.
We and LD Holdings will enter into a tax receivable agreement with the Parthenon Stockholders and certain of the Continuing LLC Members that will provide for the payment from time to time by loanDepot, Inc. to such parties or their permitted assignees of 85% of the amount of the benefits, if any, that loanDepot, Inc. realizes or under certain circumstances (such as following a change of control) is deemed to realize as a result of (i) the increases in tax basis referred to above and increases in tax basis as a result of any purchase by us of Class I common units of LD Holdings, (ii) any incremental tax basis adjustments attributable to payments made pursuant to the tax receivable agreement and (iii) any deemed interest deductions arising from payments made by us pursuant to the tax receivable agreement. See “Certain Relationships and Related Party Transactions—Tax Receivable Agreement.”
We refer to the foregoing transactions as the “Offering Transactions.”
As a result of the transactions described above, and assuming the sale of shares of Class A common stock in this offering at a price per share to the public of $17.00, which is the midpoint of the estimated price range set forth on the cover page of this prospectus, and after giving effect to the use of proceeds to us from the offering as described above:
| • | the investors in the offering will collectively own 30,000,000 shares of our Class A common stock (or 34,500,000 shares of Class A common stock if the underwriters exercise in full their option to purchase additional shares of Class A common stock) and the Parthenon Stockholders will collectively own 31,881,376 shares of Class A common stock; |
| • | loanDepot, Inc. will hold 61,881,376 Holdco Units (or 64,221,376 Holdco Units if the underwriters exercise in full their option to purchase additional shares of Class A common stock), representing 42.1% of the total economic interest of LD Holdings (or 43.4% of the total economic interest of LD Holdings if the underwriters exercise in full their option to purchase additional shares of Class A common stock); |
| • | the Continuing LLC Members will collectively hold 85,177,447 Holdco Units, representing 57.9% of the total economic interest of LD Holdings (or 83,737,447 Holdco Units, representing 56.6% if the underwriters exercise in full their option to purchase additional shares of Class A common stock), which can be exchanged together with an equal number of Class B common stock for newly issued Class A common stock pursuant to the Holdings LLC Agreement; |
| • | the investors in the offering will collectively have 20.4% of the voting power in loanDepot, Inc. (or 23.3% if the underwriters exercise in full their option to purchase additional shares of Class A common stock); |
81
Table of Contents
| • | the Parthenon Stockholders that will receive shares of Class A common stock in the Reorganization Transactions and the Continuing LLC Members that will hold Holdco Units and Class B common stock that may be exchanged for newly issued Class A common stock pursuant to the Holdings LLC Agreement, will collectively have 79.6% of the voting power in loanDepot, Inc. (or 76.7% if the underwriters exercise in full their option to purchase additional shares of Class A common stock); and |
| • | the holders of LDLLC’s Class I common units will hold Class I common units of LD Holdings and will only be entitled to the fixed payment rights set forth in the Holdings LLC Agreement and are not entitled to any distributions or residual interest in LD Holdings. See “Certain Relationships and Related Party Transactions—imortgage Settlement Agreement.” |
Our post-offering organizational structure will allow the Continuing LLC Members to retain their equity ownership in LD Holdings, an entity that is classified as a partnership for U.S. federal income tax purposes, in the form of Holdco Units. Investors in the offering and the Parthenon Stockholders will, by contrast, hold their equity ownership in loanDepot, Inc., a Delaware corporation that is a domestic corporation for U.S. federal income tax purposes, in the form of shares of Class A common stock.
The Continuing LLC Members will also hold shares of Class B common stock of loanDepot, Inc. The shares of Class B common stock have only voting and no economic rights. A share of Class B common stock cannot be transferred except in connection with a transfer of a Holdco Unit. Further, a Holdco Unit cannot be exchanged with loanDepot, Inc. for a share of our Class A common stock without the corresponding share of our Class B common stock being delivered together at the time of exchange for cancellation by us. Accordingly, as the Continuing LLC Members subsequently exchange Holdco Units for shares of Class A common stock of loanDepot, Inc. pursuant to the Holdings LLC Agreement, the voting power afforded to the Continuing LLC Members by their shares of Class B common stock is automatically and correspondingly reduced.
Holding Company Structure
loanDepot, Inc. will be a holding company, and its sole material asset will be an equity interest in LD Holdings, which will hold the equity interests in LDLLC and Intermediate LLC as described above. loanDepot, Inc. will indirectly control all of the business and affairs of LD Holdings and its subsidiaries, including LDLLC, through its ability to appoint the board of managers of LD Holdings, which will have the ability to appoint the board of managers of LDLLC.
loanDepot, Inc. will consolidate the financial results of LD Holdings and its subsidiaries, including LDLLC, and the ownership interest of the Continuing LLC Members and holders of Class I common units will be reflected as a non-controlling interest in loanDepot, Inc.’s consolidated financial statements.
Pursuant to the Holdings LLC Agreement, the board of managers of LD Holdings has the right to determine when distributions (other than tax distributions) will be made to the members of LD Holdings and the amount of any such distributions, and loanDepot, Inc. will have the right to appoint such board of managers under the Holdings LLC Agreement. If loanDepot, Inc. authorizes a distribution, such distribution will be made to the holders of Holdco Units, including loanDepot, Inc., pro rata based on their holdings of Holdco Units.
The holders of Holdco Units, including loanDepot, Inc., will generally have to include for purposes of calculating their U.S. federal, state and local income taxes their share of any taxable income of LD Holdings. Taxable income of LD Holdings generally will be allocated to the holders of Holdco Units (including loanDepot, Inc.) pro rata in accordance with their respective share of the net profits and net losses of LD Holdings. LD Holdings will be obligated, subject to available cash and applicable law and contractual restrictions (including pursuant to our debt instruments), to make cash distributions, which we refer to as “tax distributions,” based on certain assumptions, to its members (including loanDepot, Inc.) pro rata based on their Holdco Units. Generally, these tax distributions to holders of Holdco Units will be an amount equal to our estimate of the taxable income of LD Holdings, net of taxable losses, allocable per Holdco Unit multiplied by an assumed tax rate equal to the
82
Table of Contents
highest effective marginal combined U.S. federal, state and local income tax rate prescribed for an individual resident in California (taking into account the non-deductibility of certain expenses). Because tax distributions will be determined based on the holder of Holdco Units who is allocated the largest amount of taxable income on a per unit basis, LD Holdings may be required to make tax distributions that, in the aggregate, may exceed the amount of taxes that LD Holdings would have paid if it were taxed on its net income at the assumed rate. See “Certain Relationships and Related Party Transactions— Limited Liability Company Agreement of LD Holdings.”
83
Table of Contents
We estimate that the net proceeds to us from the offering will be approximately $412.7 million (or $449.3 million if the underwriters exercise in full their option to purchase additional shares of Class A common stock) based upon an assumed initial public offering price of $17.00 per share, which is the midpoint of the estimated price range set forth on the cover page of this prospectus, after deducting underwriting discounts and commissions and estimated offering expenses. We will not receive any proceeds from the sale of shares of our Class A common stock by the selling stockholders.
We intend to use net proceeds of approximately (1) $52.1 million to redeem 3,067,227 shares of our Class A common stock from the Parthenon Stockholders, (2) $38.4 million to purchase 2.4 million Holdco Units, together with an equal number of shares of our Class B common stock, from the Exchanging Members, including our Chief Executive Officer and certain of our other officers (at a purchase price per unit and share of Class B common stock, based on the midpoint of the estimated price range set forth on the cover page of this prospectus, net of underwriting discounts and commissions), and (3) up to $14.5 million to purchase Premium Holdco Units from certain holders, including our Chief Executive Officer and certain of our other officers. We will contribute the remaining net proceeds to LD Holdings and LDLLC, who intend to use net proceeds of approximately (1) $63.5 million representing the purchase price related to a prior acquisition to holders of LDLLC’s Class I common units, (2) $32.2 million for contingent consideration and to repay in full our Seller Notes related to our prior acquisition of Mortgage Master, and (3) $212.0 million (based on the midpoint of the estimated price range set forth on the cover page of this prospectus) for general corporate purposes.
See “Certain Relationships and Related Party Transactions” for the amounts of net proceeds that will be used to purchase Premium Holdco Units and other Holdco Units from our officers and to redeem shares of Class A common stock from the Parthenon Stockholders, “Principal and Selling Stockholders” for information concerning the selling stockholders and Exchanging Members in this offering, and “Management’s Discussion and Analysis of Financial Condition and Results of Operations—Liquidity and Capital Resources—Debt Obligations” for the interest rates and maturities relating to the Seller Notes.
Each $1.00 increase or decrease in the assumed initial public offering price of $17.00 per share, which is the midpoint of the estimated price range set forth on the cover page of this prospectus, would (1) increase or decrease the net proceeds to us from this offering by approximately $24.5 million, and (2) decrease or increase by 170,401 or 191,702, respectively, the number of shares of our Class A common stock outstanding as a result of being redeemed from the Parthenon Stockholders, in each case, assuming that the number of shares offered by us, as set forth on the cover page of this prospectus, remains the same.
84
Table of Contents
We currently intend to retain all available funds and future earnings, if any, to fund the development and expansion of our business and we do not anticipate paying any cash dividends in the foreseeable future. Any future determination to pay dividends will be made at the discretion of our board of directors, subject to applicable laws, and will depend on a number of factors, including our financial condition, results of operations, capital requirements, contractual, legal, tax and regulatory restrictions, general business conditions and other factors that our board of directors may deem relevant. We are a holding company and will have no material assets other than our ownership of Holdco Units in LD Holdings. Our ability to pay cash dividends will depend on our receipt of distributions from our current or future operating subsidiaries, including LDLLC, and such distributions may be restricted as a result of regulatory restrictions or contractual agreements, including agreements governing their indebtedness. See “Risk Factors—Risks Related to Our Organizational Structure—We are a holding company with no operations of our own and, as such, we depend on our subsidiaries for cash to fund all of our operations and expenses, including future dividend payments, if any.” In addition, our ability to pay cash dividends may be restricted by the terms of our debt financing arrangements, and any future debt financing arrangement will likely contain terms restricting or limiting the amount of dividends that may be declared or paid on our common stock.
Following this offering, we will receive a portion of any distributions made by LDLLC. Under the 8th LLC Agreement, loanDepot, Inc., through its ability to appoint the board of managers of LD Holdings, which will have the ability to appoint the board of managers of LDLLC, has the right to determine when distributions (other than tax distributions) will be made by LDLLC to LD Holdings and the amount of any such distributions. Under the Holdings LLC Agreement, the board of managers of LD Holdings has the right to determine when distributions (other than tax distributions) will be made to unitholders of LD Holdings and the amount of any such distributions. Any such distributions will be distributed to all holders of Holdco Units, including us, pro rata based on their holdings of Holdco Units. The cash received from such distributions will first be used by us to satisfy any tax liability and then to make any payments required under the tax receivable agreement to the Parthenon Stockholders and certain of the Continuing LLC Members or their permitted assignees. Other than tax-related distributions, LDLLC has not made any distributions to its existing owners during 2013, 2014 or to date during 2015. Tax-related distributions aggregated $13.0 million in 2013 and $1.1 million in 2014.
85
Table of Contents
The following table sets forth our cash and capitalization as of June 30, 2015 on:
| • | a historical basis for LDLLC; and |
| • | a pro forma basis for loanDepot, Inc., giving effect to the transactions described under “Unaudited Pro Forma Consolidated Financial Information,” including the application of the proceeds to us from this offering as described in “Use of Proceeds” based upon an assumed initial public offering price of $17.00 per share, which is the midpoint of the estimated price range set forth on the cover page of this prospectus, after deducting estimated underwriting discounts and commissions and estimated offering expenses and other related transaction costs payable by us. |
You should read this table together with the information contained in this prospectus, including “Use of Proceeds,” “Unaudited Pro Forma Consolidated Financial Information,” “Management’s Discussion and Analysis of Financial Condition and Results of Operations” and the historical financial statements and related notes included elsewhere in this prospectus.
| As of June 30, 2015 | ||||||||
| Actual LDLLC |
Pro Forma loanDepot, Inc.(1) |
|||||||
| (unaudited) | ||||||||
| (Dollars in millions) | ||||||||
| Cash and cash equivalents |
$ | 53.4 | $ | 256.0 | ||||
|
|
|
|
|
|||||
| Debt(2): |
||||||||
| Warehouse Lines |
$ | 1,410.8 | $ | 1,410.8 | ||||
| Secured Credit Facilities |
48.8 | 48.8 | ||||||
| Unsecured Term Loan |
80.0 | 80.0 | ||||||
| Seller Notes |
13.4 | — | ||||||
|
|
|
|
|
|||||
| Total debt |
$ | 1,553.0 | $ | 1,539.6 | ||||
|
|
|
|
|
|||||
| Redeemable units |
$ | 91.7 | $ | 26.5 | ||||
|
|
|
|
|
|||||
| Capital (equity): |
||||||||
| Unitholders’ equity |
$ | — | $ | — | ||||
| Class A common stock, par value $0.001 per share, 750,000,000 shares authorized on a pro forma basis; 61,881,376 shares issued and outstanding on a pro forma basis |
— | 0.1 | ||||||
| Class B common stock, par value $0.001 per share, 250,000,000 shares authorized on a pro forma basis; 85,177,448 shares issued and outstanding on a pro forma basis |
— | 0.1 | ||||||
| Preferred stock, par value $0.001 per share, 100,000,000 shares authorized on a pro forma basis; no shares issued and outstanding on a pro forma basis |
— | — | ||||||
| Additional paid-in capital |
11.3 | 197.8 | ||||||
| Retained earnings |
187.2 | — | ||||||
|
|
|
|
|
|||||
| Total unitholders’ equity/loanDepot, Inc. stockholders’ equity |
198.5 | 198.0 | ||||||
| Non-controlling interest |
— | 272.5 | ||||||
|
|
|
|
|
|||||
| Total capital (equity) |
198.5 | 470.5 | ||||||
|
|
|
|
|
|||||
| Total capitalization |
$ | 1,843.2 | $ | 2,036.6 | ||||
|
|
|
|
|
|||||
| (1) | Each $1.00 increase or decrease in the assumed initial public offering price of $17.00 per share, which is the midpoint of the estimated price range set forth on the cover page of this prospectus, would increase or decrease the additional paid-in capital and total unitholders’ equity/loanDepot, Inc. stockholders’ equity by approximately $9.3 million, assuming that the number of shares offered by us, as set forth on the cover page of this prospectus, remains the same. |
86
Table of Contents
| (2) | Does not include approximately (i) $14.4 million in obligations under capital leases as of June 30, 2015, as described under “Management’s Discussion and Analysis of Financial Condition and Results of Operations—Liquidity and Capital Resources—Capital Lease Transactions,” (ii) $26.5 million payable to the holders of Class I common units following this offering (listed as redeemable units in the table above), as described further under “Certain Relationships and Related Party Transactions—imortgage Settlement Agreement,” and (iii) $28.1 million in contingent consideration as of June 30, 2015 associated with the acquisition of Mortgage Master in January 2015, which remaining outstanding amount will be paid in full with proceeds from this offering. |
87
Table of Contents
If you invest in the initial public offering of our Class A common stock, your interest will be diluted to the extent of the excess of the initial public offering price per share of our Class A common stock over the pro forma net tangible book value per share of our Class A common stock after this offering. Dilution results from the fact that the per share offering price of the Class A common stock is substantially in excess of the net tangible book value per share attributable to the existing equity holders.
Our pro forma net tangible book value at June 30, 2015 was approximately $157.6 million. Pro forma net tangible book value represents the amount of total tangible assets less total liabilities and redeemable units of LDLLC, after giving effect to the Reorganization Transactions, and pro forma net tangible book value per share represents pro forma net tangible book value divided by the number of shares of Class A common stock outstanding, after giving effect to the Reorganization Transactions and assuming that all of the Continuing LLC Members exchanged their Holdco Units and Class B common stock for newly issued shares of our Class A common stock on a one-for-one basis.
After giving effect to this offering, at an assumed initial public offering price of $17.00 per share, which is the midpoint of the estimated price range set forth on the cover page of this prospectus, and the application of estimated net proceeds, after deducting underwriting discounts and commissions and estimated offering expenses payable by us, our pro forma net tangible book value at June 30, 2015, excluding pre-reorganization noncontrolling interest that is not convertible into shares of Class A common stock, would have been $429.6 million, or $2.92 per share of Class A common stock, assuming that all of the Continuing LLC Members exchanged their Holdco Units and Class B common stock for newly issued shares of our Class A common stock on a one-for-one basis.
The following table illustrates the immediate dilution of $14.08 per share to new stockholders purchasing Class A common stock in this offering, assuming the underwriters do not exercise their option to purchase additional shares.
| Assumed initial public offering price per share |
$ | 17.00 | ||||||
| Pro forma net tangible book value per share at June 30, 2015 |
$ | 1.24 | ||||||
| Increase per share attributable to this offering |
1.68 | |||||||
|
|
|
|||||||
| Pro forma net tangible book value per share, as adjusted to give effect to this offering |
2.92 | |||||||
|
|
|
|||||||
| Dilution in pro forma net tangible book value per share to new investors |
$ | 14.08 | ||||||
|
|
|
The following table summarizes, on the same pro forma basis at June 30, 2015, the total number of shares of Class A common stock purchased from us, the total cash consideration paid to us and the average price per share paid by the Parthenon Stockholders, the Continuing LLC Members and by new investors purchasing shares in the offering, assuming that all of the Continuing LLC Members exchanged their Holdco Units and Class B common stock for shares of our Class A common stock on a one-for-one basis.
| Shares of Class A Common Stock Purchased/ Granted |
Total Consideration | Average Price Per Share |
||||||||||||||||||
| Number | Percentage | Amount | Percentage | |||||||||||||||||
| (Dollars in thousands, except per share amounts) | ||||||||||||||||||||
| Investors prior to this offering |
126,979,136 | 86.4 | % | $ | 64,200,000 | 15.8 | % | $ | 0.51 | |||||||||||
| New investors in this offering |
20,079,688 | 13.6 | % | 341,354,696 | 84.2 | % | 17.00 | |||||||||||||
|
|
|
|
|
|
|
|
|
|
|
|||||||||||
| Total |
147,058,824 | 100 | % | $ | 405,554,696 | 100 | % | $ | 2.76 | |||||||||||
|
|
|
|
|
|
|
|
|
|
|
|||||||||||
88
Table of Contents
If the underwriters’ option to purchase additional shares is exercised in full, the increase in pro forma net tangible book value per share at June 30, 2015 attributable to this offering would have been approximately $1.66 per share and the dilution in pro forma net tangible book value per share to new investors would be $14.10 per share. Furthermore, the percentage of our shares held by existing equity owners would decrease to approximately 85.8% and the percentage of our shares held by new investors would increase to approximately 14.2%.
A $1.00 increase or decrease in the assumed initial public offering price of $17.00 per share, which is the midpoint of the estimated price range set forth on the cover page of this prospectus, would increase or decrease total consideration paid by new investors in this offering and total consideration paid by all investors by approximately $20.1 million, assuming that the number of shares offered by us, as set forth on the cover page of this prospectus, remains the same.
89
Table of Contents
The following table shows selected historical financial data of our accounting predecessor, LDLLC and its predecessors, for the periods and as of the dates presented.
The selected consolidated financial data as of December 31, 2014 and 2013 and for the years then ended were derived from the audited consolidated financial statements of our predecessor included elsewhere in this prospectus. The selected consolidated financial data as of and for the six months ended June 30, 2015 were derived from the audited consolidated financial statements of our predecessor included elsewhere in this prospectus. The selected consolidated financial data as of and for the six months ended June 30, 2014 were derived from the unaudited consolidated financial statements of our predecessor included elsewhere in this prospectus. The unaudited consolidated financial statements have been prepared on a consistent basis with the audited consolidated financial statements of LDLLC. In the opinion of management, such unaudited consolidated financial data reflects all adjustments (consisting of normal and recurring accruals) considered necessary to present our financial position for the periods presented. The results of operations for the interim periods are not necessarily indicative of the results that may be expected for the full year. In addition, our historical results are not necessarily indicative of the results expected for any future periods.
The selected historical consolidated financial data of loanDepot, Inc. have not been presented because loanDepot, Inc. is a newly incorporated entity, has had no business transactions or activities to date and had no assets or liabilities during the periods presented in this section.
You should read the following financial information together with the information under “Capitalization” and “Management’s Discussion and Analysis of Financial Condition and Results of Operations” and our consolidated financial statements and the related notes included elsewhere in this prospectus.
| Six Months Ended June 30, |
Year Ended December 31, |
|||||||||||||||
| 2015 | 2014 | 2014 | 2013 | |||||||||||||
| (Unaudited) | ||||||||||||||||
| (Dollars in thousands, except share and per share amounts) |
||||||||||||||||
| Statement of Operation Data: |
||||||||||||||||
| Revenues: |
||||||||||||||||
| Interest income |
$ | 30,815 | $ | 14,462 | $ | 34,416 | $ | 18,902 | ||||||||
| Interest expense |
(20,651 | ) | (8,132 | ) | (19,966 | ) | (12,692 | ) | ||||||||
|
|
|
|
|
|
|
|
|
|||||||||
| Net interest income |
10,164 | 6,330 | 14,450 | 6,209 | ||||||||||||
| Gain on origination and sale of loans, net |
425,438 | 193,849 | 435,462 | 246,478 | ||||||||||||
| Origination income, net |
41,649 | 34,635 | 75,064 | 51,995 | ||||||||||||
| Servicing income |
20,195 | 12,652 | 28,517 | 12,914 | ||||||||||||
| Servicing (losses) gains |
(19,284 | ) | (10,368 | ) | (26,522 | ) | 10,667 | |||||||||
| Other income |
11,471 | 7,122 | 17,504 | 10,232 | ||||||||||||
|
|
|
|
|
|
|
|
|
|||||||||
| Total net revenues |
$ | 489,633 | $ | 244,220 | $ | 544,475 | $ | 338,496 | ||||||||
|
|
|
|
|
|
|
|
|
|||||||||
90
Table of Contents
| Six Months Ended June 30, |
Year Ended December 31, |
|||||||||||||||
| 2015 | 2014 | 2014 | 2013 | |||||||||||||
| (Unaudited) | ||||||||||||||||
| (Dollars in thousands, except share and per share amounts) |
||||||||||||||||
| Expenses: |
||||||||||||||||
| Personnel expense |
$ | 273,182 | $ | 130,210 | $ | 293,552 | $ | 153,179 | ||||||||
| Marketing and advertising expense |
54,369 | 43,024 | 93,906 | 51,265 | ||||||||||||
| Direct origination expense |
28,594 | 20,503 | 43,893 | 22,907 | ||||||||||||
| General and administrative expense |
33,618 | 18,127 | 44,070 | 17,769 | ||||||||||||
| Occupancy expense |
11,118 | 7,065 | 15,083 | 5,716 | ||||||||||||
| Depreciation and amortization |
8,593 | 5,207 | 11,692 | 5,778 | ||||||||||||
| Subservicing expense |
5,651 | 4,919 | 11,157 | 6,884 | ||||||||||||
| Other interest expense |
5,124 | 4,400 | 8,930 | 1,967 | ||||||||||||
|
|
|
|
|
|
|
|
|
|||||||||
| Total expenses |
420,249 | 233,454 | 522,282 | 265,465 | ||||||||||||
|
|
|
|
|
|
|
|
|
|||||||||
| Income before income taxes |
69,384 | 10,766 | 22,193 | 73,031 | ||||||||||||
| Provision for income taxes |
216 | 598 | 509 | 773 | ||||||||||||
|
|
|
|
|
|
|
|
|
|||||||||
| Net income |
$ | 69,168 | $ | 10,168 | $ | 21,684 | $ | 72,258 | ||||||||
|
|
|
|
|
|
|
|
|
|||||||||
| As of June 30, | As of December 31, | |||||||||||||||
| 2015 | 2014 | 2014 | 2013 | |||||||||||||
| (unaudited) | ||||||||||||||||
| (Dollars in thousands) | ||||||||||||||||
| Balance Sheet Data: |
||||||||||||||||
| Cash and cash equivalents |
$ | 53,350 | $ | 24,225 | $ | 28,637 | $ | 40,885 | ||||||||
| Loans held for sale, at fair value |
1,504,603 | 883,585 | 1,004,195 | 741,509 | ||||||||||||
| Servicing rights, at fair value |
194,093 | 108,361 | 138,837 | 93,823 | ||||||||||||
| Total assets |
2,076,376 | 1,186,927 | 1,370,356 | 1,023,337 | ||||||||||||
| Total liabilities |
1,786,222 | 1,011,694 | 1,181,162 | 860,028 | ||||||||||||
| Total liabilities, redeemable units and unitholders’ equity |
2,076,376 | 1,186,927 | 1,370,356 | 1,023,337 | ||||||||||||
| Cash Flow Data: |
||||||||||||||||
| Net cash used in operating activities |
$ | (559,772 | ) | $ | (162,923 | ) | $ | (314,555 | ) | $ | (217,083 | ) | ||||
| Net cash provided by (used in) investing activities |
69,729 | 20,797 | 44,215 | (34,026 | ) | |||||||||||
| Net cash provided by financing activities |
514,756 | 125,466 | 258,091 | 264,349 | ||||||||||||
91
Table of Contents
UNAUDITED PRO FORMA CONSOLIDATED FINANCIAL INFORMATION
The unaudited pro forma consolidated statements of operations for the year ended December 31, 2014 and for the six months ended June 30, 2015 present our consolidated results of operations giving pro forma effect to the following transactions, in each case as if such transactions occurred on January 1, 2014:
| • | the Mortgage Master acquisition, as described under “Management’s Discussion and Analysis of Financial Condition and Results of Operations—Key Factors Influencing Our Results of Operations—Acquisitions and Industry Partnerships—Acquisition of Mortgage Master”; |
| • | the Reorganization Transactions and Offering Transactions, as described under “Organizational Structure” (but assuming no exercise of the underwriters’ option to purchase additional shares); |
| • | the use of the estimated net proceeds to us from this offering, as described under “Use of Proceeds”; and |
| • | a provision for corporate income taxes on the income attributable to loanDepot, Inc. at an effective rate of 41%, inclusive of all U.S. federal, state and local income taxes. |
The unaudited pro forma consolidated balance sheet is based on our historical audited balance sheet as of June 30, 2015 and includes pro forma adjustments to give effect to the Reorganization Transactions and Offering Transactions, as described under “Organizational Structure,” the use of the estimated net proceeds to us from this offering, as described under “Use of Proceeds,” and the effects of the Tax Receivable Agreement, as described under “Certain Relationships and Related Party Transactions—Tax Receivable Agreement,” as if they had occurred on June 30, 2015. The unaudited pro forma consolidated statements of operations are based on: (i) our audited consolidated financial statements as of and for the year ended December 31, 2014; (ii) our audited condensed consolidated financial statements as of and for the six months ended June 30, 2015; and (iii) the audited consolidated financial statements of Mortgage Master as of and for the year ended December 31, 2014.
The unaudited pro forma consolidated financial statements have been prepared on the basis that we will be taxed as a corporation under the Code and accordingly will become a tax-paying entity subject to U.S. federal and state income taxes, and should be read in conjunction with “Organizational Structure,” “Management’s Discussion and Analysis of Financial Condition and Results of Operations” and the consolidated financial statements and related notes included elsewhere in this prospectus.
The pro forma data presented reflect events directly attributable to the described transactions and certain assumptions that we believe are reasonable. The pro forma data are not necessarily indicative of financial results that would have been attained had the described transactions occurred on the dates indicated below or which could be achieved in the future because they necessarily exclude various operating expenses, such as incremental general and administrative expense associated with being a public company. The adjustments are based on currently available information and certain estimates and assumptions. Therefore, the actual adjustments may differ from the pro forma adjustments. However, management believes that the assumptions provide a reasonable basis for presenting the significant effects of the transactions as contemplated and that the pro forma adjustments give appropriate effect to those assumptions and are properly applied in the unaudited pro forma consolidated financial statements.
The unaudited pro forma consolidated financial statements and related notes are presented for illustrative purposes only. If this offering and other transactions contemplated herein had occurred in the past, our operating results might have been materially different from those presented in the unaudited pro forma financial statements. The unaudited pro forma consolidated financial statements should not be relied upon as an indication of operating results that the Company would have achieved if this offering and other transactions contemplated herein had taken place on the specified date. In addition, future results may vary significantly from the results reflected in the unaudited pro forma consolidated statements of operations and should not be relied on as an indication of the future results we will have after the completion of this offering and the other transactions contemplated by these unaudited pro forma consolidated financial statements.
92
Table of Contents
LOANDEPOT, INC.
PRO FORMA CONSOLIDATED BALANCE SHEET
JUNE 30, 2015
(unaudited)
| LDLLC Historical |
Pro Forma Adjustments(1) |
loanDepot, Inc. Pro Forma |
||||||||||
| (Dollars in millions) | ||||||||||||
| ASSETS |
||||||||||||
| Cash and cash equivalents(2) |
$ | 53.4 | $ | 202.6 | $ | 256.0 | ||||||
| Restricted cash |
3.2 | — | 3.2 | |||||||||
| Accounts receivable, net |
39.4 | — | 39.4 | |||||||||
| Loans held for sale, at fair value |
1,504.6 | — | 1,504.6 | |||||||||
| Derivative assets, at fair value |
87.4 | — | 87.4 | |||||||||
| Servicing rights, at fair value |
194.1 | — | 194.1 | |||||||||
| Property and equipment, net |
50.1 | — | 50.1 | |||||||||
| Prepaid expense and other assets |
15.0 | — | 15.0 | |||||||||
| Loans eligible for repurchase |
71.6 | — | 71.6 | |||||||||
| Investments in joint ventures |
16.7 | — | 16.7 | |||||||||
| Goodwill |
35.4 | — | 35.4 | |||||||||
| Intangible assets, net |
5.5 | — | 5.5 | |||||||||
| Deferred tax assets(3) |
— | 22.5 | 22.5 | |||||||||
|
|
|
|
|
|
|
|||||||
| Total assets |
$ | 2,076.4 | $ | 225.1 | $ | 2,301.5 | ||||||
|
|
|
|
|
|
|
|||||||
| LIABILITIES, REDEEMABLE UNITS AND UNITHOLDERS’ EQUITY |
||||||||||||
| Warehouse lines of credit |
$ | 1,410.8 | $ | — | $ | 1,410.8 | ||||||
| Accrued expenses and other liabilities(4) |
130.5 | (8.2 | ) | 122.3 | ||||||||
| Contingent consideration(2) |
28.1 | (28.1 | ) | — | ||||||||
| Derivative liabilities, at fair value |
2.0 | — | 2.0 | |||||||||
| Member distributions payable |
— | — | — | |||||||||
| Liability for loans eligible for repurchase |
71.6 | — | 71.6 | |||||||||
| Capital lease obligations |
14.4 | — | 14.4 | |||||||||
| Debt obligations |
128.8 | — | 128.8 | |||||||||
| Due to existing unitholders(3) |
— | 54.6 | 54.6 | |||||||||
| Deferred tax liabilities |
— | — | — | |||||||||
|
|
|
|
|
|
|
|||||||
| Total liabilities |
$ | 1,786.2 | $ | 18.3 | $ | 1,804.5 | ||||||
|
|
|
|
|
|
|
|||||||
| Redeemable units |
||||||||||||
| Class I units(5) |
$ | 27.3 | $ | (0.8 | ) | $ | 26.5 | |||||
| Class A units |
26.9 | (26.9 | ) | — | ||||||||
| Class B units |
5.0 | (5.0 | ) | — | ||||||||
| Class P units |
12.5 | (12.5 | ) | — | ||||||||
| Class P-2 units |
20.0 | (20.0 | ) | — | ||||||||
| Class Z-I units |
— | — | — | |||||||||
|
|
|
|
|
|
|
|||||||
| Total redeemable units |
91.7 | (65.2 | ) | 26.5 | ||||||||
| Unitholders’ equity |
||||||||||||
| Class Z-2 units |
— | — | — | |||||||||
| Class Z-3 units |
— | — | — | |||||||||
| Class Z-4 units |
— | — | — | |||||||||
| Class Y units |
— | — | — | |||||||||
| Class W units |
— | — | — | |||||||||
| Class X units |
— | — | — | |||||||||
| Preferred stock, par value $0.001 per share, 100,000,000 shares authorized on a pro forma basis; no shares issued and outstanding on a pro forma basis |
— | — | — | |||||||||
| Class A common stock, par value $0.001 per share, 750,000,000 shares authorized on a pro forma basis; 61,881,376 shares issued and outstanding on a pro forma basis |
— | 0.1 | 0.1 | |||||||||
| Class B common stock, par value $0.001 per share, 250,000,000 shares authorized on a pro forma basis; 85,177,448 shares issued and outstanding on a pro forma basis |
— | 0.1 | 0.1 | |||||||||
| Additional paid-in capital(6) |
11.3 | 186.5 | 197.8 | |||||||||
| Retained earnings |
187.2 | (187.2 | ) | — | ||||||||
|
|
|
|
|
|
|
|||||||
| Total unitholders’ equity/loanDepot, Inc. stockholders’ equity(6) |
198.5 | (0.5 | ) | 198.0 | ||||||||
|
|
|
|
|
|
|
|||||||
| Non-controlling interest(7) |
— | 272.5 | 272.5 | |||||||||
|
|
|
|
|
|
|
|||||||
| Total equity |
198.5 | 272.0 | 470.5 | |||||||||
|
|
|
|
|
|
|
|||||||
| TOTAL LIABILITIES, REDEEMABLE UNITS AND UNITHOLDERS’ EQUITY |
$ | 2,076.4 | $ | 225.1 | $ | 2,301.5 | ||||||
|
|
|
|
|
|
|
|||||||
See Notes to Pro Forma Consolidated Balance Sheet
93
Table of Contents
Notes to Pro Forma Consolidated Balance Sheet
| (1) | loanDepot, Inc. will have the ability to appoint the board of managers of LD Holdings. loanDepot, Inc. will initially have 42.1% of the economic interest in LD Holdings, but will have 100% of the voting power and control the management of LD Holdings. As a result, loanDepot, Inc. will consolidate the financial results of LD Holdings and will record non-controlling interest on the loanDepot, Inc. consolidated balance sheet. Immediately following the Reorganization Transactions and Offering Transactions, the non-controlling interest, based on the assumptions to the pro forma financial information, will be $272.5 million. Pro forma non-controlling interest, including non-controlling interest at LD Holdings, represents 57.9% of the pro forma equity of LD Holdings of $470.5 million. |
| (2) | Reflects the net effect on cash and cash equivalents of the receipt of offering proceeds to us of $448.8 million from the sale of 26,400,000 shares of Class A common stock at an assumed price of $17.00 per share described in “Use of Proceeds” after application thereof to the following items: |
| (a) | payment of $63.5 million to the holders of Class I common units of LD Holdings, which represents the purchase price for a prior acquisition, as described under “Certain Relationships and Related Party Transactions—imortgage Settlement Agreement”; |
| (b) | payment of approximately $13.4 million aggregate principal amount outstanding of Mortgage Master seller notes; |
| (c) | payment of $28.1 million in other contingent consideration pursuant to the Mortgage Master acquisition; |
| (d) | payment of $66.7 million to redeem HoldCo Units from certain holders, as described under “Organizational Structure—Offering Transactions”; |
| (e) | payment of $38.4 million to purchase 2.4 million Holdco Units, together with an equal number of shares of Class B common stock, held by Exchanging Members including certain of our officers as described under “Organizational Structure—Offering Transactions” at an assumed price of $17.00 minus the underwriting discounts and commissions; and |
| (f) | payment of approximately $36.1 million of underwriting discounts and commissions and estimated offering expenses. |
| (3) | Reflects adjustments to give effect to the Tax Receivable Agreement as a result of the Reorganization Transactions based on the following assumptions: |
| (a) | we will record an increase in deferred tax assets for estimated income tax effects of the increase in the tax basis of the purchased interests, based on an effective income tax rate of 41.0% (which includes a provision for U.S. federal, state and local income taxes); |
| (b) | we will record 85% of the estimated realizable tax benefit as an increase to the liability due to existing unitholders under the tax receivable agreement and the remaining 15% of the estimated realizable tax benefit as an increase to total stockholders’ equity which assumes the following: |
(1) that the initial net step-up is equal to the cash paid to the sellers, and
(2) that the subsequent payments under the Tax Receivable Agreement made to the Parthenon Stockholders would not be deductible and would represent approximately 31% of the payment amounts;
| (c) | we will record an increase in deferred tax assets for payments under the Tax Receivable Agreement, which will give rise to additional tax benefits and additional potential payments under the Tax Receivable Agreement; and |
| (d) | assumes that there are no material changes in the relevant tax law and that we earn sufficient taxable income in each year to realize the full tax benefit of the amortization of our assets. |
| (4) | We will record a decrease in other liabilities from the payment of $13.4 million aggregate principal amount outstanding of Mortgage Master seller notes and an increase in other liabilities to reflect the call option liability associated with the Reorganization Transactions of $5.2 million. |
| (5) | Reflects the $62.7 million increase in redeemable value of the Class I units to $90.0 million due to the imortgage Settlement Agreement, as described under “Certain Relationships and Related Party Transactions—imortgage Settlement Agreement,” and the subsequent payment of $63.5 million pursuant to the imortgage Settlement Agreement as a result of this offering. |
| (6) | Represents an adjustment to stockholders’ equity reflecting the following: |
| (a) | par value for Class A common stock and Class B common stock to be outstanding following the offering; |
| (b) | receipt of offering proceeds of $448.8 million as a result of the offering; |
| (c) | payment of $38.4 million to purchase Holdco Units, together with an equal number of shares of Class B common stock, held by Exchanging Members including certain of our officers as described under “Organizational Structure—Offering Transactions”; |
| (d) | payment of approximately $36.1 million of underwriting discounts and commissions and estimated offering expenses; |
| (e) | a decrease of $37.3 million resulting from the Tax Receivable Agreement offset by the deferred tax asset as a result of the Reorganization Transactions, including the call option liability; |
| (f) | an increase of $64.4 million of additional paid-in capital as a result of the Reorganization Transactions relating to the conversion of redeemable units into common equity; |
| (g) | a decrease due to the reclassification of $272.5 million of LDLLC members’ equity upon consolidation; |
| (h) | a decrease due to the reclassification of $62.7 million of equity to redeemable units for the increased obligation to holders of Class I common units, which represents the purchase price for a prior acquisition, as described under “Certain Relationships and Related Party Transactions—imortgage Settlement Agreement”; and |
| (i) | payment of $66.7 million to purchase newly issued HoldCo Units from LD Holdings, as described under “Organizational Structure—Offering Transactions.” |
| (7) | The increase in non-controlling interest reflects an increase from the reclassification of members’ equity of $272.5 million to non-controlling interest upon consolidation. |
94
Table of Contents
LOANDEPOT, INC.
PRO FORMA CONSOLIDATED STATEMENT OF OPERATIONS
FOR THE SIX MONTHS ENDED JUNE 30, 2015
(unaudited)
| LDLLC Historical |
Pro Forma Adjustments(1) |
loanDepot, Inc. Pro Forma |
||||||||||
| (Dollars in millions, except share and per share amounts) |
||||||||||||
| Revenues: |
| |||||||||||
| Interest income |
$ | 30.8 | $ | — | $ | 30.8 | ||||||
| Interest expense(2) |
(20.6 | ) | 0.8 | (19.8 | ) | |||||||
|
|
|
|
|
|
|
|||||||
| Net interest income |
10.2 | 0.8 | 11.0 | |||||||||
| Gain on origination and sale of loans, net |
425.4 | — | 425.4 | |||||||||
| Origination income, net |
41.6 | — | 41.6 | |||||||||
| Servicing income |
20.2 | — | 20.2 | |||||||||
| Servicing (losses) gains |
(19.3 | ) | — | (19.3 | ) | |||||||
| Other income |
11.5 | — | 11.5 | |||||||||
|
|
|
|
|
|
|
|||||||
| Total net revenues |
$ | 489.6 | $ | 0.8 | $ | 490.4 | ||||||
|
|
|
|
|
|
|
|||||||
| Expenses: |
||||||||||||
| Personnel expense |
$ | 273.2 | $ | — | $ | 273.2 | ||||||
| Marketing and advertising expense |
54.4 | — | 54.4 | |||||||||
| Direct origination expense |
28.6 | — | 28.6 | |||||||||
| General and administrative expense |
33.6 | — | 33.6 | |||||||||
| Occupancy expense |
11.1 | — | 11.1 | |||||||||
| Depreciation and amortization |
8.6 | — | 8.6 | |||||||||
| Sub-servicing expenses |
5.7 | — | 5.7 | |||||||||
| Other interest expense |
5.0 | — | 5.0 | |||||||||
|
|
|
|
|
|
|
|||||||
| Total expenses |
$ | 420.2 | $ | — | $ | 420.2 | ||||||
|
|
|
|
|
|
|
|||||||
| Income before income taxes |
$ | 69.4 | $ | 0.8 | $ | 70.2 | ||||||
| Provision for income taxes(3) |
0.2 | 11.9 | 12.1 | |||||||||
|
|
|
|
|
|
|
|||||||
| Net income |
$ | 69.2 | $ | (11.1 | ) | $ | 58.1 | |||||
| Less: Net income attributable to non-controlling interest(4) |
— | 40.7 | 40.7 | |||||||||
|
|
|
|
|
|
|
|||||||
| Net income attributable to stockholders |
$ | 69.2 | $ | (51.8 | ) | $ | 17.4 | |||||
|
|
|
|
|
|
|
|||||||
| Net income per common share: |
||||||||||||
| Basic |
$ | 0.28 | ||||||||||
| Diluted(5) |
0.28 | |||||||||||
| Weighted average common shares outstanding: |
||||||||||||
| Basic |
61,881,376 | |||||||||||
| Diluted(5) |
147,058,824 | |||||||||||
See Notes to Pro Forma Consolidated Statement of Operations
95
Table of Contents
LOANDEPOT, INC.
PRO FORMA CONSOLIDATED STATEMENT OF OPERATIONS
FOR THE YEAR ENDED DECEMBER 31, 2014
(unaudited)
| LDLLC Historical |
Mortgage Master Acquisition (6) |
LDLLC Pro Forma |
Pro Forma Adjustments (1) |
loanDepot, Inc. Pro Forma |
||||||||||||||||
| (Dollars in millions, except share and per share amounts) | ||||||||||||||||||||
| Revenues: |
||||||||||||||||||||
| Interest income |
$ | 34.4 | $ | 8.4 | $ | 42.8 | $ | — | $ | 42.8 | ||||||||||
| Interest expense(2) |
(19.9 | ) | (4.7 | ) | (24.6 | ) | 1.6 | (23.0 | ) | |||||||||||
|
|
|
|
|
|
|
|
|
|
|
|||||||||||
| Net interest income |
14.5 | 3.7 | 18.2 | 1.6 | 19.8 | |||||||||||||||
| Gain on origination and sale of loans, net |
435.5 | 80.2 | 515.7 | — | 515.7 | |||||||||||||||
| Origination income, net |
75.1 | 6.2 | 81.3 | — | 81.3 | |||||||||||||||
| Servicing income |
28.5 | — | 28.5 | — | 28.5 | |||||||||||||||
| Servicing (losses) gains |
(26.5 | ) | — | (26.5 | ) | — | (26.5 | ) | ||||||||||||
| Other income |
17.4 | 0.1 | 17.6 | — | 17.6 | |||||||||||||||
|
|
|
|
|
|
|
|
|
|
|
|||||||||||
| Total net revenues |
$ | 544.5 | $ | 90.2 | $ | 634.7 | $ | 1.6 | $ | 636.3 | ||||||||||
|
|
|
|
|
|
|
|
|
|
|
|||||||||||
| Expenses: |
||||||||||||||||||||
| Personnel expense |
$ | 293.6 | $ | 70.5 | $ | 364.1 | $ | — | $ | 364.1 | ||||||||||
| Marketing and advertising expense |
93.9 | 1.8 | 95.7 | — | 95.7 | |||||||||||||||
| Direct origination expense |
43.9 | 9.9 | 53.8 | — | 53.8 | |||||||||||||||
| General and administrative expense |
44.1 | 7.9 | 52.0 | — | 52.0 | |||||||||||||||
| Occupancy expense |
15.1 | 4.3 | 19.4 | — | 19.4 | |||||||||||||||
| Depreciation and amortization |
11.7 | 1.9 | 13.6 | — | 13.6 | |||||||||||||||
| Sub-servicing expenses |
11.2 | — | 11.2 | — | 11.2 | |||||||||||||||
| Other interest expense |
8.8 | — | 8.8 | — | 8.8 | |||||||||||||||
|
|
|
|
|
|
|
|
|
|
|
|||||||||||
| Total expenses |
522.3 | 96.3 | 618.6 | — | 618.6 | |||||||||||||||
| Income before income taxes |
22.2 | (6.1 | ) | 16.1 | 1.6 | 17.7 | ||||||||||||||
| Provision for income taxes(3) |
0.5 | 0.3 | 0.8 | 2.3 | 3.1 | |||||||||||||||
|
|
|
|
|
|
|
|
|
|
|
|||||||||||
| Net income |
$ | 21.7 | $ | (6.4 | ) | $ | 15.3 | $ | (0.7 | ) | $ | 14.6 | ||||||||
|
|
|
|
|
|
|
|
|
|
|
|||||||||||
| Less: Net income attributable to non-controlling interest(4) |
— | — | — | 10.2 | 10.2 | |||||||||||||||
|
|
|
|
|
|
|
|
|
|
|
|||||||||||
| Net income attributable to stockholders |
$ | 21.7 | $ | (6.4 | ) | $ | 15.3 | $ | (10.9 | ) | $ | 4.4 | ||||||||
|
|
|
|
|
|
|
|
|
|
|
|||||||||||
| Net income per common share: |
||||||||||||||||||||
| Basic |
$ | 0.07 | ||||||||||||||||||
| Diluted(5) |
0.07 | |||||||||||||||||||
| Weighted average common shares outstanding: |
||||||||||||||||||||
| Basic |
61,881,376 | |||||||||||||||||||
| Diluted(5) |
147,058,824 | |||||||||||||||||||
See Notes to Pro Forma Consolidated Statement of Operations
96
Table of Contents
Notes to Pro Forma Consolidated Statement of Operations
| (1) | loanDepot, Inc. will have the ability to appoint the board of managers of LD Holdings. loanDepot, Inc. will initially own 30.4% of the economic interest in LD Holdings, but will have 100% of the voting power and control the management of LD Holdings. The Continuing LLC Members will own the remaining 69.6% of the economic interest in LD Holdings, which will be accounted for as a non-controlling interest in the future consolidated financial results of loanDepot, Inc. Immediately following the offering and the use of proceeds to us therefrom, the non-controlling interest will be 57.9%. Net income attributable to the non-controlling interest will represent 57.9% of income before income taxes. These amounts have been determined based on the assumption that the underwriters’ option to purchase additional shares is not exercised. If the underwriters’ option to purchase additional shares is exercised the ownership percentage held by the non-controlling interest would decrease to 56.6%. |
| (2) | Reflects reduction in interest expense as a result of repayment of Mortgage Master seller notes payable following the offering as if it occurred as of January 1, 2014. |
| (3) | Following the Reorganization Transactions and the Offering Transactions, loanDepot, Inc. will be subject to U.S. federal income taxes, in addition to state and local taxes, with respect to its allocable share of any net taxable income of LD Holdings, which will result in higher income taxes than during our history as a limited liability company. As a result, the pro forma statements of operations reflect an adjustment to our provision for corporate income taxes to reflect an effective rate of 41.0%, which includes a provision for U.S. federal income taxes and uses our estimate of the weighted average statutory rates apportioned to each state and local jurisdiction. |
| (4) | The shares of Class B common stock of loanDepot, Inc. do not share in loanDepot, Inc. earnings and are therefore not allocated any net income attributable to the controlling and non-controlling interests. As a result, the shares of Class B common stock are not considered participating securities and are therefore not included in the weighted average shares outstanding for purposes of computing net income available per share. |
| (5) | For purposes of applying the as-if converted method for calculating diluted earnings per share, we assumed that all Holdco Units and Class B common stock are exchanged for Class A common stock. Such exchange is affected by the allocation of income or loss associated with the exchange of Holdco Units and Class B common stock for Class A common stock and accordingly the effect of such exchange has been included for calculating diluted pro forma net income (loss) available to Class A common stock per share. Giving effect to (i) the exchange of all Holdco Units and Class B common stock for shares of Class A common stock and (ii) the vesting of all unvested Holdco Unit stock based compensation awards, diluted pro forma net income (loss) per share available to Class A common stock would be computed as follows: |
| Six Months Ended June 30, 2015 |
Year Ended December 31, 2014 |
|||||||
| Pro forma income before income taxes |
$ | 70.2 | $ | 17.7 | ||||
| Adjusted pro forma income taxes(a) |
28.8 | 7.3 | ||||||
| Adjusted pro forma net income to loanDepot, Inc. stockholders(b) |
41.4 | 10.4 | ||||||
| Weighted average shares of Class A common stock outstanding (assuming the exchange of all Holdco Units for shares of Class A common stock)(c) |
147,058,824 | 147,058,824 | ||||||
| Pro forma diluted net income available to Class A common stock per share |
$ | 0.28 | $ | 0.07 | ||||
| (a) | Represents the implied provision for income taxes assuming the exchange of all Holdco Units of LD Holdings for shares of Class A common stock of loanDepot, Inc using the same method applied in calculating pro forma tax provision. |
| (b) | Assumes elimination of non-controlling interest due to the assumed exchange of all Holdco Units and Class B common stock for shares of Class A common stock of loanDepot, Inc. as of the beginning of the period. |
| (c) | The unvested units are converted to Holdco Units based on the treasury stock method and an as-if converted method is used to give effect to the exchange provisions of the Holdings LLC Agreement for the diluted weighted average share calculation. |
| (6) | Reflects adjustments to Mortgage Master’s statement of income to conform to loanDepot, Inc.’s presentation of certain revenue and expense items. |
97
Table of Contents
MANAGEMENT’S DISCUSSION AND ANALYSIS OF FINANCIAL CONDITION
AND RESULTS OF OPERATIONS
The following discussion and analysis of our financial condition and results of operations should be read in conjunction with our consolidated financial statements and the accompanying notes included elsewhere in this prospectus. The results of operations described below are not necessarily indicative of the results to be expected for any future periods. This discussion includes forward-looking information that involves risks and assumptions which could cause actual results to differ materially from management’s expectations. See “Risk Factors” and “Cautionary Statement Regarding Forward-Looking Statements.”
Overview
We are a leading technology-enabled U.S. consumer lending platform. We launched our business in 2010 to provide credit solutions to consumers who were not satisfied with the service offered by banks and other traditional market participants. We are the nation’s second largest direct-to-consumer non-bank originator by annual funded loan amount and have facilitated over $50 billion in total funding since inception. We currently offer a broad suite of consumer credit products to our customers, ranging from home loans to unsecured personal loans. Our hybrid originate-to-sell and marketplace business model allows us to generate significant loan volume with less capital than traditional market participants. For the twelve months ended June 30, 2015, we originated $22.1 billion in loans, representing 125% year-over-year growth relative to the twelve months ended June 30, 2014. Moreover, we have generated this substantial growth while maintaining profitability since 2012.
Key Factors Influencing Our Results of Operations
Market and Economic Environment
The $11.9 trillion consumer lending market is an important driver of the U.S. economy. The loan products we currently provide target some of the largest components of U.S. consumer credit, including home loan debt ($8.1 trillion outstanding as of June 30, 2015), consumer credit excluding home, automotive and student loan debt ($1.0 trillion outstanding as of June 30, 2015) and home equity lines of credit ($0.5 trillion outstanding as of June 30, 2015), which collectively account for over 80% of the total consumer lending market. Following the Financial Crisis, U.S. households focused on stabilizing their financial position by lowering household debt, which has resulted in current household debt service ratios of 9.9%, the lowest level since 1980. Similarly, consumer confidence, which has historically served as a strong indicator of improving economic conditions and a precursor to increased desire to access credit, has improved steadily since 2009. This increased confidence along with higher employment levels and promising wage growth has led to increased consumer spending, which has recently driven increased demand for credit, particularly in the consumer credit products we provide.
The consumer lending market and the associated loan origination volumes for home loans and personal loans are influenced by interest rates and economic conditions. While borrower demand for consumer credit has typically remained strong in most economic environments, general market conditions, including the interest rate environment, unemployment rates, home price appreciation and consumer confidence may affect borrower willingness to seek financing and investor desire and ability to invest in loans. For example, a significant interest rate increase or rise in unemployment could cause potential borrowers to defer seeking financing as they wait for interest rates to stabilize or the general economic environment to improve. Additionally, if the economy weakens and actual or expected default rates increase, loan investors may postpone or reduce their investments in loan products.
The volume of home loan originations associated with home purchases is generally less affected by interest rate fluctuations and more sensitive to broader economic factors as well as the overall strength of the economy and home affordability. Purchase home loan origination volume can be subject to seasonal trends as home sales typically rise during the spring and summer seasons and decline in the fall and winter seasons. This is somewhat offset by purchase loan originations sourced from our joint ventures which experience their highest level of
98
Table of Contents
activity during November and December as home builders focus on completing and selling homes prior to year end. Seasonality has less of an impact on refinance volumes, which are primarily driven by fluctuations in home loan interest rates.
Fluctuations in Interest Rates
Our home loan refinance volumes (and to a lesser degree, our purchase volumes), balance sheet and results of operations are influenced by changes in interest rates and how we effectively manage the related interest rate risk. As interest rates decline, home loan refinance volumes tend to increase, while an increasing interest rate environment may cause a decrease in refinance volumes and purchase volumes. In addition, the majority of our assets are subject to interest rate risk, including LHFS, which consist of home loans held on our balance sheet for a short period of time after origination until we are able to sell them, IRLCs, servicing rights and mandatory trades, forward sales contracts and put options that we enter into to manage interest rate risk created by IRLCs and uncommitted LHFS. We refer to such mandatory trades, forward sales contracts and put options collectively as “Hedging Instruments.” As interest rates increase, our LHFS and IRLCs generally decrease in value while our Hedging Instruments utilized to hedge against interest rate risk typically increase in value. However, rising interest rates cause our expected home loan servicing revenues to increase due to a decline in home loan prepayments which extends the average life of our servicing portfolio and increases the value of our servicing rights. Conversely, as interest rates decline, our LHFS and IRLCs generally increase in value while our Hedging Instruments decrease in value. However, in a declining interest rate environment, borrowers tend to refinance their home loans, which increases prepayment speed and causes our expected home loan servicing revenues to decrease, which reduces the average life of our servicing portfolio and decreases the value of our servicing rights. The changes in fair value of our servicing rights are recorded as unrealized gains and losses in gain on origination and sale of loans, net, and servicing gains (losses) in our consolidated statements of operations.
When interest rates rise, rate and term refinancings become less attractive to consumers after a historically long period of low interest rates. However, rising interest rates are also indicative of overall economic growth and inflation that should create more opportunities with respect to cash-out refinancings. In addition, inflation reflecting increases in asset prices and stronger economic growth (leading to higher consumer confidence) typically should generate more purchase-focused transactions requiring loans and greater opportunities for home equity loans, which we expect may offset, at least in part, any decline in rate and term refinancings in a rising interest rate environment. We also believe that rising interest rates will not have a material impact on market opportunities for personal loans because those are fixed rate products; however, if consumer debt in the aggregate began to decrease due to rising interest rates, we may see a reduction in personal loan volume because such loans are primarily used for consolidating debt.
Product Innovation and Brand Expansion
We have made and intend to continue to make investments to develop and offer new loan products for borrowers and investors. Our platform has been engineered to allow us to expand into new product categories as evidenced by the recent launches of our personal loan products in the second quarter of 2015 and home equity products in the third quarter of 2015. Our revenue growth to date has been a function of, and our future success will depend in part on, successfully meeting borrower and investor demand with new and innovative loan products and expanding our market share in our current products. As we continue to launch new products, we expect to be able to leverage our proprietary database and technology, as well as our sales force to efficiently identify consumers that could benefit from our expanded product suite. As a result, we expect to continue to reduce our average customer acquisition costs as we scale, increase customer conversion rates and become increasingly more efficient.
We intend to continue to dedicate significant resources to our marketing and brand advertising efforts and strategic relationships. We utilize highly targeted and sophisticated marketing strategies, which include internet, broadcast and new media, strategic alliances and a national television campaign to build brand awareness. Our operating results and ability to sustain and grow loan volume will depend, in part, on our ability to continue to make effective investments in marketing and product development.
99
Table of Contents
Acquisitions and Industry Partnerships
Although we have experienced rapid organic growth, we have completed and will continue to pursue selective strategic growth opportunities, which is demonstrated by our acquisitions of imortgage and Mortgage Master described below. In addition to direct borrower relationships, our sales force in the distributed retail channel originates loans through their relationships with local home builders, real estate agents and other local contacts. Furthermore, we have established joint ventures with several industry partners, including with two of the ten largest national home builders and other affinity partners and independent mortgage brokers. A local, cost-effective sales presence allows us to generate incremental origination opportunities and develop a personal relationship with customers, which leads to expanded volumes and profitability.
Acquisition of imortgage
On October 1, 2013, we completed the acquisition of substantially all of the assets of imortgage headquartered in Scottsdale, Arizona, for $53.7 million, consisting of $20.3 million in cash and $33.4 million in equity. The acquisition of imortgage provided us with a distributed retail presence to complement our direct retail channel. At the time of the acquisition, imortgage had 1,022 employees and a licensed salesforce of 369 located in six states, primarily in California and Arizona. The results of imortgage have been included in our results of operations since October 1, 2013.
Acquisition of Mortgage Master
On January 2, 2015, we completed the acquisition of Mortgage Master, headquartered in Walpole, Massachusetts, for $38.2 million, consisting of an estimated $26.9 million in contingent earn-out consideration and $11.3 million in promissory notes. The Seller Notes were amended on June 2, 2015 to, among other things, increase the amount of the notes by $4.3 million to a total outstanding principal amount of approximately $15.5 million. We repaid $2.1 million in Seller Notes as of June 30, 2015. Through our acquisition of Mortgage Master, we significantly expanded our distributed retail channel into the Northeast, Tri-State and mid-Atlantic regions. At the time of the acquisition, Mortgage Master had 629 employees and a licensed sales force of 290 located in 14 states. The results of Mortgage Master have been included in our results of operations since January 2, 2015.
Key Performance Metrics
We manage and assess the performance of our business by evaluating a variety of metrics. Selected key performance metrics are discussed below.
Fundings by Product
Fundings by product are a measure of how successful we are at growing sales of our home loan and personal loan products and a metric used by management in an attempt to isolate how effectively we are growing home and personal loans. We believe that fundings by product are an indicator of our market penetration in home and personal loans and that this provides useful information because it allows investors to better assess the underlying growth rate of our core products.
Number of Customers Serviced by Product
Number of customers serviced by product represents the number of home loan and personal loan units serviced in our servicing portfolio. We believe that our net customer additions are an indicator of the growth of home loans and personal loans and our servicing income, but may be offset by sales, from time to time, of servicing rights.
100
Table of Contents
Gain on Sale Margin
GOS margin is a loan origination revenue metric which we believe provides useful information for assessing our performance (including our home loan origination, hedging and sales activities) within the overall home loan origination and sales market. We measure GOS margin for home loans in a given period by dividing the (i) revenue from the origination and sale of the home loan by (ii) the volume of home loans sold plus the change in the notional amount of loans held for sale during the period plus the change in the notional amount of pull-through rate adjusted interest rate lock commitments during the period. Revenue from the origination and sale of home loans includes (i) gain on origination and sale of loans, net from home loans, (ii) origination income, net from home loans and (iii) servicing gains (losses) resulting from our servicing rights utilized for hedging, excluding changes in servicing rights fair value from fallout and decay (other changes in fair value) and any realized gain or loss from the sale of servicing rights during the period. We calculate GOS margin in this manner because it most appropriately represents all home loan economic revenue items divided by an appropriate notional amount of the related home loans and interest rate lock commitments responsible for this revenue.
Adjusted EBITDA, Adjusted EBITDA Margin, Adjusted Net Income and Adjusted Net Income Margin
We present Adjusted EBITDA, Adjusted EBITDA Margin, Adjusted Net Income and Adjusted Net Income Margin, which management believes are important indicators of our operations because they exclude items that may not be indicative of, or are unrelated to, our core operating results, and provide a baseline for analyzing trends in our underlying business from period to period. Adjusted EBITDA, Adjusted EBITDA Margin, Adjusted Net Income and Adjusted Net Income Margin are not a measurement of our financial performance under GAAP and should not be considered as an alternative to operating profit or any other performance measures derived in accordance with GAAP nor as an alternative to cash flows from operating activities as a measure of our liquidity.
For a presentation of our selected key performance metrics for the six months ended June 30, 2015 and 2014 and the years ended December 31, 2014 and 2013, including a discussion thereof, see “Prospectus Summary—Summary Historical Consolidated Financial and Other Data.”
Description of Components of Results of Operations
Revenues
Net Interest Income. Net interest income reflects interest earned on LHFS offset by interest expense on amounts borrowed under Warehouse Lines to finance such loans until sold. For more information regarding our Warehouse Lines, see “—Liquidity and Capital Resources—Warehouse Lines” below.
Gain on Origination and Sale of Loans, Net. Gain on origination and sale of loans, net, includes cash and non-cash elements and is comprised of the following components:
| • | gain or loss realized upon the sale of loans to investors; |
| • | the value of servicing rights associated with loans sold to investors on a servicing-retained or servicing-released basis in the current period; |
| • | discount points collected, rebates paid to borrowers and lender paid costs for the origination of loans (including broker fee compensation paid to independent wholesale brokers and brokerage fees paid to our joint ventures for referred loans); |
| • | changes in the fair value of IRLCs that we enter into with loan applicants to originate loans; |
| • | changes in the fair value of LHFS; |
| • | changes in the fair value of Hedging Instruments; |
| • | realized gains and losses on Hedging Instruments; and |
101
Table of Contents
| • | provisions for estimated loan loss obligations that we record for sold loans. |
When we sell loans to investors, we record a gain or loss which is ultimately determined by the proceeds received from the sale of loans compared to their respective carrying values. The gain or loss that we realize on the sale of loans provided through our lending activities is primarily determined by the terms of originated loans, current market interest rates, the effect of any hedging and other risk management activities that we undertake, the sales price of the loan and the value of any servicing rights generated by the transaction. We carry our LHFS at fair value. Fair value is estimated based on quoted market prices, where available, prices for other traded loans with similar characteristics, and purchase commitments and bid information received from market participants. Changes in fair value are reported as a component of gain on origination and sale of loans, net, within our consolidated statements of operations.
While our contracts vary, we provide representations and warranties to purchasers and insurers of the home loans sold that typically are in place for the life of the loan. In the event of a breach of these representations and warranties, we may be required to repurchase a home loan or indemnify the purchaser or insurer for losses, and any subsequent loss on the home loan may be borne by us. The representations and warranties require adherence to applicable origination and underwriting guidelines, including but not limited to the validity of the lien securing the loan, property eligibility, borrower credit, income and asset requirements and compliance with applicable federal, state and local law. We record a liability for our estimate of losses that we may experience as a result of our breach of representations and warranties provided to the purchasers or insurers of the loans that we have sold.
We provide IRLCs in order to provide our customers with certainty of the rate for their loan. We recognize in revenue the estimated fair value of IRLCs upon their issuance. The estimated fair value of IRLCs is based on our estimated gain on origination and sale of a loan, net of estimated direct origination costs, funded under the commitment, including servicing rights value, adjusted for the probability that the loan will fund. The IRLC is subject to changes in fair value as the loan approaches funding, as market interest rates for similar loans change and as our assessment of the probability of the funding of loans at similar points in the origination process changes. We recognize IRLCs on the balance sheet under derivative assets and liabilities, at fair value, on the commitment date with changes in fair value reported as a component of gain on origination and sale of loans, net.
The primary factor influencing the probability that the loan will fund within the terms of the IRLC is the change, if any, in interest rates subsequent to the commitment date. In general, the probability of funding increases if current interest rates rise and decreases if current interest rates fall. This is due primarily to the relative attractiveness of current interest rates compared to the applicant’s committed rate. The probability that a loan will fund within the terms of the IRLC is also influenced by the channel source of the application, aging of the application and the purpose of the loan (purchase or refinance).
We manage interest rate risk created by IRLCs and LHFS by entering into Hedging Instruments, which are accounted for as derivative financial instruments. We account for our derivative financial instruments as free-standing derivatives. We do not designate our Hedging Instruments under hedge accounting. We recognize all of our Hedging Instruments on the balance sheet at fair value with changes in the fair value reported as a component of gain on origination and sale of loans, net, within our consolidated statements of operations.
We typically originate home loans and then sell them in the secondary market while retaining servicing, and thus generate net interest income and gain on origination and sale of loans, net, on such loans, in addition to origination income, servicing income and servicing (losses) gains. We do not originate personal loans, but rather these loans are originated by our bank partner and then sold to investors. As a result, we do not generate net interest income or gain on origination and sale of personal loans, net, and instead generate platform licensing fee income and servicing income, net.
Origination Income, Net. Origination income, net, reflects the fees that we earn, net of lender credits we pay, from originating loans. Origination income includes loan origination fees, processing fees, underwriting fees
102
Table of Contents
and other fees collected from the borrower at the time of funding, as well as the platform licensing fee income received from our issuing bank partner in connection with our personal loan products. Lender credits typically include rebates or concessions to borrowers for certain loan origination costs.
Servicing Income. Servicing income reflects contractual servicing fees and ancillary and other fees (including late charges) related to the servicing of loans, including master servicing fees related to the servicing of home and personal loans.
Servicing (Losses) Gains. Servicing (losses) gains reflects both (i) changes in the fair value of servicing rights and (ii) gain or loss on sale of servicing rights. Changes in the fair value of servicing rights are influenced by borrower prepayment expectations and actual borrower prepayments (including through a home loan refinancing) relating to the underlying loans that are, in turn, primarily influenced by interest rate levels and expectations.
Other Income. Other income reflects our pro rata share of the net earnings from joint ventures, fee income from escrow services performed by LD Escrow, Inc., a consolidated subsidiary which provides escrow services to our customers in conjunction with their real estate transactions, and other items.
Expenses
Personnel Expense. Personnel expense reflects employee compensation related to salaries, commissions, incentive compensation, benefits and other employee costs.
Marketing and Advertising Expense. Marketing and advertising expense primarily reflects online advertising costs, including fees paid to search engines, television, print and radio, distribution partners, master service agreements with brokers and desk rental agreements with realtors. We expense and do not capitalize any of our marketing spend.
Direct Origination Expense. Direct origination expense reflects the unreimbursed portion of direct out-of-pocket expenses that we incur in the loan origination process, including underwriting, appraisal, credit report, loan document and other expenses paid to non-affiliates.
General and Administrative Expense. General and administrative expense reflects professional fees, data processing expense, communications expense, interest expense incurred on capital leases and other operating expenses.
Occupancy Expense. Occupancy expense reflects our lease costs, utilities, maintenance and security expenses related to the operation of our facilities.
Depreciation and Amortization. Depreciation and amortization reflects depreciation and amortization of property and equipment, amortization of assets under capital leases and amortization of intangible assets.
Subservicing Expense. Subservicing expense reflects the amounts that we pay to our subservicers to service our home and personal loan servicing portfolios.
Other Interest Expense. Other interest expense comprises costs for corporate debt obligations, including our Unsecured Term Loan and our Secured Credit Facilities. For more information regarding the debt obligations, see “—Liquidity and Capital Resources” below.
103
Table of Contents
Results of Operations
The following table sets forth our consolidated financial statement data for the periods indicated:
| Six Months Ended June 30, |
|
Year Ended December 31, |
|
|||||||||||||||||||||
| 2015 | 2014 | % Change | 2014 | 2013 | % Change | |||||||||||||||||||
| (Dollars in thousands) | ||||||||||||||||||||||||
| REVENUES: |
||||||||||||||||||||||||
| Interest income |
$ | 30,815 | $ | 14,462 | 113 | % | $ | 34,416 | $ | 18,902 | 82 | % | ||||||||||||
| Interest expense |
(20,651 | ) | (8,132 | ) | 154 | (19,966 | ) | (12,692 | ) | 57 | ||||||||||||||
|
|
|
|
|
|
|
|
|
|||||||||||||||||
| Net interest income |
10,164 | 6,330 | 61 | 14,450 | 6,209 | 133 | ||||||||||||||||||
| Gain on origination and sale of loans, net |
425,438 | 193,849 | 119 | 435,462 | 246,478 | 77 | ||||||||||||||||||
| Origination income, net |
41,649 | 34,635 | 20 | 75,064 | 51,995 | 44 | ||||||||||||||||||
| Servicing income |
20,195 | 12,652 | 60 | 28,517 | 12,914 | 121 | ||||||||||||||||||
| Servicing (losses) gains |
(19,284 | ) | (10,368 | ) | 86 | (26,522 | ) | 10,667 | (349 | ) | ||||||||||||||
| Other income |
11,471 | 7,122 | 61 | 17,504 | 10,232 | 71 | ||||||||||||||||||
|
|
|
|
|
|
|
|
|
|||||||||||||||||
| Total net revenues |
$ | 489,633 | $ | 244,220 | 100 | % | $ | 544,475 | $ | 338,496 | 61 | % | ||||||||||||
|
|
|
|
|
|
|
|
|
|||||||||||||||||
| EXPENSES: |
||||||||||||||||||||||||
| Personnel expense |
$ | 273,182 | $ | 130,210 | 110 | % | $ | 293,552 | $ | 153,179 | 92 | % | ||||||||||||
| Marketing and advertising expense |
54,369 | 43,024 | 26 | 93,906 | 51,265 | 83 | ||||||||||||||||||
| Direct origination expense |
28,594 | 20,503 | 39 | 43,893 | 22,907 | 92 | ||||||||||||||||||
| General and administrative expense |
33,618 | 18,127 | 85 | 44,070 | 17,769 | 148 | ||||||||||||||||||
| Occupancy expense |
11,118 | 7,065 | 57 | 15,083 | 5,716 | 164 | ||||||||||||||||||
| Depreciation and amortization |
8,593 | 5,207 | 65 | 11,692 | 5,778 | 102 | ||||||||||||||||||
| Subservicing expenses |
5,651 | 4,919 | 15 | 11,157 | 6,884 | 62 | ||||||||||||||||||
| Other interest expense |
5,124 | 4,400 | 16 | 8,930 | 1,967 | 354 | ||||||||||||||||||
|
|
|
|
|
|
|
|
|
|||||||||||||||||
| Total expenses |
$ | 420,249 | $ | 233,454 | 80 | % | $ | 522,282 | $ | 265,465 | 97 | % | ||||||||||||
|
|
|
|
|
|
|
|
|
|||||||||||||||||
| Income before income taxes |
$ | 69,384 | $ | 10,766 | 544 | % | $ | 22,193 | $ | 73,031 | (70 | )% | ||||||||||||
| Provision for income taxes |
216 | 598 | (64 | ) | 509 | 773 | (34 | ) | ||||||||||||||||
|
|
|
|
|
|
|
|
|
|||||||||||||||||
| Net income |
$ | 69,168 | $ | 10,168 | 580 | % | $ | 21,684 | $ | 72,258 | (70 | )% | ||||||||||||
|
|
|
|
|
|
|
|
|
|||||||||||||||||
Six Months Ended June 30, 2015 Compared to Six Months Ended June 30, 2014
Net income was $69.2 million for the six months ended June 30, 2015, as compared to $10.2 million for the six months ended June 30, 2014, representing an increase of $59.0 million or 580%. Total fundings by product were $14.3 billion for the six months ended June 30, 2015, as compared to $5.4 billion for the six months ended June 30, 2014, representing an increase of $8.9 billion or 167%. Of the total fundings by product for the six months ended June 30, 2015, $3.6 billion, or 25%, was attributable to our acquisition of Mortgage Master in January 2015. We generated additional revenue and net income growth related to increased IRLCs and home loan originations as a result of the Mortgage Master acquisition. Our operating results were positively influenced by an attractive home loan origination market during the six months ended June 30, 2015 during which interest rates declined in the first quarter of 2015, resulting in an increase in IRLCs and home loan origination volumes. Additionally, our marketing activities proved to be effective during the current period as we were able to generate additional IRLC and home loan origination volumes at a reduced marketing cost per loan. The acquisition of Mortgage Master, the continued growth of imortgage and the additional marketing spend enabled us to increase our market share in the six months ended June 30, 2015 to 2.0%, as compared to 1.0% in the six months ended June 30, 2014. We made investments in personnel and infrastructure during 2014, which enabled us to increase home loan origination volume and grow revenues at an increased rate, relative to the increase in expenses for the six months ended June 30, 2015, as compared to the six months ended June 30, 2014. Our profitability improved during the period due to efficiencies gained from our benefits of scale.
104
Table of Contents
Revenues
Net Interest Income. Net interest income was $10.2 million for the six months ended June 30, 2015, as compared to $6.3 million for the six months ended June 30, 2014, representing an increase of $3.8 million or 61%. The increase between periods was primarily the result of increased net interest earned on a higher average balance of LHFS funded by Warehouse Lines.
Gain on Origination and Sale of Loans, Net. Gain on origination and sale of loans, net, was $425.4 million for the six months ended June 30, 2015, as compared to $193.8 million for the six months ended June 30, 2014, representing an increase of $231.6 million or 119%. The increase is primarily attributable to the increase in loan originations during the period, the acquisition of Mortgage Master and continued growth of imortgage and across all our existing channels. The increase in revenue from origination volume was partially offset by a decrease in GOS margins to 296 basis points for the six months ended June 30, 2015 as compared to 380 basis points for the six months ended June 30, 2014. The decrease in GOS margin was attributable to channel mix and product mix during the periods. The wholesale and distributed retail channels increased their origination volume to 10.4% and 48.3%, respectively, of total origination volume for the six months ended June 30, 2015 as compared to 0.8% and 41.8%, respectively, for the six months ended June 30, 2014. Additionally, our product mix contributed to reduced GOS margins with conventional and government loans representing 64.2% and 29.6%, respectively, of total loan origination volume for the six months ended June 30, 2015 as compared to 61.5% and 37.9%, respectively, for the six months ended June 30, 2014. The components of gain on origination and sale of loans, net, are as follows:
| • | $358.5 million in net premiums realized upon the sale of loans to investors for the six months ended June 30, 2015, as compared to $186.5 million for the six months ended June 30, 2014, representing an increase of $172.0 million or 92%; |
| • | $148.0 million in retained servicing rights from loans sold to investors on a servicing-retained basis for the six months ended June 30, 2015, as compared to $51.2 million for the six months ended June 30, 2014, representing an increase of $96.8 million or 189%, which was driven by both (i) the increase in volume of loans sold on a servicing-retained basis to $12.1 billion during the six months ended June 30, 2015, as compared to $4.7 billion for the six months ended June 30, 2014 and (ii) an increase in estimated servicing multiples from 3.7x as of June 30, 2014 to 4.2x as of June 30, 2015; |
| • | $4.7 million of provision for loan loss obligations recorded for loans sold during the six months ended June 30, 2015, as compared to $0.7 million for the six months ended June 30, 2014, representing an increase of $4.0 million or 571%. The increase was due to $13.8 billion of loans sold during the six months ended June 30, 2015, as compared to $5.2 billion during the six months ended June 30, 2014; |
| • | $10.8 million of realized and unrealized gains from Hedging Instruments for the six months ended June 30, 2015, as compared to $57.6 million of realized and unrealized losses for the six months ended June 30, 2014. The increase is primarily due to the overall change in interest rate environment; |
| • | $23.1 million of unrealized gains from IRLCs for the six months ended June 30, 2015, as compared to $30.5 million for the six months ended June 30, 2014, representing a decrease of $7.3 million or 24%. The decrease is primarily due to the overall change in interest rate environment; |
| • | $5.2 million of mark-to-market losses on LHFS for the six months ended June 30, 2015, as compared to $20.1 million of mark-to-market gains for the six months ended June 30, 2014. The decrease is primarily attributable to an increasing interest rate environment for the six months ended June 30, 2015, as compared to a decreasing rate environment during the six months ended June 30, 2014; and |
| • | $105.1 million of rebates paid to borrowers and lender paid costs, net of discount points collected from borrowers for the origination of loans for the six months ended June 30, 2015, as compared to $36.1 million for the six months ended June 30, 2014, representing an increase of $69.0 million or 191%. |
105
Table of Contents
Origination Income, Net. Origination income, net, was $41.6 million for the six months ended June 30, 2015, as compared to $34.6 million for the six months ended June 30, 2014, representing an increase of $7.0 million or 20%. The increase in origination income, net, between periods was primarily the result of an increase in loan origination and other loan fees attributable to the growth in loan origination volumes.
Servicing Income. Servicing income was $20.2 million for the six months ended June 30, 2015, as compared to $12.7 million for the six months ended June 30, 2014, representing an increase of $7.5 million or 60%. The increase in servicing income between periods was the result of an increase of $4.4 billion in the average UPB of our servicing portfolio, which increase resulted from an increase in servicing-retained loan sales. Our average servicing portfolio increased to $14.0 billion for the six months ended June 30, 2015, as compared to $9.6 billion for the six months ended June 30, 2014.
Servicing (Losses) Gains. Servicing losses were $19.3 million for the six months ended June 30, 2015, as compared to servicing losses of $10.4 million for the six months ended June 30, 2014, representing an increase of $8.9 million or 86%. The increase in servicing losses was the result of:
| • | $15.6 million in unrealized mark-to-market losses on servicing rights for the six months ended June 30, 2015, as compared to losses of $10.8 million for the six months ended June 30, 2014, primarily due to an increase in principal amortization and prepayments experienced in our servicing portfolio during the six months ended June 30, 2015; and |
| • | $3.7 million in realized losses on sales of servicing rights associated with the sale of $7.4 billion in UPB during the six months ended June 30, 2015, as compared to a $0.5 million gain associated with the sale of $2.0 billion in UPB during the six months ended June 30, 2014. |
Other Income. Other income was $11.5 million for the six months ended June 30, 2015, as compared to $7.1 million for the six months ended June 30, 2014, representing an increase of $4.3 million or 61%. The increase between periods was primarily the result of an increase in escrow income of $7.8 million for the six months ended June 30, 2015, driven by overall increased loan activity, as compared to $4.0 million for the six months ended June 30, 2014.
Expenses
Personnel Expense. Personnel expense was $273.2 million for the six months ended June 30, 2015, as compared to $130.2 million for the six months ended June 30, 2014, representing an increase of $143.0 million or 110%. The increase between periods was primarily the result of an increase in commissions, salaries and benefits expense as a result of the increase in headcount associated with the growth of our lending operation, including the acquisition of Mortgage Master in January 2015. As of June 30, 2015, we had 4,126 full-time equivalent employees (“FTE”), as compared to 2,698 FTE as of June 30, 2014, representing a 52% year-over-year increase.
Marketing and Advertising Expense. Marketing and advertising expense was $54.4 million for the six months ended June 30, 2015, as compared to $43.0 million for the six months ended June 30, 2014, representing an increase of $11.3 million or 26%. The increase between periods was primarily the result of additional acquired leads, direct mail campaigns, national television advertising, internet marketing and marketing service agreements associated with generating additional lead sources and growing our brand awareness.
Direct Origination Expense. Direct origination expense was $28.6 million for the six months ended June 30, 2015, as compared to $20.5 million for the six months ended June 30, 2014, representing an increase of $8.1 million or 39%. The increase between periods was primarily the result of increased underwriting, credit reports, loan document and other loan origination costs associated with increased loan origination volumes during the period.
General and Administrative Expense. General and administrative expense was $33.6 million for the six months ended June 30, 2015, as compared to $18.1 million for the six months ended June 30, 2014, representing an increase
106
Table of Contents
of $15.5 million or 85%. The increase between periods was primarily the result of an increase in data and communication expense and professional services expense associated with increases in personnel and sales offices, including the acquisition of Mortgage Master in January 2015, partially offset by an increase in capitalized internally developed software costs associated with the expansion of our proprietary technology.
Occupancy Expense. Occupancy expense was $11.1 million for the six months ended June 30, 2015, as compared to $7.1 million for the six months ended June 30, 2014, representing an increase of $4.1 million or 57%. The increase between periods was the result of increased facilities cost related to our acquisition of Mortgage Master in January 2015 and an increase in the number and lease rates of imortgage sales offices.
Depreciation and Amortization. Depreciation and amortization was $8.6 million for the six months ended June 30, 2015, as compared to $5.2 million for the six months ended June 30, 2014, representing an increase of $3.4 million or 65%. The increase between periods was the result of increased property and equipment associated with the growth of our lending business, including property and equipment related to the acquisition of Mortgage Master in January 2015.
Subservicing Expense. Subservicing expense was $5.7 million for the six months ended June 30, 2015, as compared to $4.9 million for the six months ended June 30, 2014, representing an increase of $0.7 million or 15%. The increase between periods was the result of the increased balance of our servicing portfolio.
Other Interest Expense. Other interest expense was $5.1 million for the six months ended June 30, 2015, as compared to $4.4 million for the six months ended June 30, 2014, representing an increase of $0.7 million or 16%. The increase between periods was the result of interest expense on our $80.0 million Unsecured Term Loan and an increase in the Secured Credit Facilities used to finance servicing rights.
Year Ended December 31, 2014 Compared to Year Ended December 31, 2013
Net income was $21.7 million for 2014, as compared to $72.3 million for 2013, representing a decrease of $50.6 million or 70%. Total fundings by product were $13.2 billion for 2014, as compared to $8.4 billion for 2013, representing an increase of $4.8 billion or 57%. The acquisition of imortgage in October 2013 and the launch of our wholesale loan channel in May 2014 enabled us to grow our home loan origination volumes and increase revenues year-over-year despite the contraction in the home loan origination market due to higher interest rates (which affected our acquired entities before we bought them). In an effort to increase market share, we significantly increased our marketing efforts. The acquisition of imortgage and the additional marketing spend enabled us to increase our market share in 2014 to 1.2%, as compared to 0.5% in 2013. Additionally, during 2014 we enhanced our management team and made additional investments in personnel and infrastructure to support future growth of our business, including the launch of our personal loan product. Our profitability declined as a result of the increased expenses associated with marketing and organizational growth.
Revenues
Net Interest Income. Net interest income was $14.5 million for 2014, as compared to $6.2 million for 2013, representing an increase of $8.2 million or 133%. The increase between periods was primarily the result of increased net interest earned on a higher average balance of LHFS funded by Warehouse Lines.
Gain on Origination and Sale of Loans, Net. Gain on origination and sale of loans, net, was $435.5 million for 2014, as compared to $246.5 million for 2013, representing an increase of $189.0 million or 77%. The increase is primarily attributable to the increase in loan originations during the period and continued growth through the acquisition of imortgage and across all our existing channels. Also contributing to the growth in gain on origination and sale of loans, net was an increase in GOS margins to 368 basis points for 2014 as compared to 350 basis points for 2013. The increase in GOS margin was primarily attributable to a change in our product mix.
107
Table of Contents
Our conventional and government loan originations totaled 62% and 37%, respectively, of total loan origination volume for 2014 as compared to 76% and 23%, respectively, for 2013. The components of gain on origination and sale of loans, net, are as follows:
| • | $455.3 million in net premiums realized upon the sale of loans to investors for 2014, as compared to $196.3 million for 2013, representing an increase of $259.1 million or 132%; |
| • | $132.8 million in retained servicing rights from loans sold to investors on a servicing-retained basis in 2014, as compared to $60.2 million in 2013, representing an increase of $72.6 million or 121%. The increase was driven by the increase in volume of loans sold on a servicing-retained basis to $11.8 billion during 2014, as compared to $6.2 billion for 2013 and an increase in estimated servicing multiples; |
| • | $2.6 million of provision for loan loss obligations recorded for loans sold in 2014, as compared to $3.1 million in 2013, representing a decrease of $0.6 million or 18%, which decrease was primarily the result of changes in management estimates; |
| • | $91.4 million of realized and unrealized losses from Hedging Instruments in 2014, as compared to $39.8 million of realized and unrealized gains in 2013, representing a decrease of $131.2 million. The decrease is primarily due to the overall change in interest rate environment; |
| • | $18.9 million of unrealized gains from IRLCs in 2014, as compared to $3.1 million in 2013, representing an increase of $15.8 million or 510%. The increase is primarily attributable to an increase in loan pipeline commitments totaling $23.8 billion in UPB for 2014 as compared to $14.2 billion for 2013; |
| • | $23.5 million of mark-to-market gains on LHFS in 2014, as compared to $4.5 million of mark-to-market losses in 2013. The increase is primarily attributable to an increase in LHFS to $1.0 billion as of December 31, 2014, as compared to $741.5 million as of December 31, 2013; and |
| • | $101.2 million of discount points collected, net of rebates paid to borrowers and lender paid costs, for the origination of loans for 2014, as compared to $45.3 million for 2013, representing an increase of $55.9 million or 123%. |
Origination Income, Net. Origination income, net, was $75.1 million for 2014, as compared to $52.0 million for 2013, representing an increase of $23.1 million or 44%. The increase between periods was primarily the result of an increase in loan origination and other loan fees attributable to the 57% growth in loan origination volumes for 2014.
Servicing Income. Servicing income was $28.5 million for 2014, as compared to $12.9 million for 2013, representing an increase of $15.6 million or 121%. The increase in servicing income between periods was the result of an increase of $5.4 billion in the average UPB of our servicing portfolio, from an average of $5.2 billion for 2013 to $10.6 billion for 2014.
Servicing (Losses) Gains. Servicing losses were $26.5 million for 2014, as compared to servicing gains of $10.7 million for 2013, representing a decrease of $37.2 million. The decrease in servicing gains was the result of:
| • | $30.2 million in unrealized mark-to-market losses on our servicing rights in 2014, as compared to unrealized gains of $10.7 million in 2013, primarily due to a decrease in interest rates on a higher balance of servicing rights as of December 31, 2014; and |
| • | $3.7 million in realized gains on sales of servicing rights associated with the sale of $5.3 billion in UPB during 2014, as compared to no servicing rights sales during 2013. |
Other Income. Other income was $17.5 million for 2014, as compared to $10.2 million for 2013, representing an increase of $7.3 million or 71%. The increase between periods was primarily the result of
108
Table of Contents
increases in income from our investments in joint ventures associated with the acquisition of imortgage in 2013 and increases in escrow fee income. Income from joint ventures increased $4.9 million to $6.8 million for 2014, as compared to $1.9 million for 2013. Additionally, escrow fee income increased $1.8 million to $9.6 million for 2014, as compared to $7.7 million for 2013.
Expenses
Personnel Expense. Personnel expense was $293.6 million for 2014, as compared to $153.2 million for 2013, representing an increase of $140.4 million or 92%. The increase between periods was primarily the result of an increase in commissions and salaries and benefits expense as a result of the increase in headcount associated with the growth of our lending operation including the acquisition of imortgage in October 2013. As of December 31, 2014, we had 3,114 FTE, as compared to 2,326 FTE as of December 31, 2013, representing a 31% year-over-year increase.
Marketing and Advertising Expense. Marketing and advertising expense was $93.9 million for 2014, as compared to $51.3 million for 2013, representing an increase of $42.6 million or 83%. The increase between periods was primarily the result of additional acquired leads, internet marketing and marketing service agreements associated with our efforts to capture additional market share.
Direct Origination Expense. Direct origination expense was $43.9 million for 2014, as compared to $22.9 million for 2013, representing an increase of $21.0 million or 92%. The increase between periods was primarily the result of increased underwriting, credit reports, appraisals, loan document and other loan origination costs associated with increased loan origination volumes during the period.
General and Administrative Expense. General and administrative expense was $44.1 million for 2014, as compared to $17.8 million for 2013, representing an increase of $26.3 million or 148%. The increase between periods was primarily the result of an increase in data and communications expense and professional services expense associated with investments in personnel and infrastructure, as well as increased costs associated with the operations of imortgage commencing in October 2013. Partially offsetting the increase in costs was an increase in capitalized internally developed software costs associated with the expansion of our proprietary technology.
Occupancy Expense. Occupancy expense was $15.1 million for 2014, as compared to $5.7 million for 2013, representing an increase of $9.4 million or 164%. The increase between periods was primarily the result of increased facilities cost related to our distributed retail channel (primarily as a result of our acquisition of imortgage in October 2013) and the growth of our direct retail and wholesale channels.
Depreciation and Amortization. Depreciation and amortization was $11.7 million for 2014, as compared to $5.8 million for 2013, representing an increase of $5.9 million or 102%. The increase between periods was primarily the result of increased property and equipment associated with the growth of our lending business, including property and equipment related to the acquisition of imortgage in October 2013.
Subservicing Expense. Subservicing expenses were $11.2 million for 2014, as compared to $6.9 million for 2013, representing an increase of $4.3 million or 62%. The increase between periods was primarily the result of the significant growth in the balance of our servicing portfolio which increased to $13.6 billion as of December 31, 2014, as compared to $8.3 billion as of December 31, 2013.
Other Interest Expense. Other interest expense was $8.9 million for 2014, as compared to $2.0 million for 2013, representing an increase of $7.0 million or 354%. The increase between periods was primarily the result of higher outstanding debt balances associated with our Unsecured Term Loan we entered into during October 2013 and the Original Secured Credit Facility we entered into during October 2014.
109
Table of Contents
Description of Certain Components of Consolidated Balance Sheets
Loans Held for Sale, at Fair Value. Loans held for sale, at fair value, are primarily fixed and variable rate, 15- to 30-year term first-lien loans that are secured by residential property. All loans are reflected at fair value. During the six months ended June 30, 2015, our home loans were on our balance sheet for 17.3 days on average before final sale. Our personal loans are funded directly by our issuing bank partner, which thereafter sells the loans directly to investors, and are not recorded on our balance sheet.
Derivative Assets and Liabilities, at Fair Value. Derivative assets and liabilities, at fair value, represent the fair value of IRLCs and Hedging Instruments, which may be positive or negative. We do not use derivative financial instruments for purposes other than in support of our risk management activities.
Servicing Rights, at Fair Value. Servicing rights, at fair value, represent the value of a contract that obligates us to service home loans on behalf of the purchaser of the loan in exchange for servicing fees and the right to collect certain ancillary income from the borrower. We recognize servicing rights at our estimate of the fair value of the contract to service the loans.
Warehouse Lines of Credit. Warehouse lines of credit represent debt that is used to fund, and is secured by, home loans. Warehouse Lines are repaid using proceeds from the sale of loans. Warehouse Lines carry base interest rates and may include annual facility fees, commitment fees and non-usage fees.
Loans Eligible for Repurchase/Liability for Loans Eligible for Repurchase. For certain loans guaranteed by Ginnie Mae, we (as the servicer) have the unilateral right to repurchase any individual loan in a Ginnie Mae securitization pool if that loan meets defined criteria, including being delinquent greater than 90 days. Once we have the unilateral right to repurchase the delinquent loan, we have effectively gained control over the loan and must re-recognize the loan on our consolidated balance sheet and establish a corresponding liability regardless of our intent to repurchase the loan.
110
Table of Contents
Financial Condition
The following table sets forth our consolidated balance sheet data as of the dates indicated:
| June 30, 2015 |
December 31, | |||||||||||
| 2014 | 2013 | |||||||||||
| (Dollars in thousands) | ||||||||||||
| ASSETS |
||||||||||||
| Cash and cash equivalents |
$ | 53,350 | $ | 28,637 | $ | 40,885 | ||||||
| Restricted cash |
3,227 | 9,099 | 17,662 | |||||||||
| Accounts receivable, net |
39,420 | 18,759 | 12,750 | |||||||||
| Loans held for sale, at fair value |
1,504,603 | 1,004,195 | 741,509 | |||||||||
| Derivative assets, at fair value |
87,443 | 52,851 | 44,572 | |||||||||
| Servicing rights, at fair value |
194,093 | 138,837 | 93,823 | |||||||||
| Property and equipment, net |
50,056 | 36,285 | 26,995 | |||||||||
| Prepaid expenses and other assets |
15,035 | 10,362 | 6,736 | |||||||||
| Loans eligible for repurchase |
71,608 | 39,840 | 5,311 | |||||||||
| Investments in joint ventures |
16,687 | 16,791 | 18,064 | |||||||||
| Goodwill |
35,422 | 10,883 | 10,883 | |||||||||
| Intangible assets, net |
5,432 | 3,817 | 4,148 | |||||||||
|
|
|
|
|
|
|
|||||||
| Total assets |
$ | 2,076,376 | $ | 1,370,356 | $ | 1,023,337 | ||||||
|
|
|
|
|
|
|
|||||||
| LIABILITIES, REDEEMABLE UNITS AND UNITHOLDERS’ EQUITY |
||||||||||||
| Warehouse lines of credit |
$ | 1,410,794 | $ | 938,617 | $ | 697,756 | ||||||
| Accrued expenses and other liabilities |
130,558 | 80,945 | 63,569 | |||||||||
| Contingent consideration |
28,100 | — | — | |||||||||
| Derivative liabilities, at fair value |
2,020 | 7,590 | 199 | |||||||||
| Member distributions payable |
— | — | 7,089 | |||||||||
| Liability for loans eligible for repurchase |
71,608 | 39,840 | 5,311 | |||||||||
| Capital lease obligations |
14,388 | 11,170 | 6,104 | |||||||||
| Debt obligations |
128,754 | 103,000 | 80,000 | |||||||||
|
|
|
|
|
|
|
|||||||
| Total liabilities |
1,786,222 | 1,181,162 | 860,028 | |||||||||
| Total redeemable units |
91,675 | 69,225 | 64,024 | |||||||||
| Total unitholders’ equity |
198,479 | 119,968 | 99,285 | |||||||||
|
|
|
|
|
|
|
|||||||
| Total liabilities, redeemable units and unitholders’ equity |
$ | 2,076,376 | $ | 1,370,356 | $ | 1,023,337 | ||||||
|
|
|
|
|
|
|
|||||||
June 30, 2015 Compared to December 31, 2014
Assets
Cash and Cash Equivalents. Cash and cash equivalents were $53.4 million as of June 30, 2015, as compared to $28.6 million as of December 31, 2014, representing an increase of $24.7 million or 86%. The increase between periods was primarily the result of net income generated in the first six months of 2015, proceeds from the sales of servicing rights, proceeds from financing of servicing rights and proceeds from capital contributions from related parties (see “Certain Relationships and Related Party Transactions—Purchase of Premium Holdco Units and Class B Common Stock and Redemption of Class A Common Stock”).
Restricted Cash. Restricted cash was $3.2 million as of June 30, 2015, as compared to $9.1 million as of December 31, 2014, representing a decrease of $5.9 million or 65%. The decrease between periods was primarily the result of a reduction in cash collateral posted for our Unsecured Term Loan.
111
Table of Contents
Accounts Receivable, Net. Accounts receivable, net, was $39.4 million as of June 30, 2015, as compared to $18.8 million as of December 31, 2014, representing an increase of $20.7 million or 110%. The increase between periods was primarily the result of increased holdback receivables from loan sales and sales of servicing rights and an increase in realized pair-off gains receivable from our Hedging Instruments.
Loans Held for Sale, at Fair Value. Loans held for sale, at fair value, were $1.5 billion as of June 30, 2015, as compared to $1.0 billion as of December 31, 2014, representing an increase of $500.4 million or 50%. The increase between periods was primarily the result of increased loan originations driven by our acquisition of Mortgage Master in January 2015 and the growth of our wholesale channel. For the six months ended June 30, 2015, we originated and sold $14.3 billion and $13.8 billion, respectively, in loans.
Derivative Assets, at Fair Value. Derivative assets, at fair value, were $87.4 million as of June 30, 2015, as compared to $52.9 million as of December 31, 2014, representing an increase of $34.6 million or 65%. The increase between periods was primarily the result of increased IRLCs and Hedging Instruments entered into as a result of increased loan commitments associated with the growth in our lending operation and acquisition of Mortgage Master in January 2015. During the six months ended June 30, 2015, we recorded record IRLC volume with over $23.9 billion in IRLCs for an average of over 15,000 units per month.
Servicing Rights, at Fair Value. Servicing rights, at fair value, were $194.1 million as of June 30, 2015, as compared to $138.8 million as of December 31, 2014, representing an increase of $55.3 million or 40%. The increase between periods was primarily the result of $148.0 million in capitalized servicing rights from the sale of loans on a servicing retained basis and a $2.1 million increase in estimated fair value due to changes in assumptions, partially offset by a $73.5 million reduction in servicing rights from the sale of $7.4 billion in UPB of servicing rights, $17.6 million in principal amortization and prepayments and $3.7 million in realized losses on servicing rights sales during the six months ended June 30, 2015.
Property and Equipment, Net. Property and equipment, net, was $50.1 million as of June 30, 2015, as compared to $36.3 million as of December 31, 2014, representing an increase of $13.8 million or 38%. The increase between periods was primarily the result of the capitalization of internally developed software cost associated with the expansion of our proprietary technology, capital expenditures associated with the growth of our company and additional property and equipment related to our acquisition of Mortgage Master in January 2015.
Prepaid Expenses and Other Assets. Prepaid expenses and other assets were $15.0 million as of June 30, 2015, as compared to $10.4 million as of December 31, 2014, representing an increase of $4.7 million or 45%. The increase between periods was primarily the result of increases in prepaid marketing and other expenses associated with the growth of our servicing portfolio, security deposits and other assets related to our acquisition of Mortgage Master in January 2015.
Loans Eligible for Repurchase. Loans eligible for repurchase were $71.6 million as of June 30, 2015, as compared to $39.8 million as of December 31, 2014, representing an increase of $31.8 million or 80%. The increase between periods is due to an increase in loans 90 or more days past due and represent loans that we have the unilateral right to repurchase from Ginnie Mae guaranteed securitizations as part of our contractual arrangements as the servicer of the loans.
Investments in Joint Ventures. Investments in joint ventures were $16.7 million as of June 30, 2015, as compared to $16.8 million as of December 31, 2014, representing a decrease of $0.1 million or 1%. The decrease between periods was primarily the result of a loss incurred on one of our joint ventures during the six months ended June 30, 2015.
Goodwill. Goodwill was $35.4 million as of June 30, 2015, as compared to $10.9 million as of December 31, 2014, representing an increase of $24.5 million or 225%. The increase between periods was the
112
Table of Contents
result of our acquisition of Mortgage Master in January 2015. We recorded $24.5 million of goodwill representing the excess of the purchase price over the fair value of the net assets and other identifiable intangible assets acquired.
Intangible Assets, Net. Intangible assets, net, were $5.4 million as of June 30, 2015, as compared to $3.8 million as of December 31, 2014, representing an increase of $1.6 million or 42%. The increase between periods was the result of our acquisition of Mortgage Master in January 2015, net of amortization for the six months ended June 30, 2015. As part of the acquisition, we acquired $1.8 million of intangible assets related to trademarks, trade names and non-compete agreements. We recorded $0.2 million in amortization expense during the six months ended June 30, 2015 associated with intangible assets acquired in the imortgage and Mortgage Master acquisitions.
Liabilities, Redeemable Units and Unitholders’ Equity
Warehouse Lines of Credit. Warehouse lines of credit were $1.4 billion as of June 30, 2015, as compared to $938.6 million as of December 31, 2014, representing an increase of $472.2 million or 50%. The increase between periods was primarily the result of increased loan originations across all of our channels with the distributed retail channel benefitting from our acquisition of Mortgage Master in January 2015. For the six months ended June 30, 2015, we originated and sold $14.3 billion and $13.8 billion, respectively, in loans. We increased our borrowing capacity under our Warehouse Lines to $2.2 billion during the six months ended June 30, 2015 with existing lenders.
Accrued Expenses and Other Liabilities. Accrued expenses and other liabilities were $130.6 million as of June 30, 2015, as compared to $80.9 million as of December 31, 2014, representing an increase of $49.6 million or 61%. The increase between periods was primarily the result of increases in accrued expenses and other liabilities related to the growth of our business and our acquisition of Mortgage Master in January 2015. As part of the acquisition, we entered into $15.5 million in Seller Notes payable to Mortgage Master as part of purchase consideration. We made $2.1 million in principal payments which reduced the outstanding principal balance of Seller Notes to $13.4 million at June 30, 2015. Accrued loan origination costs and loan loss obligations increased $13.3 million and $3.6 million, respectively, due to growth in loan originations and loan sales during the period. Additionally, we accrued $2.9 million in litigation related liabilities during the six months ended June 30, 2015.
Contingent Consideration. Contingent consideration was $28.1 million as of June 30, 2015, as compared to $0 as of December 31, 2014. The increase between periods was primarily the result of our acquisition of Mortgage Master in January 2015. On the acquisition date, we recorded $26.9 million in contingent consideration. At June 30, 2015, we recorded a $1.2 million increase to the estimated fair value of the contingent consideration liability primarily due to an improvement in Mortgage Masters’ pre-tax earnings since the acquisition.
Derivative Liabilities, at Fair Value. Derivative liabilities, at fair value, were $2.0 million as of June 30, 2015, as compared to $7.6 million as of December 31, 2014, representing a decrease of $5.6 million or 73%.
Liability for Loans Eligible for Repurchase. Liability for loans eligible for repurchase was $71.6 million as of June 30, 2015, as compared to $39.8 million as of December 31, 2014. The increase between periods is due to an increase in loans 90 or more days past due and represent loans that we have the unilateral right to repurchase from Ginnie Mae guaranteed securitizations as part of our contractual arrangements as the servicer of the loans.
Capital Lease Obligations. Capital lease obligations were $14.4 million as of June 30, 2015, as compared to $11.2 million as of December 31, 2014, representing an increase of $3.2 million or 29%. The increase between periods was primarily the result of additional equipment financing to facilitate the growth of our business.
Debt Obligations. Debt obligations were $128.8 million as of June 30, 2015, as compared to $103.0 million as of December 31, 2014, representing an increase of $25.8 million or 25%. The increase between periods was
113
Table of Contents
primarily the result of a $26.1 million advance on servicing rights associated with a Warehouse Line that provides financing for both home loans and servicing rights. The Warehouse Line contains a $50.0 million sub-limit for the financing of servicing rights. The increase in debt obligations was partially offset by a $0.4 million reduction in our Original Secured Credit Facility due to principal reductions. At June 30, 2015, the balance of our Original Secured Credit Facility was $22.6 million, as compared to $23.0 million at December 31, 2014.
Redeemable Units and Unitholders’ Equity. Total redeemable units and unitholders’ equity were $91.7 million and $198.5 million as of June 30, 2015, as compared to $69.2 million and $120.0 million as of December 31, 2014, representing increases of $22.5 million or 32%, and $78.5 million or 65%. The increases between periods were primarily the result of $69.2 million of net income generated in the first six months of 2015, $20.0 million in capital contributions received from related parties in a private placement issuance and $11.9 million in equity compensation. See “Certain Relationships and Related Party Transactions—Purchase of Premium Holdco Units and Class B Common Stock and Redemption of Class A Common Stock.”
December 31, 2014 Compared to December 31, 2013
Assets
Cash and Cash Equivalents. Cash and cash equivalents were $28.6 million as of December 31, 2014, as compared to $40.9 million as of December 31, 2013, representing a decrease of $12.2 million or 30%. The decrease between periods was primarily the result of cash used for haircuts to fund the increased balances of LHFS funded on our Warehouse Lines. Additionally, we sold more loans on a servicing-retained basis resulting in an increase in our use of cash to fund investment in servicing rights. Partially offsetting the decreases were increases in cash from net income generated in 2014 and shares issued through equity compensation plans.
Restricted Cash. Restricted cash was $9.1 million as of December 31, 2014, as compared to $17.7 million as of December 31, 2013, representing a decrease of $8.6 million or 48%. The decrease between periods was primarily the result of the release of funds held in the reserve account for the Unsecured Term Loan. Restricted cash was subsequently released to support the full draw on the Unsecured Term Loan as additional servicing rights collateral was pledged in the first quarter of 2014.
Accounts Receivable, Net. Accounts receivable, net, was $18.8 million as of December 31, 2014, as compared to $12.8 million as of December 31, 2013, representing an increase of $6.0 million or 47%. The increase between periods was primarily the result of increased holdback receivables from loan sales and sales of servicing rights. Partially offsetting the increase was a decrease in pair-off gains receivable from our Hedging Instruments.
Loans Held for Sale, at Fair Value. Loans held for sale, at fair value, were $1.0 billion as of December 31, 2014, as compared to $741.5 million as of December 31, 2013, representing an increase of $262.7 million or 35%. The increase between periods was primarily the result of increased loan originations driven by our acquisition of imortgage in October 2013 and the growth of our wholesale channel. For the year ended December 31, 2014, we originated and sold $13.2 billion and $12.9 billion, respectively, in loans.
Derivative Assets, at Fair Value. Derivative assets, at fair value, were $52.9 million as of December 31, 2014, as compared to $44.6 million as of December 31, 2013, representing an increase of $8.3 million or 19%. The increase between periods was primarily the result of increased IRLCs and Hedging Instruments entered into as a result of increased loan commitments associated with the growth in our lending operation and acquisition of imortgage in October 2013 as well as the growth of our wholesale channel. As of December 31, 2014, we had $2.3 billion in IRLCs outstanding with borrowers as compared to $1.4 billion as of December 31, 2013.
Servicing Rights, at Fair Value. Servicing rights, at fair value, were $138.8 million as of December 31, 2014, as compared to $93.8 million as of December 31, 2013, representing an increase of $45.0 million or 48%. The increase between periods was primarily the result of $133.1 million in servicing rights additions from
114
Table of Contents
servicing-retained loan sales, partially offset by a decrease of $62.1 million in servicing rights related to the sale of $5.3 billion in outstanding UPB of our loan servicing portfolio and a decrease of $26.0 million in servicing rights from unrealized mark-to-market losses related to a decline in interest rates during 2014.
Property and Equipment, Net. Property and equipment, net, was $36.3 million as of December 31, 2014, as compared to $27.0 million as of December 31, 2013, representing an increase of $9.3 million or 34%. The increase between periods was primarily the result of additional property and equipment related to our acquisition of imortgage in October 2013 and the growth of our lending operation.
Prepaid Expenses and Other Assets. Prepaid expenses and other assets were $10.4 million as of December 31, 2014, as compared to $6.7 million as of December 31, 2013, representing an increase of $3.6 million or 54%. The increase between periods was primarily the result of an increase of $1.7 million in servicing advances, associated with the growth in our servicing portfolio, to $2.4 million as of December 31, 2014, as compared to $0.7 million as of December 31, 2013 and other prepaid marketing costs related to the growth of our lending operation.
Loans Eligible for Repurchase. Loans eligible for repurchase were $39.8 million as of December 31, 2014, as compared to $5.3 million as of December 31, 2013. The increase between periods is due to an increase in loans 90 or more days past due and represent loans that we have the unilateral right to repurchase from Ginnie Mae guaranteed securitizations as part of our contractual arrangements as the servicer of the loans.
Investments in Joint Ventures. Investments in joint ventures were $16.8 million as of December 31, 2014, as compared to $18.1 million as of December 31, 2013, representing a decrease of $1.3 million or 7%. The decrease between periods was primarily the result of a loss incurred on one of our joint ventures during the year ended December 31, 2014, partially offset by income from an investment in a new joint venture during 2014.
Goodwill. Goodwill was $10.9 million as of December 31, 2014, as compared to $10.9 million as of December 31, 2013. As a result of our acquisition of imortgage in October 2013, we recorded $10.9 million of goodwill representing the excess of the purchase price over the fair value of the net assets and other identifiable intangible assets acquired.
Intangible Assets, Net. Intangible assets, net, were $3.8 million as of December 31, 2014, as compared to $4.1 million as of December 31, 2013, representing a decrease of $0.3 million or 8%. The decrease between periods was the result of the amortization of intangible assets related to our acquisition of imortgage in October 2013. As part of the acquisition, intangible assets consisted primarily of trademarks and a non-compete agreement. Intangible assets with definite lives are amortized over their estimated lives.
Liabilities, Redeemable Units and Unitholders’ Equity
Warehouse Lines of Credit. Warehouse lines of credit were $938.6 million as of December 31, 2014, as compared to $697.8 million as of December 31, 2013, representing an increase of $240.9 million or 35%. The increase between periods was primarily the result of increased loan originations across all of our channels with the distributed retail channel that was launched by our acquisition of imortgage in October 2013. For the year ended December 31, 2014, we originated and sold $13.2 billion and $12.9 billion, respectively, in loans. We increased our borrowing capacity during 2014 by entering into one new Warehouse Line agreement providing $125.0 million in additional borrowing capacity.
Accrued Expenses and Other Liabilities. Accrued expenses and other liabilities were $80.9 million as of December 31, 2014, as compared to $63.6 million as of December 31, 2013, representing an increase of $17.4 million or 27%. The increase between periods was primarily the result of increases in accrued expenses and other liabilities related to our acquisition of imortgage in October 2013. Additionally, the increase is due to increased accrued operating expenses and escrow liabilities associated with the growth in our lending operations and servicing portfolio.
115
Table of Contents
Derivative Liabilities, at Fair Value. Derivative liabilities, at fair value, were $7.6 million as of December 31, 2014, as compared to $0.2 million as of December 31, 2013, representing an increase of $7.4 million. The increase in Hedging Instruments between periods was primarily the result of increased IRLCs and LHFS associated with the growth in our lending operation and acquisition of imortgage in October 2013.
Liability for Loans Eligible for Repurchase. Liability for loans eligible for repurchase was $39.8 million as of December 31, 2014, as compared to $5.3 million as of December 31, 2013. The increase between periods is due to an increase in loans 90 or more days past due and represent loans that we have the unilateral right to repurchase from Ginnie Mae guaranteed securitizations as part of our contractual arrangements as the servicer of the loans.
Capital Lease Obligations. Capital lease obligations were $11.2 million as of December 31, 2014, as compared to $6.1 million as of December 31, 2013, representing an increase of $5.1 million or 83%. The increase between periods was primarily the result of an increase in capital leases associated with capital expenditures for the growth of our lending operations.
Debt Obligations. Debt obligations were $103.0 million as of December 31, 2014, as compared to $80.0 million as of December 31, 2013, representing an increase of $23.0 million or 29%. The increase between periods was the result of entering into our Original Secured Credit Facility in October 2014. As of December 31, 2014, our Original Secured Credit Facility balance was $23.0 million.
Redeemable Units and Unitholders’ Equity. Total redeemable units and unitholders’ equity were $69.2 million and $120.0 million as of December 31, 2014, as compared to $64.0 million and $99.3 million as of December 31, 2013, representing increases of $5.2 million or 8%, and $20.7 million or 21%. The increases between periods were primarily the result of $21.7 million of net income generated in 2014 and $5.3 million in shares issued through equity compensation plans, partially offset by $1.1 million in capital distributions.
Liquidity and Capital Resources
Liquidity
Our liquidity reflects our ability to meet our current obligations (including our operating expenses and, when applicable, the retirement of our debt and margin calls relating to our Hedging Instruments, Warehouse Lines and Secured Credit Facilities), fund new originations and purchases and make investments as we identify them. We forecast the need to have adequate liquid funds available to operate and grow our business. As of June 30, 2015, unrestricted cash and cash equivalents were $53.3 million and committed and uncommitted available capacity under our Warehouse Lines was $753.1 million.
Sources and Uses of Cash
Our primary sources of liquidity have been as follows: (i) funds obtained from our Warehouse Lines; (ii) proceeds from other financing arrangements described under “—Debt Obligations” below; (iii) proceeds received from the sale and securitization of loans; (iv) proceeds from the sale of servicing rights; (v) loan fees from the origination of loans; (vi) servicing fees; (vii) interest payments from LHFS; and (viii) proceeds from private placement issuances.
Our primary uses of funds for liquidity have included the following: (i) funding new loans; (ii) funding loan origination costs; (iii) payment of Warehouse Line haircuts required at loan origination; (iv) payment of interest expense on Warehouse Lines; (v) payment of interest expense under other financing arrangements described under “—Debt Obligations” below; (vi) payment of operating expenses; (vii) repayment of Warehouse Lines; (viii) repayment of other financing arrangements described under “—Debt Obligations” below; (ix) funding of servicing advances; (x) margin calls on Warehouse Lines or Hedging Instruments; (xi) payment of distributions and other amounts due to the holders of Class I common units; (xii) repurchases of loans under representation and warranty breaches; and (xiii) costs relating to subservicing.
116
Table of Contents
We rely on the secondary mortgage market as a source of long-term capital to support our home lending operations. Substantially all of the home loans that we originate are sold in the secondary mortgage market to Fannie Mae or Freddie Mac or, in the case of mortgage-backed securities guaranteed by Ginnie Mae, are home loans insured or guaranteed by the FHA or VA. We also sell loans to many private investors.
At this time, we believe that there are no material market trends that would affect our access to long-term or short-term borrowings sufficient to maintain our current operations, or that would likely cause us to cease to be in compliance with applicable covenants for our indebtedness or that would inhibit our ability to fund our loan operations and capital commitments for the next twelve months. However, should those trends change, we believe we could retain less or sell additional servicing rights, scale back growth or take other actions to mitigate any significant increase in demands on our liquidity.
We do not originate personal loans, but rather these loans are originated by our issuing bank partner and then sold by such partner to third party investors. Accordingly, we do not utilize our capital resources for our personal loans. However, our ability to grow the personal loan business will depend upon the availability of third-party investors to purchase such loans when funded. Our issuing bank currently has commitments from two third-party investors for these purposes. Further investor commitments will be necessary in order for us to continue to facilitate personal loans once the existing commitments are satisfied or expire.
Cash Flows
The following table summarizes the net cash provided by (used in) operating activities, investing activities and financing activities for the periods indicated:
| Six Months Ended June 30, |
Year Ended December 31, |
|||||||||||||||
| 2015 | 2014 | 2014 | 2013 | |||||||||||||
| (Dollars in thousands) | ||||||||||||||||
| Statement of Operation Data: |
|
|||||||||||||||
| Net cash used in operating activities |
$ | (559,772 | ) | $ | (162,923 | ) | $ | (314,555 | ) | $ | (217,083 | ) | ||||
| Net cash provided by (used in) investing activities |
69,729 | 20,797 | 44,215 | (34,026 | ) | |||||||||||
| Net cash provided by financing activities |
514,756 | 125,466 | 258,091 | 264,349 | ||||||||||||
Operating Activities
During the six months ended June 30, 2015, net cash used in operating activities was $559.8 million, compared to $162.9 million during the six months ended June 30, 2014. The increase in cash used in operating activities during the six months ended June 30, 2015 was primarily driven by a net $662.4 million use of cash due to loan originations in excess of loan sales during the period as we grew our loans held for sale to $1.5 billion at June 30, 2015 as compared to $1.0 billion at December 31, 2014. The increase in cash used was partially offset by $69.2 million in net income, $15.6 million in fair value changes in servicing rights and $8.7 million in principal payments on home loans.
During 2014, net cash used in operating activities was $314.6 million, compared to $217.1 million during 2013. The increase in cash used in operating activities during 2014 was primarily driven by a net $382.0 million use of cash due to loan originations in excess of loan sales during the period as we grew our loans held for sale to $1.0 billion at December 31, 2014 as compared to $741.5 million at December 31, 2013. The increase in cash used was partially offset by $21.7 million in net income, $8.8 million in principal payments on home loans and $8.6 million in reductions of restricted cash.
Investing Activities
During the six months ended June 30, 2015, net cash flows provided by investing activities was $69.7 million, compared to $20.8 million during the six months ended June 30, 2014. The increase in net cash
117
Table of Contents
flows provided by investing activities during the six months ended June 30, 2015 was driven by $73.5 million of proceeds from sale of servicing rights, $4.9 million of cash received net of cash paid for acquisition of Mortgage Master and $3.4 million of disbursements from joint ventures, partially offset by $12.1 million used in purchases of property and equipment.
During 2014, net cash flows provided by investing activities was $44.2 million, as compared to net cash used in investing activities of $34.0 million during 2013. The increase in net cash flows provided by investing activities during 2014, was driven by $60.9 million of net change in proceeds from sale and purchase of servicing rights and $1.3 million of disbursements from joint ventures, partially offset by $18.0 million used in purchases of property and equipment.
Financing Activities
During the six months ended June 30, 2015, cash provided by financing activities was $514.8 million, compared to $125.5 million during the six months ended June 30, 2014. The increase in cash provided by financing activities during the six months ended June 30, 2015 was driven by $472.2 million of net changes in Warehouse Lines, $54.2 million of proceeds from debt obligations and $20.0 million of contributed capital from members, partially offset by $28.5 million of payments on debt obligations and $3.1 million of payments on capital lease obligation.
During 2014, net cash provided by financing activities was $258.1 million, as compared to $264.3 million during 2013. The decrease in cash provided by financing activities during 2014, was driven by $240.9 million of net changes in Warehouse Lines, $23.0 million of proceeds from debt obligations, $7.2 million of proceeds from sale-leaseback transactions and $0.8 million of contributed capital from members, partially offset by distributions to common unitholders of $8.2 million, payments on capital lease obligations of $4.8 million, and $0.7 million of payments on repurchase of units.
Warehouse Lines
We finance most of our loan originations on a short-term basis using our Warehouse Lines. Under our Warehouse Lines, we agree to transfer certain loans to our counterparties against the transfer of funds by them, with a simultaneous agreement by the counterparties to transfer the loans back to us at the date loans are sold, or on demand by us, against the transfer of funds from us. We typically repurchase the loans within 15 to 20 days of funding. Our Warehouse Lines are short-term borrowings which mature in less than one year. We utilize both committed and uncommitted loan funding facilities and we evaluate our needs under these facilities based on forecasted volume of loan originations and sales.
As of June 30, 2015, we had $2.2 billion of capacity under our Warehouse Lines with maturities staggered throughout the remainder of 2015 and 2016. As of June 30, 2015, we maintained Warehouse Lines with eight counterparties. As of June 30, 2015, we had $1.4 billion of borrowings outstanding under these facilities and $412.0 million of additional availability under our facilities.
When we draw on the Warehouse Lines, we must pledge eligible loan collateral and make a capital investment, or “haircut,” upon financing the loans, which is generally determined by the type of collateral provided and the Warehouse Line terms. Our loan originations on Warehouse Lines require a haircut generally between 1% and 5% of the outstanding principal balance of the loans. The haircuts are normally recovered from sales proceeds. With the expected future increase in loan origination volumes, we will be required to use additional capital for haircuts and increase our restricted cash balances with our warehouse lenders. As of June 30, 2015, we had $3.3 million in restricted cash posted as additional collateral as compared to $2.4 million as of December 31, 2014.
118
Table of Contents
The table below summarizes our Warehouse Lines and their expiration dates as of June 30, 2015 ($ in thousands):
| Outstanding Balance | ||||||||||||||||||||||||||
| Committed Amount |
Uncommitted Amount |
Total Facility Amount |
Expiration Date |
June 30, 2015 |
December 31, 2014 |
December 31, 2013 |
||||||||||||||||||||
| Facility 1(1) |
$ | — | $ | 500,000 | $ | 500,000 | 12/16/2015 | $ | 158,945 | $ | 107,758 | $ | 4,003 | |||||||||||||
| Facility 2(2)(3) |
— | 300,000 | 300,000 | 07/17/2015 | 269,335 | 194,896 | 244,486 | |||||||||||||||||||
| Facility 3 |
150,000 | 400,000 | 550,000 | 04/26/2016 | 505,560 | 330,208 | 240,238 | |||||||||||||||||||
| Facility 4(4) |
150,000 | — | 150,000 | 03/17/2016 | 88,735 | 104,886 | — | |||||||||||||||||||
| Facility 5(5) |
100,000 | 25,000 | 125,000 | 09/07/2015 | 98,477 | 41,102 | 83,993 | |||||||||||||||||||
| Facility 6(6) |
— | 115,000 | 115,000 | 07/30/2015 | 87,573 | 96,834 | 73,535 | |||||||||||||||||||
| Facility 7(7) |
200,000 | — | 200,000 | 08/14/2015 | 76,871 | 14,804 | — | |||||||||||||||||||
| Facility 8(8) |
— | 250,000 | 250,000 | N/A | 125,298 | 48,130 | 51,501 | |||||||||||||||||||
|
|
|
|
|
|
|
|
|
|
|
|
|
|||||||||||||||
| Total(9) |
$ | 600,000 | $ | 1,590,000 | $ | 2,190,000 | $ | 1,410,794 | $ | 938,618 | $ | 697,756 | ||||||||||||||
|
|
|
|
|
|
|
|
|
|
|
|
|
|||||||||||||||
| (1) | The total facility is available both to fund loan originations and also provide liquidity under a gestation facility for recently sold MBS up to the MBS settlement date. |
| (2) | In July 2015, the facility was renewed and extended to July 15, 2016. |
| (3) | In addition to the $300.0 million Warehouse Line, the lender provides a separate $150.0 million gestation facility to finance recently sold MBS up to the MBS settlement date. |
| (4) | In May 2015, we amended this facility to provide a $50.0 million sub-limit to finance our investment in servicing rights. For more information, see “—Debt Obligations—Secured Credit Facilities—New Secured Credit Facility” below. |
| (5) | In October 2015, the expiration date was extended to October 21, 2016. |
| (6) | In September 2015, the facility was increased to $150.0 million and the expiration date was extended to June 19, 2016. |
| (7) | In October 2015, the facility was increased to $300.0 million and the expiration date was extended to October 2016. |
| (8) | In addition to the $250.0 million Warehouse Line, the lender provides a separate gestation facility to finance recently sold MBS up to the MBS settlement date. |
| (9) | In August 2015, we entered into a new Warehouse Line providing a $100.0 million line of credit with an expiration date of August 2016. Additionally, in September 2015, we entered into a new Warehouse Line providing a $200.0 million line of credit with an expiration date of August 2016. |
Interest on our Warehouse Lines varies by facility and depends on the type of loan that is being financed or the period of time that a loan is transferred to our Warehouse Line counterparty. As of June 30, 2015, interest expense under our Warehouse Lines was generally based on one-month LIBOR plus a margin and in some cases a minimum interest rate and certain commitment and utilization fees apply.
Under our Warehouse Lines, interest is payable monthly in arrears or on the repurchase date of a loan, and outstanding principal is payable upon receipt of loan sale proceeds or on the repurchase date of a loan. Outstanding principal related to a particular loan must also be repaid after the expiration of a contractual period of time or, if applicable, upon the occurrence of certain events of default with respect to the underlying loan.
Our Warehouse Lines require us to comply with various financial covenants including tangible net worth, liquidity, leverage ratios and net income. As of June 30, 2015, December 31, 2014 and 2013, we were in compliance with all of our warehouse lending covenants.
Although these financial covenants limit the amount of indebtedness that we may incur and affect our liquidity through minimum cash reserve requirements, we believe that these covenants currently provide us with sufficient flexibility to successfully operate our business and obtain the financing necessary to achieve that purpose.
119
Table of Contents
Debt Obligations
Seller Notes
In January 2015, we issued to Mortgage Master four promissory notes in the original aggregate principal amount of $11.3 million. During June 2015, the Seller Notes were increased by an aggregate principal amount of $4.3 million. The Seller Notes accrued interest at a rate of 5.0% per annum through June 2, 2015 and accrue interest at a rate of 10.0% per annum from June 2, 2015 to maturity. The Seller Notes mature on the earlier of December 31, 2015 and the occurrence of certain specified events unless otherwise extended. As of June 30, 2015, $13.4 million in the aggregate was outstanding under the Seller Notes. We expect to repay the Seller Notes in full with the net proceeds to us from this offering. See “Use of Proceeds.”
Secured Credit Facilities
Original Secured Credit Facility. In October 2014, we entered into a $25.0 million secured revolving line of credit for working capital purposes, which was increased to $42.5 million in June 2015 and later reduced to $30.0 million in August 2015. The Original Secured Credit Facility is collateralized by servicing rights, matures in October 2016 unless otherwise extended and accrues interest at a base rate per annum of one-month LIBOR plus a margin. We use amounts borrowed under the Original Secured Credit Facility to retain servicing rights and for other working capital needs and general corporate purposes. As of June 30, 2015, $22.6 million was outstanding under the Original Secured Credit Facility. Under the Original Secured Credit Facility, we are required to satisfy certain financial covenants, including minimum tangible net worth, minimum liquidity, maximum leverage and debt service coverage. As of June 30, 2015, we were in compliance with all such covenants.
New Secured Credit Facility. In May 2015, we amended one of our Warehouse Lines to provide a $50.0 million sub-limit to finance our investment in servicing rights, which we refer to as the New Secured Credit Facility. The total capacity under that Warehouse Line facility is $150.0 million and is available to fund a combination of loans and servicing rights, subject to the $50.0 million sub-limit. Certain servicing rights are posted as collateral and secure outstanding advances related to the sub-limit. At June 30, 2015, we had $26.1 million outstanding under the New Secured Credit Facility. Under the New Secured Credit Facility, we are required to satisfy certain financial covenants, including minimum tangible net worth, minimum liquidity, maximum leverage and profitability requirements. As of June 30, 2015, we were in compliance with all such covenants.
Unsecured Term Loan
In October 2013, we entered into an $80.0 million unsecured term loan facility. The Unsecured Term Loan matures in October 2016 and accrues interest at a rate per annum ranging from 11.0% to 12.75%. We used the proceeds under the Unsecured Term Loan to fund the acquisition of imortgage, the retention of servicing rights and for working capital and general corporate purposes. As of June 30, 2015, $80.0 million was outstanding under the Unsecured Term Loan. Under the Unsecured Term Loan, we are required to satisfy certain financial covenants, including minimum tangible net worth, minimum liquidity and maximum consolidated leverage. As of June 30, 2015, we were in compliance with all such covenants.
Subordinated Notes
In September 2013, we entered into two subordinated short-term note agreements (the “Subordinated Notes”) with related parties pursuant to which we borrowed an aggregate amount of $15.0 million at an interest rate per annum of 15.0%. The Subordinated Notes were repaid in full in October 2013 with proceeds from the Unsecured Term Loan.
120
Table of Contents
Capital Lease Transactions
In 2013 and 2014, we entered into agreements with an institution to sell and leaseback certain equipment. We received $3.2 million and $7.2 million in 2013 and 2014, respectively, pursuant to these arrangements and recorded capital lease obligations in the same amounts. The capital leases have terms of three years and have effective interest rates of 7.75% (for the $3.2 million capital lease obligation) and 5.00% (for the $7.0 million capital lease obligation). We have the option to repurchase the leased equipment at the end of the leases.
Margin Calls
Our Hedging Instruments, Warehouse Lines and Secured Credit Facilities contain margin call provisions that, upon notice from the applicable lender at its option, require us to transfer cash or, in some instances, additional assets in an amount sufficient to eliminate any margin deficit. A margin deficit will generally result from any decline in the market value (as determined by the applicable lender) of the assets subject to the related financing agreement. Upon notice from the applicable lender, we will generally be required to satisfy the margin call on the day of such notice or within one business day thereafter, depending on the timing of the notice.
Contractual Obligations and Commitments
Our estimated contractual obligations as of December 31, 2014 are as follows ($ in thousands):
| Payments Due by Period(1) | ||||||||||||||||||||
| Total | Less than 1 Year |
1-3 years | 3-5 Years | More than 5 Years |
||||||||||||||||
| Secured Credit Facilities(2) |
$ | 23,000 | $ | 23,000 | $ | — | $ | — | $ | — | ||||||||||
| Warehouse Lines |
938,617 | 938,617 | — | — | — | |||||||||||||||
| Unsecured Term Loan |
80,000 | — | 80,000 | — | — | |||||||||||||||
| Operating lease obligations(3) |
57,042 | 14,269 | 22,321 | 16,074 | 4,378 | |||||||||||||||
| Capital lease obligations(4) |
12,174 | 6,058 | 6,109 | 7 | — | |||||||||||||||
|
|
|
|
|
|
|
|
|
|
|
|||||||||||
| Total contractual obligations |
$ | 1,110,833 | $ | 981,944 | $ | 108,430 | $ | 16,081 | $ | 4,378 | ||||||||||
|
|
|
|
|
|
|
|
|
|
|
|||||||||||
| (1) | Table does not include (i) contingent consideration (subject to a cap of $50.0 million) or the Seller Notes associated with the acquisition of Mortgage Master in January 2015 or (ii) amounts that may be payable to the holders of Class I common units pursuant to the Settlement Agreement and the Holdings LLC Agreement. See “—Key Factors Influencing Our Results of Operations—Acquisitions and Industry Partnerships—Acquisition of Mortgage Master,” “—Debt Obligations—Seller Notes” and “Certain Relationships and Related Party Transactions—imortgage Settlement Agreement.” |
| (2) | In May 2015, we amended one of our Warehouse Lines to provide a $50.0 million sub-limit to finance servicing rights, which we refer to as the New Secured Credit Facility. At June 30, 2015, $26.1 million was outstanding under the New Secured Credit Facility. |
| (3) | Represents lease obligations for office space under non-cancelable operation lease agreements. |
| (4) | Represents lease obligations for equipment under non-cancelable capital lease agreements. |
In addition to the above contractual obligations, we also had commitments to originate loans of $2.3 billion as of December 31, 2014. Commitments to originate loans do not necessarily reflect future cash requirements as some commitments are expected to expire without being drawn upon and, therefore, those commitments have been excluded from the table above.
Off-Balance Sheet Arrangements
As of June 30, 2015, we were party to mortgage loan participation purchase and sale agreements, pursuant to which we have access to uncommitted facilities that provide liquidity for recently sold MBS up to the MBS settlement date. These facilities, which we refer to as gestation facilities, are a component of our financing strategy and are off-balance sheet arrangements. See “—Liquidity and Capital Resources—Warehouse Lines” for more information regarding these gestation facilities.
121
Table of Contents
Critical Accounting Policies and Estimates
We prepare our consolidated financial statements in accordance with GAAP, which requires us to make judgments, estimates and assumptions that affect: (i) the reported amounts of our assets and liabilities; (ii) the disclosure of our contingent assets and liabilities at the end of each reporting period; and (iii) the reported amounts of revenues and expenses during each reporting period. We continually evaluate these judgments, estimates and assumptions based on our own historical experience, knowledge and assessment of current business and other conditions and our expectations regarding the future based on available information which together form our basis for making judgments about matters that are not readily apparent from other sources. Since the use of estimates is an integral component of the financial reporting process, our actual results could differ from those estimates. Some of our accounting policies require a higher degree of judgment than others in their application.
When reading our consolidated financial statements, you should consider our selection of critical accounting policies, the judgment and other uncertainties affecting the application of such policies and the sensitivity of reported results to changes in conditions and assumptions. We believe the following accounting policies involve the most significant judgments and estimates used in the preparation of our consolidated financial statements.
Loans Held-for-Sale
Loans that are intended to be sold in the foreseeable future, including residential home loans, are reported as LHFS. We account for LHFS under the fair value option. Fair value of LHFS is typically calculated using observable market information, including pricing from actual market transactions or observable market prices from other loans that have similar collateral, credit, and interest rate characteristics. Gains or losses from the sale of loans are recognized based upon the difference between the selling price and fair value of the related loans upon the sale of such loans.
In order to facilitate the origination and sale of loans, we have entered into various agreements with warehouse lenders. These agreements are in the form of loan participations and repurchase agreements with banks and other financial institutions. LHFS are considered sold when we surrender control over the financial assets and those financial assets are legally isolated from us in the event of our bankruptcy. We account for all repurchase agreements as secured borrowings.
Servicing Rights
Servicing rights are non-financial assets that are created (i) in the case of home loans, when the loan is sold and we retain the right to service the loan, and (ii) in the case of personal loans, when the investor assigns to us the servicing right for the loan. Servicing of loans includes payment processing, remittance of funds to investors, collection of delinquent payments, and, in the case of home loans, payment of taxes and insurance and disposition of foreclosed properties. In return for these services, we receive servicing fee income and ancillary fee income. The servicing rights are initially recorded at fair value, which is estimated by using a valuation model that calculates the present value of estimated future net servicing cash flows. The valuation model incorporates assumptions that market participants would use in estimating future net servicing income, including estimates of the cost of servicing, the discount rate, the float value, the inflation rate, estimated prepayment speeds and default rates. We use a dynamic model to estimate the fair value of our servicing rights.
We have elected to account for the measurement of servicing rights using the fair value method, whereby the servicing rights are initially recorded on our balance sheet at fair value with subsequent changes in fair value recorded in earnings during the period in which the changes in fair value occur. We believe that accounting for servicing rights at fair value best reflects the impact of current market conditions on our servicing rights, and our investors and other users of our financial statements will have greater insight into management’s views as to the value of our servicing rights at each reporting date. The fair value of the servicing rights is assessed at each reporting date using the methods described above.
122
Table of Contents
Fair Value of Financial Instruments
We use fair value measurements in fair value disclosures and to record certain assets and liabilities at fair value on a recurring basis (such as servicing rights, IRLCs, LHFS and Hedging Instruments). We have elected fair value accounting for servicing rights and LHFS, as permitted under current accounting guidance, to more closely align our accounting with our interest rate risk management strategies.
When observable market prices do not exist for our financial instruments, we estimate fair value primarily by using cash flow and other valuation models. Our valuation models may include adjustments, such as market liquidity and credit quality, where appropriate. Valuations of products using models or other techniques are sensitive to assumptions used for the significant inputs. The process for determining fair value using unobservable inputs, such as discount rates, prepayment speeds, default rates and cost of servicing, is generally more subjective and involves a higher degree of management judgment and assumptions than the measurement of fair value using observable inputs. These judgments and assumptions may have a significant effect on our measurements of fair value, and the use of different judgments and assumptions, as well as changes in market conditions, could have a material effect on our statements of operations as well as our balance sheets.
Reserve for Loan Loss Obligations
Loans sold to investors by us and which met investor and Agency underwriting guidelines at the time of sale may be subject to repurchase or indemnification in the event of specific default by the borrower or subsequent discovery that underwriting standards were not met. In limited circumstances, the full risk of loss on loans sold is retained to the extent the liquidation of the underlying collateral is insufficient.
We establish a reserve for loan repurchases and indemnifications related to various representations and warranties that reflect management’s estimate of losses for loans for which we could have a repurchase obligation, whether or not we currently service those loans, based on a combination of factors. Such factors include the type of loan, the channel from which it came, LTV and other loan-related specifics. The process for determining the measurement of the liability involves certain unobservable inputs such as estimated repurchase demand and repurchases, and loss severity and is generally subjective and involves a high degree of management judgment and assumptions. These judgments and assumptions may have a significant effect on our measurements of the liability, and the use of different judgments and assumptions, as well as changes in market conditions, could have a material effect on our statements of operations as well as our balance sheets.
Derivative Financial Instruments
We enter into derivative instruments to serve the financial needs of our customers and to reduce our risk exposure to fluctuations in interest rates. For example, we enter into IRLCs with certain customers to originate residential home loans at specified interest rates and within a specified period of time. IRLCs on loans that are intended to be sold are accounted for as derivatives, with changes in fair value recorded in the consolidated statement of operations as part of gain on origination and sale of loans, net. The fair value of an IRLC is based upon changes in the fair value of the underlying loans estimated to be realizable upon sale into the secondary market. In estimating the fair value of an IRLC, we also adjust the fair value of the underlying loan to reflect the estimated percentage of commitments that will result in a closed loan; our estimate of this percentage will primarily vary based on the age of the underlying commitment, the underlying loan’s current status in the origination process and changes in loan interest rates.
The primary factor influencing the probability that a loan will fund within the terms of the IRLC, prior to a loan package being submitted to underwriting, is the change, if any, in interest rates subsequent to the commitment date. In general, the probability of funding increases if interest rates rise and decreases if interest rates fall. This is due primarily to the relative attractiveness of current interest rates compared to the applicant’s committed rate. Once a loan package is submitted to underwriting, the current status of the loan in the origination process is the primary factor influencing the probability that a loan will fund within the terms of the IRLC. Additionally, the probability that a loan will fund within the terms of the IRLC is influenced by the source of the application, age of the application, purpose of the loan (purchase or non-purchase) and the application approval rate.
123
Table of Contents
We manage the interest rate risk associated with our outstanding IRLCs and LHFS by entering into Hedging Instruments. For exchange-traded contracts, fair value is based on quoted market prices. For non-exchange traded contracts, fair value is based on dealer quotes, pricing models, and discounted cash flow methodologies. Fair value estimates also take into account counterparty credit risk and our own credit standing.
Business Combinations
Business combinations are accounted for under the acquisition method of accounting in accordance with Financial Accounting Standards Board (“FASB”) Accounting Standards Codification (“ASC”) Topic 805, “Business Combinations.” Under the acquisition method, the acquiring entity in a business combination recognizes the acquired assets and assumed liabilities at their estimated fair values as of the date of acquisition. Any excess of the purchase price over the fair value of net assets and other identifiable intangible assets acquired is recorded as goodwill. To the extent the fair value of net assets acquired, including other identifiable assets, exceeds the purchase price, a bargain purchase gain is recognized. Assets acquired and liabilities assumed which involve contingencies must also be recognized at their estimated fair value, provided such fair value can be determined during the measurement period. Acquisition-related costs, including severance, conversion and other restructuring charges, such as abandoned space accruals, are expensed. Results of operations of an acquired business are included in the statements of operations from the date of acquisition.
Equity-Based Compensation
In connection with this offering, our board of directors adopted the 2015 Omnibus Incentive Plan. The 2015 Omnibus Incentive Plan, which becomes effective as of the closing of this offering, reserves for issuance up to 14,705,882 shares of our Class A common stock (including any LTIP Units, which may be granted under the 2015 Omnibus Incentive Plan). Incentive stock awards authorized under the plan include stock options, stock appreciation rights, restricted stock, restricted stock units, dividend equivalent awards and performance awards. See “Executive Compensation—Employee Benefit Plans—2015 Omnibus Incentive Plan.” As of the date of this prospectus, no incentive stock awards have been granted under the 2015 Omnibus Incentive Plan. Stock-based compensation expense is accounted for in accordance with the provisions of ASC Topic 718, “Compensation—Stock Compensation.” The compensation cost recorded for these awards will be based on their fair value at grant date less the cost of estimated forfeitures determined using the Black-Scholes-Merton option-pricing model (“Black-Scholes model”). Forfeitures will be estimated at the time of grant and revised, if necessary, in subsequent periods to reflect actual forfeitures.
Equity-based compensation attributable to LDLLC profits interest awards granted to employees pursuant to the 6th LLC Agreement in effect prior to this offering are also accounted for in accordance with the provisions of FASB ASC Topic 718. The fair value of profits interest awards are estimated on the date of grant. These awards are subject to the terms of the applicable agreement governing the profits interest award.
For all time-vesting awards granted, equity-based compensation expense is recognized in the statements of operations and amortized using the straight-line attribution method. For profits interest awards that contain a liquidity condition, which is satisfied upon occurrence of a qualifying event, defined as a change in control transaction, expense recognition will occur at the time of the qualifying event.
We utilize the Black-Scholes model for estimating fair value of our awards granted. Determining the fair value of equity-based awards at the grant date requires judgment. Option valuation models, including the Black-Scholes model, require the input of highly subjective and complex assumptions, and changes in the assumptions used can materially affect the grant date fair value of an award. As a result, the estimated fair value for future profits interest awards may differ materially compared with the profits interest awards granted previously. In valuing our awards granted, the assumptions we use include the risk-free rate of interest, expected dividend yield, expected volatility and the expected life of the award.
The risk-free interest rates used for determining the fair value of profits interest awards are based on the U.S. Treasury yield curve in effect at the time of grant based on the expected life of the unit grants. During the six months ended June 30, 2015 and 2014 and the fiscal years 2014 and 2013, LDLLC did not make any
124
Table of Contents
distributions (other than tax-related distributions) to its members and, therefore, we have assumed an expected dividend rate of zero. Expected volatility rates used for determining the fair value of profits interest awards are based on historical volatility of the common stock of comparable publicly traded entities in the most recent period that is equal to the expected term of the unit grants being valued and other factors, including adjustments for leverage, due to the lack of historic information regarding LDLLC. The expected life of profits interest awards is the period of time for which the profits interest awards are expected to be outstanding. Given the lack of historic exercise data, the expected life is determined using the anticipated liquidity event for the awards.
In establishing the estimated fair value of our profits interest awards, our valuation analyses were based on the guidance set forth in American Institute of Certified Public Accountants Practice Guide, “Valuation of Privately-Held-Company Equity Securities Issued as Compensation” and contemporaneous information as of each respective valuation date provided by our management, including historical and projected financial statements, prospects and risks, our performance, various corporate documents, capitalization, economic conditions and financial market conditions. The valuation analyses were reviewed by management and the board of directors in conjunction with equity-based compensation grants. Management and our board of directors have considered these valuation analyses and other qualitative and quantitative factors to determine and approve the best estimate of the fair value of the profits interest awards at each grant date. These factors included: (i) progress and milestones achieved in our business development, (ii) our operating performance and competitive position within the industry, (iii) general market conditions and trends, (iv) key employee hires and terminations, (v) financial statement projections, (vi) market value of companies considered comparable to us and (vii) the likelihood of achieving certain liquidity events, such as a sale or merger or initial public offering, given prevailing market conditions.
The table below sets forth the assumptions used for calculating the value of profits interest awards granted in the periods presented:
| Six Months Ended June 30, |
Year Ended December 31, | |||||||
| 2015 | 2014 | 2014 | 2013 | |||||
| Risk-free interest rate |
0.16% | 1.69% | 1.68% | 2.34% | ||||
| Dividend yield |
— | — | — | — | ||||
| Expected volatility |
40.00% | 26.04% | 25.10% | 47.20% | ||||
| Expected term |
0.8 years | 5 years | 5 years | 5 years | ||||
Subject to certain exceptions, each profits interest award will vest over a five-year term with 20% of the units vesting on the first anniversary of the effective date of the unit grant agreement and the remaining units vesting each month thereafter in equal installments for so long as the member of management remains employed by us. Prior to the completion of the offering and as part of the Reorganization Transactions, LDLLC will modify its capital structure by replacing its different classes of interest units (other than the Class I common units of LDLLC) with a single new class of LLC Units. See “Organizational Structure—Reorganization Transactions at LDLLC.”
The following table summarizes by grant date the number of common units granted since August 1, 2014 and the estimated fair value per common unit at the date of grant:
| Grant Date |
Unit Class |
Number of Units Granted |
Fair Value Per Unit at Grant Date |
Fair Value of Grant at Grant Date |
Total Class X Outstanding Fair Value |
Risk- free Interest Rate |
Dividend Yield |
Expected Volatility |
Expected Term |
|||||||||||||||||||||||||||
| 9/29/2014 |
Class X | 2,000 | $ | 0.33 | $ | 660 | $ | 5,344 | 1.78 | % | — | 23.43 | % | 5.0 years | ||||||||||||||||||||||
| 2/01/2015 |
Class X | 1,210 | 129.65 | 156,849 | 2,255,054 | 2.00 | % | — | 25.00 | % | 5.0 years | |||||||||||||||||||||||||
| 3/01/2015 |
Class X | 3,055 | 129.65 | 396,085 | 2,651,139 | 2.00 | % | — | 25.00 | % | 5.0 years | |||||||||||||||||||||||||
| 4/07/2015 |
Class X | 1,750 | 92.91 | 162,598 | 2,062,577 | 2.00 | % | — | 25.00 | % | 5.0 years | |||||||||||||||||||||||||
| 5/20/2015 |
Class X | 2,939,861,813 | (1) | 0.004 | 12,905,993 | 13,285,223 | 0.16 | % | — | 40.00 | % | 0.8 years | ||||||||||||||||||||||||
| (1) | Represents 30 separate grants of our Class X common units pursuant to the 6th LLC Agreement to align key executives and managers with the Company’s performance going forward. |
125
Table of Contents
No single event caused the valuation of our Class X common units to change from August 2014 to August 2015. Instead, a combination of the factors described above led to the changes in fair value of the common units as determined by our board of directors.
Refer to Note 20, “Equity-Based Compensation,” to our audited consolidated financial statements as of and for the six months ended June 30, 2015 and Note P, “Equity-Based Compensation,” to our audited consolidated financial statements as of and for the year ended December 31, 2014, both of which are included elsewhere in this prospectus, for more information related to stock-based compensation.
Recent Accounting Pronouncements
ASU No. 2014-15, “Presentation of Financial Statements—Going Concern (Topic 205-40): 1230 Disclosure of Uncertainties about an Entity’s Ability to Continue as a Going Concern” was issued in August 2014. This update is intended to define management’s responsibility to evaluate whether there is a substantial doubt about an organization’s ability to continue as a going concern and to provide related footnote disclosure. The new guidance will be effective for us beginning on January 1, 2016. We do not expect the adoption of the new guidance to have a material impact on our financial statements.
ASU No. 2014-17, “Business Combinations (Topic 805)—Pushdown Accounting” was issued in November 2014. This update provides an acquired entity with an option to apply pushdown accounting in its separate financial statements upon occurrence of an event in which an acquirer obtains control of the acquired entity. An acquired entity may elect the option to apply pushdown accounting in the reporting period in which the change-in-control events occurs. The new guidance will be effective for us on the date of our next business combination. We do not expect the adoption of the new guidance to have a material impact on our financial statements.
ASU No. 2015-02, “Consolidation (Topic 810)—Amendments to the Consolidation Analysis” was issued in February 2015. This update affects reporting entities that are required to evaluate whether they should consolidate certain legal entities. The amendments in this update affect the following areas: limited partnerships and similar legal entities; evaluating fees paid to a decision maker or a service provider as a variable interest; the effect of fee arrangements on the primary beneficiary determination; the effect of related parties on the primary beneficiary determination; and certain investment funds. The new guidance will be effective for us beginning on January 1, 2016. We do not expect the adoption of the new guidance to have a material impact on our financial statements.
ASU No. 2015-03 “Interest—Imputation of Interest (Subtopic 835-30): Simplifying the Presentation of Debt Issuance Costs” was issued in April 2015. This update is to simplify presentation of debt issuance costs and requires debt issuance costs related to a recognized debt liability to be presented in the balance sheet as a direct deduction from the carrying amount of the debt liability, consistent with debt discounts. The new guidance will be effective for us beginning on January 1, 2016. We do not expect the adoption of the new guidance to have a material impact on our financial statements.
ASU No. 2015-05 “Intangibles—Goodwill and Other—Internal Use Software (Topic 350-40): Customer’s Accounting for Fees Paid in a Cloud Computing Arrangement” was issued in April 2015. This update provides guidance to customers about whether a cloud computing arrangement includes a software license and how to account for it. The new guidance will be effective for us beginning on January 1, 2016. We do not expect the adoption of the new guidance to have a material impact on our financial statements.
Emerging Growth Company
We are an “emerging growth company,” as defined in the JOBS Act. For as long as we are an “emerging growth company,” we may take advantage of certain exemptions from various reporting requirements that are applicable to other public companies that are not “emerging growth companies,” including, but not limited to, not
126
Table of Contents
being required to comply with the auditor attestation requirements of Section 404(b) of the Sarbanes-Oxley Act, reduced disclosure obligations regarding executive compensation in our periodic reports and proxy statements and exemptions from the requirements of holding stockholder advisory “say-on-pay” votes on executive compensation and stockholder advisory votes on golden parachute compensation.
The JOBS Act also provides that an “emerging growth company” can utilize the extended transition period provided in Section 7(a)(2)(B) of the Securities Act, for complying with new or revised accounting standards. Pursuant to Section 107 of the JOBS Act, we have chosen to “opt out” of such extended transition period and, as a result, we will comply with new or revised accounting standards on the relevant dates on which adoption of such standards is required for companies that are not “emerging growth companies.” Under the JOBS Act, our decision to opt out of the extended transition period for complying with new or revised accounting standards is irrevocable.
We will continue to be an emerging growth company until the earliest to occur of (i) the last day of the fiscal year during which we had total annual gross revenues of at least $1 billion (as indexed for inflation), (ii) the last day of the fiscal year following the fifth anniversary of the closing of this offering, (iii) the date on which we have, during the previous three-year period, issued more than $1 billion in non-convertible debt or (iv) the date on which we are deemed to be a “large accelerated filer,” as defined under the Securities Exchange Act of 1934, as amended (the “Exchange Act”).
Quantitative and Qualitative Disclosures About Market Risk
In the normal course of business, we are exposed to various risks which can affect our business, results and operations. The primary market risks to which we are exposed include interest rate risk, credit risk, prepayment risk and inflation risk.
We manage our interest rate risk and the price risk associated with changes in interest rates pursuant to the terms of an Interest Rate Risk Management Policy which (i) quantifies our interest rate risk exposure, (ii) lists the derivatives eligible for use as Hedging Instruments and (iii) establishes risk and liquidity tolerances.
Interest Rate Risk
Our principal market exposure is to interest rate risk as our business is subject to variability in results of operations due to fluctuations in interest rates. We anticipate that interest rates will remain our primary benchmark for market risk for the foreseeable future. Changes in interest rates affect our assets and liabilities measured at fair value, including LHFS, IRLCs, servicing rights and Hedging Instruments. In a declining interest rate environment, we would expect our results of operations to be positively impacted by higher loan origination volumes and loan margins. However, we would expect our results of operations to be negatively impacted by higher actual and projected loan prepayments related to our loan servicing portfolio and a decrease in the value of our servicing rights. As interest rates decline, our LHFS and IRLCs generally increase in value while our Hedging Instruments utilized to hedge against interest rate risk decrease in value. In a rising interest rate environment, we would expect a negative impact on the results of operations of our production activities and a positive impact on the results of operations of our servicing activities (principally through an increase in the fair value of our servicing rights). As interest rates increase, our LHFS and IRLCs generally decrease in value while our Hedging Instruments typically increase in value. The interaction between the results of operations of our various activities is a core component of our overall interest rate risk strategy. See “—Sensitivity Analysis” for tabular analysis on the impact of changes in interest rates on our financial assets and liabilities measured at fair value.
IRLCs represent an agreement to extend credit to a potential customer, whereby the interest rate on the loan is set prior to funding. Our LHFS, which are held in inventory awaiting sale into the secondary market, and our IRLCs, are subject to changes in interest rates from the date of the commitment through the sale of the loan into
127
Table of Contents
the secondary market. Accordingly, we are exposed to interest rate risk and related price risk during the period from the date of the lock commitment through (i) the lock commitment cancellation or expiration date, or (ii) the date of sale into the secondary mortgage market. Loan commitments generally range between 15 and 60 days; and our average holding period of the loan from funding to sale is 17.3 days.
We manage the interest rate risk associated with our outstanding IRLCs, LHFS and servicing rights by entering into Hedging Instruments. Management expects these Hedging Instruments will experience changes in fair value opposite to changes in fair value of the IRLCs and LHFS, thereby reducing earnings volatility. We take into account various factors and strategies in determining the portion of IRLCs, LHFS and servicing rights that we want to economically hedge. Our expectation of how many of our IRLCs will ultimately close is a key factor in determining the notional amount of Hedging Instruments used in hedging the position. See “Risk Factors—Risks Related to Our Business—Our hedging strategies may not be successful in mitigating our risks associated with changes in interest rates.”
Credit Risk
We are subject to credit risk in connection with our loan sale transactions. While our contracts vary, we provide representations and warranties to purchasers and insurers of the home loans sold that typically are in place for the life of the loan. In the event of a breach of these representations and warranties, we may be required to repurchase a home loan or indemnify the purchaser, and any subsequent loss on the home loan may be borne by us. The representations and warranties require adherence to applicable origination and underwriting guidelines (including those of Fannie Mae, Freddie Mac and Ginnie Mae), including but not limited to the validity of the lien securing the loan, property eligibility, borrower credit, income and asset requirements and compliance with applicable federal, state and local law.
We record a provision for losses relating to such representations and warranties as part of our loan sale transactions. The level of the liability for losses from representations and warranties is difficult to estimate and requires considerable management judgment. The level of loan repurchase losses is dependent on economic factors, trends in property values, investor repurchase demand strategies and other external conditions that may change over the lives of the underlying loans. We evaluate the adequacy of our liability for losses from representations and warranties based on our loss experience and our assessment of incurred losses relating to loans that we have previously sold and which remain outstanding at the balance sheet date. As our portfolio of loans sold subject to representations and warranties grows and as economic fundamentals change, such adjustments can be material. However, we believe that our current estimates adequately approximate the losses incurred on our sold loans subject to such representations and warranties.
Additionally, we are exposed to credit risk associated with our customers from our LHFS as well as credit risks related to our counterparties including our subservicer, Hedging Instrument counterparties and other significant vendors. Our ability to operate profitably is dependent on both our access to capital to finance our assets and our ability to profitably originate, sell and service loans. Our ability to hold loans pending sale and/or securitization depends, in part, on the availability to us of adequate financing lines of credit at suitable interest rates and favorable advance rates.
In general, we manage such risk by selecting only counterparties that we believe to be financially strong, dispersing the risk among multiple counterparties, placing contractual limits on the amount of unsecured credit extended to any single counterparty and entering into netting agreements with the counterparties, as appropriate. During the six months ended June 30, 2015 and the years ended December 31, 2014 and December 31, 2013, we incurred no losses due to nonperformance by any of our counterparties.
Prepayment Risk
Prepayment risk is affected by interest rates (and their inherent risk) and borrowers’ actions relative to their underlying loans. To the extent that the actual prepayment speed on the loans underlying our servicing rights differs from what we projected when we initially recognized them and when we measured fair value as of the end
128
Table of Contents
of each reporting period, the carrying value of our investment in servicing rights will be affected. In general, an increase in prepayment expectations will decrease our estimates of the fair value of the servicing right, thereby reducing expected servicing income. We monitor the servicing portfolio to identify potential refinancings and the impact that would have on associated servicing rights.
Inflation Risk
Almost all of our assets and liabilities are interest rate sensitive in nature. As a result, interest rates and other factors will influence our performance more than inflation. Changes in interest rates do not necessarily correlate with inflation rates or changes in inflation rates. Additionally, our financial statements are prepared in accordance with GAAP and our activities and balance sheet are measured with reference to historical cost and/or fair value without considering inflation.
Sensitivity Analysis
Our total market risk is influenced by various factors including market volatility and the liquidity of capital markets. There are certain limitations inherent in the sensitivity analysis presented, including (i) the necessity to conduct the analysis based on a single point in time, (ii) the inability to include or fully anticipate the complex market reactions that normally would arise from the market shifts modeled, (iii) the accuracy of various models and assumptions used, including prepayment forecasts and discount rates and (iv) the inability to include other factors that would affect our overall financial performance in such scenarios, including operational adjustments made by management to account for changing circumstances.
We used June 30, 2015 market rates on our instruments to perform the sensitivity analysis on our financial assets and liabilities measured at fair value. The interest rate sensitivity analysis assumes instantaneous, parallel shifts in interest rate yield curves. These sensitivities are hypothetical and presented for illustrative purposes only. Changes in fair value based on variations in assumptions generally cannot be extrapolated because the relationship of the change in fair value may not be linear.
The following tables summarize the estimated change in fair value of our financial assets and liabilities measured at fair value as of June 30, 2015, given hypothetical parallel shifts in interest rates:
| As of June 30, 2015 | ||||||||||||||||||||||||||||
| Shift in interest rates |
Down 100 bps |
Down 50 bps |
Down 25 bps |
0 | Up 25 bps |
Up 50 bps |
Up 100 bps |
|||||||||||||||||||||
| ($ in thousands) | ||||||||||||||||||||||||||||
| Change in fair value: |
||||||||||||||||||||||||||||
| IRLCs |
$ | 186,444 | $ | 134,014 | $ | 109,534 | $ | 79,965 | $ | 43,469 | $ | 485 | $ | (91,808 | ) | |||||||||||||
| LHFS |
1,549,019 | 1,531,059 | 1,518,682 | 1,504,603 | 1,489,118 | 1,472,420 | 1,435,652 | |||||||||||||||||||||
| Servicing rights |
145,479 | 173,741 | 184,677 | 194,093 | 202,185 | 209,100 | 220,140 | |||||||||||||||||||||
| Derivative assets and liabilities (excluding IRLCs) |
(105,162 | ) | (57,485 | ) | (28,156 | ) | 5,458 | 45,332 | 94,646 | 240,332 | ||||||||||||||||||
|
|
|
|
|
|
|
|
|
|
|
|
|
|
|
|||||||||||||||
| Total |
$ | 1,775,780 | $ | 1,781,329 | $ | 1,784,737 | $ | 1,784,119 | $ | 1,780,104 | $ | 1,776,651 | $ | 1,804,316 | ||||||||||||||
|
|
|
|
|
|
|
|
|
|
|
|
|
|
|
|||||||||||||||
| Change in fair value (%): |
||||||||||||||||||||||||||||
| IRLCs |
133 | % | 68 | % | 37 | % | 0 | % | (46 | )% | (99 | )% | (215 | )% | ||||||||||||||
| LHFS |
3 | % | 2 | % | 1 | % | 0 | % | (1 | )% | (2 | )% | (5 | )% | ||||||||||||||
| Servicing rights |
(25 | )% | (10 | )% | (5 | )% | 0 | % | 4 | % | 8 | % | 13 | % | ||||||||||||||
| Derivative assets and liabilities (excluding IRLCs) |
(2,027 | )% | (1,153 | )% | (616 | )% | 0 | % | 731 | % | 1,634 | % | 4,303 | % | ||||||||||||||
| Total |
0 | % | 0 | % | 0 | % | 0 | % | 0 | % | 0 | % | 1 | % | ||||||||||||||
129
Table of Contents
Our Mission
To become America’s Consumer Lending Platform by leveraging our technology to provide consumers with credit products best suited for their financial needs.
Our Company
loanDepot is a leading technology-enabled U.S. consumer lending platform. We launched our business in 2010 to provide credit solutions to consumers who were not satisfied with the service offered by banks and other traditional market participants. We are the nation’s second largest direct-to-consumer non-bank originator by annual funded loan amount and have facilitated over $50 billion in total funding since inception. We currently offer a broad suite of consumer credit products to our customers, ranging from home loans to unsecured personal loans. Our hybrid originate-to-sell and marketplace business model allows us to generate significant loan volume with less capital than traditional market participants. For the twelve months ended June 30, 2015, we originated $22.1 billion in loans, representing 125% year-over-year growth relative to the twelve months ended June 30, 2014. Moreover, we have generated this substantial growth while maintaining profitability since 2012.
The consumer lending market in the United States is massive, with more than $11.8 trillion in household debt outstanding as of June 30, 2015. We believe that banks and other traditional market participants continue to be ineffective in adequately addressing consumer needs due to increasing capital requirements, regulatory constraints, legacy systems and antiquated processes. In addition, we expect our addressable market to expand, as consumer debt in our target markets was $1.6 trillion lower at June 30, 2015 than at December 31, 2008. This represents a compelling opportunity for us to disrupt the market and gain share by both displacing incumbent participants and addressing unmet demand.
Given this significant opportunity and our management team’s experience in providing home loan products, we identified home lending as our most effective entry point into the broader U.S. consumer lending market. We targeted the home lending market for the following reasons: (i) it has the largest addressable market with $8.6 trillion outstanding as of June 30, 2015; (ii) its complexity and licensing requirements present significant barriers to entry, which our management team has had significant experience and success in addressing; (iii) consumer dissatisfaction with banks and traditional lenders provides an opportunity for significant disruption; and (iv) home loan products provide a foundation for direct customer relationships and powerful cross-selling opportunities for other loan products, thereby increasing customer lifetime value. Building on these direct customer relationships and the success of our existing home loan products, we continue to broaden our product suite, which now includes home equity and unsecured personal loans. By providing a robust suite of secured and unsecured loan products and leveraging technology to provide a better and more efficient customer experience, we strive to become America’s Consumer Lending Platform.
We have built our operations to be significantly automated, including the application process, product identification and selection, credit decisioning and scoring, loan funding, servicing, regulatory compliance and fraud detection. We further leverage our technology to address additional licensing requirements and to comply with increasingly complex regulatory requirements which primarily result from the Financial Crisis. We believe that our platform and technology also provide an improved customer experience and enhances the lifetime value of our customer relationships through repeat and cross-sell opportunities. We believe our NPS, an index that measures customer satisfaction and loyalty, of 59.5 for the six months ended June 30, 2015 and 63.5 for the year ended December 31, 2014 (for those channels we primarily operated in at the time) demonstrates our strong direct customer relationships and success in providing a better experience and compares favorably to the 2014 annual industry averages of approximately 16 for national banks and approximately 22 for regional banks.
Our multi-channel platform allows our customers to engage with us through their preferred channel, enabling a better customer experience, while matching consumers’ diverse borrowing needs with efficient and
130
Table of Contents
lower-cost sources of capital. This model offers three convenient options for consumers: (i) our direct retail channel comprising our online platform, loanDepot.com, and our proprietary customer contact centers; (ii) our distributed retail channel comprising nearly 1,000 members of our sales force strategically located across the United States and our joint ventures; and (iii) our wholesale channel, LD Wholesale, comprising our nationwide network of independent home loan brokers. For the six months ended June 30, 2015, 41.3% of loans were originated through our direct retail channel, 48.3% were originated through our distributed retail channel and 10.4% were originated through our wholesale channel. Currently, home loans are originated through all of our distribution channels, personal loans are facilitated through both of our retail channels and home equity loans are originated through our direct retail channel. In the future, we expect that all of our consumer credit products will be available across all of our distribution channels. See “—Our Distribution Channels” below for more detail. Our more than 1,500 employee sales force across both our direct and distributed retail channels provides a competitive advantage in our go-to-market strategy. We have invested heavily in both training our sales force and providing them with multiple state licenses to optimize workflow, which we believe creates a better consumer experience and differentiates our offerings in the marketplace.
Both our technology and multi-channel distribution platform are complemented by our scaled marketing effort. We currently invest significantly in both online and offline marketing strategies, which has resulted in loanDepot becoming a nationally recognized consumer brand. We believe our highly targeted marketing strategies are more effective than many of our competitors’ traditional marketing efforts. We currently generate over 300,000 customer leads each month and continue to grow our proprietary database, which currently exceeds 11 million consumer contacts. By effectively utilizing our lead-generation sources, proprietary lead management technology and automated product-decisioning capabilities, we are able to drive revenue while executing our customer acquisition strategy. Our extensive database and proprietary technology also proactively identify and facilitate opportunities to cross-sell and resell our products, which further reduces our average customer acquisition costs and thereby increases the lifetime value of our customer.
We have historically derived substantially all of our revenues from originating, selling and servicing home loans. However, in May 2015, we began facilitating personal loans, and, in large part due to the success of cross-selling opportunities, we have seen significant growth in units without a substantial increase in marketing expense. For the six months ended June 30, 2015, we funded over $14.3 billion in home loans and facilitated over $13.9 million in personal loans. Since the launch of our personal loan product through September 30, 2015, we have facilitated over $140 million in personal loans. Based on our successful experience with personal loans, we believe a similar cross-selling opportunity exists with the origination of our home equity loan products, which we recently launched in September 2015.
We believe our broad suite of consumer loan products is a competitive advantage, and we expect that originating and facilitating multiple loan products will lead to:
| • | improved customer experience and brand awareness; |
| • | savings for our customers; |
| • | greater customer conversion and retention; |
| • | enhanced data optimization, analytics and credit decisioning; and |
| • | lower average customer acquisition costs. |
Our business has scaled rapidly and has been funded primarily by internally generated profits from operations. For the twelve months ended June 30, 2015, we originated $22.1 billion of loans, representing year-over-year growth of 125% relative to the twelve months ended June 30, 2014. Our growth has been supported by our balance-sheet light model, which utilizes diverse funding sources, our ability to provide what we believe is a superior customer experience and our strategic acquisitions. For the year ended December 31, 2014, we originated $13.2 billion of loans and recorded total net revenues of $544.5 million, Adjusted EBITDA of $50.2 million, Adjusted Net Income of $17.6 million (giving effect to net income as if we were taxed as a
131
Table of Contents
C-Corp) and net income of $21.7 million. For the six months ended June 30, 2015, we originated $14.3 billion of loans and recorded total net revenues of $489.6 million, Adjusted EBITDA of $101.1 million, Adjusted Net Income of $51.7 million (giving effect to net income as if we were taxed as a C-Corp) and net income of $69.2 million. See “Prospectus Summary—Summary Historical Consolidated Financial and Other Data” for a reconciliation of Adjusted EBITDA and Adjusted Net Income to net income.
Industry Background & Trends
Massive Consumer Lending Market Poised for Growth as the U.S. Economy and Consumer Confidence Recover
The consumer lending market in the United States is massive with more than $11.8 trillion in household debt outstanding as of June 30, 2015. We believe this market is poised for growth as borrowings in our target markets (consumer debt excluding automotive and student loans) was $1.6 trillion lower at June 30, 2015 as compared to December 31, 2008, during the height of the Financial Crisis.
Consumer credit is an important driver of the U.S. economy. The loan products we currently provide target some of the largest components of U.S. consumer credit, including home loan debt ($8.1 trillion outstanding as of June 30, 2015), consumer credit excluding home, automotive and student loan debt ($1.0 trillion outstanding as of June 30, 2015) and home equity lines of credit ($0.5 trillion outstanding as of June 30, 2015), which collectively account for over 80% of the total consumer lending market. Following the Financial Crisis, U.S. households focused on stabilizing their financial positions by lowering their household debt, which has resulted in current household debt service ratios of 9.9%, the lowest level since 1980. Similarly, consumer confidence, which has historically served as a strong indicator of improving economic conditions and a precursor to increased desire to access credit, has improved steadily since 2009. This increased confidence along with higher employment levels and promising wage growth has led to increased consumer spending, which has recently driven increased demand for credit, particularly in the consumer credit products we provide.
When interest rates rise, rate and term refinancings become less attractive to consumers after a historically long period of low interest rates. However, rising interest rates are also indicative of overall economic growth and inflation that should create more opportunities with respect to cash-out refinancings. In addition, inflation reflecting increases in asset prices and stronger economic growth (leading to higher consumer confidence) typically should generate more purchase-focused transactions requiring loans and greater opportunities for home equity loans, which we expect may offset, at least in part, any decline in rate and term refinancings in a rising interest rate environment. We also believe that rising interest rates will not have a material impact on market opportunities for personal loans because those are fixed rate products; however, if consumer debt in the aggregate began to decrease due to rising interest rates, we may see a reduction in personal loan volume because such loans are primarily used for consolidating debt.
Consumers Have Not Been Adequately Served
We believe the traditional banking and consumer lending system is burdened by high fixed costs and antiquated processes, in part due to extensive legacy infrastructure and labor-intensive processes. Post-Financial Crisis, this burden has been compounded by an increasingly complex regulatory environment. During the Financial Crisis, banks and other traditional market participants were forced to tighten credit and, in some cases, exit certain markets and lending products. As a result, despite continued strong demand for credit, many consumers have had fewer borrowing choices and declining access to credit products such as unsecured personal loans, home equity loans and non-Agency home loans. This has created an opportunity for non-bank lending platforms like us to fill the void left by traditional lenders.
The Home Loan Market is Undergoing a Substantial Transformation
The home loan market is the largest component of U.S. consumer borrowing and requires originators and servicers to have various licenses as well as substantial training and expertise. Following the Financial Crisis, the
132
Table of Contents
Agencies and federal and state regulators have imposed substantial compliance and capital requirements on banks and other market participants which has raised origination costs and reduced economic returns. We believe that increasing regulation and stricter lending policies provide a compelling opportunity for a non-bank consumer lender of scale like us to take market share. Evidencing this, non-bank lenders have grown market share from 10% of the consumer lending market in 2009 to 42% in 2014. Additionally, as more consumers are becoming increasingly comfortable obtaining credit products through technology-driven platforms, there has been a significant increase in the share of the home loan market originated through the direct/indirect channels, including internet-based platforms.
Impact of Emerging Disruptive Business Models
Online marketplaces and other disruptive business models have emerged to connect buyers and sellers across many industries to increase consumer choice and improve customer satisfaction. Specifically in the financial sector, many of these platforms have focused on consumer lending. The majority of these platforms have sought to increase availability of unsecured personal loans to consumers via online marketplaces relative to alternatives such as credit cards, while still offering attractive yields to support investor return requirements. We believe that these platforms have focused on unsecured personal loans rather than home loans due to their lower regulatory and compliance requirements as well as lower complexity relative to home loans. As a result, the consumer experience has improved, costs have been lowered and consumers have become increasingly comfortable using online platforms and technology to fulfill their financial needs.
Reemergence of Historically Important Lending Products
Since December 31, 2011, the home equity of U.S. consumers has increased by approximately $5.3 trillion as of March 31, 2015. Despite this, home equity lines of credit, which provide consumers with significant capacity to borrow against their home’s equity, generally at more attractive terms than those available with credit cards and unsecured loans, have declined 29% since December 31, 2008, to approximately $500 billion, as of June 30, 2015. As the market for home equity loans recovers, we believe consumers will utilize their increased home equity to more cost-efficiently meet their borrowing needs.
Additionally, in 2014, Agency home loans represented 96% of all home loans originated, well above the 2006 level of 44%. We believe that the current record level of U.S. government and Agency involvement in the home loan market will abate as private investors seek to invest in the improving housing market, allowing borrowers greater choice and access to non-Agency products.
While many new entrants have been able to grow quickly in the personal loan space due to the lower barriers to entry, originating home loans, home equity loans and other home loan products requires licensing, training and significant operational and regulatory expertise, which we believe these competitors generally lack.
Our Competitive Strengths
Full-Service Consumer Lending Platform of Scale with National Brand Awareness
We are currently the second largest direct-to-consumer non-bank originator, and we have underwritten and facilitated over $50 billion in total loan funding since our launch in 2010. The regulated nature and complexity of the home loan market create a significant barrier to entry, as competitors must have substantial scale and expertise in order to effectively compete. We have invested in our infrastructure, licensed personnel, national brand and technology platform as well as in direct customer relationships to position ourselves for future growth. Given our expertise in complex home loan products and our extensive consumer database, we believe that we are well positioned to continue our expansion into additional loan products. The ability to cross-sell additional products at minimal incremental cost allows us to further reduce our average customer acquisition cost and increase our lifetime customer value. Together, we believe our brand, strong online and offline presence, full service capabilities and breadth of operations provide us significant advantages over competitors which we believe are unable to achieve the same benefits and cost advantages of scale.
133
Table of Contents
Powerful, Efficient and Scalable Technology
Our proprietary technology systems, which were built de novo to address the post-Financial Crisis consumer lending environment, provide us substantial competitive advantages. Our technology significantly automates historically labor-intensive processes including the application process, credit decisioning and scoring, product identification and selection, loan funding, servicing, regulatory compliance and fraud detection, enabling us to be more efficient. Specifically, our technology allows us to instantly determine the optimal products to offer our customers, improving lead conversion and ultimately lowering average customer acquisition costs. Regardless of the channel through which our customers choose to engage with us, our technology enables us to educate potential customers on their alternatives, thereby maximizing customer conversion and retention. Our systems continuously update our comprehensive database of financial and contact information for millions of consumers, which we monitor and analyze to identify attractive future lending opportunities.
Superior Customer Experience
We believe that our robust distribution and service model allows us to provide a superior customer experience throughout the lending life cycle. We employ a multi-channel model, consisting of our online platform, a sales force of more than 1,500 licensed employees located across the United States, strong relationships with affinity partners and our network of home loan brokers. We believe this model provides our customers with both optionality and convenience, as customers may pursue a loan through the channel of their choice. Further, our platform improves speed to close and increases funding certainty for our customers. We believe our customer-centric approach has been validated by our NPS score of 59.5 for the six months ended June 30, 2015. We expect that this continuous high level of service and resulting customer satisfaction positions us well to be successful in expanding our offering of loan products and services to our customer base.
Low-Cost Customer Acquisition Capabilities
Through our multi-channel origination platform, we drive acquisition costs lower through process automation and superior product decisioning technology. Our technology allows us to leverage our over 300,000 leads per month by providing customer-level intelligence to our platform prior to customer contact, which allows us to better understand a borrower’s financial profile and borrowing needs. Ultimately, we believe this drives superior lead conversion, a better customer service experience, improved retention and recapture rates and higher customer lifetime values. Moreover, as we continue to expand our product suite, we believe that we will be able to better leverage our database and cross-sell opportunities, and thereby further increase customer conversions and further reduce our average customer acquisition costs.
Proprietary Workflow Solution Supports Flexible Business Model
Our dynamic workflow solutions make our platform more flexible than those of many of our competitors. Utilizing both technology and our workforce, we optimize our capacity utilization and workflow capabilities to efficiently process significantly higher loan volume. Through our proprietary decisioning technology and expansive database, we are able to identify consumers that would benefit from a particular lending product. Our sales force proactively contacts these customers and highlights the attractiveness of these particular products. Whereas many loan officers are licensed in only one or two states, we have built a bespoke training program that licenses our sales force in several states for multiple credit products. Because each member of our sales force is licensed to engage with customers in a wider variety of locations, we are able to quickly reallocate resources to specific geographic areas based on demand. This is important particularly in the home loan market in which a licensed loan officer is required to handle each transaction. For the six months ended June 30, 2015, approximately 40% of our aggregate home loan origination was secured by properties concentrated in the states of California, Texas and Arizona. The properties securing the aggregate outstanding UPB of our home loan servicing rights portfolio have a similar geographic concentration. On average, our sales force has five licenses each, which we believe is higher than the industry average.
134
Table of Contents
Capital-Light Model, Driven by Stable and Diverse Funding Base
Our combination of an efficient, originate-to-sell business model in home loans and home equity loans and marketplace model with stable and diverse investors in personal loans allows us to generate significant loan volume with less capital than traditional market lenders. Currently, home loan products remain on our balance sheet for 17.3 days on average, and our personal loan products are funded directly by our issuing bank partner and then sold to investors, requiring no use of our balance sheet. We have developed a stable and diverse funding base and built an experienced capital markets team which has cultivated strong relationships with private investors, the GSEs, government agencies and more than 80 financial institutions globally. We continually evaluate our capital sources and investor partnerships to ensure our funding model is optimally aligned with our strategic initiatives.
Proven and Visionary Management Team
Our senior management team brings extensive experience from numerous high-growth, technology-enabled consumer lending companies as well as extensive capital markets and financing expertise throughout multiple credit environments over the past three decades. Our founder, Chairman and CEO, Anthony Hsieh, has nearly 30 years of consumer lending experience and previously founded two successful technology-enabled consumer lending companies, one of which was the first to underwrite a consumer loan online. Our management team will hold a significant ownership stake in the Company after giving effect to the offering and the use of proceeds to us therefrom.
Our Strategy for Growth
Increase Customer Penetration and Distribution in Existing Products and Markets
We initially focused on the $8.1 trillion U.S. home loan market and have entered the $1.0 trillion unsecured consumer lending market and $0.5 trillion home equity market where together we believe there is considerable opportunity for continued growth and further market penetration. We had an estimated 2.0% market share in the home loan origination market as of June 30, 2015, as compared to approximately 1.0% as of June 30, 2014. In addition, we launched our personal loan products in the second quarter of 2015, and through September 30, 2015, we have facilitated over $140 million in personal loans. We believe that our technology platform and growing proprietary database of more than 11 million consumers will allow us to further distribute our existing products to both new and existing customers. As banks have retreated, as evidenced by their decline in market share from 90% to 58% in the home loan market and 45% to 40% in the non-home loan consumer finance market from 2010 to 2014, we expect that consumer lending will continue to migrate towards technology-enabled, marketplace platforms and non-bank lenders such as ourselves. We believe that we are well-positioned to capitalize on this shift and to gain market share. We also believe that origination volumes in the home loan and personal lending markets are below historical averages and that there will be a significant opportunity to increase volume through overall industry growth as the U.S. economy improves.
Introduce Additional Products to Our Platform
Our platform has been developed to allow us to expand into new product categories with minimal incremental cost, as evidenced by the recent launches of personal loan and home equity products. We currently offer the bookends of consumer credit. On one end, we offer home loans, which are the most complex and heavily regulated product but typically provide the lowest borrowing rate, and, on the other end, we offer unsecured personal loans. As we continue to expand our product suite, our consumer lending capabilities will provide a broad range of credit solutions that will serve much of a typical U.S. consumer’s borrowing needs. As we launch additional products, we will be able to leverage our proprietary database and technology, as well as our sales force to efficiently identify and engage with consumers that could benefit from our expanded product suite. As a result, we expect to continue to reduce our average customer acquisition costs as we scale, improve customer conversion rates and become increasingly efficient.
135
Table of Contents
Investing in Our Brand
We utilize highly targeted and sophisticated marketing strategies, which include internet, broadcast and new media, strategic alliances and a national television campaign. During 2014, we invested over $93 million on marketing, representing 17% of our total net revenue. This investment has helped us attract customers and we expect to continue to invest in our brand. As customers continue to associate our brand with high quality service and a consumer-oriented approach, as evidenced by our NPS, we believe this will allow us to further increase market penetration and support our product expansion.
Further Expand Industry Partnerships
We have established relationships with key industry partners, including joint ventures with two of the top ten U.S. homebuilders, as well as relationships with leading real estate brokerage firms and independent home loan brokers. Once we establish a relationship with a customer through an industry partnership, we have the ability to cross-sell additional and repeat products to enhance the lifetime value of that customer. We believe there is significant opportunity to deepen our existing relationships and develop additional partnerships, which will allow us to efficiently expand our business in a capital-light manner.
Expand Our Distribution Capabilities
We currently have a nationwide distribution network and believe there are additional opportunities to strategically deepen our presence in key markets. We plan to leverage our diversified product offerings and scalable platform to attract industry talent and additional human capital. We have grown organically and effectively pursued and integrated strategic acquisition opportunities, as demonstrated by our launch of LDWholesale and our acquisitions of imortgage and Mortgage Master.
Grow Our Investment in Technology and Training
We plan to continue to invest significantly in our technology, which is designed to provide a best-in-class customer experience, reduce average customer acquisition costs and enhance profitability. This investment will also focus on improving our proprietary algorithms to increase our cutting edge product optimization and decisioning, as well as further enhanced credit modeling. We also plan to continue to invest considerably in our people and training as we believe that the training system we have developed in-house is a key advantage that enhances our multi-channel business model.
Our Current Products and Services
We offer a broad suite of consumer loan products, including what we consider to be the bookends of consumer finance, serving a wide range of borrowers through a variety of market environments. In addition to our nationwide presence in the U.S. residential home loan market, we also provide customers with other consumer loan products and services. We believe that expanding into new consumer products and services is a natural extension of our core brand that will be attractive to both existing and new customers.
Home Loans
We offer customers a range of home loan products, secured either by a first or second lien against a residential property. We expect our extensive home loan capabilities, combined with our consumer-direct distribution model, will further grow our presence in the home loan market and increase our current rate of growth in market share. We sell the home loans that we originate to secondary market investors, including a variety of institutional investors, generally within 15-20 days of origination. During the year ended December 31, 2014, 91.8% of our home loans were sold to, or were sold pursuant to, programs sponsored by Fannie Mae,
136
Table of Contents
Freddie Mac or Ginnie Mae and the remaining 8.2% were sold to private investors. We originated $14.3 billion and $13.2 billion in home loan volume for the six months ended June 30, 2015 and the year ended December 31, 2014, respectively. Our current product suite includes the following categories for home loan products:
Conventional Agency Loans
Our conventional Agency loans meet the general underwriting guidelines established by Fannie Mae and Freddie Mac, and may be modified through special arrangements we have with both GSEs. Conventional Agency loans are generally fixed rate and fully amortize over a 15- or 30-year period.
FHA & VA Loans
FHA loans are federal assistance home loans that insure the lender against default on the loan. FHA loans are primarily available to borrowers who cannot afford a typical 20% down payment for a home purchase or may have lower credit scores. VA loans are federal assistance home loans for eligible U.S. veterans and their surviving spouses that are guaranteed against default by the U.S. government. This product allows eligible borrowers to buy a home with little or no money for a down payment or refinance up to 100% of their home loan without needing to purchase home loan insurance. FHA and VA loans may have higher LTV ratios and borrowers may have lower FICO scores than in conventional Agency loans.
Conventional Prime Jumbo Loans
We also originate conventional prime jumbo home loans. These loans generally conform to the underwriting guidelines of the GSEs but exceed the maximum loan size allowed for single unit properties. The majority of these loans are aggregated and sold to investors in the secondary market. These loans are fully documented and underwritten and have property value verification.
Home Equity Loans
In the third quarter of 2015, we expanded our product suite to include home equity loans. We originate certain home equity loans that are designed to provide homeowners access to efficient capital by accessing the home equity that borrowers have accumulated in their homes. Home equity products can take a number of forms including, but not limited to, home improvement loans designed to fund renovations to an existing property, closed end second lien loans that sit behind an existing first lien loan, or home equity lines of credit that allow borrowers to draw funds against their home equity on a revolving basis. We believe many home equity loan products offer borrowers attractive costs of funds relative to other loan products besides first lien home loans. In addition, home equity loan products further benefit borrowers through the potential tax deductible nature of the interest expense associated with these loans, subject to applicable tax laws. We believe that as the home loan market continues to recover, home equity loans will become an increasingly attractive financial product for our customers.
Personal Loans
In the second quarter of 2015, we expanded our product suite to include personal loans, which are offered through a bank partnership model. This personal loan product is designed to meet customers’ credit needs, regardless of whether they own a home. The personal loan product typically offers customers access to between $5,000 and $35,000 of unsecured credit, is fully amortizing, has a term of three to five years, includes no prepayment penalties and generally provides a lower interest rate than other unsecured borrowing alternatives such as credit cards. Currently, personal loans that are approved through our program are generally extended to borrowers who have a minimum FICO score of 660 or higher, satisfactory debt-to-income ratios and many other elements that contribute to our proprietary credit decisioning and scoring. We believe that these loans are simple, fair and responsible credit products that make it easier for many consumers to lower their monthly borrowing costs and meet their financial goals. Personal loans are originated and funded by our issuing bank partner, Cross
137
Table of Contents
River Bank, utilizing our proprietary credit scoring model, for which we receive a platform licensing fee. As of June 30, 2015, these fees ranged from 1% to 5% of the initial principal amount of the loan. These loans are not recorded on our balance sheet because we do not fund them, and are subsequently sold by our bank partner directly to investors. Our personal loan business is currently dependent on commitments from two investors to purchase such loans from our bank partner.
Loan Servicing
Prior to 2012, we sold substantially all the servicing rights associated with our home loan products. In 2012, we began retaining a portion of this servicing in order to complement our home loan business. While our net income is predominantly attributable to gain on origination and sale of loans (87% of total net revenues for the six months ended June 30, 2015), by maintaining a relationship with our customers through the servicing function, we are able to preserve and improve repeat origination and cross-sell opportunities, thereby increasing the lifetime value of our customers. Home loan servicing includes the performance of a variety of loan administration and servicing functions, including the collection and remittance of loan payments, responding to customer inquiries, and accounting for principal and interest, among other responsibilities. Home loan servicing produces strong recurring, contractual fee-based revenue with minimal credit risk. Servicing fees are primarily based on the UPB of the home loans serviced per month. As of June 30, 2015, we owned the right to service $16.6 billion in UPB of home loans for more than 75,500 of our customers. For the six months ended June 30, 2015, we earned $14.5 million in servicing income, net of subservicing expenses (which do not include certain administrative expenses related to oversight of our subservicing relationship) and excluding servicing losses of $19.3 million from fair value changes and sale of our servicing rights, out of total net income of $69.2 million. Origination income, net and servicing income represented 9% and 4%, respectively, of total net revenues for the six months ended June 30, 2015.
We entered the personal loan servicing market in the second quarter of 2015 when we began to facilitate personal loans. Similar to our home loan servicing, we are able to enhance the lifetime value of the customer through the servicing relationship. Servicing is comprised of account maintenance, collection and processing of payments from borrowers and remittance of payments to investors. A large majority of our loan payments are made through an Automated Clearing House (“ACH”) withdrawal from a borrower’s bank account. We charge a flat monthly master servicing fee per loan to investors to cover servicing expenses. As of August 31, 2015, this monthly fee was between 1% and 2% of the borrower’s monthly payment amount.
We engage third-parties as subservicers for both home loans and personal loans, which allows us to generate revenue in an operationally efficient manner while maintaining ongoing relationships with our customers. We have engaged a nationally recognized and highly-rated subservicer to perform the operational functions such as loan administration, collection and loss mitigation activities for our home loans. We have also engaged another nationally recognized subservicer to perform similar loan servicing functions for personal loans. In each case, we receive a master servicing fee related to the servicing of these loans, and we pay a subservicing fee to the subservicer to perform the loan servicing functions. We regularly monitor each subservicer’s servicing activities and performance. We are currently able to service loans in all 50 states.
Sales and Marketing
Our strategy is to utilize a variety of media in order to grow customer leads for our broad suite of products. We believe that we have developed highly effective marketing and customer acquisition strategies which serve to drive revenue growth and significantly reduce our average customer acquisition costs, as demonstrated by our significant origination growth, driving high lead volume and revenue relative to annual marketing spend. We currently spend over $90 million annually to generate leads through multiple channels, and we are constantly evaluating new mediums and marketing tactics to more efficiently spend our marketing dollars.
138
Table of Contents
Our current strategies include:
| • | Search Engine Optimization. We advertise on select major online search engines. |
| • | Pay-Per-Click. We utilize targeted banner-ads and other pay-per-click advertisements. |
| • | Online Lead Aggregators. We acquire leads and other targeted consumer information from online lead aggregators. |
| • | Social and New Media Campaigns. We employ social media outlets to help build brand awareness. |
| • | Print and Radio. We engage in print and radio advertising in markets where we have experienced strong results. |
| • | Television. We recently launched a national TV advertising campaign to continue to promote brand awareness. |
| • | Strategic Alliances. We establish formal and informal partnerships with companies to provide home loan origination services. |
Combined, our online and offline marketing campaigns currently generate more than 300,000 leads each month to proactively contact potential customers. We also obtain access to a substantial number of potential borrowers each month through our distributed retail network and industry relationships with home builders and real estate brokers, including our joint ventures, as well as through our wholesale home loan broker relationships.
We maintain an extensive and growing lead database which includes over 11 million consumer contacts generated through our five-year history and which increases over time as new contacts are made. We believe that our recently expanded suite of consumer products will reduce our ratios of marketing investment to revenue and loan volume as we begin to capitalize on increased conversion rates, higher retention rates and cross-sell opportunities. In turn, we believe we will experience increased operating margins that will allow us to reinvest a portion of the savings into additional marketing, thereby acquiring more customers.
Our Distribution Channels
We distribute our products through three channels—direct retail, distributed retail and wholesale. We offer multiple channels in order to provide customers with the user experience that best suits their needs, which we believe leads to higher lead conversion. Customers can apply for a loan directly on our website or can initiate contact by phone or in person with our sales force, directly through our industry partnerships or through one of our wholesale broker partners. For the six months ended June 30, 2015, 41.3% of loans were originated through direct retail, 48.3% were originated through distributed retail and 10.4% were originated through wholesale.
Direct Retail
Our direct retail channel centers on our online platform, loanDepot.com and our proprietary customer contact centers. Launched in 2010 as our initial channel, direct retail focuses on customers who are generally more tech-savvy and therefore prefer to search for and apply for our products online. The direct retail channel is supported by four web fulfillment centers and over 450 members of our sales force to provide an easy and convenient channel for consumers to obtain loans. This system is driven by a proprietary algorithm that matches leads and initiates outbound calls based with the sales force member best suited for the customer’s applicable state and product. Consumers are able to apply for loans online with minimal personal interaction generating a rate quote within seconds. Differentiated from self-serve only models, our user-friendly online application interface provides real-time online chat or telephone assistance from a live sales force professional, as needed by the customer to ensure customer satisfaction and enhance customer conversion. The direct retail channel accounted for 41.3% and 54.8% of our loan originations for the six months ended June 30, 2015 and the year ended December 31, 2014, respectively.
139
Table of Contents
Distributed Retail
Through our distributed retail channel, we originate loans through our sales force of nearly one thousand members located across the United States, who are responsible for sourcing, engaging with and maintaining customer relationships through local real estate agents, builders and other local contacts. We initiated our distributed retail channel in October 2013 through our acquisition of imortgage and expanded our footprint in January 2015 through our acquisition of Mortgage Master. We have established key relationships with several industry partners, including joint ventures with two of the ten largest U.S. home builders and other affinity and independent home loan brokers. As of June 30, 2015, we were party to four exclusive joint ventures, three with home builders and one with a real estate brokerage company. We believe that having a local, cost-effective presence allows us to generate incremental origination opportunities and develop a personal relationship with customers. This relationship is an effective part of reaching consumers however and whenever they want to engage. The distributed retail channel accounted for 48.3% and 39.7% of our loan originations for the six months ended June 30, 2015 and the year ended December 31, 2014, respectively.
Wholesale
Through our wholesale channel, LDWholesale, we offer our products in 47 states through a nationwide network of over 500 independent wholesale brokers which employ over 2,400 licensed loan sales agents as of June 30, 2015. Launched in April 2014, our wholesale channel allows us to work through our network of brokers to distribute our entire suite of loan products to a broader scope of consumers. Brokers identify applicants, help them complete a loan application, gather required information and documents and act as our liaison with the customer during the lending process. The application submitted on behalf of a broker is uploaded to our proprietary underwriting system, where the application is either accepted or rejected. If accepted, our system determines the range of interest rates and other loan terms, and we then fund the loan upon acceptance by the customer and satisfaction of loan conditions. We believe that leveraging local brokers who are able to market our products and assist customers throughout the loan application process can help to efficiently expand our business in a capital-light fashion. In all cases, we are responsible for underwriting an application and determining key loan terms and ultimately have direct contact with the customer upon funding allowing us to develop and maintain a lifetime relationship, including future cross-sell opportunities. The wholesale channel accounted for 10.4% and 5.5% of our loan originations for the six months ended June 30, 2015 and the year ended December 31, 2014, respectively.
Our Technology
We custom built our technology platform to support rapid growth and deliver a consistent, predictable customer experience while positioning us to meet the demands of all constituents of today’s consumer lending market, including borrowers, capital providers and regulators. We have developed technology-driven marketing and origination capabilities which provide substantial operating leverage as we continue to grow our operations and scale. Additionally, we have implemented sophisticated data storage and virtual server technologies to create a highly scalable and flexible infrastructure to support our growth. We believe our platform has been a key factor in our ability to grow our originations and has helped with the expeditious and seamless integration of our two key acquisitions. Key elements of our technology include:
Lead Generation and Customer-Specific Matching
Our technology was developed with a focus on converting the over 300,000 leads a month that we generate into appropriate loan products that best suit our customers’ needs. Our proprietary systems have been developed to provide our sales force with a detailed customer profile that determines the most optimal loan products to offer a customer before making contact, allowing our sales force to offer customized lending solutions. Moreover, as we further develop and expand our product suite, our technology has been developed to utilize the data warehoused in our customer database to identify additional suitable products as well as aid our sales force by identifying customers who could benefit from new loan product offerings.
140
Table of Contents
Product and Channel Integration
We developed a centralized loan origination system in order to offer all products to borrowers using a multi-channel approach. This system enables us to evaluate and offer all products in real-time to a consumer regardless of the channel through which they choose to engage with us.
Proprietary Contact Management System
We have developed a fully automated contact system driven by a proprietary algorithm primarily based on years of customer acquisition and lending experience. The system manages customer dialing, lead flow and routing based on our sales force availability according to their state licenses and product expertise. This system, combined with our flexible and dynamic sales force, maximizes consumer engagement. We believe that this proprietary contact management system is a significant competitive advantage for converting leads and reducing staff cost.
Loan Underwriting
Our centralized origination systems are specifically designed to guide each loan through our underwriting and verification processes efficiently and expeditiously. Our systems are designed to automatically ensure that each loan is underwritten and documentation verified at a high standard, which we believe results in a consistently high-quality loan product. All loans, regardless of product or origination channel, are monitored through our platform by our centralized capital markets team throughout the origination process to ensure reliable execution upon loan issuance for all customers. While home loan underwriting is currently heavily influenced by the GSEs, we incorporate components of our underwriting scoring, processes and standards that are important for our other non-Agency home loan and personal loan products to help evaluate consumers’ ability and willingness to repay their loans.
Home Loans
Once a customer has been “pre-approved” for a home loan by a licensed loan sales agent, the customer loan information is sent to our loan origination system, and the loan application information is fully underwritten by a loanDepot underwriter that verifies a wide spectrum of items including but not limited to assets, customer credit and income. Throughout our underwriting group we have specialized and subject matter experts that focus on certain aspects of the loan underwriting process. We believe that our experts help ensure both efficiency and, more importantly, loan quality. For home loans, we perform diligence on every loan by using our technology to analyze the credit, collateral and compliance risk in order to ensure that each home loan meets our purchasers’ standards and all applicable regulatory rules. Our technology-driven credit analysis is based on multiple consumer attributes and supported by extensive historical data.
Currently almost all of our home loan products require income and asset verification. We generally utilize several methodologies to verify income including third-party information services that link directly to sources such as the IRS. Additionally, almost all of our home loan programs require a full property appraisal that is in compliance with rules and regulations as set forth by the Dodd-Frank Act and other agencies such as the CFPB. Once a loan has been fully underwritten and underwriting approvals have been received the borrower executes the loan documents with an attorney or notary and generally receives funds within several days thereafter.
Personal Loans
For personal loans, we perform underwriting services on behalf of our issuing bank partner. Our personal loan underwriting provides integrated and automated application and credit decisioning functionality. Consumers can apply online or contact a live sales agent. Regardless of the channel through which a consumer applies, we utilize a proprietary algorithm taking a range of information including a consumers’ transactional and payment data, employment information, total credit exposure and more traditional risk assessment data points such as FICO scores. Based on the information provided and utilized, a specific loan or risk grade will be assigned to the
141
Table of Contents
application. Each risk grade has different pricing, cost and line assignment characteristics. If an application is approved a range of options are provided to the consumer which could show different loan amounts, terms and interest rate. A consumer will then select their desired loan terms, within the parameters provided, and final underwriting and verification will commence. Borrower information is verified prior to funding using our technology, which includes state-of-the-art fraud detection tools, to ensure compliance with all regulations. We utilize several methodologies and technologies to verify a consumers’ identity through both physical documentation that can be digitally uploaded securely by a consumer or through third-party service providers.
Automated Credit Modeling and Decisioning
We have developed a proprietary credit risk engine that analyzes customer data to determine the credit risk profile of our potential customers for personal loans, and we expect to expand the use of such credit risk engine across our product suite in the future. We consider behavioral, transactional and other data in tandem with traditional risk assessment tools, such as employment history, debt payment history and FICO scores, to determine a proprietary credit underwriting score and decision in real-time. Given the majority of home loans originated post-Financial Crisis have been Agency loans, the primary credit decisioning has been determined by the underwriting guidelines of the Agencies. We expect this to shift over time as private investors are anticipated to increasingly participate in the secondary market, and we believe we have the risk engines in place to take advantage of the shift away from almost exclusively Agency home loans. The credit modeling and decisioning for our personal loan product is exclusively driven by our proprietary risk engines.
Extensive Consumer Database
We retain consumer data from existing customers as well as previous consumer contacts, regardless of whether or not they closed a loan with us, in a proprietary database. This database currently holds financial and contact information for over 11 million consumers, which is used to identify and match attractive loan products to likely customers. Our consumer database continues to grow monthly via our marketing and lead generation efforts. In addition, our consumer database is linked with our proprietary contact management system directing lead opportunities to our sales force. We believe our database is a significant competitive advantage that will help enhance lead generation effectiveness and increase repeat customer rates across our loan products. We also believe we can continue to improve our recapture rate as we are able to cross-sell additional products to customers.
Data Integrity and Security
Our information security strategy is designed to mitigate risk to our information assets and customer information and to safeguard sensitive data. We continually implement information-security best practices to identify areas of risk and continually enhance our security infrastructure. Additionally, we have deployed enterprise-class network firewall technology and endpoint protection to safeguard sensitive customer data. Further, we continually monitor new security threats as well as new technology developments to maintain state-of-the-art data integrity and security standards.
Our Infrastructure
Funding and Capital Markets
Our dedicated capital markets team has significant experience in the consumer finance sector with both home loan and personal loan products. The primary responsibility of the capital markets team is to ensure maximum sale proceeds for all loan products, while managing interest rate and market volatility risk through real-time loan pricing and hedging. All of our home loan products are sold directly to the GSEs, Ginnie Mae or investors through the secondary market. On average, our home loans reside on our balance sheet for 17.3 days. For personal loans, under our current model, loans are sold directly from our bank partner to investors without ever residing on our balance sheet. As a non-portfolio lending platform, liquidity is very important to the overall success of our business and is primarily managed by our capital markets team.
142
Table of Contents
Sales Force Licensing Program
We have developed a proprietary in-house training system that efficiently licenses members of our sales force through a rigorous training process. We are one of the few originators that have developed this training in-house, and we believe our extensive sales force licensing provides us with a significant competitive advantage. On average, the more than 1,500 members of our sales force become licensed in five states, compared with the typical one or two licenses that most loan officers hold, which allows us to maintain a flexible business model with the ability to optimize our capacity utilization to shift quickly based on origination demand in different geographies.
Compliance
We operate within a complex portion of the financial sector and our business requires a significant compliance and regulatory infrastructure. Since launching our business in 2010, we have developed an operating platform designed to meet the needs of today’s compliance and regulatory environment. We leverage our proprietary technology and automated systems which are designed to ensure that all processes operate in a compliant manner. We believe our use of best-in-class, purpose-built technology helps reduce errors and ensures standardized compliant processes.
We employ an in-house team of lawyers and other professionals dedicated to legal, regulatory and compliance related matters. Our compliance functions sit independently of our production operations from a reporting perspective, which allows for autonomy. However, our compliance department also works alongside the production areas of our organization on a day-to-day basis, which enables our compliance function and business units to collaborate and work more efficiently. We regularly and proactively engage with our regulators to stay ahead of regulatory trends. In addition, we utilize third-party verification and internal audit procedures to ensure compliance on fundamental issues. We view our infrastructure and culture of compliance to be a competitive advantage, as it enables us to leverage our platform and rapidly scale our business while minimizing, as much as possible, compliance risk.
Competition
As a technology-enabled consumer platform that provides multiple credit products, we compete with other alternative, non-bank lenders across various products, including credit marketplaces and originate-to-hold lenders. We also compete for customers with other financial institutions and companies including banks, credit unions and consumer finance companies.
We believe that the principal factors that generally determine competitive advantage within our market include:
| • | ease of loan application process; |
| • | overall customer experience; |
| • | brand recognition and trust; |
| • | loan features, including rate, fees, term and pay-back method; |
| • | loan product fit; |
| • | transparent description of key terms; and |
| • | effectiveness of customer acquisition. |
We believe we compete favorably on the basis of our proprietary technology, multi-channel origination platform, scale, brand and broad suite of products.
143
Table of Contents
Supervision and Regulation
We describe below the material elements of the regulatory and supervisory framework applicable to us. Statutes, regulations and policies that affect home loan and personal loan lending and servicing are continually under review by Congress and state legislatures and federal and state regulatory agencies, and a change in them, including changes in how they are interpreted or implemented, could have a material effect on our business. The regulatory and supervisory framework applicable to originators, lenders and facilitators in the home loan and personal loan markets is generally intended to protect consumers and not investors in such companies.
Supervision and Enforcement
Because we are not a depository institution, we generally do not benefit from federal preemption of state mortgage lending, loan servicing or debt collection licensing and regulatory requirements. Accordingly, we must comply with state licensing requirements in all of the states in which we conduct business. We are licensed as a loan originator in all 50 states and the District of Columbia and also are licensed as a loan servicer and loan broker in a number of states and jurisdictions in which such licenses are required. We are also subject to an extensive framework of state laws in the jurisdictions in which we do business, and to periodic audits and examinations conducted by the state regulators to ensure compliance with those laws. From time to time, we receive requests from state regulators and other agencies for records, documents and information regarding our policies, procedures and practices related to our loan origination, loan facilitation, loan servicing and debt collection operations. State attorneys general, state licensing regulators, and state and local consumer protection offices have authority to investigate consumer complaints and to commence investigations and other formal and informal proceedings regarding our operations and activities.
We are also subject to supervision and enforcement activity by federal government entities. Under the Dodd-Frank Act, the CFPB was established in 2011 to ensure, among other things, that consumers receive clear and accurate disclosures regarding financial products and to protect consumers from hidden fees and unfair, deceptive or abusive acts or practices. The CFPB has broad supervisory and enforcement powers with regard to nonbanking companies, such as us, that engage in the origination and servicing of home loans and personal loans. As an approved originator and servicer of loans that are guaranteed by FHA and VA and loans that are sold to Fannie Mae and Freddie Mac, our operations also may be reviewed by these, and other, entities with whom we do business. We are also subject to oversight by the Federal Trade Commission, HUD and FHFA.
Compliance Audits by HUD Office of Inspector General
The OIG recently completed two compliance audits of our operations in order to determine: (i) whether we originated FHA loans containing down payment assistance (“DPA”) in accordance with HUD FHA regulations; and (ii) whether we originated FHA loans containing Golden State Finance Authority DPA in accordance with HUD FHA regulations.
In connection with each audit, the OIG found that the FHA loans we originated did not always meet HUD requirements, alleging that the DPA used for certain loans constituted ineligible gifts and secondary financing funds which improperly resulted in a premium interest rate for the borrower. Specifically, the OIG contends that funds provided by HFAs cannot properly be considered DPA funds. Accordingly, the OIG (i) recommended that HUD’s Associate General Counsel for Program Enforcement determine legal sufficiency and, if legally sufficient, pursue civil and administrative remedies, civil monetary penalties or both against us and our principals or both and (ii) recommended that HUD’s Deputy Assistance Secretary for Single Family Housing require us to cease originating FHA loans with the allegedly ineligible assistance; indemnify HUD for all FHA loans identified by the OIG as ineligible and any other loans that likely contain ineligible assistance (which could result in an indemnification obligation exceeding $100 million); reimburse amounts (less than $100,000 in the aggregate) to borrowers for fees that the OIG alleges were not customary or reasonable or were not representative of their intended purpose; collaborate with loan servicers to reduce interest rates for borrowers that the OIG asserts
144
Table of Contents
received DPA and were charged a premium interest rate; reimburse borrowers for overpaid interest payments as a result of any premium interest rate; and to update our internal checklists to include specific HUD requirements on gifts, secondary financing premium rates, and allowable fees.
HUD has provided public guidance specifically approving the types of DPA we used and stating that it disagrees with the OIG’s position regarding DPA programs. For example, HUD issued an interpretive rule on December 5, 2012 (“Interpretive Rule”), noting that HFA provided funds could be used in DPA programs. HUD then issued Mortgagee Letter 2013-14 providing similar guidance. Most recently, on July 20, 2015 HUD issued a letter specifically responding to a similar OIG audit and noted: “The intent of our rules regarding down payment assistance is clear and allows HFAs the discretion necessary to fund these programs appropriately. HUD is taking active steps to completely resolve the issues raised in the audit and to provide proper clarity and guidance to the market.” Based on HUD’s historical guidance and recent public statements, therefore, we do not expect HUD to take any action against us based on the OIG recommendations; to the contrary, HUD representatives have suggested to industry media that the agency intends to reiterate its longstanding position that funds from DPA programs administered by housing finance agencies do not violate HUD rules.
Federal, State and Local Regulation
Our business is highly regulated. Regulatory and legal requirements are subject to change and may become more restrictive, making our compliance more complex or expensive or otherwise restricting our ability to conduct our business as it is now conducted or projected to be conducted. We are subject to extensive federal laws and regulations as well as to numerous state-specific laws and regulations. We are also subject to judicial and administrative decisions that impose requirements and restrictions on our business.
The U.S. federal, state and local laws, rules and regulations to which we are subject, among other things:
| • | prohibit basing loan officer compensation on the terms of a loan or certain other factors; |
| • | impose licensing obligations on us and our loan officers; |
| • | impose financial requirements on us, including but not limited to net worth and liquidity requirements; |
| • | limit the interest rates, finance charges and other fees that we may charge; |
| • | regulate the loan terms that we may impose; |
| • | regulate the use of credit reports and the reporting of credit information; |
| • | impose underwriting requirements; |
| • | mandate disclosures and notices to consumers; |
| • | mandate maintenance and retention of loan records; |
| • | mandate the collection and reporting of statistical data regarding our loan applications and applicants; |
| • | regulate any direct consumer marketing techniques and practices; |
| • | require us to safeguard non-public information about our customers, including encryption of such information in various situations; |
| • | regulate our servicing practices, including but not limited to responding to consumer inquiries and complaints, application of payments, collection and foreclosure practices and the administration of escrow accounts; |
| • | require us to take precautions against money-laundering and doing business with certain government-designated parties, such as suspected terrorists or parties engaged in narcotics trafficking; |
145
Table of Contents
| • | regulate the method by which appraisals are ordered and our interactions with appraisers; and |
| • | mandate the terms and conditions under which we must offer and approve loan modification programs for our servicing customers. |
Since the Financial Crisis, federal, state, local and other regulatory bodies have adopted a number of regulatory changes impacting the home loan industry, in particular as part of Titles IX, X and XIV of the Dodd-Frank Act.
Gramm-Leach-Bliley Act
The GLBA imposes obligations on us to safeguard the information we maintain regarding our customers, requires that we provide customers with notices describing how we collect, use and share their information, and allows customers to “opt out” of sharing certain information with third parties and affiliates under certain circumstances. In addition, certain states have passed a variety of laws to further protect customer information, including laws that require an affirmative “opt-in” from consumers for information requiring an opt-out under GLBA, regulate the use of Social Security numbers, require notifications to customers if the security of their personal information is breached or require us to safeguard personal information, including encryption of personal information in various situations, such as when it is transmitted electronically across public networks or stored on portable devices. Although we do not use or share customer information for marketing or other purposes, other than those allowed under the various statutes, these federal and state laws require ongoing review and monitoring to protect customer information.
Fair Credit Reporting Act
The FCRA sets out detailed requirements for us when we obtain information from credit bureaus and other “consumer reporting agencies” (“CRA”) or furnish information about our customers to CRAs. Although the law originally regulated the conduct of CRAs, subsequent amendments have greatly expanded the reach of the statute so that it now comprehensively regulates companies that use credit reports and other “consumer reports” or furnish information to CRAs. For example, the law requires us: to have a specific “permissible purpose” to obtain or use information from a CRA; to provide notices when we decline or take other adverse action on an application based wholly or partly on information from a CRA or similar credit information from a third party; to provide notices about the consumer’s credit score and the impact that the score and other credit information may have on the pricing of a loan; to investigate and, if necessary, correct items of information that we reported to a CRA that the consumer claims are inaccurate or incomplete, and institute procedures to ensure the accuracy and integrity of information we report to CRAs; and to take steps to prevent identity theft. FCRA also regulates the use of credit bureau information in credit bureau “prescreenings” and sharing of information with affiliated and nonaffiliated companies.
Finally, while the Fair and Accurate Credit Transactions Act of 2003 preempted many state and local laws that conflict with FCRA, a few provisions were exempted from preemption, most notably higher exposure under California law for reporting inaccurate information to a CRA.
Home Mortgage Disclosure Act
The Home Mortgage Disclosure Act (“HMDA”) requires us to collect, report, and publicly disclose certain data about applications for, and originations and purchases of, mortgage loans, home improvement loans, and refinancings. The data required to be collected and reported under HMDA has been expanded various times since its adoption in 1975, and includes demographic and income information regarding the home loan applicant; information regarding the loan sought, such as the loan amount, loan purpose, security property type and location, whether the annual percentage rate exceeds a certain threshold, and whether the loan is a high-cost loan under TILA; and the action taken on the loan application, such as originated, denied, approved but not accepted
146
Table of Contents
or closed for incompleteness. The federal government assesses the data reported for various purposes, including the performance of a home loan lender with respect to fair lending laws, and may commence fair lending investigations based on HMDA data. Various private parties, such as organizations representing the interests of consumers, use publicly available HMDA data to assess home loan lenders, and may make fair lending claims based on the data.
The CFPB also has focused on the accuracy of the collection and reporting of data by home loan lenders under HMDA, and may sanction lenders found not to be in compliance with HMDA. We have implemented procedures to designed to result in the collection and reporting of data in compliance with HMDA. At present, the CFPB is in the process of promulgating amendments to the HMDA implementing regulation, Regulation C that, if adopted, likely will expand our data collection and reporting obligations under HMDA. The amendments are anticipated to be adopted in 2015. The amendments likely will increase our administrative burdens and costs to collect and report HMDA data. The amendments also likely will significantly enhance the ability of the federal government and private parties to assess the lending practices of home loan lenders. The expansion of the data reported under HMDA may result in additional scrutiny of, and claims against, home loan lenders.
“High Cost” Home Loans
In addition to the high-cost home loan provisions under the federal Truth in Lending Act, several states have adopted laws or regulations intended to eliminate so called “predatory” lending practices. In particular, these new laws have required us to implement automated tools to perform loan-by-loan analysis of points, fees and other factors set forth in the laws, which often differ depending on the state, and in some cases the city or county, in which the mortgaged property is located.
Real Estate Settlement Procedures Act
RESPA is a federal consumer protection statute that, in part, requires certain disclosures to be given to a consumer at or around the time of application for and closing of a mortgage loan. The implementing regulations, Regulations X and Z, prohibit the imposition of a fee on a loan applicant, other than a fee for a credit report, before the applicant receives the time of initial application disclosure and indicates an intent to proceed with the loan transaction as set forth in the disclosure. The implementing regulations also impose limits on the extent to which fees ultimately imposed on the loan applicant may increase over fees set forth in the time of initial application disclosure. The limitations effectively require the lender to bear the burden of cost increases in various cases.
In November 2013, the CFPB finalized its TRID rule, which is intended to improve the way consumers receive information about home loans both when they apply and when they are getting ready to close. The TRID rule (also known as the Know Before You Owe Mortgage Disclosure Rule) became effective on October 3, 2015 and represents a comprehensive overhaul of not only the existing home loan disclosure rules, but the entire home loan origination process, and requires industry wide changes to the way in which home loan brokers, lenders, settlement agents, and service providers must work with each other. The TRID rule further limits the extent to which fees ultimately imposed on the loan applicant may increase over fees set forth in the time of application disclosure. The rule has required, and will continue to require, substantial expense and effort in order to implement.
RESPA also prohibits certain practices such as giving or accepting a fee, kickback or anything of value in exchange for referrals of settlement service business, though the statute does permit payments made in exchange for goods or services actually rendered. Multiple enforcement actions by the CFPB related to RESPA’s prohibition on referral fees have indicated that lenders may be required to re-draft agreements with marketing and other business partners and enhance controls to ensure compliance with this proscription. Specifically, in a September 2014 consent order with Lighthouse Title, Inc. the CFPB asserted that any payment by a home loan
147
Table of Contents
settlement service provider for marketing services that is also made in connection with a referral arrangement is impermissible under RESPA, regardless of whether the payment is reasonable compensation for the marketing services provided. The June 2015 enforcement decision by CFPB Director Cordray in In re PHH Corporation, sets forth the CFPB’s rationale for this position in providing that the RESPA provision that permits payments made in exchange for goods or services actually rendered is not an exemption from the RESPA prohibitions on giving or accepting a fee, kickback or anything of value in exchange for referrals of settlement service business. This interpretation is a substantial departure from prior interpretations of HUD and is being challenged in the U.S. Court of Appeals for the District of Columbia Circuit in PHH Corporation v. Consumer Financial Protection Bureau (No. 15-1177). If the CFPB’s position is upheld, home loan industry participants will likely need to reassess and modify, or terminate, arrangements with parties who are also business referral sources, including potentially marketing service providers and lead generators.
Under new regulations that went into effect January 10, 2014, RESPA now sets forth expansive requirements regarding home loan servicing. In particular, these requirements govern how a servicer administers escrow accounts, manages delinquent loans, handles servicing transfers, and receives and responds to borrower inquiries and notices of error. The rules also require servicers to take additional steps before purchasing insurance to protect the lender’s interest in the property.
RESPA’s requirements and prohibitions, and in particular the most recent extensive revisions, impose additional regulatory, compliance and IT development costs on us in a number of areas, including loan origination, loan servicing practices, marketing efforts and contracts with third parties. In addition to monitoring our own compliance with these requirements, where other entities service loans on our behalf, we are responsible for overseeing their practices to ensure their compliance with these requirements. As described elsewhere in this prospectus in greater detail, we utilize sub-servicers to service most of the loans we originate or facilitate. The new integrated disclosure forms that take effect October 3, 2015 make significant changes to the existing disclosure forms and will require extensive systems and procedural changes in our loan origination process, which we are in the process of implementing. Because the new disclosure requirements were mainly promulgated through amendments to Regulation Z under the federal Truth in Lending Act, certain violations related to these disclosures may be subject to the remedies and penalties set forth in that statute. It appears likely that the new disclosure requirements create liability under the Truth in Lending Act for settlement costs disclosures traditionally required under RESPA.
Truth in Lending Act
The TILA is a federal consumer protection statute that, with respect to secured residential real estate lending, is designed to promote consumer understanding of the cost of a loan, expressed in terms of an annual percentage rate, and other credit terms including the disclosure of the number, amount and due dates or periods of scheduled repayments. TILA also requires that borrowers be provided with additional disclosures for adjustable rate loans and that a Notice of Right to Cancel be provided on all refinance loans secured by the borrower’s principal residence advising the borrower of the right to cancel or rescind the loan within three days after closing. Effective with the passage of the Mortgage Disclosure Improvement Act (“MDIA”) in 2009, TILA was amended to prohibit the imposition of a fee on the applicant, other than a reasonable fee to obtain the consumer’s credit history, before the applicant receives the initial TILA disclosures, and to require a seven business day waiting period after disclosure before the loan may be consummated. If the annual percentage rate in the initial TILA disclosures becomes inaccurate, the MDIA requires that the applicant be provided with corrected TILA disclosures and requires an additional three business day waiting period after the applicant’s receipt of the disclosures before consummation may occur.
In 2011, amendments to the TILA implementing regulation, Regulation Z, that were adopted by the Federal Reserve Board became effective that that imposed restrictions on loan originator compensation. In 2014, amendments to the restrictions adopted by the CFPB under the Dodd-Frank Act became effective. The restrictions do not permit a loan broker or loan officer to be compensated based on the interest rate or other terms
148
Table of Contents
of a home loan, or based on a factor that is a “proxy” for one or more terms of a home loan. The restrictions also prohibit a loan broker or loan officer from receiving compensation from both the borrower and the lender in the same transaction.
On January 10, 2014, amendments to Regulation Z became effective that impose certain “ability to repay” requirements for mortgage loans. Before originating a home loan, lenders must determine on the basis of certain information and according to specified criteria that the prospective borrower has an independent ability to repay the loan. Lenders that make loans meeting certain underwriting and loan terms requirements, known as “qualified mortgages,” will be presumed to have complied with the new rule with respect to these loans. If the annual percentage rate on the loan exceeds a certain threshold, the presumption of compliance is rebuttable. “Qualified mortgage” requirements generally include (i) points and fees charged on the loan that do not exceed 3% of the loan amount, (ii) no risk-heightening features such as negative amortization, interest-only, or balloon payment features, (iii) a maximum loan term of 30 years or less, and (iv) debt-to- income ratios that do not exceed 43% or other parameters (depending on the qualified mortgage basis). We expect that substantially all loans that we originate will meet the qualified mortgage parameters.
TILA also applies to the servicing of home loans, and on January 10, 2014, the CFPB implemented new and revised home loan servicing requirements. Specifically, among other requirements, servicers must provide periodic billing statements, promptly credit borrowers’ accounts for payments received, and promptly provide loan pay-off information.
In general, lenders and servicers that fail to comply with the requirements of TILA may be held liable to consumers for actual damages, penalties, and attorneys’ fees, and with respect to certain loans, rescission. In addition, for certain high-cost home loans, and for violations of the TILA ability to repay requirements or loan originator compensation requirements, a lender may be liable for all finance charges and fees paid by the consumer within the first three years of the loan unless the lender is able to show that its violation was immaterial. Entities may also be subject to administrative enforcement action based on violations of TILA and its implementing regulations. In the event that a lender fails to comply with TILA’s ability to repay requirements or loan originator compensation requirements, the statute authorizes consumers to bring a defensive claim, in the event of foreclosure or other action to enforce the loan, for recoupment or setoff, which if successful would reduce the amount of debt owed by the amount that the consumer would have recovered had he or she initiated an affirmative claim under TILA.
Secure and Fair Enforcement for Mortgage Licensing Act
The Housing and Economic Recovery Act of 2008 included, among other things, the Secure and Fair Enforcement for Mortgage Licensing Act (the “SAFE Act”). The SAFE Act is designed to enhance consumer protection and reduce fraud by requiring states to establish minimum standards for the licensing and registration of state licensed mortgage loan originators, including continuing education and testing. The Conference of State Bank Supervisors (“CSBS”) and the American Association of Residential Mortgage Regulators were directed to establish and maintain a nationwide mortgage licensing system for the purpose of providing uniform license applications and reporting requirements, developing a comprehensive and supervisory database, and implementing a standard examination format. Further, the SAFE Act directs states to adopt licensing and registration requirements for individual loan originators that meet the minimum standards specified in the SAFE Act. Model state legislation, which was drafted to allow states to easily implement the federal SAFE Act’s licensing requirements, defined “mortgage loan originator” (in relevant part) as an individual who for compensation or gain or in the expectation of compensation or gain (i) takes a residential mortgage loan application, or (ii) offers or negotiates terms of a residential mortgage loan. Our licensing team is responsible for obtaining licensing for our company and our locations, as well as our loan originators and other employees required to be licensed under the SAFE Act and various state laws and regulations. In conducting routine examinations, state regulatory agencies consistently seek to investigate whether the company is appropriately licensed with regard to both company-level and individual-level authority.
149
Table of Contents
Fair Debt Collection Practices Act
The Fair Debt Collection Practices Act (the “FDCPA”) makes certain improper collection practices unlawful and imposes certain requirements for the collection of debts. By its terms, the FDCPA does not apply to a creditor’s collection of its own debts (i.e., it does not apply to a mortgage lender attempting to collect on the loans that it makes), but it does apply to creditors in certain situations, such as when the ownership or servicing of a loan is acquired when the loan is in default. However, the CFPB has warned lenders that the Dodd-Frank Act’s prohibition of unlawful, deceptive or abusive acts or practices to applies to their debt collection efforts even when they are exempt from the FDCPA, and is considering the proposal of regulations that would specifically apply certain provisions of the FDCPA to lenders.
A number of states have laws that impose requirements that are similar to, or in some cases exceed, the requirements of the FDCPA. In particular, the California equivalent of the FDCPA applies most of the provisions of the federal law to creditors collecting their own debts.
Proposed Minimum Capital and Liquidity Requirements
In June 2011, the Basel Committee announced the final framework for strengthening capital requirements, known as Basel III. In July 2013, the U.S. federal banking agencies announced the adoption of final rules to implement Basel III for U.S. banking organizations, subject to various transition periods. Compliance with the Basel III standards may result in significant costs to banking organizations, which in turn may reduce our sources of funding and increase the costs of originating and servicing home loans. If we are unable to obtain sufficient capital to meet the financing requirements of our business on acceptable terms for any of the foregoing reasons, our business, financial condition and results of operations would be materially adversely affected.
On May 20, 2015, FHFA implemented new minimum financial eligibility requirements for non-bank sellers and servicers of home loans to Fannie Mae and Freddie Mac. The minimum financial requirements include net worth, capital ratio and liquidity criteria for the non-bank mortgage firms, and are an attempt to curb perceived risks to the GSEs amidst a post-Financial Crisis industry shift that has resulted in non-bank mortgage firms playing an expanded role in home loan servicing. Specifically, any non-bank servicer who services loans sold to the GSEs equal must have minimum tangible net worth of at least six percent of the servicer’s total assets. In addition, non-bank servicers also must hold liquid assets equivalent to at least 0.035 percent of the loans they oversee for the GSEs or Ginnie Mae. This amount could increase by a rate of 200 basis points of the total of non-performing GSE and Ginnie Mae servicing assets in excess of six percent of the servicer’s total in UPB if the non-bank servicer owns, or services, many delinquent loans due to the high costs of servicing non-performing loans. In addition, all entities selling or servicing loans for the GSEs must have a net worth of at least $2.5 million plus 0.25 percent of the value of the UPB of all loans they service. This represents an increase in the amounts currently required by the GSEs, because the percentage is based off all loans serviced and not just loans serviced for the GSEs.
The new operational requirements are effective as of September 1, 2015, and the financial requirements are effective as of December 31, 2015. Compliance with the new requirements will be tested on a quarterly basis.
On March 25, 2015, the CSBS and the American Association of Residential Mortgage Regulators issued for public comment Proposed Regulatory Prudential Standards for Non-bank Mortgage Servicers designed to provide better protection for borrowers, investors, and other stakeholders; enhance effective regulatory oversight and market discipline over non-bank mortgage servicers; and improve transparency, accountability, risk management, and corporate governance standards.
The proposal includes a set of Baseline Prudential Regulatory Standards to be applied to all non-bank mortgage servicers licensed by and operating in the states covering eight areas: capital; liquidity; risk management; data standards; data protection (including cyber risk); corporate governance; servicing transfer
150
Table of Contents
requirements; and change-of-control requirements. The proposal also includes Enhanced Prudential Standards that may be appropriate for large, complex non-bank mortgage servicing companies. The proposed Enhanced Prudential Standards would deploy enhanced planning, modeling, metrics and audit for: capital; liquidity; stress testing; and living will and recovery and resolution plans.
The comment period closed on June 23, 2015. It is not known when final proposed standards may be issued or the extent to which states may adopt the final proposed standards in whole or in part. To the extent that state regulators adopt new standards, in whole or in part, it could impact our business, financial condition and results of operations.
The Dodd-Frank Act
The Dodd-Frank Act was enacted to further regulate the financial services industry, including the mortgage origination, sales and securitization industries. The CFPB was created in 2011 pursuant to authority granted by the Dodd-Frank Act. While rulemaking by the CFPB pursuant to the provisions of the Dodd-Frank Act and the enumerated set of Consumer Financial Protection laws is referenced in various sections of this prospectus, rulemaking under the Dodd-Frank Act remains ongoing and we cannot predict the ultimate effect it will have on our business.
The CFPB has exclusive authority for interpreting certain federal consumer financial protection laws and writing the related regulations to which we are subject, and it may make material changes to existing regulations and interpretations. The CFPB also is empowered with examination and enforcement authority over certain home loan origination and servicing companies, including our company. Since October 2001 the CFPB has issued guidelines outlining its approach to supervising nonbank mortgage originators and servicers, which include sending examiners to such institutions to assess whether consumers’ interests are protected. The CFPB has the authority to impose a formal or informal enforcement action if it concludes that our loan origination or servicing activities violate applicable law or regulations. The CFPB’s enforcement powers are broad, and it has authority to seek or impose a wide range of sanctions and remedies, including rescission or reformation of contracts, refund of monies, restitution, disgorgement, damages or other monetary relief, required public notice regarding a violation, limits on activities and civil money penalties. Formal enforcement actions are generally made public, which carries reputational risk. Both types of enforcement actions may require modifications to existing business practices. The results of CFPB examinations are often shared with other state and federal regulators, which may in turn initiate their own investigations and the subsequent imposition of additional penalties.
The CFPB also has enforcement authority over the conduct of third-party service providers of financial institutions. The CFPB has made it clear that it expects non-bank entities to maintain an effective process for managing risks associated with third-party vendor relationships, including compliance-related risks. In connection with this vendor risk management process, we are expected to perform due diligence reviews of potential vendors, review vendors’ policies and procedures and internal training materials to confirm compliance-related focus, include enforceable consequences in contracts with vendors regarding failure to comply with consumer protection requirements, and take prompt action, including terminating the relationship, in the event that vendors fail to meet our expectations. The CFPB is also applying greater scrutiny to compensation payments to third-party providers for marketing services and has issued guidance that potentially narrows the range of acceptable payments to third-party providers as part of marketing services agreements, lead generation agreements and other third-party marketer relationships. Specifically, in October 2015, the CFPB issued a compliance bulletin stating that, although the CFPB did not say that all marketing services agreements are illegal, the CFPB has grave concerns about the use of marketing services agreements in ways that avoid the requirements of RESPA, and intends to actively scrutinize the use of such agreements. We generate a significant amount of our business through third-party marketer relationships, of which marketing services agreements represent a relatively small portion. If the CFPB were to alter the forms of acceptable payment under arrangements beyond marketing services agreements, it could have a materially adverse impact on our business.
151
Table of Contents
Our failure to comply with the laws, rules or regulations to which we are subject, including the Dodd-Frank Act and other consumer financial protection laws, whether actual or alleged, could expose us to: civil and criminal liability; loss of licenses and approvals; damage to our reputation in the industry; inability to sell or securitize our home loans or otherwise raise capital; demands for indemnification or loan repurchases from purchasers of our home loans; fines, penalties and litigation, including class action lawsuits; governmental investigations and enforcement actions; and claims that an allegedly non-compliant home loan is rescindable or unenforceable. Apart from legal and regulatory requirements, we are also subject to compliance with requirements under certain government programs in which we participate.
Although the CFPB only began its operations in July 2011, it has already commenced enforcement actions and entered into settlement agreements with a number of lenders and others in the financial services industry. These actions have included penalties based on violations of various consumer protection statutes, described elsewhere in this prospectus, as well as the Dodd-Frank Act’s prohibition on unfair, deceptive, and abusive acts and practices.
The risk retention requirement under the Dodd-Frank Act requires securitizers to retain no less than 5% of the credit risk when they create, sell, or transfer mortgage-backed securities to third parties, with an exception for securitizations that are wholly composed of QRMs. Once implemented, the risk retention requirement may result in higher costs of certain origination operations and impose on us additional compliance requirements to meet origination and servicing criteria for QRMs. The impact of the risk retention rule on the asset-backed securities market is uncertain. Federal regulators re-issued the final risk retention rule on October 21, 2014. For home loans, the final rule becomes effective on December 24, 2015. All qualified mortgages under the ability to repay rule will also be QRMs under the risk retention rule. The Dodd-Frank Act also amended TILA to require the creation of new Appraiser Independence Requirements (“AIR”), in the form of interim regulations promulgated by the Federal Reserve Board. The AIR, published by the Federal Reserve Board on October 28, 2010, effectively repealed and replaced the Home Valuation Code of Conduct (“HVCC”) rules previously implemented by the GSEs in May 2009. Like the HVCC rules, the AIR requires the complete independence of an appraiser. In addition, an appraiser is expected to use his or her expertise in a specified area to determine the most accurate estimate of the value for a subject property. Neither our home loan brokers nor any employee of our loan production staff is permitted to have substantive communications with appraisers. We have agreements in place with our appraisal management companies that prohibit these companies and their appraisers from communicating with our approved brokers or our production staff.
While we continue to evaluate all aspects of the Dodd-Frank Act, the actions of the CFPB, including continuing supervision of our operations, new regulations promulgated under the Dodd-Frank Act, and interpretations and enforcement of new and existing consumer protection laws, could materially and adversely affect the manner in which we conduct our operations and result in heightened federal regulation and oversight of our business activities, increased compliance costs and potential litigation or enforcement actions associated with our business activities.
State Usury Laws
As described more fully elsewhere in this prospectus, we have established a relationship with Cross River Bank, an FDIC-insured New Jersey-chartered bank, for purposes of our personal loan platform. The personal loans we make available are originated by Cross River Bank and sold by it, shortly after origination, to third-party investors. Because Cross River Bank is an FDIC-insured bank chartered by the State of New Jersey, we believe that the interest rates on these loans are governed nationwide by Section 27 of the Federal Deposit Insurance Act, without regard to more restrictive laws that might otherwise apply in other states. Section 27 authorizes a state bank to charge interest at the rate allowed by the law of the state where it is located, which in New Jersey is 30% per annum on loans to individuals and 50% per annum on loans to corporations, limited liability companies and limited liability partnerships.
152
Table of Contents
The applicability of Section 27 to the personal loans originated through our platform can be challenged on two potential bases: First, it could be argued that, notwithstanding Cross River Bank’s funding of the loans and its formal status as the lender, as a matter of substance either loanDepot or the nonbank assignee and not Cross River Bank should be treated as the “true lender,” with the result that state usury laws and not federal law would apply. Second, it could be argued that, even if Cross River Bank is the “true lender,” Section 27 ceases to apply once Cross River Bank sells a loan to a third party investor, again with the result that state usury laws would apply.
The “true lender” argument has been litigated in a number of courts. Most commonly, these cases have involved short-term “payday loans” offered at triple-digit annual percentage rates, where the nonbank partner of the bank nominally making the loan provides turnkey marketing, billing, collection and accounting services in connection with the loans and also acquires the predominant if not entire economic interest in the loans. However, cases raising this issue have also arisen in other contexts, including student loans at modest interest rates and installment loans at higher interest rates (but less than 100%). Courts considering the issue have reached differing conclusions. Accordingly, even though rates on personal loans under our program are capped at 30% per annum and even though we do not purchase any loans, there nevertheless remains a risk that a court in one or more jurisdictions could conclude that the loans are unlawful on the theory that Cross River Bank is not the “true lender.”
Regarding the second potential argument against the program, in May 2015, the United States Court of Appeals for the Second Circuit issued a decision in Madden v. Midland Funding, holding that a nonbank loan purchaser cannot rely on federal law to continue charging the interest the bank lender can charge under federal law. This decision is binding in the Second Circuit but not in other parts of the country. We believe it conflicts with the thrust of decisions previously reached by other courts, including decisions it fails to cite. Moreover, we believe that Madden addresses whether the interest authority of a bank lender will necessarily carry over to the bank’s assignee as a matter of federal law but not whether the authority continues as a matter of state common law. Nevertheless, as a result of Madden, Cross River Bank limits in New York, Connecticut and Vermont (the three states within the Second Circuit) the maximum interest rates on personal loans offered through our platform. If it becomes necessary in the future, we believe that a number of options are available to deal with Madden and any like decisions in other circuits (for example, having Cross River Bank sell loan participations rather than whole loans).
If a state attorney general or other authority (or a borrower suing on a class basis once our arbitration agreements no longer protect us against class actions) were to successfully attack our program with Cross River Bank on the basis of either the “true lender” and/or the Madden argument, we could be compelled in the state in question to pay restitution and/or usury penalties as to existing loans (and any new loans originated at rates that are not permitted under the laws of the states in question), subject to applicable statutes of limitation. We could also be required to lower the maximum rates or fees charged on personal loans offered through the platform, even outside the Second Circuit, obtain additional licenses and/or make other changes to our mode of operation. These changes could reduce our profits and operating efficiency with respect to personal loans.
Fair Housing Act
The Fair Housing Act and HUD regulations promulgated thereunder prohibit discriminating against any person in making available, or in the terms or conditions of, a residential real estate related transaction because of race, color, religion, sex, handicap, familial status or, national origin. Under the Fair Housing Act, home loan lenders and servicers may not discriminate against applicants or borrowers on any of the indicated bases. In addition to reputational harm, violations of the Fair Housing Act can result in actual damages, punitive damages, injunctive or equitable relief, attorneys’ fees and civil money penalties.
On February 8, 2013, HUD issued final regulations to formalize potential liability for violations of the Fair Housing Act based on the disparate impact that a policy, procedure or practice may have on a protected class of
153
Table of Contents
borrowers. These HUD regulations cover mortgage lending and servicing, as well as the purchase of mortgages. During its 2014-15 term, the U.S. Supreme Court found that disparate-impact claims are cognizable under the Fair Housing Act. Although the Supreme Court referred to the HUD rule, it did not specifically opine on whether its decision effects the HUD rule The DOJ has recently brought numerous actions against lenders for alleged violations of this law.
Electronic Signatures in Global and National Commerce Act/Uniform Electronic Transactions Act
In order for us to provide disclosures electronically to borrowers and to obtain an effective signature on loan and other documents, we are required under the Electronic Signatures in Global and National Commerce Act (“ESIGN”) and similar state laws, notably the Uniform Electronic Transactions Act (“UETA”), to provide certain information about the electronic disclosure process (such as the hardware and software the customer will need to access and maintain the electronic disclosures) and to obtain the borrower’s consent to receive required federal and state disclosures electronically in such a manner that reasonably demonstrates the borrower’s ability to access the disclosures in electronic form. We are additionally required to maintain electronic records of such transactions in compliance with ESIGN and UETA requirements. The TRID rule addressed elsewhere in this prospectus imposes an additional requirement that the ESIGN consent process be completed before any disclosures under the TRID rule may be transmitted electronically.
Electronic Fund Transfer Act
The Electronic Fund Transfer Act and Regulation E promulgated thereunder establish the rights, liabilities and responsibilities of borrowers who use electronic fund transfer services. As a general matter, Regulation E provides that preauthorized electronic fund transfers from a consumer’s account must be authorized by the consumer in a manner that meets certain specific requirements. In addition, transfers performed by ACH electronic transfers are subject to detailed authorization, timing and notification rules and guidelines administered by the National Automated Clearinghouse Association. Most transfers of funds in connection with the origination and repayment of the loan are performed by ACH. We are required to obtain necessary authorization from borrowers and investors for such transfers in compliance with these rules. We also are prohibited from conditioning an extension of credit upon a consumer’s agreement to pay via preauthorized recurring transfer.
Equal Credit Opportunity Act
The ECOA and Regulation B promulgated thereunder prohibit creditors from discriminating against credit applicants on the basis of race, color, sex, age, religion, national origin, marital status, the fact that all or part of the applicant’s income derives from any public assistance program or the fact that the applicant has in good faith exercised any right under the federal Consumer Credit Protection Act or any applicable state law. The prohibition against discrimination applies to every aspect of an applicant’s dealings with a creditor regarding an application for credit or an existing extension of credit, including the initial application and underwriting process, servicing, furnishing of credit information, and collection procedures. The statute and regulation also include many other requirements. For example, creditors must provide a notice to applicants against whom they take adverse action, including a statement of the reasons for the action or the applicant’s right to receive the reasons on request and provide a copy of the appraisal to applicants for credit secured by a first mortgage lien. Regulation B includes detailed technical requirements related to information that a creditor may obtain or use about applicants, such as limitations on discounting or excluding from consideration “protected” income such as alimony, child support, or separate maintenance payments or retirement income. In addition to reputational harm, violations of the ECOA can result in actual damages, punitive damages, injunctive or equitable relief, attorneys’ fees and civil money penalties.
154
Table of Contents
Telephone Consumer Protection Act and the Telemarketing Sales Rule
The Telephone Consumer Protection Act (the “TCPA”), Telemarketing Sales Rules and related laws and regulations govern, among other things, communications and advertising via telephone and facsimile. The FCC and the FTC have responsibility for regulating various aspects of these laws, such telephone calls, text messages facsimile advertising and the use of automated telephone dialing systems and prerecorded or artificial voice messages. These agencies maintain “do-not-call” registry requirements which, in part, mandate that companies such as us maintain and regularly update lists of consumers who have chosen not to be called. These requirements also mandate that we do not call consumers who have chosen to be on a state or national do-not-call list. During this same time, over 25 states have also adopted similar laws, with which we must also comply. As with other regulatory requirements, these provisions impose additional regulatory and compliance costs on us, limit our ability to communicate with consumers for non-marketing purposes and reduce the effectiveness of our marketing programs.
Among other provisions, the TCPA provides that it is “unlawful for any person within the United States, or any person outside the United States if the recipient is within the United States … to make any call (other than a call made for emergency purposes or made with the prior express consent of the called party) using any automatic telephone dialing system or an artificial or prerecorded voice … to any telephone number assigned to a … cellular telephone service… or any service for which the called party is charged for the call.” In 2013, the FCC adopted new rules stating that the party making the call must obtain “prior express written consent” from the called party with respect to any communication covered by the TCPA made after October 16, 2013, which introduces an advertisement or constitutes telemarketing.
We use automatic telephone dialing equipment to place marketing calls to consumers and generally rely on third party lead generators to obtain appropriate consent from the called parties. If we were to place collection or marketing calls to consumers without prior express consent (or prior express written consent, as applicable), we could be exposed to liability. Specifically, the TCPA provides a private right of action under which a plaintiff may recover actual monetary loss or $500 per violation of the prohibitions on calls made using an “artificial or pre-recorded voice” or ATDS. A court may treble the amount of damages upon a finding of a “willful or knowing” violation. This action may be brought by the FCC, a state attorney general, an individual, or a class of individuals. The TCPA places no cap on damages for claims brought individually or as a class action. Because there is no overall cap on damages (unlike many other consumer protection laws), the number of violations can mount quickly, and because damages can be trebled in the event of a willful or knowing violation, the potential liability for systemic or repeated TCPA violations can be extensive.
Servicemembers Civil Relief Act
The SCRA allows military servicemembers to suspend or postpone certain civil obligations so that the servicemember can devote his or her full attention to military duties. The majority of the relevant protections under the SCRA are limited to obligations or liabilities incurred prior to active duty. When an eligible servicemember notifies a lender that he or she has been called to active duty and provides a copy of the military orders calling the servicemember to active duty, the lender is required to reduce the interest rate on the servicemember’s obligation to 6% for the time that the servicemember is on active duty (and one year thereafter for an obligation or liability consisting of a home loan, trust deed, or other security in the nature of a home loan). The SCRA also prevents a creditor from completing a foreclosure proceeding against a servicemember without first obtaining a written waiver from the servicemember or a court order permitting the foreclosure to proceed. In a judicial proceeding where the servicemember does not make an appearance, the SCRA requires the plaintiff to file a military status affidavit with the court and empowers the court to delay the proceedings, appoint an attorney to represent an absent active duty servicemember, or require the posting of a bond to protect the servicemember.
Bank Secrecy Act
The Bank Secrecy Act (“BSA”) requires us, the GSEs and Cross River Bank to comply with anti-money laundering, customer due diligence and record-keeping policies and procedures. In 2001, Congress amended the
155
Table of Contents
BSA through its enactment of the Uniting and Strengthening America by Providing Appropriate Tools Required to Intercept and Obstruct Terrorism Act, which was designed to prevent, detect and prosecute terrorism, to fight international money laundering and to block terrorist access to the U.S. financial system. The amendments require financial institutions to conduct due diligence and recordkeeping with respect to borrowers, such as verifying an applicant’s identifying information, including name, address, phone number and Social Security number, and ascertaining that the applicant is not named on any terrorist list.
The BSA has historically been enforced with respect to depository institutions, but various BSA requirements also apply to any “financial institution,” which includes a loan or finance company. The Financial Crimes Enforcement Network (“FinCEN”), which enforces the BSA, has issued regulations implementing the BSA’s anti-money laundering program and suspicious activity report filing requirements with respect to residential mortgage lenders and originators. These regulations require us to maintain a written anti-money laundering program that is reasonably designed to prevent us from being used to facilitate money laundering or terrorist financing, and to file suspicious activity reports with FinCEN in response to potentially unlawful activity or transactions. We have implemented policies and procedures to comply with the requirements of the BSA and its implementing regulations.
U.S. Controlling the Assault of Non-Solicited Pornography and Marketing Act
The U.S. Controlling the Assault of Non-Solicited Pornography and Marketing Act (“CAN-SPAM”) prohibits certain e-mail messages, as defined in the law. The FTC has responsibility for regulating various aspects of the law, including identification of commercial messages as a solicitation, recipient consent and e-mail content and format. CAN-SPAM and its applicable regulations provide that recipients of applicable messages must be allowed to opt-out of receiving future messages and requires senders to honor opt-out requests within certain time frames. Such regulatory requirements impose additional regulatory and compliance costs.
Other Laws
We are subject to various other laws, including employment laws related to hiring practices and termination of employees, health and safety laws, environmental laws and other federal, state and local laws in the jurisdictions in which we operate.
Employees
As of June 30, 2015, we had 4,126 full-time equivalent employees and 51 part-time employees, all of whom are based in the United States. As of June 30, 2015, we also employed 213 full-time contractors and 12 part-time contractors. None of our employees is represented by a labor union and we consider our employee relations to be good.
Facilities and Real Estate
Our corporate headquarters are located at Towne Centre Plaza, 26632, 26642 and 26672 Towne Centre Drive, Foothill Ranch, California 92610, in a three building development totaling 131,267 square feet of leased office space. This location houses our corporate office, our largest sales and processing team, our support services, technology and operations, as well as our administrative offices.
We lease three additional facilities in Franklin, Tennessee, Scottsdale, Arizona, and Plano, Texas. Our Franklin location is primarily a sales office, our Scottsdale location houses some of our sales, processing and operations employees, and our Plano location includes employees from nearly all aspects of our business, including our servicing department. In addition, we lease over 130 sales office locations, licensed to lend in each state in the United States.
156
Table of Contents
None of our leases extend beyond 10 years and the financial commitments are immaterial to the scope of our operations.
Intellectual Property
We hold registered trademarks with respect to the name loanDepot and logos and various additional designs and word marks relating to the loanDepot name. We do not otherwise rely on any copyright, patent or other form of registration to protect our rights in our intellectual property. Our other intellectual property includes proprietary know-how and technological innovations, such as our proprietary credit decisioning and scoring models, and other trade secrets that we have developed to maintain our competitive position.
Legal Proceedings
From time to time, we and certain of our subsidiaries are involved in various lawsuits in state or federal courts regarding violations of state or federal statutes, regulations or common law related to matters arising out of the ordinary course of business. We are not currently subject to any other material legal proceedings.
157
Table of Contents
Executive Officers and Directors
The following table sets forth information as to persons who serve as loanDepot, Inc.’s executive officers and directors. Biographical information for each of the executive officers and directors can be found below. The positions referenced in the biographies represent the final positions held. Upon completion of the offering, we expect to have five individuals serving as our directors. After the completion of the offering, we expect that additional directors who are independent in accordance with the criteria established by the NYSE for independent board members will be appointed to loanDepot, Inc.’s board of directors.
| Name |
Age |
Position(s) | ||||
| Anthony Hsieh |
50 | Chairman and Chief Executive Officer | ||||
| Jeff DerGurahian |
40 | Executive Vice President, Capital Markets | ||||
| Bryan Sullivan |
39 | Executive Vice President, Chief Financial Officer | ||||
| Brian Biglin |
46 | Chief Risk Officer | ||||
| Peter Macdonald |
49 | Executive Vice President, General Counsel | ||||
| Dominick Marchetti |
42 | Chief Technology Officer | ||||
| Mike Smith |
48 | Chief Accounting Officer | ||||
| Brian P. Golson |
45 | Director | ||||
| Andrew C. Dodson |
38 | Director | ||||
| John C. Dorman |
65 | Director | ||||
| Dawn Lepore |
61 | Director | ||||
Background of Our Executive Officers and Directors
Anthony Hsieh. Mr. Hsieh founded loanDepot and has served as Chairman and Chief Executive Officer since its formation in December 2009. He has been Chairman and Chief Executive Officer of loanDepot, Inc. since its formation in July 2015. Mr. Hsieh has more than 30 years of experience in the lending industry. Prior to starting loanDepot, he was instrumental in the development and success of many consumer lending firms. In 2002, Mr. Hsieh founded HomeLoanCenter.com, the first national online lender to offer a full spectrum of home loan products featuring live interest-rate quotes and loan offerings tailored to borrowers’ needs and credit profiles. He continued to lead the business for three years after it merged with IAC/Interactive subsidiary, LendingTree in 2004. In 1989, he acquired a mortgage brokerage company and transformed it into LoansDirect.com just as the internet sector was taking off. It became one of the most profitable and successful mortgage lenders throughout the 1990s before it was acquired by E*TRADE Financial in 2001. Mr. Hsieh’s executive leadership experience and extensive knowledge of our business and the consumer lending industry qualify him to serve as a member of our board of directors.
Jeff DerGurahian. Mr. DerGurahian was appointed Executive Vice President, Capital Markets of loanDepot, Inc. at its formation in July 2015 and has served as Executive Vice President, Capital Markets of LDLLC since joining us in May 2012. He oversees our secondary marketing and capital markets efforts including investor relations, loan trading, hedging, pricing strategies and product development. Prior to joining loanDepot, Mr. DerGurahian served for nine years as Executive Vice President of Capital Markets for Prospect Mortgage, LLC (formerly MetroCities Mortgage), and was a Hedge Manager for Tuttle Risk Management Services before joining Prospect Mortgage. Mr. DerGurahian holds a bachelor’s degree in Finance from the University of Virginia.
Bryan Sullivan. Mr. Sullivan was appointed Executive Vice President, Chief Financial Officer of loanDepot, Inc. in October 2015 and previously served as Executive Vice President, Chief Investment and Strategy Officer of LDLLC since joining us in October 2013. He is primarily responsible for leading all aspects of financial management across our multiple distribution channels and servicing businesses. Mr. Sullivan has more than 17 years of financial services experience. Prior to joining loanDepot, from June 2011 to June 2013,
158
Table of Contents
Mr. Sullivan was a lead portfolio manager and investment committee voting member of the BRAVO series of alternative capital funds at Pacific Investment Management Co. (PIMCO), where he focused on private equity investing, asset investing and other special situation investment opportunities. From September 2007 to April 2011, Mr. Sullivan was a senior member of the Special Situations group at Goldman Sachs focused on private equity, asset investing, lender finance and other distressed and special situations investing. Prior to that, he also was a financial institutions investment banker with FBR & Co., and began his career at KPMG providing assurance services to financial services clients. Mr. Sullivan earned a bachelor’s degree in Accountancy from the University of San Diego and is also a licensed CPA in the State of California (currently inactive).
Brian Biglin. Mr. Biglin was appointed Chief Risk Officer of loanDepot, Inc. at its formation in July 2015 and has served as Chief Risk Officer of LDLLC since joining us in April 2015. He leads our innovation of new mortgage and nonmortgage loan products, credit risk models and the connection of capital markets to consumer demand. Mr. Biglin has more than 20 years of experience in the lending and technology industries. Prior to joining loanDepot, from March 2014 to April 2015, Mr. Biglin served as Vice President, Chief Risk Officer at Intuit, where he led global risk, compliance, pricing and risk operations for high value transactions for Intuit’s payment, payroll and small business groups. Before that, he served as Chief Credit Risk Officer at PayPal, where he was responsible for portfolio management strategies, statistical modeling and credit risk product architecture. Other senior leadership roles he has held throughout his career include roles in business intelligence, financial modeling and product development for Washington Mutual, Household Finance and Bill Me Later. He earned a bachelor’s degree in Finance from Brigham Young University Marriot School of Management.
Peter Macdonald. Mr. Macdonald was appointed Executive Vice President, General Counsel of loanDepot, Inc. at its formation in July 2015 and has served as Executive Vice President, General Counsel of LDLLC since its formation in December 2009. He oversees all aspects of our legal department, including all litigation, regulatory compliance, audits licensing, regulatory exams, quality assurance, customer service and employment-related legal matters, in addition to managing outside counsel in all 50 states. With more than 18 years of experience advising financial services clients, Mr. Macdonald also served as General Counsel, Vice President and Secretary for Home Loan Center and LendingTree Loans from September 2003 to November 2006. Before joining the mortgage industry, he was counsel for various companies and also served as a prosecutor and Deputy City Attorney for the City of Anaheim. Mr. Macdonald earned a bachelor’s degree in Psychology from Carleton University in Ottawa and a Juris Doctor from Western State University.
Dominick Marchetti. Mr. Marchetti was appointed Chief Technology Officer of loanDepot, Inc. at its formation in July 2015 and has served as Chief Technology Officer of LDLLC since joining us in March 2015. He oversees the evolution of new technology to support our consumer-direct strategy on an enterprise level to enable the further expansion of new lending products across multiple platforms. Prior to joining loanDepot, from August 2011 to February 2015, Mr. Marchetti served as Chief Operating Officer of Blueberry Systems, where he was responsible for product development and day-to-day operations. Mr. Marchetti also served as Chief Technology Officer of First Magnus Financial Corporation, which filed for bankruptcy protection in August 2007. Throughout his career, Mr. Marchetti has created a series of industry portals, credit companies, insurance platforms and an offshore company focused on business process outsourcing.
Mike Smith. Mr. Smith was appointed Chief Accounting Officer of loanDepot, Inc. in October 2015 and has served as Chief Accounting Officer of LDLLC since joining us in September 2014. He is primarily responsible for developing and managing our financial and accounting operations. Prior to joining loanDepot, from July 2008 to June 2014, Mr. Smith served first as Senior Vice President, Finance and then as Chief Accounting Officer of commercial lender CapitalSource Inc. From May 2004 to July 2008, Mr. Smith served as the Chief Accounting Officer of Fremont Investment & Loan. Prior to that, he worked in public accounting with Deloitte & Touche LLP and Grant Thornton LLP. Mr. Smith earned his masters and undergraduate degrees in Accountancy from Brigham Young University. He became a certified public accountant in California in 1996, a certified management accountant in 1997 and a chartered global management accountant in 2012.
159
Table of Contents
Brian P. Golson. Mr. Golson was appointed as a director of loanDepot, Inc. at its formation in July 2015 and has served as a director of LDLLC since January 2010. Mr. Golson is a Managing Partner at Parthenon Capital and has been with Parthenon Capital since 2002. Prior to joining Parthenon Capital, Mr. Golson was the Chief Financial Officer and Vice President of Operations for Everdream, a software company sold to Dell providing outsourced IT infrastructure management. Mr. Golson also held leadership positions with Prometheus Partners, a middle-market private equity fund focused on recurring revenue service businesses, and GE Capital where he focused on acquisitions and divestitures of financial services and insurance businesses. Mr. Golson also serves on the boards of directors of Performant Financial Corporation (NASDAQ: PFMT), Coastal Credit, Seaside National Bank & Trust, H.D. Vest, eSecLending, Ascension Insurance, Periscope Holdings, BlueSnap and Cayan. Mr. Golson earned a B.A. in Economics from the University of North Carolina, Chapel Hill and an M.B.A. from the Harvard Business School. Mr. Golson’s leadership role at Parthenon Capital and his business and financial experience qualify him to serve as a member of our board of directors.
Andrew C. Dodson. Mr. Dodson was appointed as a director of loanDepot, Inc. at its formation in July 2015 and has served as a director of LDLLC since January 2010. Mr. Dodson is a Partner at Parthenon Capital and has been with Parthenon Capital since 2005. Prior to joining Parthenon Capital, Mr. Dodson was a consultant with Bain & Co. where he focused on mergers and acquisitions, cost control and corporate strategy for middle market technology companies. Mr. Dodson was also a financial analyst for Enron Corporation in the company’s retail group and worked for Trilogy, Inc., an enterprise software company, where he focused primarily in business development. Mr. Dodson also serves on the boards of directors of ScentAir Technologies, Envysion, Coastal Credit, H.D. Vest and Ascension Insurance. Mr. Dodson earned a B.A. from Duke University and an M.B.A. from the Harvard Business School. Mr. Dodson’s senior role at Parthenon Capital and his business and financial experience qualify him to serve as a member of our board of directors.
John C. Dorman. Mr. Dorman was appointed as a director of loanDepot, Inc. at its formation in July 2015. Mr. Dorman served as a director of Online Resources Corporation, a developer and supplier of electronic payment services, from May 2009 until it was sold to ACI Worldwide, Inc. in March 2013, and as its Chairman from June 2010 until the sale. Mr. Dorman previously served as Co-Chairman of Online Resources Corporation from January 2010 to June 2010, and as Interim Chief Executive Officer from April 2010 to June 2010. From October 1998 to August 2003, he served as Chief Executive Officer of Digital Insight Corporation, a provider of software-as-a-service for online banking and bill payment for financial institutions, and served on the board of directors of Digital Insight until the company was acquired in 2007 by Intuit, Inc. Mr. Dorman served as Senior Vice President of the Global Financial Services Division of Oracle Corporation from August 1997 to October 1998; and Chairman and Chief Executive Officer of Treasury Services Corporation, a provider of modeling and analysis software for financial institutions, from 1983 to 1997. Mr. Dorman also serves on the boards of directors of CoreLogic, Inc. (NYSE: CLGX) and DeepDyve, Inc. Mr. Dorman earned a B.A. in Business Administration and Philosophy from Occidental College and an M.B.A. in Finance from the University of Southern California. Mr. Dorman’s extensive business and financial management experience qualify him to serve as a member of our board of directors.
Dawn Lepore. Ms. Lepore was appointed as a director of loanDepot, Inc. at its formation in July 2015. Ms. Lepore served as Interim Chief Executive Officer of Prosper Marketplace, Inc., an online peer-to-peer lending platform, from March 2012 to January 2013, and as Chairman and Chief Executive Officer of drugstore.com, inc., an online retailer of health and beauty care products, from October 2004 until its sale to Walgreen Co. in June 2011. Prior to joining drugstore.com, Ms. Lepore held various leadership positions during her 21 years with The Charles Schwab Company, an investment services firm that provides brokerage, banking and investment-related services to consumers and businesses. Ms. Lepore also serves on the boards of directors of Coupons.com Incorporated (NYSE: COUP) and RealNetworks, Inc. (NASDAQ: RNWK). Ms. Lepore previously served on the boards of directors of AOL Inc. from November 2012 to June 2015, The TJX Companies, Inc. from June 2013 to June 2014, eBay Inc. from December 1999 to January 2013, The New York Times Company from 2008 to 2011, drugstore.com, inc. from 2004 to 2011 and Wal-Mart Stores Inc. from 2001 to 2004. Ms. Lepore earned a B.A. from Smith College. Ms. Lepore’s extensive operational background and
160
Table of Contents
experience as an executive and director at a diverse range of online consumer, internet technology and retail companies qualify her to serve as a member of our board of directors.
Board Composition
The number of directors which shall constitute the board of directors of loanDepot, Inc. will initially be fixed at eight directors, of whom five will be serving upon completion of the offering. The authorized number of directors may be changed by resolution of our board of directors. Vacancies on our board of directors can be filled by resolution of our board of directors. Upon the completion of the offering, our board of directors will be divided into three classes, each serving staggered, three-year terms:
| • | our Class I director will be Mr. Hsieh, and his term will expire at the first annual meeting of stockholders following the date of this prospectus; |
| • | our Class II directors will be Mr. Dorman and Ms. Lepore, and their terms will expire at the second annual meeting of stockholders following the date of this prospectus; and |
| • | our Class III directors will be Messrs. Golson and Dodson, and their terms will expire at the third annual meeting of stockholders following the date of this prospectus. |
As a result, only one class of directors will be elected at each annual meeting of stockholders, with the other classes continuing for the remainder of their respective terms.
Our board of directors has undertaken a review of the independence of each director. Based on information provided by each director concerning his or her background, employment, and affiliations, our board of directors has determined that Mr. Dorman and Ms. Lepore do not have a relationship that would interfere with the exercise of independent judgment in carrying out the responsibilities of a director and that each of these directors is “independent” as that term is defined under the applicable rules and regulations of the SEC and the listing standards of the NYSE. In making these determinations, our board of directors considered the current and prior relationships that each non-employee director has with our Company and all other facts and circumstances our board of directors deemed relevant in determining their independence, including the beneficial ownership of our capital stock by each non-employee director, and the transactions involving them described in the section titled “Certain Relationships and Related Party Transactions.”
Controlled Company
Upon completion of this offering, the Parthenon Stockholders, PCP, L.P. and Mr. Hsieh and his affiliates, collectively as a group, will control a majority of the voting power of our outstanding common stock. As a result, we will be a “controlled company” under the NYSE corporate governance standards. As a controlled company, exemptions under the standards will free us from the obligation to comply with certain corporate governance requirements, including the requirements:
| • | that a majority of our board of directors consists of “independent directors,” as defined under the rules of the NYSE; |
| • | that we have, to the extent applicable, a nominating and corporate governance committee that is composed entirely of independent directors with a written charter addressing the committee’s purpose and responsibilities; |
| • | that we have a compensation committee that is composed entirely of independent directors with a written charter addressing the committee’s purpose and responsibilities; and |
| • | for an annual performance evaluation of the nominating and corporate governance committee and compensation committee. |
161
Table of Contents
Because we intend to avail ourselves of the “controlled company” exception under the NYSE rules, we may choose to rely upon these exemptions. These exemptions, however, do not modify the independence requirements for our audit committee, and we intend to comply with the requirements of Rule 10A-3 of the Exchange Act, and the rules of the NYSE within the applicable time frame. These rules require that our audit committee be composed of at least three members, a majority of whom will be independent within 90 days of the date of this prospectus, and all of whom will be independent within one year of the date of this prospectus.
Board Committees
Upon completion of this offering, our board of directors will have three standing committees: an audit committee, a compensation committee and a governance and nominating committee. Each of the committees will report to the board of directors as they deem appropriate, and as the board of directors may request. The expected composition, duties and responsibilities of these committees are set forth below. In the future, our board of directors may establish other committees, as it deems appropriate, to assist it with its responsibilities.
Audit Committee
The audit committee provides assistance to the board of directors in fulfilling its legal and fiduciary obligations in matters involving our accounting, auditing, financial reporting, internal control and legal compliance functions by approving the services performed by our independent registered public accounting firm and reviewing their reports regarding our accounting practices and systems of internal accounting controls. The audit committee also oversees the audit efforts of our independent registered public accounting firm and takes those actions as it deems necessary to satisfy itself that the independent registered public accounting firm is independent of management. Upon completion of this offering, our audit committee will consist of Mr. Dorman (Chair), Ms. Lepore and Mr. Dodson. The SEC rules and the NYSE rules require us to have one independent audit committee member upon the listing of our Class A common stock on the NYSE, a majority of independent directors on the audit committee within 90 days of the date of the completion of this offering and all independent audit committee members within one year of the date of the completion of this offering. Our board of directors has affirmatively determined that Mr. Dorman and Ms. Lepore meet the definition of “independent directors” for purposes of serving on an audit committee under applicable SEC and NYSE rules, and we intend to comply with these independence requirements within the time periods specified. In addition, Mr. Dorman will qualify as our “audit committee financial expert,” as such term is defined in Item 407 of Regulation S-K. Our board of directors will adopt a new written charter for the audit committee, which will be available on the Investor Relations section of our website at www.loandepot.com upon the completion of this offering. The information on our website is not intended to form a part of or be incorporated by reference into this prospectus.
Compensation Committee
After completion of the offering, the compensation committee will determine our general compensation policies and the compensation provided to our directors and officers. The compensation committee will also review and determine bonuses for our officers and other employees. In addition, the compensation committee will review and determine equity-based compensation for our directors, officers, employees and consultants and will administer our equity incentive plans. Our compensation committee will also oversee our corporate compensation programs. Upon completion of this offering, our compensation committee will consist of Ms. Lepore (Chair), Mr. Golson and Mr. Dorman. Our board of directors will adopt a new written charter for the compensation committee, which will be available on the Investor Relations section of our website at www.loandepot.com upon the completion of this offering. The information on our website is not intended to form a part of or be incorporated by reference into this prospectus.
Governance and Nominating Committee
After completion of the offering, the governance and nominating committee will be responsible for making recommendations to the board of directors regarding candidates for directorships and the size and composition of
162
Table of Contents
the board. In addition, the governance and nominating committee will be responsible for overseeing our corporate governance guidelines and reporting and making recommendations to the board of directors concerning corporate governance matters. Upon completion of the offerings, our governance and nominating committee will consist of Mr. Golson (Chair), Ms. Lepore and Mr. Hsieh. Our board of directors will adopt a written charter for the governance and nominating committee, which will be available on the Investor Relations section of our website at www.loandepot.com upon the completion of this offering. The information on our website is not intended to form a part of or be incorporated by reference into this prospectus.
Role of Our Board of Directors in Risk Oversight
One of the key functions of our board of directors is informed oversight of our risk management process. Our board of directors administers this oversight function directly through our board of directors as a whole, as well as through various standing committees of our board of directors that address risks inherent in their respective areas of oversight. In particular, our board of directors is responsible for monitoring and assessing strategic risk exposure, and our audit committee will have the responsibility to consider and discuss our major financial risk exposures and the steps our management has taken to monitor and control these exposures. The audit committee will also have the responsibility to review with management the process by which risk assessment and management is undertaken, monitor compliance with legal and regulatory requirements, and review with our independent auditors the adequacy and effectiveness of our internal controls over financial reporting. Our governance and nominating committee will be responsible for periodically evaluating the Company’s corporate governance policies and system in light of the governance risks that the Company faces and the adequacy of the Company’s policies and procedures designed to address such risks. Our compensation committee will assess and monitor whether any of our compensation policies and programs are reasonably likely to have a material adverse effect on the Company.
Compensation Committee Interlocks and Insider Participation
No interlocking relationship exists between our board of directors or compensation committee and the board of directors or compensation committee of any other entity, nor has any interlocking relationship existed in the past.
Codes of Ethics
Our board of directors will adopt a general code of ethics that applies to all of our employees, officers and directors effective upon the completion of the offering. In addition, our board of directors will adopt a code of ethics for executive officers and principal accounting personnel that applies to our principal executive officer, principal financial and accounting officer and other designated members of our management effective upon the completion of the offering. At that time, the full text of our codes of ethics will be available on the Investor Relations section of our website at www.loandepot.com. We intend to disclose future amendments to certain provisions of our codes of ethics, or waivers of certain provisions as they relate to our directors and executive officers, at the same location on our website or otherwise as required by applicable law. The information on our website is not intended to form a part of or be incorporated by reference into this prospectus.
163
Table of Contents
Our named executive officers for the year ending December 31, 2014, which consist of our principal executive officer and our two other most highly-compensated executives, were:
| • | Anthony Hsieh, Chairman and Chief Executive Officer; |
| • | David Norris, President and Chief Operating Officer (who resigned from such position in August 2015); and |
| • | Jeff DerGurahian, Executive Vice President, Capital Markets. |
Summary Compensation Table
The following table sets forth information concerning the total compensation awarded to, or earned by, our named executive officers during the 2014 fiscal year.
| Name and Principal Position |
Year | Salary ($)(1) |
Bonus ($)(2) |
Stock Awards ($)(3) |
Non-Equity Incentive Plan Compensation ($)(4) |
All Other Compensation ($)(5) |
Total ($) |
|||||||||||||||||||||
| Anthony Hsieh(6) Chairman and Chief Executive Officer |
2014 | 350,000 | — | — | 1,420,599 | 60,705 | 1,831,304 | |||||||||||||||||||||
| David Norris President and Chief Operating Officer |
2014 | 337,179 | 800,000 | 6,643 | 600,000 | 3,813 | 1,747,635 | |||||||||||||||||||||
| Jeff DerGurahian EVP, Capital Markets |
2014 | 320,000 | — | — | 600,000 | 5,789 | 925,789 | |||||||||||||||||||||
| (1) | Mr. Norris is entitled to an annual base salary of $500,000. The amount shown below reflects the portion of Mr. Norris’s base salary that was paid during his partial year of employment. Mr. Norris started employment on April 14, 2014. |
| (2) | The amounts in this column represent cash retention bonuses earned by Mr. Norris during the 2014 fiscal year, as further described below under “—Employment Agreements.” |
| (3) | The amounts in this column reflect the aggregate grant date fair value of each common unit granted during the 2014 fiscal year described below under the caption entitled “—Employee Benefit Plans—Profits Interests Grants” and the table below entitled “Outstanding Equity Awards at Fiscal Year End.” The amounts shown were computed in accordance with FASB ASC Topic 718. |
| (4) | The amounts reported in the “Non-Equity Incentive Plan Compensation” column represent annual cash bonuses to our named executive officers earned during the 2014 fiscal year, as further described below under “—Employment Agreements.” |
| (5) | The compensation included in the “All Other Compensation” column consists of (i) in the case of Mr. Hsieh, the cost to the Company of services provided to Mr. Hsieh by the Company’s employees that are not related to the business of the Company, (ii) the 401(k) company matching contribution made by the Company for Messrs. Norris and DerGurahian in the 2014 fiscal year and (iii) in the case of Mr. DerGurahian, imputed income on Company-provided benefits. |
| (6) | Mr. Hsieh also serves as the Chairman of our board of directors but does not receive any additional compensation for his service as a director. |
164
Table of Contents
Outstanding Equity Awards at Fiscal Year End
The following table summarizes the total outstanding equity awards as of December 31, 2014, for each named executive officer.
| Plan Category(1) |
Number of Shares or Units of Stock that have Not Vested (#) |
Market Value of Shares or Units of Stock that have Not Vested ($)(2) |
||||||
| Anthony Hsieh |
||||||||
| Class Z Common Units |
— | — | ||||||
| Class Y Common Units |
— | — | ||||||
| Class X Common Units |
— | — | ||||||
| David Norris |
||||||||
| Class Z Common Units |
— | — | ||||||
| Class Y Common Units |
— | — | ||||||
| Class X Common Units |
7,805 | 6,643 | ||||||
| Jeff DerGurahian |
||||||||
| Class Z Common Units |
13,965 | 42,360 | ||||||
| Class Y Common Units |
1,183 | 3,387 | ||||||
| Class X Common Units |
— | — | ||||||
| (1) | As part of the Reorganization Transactions, the Class Z, Y and X common units of LDLLC will be among the classes of units converted into a single new class of LLC Units in LDLLC. Immediately after such conversion is effected, each holder of LLC Units will exchange such LLC Units on a one-for-one basis for Holdco Units in LD Holdings. See “Organizational Structure.” Assuming the sale of shares of Class A common stock in this offering at a price per share to the public of $17.00, which is the midpoint of the estimated price range set forth on the cover page of this prospectus, and after giving effect to such conversion and exchange, (a) Mr. DerGurahian’s 13,965 unvested Class Z common units would result in 214,261 Holdco Units and (b) Mr. DerGurahian’s 1,183 Class Y common units would result in 27,209 Holdco Units. At the consummation of this offering, Mr. Norris will have no unvested Class X common units. |
| (2) | Because there was no public market for our equity as of December 31, 2014, the market value of our common units as of that date is not determinable. Accordingly, we cannot calculate the market value of the unvested common units as of that date. The values reflect the grant date fair values calculated in accordance with FASB ASC Topic 718. Assumptions used in the valuation of equity-based awards are discussed in Note P, “Equity-Based Compensation,” to our audited consolidated financial statements as of and for the year ended December 31, 2014, which are included elsewhere in this prospectus. |
2015 Grants
In May 2015, LDLLC granted profits interest awards in the form of Class X common units in the amount of 1,946,283,909.740 units for Mr. Hsieh, 109,674,630.046 units for Mr. Norris and 209,355,787.819 units for Mr. DerGurahian, which will be subsequently converted to LLC Units as part of the Reorganization Transactions. Approximately 85% of Mr. Hsieh’s Class X common units vested on the date of grant and the remaining units vest monthly so that 100% of the units are fully vested on May 31, 2019, in each case subject to Mr. Hsieh’s continued employment with the Company. Approximately 15% of Mr. Norris’ Class X common units and approximately 38% of Mr. DerGurahian’s Class X common units vested on the date of grant and the remaining units vest monthly so that 100% of the units are fully vested on May 31, 2020, in each case subject to the named executive officer’s continued employment with the Company.
165
Table of Contents
Employment Agreements
We have entered into employment agreements with each of Mr. Hsieh and Mr. Norris and an offer letter with Mr. DerGurahian. The material terms of the employment agreements and the offer letter are summarized below. These summaries are qualified by reference to the actual text of the agreements, which will be filed as exhibits to the registration statement of which this prospectus forms a part.
Mr. Hsieh Employment Agreement
The employment agreement with Mr. Hsieh is effective December 30, 2009, and provides for an initial term of two years and is subject to successive one-year extensions beginning on the expiration of the initial term. The automatic extension of the employment agreement may be terminated with at least 30 days’ prior written notice from the executive or the Company stating the intent not to extend the employment term. Under the employment agreement, Mr. Hsieh is entitled to receive minimum annual base salary of $350,000, subject to annual review by the Company’s board of directors, and have the opportunity to participate in the Company’s equity incentive programs. Mr. Hsieh is eligible to participate in any bonus pool established by the board of directors and in the manner determined by the board of directors. Mr. Hsieh is also entitled to participate in the Company’s employee and fringe benefit plans as may be in effect from time to time on the same basis as other similarly situated executives of the Company generally.
Under the employment agreement, in the event of the executive’s termination of employment without “cause,” with “good reason” (each as defined in the employment agreements), the executive generally is entitled to receive, subject to the executive’s timely execution of a general release of claims: (i) any unpaid base salary and benefits through the date of termination; (ii) an amount equal to the then-current annual base salary, payable in equal installments over the twelve-month period following such termination; and (iii) a lump sum payment equal to a pro-rated portion of the executive’s annual bonus for the year of termination.
The employment agreement contains a non-solicitation provision that prohibits the executive from actively soliciting our employees, consultants or certain brokers during the period of employment and for a period of one year following termination of employment. The executive is also subject to perpetual confidentiality restrictions that protect the Company’s proprietary information, developments and other intellectual property and subject to non-disparagement covenant that prohibits the executive from disparaging us during the period of employment and at any time following termination of employment.
Mr. Norris Employment Agreement
The employment agreement with Mr. Norris is effective April 14, 2014, and provides for an initial term of three years and is subject to successive one-year extensions beginning on the expiration of the initial term. The automatic extension of the employment agreement may be terminated with at least 60 days’ prior written notice from the executive or the Company stating the intent not to extend the employment term. Under the employment agreement, Mr. Norris is entitled to receive minimum annual base salary of $500,000, subject to annual review by the Company’s board of directors, and have the opportunity to participate in the Company’s equity incentive programs. Mr. Norris earned an annual bonus equal to $600,000 with respect to 2014 fiscal year. The annual bonus target for any subsequent year will be determined by the board of directors and Mr. Norris so that Mr. Norris’ aggregate annual compensation for each applicable year is between $1,500,000 and $2,500,000. Mr. Norris is also entitled to participate in the Company’s employee and fringe benefit plans as may be in effect from time to time on the same basis as other similarly situated executives of the Company generally. In addition, Mr. Norris was entitled to receive a one-time retention payment during the first year of employment, payable as follows: (i) $500,000 was paid on the day that is ninety days following Mr. Norris’ start date; (ii) $300,000 was paid on the day that is 180 days following Mr. Norris’ start date; and (iii) $600,000 was paid on the first anniversary of Mr. Norris’ start date.
Under the employment agreement, in the event of the executive’s termination of employment without “cause,” with “good reason” (each as defined in the employment agreements), the executive generally is entitled
166
Table of Contents
to receive, subject to the executive’s timely execution of a general release of claims: (i) any unpaid base salary and benefits through the date of termination; (ii) an amount equal to the then-current annual base salary, payable in equal installments over the twelve-month period following such termination; (iii) a lump sum payment equal to a pro-rated portion of the executive’s annual bonus for the year of termination; (iv) any earned but unpaid bonus for the previous year; and (v) reimbursement of COBRA premiums paid by the executive for a period of twelve months following such termination.
The employment agreement contains a non-competition covenant that prohibits the executive from competing against us and a non-solicitation covenant that prohibits the executive from actively soliciting our customers or suppliers, in each case during the period of the executive’s employment. The employment agreement also contains a non-solicitation provision that prohibits the executive from actively soliciting our employees or consultants during the period of employment and for a period of one year following termination of employment. The executive is also subject to perpetual confidentiality restrictions that protect the Company’s proprietary information, developments and other intellectual property and subject to non-disparagement covenant that prohibits the executive from disparaging us during the period of employment and for a period of two years following termination of employment.
In August 2015, pursuant to an advisory agreement between Mr. Norris and the Company, Mr. Norris voluntarily resigned from his employment as President and Chief Operating Officer of the Company and from any offices and directorships he held with the Company or any of its affiliates. Upon his resignation, Mr. Norris agreed to provide exclusive advisory services to the Company for a period of one year following the date of his resignation. As a senior advisor to the Company, Mr. Norris is entitled to receive a base salary of $60,000 and a $940,000 bonus which shall be paid on the one year anniversary of his advisory agreement. Mr. Norris also agreed to sell to the Company 50% of his total vested Class X common units, and his unvested Class X common units were cancelled as of the date of his resignation pursuant to the grant agreements. The advisory agreement contains non-competition, non-solicitation and non-disparagement covenants and confidentiality restrictions similar in nature to those of his prior employment agreement.
Mr. DerGurahian Offer Letter
The offer letter with Mr. DerGurahian is dated April 25, 2012, and provides for an employment at-will without a specified term. Under the offer letter, Mr. DerGurahian is entitled to receive minimum annual base salary of $320,000 and have the opportunity to participate in the Company’s equity incentive programs. Mr. DerGurahian has the opportunity to earn an annual target bonus equal to up to 100% of his base salary, subject to achievement of established goals, as approved by the board of directors and pursuant to the management incentive plan. Mr. DerGurahian is also entitled to participate in the Company’s employee and fringe benefit plans as may be in effect from time to time.
Under the offer letter, in the event of the executive’s termination of employment without cause, the executive is generally entitled to receive, subject to the executive’s timely execution of a general release of claims, an amount equal to the annual base salary that the executive would have been entitled to receive if the executive were to continue employment for a period of six months following the date of such termination.
Employee Benefit Plans
Profits Interests Grants
We have granted profits interest awards pursuant to unit grant agreements for Class W, X, Y and Z common units with PCP, L.P. and certain of our directors, executive officers and employees. Class Z common units were granted under the loanDepot.com, LLC 2009 Incentive Equity Plan (the “LDLLC 2009 Incentive Equity Plan”) and Class Y common units under the loanDepot.com, LLC 2012 Incentive Equity Plan (the “LDLLC 2012 Incentive Equity Plan”). The Class W and X common units were created and issued pursuant to the 6th LLC Agreement. 567,369.53 Class Z common units were available for issuance under the LDLLC 2009 Incentive
167
Table of Contents
Equity Plan and 41,390.80 Class Y common units were available for issuance under the LDLLC 2012 Incentive Equity Plan. As of December 31, 2014, there were 10,000 outstanding Class W common units, 16,184 outstanding Class X common units, 534,008 outstanding Class Z common units under the LDLLC 2009 Incentive Equity Plan and 15,439 outstanding Class Y common units under the LDLLC 2012 Incentive Equity Plan. The granted units are subject to certain accelerated vesting upon certain events such as the sale of LDLLC. Subject to certain requirements, we have the right under the unit grant agreements to repurchase common units granted following the termination of employment of the applicable executive officer or employee. As part of the Reorganization Transactions and in connection with the completion of this offering, any outstanding Class W, X, Y and Z common units will be equitably adjusted and replaced with a single new class of LLC Units. Immediately after such conversion is effected, each holder of LLC Units will exchange such LLC Units on a one-for-one basis for Holdco Units as described under “Organizational Structure.” Following the completion of this offering and the replacement of the Class W, X, Y and Z common units, no further awards will be granted under the LDLLC 2009 Incentive Equity Plan and the LDLLC 2012 Incentive Equity Plan, and the plans will be terminated.
2015 Omnibus Incentive Plan
In connection with the offering, we adopted the loanDepot, Inc. 2015 Omnibus Incentive Plan. The 2015 Omnibus Incentive Plan provides for grants of stock options, stock appreciation rights, restricted stock, performance awards, other stock-based awards, including LTIP Units, as described below, and other cash-based awards. Directors, officers and other employees of us and our subsidiaries, as well as others performing consulting or advisory services for us, are eligible for grants under the 2015 Omnibus Incentive Plan. The purpose of the 2015 Omnibus Incentive Plan is to provide incentives that will attract, retain and motivate high performing officers, directors, employees and consultants by providing them with appropriate incentives and rewards either through a proprietary interest in our long-term success or compensation based on their performance in fulfilling their personal responsibilities. Set forth below is a summary of the material terms of the 2015 Omnibus Incentive Plan. For further information about the 2015 Omnibus Incentive Plan, we refer you to the complete copy of the 2015 Omnibus Incentive Plan, which is attached as an exhibit to the registration statement, of which this prospectus is a part.
Administration of the 2015 Omnibus Incentive Plan
The 2015 Omnibus Incentive Plan is administered by the compensation committee of our board of directors. Among the compensation committee’s powers is to determine the form, amount and other terms and conditions of awards; clarify, construe or resolve any ambiguity in any provision of the 2015 Omnibus Incentive Plan or any award agreement; amend the terms of outstanding awards; and adopt such rules, forms, instruments and guidelines for administering the 2015 Omnibus Incentive Plan as it deems necessary or proper. The compensation committee has authority to administer and interpret the 2015 Omnibus Incentive Plan, to grant discretionary awards under the 2015 Omnibus Incentive Plan, to determine the persons to whom awards will be granted, to determine the types of awards to be granted, to determine the terms and conditions of each award, to determine the number of shares of common stock to be covered by each award, to make all other determinations in connection with the 2015 Omnibus Incentive Plan and the awards thereunder as the compensation committee deems necessary or desirable and to delegate authority under the 2015 Omnibus Incentive Plan to our executive officers.
Available Shares
The aggregate number of shares of Class A common stock which may be issued or used for reference purposes under the 2015 Omnibus Incentive Plan or with respect to which awards may be granted may not exceed 14,705,882 shares (including any LTIP Units, which may be granted under the 2015 Omnibus Incentive Plan), which amount shall be increased on the first day of each fiscal year during the term of the 2015 Omnibus Incentive Plan commencing with the 2017 fiscal year by 3% of the total number of shares of common stock outstanding on the last day of the immediately preceding fiscal year or a lesser amount determined by our board of directors. The number of shares available for issuance under the 2015 Omnibus Incentive Plan may be subject to adjustment in the event of a reorganization, stock split, merger or similar change in the corporate structure or the outstanding shares of Class A
168
Table of Contents
common stock. In the event of any of these occurrences, we may make any adjustments we consider appropriate to, among other things, the number and kind of shares, options or other property available for issuance under the plan or covered by grants previously made under the plan. The shares available for issuance under the 2015 Omnibus Incentive Plan may be, in whole or in part, either authorized and unissued shares of our Class A common stock or shares of Class A common stock held in or acquired for our treasury. In general, if awards under the 2015 Omnibus Incentive Plan are for any reason cancelled, or expire or terminate unexercised, the shares covered by such awards may again be available for the grant of awards under the 2015 Omnibus Incentive Plan. With respect to stock appreciation rights and options settled in Class A common stock, upon settlement, only the number of shares of Class A common stock delivered to a participant will count against the aggregate and individual share limitations. If any shares of Class A common stock are withheld to satisfy tax withholding obligations on an award issued under the 2015 Omnibus Incentive Plan, the number of shares of Class A common stock withheld shall again be available for purposes of awards under the 2015 Omnibus Incentive Plan. Any award under the 2015 Omnibus Incentive Plan settled in cash shall not be counted against the foregoing maximum share limitations.
The maximum number of shares of our Class A common stock with respect to which any stock option, stock appreciation right, shares of restricted stock or other stock-based awards, including LTIP Units, that are subject to the attainment of specified performance goals and intended to satisfy Section 162(m) of the Code and may be granted under the 2015 Omnibus Incentive Plan during any fiscal year to any eligible individual will be 2,000,000 shares (per type of award). The total number of shares of our Class A common stock with respect to all awards that may be granted under the 2015 Omnibus Incentive Plan (including any LTIP Units, which may be granted thereunder) during any fiscal year to any eligible individual will be 2,000,000 shares. There are no annual limits on the number of shares of our Class A common stock with respect to an award of restricted stock that are not subject to the attainment of specified performance goals to eligible individuals. The maximum number of shares of our Class A common stock subject to any performance award which may be granted under the 2015 Omnibus Incentive Plan (including any LTIP Units, which may be granted thereunder) during any fiscal year to any eligible individual will be 2,000,000 shares. The maximum value of a cash payment made under a performance award which may be granted under the 2015 Omnibus Incentive Plan during any fiscal year to any eligible individual will be $5,000,000. The aggregate grant date fair value (computed as of the date of grant in accordance with applicable financial accounting rules) of all types of awards granted under the 2015 Omnibus Incentive Plan to any individual non-employee director in any fiscal year (excluding awards made pursuant to deferred compensation arrangements in lieu of all or a portion of cash retainers and any stock dividends payable in respect of outstanding awards) may not exceed $5,000,000.
Eligibility for Participation
Members of our board of directors, as well as employees of, and consultants to, us or any of our subsidiaries and affiliates are eligible to receive awards under the 2015 Omnibus Incentive Plan.
Award Agreement
Awards granted under the 2015 Omnibus Incentive Plan are evidenced by award agreements, which need not be identical, that provide additional terms, conditions, restrictions and/or limitations covering the grant of the award, including, without limitation, additional terms providing for the acceleration of exercisability or vesting of awards in the event of a change of control or conditions regarding the participant’s employment, as determined by the compensation committee.
Stock Options
The compensation committee may grant nonqualified stock options to eligible individuals and incentive stock options only to eligible employees. The compensation committee will determine the number of shares of our Class A common stock subject to each option, the term of each option, which may not exceed ten years, or
169
Table of Contents
five years in the case of an incentive stock option granted to a ten percent stockholder, the exercise price, the vesting schedule, if any, and the other material terms of each option. No incentive stock option or nonqualified stock option may have an exercise price less than the fair market value of a share of our Class A common stock at the time of grant or, in the case of an incentive stock option granted to a ten percent stockholder, 110% of such share’s fair market value. Options will be exercisable at such time or times and subject to such terms and conditions as determined by the compensation committee at grant and the exercisability of such options may be accelerated by the compensation committee.
Stock Appreciation Rights
The compensation committee may grant stock appreciation rights, which we refer to as SARs, either with a stock option, which may be exercised only at such times and to the extent the related option is exercisable, which we refer to as a Tandem SAR, or independent of a stock option, which we refer to as a Non-Tandem SAR. A SAR is a right to receive a payment in shares of our Class A common stock or cash, as determined by the compensation committee, equal in value to the excess of the fair market value of one share of our Class A common stock on the date of exercise over the exercise price per share established in connection with the grant of the SAR. The term of each SAR may not exceed ten years. The exercise price per share covered by a SAR will be the exercise price per share of the related option in the case of a Tandem SAR and will be the fair market value of our Class A common stock on the date of grant in the case of a Non-Tandem SAR. The compensation committee may also grant limited SARs, either as Tandem SARs or Non-Tandem SARs, which may become exercisable only upon the occurrence of a change in control, as defined in the 2015 Omnibus Incentive Plan, or such other event as the compensation committee may designate at the time of grant or thereafter.
Restricted Stock
The compensation committee may award shares of restricted stock. Except as otherwise provided by the compensation committee upon the award of restricted stock, the recipient generally has the rights of a stockholder with respect to the shares, including the right to receive dividends, the right to vote the shares of restricted stock and, conditioned upon full vesting of shares of restricted stock, the right to tender such shares, subject to the conditions and restrictions generally applicable to restricted stock or specifically set forth in the recipient’s restricted stock agreement. The compensation committee may determine at the time of award that the payment of dividends, if any, will be deferred until the expiration of the applicable restriction period.
Recipients of restricted stock are required to enter into a restricted stock agreement with us that states the restrictions to which the shares are subject, which may include satisfaction of pre-established performance goals, and the criteria or date or dates on which such restrictions will lapse.
If the grant of restricted stock or the lapse of the relevant restrictions is based on the attainment of performance goals, the compensation committee will establish for each recipient the applicable performance goals, formulae or standards and the applicable vesting percentages with reference to the attainment of such goals or satisfaction of such formulae or standards while the outcome of the performance goals are substantially uncertain. Such performance goals may incorporate provisions for disregarding, or adjusting for, changes in accounting methods, corporate transactions, including, without limitation, dispositions and acquisitions, and other similar events or circumstances. Section 162(m) of the Code requires that performance awards be based upon objective performance measures. The performance goals for performance-based restricted stock will be based on one or more of the objective criteria set forth on Exhibit A to the 2015 Omnibus Incentive Plan and are discussed in general below.
Other Stock-Based Awards
The compensation committee may, subject to limitations under applicable law, make a grant of such other stock-based awards, including, without limitation, performance units, dividend equivalent units, stock equivalent units, restricted stock and deferred stock units under the 2015 Omnibus Incentive Plan that are payable in cash or
170
Table of Contents
denominated or payable in or valued by shares of our Class A common stock or factors that influence the value of such shares. The compensation committee may determine the terms and conditions of any such other awards, which may include the achievement of certain minimum performance goals for purposes of compliance with Section 162(m) of the Code and/or a minimum vesting period. The performance goals for performance-based other stock-based awards will be based on one or more of the objective criteria set forth on Exhibit A to the 2015 Omnibus Incentive Plan and discussed in general below.
LTIP Units
The compensation committee may grant awards of equity-based awards, valued by reference to shares of publicly traded common stock of loanDepot, Inc., consisting of Holdco Units in LD Holdings and an equal number of shares of Class B common stock of loanDepot, Inc., which will be referred to as “LTIP Units.” LTIP Units may be subject to any vesting conditions as the compensation committee may decide, similar to any other more typical equity incentive program, such as restricted stock. Holders of LTIP Units will have the right to exchange such units for shares of Class A common stock of loanDepot, Inc. on a one-for-one basis, subject to customary conversion rate adjustments for stock splits, stock dividends and reclassifications. Any Holdco Units exchanged under the exchange provisions described above will thereafter be owned by loanDepot, Inc. Any shares of Class B common stock exchanged will be cancelled. See “Organizational Structure.” Each LTIP Unit awarded will be equivalent to an award of one share of Class A common stock of loanDepot, Inc. for purposes of reducing the number of shares of Class A common stock available under the 2015 Omnibus Incentive Plan on a one-for-one basis.
Other Cash-Based Awards
The compensation committee may grant awards payable in cash. Cash-based awards will be in such form, and dependent on such conditions, as the compensation committee will determine, including, without limitation, being subject to the satisfaction of vesting conditions or awarded purely as a bonus and not subject to restrictions or conditions. If a cash-based award is subject to vesting conditions, the compensation committee may accelerate the vesting of such award in its discretion.
Performance Awards
The compensation committee may grant a performance award to a participant payable upon the attainment of specific performance goals. The compensation committee may grant performance awards that are intended to qualify as performance-based compensation under Section 162(m) of the Code as well as performance awards that are not intended to qualify as performance-based compensation under Section 162(m) of the Code. If the performance award is payable in cash, it may be paid upon the attainment of the relevant performance goals either in cash or in shares of restricted stock, based on the then current fair market value of such shares, as determined by the compensation committee. Based on service, performance and/or other factors or criteria, the compensation committee may, at or after grant, accelerate the vesting of all or any part of any performance award.
Performance Goals
The compensation committee may grant awards of restricted stock, performance awards, and other stock-based awards that are intended to qualify as performance-based compensation for purposes of Section 162(m) of the Code. These awards may be granted, vest and be paid based on the attainment of specified performance goals established by the compensation committee. These performance goals may be based on the attainment of a certain target level of, or a specified increase or decrease in, one or more of the following measures selected by the compensation committee: (1) earnings per share; (2) operating income; (3) gross income; (4) net income, before or after taxes; (5) cash flow; (6) gross profit; (7) gross profit return on investment; (8) gross margin return on investment; (9) gross margin; (10) operating margin; (11) working capital; (12) earnings before interest and
171
Table of Contents
taxes; (13) earnings before interest, tax, depreciation and amortization; (14) return on equity; (15) return on assets; (16) return on capital; (17) return on invested capital; (18) net revenues; (19) gross revenues; (20) revenue growth; (21) annual recurring revenues; (22) recurring revenues; (23) license revenues; (24) sales or market share; (25) total stockholder return; (26) economic value added; (27) specified objectives with regard to limiting the level of increase in all or a portion of our bank debt or other long-term or short-term public or private debt or other similar financial obligations, which may be calculated net of cash balances and other offsets and adjustments as may be established by the compensation committee; (28) the fair market value of a share of our Class A common stock; (29) the growth in the value of an investment in our Class A common stock assuming the reinvestment of dividends; or (30) reduction in operating expenses.
To the extent permitted by law, the compensation committee may also exclude the impact of an event or occurrence which the compensation committee determines should be appropriately excluded, such as:
(1) restructurings, discontinued operations, extraordinary items and other unusual or non-recurring charges;
(2) an event either not directly related to our operations or not within the reasonable control of management; or
(3) a change in accounting standards required by generally accepted accounting principles.
Performance goals may also be based on an individual participant’s performance goals, as determined by the compensation committee.
In addition, all performance goals may be based upon the attainment of specified levels of our performance, or the performance of a subsidiary, division or other operational unit, under one or more of the measures described above relative to the performance of other corporations. The compensation committee may designate additional business criteria on which the performance goals may be based or adjust, modify or amend those criteria.
Change in Control
In connection with a change in control, as defined in the 2015 Omnibus Incentive Plan, the compensation committee may accelerate vesting of outstanding awards under the 2015 Omnibus Incentive Plan. In addition, such awards may be, in the discretion of the committee, (1) assumed and continued or substituted in accordance with applicable law, (2) purchased by us for an amount equal to the excess of the price of a share of our Class A common stock paid in a change in control over the exercise price of the awards, or (3) cancelled if the price of a share of our Class A common stock paid in a change in control is less than the exercise price of the award. The compensation committee may also provide for accelerated vesting or lapse of restrictions of an award at any time.
Stockholder Rights
Except as otherwise provided in the applicable award agreement, and with respect to an award of restricted stock, a participant has no rights as a stockholder with respect to shares of our Class A common stock covered by any award until the participant becomes the record holder of such shares.
Amendment and Termination
Notwithstanding any other provision of the 2015 Omnibus Incentive Plan, our board of directors may at any time amend any or all of the provisions of the 2015 Omnibus Incentive Plan, or suspend or terminate it entirely, retroactively or otherwise, subject to stockholder approval in certain instances; provided, however, that, unless otherwise required by law or specifically provided in the 2015 Omnibus Incentive Plan, the rights of a participant with respect to awards granted prior to such amendment, suspension or termination may not be adversely affected without the consent of such participant.
172
Table of Contents
Transferability
Awards granted under the 2015 Omnibus Incentive Plan generally are nontransferable, other than by will or the laws of descent and distribution, except that the committee may provide for the transferability of nonqualified stock options at the time of grant or thereafter to certain family members.
Recoupment of Awards
The 2015 Omnibus Incentive Plan provides that awards granted under the 2015 Omnibus Incentive Plan are subject to any recoupment policy that we may have in place or any obligation that we may have regarding the clawback of “incentive-based compensation” under the Exchange Act, or under any applicable rules and regulations promulgated by the SEC.
Effective Date and Term
The 2015 Omnibus Incentive Plan was adopted by the board of directors on the date specified in the 2015 Omnibus Incentive Plan and approved by stockholders. No award will be granted under the 2015 Omnibus Incentive Plan on or after the 10-year anniversary of the date on which the 2015 Omnibus Incentive Plan becomes effective. Any award outstanding under the 2015 Omnibus Incentive Plan at the time of termination will remain in effect until such award is exercised or has expired in accordance with its terms.
Employee Stock Purchase Plan
In connection with this offering, we adopted the loanDepot, Inc. Employee Stock Purchase Plan. Subject to stockholder approval, the LD ESPP would be effective as of the consummation of this offering, but the first offering period under the LD ESPP would not commence until specifically authorized by the committee that administers the LD ESPP. Generally, all of our employees would be eligible to participate if they are employed by us, or any participating subsidiary or affiliate. The LD ESPP would generally be designed to encourage employees to become stockholders and to increase their ownership of our Class A common stock. The maximum number of shares of Class A common stock which may be issued pursuant to the LD ESPP may not exceed 3,676,470 shares. We anticipate that shares of our Class A common stock issued under the LD ESPP would be issued at a discount to market no greater than 15% and with an offering period equal to 6 months; provided, that the maximum number of shares that may be purchased in any calendar year by an eligible employee may not exceed 3,000 in total. The term of the LD ESPP shall be 10 years from the date of adoption. The LD ESPP would have two components: a Code Section 423 Component and a non-Code Section 423 Component. The Code Section 423 Component would be intended to comply with the requirements of Section 423 of the Code and to assure the participants of the tax advantages provided thereby.
Other Supplemental Benefits
Our named executive officers are eligible for the following benefits on a similar basis as other eligible employees:
| • | health, dental and vision insurance; |
| • | paid-time-off days; |
| • | life and accidental death and dismemberment insurance; |
| • | short-term (voluntary) and long-term disability insurance; |
| • | flexible spending and health savings account programs; |
| • | critical, accident and life insurance (voluntary); and |
| • | 401(k) plan which generally allows employees to contribute up to 100% of their salary (subject to an annual maximum of $17,500), with the company matching 25% of such contributions. |
173
Table of Contents
Director Compensation
The following table shows the compensation earned during the fiscal year ended December 31, 2014, by each of our directors who are not named executive officers.
| Name |
Fees Earned or Paid in Cash ($) |
Stock Awards ($) |
Non-Equity Incentive Plan Compensation ($) |
All Other Compensation ($) |
Total ($) |
|||||||||||||||
| Brian P. Golson |
— | — | — | — | — | |||||||||||||||
| Andrew C. Dodson |
— | — | — | — | — | |||||||||||||||
| John C. Dorman |
— | — | — | — | — | |||||||||||||||
| Dawn Lepore |
— | — | — | — | — | |||||||||||||||
Narrative Disclosure Regarding Director Compensation Table
With respect to the fiscal year ended December 31, 2014, none of our directors received any compensation from us for service on our board of directors.
Messrs. Golson, Dodson and Dorman and Ms. Lepore will each receive an annual cash retainer of $50,000 for serving on the board of directors of loanDepot, Inc. Mr. Dorman and Ms. Lepore have each received, in consideration for service on our board of directors prior to the completion of this offering, LDLLC Class X common units with an aggregate grant date fair value of $6,673, and will each receive, in consideration for service as a director for the first year after completion of this offering, an equity grant of restricted stock units with an aggregate value of $175,000, to be fully vested at the time of grant and made following the completion of this offering. Messrs. Golson, Dodson and Dorman and Ms. Lepore will each receive in consideration for continuing service as a director of loanDepot, Inc., an annual equity grant of restricted stock units with an aggregate value on an annual basis of $100,000 to be fully vested at the time of grant and made following loanDepot, Inc.’s annual stockholder meeting.
Additionally, certain directors may receive an annual cash retainer of $20,000, $15,000 and $10,000 for service as a chairperson of our audit committee, compensation committee and governance and nominating committee, respectively, to be paid in arrears in equal quarterly installments for so long as the director remains the chairperson of such committee. Certain directors serving on our audit committee, compensation committee and governance and nominating committee, but not as chairperson of such committee, will receive an annual cash retainer of $10,000, $7,500 and $5,000, respectively, to be paid in arrears in equal quarterly installments for so long as the director remains a member of such committee.
Compensation Policies and Practices as They Relate to Risk Management
One of the key functions of our board of directors is informed oversight of our risk management process. Our board of directors administers this oversight function directly through our board of directors as a whole, as well as through various standing committees of our board of directors that address risks inherent in their respect areas of oversight. Our audit committee is responsible for reviewing the adequacy and effectiveness of our internal controls over financial reporting with our independent auditors. Our compensation committee assesses and monitors whether any of our compensation policies and programs are reasonably likely to have a material adverse effect on the Company.
Compensation Committee Interlocks and Insider Participation
No member of the compensation committee is or has been one of our officers or employees or has had any relationship with us requiring disclosure under the SEC’s rules and regulations.
174
Table of Contents
Rule 10b5-1 Sales Plan
Our directors and executive officers may adopt written plans, known as Rule 10b5-1 plans, in which they will contract with a broker to buy or sell shares of our common stock on a periodic basis. Under a Rule 10b5-1 plan, a broker executes trades pursuant to parameters established by the director or officer when entering into the plan, without further direction from them. The director or officer may amend a Rule 10b5-1 plan in some circumstances and may terminate a plan at any time. Our directors and executive officers also may buy or sell additional shares outside a Rule 10b5-1 plan when they are not in possession of material nonpublic information subject to compliance with the terms of our policy on insider trading and communications with the public.
175
Table of Contents
CERTAIN RELATIONSHIPS AND RELATED PARTY TRANSACTIONS
Reorganization Transactions
Prior to and in connection with the consummation of this offering, we will consummate the Reorganization Transactions described under “Organizational Structure” pursuant to the agreements filed as exhibits to the registration statement of which this prospectus forms a part.
Amended and Restated Limited Liability Company Agreements of LDLLC
As a result of the Reorganization Transactions and Offering Transactions, LDLLC will be owned by LD Holdings and Intermediate LLC. Prior to the completion of the offering, the 6th LLC Agreement of LDLLC will be further amended and restated as the 7th LLC Agreement to, among other things, modify its capital structure by converting the different classes of interests that had been held by Parthenon Blocker and the Continuing LLC Members with a single new class of LLC Units. The conversion ratios of all of the different classes of units of LDLLC (other than the Class I common units of LDLLC) into a single class will be based on the proceeds that each unit would receive in a hypothetical liquidation (pursuant to the distribution provisions set forth in the 6th LLC Agreement) of 100% of LDLLC based on the initial public offering price of the Class A common stock. The number of LLC Units issued upon conversion per class of outstanding units will be determined pursuant to the distribution provisions set forth in the 6th LLC Agreement. Immediately after such conversion is effected, each holder of LLC Units will exchange such LLC Units on a one-for-one basis for Holdco Units. Simultaneously, the holders of LDLLC’s Class I common units will also contribute all of their respective Class I common units of LDLLC to LD Holdings for substantially identical Class I common units of LD Holdings.
In connection with such exchange transactions, which will result in LDLLC becoming a wholly owned subsidiary of LD Holdings, each of Parthenon Blocker, the Continuing LLC Members and the holders of Class I common units of LD Holdings will enter into the Holdings LLC Agreement. After completing these exchange transactions, LD Holdings will further amend and restate the 7th LLC Agreement as the 8th LLC Agreement to simplify the equity arrangements of LDLLC as a subsidiary company and to create two classes of common units at LDLLC, Class A common units which will have voting and economic rights and Class B common units which will have voting rights only and no economic rights. Under the 8th LLC Agreement, loanDepot, Inc., through its ability to appoint the board of managers of LD Holdings, which will have the ability to appoint the board of managers of LDLLC, has the right to determine when distributions (other than tax distributions) will be made by LDLLC to LD Holdings and the amount of any such distributions.
imortgage Settlement Agreement
Following our acquisition of imortgage on October 1, 2013, certain disputes arose among LDLLC, Parthenon Blocker and Trilogy Mortgage Holdings, Inc. (an affiliate of Anthony Hsieh), on the one hand, and the original stockholders of imortgage and their affiliates and representatives (collectively, the “imortgage Stockholders”), on the other hand, with respect to the interpretation of certain provisions of the fifth amended and restated limited liability company agreement of LDLLC (the “5th LLC Agreement”) relating to amounts payable to holders of the Class I common units in connection with an initial public offering.
In particular, in connection with an initial public offering, the imortgage Stockholders believed that they were entitled to a percentage of the overall value of LDLLC based on the earnings from the imortgage division of LDLLC relative to the overall earnings of LDLLC. LDLLC and its other members believed that the imortgage Stockholders were entitled to a percentage of the net proceeds from an initial public offering based on the earnings from the imortgage division of LDLLC relative to the overall earnings of LDLLC.
176
Table of Contents
In order to eliminate uncertainty and resolve all disagreements, pursuant to a Settlement Agreement and Release dated August 25, 2015 (“Settlement Agreement”) and the 6th LLC Agreement, LDLLC, Parthenon Blocker, Trilogy Mortgage Holdings, Inc. and the imortgage Stockholders agreed to eliminate the potential variable nature of the formula specified in the 5th LLC Agreement and to amend the formula to provide for a fixed amount of $90.0 million due to the imortgage Stockholders payable as described below (plus quarterly cash distributions as described below), which reflects the mutual intent of the parties with respect to the provisions that had been in dispute:
| • | $4.5 million payable upon the signing of the Settlement Agreement; |
| • | $500,000 payable on each of September 15, 2015, October 15, 2015, November 15, 2015 and December 15, 2015; |
| • | approximately $63.5 million payable upon the consummation of this offering (based on the midpoint of the estimated price range set forth on the cover of this prospectus), which amount, when finalized, will be equal to 25% of the net proceeds received by us in this offering (subject to a minimum of $35.0 million and a maximum of $63.5 million); |
| • | an amount equal to the result of $83.5 million less the amount paid upon the consummation of this offering (such amount, together with any amounts described in the foregoing three bullets that have not yet been paid, the “Class I Total Unpaid Balance”), which shall be paid by LD Holdings as follows: (a) 25% of the net primary proceeds received by us from future offerings will be contributed to LD Holdings in exchange for Holdco Units and then used by LD Holdings to pay down the Class I Total Unpaid Balance, and (b) from future distributions from LD Holdings to the holders of Class I common units in accordance with the Holdings LLC Agreement; and |
| • | cash distributions, payable quarterly, accruing on the Class I Total Unpaid Balance, beginning April 1, 2016, at a rate of 7% per annum (9% per annum after January 1, 2017), until the Class I Total Unpaid Balance is paid in full. |
Other than as set forth herein, the Class I common units are not entitled to any additional amounts, and in particular do not hold any rights to residual or common equity value in LD Holdings or LDLLC.
Pursuant to the terms of the Settlement Agreement and the 6th LLC Agreement (and, when effective, the 7th LLC Agreement and the Holdings LLC Agreement), we may elect to purchase Class I common units (for an amount otherwise distributable to such holders of Class I common units, as described above) in lieu of LDLLC making the distributions described above. If we elect to purchase Class I common units as described above, then immediately following such a purchase, such Class I common units shall be converted automatically into Holdco Units determined as follows: (i) if we purchase Class I common units in connection with a public offering of our Class A common stock, then such Class I units will be converted into a number of Holdco Units equal to the number of Holdco Units that would have been issued if we had instead contributed the price paid for the purchased Class I common units to LD Holdings, or (ii) in any other case, the Class I common units will be converted into a number of Holdco Units based on the price paid for such units and the then-current value of the Class A common stock.
The payment of Class I distributions may be delayed if such payment (i) would cause LDLLC or LD Holdings, as the successor to LDLLC’s obligations to the holders of Class I common units, (x) to violate or breach any term or provision of any material agreement or contract of LDLLC or financial covenant of LDLLC or (y) to fail to meet 120% of any financial covenant of LDLLC, with such calculation being made as of the end of the most recent calendar quarter and as of the end of the then current calendar quarter based on estimated financial results for such quarter or (ii) is restricted by applicable law or any third party or governmental entity prevents or penalizes (or threatens to prevent or penalize LDLLC) from making such payment. However, the payment of Class I distributions may be accelerated under certain other circumstances, if not paid when due in accordance with the Settlement Agreement and the Holdings LLC Agreement.
177
Table of Contents
The distributions described above generally must be made before LD Holdings will be permitted to make distributions (other than tax distributions) with respect to the Holdco Units.
Limited Liability Company Agreement of LD Holdings
As a result of the Reorganization Transactions and Offering Transactions, loanDepot, Inc. will hold a significant equity interest in LD Holdings and will be entitled to appoint the board of managers of LD Holdings. Accordingly, loanDepot, Inc. will operate and control all of the business and affairs of LD Holdings and, through LD Holdings and its operating entity subsidiaries, conduct our business.
The Holdings LLC Agreement will provide for Holdco Units and Class I common units of LD Holdings. Under the Holdings LLC Agreement, the board of managers of LD Holdings has the right to determine when distributions (other than tax distributions) will be made to unitholders of LD Holdings and the amount of any such distributions, subject to the distribution preference with respect to the Class I common units. If a distribution with respect to Holdco Units is authorized, such distribution will be made to the holders of Holdco Units pro rata based on their holdings of Holdco Units. The Class I common units of LD Holdings will only be entitled to the fixed payment rights set forth in the Holdings LLC Agreement and are not otherwise entitled to any distributions or residual interest in LD Holdings. See “—imortgage Settlement Agreement.”
Under the terms of the Holdings LLC Agreement, all of the Holdco Units received by the Continuing LLC Members in the Reorganization Transactions will be subject to restrictions on disposition. Additionally, consistent with the terms of the underlying unit grant agreements executed at the time of original grant, Holdco Units received by the Continuing LLC Members will be subject to vesting and forfeiture on the same basis as the units which were exchanged for the Holdco Units.
The holders of Holdco Units, including loanDepot, Inc., will incur U.S. federal, state and local income taxes on their proportionate share of any taxable income of LD Holdings. Net profits and net losses of LD Holdings will generally be allocated to the holders of Holdco Units (including loanDepot, Inc.) pro rata in accordance with their respective share of the net profits and net losses of LD Holdings. The Holdings LLC Agreement will provide for cash distributions, which we refer to as “tax distributions,” based on certain assumptions, to the holders of Holdco Units (including loanDepot, Inc.) pro rata based on their Holdco Units. Generally, these tax distributions to holders of Holdco Units will be an amount equal to our estimate of the taxable income of LD Holdings, net of taxable losses, allocable per Holdco Unit multiplied by an assumed tax rate equal to the highest effective marginal combined U.S. federal, state and local income tax rate prescribed for an individual resident in California (taking into account the non-deductibility of certain expenses). Because tax distributions will be determined based on the holder of Holdco Units who is allocated the largest amount of taxable income on a per unit basis, LD Holdings may be required to make tax distributions that, in the aggregate, may exceed the amount of taxes that LD Holdings would have paid if it were taxed on its net income at the assumed rate. Tax distributions will be made only to the extent all distributions from LD Holdings for the relevant year were insufficient to cover such tax liabilities. Any distributions will be subject to available cash and applicable law and contractual restrictions (including pursuant to our debt instruments and the Settlement Agreement).
Under the Holdings LLC Agreement, the Continuing LLC Members (or certain permitted transferees thereof) will have the right, subject to the terms of the Holdings LLC Agreement, to exchange their Holdco Units (together with a corresponding number of shares of Class B common stock) for shares of our Class A common stock on a one-for-one basis, subject to customary conversion rate adjustments for stock splits, stock dividends, reclassifications and other similar transactions. The Holdings LLC Agreement will provide that as a general matter a Continuing LLC Member will not have the right to exchange Holdco Units if we determine that such exchange would be prohibited by law or regulation or would violate other agreements with us to which the Continuing LLC Member may be subject or would cause a technical tax termination of LD Holdings. We may impose additional restrictions on exchange that we determine to be necessary or advisable so that LD Holdings is not treated as a “publicly traded partnership” for U.S. federal income tax purposes. As a Continuing LLC
178
Table of Contents
Member exchanges Holdco Units for shares of Class A common stock, the number of Holdco Units held by loanDepot, Inc. is correspondingly increased as it acquires the exchanged Holdco Units, and a corresponding number of shares of Class B common stock are cancelled.
LDLLC 2009 Incentive Equity Plan, LDLLC 2012 Incentive Equity Plan and Unit Grant Agreements
We have entered into various unit grant agreements with PCP, L.P. and certain of our directors, executive officers and employees. The unit grant agreements provide the grantees with LDLLC Class W, X, Y or Z common units. The Class W and X common units were created and issued pursuant to the 6th LLC Agreement. The Class Z common units are governed by the LDLLC 2009 Incentive Equity Plan and the Class Y common units are governed by the LDLLC 2012 Incentive Equity Plan. The granted units are subject to certain accelerated vesting upon certain events such as the sale of LDLLC. Subject to certain requirements, we have the right under the unit grant agreements to repurchase common units granted following the termination of employment of the applicable executive officer or employee. As part of the Reorganization Transactions, the entry into the 7th LLC Agreement will result in the conversion of LDLLC Class W, X, Y and Z common unit, into a single new class of LLC Units in LDLLC. Immediately after such conversion is effected, each holder of LLC Units will exchange such LLC Units on a one-for-one basis for Holdco Units.
Purchase of Premium Holdco Units and Class B Common Stock and Redemption of Class A Common Stock
In December 2013 and September 2014, LDLLC entered into various subscription agreements with Parthenon Blocker, certain of our executive officers (identified below) and employees and other investors, pursuant to which an aggregate of 11,130 Class P common units of LDLLC were issued to and purchased by Parthenon Blocker and such executive officers for $1,000 per unit, for aggregate consideration of approximately $11.1 million. In March and April 2015, LDLLC entered into various subscription agreements with Parthenon Blocker, certain of our executive officers and employees and other investors, pursuant to which an aggregate of 17,360 Class P-2 common units of LDLLC were issued to and purchased by Parthenon Blocker and such executive officers for $1,000 per unit, for aggregate consideration of approximately $17.4 million.
Class P Common Units
Class P common units have no voting rights. Class P common units have a liquidation preference subordinate to Class B common units and are pari passu with the Class P-2 common units described below. There were 12,500 Class P common units authorized and outstanding as of June 30, 2015, which were purchased for an aggregate of $12.5 million. Class P common unitholders have the right to receive distributions equal to the initial capital investment made for such Class P common units pari passu with the Class P-2 common units once the Class A and Class B common unitholders have received distributions equal to 1.5 times the amount contributed by the Class A and Class B common unitholders. Then, subsequent to the distributions to the Class A, Class B and Class Z-1 common units, the Class P common unitholders have the right to receive distributions, to the extent distributions are authorized by the board of directors, equal to the greater of (a) 225% of the amount contributed by the Class P common unitholders or (b) a 20% per annum return on the amount contributed by the Class P common unitholders. Upon the sale of the Company, the Class P common unitholders have the right to increase this distribution based upon a formula described in the 6th LLC Agreement.
In connection with the consummation of this offering, the Class P common unitholders shall have the right to elect to either have all or any portion of such Class P common units either (1) converted or exchanged into Holdco Units and shares of Class B common stock based on a ratio of one to a fraction, the numerator of which is 325% of the initial capital investment made for such Class P common units and the denominator of which is 87.5% or (2) have the Holdco Units and shares of Class B common stock described in the immediately preceding subsection (1) redeemed for cash, in each case as required pursuant to the 6th LLC Agreement; provided that in any case each such Class P common unitholder will be required to redeem an amount at least equal to such Class P common unitholder’s initial capital investment in the Class P common units for cash. All cash redemptions
179
Table of Contents
consummated in connection with the foregoing rights will be effected by first converting all of the Class P common units into Holdco Units and issuing an equal number of shares of Class B common stock to the holders thereof pursuant to the Reorganization Transactions, and any such Holdco Units and shares of Class B common stock being redeemed shall thereafter be purchased by loanDepot, Inc. immediately following this offering from the applicable Class P common unitholder.
Class P-2 Common Units
Class P-2 common units have no voting rights. Class P-2 common units have a liquidation preference subordinate to Class B common units and are pari passu with the Class P common units described above. There were 20,000 Class P-2 common units authorized and outstanding as of June 30, 2015, which were purchased for an aggregate of $20.0 million. Class P-2 common unitholders have the right to receive distributions equal to the initial capital investment made for such Class P-2 common units pari passu with the Class P common units once the Class A and Class B common unitholders have received distributions equal to 1.5 times the amount contributed by the Class A and Class B common unitholders. Then, subsequent to the distributions to the Class A, Class B and Class Z-1 common units (as described below), the Class P-2 common unitholders have the right to receive distributions, to the extent distributions are authorized by the board of directors, equal to the greater of (a) 125% of the amount contributed by the Class P-2 common unitholders if the Company successfully completes an initial public offering during 2015 or the Company meets or exceeds the 2015 operating budget metric of $110.0 million pre-tax, net income or (b) 165% if the Company does not complete an initial public offering during 2015 or meet or exceed the 2015 operating budget metric of $110 million pre-tax, net income or (c) a 20% per annum return on the amount contributed by the Class P-2 common unitholders (collectively with the initial capital investment made in respect of such Class P-2 common units, the “Class P-2 Return Balance”). Upon the sale of the Company, the Class P-2 common unitholders have the right to increase this distribution based upon a formula described in the 6th LLC Agreement.
In connection with the consummation of this offering, the Class P-2 common unitholders shall have the right to (i) receive a distribution of cash equal to 50% of the initial capital investment made for such Class P-2 common units, and (ii) elect to have any portion (up to the remaining 50% of such Class P-2 common unit initial capital investment) redeemed in cash, with the remainder being converted or exchanged into Holdco Units and an equal number of shares of Class B common stock based on a ratio of one to a fraction, the numerator of which is the Class P Return Balance of such Class P-2 common unit (less any amounts redeemed for cash), and the denominator of which is 87.5%, in each case pursuant to the 6th LLC Agreement. All cash redemptions consummated in connection with the foregoing rights will be effected by first converting all of the Class P-2 common units into Holdco Units and issuing an equal number of shares of Class B common stock to the holders thereof pursuant to the Reorganization Transactions, and any such Holdco Units and shares of Class B common stock being redeemed shall thereafter be purchased by loanDepot, Inc. immediately following this offering from the applicable Class P-2 common unitholder.
180
Table of Contents
The table below sets forth the number of Class P and Class P-2 common units initially purchased by Parthenon Blocker and our executive officers (including their respective affiliates), the purchase price for the initial purchase of such units from LDLLC, the number of Premium Holdco Units to be purchased by us from such related parties after giving effect to the Reorganization Transactions and the total consideration for the purchase of such Premium Holdco Units (together with an equal number of shares of Class B common stock) with a portion of the net proceeds to us from this offering, assuming an initial public offering price of $17.00 per share, which is the midpoint of the estimated price range set forth on the cover page of this prospectus. See “Use of Proceeds” and “Principal and Selling Stockholders.”
| Name of Beneficial Owner |
Number of Class P common units(1) |
Initial purchase price |
Number of Class P-2 common units(2) |
Initial purchase price |
Number of Premium Holdco Units (together with equal number of shares of Class B common stock) to be purchased |
Total Offering Consideration |
||||||||||||||||||
| Parthenon Blocker(3) |
10,000 | $ | 10,000,000 | 15,000 | $ | 15,000,000 | 3,067,227 | $ | 52,142,857 | |||||||||||||||
| Anthony Hsieh |
465 | 465,000 | 1,392 | 1,392,000 | 183,479 | 3,119,143 | ||||||||||||||||||
| David Norris(4) |
— | — | 500 | 500,000 | 29,412 | 500,000 | ||||||||||||||||||
| Jeff DerGurahian(5) |
200 | 200,000 | 50 | 50,000 | 46,639 | 792,857 | ||||||||||||||||||
| Bryan Sullivan(6) |
265 | 265,000 | 150 | 150,000 | 66,722 | 1,134,285 | ||||||||||||||||||
| Peter Macdonald(7) |
200 | 200,000 | 143 | 143,000 | 52,109 | 885,857 | ||||||||||||||||||
| Mike Smith(8) |
— | — | 125 | 125,000 | 7,353 | 125,000 | ||||||||||||||||||
| (1) | Our executive officers (including their respective affiliates) beneficially own their Class P common units through Trilogy Management Investors Four, LLC, which we expect to be dissolved following the completion of this offering. |
| (2) | Our executive officers (including their respective affiliates) beneficially own their Class P-2 common units through Trilogy Management Investors Five, LLC, which we expect to be dissolved within one year after this offering. |
| (3) | In connection with the Reorganization Transactions and this offering, Parthenon Blocker and loanDepot, Inc. will engage in a series of transactions that will result in Parthenon Blocker merging with and into loanDepot, Inc., with loanDepot, Inc. remaining as the surviving corporation. As a result of such transactions, the Parthenon Stockholders will exchange all of the equity interests of Parthenon Blocker in return for shares of loanDepot, Inc. Class A common stock and loanDepot, Inc. will own the Holdco Units that were held by Parthenon Blocker prior to the merger. See “Organizational Structure.” We will redeem 3,067,227 of such shares of Class A common stock from the Parthenon Stockholders for the consideration set forth above. |
| (4) | Includes 500 Class P-2 common units beneficially owned by The Norris Family Trust 2 14 02. |
| (5) | Includes 123 Class P common units beneficially owned by Jeff DerGurahian and 77 Class P common units beneficially owned by PENSCO Trust Company Custodian FBO Jeffrey DerGurahian IRA. |
| (6) | Includes 161 Class P common units beneficially owned by Sullivan Family 2011 Trust, 54 Class P common units beneficially owned by PENSCO Trust Company Custodian FBO Bryan Sullivan IRA and 50 Class P common units beneficially owned by PENSCO Trust Company Custodian FBO Dana Sullivan IRA. Includes 50 Class P-2 common units beneficially owned by PENSCO Trust Company Custodian FBO Bryan Sullivan IRA, 50 Class P-2 common units beneficially owned by Sullivan Family 2011 Trust and 50 Class P-2 common units beneficially owned by Bernard & Joy Sullivan Trust. In addition, we will use approximately $0.4 million of our net proceeds from the offering to purchase 24,514 Holdco Units and an equal number of shares of Class B common stock from Mr. Sullivan. Such Holdco Units will have been converted from 10,000 Class W common units of LDLLC owned by Mr. Sullivan in connection with the Reorganization Transactions. |
| (7) | Includes 143 Class P-2 common units beneficially owned by Peter Macdonald—IRA. |
| (8) | Includes 125 Class P-2 common units beneficially owned by Michael Smith—IRA. |
181
Table of Contents
Purchase of Holdco Units and Class B Common Stock
Immediately following this offering, we will also use a portion of the net proceeds to us from this offering to purchase an aggregate of 2,400,000 Holdco Units (excluding Premium Holdco Units) (or 3,840,000 Holdco Units (excluding Premium Holdco Units) if the underwriters’ option is exercised in full), together with an equal number of shares of Class B common stock, held by our Chief Executive Officer, certain other executive officers listed below, employees and other unitholders (including their respective affiliates) for aggregate consideration of approximately $38.4 million (or $61.4 million if the underwriters’ option is exercised in full). The table below sets forth the number of Holdco Units (together with an equal number of shares of Class B common stock) to be purchased by us from our Chief Executive Officer and executive officers in addition to our purchase of their Premium Holdco Units as set forth above in “— Purchase of Premium Holdco Units and Class B Common Stock and Redemption of Class A Common Stock.” The per share price for each Holdco Unit (excluding Premium Holdco Units) surrendered for purchase by an Exchanging Member along with a share of Class B common stock will be equal to the price per share of our Class A common stock in this offering, less underwriting discounts and commissions. See “Use of Proceeds” and ‘‘Principal and Selling Stockholders.’’
| Name of Beneficial Owner |
Number of Holdco Units (with equal number of shares of Class B common stock) to be purchased |
Aggregate purchase price |
||||||
| Anthony Hsieh(1) |
1,797,081 | $ | 28,732,630 | |||||
| Jeff DerGurahian |
70,758 | 1,131,314 | ||||||
| Bryan Sullivan |
70,758 | 1,131,314 | ||||||
| Peter Macdonald |
70,758 | 1,131,314 | ||||||
| Brian Biglin |
11,793 | 188,552 | ||||||
| Mike Smith |
11,793 | 188,552 | ||||||
| (1) | Includes 1,108,743 Holdco Units owned by Anthony Hsieh, 633,609 Holdco Units owned by Trilogy Mortgage Holdings, Inc. and 54,729 Holdco Units owned by JLSA, LLC. |
2015 Omnibus Incentive Plan
We intend to adopt the 2015 Omnibus Incentive Plan effective prior to and in connection with this offering. The plan will provide for grants of stock options, restricted stock and performance awards. Our directors, officers and other employees and persons who engage in services for us are eligible for grants under the plan. The purpose of the plan is to provide these individuals with incentives to maximize stockholder value and otherwise contribute to our success and to enable us to attract, retain and reward the best available persons for positions of responsibility. 14,705,882 shares of our Class A common stock (including any LTIP Units, which may be granted under the 2015 Omnibus Incentive Plan), which amount shall be increased on the first day of each fiscal year during the term of the 2015 Omnibus Incentive Plan commencing with the 2017 fiscal year by 3% of the total number of shares of common stock outstanding on the last day of the immediately preceding fiscal year or a lesser amount determined by our board of directors, will be authorized for issuance under the plan, subject to adjustment in the event of a reorganization, stock split, merger or similar change in our corporate structure or the outstanding shares of Class A common stock. Our compensation committee will administer the plan. Our board of directors also has the authority to administer the plan and to take all actions that our compensation committee is otherwise authorized to take under the plan. The terms and conditions of each award made under the plan, including vesting requirements, will be set forth consistent with the plan in a written agreement with the grantee. See “Executive Compensation—Employee Benefit Plans—2015 Omnibus Incentive Plan.”
182
Table of Contents
Registration Rights Agreement
Effective upon consummation of the offering, we will enter into a registration rights agreement pursuant to which we may be required to register the sale of shares of our Class A common stock held by the Parthenon Stockholders and/or our Class A common stock that may be issued to the Continuing LLC Members upon exchange of Holdco Units held by them. The registration rights agreement will also require us to make available and keep effective shelf registration statements permitting sales of shares into the market from time to time over an extended period. In addition, the Parthenon Stockholders and certain of the Continuing LLC Members will have the ability to exercise certain demand registration rights and/or piggyback registration rights in connection with registered offerings requested by any of such holders or initiated by us.
Stockholders Agreement
Effective upon consummation of the offering, we will enter into a stockholders agreement with the Parthenon Stockholders and certain of the Continuing LLC Members, from time to time party thereto, which currently includes PCP, L.P. and all of our directors and executive officers (including their respective affiliates). The stockholders agreement will contain certain governance provisions, including provisions relating to nominations for the election of directors. In particular, the Parthenon Stockholders and PCP, L.P. (collectively with their affiliates, the “Parthenon Group”) and Anthony Hsieh and his affiliates (collectively, the “Hsieh Group”) will each have the right to designate (i) two nominees for election to our board of directors so long as such group owns at least 50% of the total voting power of common stock immediately held by such group following the completion of this offering and (ii) otherwise one nominee for election to our board of directors so long as such groups owns at least 5% of the total voting power of the then-outstanding common stock and in each case, we will agree to take certain actions to support those nominees for election and include the nominees in the relevant proxy statements. Brian P. Golson and Andrew C. Dodson are expected to be designated nominees by the Parthenon Group, and until the Hsieh Group is no longer entitled to designate any nominees pursuant to the stockholders agreement, Mr. Hsieh shall be a designated nominee of the Hsieh Group. The second designated nominee of the Hsieh Group has yet to be identified to fill a vacancy on our board of directors. In addition, the Parthenon Group and the Hsieh Group shall each be entitled to designate the replacement for any of its board designees whose board service terminates prior to the end of the director’s term. The Parthenon Group and the Hsieh Group will each agree to take all necessary action, including voting their respective shares of common stock, to cause the election of the director nominated by such other group in accordance with the terms of the stockholders agreement. The stockholders agreement also provides for certain restrictions and rights with respect to transfer and sale of our Class A common stock (including Class A common stock received following an exchange of Holdco Units and shares of Class B common stock pursuant to the Holdings LLC Agreement) by the parties to the stockholders agreement.
The stockholders agreement will provide that the Hsieh Group and certain of our employees may only transfer their Class A common stock at such time as the Parthenon Group is also selling shares of Class A common stock in a registered public offering and then only up to: in the case of the Hsieh Group, equal to the number of shares of Class A common stock that results in proceeds equal to 50% of the proceeds to be received by the Parthenon Group in such sale transaction; and in the case of certain of our employees, equal to the product of (i) the aggregate number of Class A common stock held by such employee immediately prior to such sale (excluding shares that are transferrable by such employee as a result of the paragraph immediately below) multiplied by (ii) the proportion of the number of shares of Class A common stock being sold by the Hsieh Group to its aggregate ownership of Class A common stock immediately prior to such sale (including shares receivable upon exchange pursuant to the Holdings LLC Agreement) (the “Management Selling Ratio”). In addition, following the first day of the calendar month immediately following the first anniversary of this offering, (a) the Hsieh Group and certain of our employees may transfer their Class A common stock at such time as the Hsieh Group is selling shares of Class A common stock in a registered public offering and then only up to: in the case of the Hsieh Group, equal to the number of shares of Class A common stock that results in proceeds equal to 50% of the proceeds to be received by the Parthenon Group in such sale transaction; and in the case of certain of our employees, equal to the product of (i) the aggregate number of Class A common stock held by such employee
183
Table of Contents
immediately prior to such sale (excluding shares that are transferrable by such employee as a result of the paragraph immediately below) multiplied by (ii) the Management Selling Ratio, subject to a $150,000,000 limitation on net proceeds from such sale transaction and other conditions specified therein; provided that if the Parthenon Group elects not to transfer shares of Class A common stock in such sale transaction, the number of shares that the Parthenon Group would have otherwise been entitled to transfer in such sale transaction shall instead be allocated to the Hsieh Group and such employees based on the applicable Management Selling Ratio, and (b) each of the Hsieh Group and certain of our employees shall each be entitled to transfer up to an additional number of shares of Class A common stock that, if sold, would result in receiving proceeds equal to an aggregate of $500,000 for such calendar year. Any permitted amounts described in this paragraph that are not transferred can be carried forward to future permitted transfers.
Tax Receivable Agreement
The Continuing LLC Members may from time to time (subject to the terms of the Holdings LLC Agreement regarding exchange rights) exchange an equal number of Holdco Units and shares of Class B common stock for shares of Class A common stock of loanDepot, Inc. on a one-for-one basis. LD Holdings (and each of its subsidiaries classified as a partnership for federal income tax purposes) intends to make an election under Section 754 of the Code effective for the taxable year in which this offering is completed and each subsequent taxable year in which an exchange of Holdco Units and shares of Class B common stock for shares of Class A common stock occurs. In addition, we may purchase Class I common units of LD Holdings. Our purchase of Holdco Units from the Exchanging Members in connection with this offering, the exchanges of Holdco Units and shares of Class B common stock for shares of Class A common stock and any purchase by us of Class I common units of LD Holdings are expected to result, with respect to loanDepot, Inc., in increases in the tax basis of the assets of LD Holdings that otherwise would not have been available. These increases in tax basis may reduce the amount of tax that loanDepot, Inc. would otherwise be required to pay in the future. These increases in tax basis may also decrease gains (or increase losses) on future dispositions of certain assets to the extent tax basis is allocated to those assets.
We and LD Holdings will enter into a tax receivable agreement with the Parthenon Stockholders and, following the completion of the offering, certain of the Continuing LLC Members, as part of the consideration received by such Continuing LLC Members in exchange for the sale of Holdco Units to loanDepot, Inc., that will provide for the payment from time to time by loanDepot, Inc. to such parties or their permitted assignees of 85% of the amount of the benefits, if any, that loanDepot, Inc. realizes or under certain circumstances (such as a change of control) is deemed to realize as a result of (i) the aforementioned increases in tax basis, (ii) any incremental tax basis adjustments attributable to payments made pursuant to the tax receivable agreement and (iii) any deemed interest deductions arising from payments made by us under the tax receivable agreement. These payment obligations are obligations of loanDepot, Inc. and not of LD Holdings. For purposes of the tax receivable agreement, subject to certain exceptions noted below, the benefit deemed realized by loanDepot, Inc. generally will be computed by comparing the actual income tax liability of loanDepot, Inc. (calculated with certain assumptions) to the amount of such taxes that loanDepot, Inc. would have been required to pay had there been no increase to the tax basis of the assets of LD Holdings as a result of our purchase of Holdco Units from the Exchanging Members in connection with this offering, the exchanges of Holdco Units and any purchase by us of Class I common units of LD Holdings and had loanDepot, Inc. not derived any tax benefits in respect of payments made under the tax receivable agreement. The term of the tax receivable agreement will continue until all such tax benefits have been utilized or expired, unless we materially breach any of our material obligations under the agreement or elect an early termination of the agreement or we undergo a change of control. Estimating the amount of payments that may be made under the tax receivable agreement is by its nature imprecise, insofar as the calculation of amounts payable depends on a variety of factors. The actual increase in tax basis, as well as the amount and timing of any payments under the tax receivable agreement, will vary depending upon a number of factors, including:
| • | the timing of any subsequent exchanges of Holdco Units—for instance, the increase in any tax deductions will vary depending on the fair value, which may fluctuate over time, of the depreciable or amortizable assets of LD Holdings at the time of each exchange; |
184
Table of Contents
| • | the price of shares of our Class A common stock at or around the time of the exchange—the increase in any tax deductions, as well as the tax basis increase in other assets, of LD Holdings is affected by the price of shares of our Class A common stock at the time of the exchange; |
| • | the extent to which such exchanges are taxable—if an exchange is not taxable for any reason, increased deductions will not be available; |
| • | the amount and timing of our income—loanDepot, Inc. generally will be required to pay 85% of the deemed benefits as and when deemed realized; and |
| • | the allocation of basis increases among the assets of LD Holdings and certain tax elections affecting depreciation. |
If LD Holdings does not have taxable income, loanDepot, Inc. generally is not required to make payments under the tax receivable agreement for that taxable year because no benefit actually will have been realized. Nevertheless, any tax benefits that do not result in realized benefits in a given tax year likely will generate tax attributes that may be utilized to generate benefits in previous or future tax years and the utilization of such tax attributes will result in payments under the tax receivable agreement. We expect that the payments that we may make under the tax receivable agreement will be substantial. There may be a material negative effect on our liquidity if, as a result of timing discrepancies or otherwise, (a) the payments under the tax receivable agreement exceed the actual benefits we realize in respect of the tax attributes subject to the tax receivable agreement and/or (b) distributions to loanDepot, Inc. by LD Holdings are not sufficient to permit loanDepot, Inc. to make payments under the tax receivable agreement after it has paid its taxes and other obligations. loanDepot, Inc.’s obligations pursuant to the tax receivable agreement will rank pari passu with its other general trade credit obligations. The payments under the tax receivable agreement are not conditioned upon any recipient’s continued ownership of us or LD Holdings. The Parthenon Stockholders and certain of the Continuing LLC will receive payments under the tax receivable agreement until such time that they validly assign or otherwise transfer their rights to receive such payments.
The effects of the tax receivable agreement on our consolidated balance sheet upon each purchase of Class I common units of LD Holdings or our purchase or exchange of Holdco Units are as follows:
| • | we will record an increase in deferred tax assets for the estimated income tax effects of the increase in the tax basis of the assets owned by loanDepot, Inc. based on enacted federal, state and local income tax rates at the date of the exchange or purchase. To the extent we estimate that we will not realize the full benefit represented by the deferred tax asset, based on an analysis of expected future earnings, we will reduce the deferred tax asset with a valuation allowance; |
| • | we will record an increase in liabilities for 85% of the estimated realizable tax benefit resulting from (i) the increase in the tax basis of the purchased or exchanged interests as noted above and (ii) certain other tax benefits subject to the tax receivable agreement; and |
| • | we will record an increase to additional paid-in capital in an amount equal to the difference between the increase in deferred tax assets and the increase in liability due to the Parthenon Stockholders and certain of the Continuing LLC Members under the tax receivable agreement. The amounts to be recorded for both the deferred tax assets and the liability for our obligations under the tax receivable agreement have been estimated. All of the effects of changes in any of our estimates after the date of the exchange or purchase will be included in our net income. Similarly, the effect of subsequent changes in the enacted tax rates will be included in net income. |
Payments under the tax receivable agreement will be based on the tax reporting positions that we determine in accordance with the tax receivable agreement. Although we do not currently anticipate that the IRS would have a basis for a successful challenge with respect to a tax basis increase, we will not be reimbursed for any payments previously made under the tax receivable agreement if the IRS subsequently disallows part or all of the tax benefits that gave rise to such prior payments, although future payments under the tax receivable agreement will be reduced on account of such disallowances. As a result, in certain circumstances, payments could be made under the tax receivable agreement that are significantly in excess of the benefits that we actually realize in respect of (a) the
185
Table of Contents
increases in tax basis resulting from our purchases or exchanges of Holdco Units and our purchase of Class I common units of LD Holdings (b) any incremental tax basis adjustments attributable to payments made pursuant to the tax receivable agreement and (c) any deemed interest deductions arising from our payments under the tax receivable agreement. Decisions made by the Parthenon Stockholders and the Continuing LLC Members in the course of running our business, such as with respect to mergers, asset sales, other forms of business combinations or other changes in control, may influence the timing and amount of payments that we are required to make under the tax receivable agreement. For example, the earlier disposition of assets following an exchange or acquisition transaction generally will accelerate payments under the tax receivable agreement and increase the present value of such payments, and the disposition of assets before an exchange or acquisition transaction will increase the Parthenon Stockholders’ and the Continuing LLC Members’ tax liability without giving rise to any obligations to make payments under the tax receivable agreement. In addition, a purchase of Class I common units of LD Holdings (pursuant to our election described under “—imortgage Settlement Agreement”) will increase the payments under the tax receivable agreement. Payments generally are due under the tax receivable agreement within a specified period of time following the filing of our tax return for the taxable year with respect to which the payment obligation arises, although interest on such payments will begin to accrue at a rate of LIBOR plus 500 basis points from the due date (without extensions) of such tax return.
Additionally the tax receivable agreement will provide that (1) in the event that we materially breach any of our material obligations under the agreement, whether as a result of failure to make any payment, failure to honor any other material obligation required thereunder or by operation of law as a result of the rejection of the agreements in a bankruptcy or otherwise, (2) if, at any time, we elect an early termination of the agreement or (3) upon certain changes of control of the Company, our (or our successor’s) obligations under the agreements (with respect to all Holdco Units and all Class I common units of LD Holdings, whether or not such units have been exchanged or acquired before or after such transaction) would accelerate and become payable in a lump sum amount equal to the present value of the anticipated future tax benefits calculated based on certain assumptions. These assumptions will include the assumptions that (i) we (or our successor) will have sufficient taxable income to fully utilize the deductions arising from the increased tax deductions and tax basis and other benefits subject to the tax receivable agreement, (ii) we (or our successor) will utilize any loss carryovers generated by the increased tax deductions and tax basis and other benefits in the earliest possible tax year, and (iii) LD Holdings and its subsidiaries will sell certain nonamortizable assets (and realize certain related tax benefits) no later than a specified date. As a result of the foregoing, if we materially breach a material obligation under the agreement or if we elect to terminate the agreement early, we would be required to make an immediate lump sum payment equal to the present value of the anticipated future tax savings, which payment may be made significantly in advance of the actual realization of such future tax savings. In these situations, our obligations under the tax receivable agreement could have a substantial negative impact on our liquidity. There can be no assurance that we will be able to fund or finance our obligations under the tax receivable agreement. Additionally, the obligation to make a lump sum payment upon a change of control may deter potential acquirors, which could negatively affect our stockholders’ potential returns.
Indemnification Agreements
We intend to enter into indemnification agreements with each of our current directors and executive officers. These agreements will require us to indemnify these individuals to the fullest extent permitted under Delaware law against liabilities that may arise by reason of their service to us, and to advance expenses incurred as a result of any proceeding against them as to which they could be indemnified. We also intend to enter into indemnification agreements with our future directors and executive officers.
Management Services Agreement
LDLLC is party to an amended and restated management services agreement, dated as of May 17, 2015 (the “Management Services Agreement”), with PCP, L.P. (formerly known as PCap, L.P.), a Delaware limited partnership, relating to certain management and advisory services Parthenon Capital provides to us. The
186
Table of Contents
Management Services Agreement provides for LDLLC (i) to pay Parthenon Capital an annual management fee equal to 1.0% of all amounts invested by Parthenon Capital, directly or indirectly, in securities of LDLLC or its subsidiaries, subject to increase for future amounts invested by Parthenon Capital, which fee will be payable on a quarterly basis in advance, (ii) to pay Parthenon Capital a fee upon the consummation of each equity financing in which Parthenon Capital is the investor in an amount equal to 1.0% of the aggregate gross cash equity investment made by Parthenon Capital and (iii) to reimburse Parthenon Capital for all of its reasonable out-of-pocket fees and expenses incurred in connection with the provision of services under the Management Services Agreement or the direct or indirect investment in or ownership of LDLLC or its subsidiaries by Parthenon Capital.
LDLLC indemnifies Parthenon Capital against all losses, claims, damages and liabilities arising out of the performance by Parthenon Capital of its services pursuant to the Management Services Agreement or relating to Parthenon Capital’s direct or indirect investment in or ownership of LDLLC or its subsidiaries, other than those that have resulted directly from the fraud, gross negligence, willful misconduct or bad faith of Parthenon Capital.
The Management Services Agreement had a three-year initial term commencing on December 30, 2009, and thereafter is subject to automatic one-year term renewals, except that the Management Services Agreement will terminate upon the earlier of (i) the consummation of a transaction or series of transactions pursuant to which any person or group of related persons acquires 50% or more of the equity interests of LDLLC, (ii) upon an Offering Event (as defined in the 6th LLC Agreement) such as this offering or (iii) the consummation of a transaction or series of transactions pursuant to which any person or group of related persons (other than equity holders of LDLLC or their affiliates as of the date of the Management Services Agreement) acquires all or substantially all of the Company’s assets determined on a consolidated basis. In connection with and as a condition to any termination of the Management Services Agreement, Parthenon Capital is entitled to receive an amount equal to any fees and expenses payable to Parthenon Capital through the date of termination.
We incurred approximately $0.2 million, $0.3 million, $0.7 million and $0.1 million in fees and expense reimbursements to Parthenon Capital under the Management Services Agreement for the six months ended June 30, 2015 and the years ended December 31, 2014, 2013 and 2012, respectively. In May 2015, LDLLC issued fully vested Class X common units with an aggregate value of approximately $0.4 million to PCP, L.P. in full satisfaction of (a) any and all amounts that are owed under the Management Services Agreement through May 17, 2015 and (b) any transaction fees payable to Parthenon Capital in connection with the termination of the Management Services Agreement upon completion of this offering. As part of the Reorganization Transactions, the entry into the 7th LLC Agreement will result in the conversion of LDLLC Class X common units into a single new class of LLC Units in LDLLC. Immediately after such conversion is effected, each holder of LLC Units will exchange such LLC Units on a one-for-one basis for Holdco Units.
Arrangement with Trilogy Mortgage Holdings, Inc.
As of June 30, 2015, the Company recorded a receivable from Trilogy Mortgage Holdings, Inc., an entity that is majority controlled by Anthony Hsieh and through which he beneficially owns 65,000 Class A common units, or 24.2% of the voting power, of LDLLC prior to the Reorganization Transactions, for tax payments or other miscellaneous items of approximately $0.2 million which is included in accounts receivable, net. The related party receivable pertains primarily to tax compliance fees paid by LDLLC on behalf of Trilogy Mortgage Holdings, Inc. since the inception of LDLLC in December 2009. The receivable was repaid in full in September 2015.
Aircraft and Boat Arrangements with North American Charters
We charter private aircraft and a boat owned by North American Charters, Inc. (“NA Charters”), a company controlled by Anthony Hsieh, which from time-to-time also leases the boat to third parties unaffiliated with us. We use the charter services mainly for the purposes of business travel for our executive officers and directors. During the six months ended June 30, 2015 and the years ended December 31, 2014, 2013 and 2012, we incurred
187
Table of Contents
expenses to NA Charters of approximately $0.3 million, $0.5 million, $0.5 million and $0.3 million, respectively, for the use of the aircraft and boat. These charges included only allocated costs based on business usage. Mr. Hsieh pays for all unallocated expenses and any expenses related to his personal travel or mixed-use travel (travel in which a non-business passenger is also on the aircraft or boat). The charter services were arranged through arms-length dealings and the rates paid by us were at or below market price.
Policies and Procedures With Respect to Related Party Transactions
Upon the closing of this offering, we intend to adopt policies and procedures whereby our audit committee will be responsible for reviewing and approving related party transactions. In addition, our general code of ethics will require that all of our employees and directors inform the Company of any material transaction or relationship that comes to their attention that could reasonably be expected to create a conflict of interest. Further, at least annually, each director and executive officer will complete a detailed questionnaire that asks questions about any business relationship that may give rise to a conflict of interest and all transactions in which we are involved and in which the executive officer, a director or a related person has a direct or indirect material interest.
188
Table of Contents
PRINCIPAL AND SELLING STOCKHOLDERS
The following table sets forth information regarding the beneficial ownership of our Class A common stock and Holdco Units as of October 30, 2015, for:
| • | each beneficial owner of more than 5% of any class of our outstanding shares; |
| • | each of our named executive officers; |
| • | each of our directors; |
| • | all of our executive officers, directors as a group; and |
| • | each selling stockholder. |
The number of shares of our Class A common stock beneficially owned and percentages of beneficial ownership before the offering set forth below are based on (i) the number of shares of Class A common stock and Holdco Units (together with the corresponding shares of Class B common stock) to be issued and outstanding immediately prior to the consummation of the Offering Transactions after giving effect to the Reorganization Transactions and (ii) an assumed initial public offering price of $17.00 per share, which is the midpoint of the estimated price range set forth on the cover page of this prospectus. The number of shares of our Class A common stock beneficially owned and percentages of beneficial ownership after the offering set forth below are based on (i) the number of shares of Class A common stock and Holdco Units (together with the corresponding shares of Class B common stock) to be issued and outstanding after the Offering Transactions, including the use of a portion of the proceeds from our sale of Class A common stock to purchase Holdco Units and shares of Class B common stock from the Exchanging Members and to redeem shares of Class A common stock from the Parthenon Stockholders, and (ii) an assumed initial public offering price of $17.00 per share, which is the midpoint of the estimated price range set forth on the cover page of this prospectus. Upon completion of this offering and the use of proceeds to us therefrom, the Parthenon Stockholders, PCP, L.P. and Anthony Hsieh and his affiliates, collectively as a group, will own approximately 65.8% of the voting power of our common stock, assuming that the underwriters do not exercise their option to buy additional shares of Class A common stock, and 63.2% of the voting power of our common stock, assuming that the underwriters exercise their option to buy additional shares of Class A common stock. As a result, we expect to be a “controlled company” within the meaning of the corporate governance rules of the NYSE.
We intend to use net proceeds from this offering of approximately (1) $52.1 million to redeem 3,067,227 shares of our Class A common stock from the Parthenon Stockholders, (2) up to $14.5 million to purchase 853,086 Premium Holdco Units, together with an equal number of shares of our Class B common stock, from Exchanging Members, including our Chief Executive Officer, certain of our executive officers, employees and other holders, and (3) $38.4 million to purchase 2,400,000 Holdco Units, together with an equal number of shares of our Class B common stock, from Exchanging Members, including our Chief Executive Officer, certain of our executive officers, employees and other holders, based on an assumed initial public offering price of $17.00 per share, which is the midpoint of the estimated price range set forth on the cover page of this prospectus. If the underwriters’ option to purchase additional shares is exercised, we intend to use approximately $23.0 million of the net proceeds from our sale of 2,340,000 additional shares to purchase 1,440,000 Holdco Units, together with an equal number of shares of our Class B common stock, from Exchanging Members, including our Chief Executive Officer, certain of our executive officers, employees and other holders. The beneficial ownership numbers and percentages for after this offering set forth below reflect this application of such net proceeds from this offering. See “Use of Proceeds” and “Certain Relationships and Related Party Transactions—Purchase of Premium Holdco Units and Class B Common Stock and Redemption of Class A Common Stock” and “—Purchase of Holdco Units and Class B Common Stock.”
189
Table of Contents
Beneficial ownership is determined in accordance with SEC rules. These rules generally attribute beneficial ownership of securities to persons who possess sole or shared voting power or investment power with respect to such securities or have the right to acquire such voting power or investment power within 60 days. Except as otherwise indicated, all persons listed below have sole voting and investment power with respect to the shares beneficially owned by them, subject to applicable community property laws. The table set forth below reflects the inclusion of both vested and unvested Holdco Units. Except as otherwise indicated, the address for each beneficial owner listed in the table below is c/o loanDepot.com, LLC, 26642 Towne Centre Drive, Foothill Ranch, California 92610.
| Class A common stock owned after giving effect to the Reorganization Transactions and before the Offering Transactions(1) |
Class A common stock being offered |
Holdco Units/ Class B common stock to be purchased/ Class A common stock to be redeemed(3) |
Class A common stock owned after giving effect to the Reorganization Transactions and Offering Transactions (assuming no exercise of underwriters’ option)(1) |
Additional Class A common stock being offered if underwriters’ option is exercised in full |
Additional Holdco Units/ Class B common stock to be purchased if underwriters’ option is exercised in full(3) |
Class A common stock owned after giving effect to the Reorganization Transactions and Offering Transactions (assuming full exercise of underwriters’ option)(1) |
||||||||||||||||||||||||||||||||||||||
| Name of Beneficial Owner |
Number | Percentage(2) | Number | Number | Number | Percentage(2) | Number | Number | Number | Percentage(2) | ||||||||||||||||||||||||||||||||||
| Principal Stockholders: |
||||||||||||||||||||||||||||||||||||||||||||
| Entities affiliated with Parthenon Capital(4) |
40,023,787 | 31.5 | % | 3,600,000 | 3,067,227 | 33,356,561 | 22.7 | % | 2,160,000 | — | 31,196,561 | 21.1 | % | |||||||||||||||||||||||||||||||
| Trilogy Mortgage Holdings, Inc.(5) |
22,972,910 | 18.1 | % | — | 633,609 | 22,339,301 | 15.2 | % | — | 1,013,775 | 21,325,526 | 14.4 | % | |||||||||||||||||||||||||||||||
| Executive Officers and Directors: |
||||||||||||||||||||||||||||||||||||||||||||
| Anthony Hsieh(6) |
65,340,660 | 51.5 | % | — | 1,980,561 | 63,360,100 | 43.1 | % | — | 1,078,249 | 62,281,851 | 42.1 | % | |||||||||||||||||||||||||||||||
| David Norris(7) |
242,277 | * | — | 29,412 | 212,865 | * | — | — | 212,865 | * | ||||||||||||||||||||||||||||||||||
| Jeff DerGurahian(8) |
4,082,775 | 3.2 | % | — | 117,396 | 3,965,379 | 2.7 | % | — | 42,455 | 3,922,925 | 2.7 | % | |||||||||||||||||||||||||||||||
| Bryan Sullivan(9) |
954,990 | * | — | 161,994 | 792,996 | * | — | 42,455 | 750,541 | * | ||||||||||||||||||||||||||||||||||
| Brian Biglin |
775,357 | * | — | 11,793 | 763,564 | * | — | 7,076 | 756,488 | * | ||||||||||||||||||||||||||||||||||
| Peter Macdonald(10) |
1,665,263 | 1.3 | % | — | 122,867 | 1,542,396 | 1.0 | % | — | 42,455 | 1,499,942 | 1.0 | % | |||||||||||||||||||||||||||||||
| Mike Smith(11) |
402,993 | * | — | 19,146 | 383,847 | * | — | 7,076 | 376,771 | * | ||||||||||||||||||||||||||||||||||
| Dominick Marchetti |
590,074 | * | — | — | 590,074 | * | — | — | 590,074 | * | ||||||||||||||||||||||||||||||||||
| Brian P. Golson(4) |
40,023,787 | 31.5 | % | 3,600,000 | 3,067,227 | 33,356,561 | 22.7 | % | 2,160,000 | — | 31,196,561 | 21.1 | % | |||||||||||||||||||||||||||||||
| Andrew C. Dodson(4) |
40,023,787 | 31.5 | % | 3,600,000 | 3,067,227 | 33,356,561 | 22.7 | % | 2,160,000 | — | 31,196,561 | 21.1 | % | |||||||||||||||||||||||||||||||
| John C. Dorman |
12,982 | * | — | — | 12,982 | * | — | — | 12,982 | * | ||||||||||||||||||||||||||||||||||
| Dawn Lepore |
12,982 | * | — | — | 12,982 | * | — | — | 12,982 | * | ||||||||||||||||||||||||||||||||||
| Executive Officers and Directors as a group (12 persons)(12) |
114,104,140 | 89.9 | % | 3,600,000 | 5,510,396 | 104,993,744 | 71.4 | % | 2,160,000 | 1,219,764 | 101,613,980 | 68.7 | % | |||||||||||||||||||||||||||||||
190
Table of Contents
| * | Less than 1% |
| (1) | Subject to the terms of the Holdings LLC Agreement, Holdco Units (together with the corresponding shares of our Class B common stock) are exchangeable for shares of our Class A common stock on a one-for-one basis. See “Certain Relationships and Related Party Transactions—Limited Liability Company Agreement of LD Holdings.” Beneficial ownership of Class A common stock reflected in the table above also reflects beneficial ownership of vested and unvested Holdco Units and shares of Class B common stock exchangeable for shares of Class A common stock. |
| (2) | Represents percentage of voting power of the Class A common stock and Class B common stock of loanDepot, Inc. voting together as a single class. See “Description of Capital Stock—Common Stock—Class B Common Stock.” As of October 30, 2015, there were 126,979,136 shares of Class A common stock and Class B common stock after giving effect to the Reorganization Transactions. |
| (3) | Represents shares of Class A common stock to be sold by us to purchase or redeem, as applicable, an equal number of (i) Holdco Units (including Premium Holdco Units) together with shares of Class B common stock from the Exchanging Members and (ii) shares of Class A common stock from the Parthenon Stockholders. Such beneficial owners participating in the offering only as Exchanging Members are not identified as selling stockholders in this prospectus. |
| (4) | Includes 1,475,184 Holdco Units owned by PCP, L.P. and 38,548,603 shares of Class A common stock owned by the Parthenon Stockholders. The reported shares of Class A common stock are owned of record by Parthenon Investors III, L.P., PCap Associates, Parthenon Capital Partners Fund, L.P. and Parthenon LoanDepot Partners, LP, which are collectively referred to herein as the Parthenon Stockholders. PCP Managers, LLC is the managing member of PCap III, LLC, which is the managing member of PCap Partners III, LLC, which is the general partner of each of Parthenon Investors III, L.P. and PCap Associates. PCP Managers, LLC is also the general partner of each of Parthenon Capital Partners Fund, L.P. and PCP, L.P. Parthenon LoanDepot Holdings GP, LLC is the general partner of Parthenon LoanDepot Partners, LP. Brian P. Golson is a Managing Member of PCP Managers, LLC and the President and Assistant Secretary of Parthenon LoanDepot Holdings GP, LLC and also serves as a Managing Partner at Parthenon Capital, an affiliate of each of the Parthenon Stockholders and PCP, L.P. Andrew C. Dodson serves as the Vice President and Secretary of Parthenon LoanDepot Holdings GP, LLC and also serves as a Partner at Parthenon Capital. Each of the above listed persons may be deemed to beneficially own the securities owned of record by the Parthenon Stockholders and PCP, L.P. However, each expressly disclaims beneficial ownership of such securities, except to the extent of his or its pecuniary interest therein. The address for the foregoing persons is c/o Parthenon Capital Partners, Four Embarcadero Center, Suite 3610, San Francisco, California 94111. |
| (5) | Anthony Hsieh is the President and majority controlling owner of Trilogy Mortgage Holdings, Inc. and is deemed to have beneficial ownership and voting and investment power over the securities held by Trilogy Mortgage Holdings, Inc. The address for Trilogy Mortgage Holdings, Inc. is 3355 Michelson Dr., Suite 300 Irvine, California 92612. |
| (6) | Includes 40,383,417 Holdco Units owned by Anthony Hsieh, 1,984,334 Holdco Units owned by JLSA, LLC and 22,972,910 Holdco Units owned by Trilogy Mortgage Holdings, Inc. (as listed in the table above). Mr. Hsieh is deemed to have beneficial ownership and voting and investment power over the securities held by JLSA, LLC and Trilogy Mortgage Holdings, Inc. |
| (7) | Includes 166,647 Holdco Units owned by David Norris and 75,630 Holdco Units owned by The Norris Family Trust 2 14 02. |
| (8) | Includes 4,065,952 Holdco Units owned by Jeff DerGurahian and 16,824 Holdco Units owned by PENSCO Trust Company Custodian FBO Jeffrey DerGurahian IRA. |
| (9) | Includes 881,965 Holdco Units owned by Bryan Sullivan, 19,361 Holdco Units owned by PENSCO Trust Company Custodian FBO Bryan Sullivan IRA, 10,924 Holdco Units owned by PENSCO Trust Company Custodian FBO Dana Sullivan IRA, 42,739 Holdco Units owned by Sullivan Family 2011 Trust and 7,563 Holdco Units owned by Bernard & Joy Sullivan Trust. |
| (10) | Includes 1,643,633 Holdco Units owned by Peter Macdonald and 21,630 Holdco Units owned by Peter Macdonald-IRA. |
| (11) | Includes 384,085 Holdco Units owned by Mike Smith and 18,908 Holdco Units owned by Mike Smith IRA. |
| (12) | Also includes 1,475,184 Holdco Units and 38,548,603 shares of Class A common stock held by entities affiliated with Parthenon Capital as listed in footnote (4) above. |
191
Table of Contents
The following is a description of the material terms of our amended and restated certificate of incorporation and amended and restated bylaws that will be in effect upon consummation of the offering. We refer you to our amended and restated certificate of incorporation and amended and restated bylaws, copies of which have been filed as exhibits to the registration statement of which this prospectus forms a part.
Authorized Capitalization
Upon completion of the offering and after giving effect to the use of proceeds to us therefrom, our authorized capital stock will consist of 750,000,000 shares of Class A common stock, par value $0.001 per share, of which 61,881,376 shares will be issued and outstanding, 250,000,000 shares of Class B common stock, par value $0.001 per share, of which 85,177,447 shares will be issued and outstanding, and 100,000,000 shares of preferred stock, par value $0.001 per share, none of which will be issued and outstanding.
Unless our board of directors determines otherwise, we will issue all shares of our capital stock in uncertificated form.
Common Stock
We have two classes of common stock: Class A and Class B, each of which has one vote per share. The Class A common stock and Class B common stock will generally vote together as a single class on all matters submitted to a vote of stockholders, except as otherwise required by applicable law.
Class A Common Stock
Voting Rights
Holders of shares of Class A common stock are entitled to one vote per share on all matters to be voted upon by the stockholders. The holders of Class A common stock do not have cumulative voting rights in the election of directors.
Dividend Rights
Subject to the rights of the holders of any preferred stock that may be outstanding and any contractual or statutory restrictions, holders of our Class A common stock are entitled to receive equally and ratably, share for share, dividends as may be declared by our board of directors out of funds legally available to pay dividends. Dividends upon our Class A common stock may be declared by the board of directors at any regular or special meeting, and may be paid in cash, in property, or in shares of capital stock. Before payment of any dividend, there may be set aside out of any of our funds available for dividends, such sums as the board of directors deems proper as reserves to meet contingencies, or for equalizing dividends, or for repairing or maintaining any of our property, or for any proper purpose, and the board of directors may modify or abolish any such reserve.
Liquidation Rights
Upon liquidation, dissolution, distribution of assets or other winding up, the holders of Class A common stock are entitled to receive ratably the assets available for distribution to the stockholders after payment of liabilities and the liquidation preference of any outstanding shares of preferred stock.
Other Matters
The shares of Class A common stock have no preemptive or conversion rights and are not subject to further calls or assessment by us. There are no redemption or sinking fund provisions applicable to the Class A common stock. All outstanding shares of our Class A common stock, including the Class A common stock offered in the offering, are fully paid and non-assessable.
192
Table of Contents
Class B Common Stock
Voting Rights
Holders of shares of Class B common stock are entitled to one vote per share on all matters submitted to a vote of stockholders. In connection with this offering, shares of Class B common stock will be issued to the Continuing LLC Members. Accordingly, the Continuing LLC Members will, as holders of Class B common stock, collectively have a number of votes in loanDepot, Inc. that is equal to the aggregate number of Holdco Units that they hold. When a Holdco Unit is exchanged by a Continuing LLC Member, a corresponding share of Class B common stock held by the exchanging owner is also exchanged and will be cancelled. Holders of shares of our Class A common stock and Class B common stock vote together as a single class on all matters presented to our stockholders for their vote or approval, except as otherwise required by applicable law. The holders of Class B common stock do not have cumulative voting rights in the election of directors.
No Dividend or Liquidation Rights
Holders of our Class B common stock do not have any right to receive dividends or to receive a distribution upon a liquidation or winding up of loanDepot, Inc.
Exchange for Class A Common Stock
Pursuant to the Holdings LLC Agreement, the Continuing LLC Members may from time to time (subject to the conditions therein) exchange an equal number of Holdco Units and shares of Class B common stock for shares of our Class A common stock on a one-for-one basis, subject to customary adjustments for stock splits, stock dividends and reclassifications. See “Certain Relationships and Related Party Transactions—Limited Liability Company Agreement of LD Holdings.”
Other Matters
The shares of Class B common stock have no preemptive or conversion rights and are not subject to further calls or assessment by us. There are no redemption or sinking fund provisions applicable to the Class B common stock. All outstanding shares of our Class B common stock are fully paid and non-assessable.
Preferred Stock
Our amended and restated certificate of incorporation authorizes our board of directors to establish one or more series of preferred stock and to determine, with respect to any series of preferred stock, the terms and rights of that series, including:
| • | the designation of the series; |
| • | the number of shares of the series which our board may, except where otherwise provided in the preferred stock designation, increase or decrease, but not below the number of shares then outstanding; |
| • | whether dividends, if any, will be cumulative or non-cumulative and the dividend rate of the series; |
| • | the dates at which dividends, if any, will be payable; |
| • | the redemption rights and price or prices, if any, for shares of the series; |
| • | the terms and amounts of any sinking fund provided for the purchase or redemption of shares of the series; |
| • | the amounts payable on shares of the series in the event of any voluntary or involuntary liquidation, dissolution or winding up of the affairs of our company, or upon any distribution of assets of our company; |
193
Table of Contents
| • | whether the shares of the series will be convertible into shares of any other class or series, or any other security, of our company or any other corporation, and, if so, the specification of the other class or series or other security, the conversion price or prices or rate or rates, any rate adjustments, the date or dates as of which the shares will be convertible and all other terms and conditions upon which the conversion may be made; |
| • | the preferences and special rights, if any, of the series and the qualifications and restrictions, if any, of the series; |
| • | the voting rights, if any, of the holders of the series; and |
| • | such other rights, powers and preferences with respect to the series as our board of directors may deem advisable. |
Authorized but Unissued Capital Stock
Delaware law does not require stockholder approval for any issuance of authorized shares. However, the listing requirements of the NYSE, which would apply if and for so long as our Class A common stock is listed on the NYSE, require stockholder approval of certain issuances. These additional shares may be used for a variety of corporate purposes, including future public offerings, to raise additional capital or to facilitate acquisitions. One of the effects of the existence of unissued and unreserved capital stock may be to enable our board of directors to issue shares to persons friendly to current management, which issuance could render more difficult or discourage an attempt to obtain control of our company by means of a merger, tender offer, proxy contest or otherwise, and thereby protect the continuity of our management and possibly deprive the stockholders of opportunities to sell their shares of Class A common stock at prices higher than prevailing market prices.
Anti–Takeover Effects of Certain Provisions of Delaware Law and Our Amended and Restated Certificate of Incorporation and Amended and Restated Bylaws
Certain provisions of our amended and restated certificate of incorporation and amended and restated bylaws, which are summarized in the following paragraphs, may have an anti-takeover effect and may delay, defer or prevent a tender offer or takeover attempt that a stockholder might consider in its best interest, including those attempts that might result in a premium over the market price for the shares held by stockholders.
Undesignated Preferred Stock
The ability to authorize undesignated preferred stock will make it possible for our board of directors to issue preferred stock with super voting, special approval, dividend or other rights or preferences on a discriminatory basis that could impede the success of any attempt to acquire us or otherwise effect a change in control of us. These and other provisions may have the effect of deferring, delaying or discouraging hostile takeovers, or changes in control or management of our company.
No Cumulative Voting
The DGCL provides that stockholders are not entitled to the right to cumulate votes in the election of directors unless our certificate of incorporation provides otherwise. Our amended and restated certificate of incorporation prohibits cumulative voting.
Stockholder Action by Written Consent and Calling of Special Meetings of Stockholders
Our amended and restated certificate of incorporation will provide that stockholder action can be taken only at an annual or special meeting of stockholders and cannot be taken by written consent in lieu of a meeting once Parthenon Capital, Anthony Hsieh and their respective affiliates cease collectively to beneficially own more than 50% of the voting power of our outstanding shares of common stock. Our amended and restated certificate of
194
Table of Contents
incorporation and bylaws will also provide that, except as otherwise required by law, special meetings of the stockholders can be called only pursuant to a resolution adopted by a majority of the total number of directors that we would have if there were no vacancies. Except as described above, stockholders will not be permitted to call a special meeting or to require the board of directors to call a special meeting.
Advance Notice Requirements for Stockholder Proposals and Director Nominations
Our amended and restated bylaws establish advance notice procedures with respect to stockholder proposals and the nomination of candidates for election as directors. In order for any matter to be “properly brought” before a meeting, a stockholder will have to comply with advance notice requirements and provide us with certain information. Our amended and restated bylaws allow the presiding officer at a meeting of the stockholders to adopt rules and regulations for the conduct of meetings which may have the effect of precluding the conduct of certain business at a meeting if the rules and regulations are not followed.
These provisions may defer, delay or discourage a potential acquirer from conducting a solicitation of proxies to elect the acquirer’s own slate of directors or otherwise attempting to obtain control of our company.
Classified Board of Directors
Our amended and restated certificate of incorporation will provide that our board of directors will be divided into three classes of directors, with the classes as nearly equal in number as possible. As a result, approximately one-third of our board of directors will be elected each year. The classification of directors will have the effect of making it more difficult for stockholders to change the composition of our board of directors.
Removal of Directors; Vacancies
Our amended and restated certificate of incorporation will provide that directors may only be removed from office only for cause and only upon the affirmative vote of at least 75% of the voting power of our outstanding shares of common stock entitled to vote in the election of directors. In addition, our amended and restated certificate of incorporation provides that any newly-created directorship on the board of directors that results from an increase in the number of directors and any vacancy occurring on the board of directors shall be filled only by a majority of the directors then in office, although less than a quorum, or by a sole remaining director.
Amendment to Certificate of Incorporation and Bylaws
The DGCL provides generally that the affirmative vote of a majority of the outstanding stock entitled to vote on amendments to a corporation’s certificate of incorporation or bylaws is required to approve such amendment, unless a corporation’s certificate of incorporation or bylaws, as the case may be, requires a greater percentage. Our amended and restated bylaws may be amended, altered, changed or repealed by a majority vote of our board of directors. In addition to any other vote otherwise required by law, any amendment, alteration, change, or repeal of our amended and restated bylaws by our stockholders will require the affirmative vote of at least 75% of the voting power of our outstanding shares of common stock, voting as a single class. Additionally, the affirmative vote of at least 75% of the voting power of our outstanding shares of common stock, voting as a single class, will be required to amend or repeal certain provisions of our amended and restated certificate of incorporation or to adopt any provision inconsistent with specified provisions of our amended and restated certificate of incorporation. This requirement of a supermajority vote to approve amendments to our amended and restated certificate of incorporation and amended and restated bylaws could enable a minority of our stockholders to exercise veto power over any such amendments.
Business Combinations
We have opted out of Section 203 of the DGCL; however, our amended and restated certificate of incorporation contains similar provisions providing that we may not engage in certain “business combinations”
195
Table of Contents
with any “interested stockholder” for a three-year period following the time that the stockholder became an interested stockholder, unless:
| • | prior to such time, our board of directors approved either the business combination or the transaction which resulted in the stockholder becoming an interested stockholder; |
| • | upon consummation of the transaction that resulted in the stockholder becoming an interested stockholder, the interested stockholder owned at least 85% of our voting stock outstanding at the time the transaction commenced, excluding certain shares; or |
| • | at or subsequent to that time, the business combination is approved by our board of directors and by the affirmative vote of holders of at least 66 2⁄3 % of our outstanding voting stock that is not owned by the interested stockholder. |
Generally, a “business combination” includes a merger, asset or stock sale or other transaction resulting in a financial benefit to the interested stockholder. Subject to certain exceptions, an “interested stockholder” is a person who, together with that person’s affiliates and associates, owns, or within the previous three years owned, 15% or more of our outstanding voting stock. For purposes of this section only, “voting stock” has the meaning given to it in Section 203 of the DGCL.
Under certain circumstances, this provision will make it more difficult for a person who would be an “interested stockholder” to effect various business combinations with us for a three-year period. This provision may encourage companies interested in acquiring us to negotiate in advance with our board of directors because the stockholder approval requirement would be avoided if our board of directors approves either the business combination or the transaction which results in the stockholder becoming an interested stockholder. These provisions also may have the effect of preventing changes in our board of directors and may make it more difficult to accomplish transactions which stockholders may otherwise deem to be in their best interests.
Our amended and restated certificate of incorporation provides that Parthenon Capital and its affiliates, and any of their respective direct or indirect transferees and any group as to which such persons are a party, do not constitute “interested stockholders” for purposes of this provision.
Limitations on Liability and Indemnification of Officers and Directors
The DGCL authorizes corporations to limit or eliminate the personal liability of directors to corporations and their stockholders for monetary damages for breaches of directors’ fiduciary duties. Our amended and restated certificate of incorporation includes a provision that eliminates the personal liability of directors for monetary damages for breach of fiduciary duty as a director, except:
| • | for breach of duty of loyalty; |
| • | for acts or omissions not in good faith or involving intentional misconduct or knowing violation of law; |
| • | under Section 174 of the DGCL (unlawful dividends); or |
| • | for transactions from which the director derived improper personal benefit. |
Our amended and restated certificate of incorporation and amended and restated bylaws provide that we must indemnify our directors and officers to the fullest extent authorized by the DGCL. We are also expressly authorized to, and do, carry directors’ and officers’ insurance providing coverage for our directors, officers and certain employees for some liabilities. We believe that these indemnification provisions and insurance are useful to attract and retain qualified directors and executive officers.
The limitation of liability and indemnification provisions in our amended and restated certificate of incorporation and amended and restated bylaws may discourage stockholders from bringing a lawsuit against directors for breach of their fiduciary duty. These provisions may also have the effect of reducing the likelihood
196
Table of Contents
of derivative litigation against directors and officers, even though such an action, if successful, might otherwise benefit us and our stockholders. In addition, your investment may be adversely affected to the extent we pay the costs of settlement and damage awards against directors and officers pursuant to these indemnification provisions.
We intend to enter into indemnification agreements with each of our directors and officers providing for additional indemnification protection beyond that provided by the directors’ and officers’ liability insurance policy. In the indemnification agreements, we will agree, subject to certain exceptions, to indemnify and hold harmless the director or officer to the maximum extent then authorized or permitted by the provisions of our amended and restated certificate of incorporation, the DGCL, or by any amendment(s) thereto.
There is currently no pending litigation or proceeding involving any of our directors, officers or employees for which indemnification is sought.
Corporate Opportunity
Our amended and restated certificate of incorporation provides that we renounce any interest or expectancy in, or in being offered an opportunity to participate in, any business opportunity that may from time to time be presented to Parthenon Capital or any of its officers, directors, agents, stockholders, members, partners, affiliates and subsidiaries (other than us and our subsidiaries) and that may be a business opportunity for Parthenon Capital, even if the opportunity is one that we might reasonably have pursued or had the ability or desire to pursue if granted the opportunity to do so. No such person will be liable to us for breach of any fiduciary or other duty, as a director or officer or otherwise, by reason of the fact that such person, acting in good faith, pursues or acquires any such business opportunity, directs any such business opportunity to another person or fails to present any such business opportunity, or information regarding any such business opportunity, to us unless, in the case of any such person who is our director or officer, any such business opportunity is expressly offered to such director or officer solely in his or her capacity as our director or officer. Neither Parthenon Capital nor any of its representatives has any duty to refrain from engaging directly or indirectly in the same or similar business activities or lines of business as us or any of our subsidiaries.
Choice of Forum
Our amended and restated certificate of incorporation provides that, unless we consent in writing to the selection of an alternative forum, the Court of Chancery of the State of Delaware will be the exclusive forum for: (a) any derivative action or proceeding brought on our behalf; (b) any action asserting a breach of fiduciary duty; (c) any action asserting a claim against us arising pursuant to the DGCL, our certificate of incorporation or our bylaws; or (d) any action asserting a claim against us that is governed by the internal affairs doctrine.
Transfer Agent and Registrar
The transfer agent and registrar for our Class A common stock will be Broadridge Corporate Issuer Solutions, Inc.
Listing
We have been approved to list our Class A common stock on the NYSE under the symbol “LDI”.
197
Table of Contents
SHARES ELIGIBLE FOR FUTURE SALE
Prior to the offering, there has been no public market for our Class A common stock. No prediction can be made as to the effect, if any, future sales of shares, or the availability for future sales of shares, will have on the market price of our Class A common stock prevailing from time to time. The sale of substantial amounts of our Class A common stock in the public market, or the perception that such sales could occur, could harm the prevailing market price of our Class A common stock.
Currently, 1,000 shares of our single class of common stock, par value $0.001 per share, are outstanding and owned by LDLLC. In connection with the offering, all 1,000 shares of such common stock held by LDLLC will be cancelled. In connection with this offering, we will issue 38,548,603 shares of Class A common stock to the Parthenon Stockholders. In addition, prior to our purchase of Holdco Units from LD Holdings and the Exchanging Members with a portion of the net proceeds to us from the offering, we intend to cause LD Holdings to distribute 88,430,533 shares of Class B common stock to the Continuing LLC Members. Upon consummation of the offering and after giving effect to the use of proceeds to us therefrom, we will have outstanding 61,881,376 shares of Class A common stock (or a maximum of 64,221,376 shares of Class A common stock if the underwriters exercise their option to purchase additional shares) and 85,177,447 shares of Class B common stock (or 83,737,447 shares of Class B common stock if the underwriters exercise their option to purchase additional shares in full). The shares of Class A common stock sold in the offering will be freely tradable without restriction or further registration under the Securities Act, except for any Class A common stock held by our “affiliates,” as defined in Rule 144, which would be subject to the limitations and restrictions described below. All of the other outstanding 31,881,376 shares of Class A common stock will be restricted securities that may not be sold in the absence of registration under the Securities Act unless an exemption from registration is available, including the exemption provided by Rule 144, and all are subject to the 180-day lock-up restrictions described below.
In addition, pursuant to certain provisions of the Holdings LLC Agreement, the Continuing LLC Members can from time to time exchange an equal number of Holdco Units and shares of Class B common stock for shares of loanDepot, Inc. Class A common stock on a one-for-one basis, subject to customary conversion rate adjustments for stock splits, stock dividends and reclassifications. Upon consummation of the offering and after giving effect to the use of proceeds to us therefrom, the Continuing LLC Members will hold 85,177,447 Holdco Units (or 83,737,447 Holdco Units if the underwriters exercise their option to purchase additional shares in full), all of which will be exchangeable together with an equal number of shares of Class B common stock for shares of our Class A common stock. The shares of Class A common stock we issue upon such exchanges would be “restricted securities” as defined in Rule 144 unless we register such issuances.
In addition, 14,705,882 shares of Class A common stock may be granted under our 2015 Omnibus Incentive Plan (including any LTIP Units, which may be granted thereunder), which amount shall be increased on the first day of each fiscal year during the term of the 2015 Omnibus Incentive Plan commencing with the 2017 fiscal year by 3% of the total number of shares of common stock outstanding on the last day of the immediately preceding fiscal year or a lesser amount determined by our board of directors. 3,676,470 shares of Class A common stock are reserved for issuance under the LD ESPP. See “Executive Compensation—Employee Benefit Plans—2015 Omnibus Incentive Plan” and “—Employee Stock Purchase Plan.” We intend to file one or more registration statements on Form S-8 under the Securities Act to register Class A common stock issued or reserved for issuance under our 2015 Omnibus Incentive Plan and the LD ESPP. Any such Form S-8 registration statement will automatically become effective upon filing. Accordingly, shares registered under such registration statement will be available for sale in the open market, unless such shares are subject to vesting restrictions with us or the lock-up restrictions described below.
Stockholders Agreement
Effective upon the consummation of the offering, we will enter into a stockholders agreement with the Parthenon Stockholders and certain of the Continuing LLC Members, from time to time party thereto, which
198
Table of Contents
currently includes PCP, L.P. and all of our directors and executive officers (including their respective affiliates). The stockholders agreement will provide for certain restrictions and rights with respect to the transfer and sale following the offering of our Class A common stock (including Class A common stock received following exchange of Holdco Units and shares of Class B common stock pursuant to the Holdings LLC Agreement) by the parties to the stockholders agreement. See “Certain Relationships and Related Party Transactions—Stockholders Agreement.”
Registration Rights Agreement
Effective upon consummation of the offering, we will enter into a registration rights agreement with the Parthenon Stockholders and the Continuing LLC Members pursuant to which we will grant them, their affiliates and certain of their transferees the right, under certain circumstances and subject to certain restrictions, to require us to register under the Securities Act shares of our Class A common stock (including, without limitation, shares
of Class A common stock that are issuable by means of conversion, exchange or exercise of other securities) held or acquired by them. Such securities registered under any registration statement will be available for sale in the open market unless restrictions apply.
Lock-Up of Our Class A Common Stock
We, all of our directors and officers and substantially all of the holders of our outstanding stock and stock options, including all of the selling stockholders, have agreed with the underwriters, subject to certain exceptions described below, not to (i) offer, pledge, sell, contract to sell, sell any option or contract to purchase, purchase any option or contract to sell, grant any option, right or warrant to purchase, lend or otherwise transfer or dispose of, directly or indirectly, any shares of Class A common stock or any securities convertible into or exercisable or exchangeable for shares of Class A common stock, (ii) file any registration statement with the Securities and Exchange Commission relating to the offering of any shares of Class A common stock or any securities convertible into or exercisable or exchangeable for Class A common stock, or (iii) enter into any swap or other arrangement that transfers to another, in whole or in part, any of the economic consequences of ownership of the Class A common stock, whether owned directly by such member (including holding as a custodian) or with respect to which such member has beneficial ownership within the rules and regulations of the SEC, during the period from the date of this prospectus continuing through the date 180 days after the date of this prospectus, except with the prior written consent of Morgan Stanley & Co. LLC and Goldman, Sachs & Co. Currently, the underwriters have no current intention to release the aforementioned holders of our Class A common stock from the lock-up restrictions described above.
Our lock-up agreement will provide for certain exceptions. See “Underwriting.”
Rule 144
The shares of Class A common stock to be issued upon exchange of the Holdco Units and other shares of Class A common stock not sold in this offering will be, when issued, “restricted” securities under the meaning of Rule 144 under the Securities Act, and may not be sold in the absence of registration under the Securities Act unless an exemption from registration is available, including the exemption provided by Rule 144.
In general, under Rule 144 under the Securities Act, a person (or persons whose shares are aggregated) who is not deemed to have been an “affiliate” of ours at any time during the three months preceding a sale, and who has held restricted securities within the meaning of Rule 144 for at least six months (including any period of consecutive ownership of preceding non-affiliated holders) would be entitled to sell those securities, subject only to the availability of current public information about us. As defined in Rule 144, an “affiliate” of an issuer is a person that directly, or indirectly, through one or more intermediaries, controls, or is under common control with the issuer. A non-affiliated person who has held restricted securities within the meaning of Rule 144 for at least one year would be entitled to sell those securities without regard to the provisions of Rule 144.
199
Table of Contents
A person (or persons whose securities are aggregated) who is deemed to be an affiliate of ours and who has held restricted securities within the meaning of Rule 144 for at least six months would be entitled to sell within any three-month period a number of securities that does not exceed the greater of one percent of the then outstanding shares of securities of such class or the average weekly trading volume of securities of such class during the four calendar weeks preceding such sale. Such sales are also subject to certain manner of sale provisions, notice requirements and the availability of current public information about us (which requires that we are current in our periodic reports under the Exchange Act).
200
Table of Contents
U.S. FEDERAL TAX CONSIDERATIONS FOR NON-U.S. HOLDERS
The following is a summary of material U.S. federal income tax consequences to non-U.S. holders, as defined below, of the purchase, ownership and disposition of shares of our Class A common stock. This summary deals only with non-U.S. holders of shares of Class A common stock that purchase the shares in the offering and will hold such shares as capital assets (generally, property held for investment) within the meaning of section 1221 of the Code.
For purposes of this discussion, a “non-U.S. holder” is a beneficial owner of shares of our Class A common stock that, for U.S. federal income tax purposes, is not a partnership and is not any of the following:
| • | an individual who is a citizen or resident of the United States; |
| • | a corporation (or any other entity treated as a corporation for U.S. federal income tax purposes) created or organized in or under the laws of the United States, any state thereof or the District of Columbia; |
| • | an estate the income of which is subject to U.S. federal income taxation regardless of its source; or |
| • | a trust if it (1) is subject to the primary supervision of a court within the United States and one or more U.S. persons have the authority to control all substantial decisions of the trust or (2) has a valid election in effect under applicable U.S. Treasury regulations to be treated as a U.S. person for U.S. federal income tax purposes. |
This summary is based upon provisions of the Code, U.S. Treasury regulations promulgated under the Code, rulings and other administrative pronouncements, and judicial decisions, all as of the date hereof. These authorities are subject to different interpretations and may be changed, perhaps retroactively, so as to result in U.S. federal income tax consequences different from those summarized below. We cannot assure you that a change in law, possibly with retroactive application, will not significantly alter the tax considerations described in this summary. This summary does not address all aspects of U.S. federal income taxation and does not deal with non-U.S., state, local, alternative minimum, gift and estate, or other tax considerations, including the Medicare tax on certain investment income, that may be relevant to non-U.S. holders in light of their particular circumstances. In addition, this summary does not describe the U.S. federal income tax consequences applicable to you if you are subject to special treatment under U.S. federal income tax laws (including if you are a U.S. expatriate or U.S. expatriated entity or subject to the U.S. anti-inversion rules, a bank or other financial institution, an insurance company, a tax-exempt entity, a broker, dealer, or trader in securities, commodities or currencies, a regulated investment company, a real estate investment trust, a “controlled foreign corporation,” a “passive foreign investment company,” a partnership or other pass-through entity for U.S. federal income tax purposes (or an investor in such a pass-through entity), a corporation that accumulates earnings to avoid U.S. federal income tax, a person who acquired shares of our common stock as compensation or otherwise in connection with the performance of services, or a person who has acquired shares of our common stock as part of a straddle, hedge, conversion transaction, synthetic security or other integrated investment, or risk reduction transaction).
We have not sought and do not plan to seek any rulings from the U.S. Internal Revenue Service, or the IRS, regarding the statements made and the conclusions reached in this summary. There can be no assurance that the IRS or a court will not take positions concerning the tax consequences of the ownership or disposition of shares of our Class A common stock that differ from those discussed in this summary.
If any entity or arrangement treated as a partnership for U.S. federal income tax purposes holds shares of our Class A common stock, the tax treatment of a partner generally will depend upon the status of the partner and the activities of the partner and the partnership. If you are a partner of a partnership holding shares of our Class A common stock, you should consult your tax advisors.
201
Table of Contents
This summary is for general information only and is not intended to constitute a complete description of all U.S. federal income tax consequences for non-U.S. holders relating to the purchase, ownership and disposition of shares of our Class A common stock. If you are considering the purchase of shares of our Class A common stock, you should consult your tax advisors concerning the particular U.S. federal income tax consequences to you of the purchase, ownership and disposition of shares of our Class A common stock, as well as the consequences to you arising under U.S. tax laws other than the federal income tax law discussed in this summary or under the laws of any other applicable taxing jurisdiction in light of your particular circumstances.
Dividends
As discussed under the section entitled “Dividend Policy” above, we do not currently anticipate paying cash dividends. In the event that we do make distributions of cash or property (other than certain stock distributions) with respect to our Class A common stock, any such distributions will generally constitute dividends for U.S. federal income tax purposes to the extent paid from our current or accumulated earnings and profits, as determined under U.S. federal income tax principles. To the extent any such distributions exceed both our current and our accumulated earnings and profits, such excess amount will be allocated ratably among each share of common stock with respect to which the distribution is paid and will first be treated as a tax-free return of capital reducing your adjusted tax basis in our Class A common stock, but not below zero, and thereafter will be treated as gain from the sale or other taxable disposition of such stock, the treatment of which is discussed under “—Gain on Disposition of Shares of Class A Common Stock.” Your adjusted tax basis in a share of our Class A common stock is generally your purchase price for such share, reduced by the amount of any such prior tax-free returns of capital (but not below zero).
Dividends paid to a non-U.S. holder generally will be subject to a U.S. withholding tax at a 30% rate, or such lower rate as may be specified by an applicable income tax treaty. A non-U.S. holder of shares of our Class A common stock who wishes to claim the benefit of an applicable treaty rate and avoid backup withholding, as discussed below, for dividends generally will be required (a) to properly complete IRS Form W-8BEN or W-8BEN-E (or other applicable form) and certify under penalty of perjury that such holder is not a U.S. person as defined under the Code and is eligible for treaty benefits, or (b) if such holder’s shares of our Class A common stock are held through certain foreign intermediaries or foreign partnerships, satisfy the relevant certification requirements of applicable U.S. Treasury regulations. This certification must be provided to us or our paying agent prior to the payment to you of any dividends and must be updated periodically, including upon a change in circumstances that makes any information on such certificate incorrect.
Dividends paid to a non-U.S. holder that are effectively connected with the conduct of a trade or business within the United States by such non-U.S. holder (and, if required by an applicable income tax treaty, are attributable to a U.S. permanent establishment) generally will not be subject to the aforementioned withholding tax, provided certain certification and disclosure requirements are satisfied (including providing a properly completed IRS Form W-8ECI or other applicable IRS Form W-8). Instead, such dividends generally will be subject to U.S. federal income tax on a net income basis at applicable graduated individual or corporate rates in generally the same manner as if the non-U.S. holder were a U.S. person as defined under the Code, unless an applicable income tax treaty provides otherwise. A non-U.S. holder that is treated as a corporation for U.S. federal income tax purposes may be subject to an additional “branch profits tax” at a 30% rate (or such lower rate as may be specified by an applicable income tax treaty) on earnings and profits attributable to dividends that are effectively connected with its conduct of a U.S. trade or business (and, if an income tax treaty applies, are attributable to its U.S. permanent establishment), subject to adjustments.
A non-U.S. holder of shares of our Class A common stock eligible for a reduced rate of U.S. withholding tax pursuant to an income tax treaty may obtain a refund of any excess amounts withheld by timely filing an appropriate claim for refund with the IRS.
202
Table of Contents
Gain on Disposition of Shares of Class A Common Stock
Subject to the discussions below on backup withholding and FATCA, any gain realized by a non-U.S. holder on the sale or other disposition of shares of our Class A common stock generally will not be subject to U.S. federal income tax unless:
| • | the gain is effectively connected with a trade or business of the non-U.S. holder in the United States (and, if required by an applicable income tax treaty, is attributable to a U.S. permanent establishment); |
| • | the non-U.S. holder is an individual who is present in the United States for 183 days or more in the taxable year of such sale or other disposition, and certain other conditions are met; or |
| • | we are or have been a U.S. real property holding corporation for U.S. federal income tax purposes at any time during the shorter of the five-year period ending on the date of the disposition or the period that the non-U.S. holder held shares of our common stock, and certain other conditions are met. |
In the case of a non-U.S. holder described in the first bullet point above, any net gain derived from the disposition generally will be subject to U.S. federal income tax under graduated U.S. federal income tax rates on a net income basis in generally the same manner as if the non-U.S. holder were a U.S. person as defined under the Code, unless an applicable income tax treaty provides otherwise. Additionally, a non-U.S. holder that is a corporation may be subject to a branch profits tax equal to 30% of its effectively connected earnings and profits attributable to such gain (or, if an income tax treaty applies, at such lower rate as may be specified by the treaty on its gains attributable to its U.S. permanent establishment), subject to adjustments. Except as otherwise provided by an applicable income tax treaty, an individual non-U.S. holder described in the second bullet point above will be subject to a 30% tax on any gain derived from the disposition, which may be offset by certain U.S. source capital losses provided that the non-U.S. holder has timely filed U.S. federal income tax returns with respect to such losses, even though the individual is not considered a resident of the United States under the Code. With respect to the third bullet point above, we believe we are not and, although no assurance can be given, do not anticipate becoming a U.S. real property holding corporation for U.S. federal income tax purposes. If we are, or become, a U.S. real property holding corporation, then, as long as our Class A common stock is regularly traded on an established securities market, a non-U.S. holder will generally not be subject to U.S. federal income tax on the disposition of our common stock so long as the non-U.S. holder has not held more than 5% (actually or constructively) of our total outstanding common stock at any time during the shorter of the five-year period preceding the date of such disposition or such non-U.S. holder’s holding period. You should consult your own tax advisor about the consequences that could result if we are, or become, a U.S. real property holding corporation.
Information Reporting and Backup Withholding
The amount of dividends paid to each non-U.S. holder, and the tax withheld with respect to such dividends generally will be reported annually to the IRS and to each such holder, regardless of whether withholding was reduced or eliminated by an applicable tax treaty. Copies of the information returns reporting such dividends and withholding may also be made available to the tax authorities in the country in which the non-U.S. holder resides or is established under the provisions of an applicable income tax treaty or agreement.
A non-U.S. holder generally will be subject to backup withholding (currently at a rate of 28%) for dividends paid to such non-U.S. holder on shares of our Class A common stock unless such holder certifies under penalty of perjury (usually on an IRS Form W-8BEN or W-8BEN-E) that it is a non-U.S. holder (and the payor does not have actual knowledge or reason to know that such holder is a U.S. person as defined under the Code), or such holder otherwise establishes an exemption. Information reporting and, depending on the circumstances, backup withholding will apply to the proceeds of a sale of shares of our Class A common stock within the United States or conducted through certain U.S.-related financial intermediaries, unless the beneficial owner certifies under penalty of perjury that it is a non-U.S. holder (and the payor does not have actual knowledge or reason to know that the beneficial owner is a United States person as defined under the Code), or such owner otherwise establishes an exemption.
203
Table of Contents
Backup withholding is not an additional tax. Any amounts withheld under the backup withholding rules may be allowed as a refund or a credit against a non-U.S. holder’s U.S. federal income tax liability provided the required information is timely furnished to the IRS.
Foreign Account Tax Compliance Act
Legislation and administrative guidance, commonly known as “FATCA,” generally imposes a withholding tax of 30% on any dividends on our Class A common stock paid to certain “foreign financial institutions,” as specifically defined under such rules (and including where such entity is acting as an intermediary), and generally including a non-U.S. investment vehicle, unless such institution enters into an agreement with the U.S. government to, among other things, collect and provide to the U.S. tax authorities substantial information regarding U.S. account holders of such institution (which includes certain equity and debt holders of such institution, as well as certain account holders that are foreign entities with U.S. owners) or another exception applies. Absent any applicable exception, FATCA will also generally impose a withholding tax of 30% on any dividends on our Class A common stock paid to a foreign entity that is not a foreign financial institution unless such entity provides the withholding agent with either a certification that such entity does not have any substantial U.S. owners or a certification identifying the substantial U.S. owners of the entity, which generally includes any U.S. person who directly or indirectly owns more than 10% of the entity, and meets certain other specified requirements. Finally, beginning on January 1, 2019 withholding of 30% also generally will apply to the gross proceeds of a disposition of our Class A common stock paid to a foreign financial institution or to a non-financial foreign entity unless the reporting and certification requirements described above have been met or another exception applies. An intergovernmental agreement between the United States and an applicable foreign country may modify these requirements. Under certain circumstances, a non-U.S. holder of our Class A common stock may be eligible for refunds or credits of such taxes, and a non-U.S. holder might be required to file a U.S. federal income tax return to claim such refunds or credits. Investors are encouraged to consult with their tax advisors regarding the possible implications of FATCA on their investment in our Class A common stock.
THE SUMMARY OF MATERIAL U.S. FEDERAL INCOME TAX CONSIDERATIONS FOR NON-U.S. HOLDERS ABOVE IS INCLUDED FOR GENERAL INFORMATION PURPOSES ONLY. POTENTIAL PURCHASERS OF OUR CLASS A COMMON STOCK ARE URGED TO CONSULT THEIR TAX ADVISORS TO DETERMINE THE U.S. FEDERAL, STATE, LOCAL AND NON-U.S. INCOME AND OTHER TAX AND TAX TREATY CONSIDERATIONS OF PURCHASING, OWNING AND DISPOSING OF OUR CLASS A COMMON STOCK.
204
Table of Contents
Under the terms and subject to the conditions in an underwriting agreement dated the date of this prospectus, the underwriters named below, for whom Morgan Stanley & Co. LLC, Goldman, Sachs & Co., Wells Fargo Securities, LLC and Barclays Capital Inc. are acting as representatives, have severally agreed to purchase, and we and the selling stockholders have agreed to sell to them, the number of shares indicated below:
| Underwriters |
Number of Shares |
|||
| Morgan Stanley & Co. LLC |
||||
| Goldman, Sachs & Co. |
||||
| Wells Fargo Securities, LLC |
||||
| Barclays Capital Inc. |
||||
| UBS Securities LLC |
||||
| Citigroup Global Markets Inc. |
||||
| BMO Capital Markets Corp. |
||||
| JMP Securities LLC |
||||
| Raymond James & Associates, Inc. |
||||
| William Blair & Company, L.L.C. |
||||
|
|
|
|||
| Total |
30,000,000 | |||
|
|
|
|||
The underwriters and the representatives are collectively referred to as the “underwriters” and the “representatives,” respectively. The underwriters are offering the shares of Class A common stock subject to their acceptance of the shares from us and the selling stockholders and subject to prior sale. The underwriting agreement provides that the obligations of the several underwriters to pay for and accept delivery of the shares of Class A common stock offered by this prospectus are subject to the approval of certain legal matters by their counsel and to certain other conditions. The underwriters are obligated to take and pay for all of the shares of Class A common stock offered by this prospectus if any such shares are taken. However, the underwriters are not required to take or pay for the shares covered by the underwriters’ option to purchase additional shares described below.
The underwriters initially propose to offer part of the shares of Class A common stock directly to the public at the offering price listed on the cover page of this prospectus and part to certain dealers. After the initial offering of the shares of Class A common stock, the offering price and other selling terms may from time to time be varied by the representatives.
We and the selling stockholders have granted to the underwriters an option, exercisable for 30 days from the date of this prospectus, to purchase up to 4,500,000 additional shares of Class A common stock at the public offering price listed on the cover page of this prospectus, less underwriting discounts and commissions. To the extent the option is exercised, each underwriter will become obligated, subject to certain conditions, to purchase about the same percentage of the additional shares of Class A common stock as the number listed next to the underwriter’s name in the preceding table bears to the total number of shares of Class A common stock listed next to the names of all underwriters in the preceding table. The underwriters reserve the right to withdraw, cancel or modify offers to the public and to reject orders in whole or part.
205
Table of Contents
The following table shows the per share and total public offering price, underwriting discounts and commissions, and proceeds before expenses to us and the selling stockholders. These amounts are shown assuming both no exercise and full exercise of the underwriters’ option to purchase up to an additional 4,500,000 shares of Class A common stock.
| Per Share |
Total | |||||||||||
| No Exercise | Full Exercise |
|||||||||||
| Public offering price |
$ | $ | $ | |||||||||
| Underwriting discounts and commissions to be paid by: Us |
$ | $ | $ | |||||||||
| Selling stockholders |
$ | $ | $ | |||||||||
| Proceeds, before expenses, to us |
$ | $ | $ | |||||||||
| Proceeds, before expenses, to selling stockholders |
$ | $ | $ | |||||||||
The estimated offering expenses payable by us, exclusive of the underwriting discounts and commissions and financial advisory services fee (further disclosed herein), are approximately $4.4 million. We have agreed to reimburse the underwriters for expense relating to clearance of this offering with the Financial Industry Regulatory Authority up to $40,000.
The underwriters have informed us that they do not intend sales to discretionary accounts to exceed 5% of the total number of shares of Class A common stock offered by them.
We have been approved to list our Class A common stock on the NYSE under the trading symbol “LDI”.
We, all of our directors and officers and substantially all of the holders of our outstanding stock and stock options, including all of the selling stockholders, have agreed that, without the prior written consent of Morgan Stanley & Co. LLC and Goldman, Sachs & Co. on behalf of the underwriters, we and they will not, during the period ending 180 days after the date of this prospectus (the “restricted period”):
| • | offer, pledge, sell, contract to sell, sell any option or contract to purchase, purchase any option or contract to sell, grant any option, right or warrant to purchase, lend or otherwise transfer or dispose of, directly or indirectly, any shares of Class A common stock or any securities convertible into or exercisable or exchangeable for shares of Class A common stock, including Class B common stock and units of LDLLC and LD Holdings; or |
| • | enter into any swap or other arrangement that transfers to another, in whole or in part, any of the economic consequences of ownership of the Class A common stock or such other securities |
whether any such transaction described above is to be settled by delivery of Class A common stock or such other securities, in cash or otherwise. In addition, we and each such person agrees that, without the prior written consent of Morgan Stanley & Co. LLC and Goldman, Sachs & Co. on behalf of the underwriters, we or such other person will not, during the restricted period, make any demand for, or exercise any right with respect to, the registration of any shares of Class A common stock or any security convertible into or exercisable or exchangeable for Class A common stock.
The restrictions described in the immediately preceding paragraph do not apply to certain transactions, subject in certain cases to various conditions (such as no filing requirements and the transfer of the lock-up restrictions) by us, our directors, officers, selling stockholders and other holders of our outstanding stock and stock options, including, but not limited to:
| (a) | the establishment of a trading plan pursuant to Rule 10b5-1 under the Exchange Act for the transfer of Class A common stock, provided that such plan does not provide for the transfer of Class A common stock during the restricted period; |
206
Table of Contents
| (b) | transfers in connection with the Reorganization Transactions on the terms described under “Organizational Structure—Reorganization Transactions at LDLLC” and “—Offering Transactions” in this prospectus prior to the completion of this offering; |
| (c) | transfers pursuant to an order of a court or regulatory agency; |
| (d) | the exchange of any units of LD Holdings and a corresponding number of shares of Class B common stock into or for shares of Class A common stock pursuant to the limited liability company agreement of LD Holdings (or separate agreement governing such exchange) described in this prospectus; or |
| (e) | Class A common stock to be sold pursuant to this offering. |
In addition, the restrictions in the foregoing do not apply to certain transactions, subject in certain cases to various conditions (such as no filing requirements and the transfer of the lock-up restrictions) solely by us, including, but not limited to:
| (a) | issuances by us, LDLLC or LD Holdings upon the exercise of an option or warrant or the conversion of a security outstanding on the date of this prospectus of which the underwriters have been advised in writing; |
| (b) | issuances by us, LDLLC or LD Holdings of any options and other awards granted under an equity incentive plan or employee stock purchase plan described in this prospectus (and issuances by us, LDLLC or LD Holdings upon the exercise thereof under any plan described in this prospectus); |
| (c) | the filing by us of any registration statement on Form S-8 or a successor form thereto relating to the shares of Class A common stock or any securities convertible into or exercisable or exchangeable for Class A common stock granted pursuant to or reserved for issuance under an equity incentive plan or employee stock purchase plan described in this prospectus; or |
| (d) | issuances in connection with the acquisition of the business, property or other assets of, or a majority or controlling portion of the equity of, or a business combination, a joint venture, commercial relationship or other strategic transactions with, another entity in connection with such transaction by us or any of our subsidiaries, provided that the aggregate number of securities (on an as-converted, as-exercised or as-exchanged basis) issued or issuable pursuant to this clause does not exceed 5% of the number of shares of Class A common stock outstanding immediately after the offering of the Class A common stock pursuant to this prospectus determined on a fully-diluted basis and assuming that all outstanding Holdco Units in LD Holdings that are exchangeable for shares of Class A common stock are so exchanged. |
In addition, the restrictions described in the foregoing do not apply to certain transactions, subject in certain cases to various conditions (such as no filing requirements and the transfer of the lock-up restrictions) solely by our directors, officers, selling stockholders and other holders of our outstanding stock and stock options, including, but not limited to:
| (a) | transactions relating to securities acquired from the underwriters in this offering (other than any issuer-directed shares of Class A common stock purchased by any officer or director of us, LDLLC or LD Holdings) or acquired in open market transactions after the completion of this offering; |
| (b) | transfers (i) in the case of a corporation or partnership or limited liability company or other business entity, to another corporation, partnership, limited liability company or other business entity that controls, is controlled by or is under common control with the transferor, (ii) in the case of a trust, to a trustor or beneficiary of the trust or (iii) not involving a change in beneficial ownership; |
| (c) | distributions to limited partners, members or stockholders of the security holder; |
| (d) | the receipt from us, LDLLC or LD Holdings upon the vesting of stock awards or the exercise of options or warrants issued pursuant to our, LDLLC’s or LD Holdings’ equity incentive plans or the |
207
Table of Contents
| transfer to us, LDLLC or LD Holdings upon a vesting event of our, LDLLC’s or LD Holdings’ securities or upon the exercise of options or warrants to purchase our, LDLLC’s or LD Holdings’ securities (including settlement of restricted stock units), in each case on a “cashless” or “net exercise” basis or to cover tax withholding obligations of the recipient in connection with such vesting or exercise, insofar as such stock award, option or warrant was outstanding on the date of the underwriting agreement and would, by its terms, expire during the restricted period (except that the requirement of expiration during the restricted period shall not apply to stock awards that by their terms are automatically paid or settled upon vesting); |
| (e) | the transfer to us, LDLLC or LD Holdings, pursuant to agreements under which we, LDLLC or LD Holdings has the option to repurchase such shares or securities or a right of first refusal, as described in this prospectus, with respect to transfers of such shares or securities; |
| (f) | in the case of an individual, the transfer that occurs by operation of law pursuant to a qualified domestic order or in connection with a divorce settlement; |
| (g) | the sale of shares of Class A common stock to the underwriters pursuant to the underwriting agreement, and any transfer to us or LD Holdings made on or about the closing date of this offering in consideration for cash from our proceeds from this offering, on the terms described in this prospectus; |
| (h) | any transfer pursuant to a bona fide third party tender offer, merger, consolidation or other similar transaction made to all holders of the Class A common stock or such other securities involving a “change of control” (as defined below) of us following this offering approved by the our board of directors; provided that all of the security holder’s shares of Class A common stock or any security convertible into or exercisable or exchangeable for shares of Class A common stock subject to the lock-up that are not so transferred, sold, tendered or otherwise disposed of remain subject to the lock-up; and provided further, that in the event that the tender offer, merger, consolidation or other such transaction is not completed, the Class A common stock or such other securities owned by the security holder shall remain subject to the terms of this agreement. For purposes of this clause, “change of control” shall mean the consummation of any bona fide third party tender offer, merger, consolidation or other similar transaction the result of which is that any “person” (as defined in Section 13(d)(3) of the Exchange Act), or group of persons, other than us, becomes the beneficial owner (as defined in Rules 13d-3 and 13d-5 of the Exchange Act) of a majority of the total voting power of the voting stock of ours; |
| (i) | transfers to the security holder’s affiliates or to any investment fund or other entity controlled or managed by the security holder; provided that in the case of any transfer or distribution pursuant to this clause, any such transfer or distribution shall not involve a disposition for value; |
| (j) | transfers from an executive officer to us, LDLLC or LD Holdings upon death, disability or termination of employment of such executive officer; |
| (k) | transfers to a nominee or custodian of a person or entity to whom a disposition or transfer would be permissible under clauses (b), (c) and (i); or |
| (l) | transfers (i) as a bona fide gift, including to charitable organizations, or by will or intestacy or (ii) to an immediate family member or to a trust, or other entity formed for estate planning purposes, formed for the benefit of the security holder or of an immediate family member of the security holder. |
Morgan Stanley & Co. LLC and Goldman, Sachs & Co., in their sole discretion, may release the Class A common stock and other securities subject to the lock-up agreements described above in whole or in part at any time.
In order to facilitate the offering of the Class A common stock, the underwriters may engage in transactions that stabilize, maintain or otherwise affect the price of the Class A common stock. Specifically, the underwriters may sell more shares than they are obligated to purchase under the underwriting agreement, creating a short
208
Table of Contents
position. A short sale is covered if the short position is no greater than the number of shares available for purchase by the underwriters under the option to purchase additional shares. The underwriters can close out a covered short sale by exercising the option to purchase additional shares or purchasing shares in the open market. In determining the source of shares to close out a covered short sale, the underwriters will consider, among other things, the open market price of shares compared to the price available under the option to purchase additional shares. The underwriters may also sell shares in excess of the option to purchase additional shares, creating a naked short position. The underwriters must close out any naked short position by purchasing shares in the open market. A naked short position is more likely to be created if the underwriters are concerned that there may be downward pressure on the price of the Class A common stock in the open market after pricing that could adversely affect investors who purchase in this offering. As an additional means of facilitating this offering, the underwriters may bid for, and purchase, shares of Class A common stock in the open market to stabilize the price of the Class A common stock. These activities may raise or maintain the market price of the Class A common stock above independent market levels or prevent or retard a decline in the market price of the Class A common stock. The underwriters are not required to engage in these activities and may end any of these activities at any time.
We, the selling stockholders and the several underwriters have agreed to indemnify each other against certain liabilities, including liabilities under the Securities Act.
A prospectus in electronic format may be made available on websites maintained by one or more underwriters, or selling group members, if any, participating in this offering. The representative may agree to allocate a number of shares of Class A common stock to underwriters for sale to their online brokerage account holders. Internet distributions will be allocated by the representative to underwriters that may make internet distributions on the same basis as other allocations.
The underwriters and their respective affiliates are full service financial institutions engaged in various activities, which may include securities trading, commercial and investment banking, financial advisory, investment management, investment research, principal investment, hedging, financing and brokerage activities. Certain of the underwriters and their respective affiliates have, from time to time, performed, and may in the future perform, various financial advisory and investment banking services for us, for which they received or will receive customary fees and expenses.
In addition, affiliates of Morgan Stanley & Co. LLC, Wells Fargo Securities, LLC, UBS Securities LLC, Citigroup Global Markets Inc. and BMO Capital Markets Corp. currently provide us, and may provide us in the future, borrowing capacity under loan funding facilities and a mortgage gestation facility. Furthermore, from time to time, Morgan Stanley & Co. LLC, Wells Fargo Securities, LLC, Citigroup Global Markets Inc. and Raymond James & Associates, Inc. or their respective affiliates purchase loans from us in the secondary market.
In addition, in the ordinary course of their various business activities, the underwriters and their respective affiliates may make or hold a broad array of investments and actively trade debt and equity securities (or related derivative securities), currencies, credit default swaps and other financial instruments (including bank loans) for their own account and for the accounts of their customers and may at any time hold long and short positions in such securities and instruments. Such investment and securities activities may involve our securities and instruments. The underwriters and their respective affiliates may also make investment recommendations or publish or express independent research views in respect of such securities or instruments and may at any time hold, or recommend to clients that they acquire, long or short positions in such securities and instruments.
Pursuant to an engagement letter agreement, we retained FTP Securities LLC (“FT Partners”), a FINRA member, to provide certain financial advisory services in connection with this offering. We agreed to pay FT Partners, simultaneously with or prior to the consummation of this offering, a fee equal to 1% of the gross proceeds of this offering. If the proceeds of this offering are less than $200 million, in the event within 36 months of this offering we complete one or more follow-on offerings, we agreed to pay FT Partners a fee of 1% of such
209
Table of Contents
follow-on offering proceeds until the fees for this offering and such follow-on offerings equal $2 million in total. We also agreed to reimburse FT Partners for reasonable and documented travel and other out-of-pocket expenses up to a maximum of $100,000 and have provided indemnification of FT Partners pursuant to the engagement agreement. FT Partners is not acting as an underwriter and has no contact with any public or institutional investor on behalf of us or the underwriters. In addition, FT Partners will not underwrite or purchase any of our common shares in this offering or otherwise participate in any such undertaking.
Pricing of the Offering
Prior to this offering, there has been no public market for our Class A common stock. The initial public offering price was determined by negotiations between us, the selling stockholders and the representatives. Among the factors considered in determining the initial public offering price were our future prospects and those of our industry in general, our sales, earnings and certain other financial and operating information in recent periods, and the price-earnings ratios, price-sales ratios, market prices of securities, and certain financial and operating information of companies engaged in activities similar to ours.
Directed Share Program
At our request, the underwriters have reserved 1,500,000 shares of Class A common stock, or approximately 5% of the shares of Class A common stock offered by this prospectus for sale, at the initial public offering price, to our directors, officers, employees, business associates and related persons. If purchased by these persons, these shares will be subject to a 180-day lock-up restriction. The number of shares of Class A common stock available for sale to the general public will be reduced to the extent these individuals purchase such reserved shares. Any reserved shares that are not so purchased will be offered by the underwriters to the general public on the same basis as the other shares offered by this prospectus.
Selling Restrictions
Canada
The Class A common stock may be sold in Canada only to purchasers purchasing, or deemed to be purchasing, as principal that are accredited investors, as defined in National Instrument 45-106 Prospectus Exemptions or subsection 73.3(1) of the Securities Act (Ontario), and are permitted clients, as defined in National Instrument 31-103 Registration Requirements, Exemptions and Ongoing Registrant Obligations. Any resale of the Class A common stock must be made in accordance with an exemption from, or in a transaction not subject to, the prospectus requirements of applicable securities laws.
Securities legislation in certain provinces or territories of Canada may provide a purchaser with remedies for rescission or damages if this prospectus (including any amendment thereto) contains a misrepresentation, provided that the remedies for rescission or damages are exercised by the purchaser within the time limit prescribed by the securities legislation of the purchaser’s province or territory. The purchaser should refer to any applicable provisions of the securities legislation of the purchaser’s province or territory for particulars of these rights or consult with a legal advisor.
Pursuant to section 3A.3 of National Instrument 33-105 Underwriting Conflicts (NI 33-105), the underwriters are not required to comply with the disclosure requirements of NI 33-105 regarding underwriter conflicts of interest in connection with this offering.
European Economic Area
In relation to each Member State of the European Economic Area which has implemented the Prospectus Directive (each, a “Relevant Member State”) an offer to the public of any shares of our Class A common stock may not be made in that Relevant Member State, except that an offer to the public in that Relevant Member State
210
Table of Contents
of any shares of our Class A common stock may be made at any time under the following exemptions under the Prospectus Directive, if they have been implemented in that Relevant Member State:
| (a) | to any legal entity which is a qualified investor as defined in the Prospectus Directive; |
| (b) | to fewer than 100 or, if the Relevant Member State has implemented the relevant provision of the 2010 PD Amending Directive, 150, natural or legal persons (other than qualified investors as defined in the Prospectus Directive), as permitted under the Prospectus Directive, subject to obtaining the prior consent of the representatives for any such offer; or |
| (c) | in any other circumstances falling within Article 3(2) of the Prospectus Directive, provided that no such offer of shares of our Class A common stock shall result in a requirement for the publication by us or any underwriter of a prospectus pursuant to Article 3 of the Prospectus Directive. |
For the purposes of this provision, the expression an “offer to the public” in relation to any shares of our Class A common stock in any Relevant Member State means the communication in any form and by any means of sufficient information on the terms of the offer and any shares of our Class A common stock to be offered so as to enable an investor to decide to purchase any shares of our Class A common stock, as the same may be varied in that Member State by any measure implementing the Prospectus Directive in that Member State, the expression “Prospectus Directive” means Directive 2003/71/EC (and amendments thereto, including the 2010 PD Amending Directive, to the extent implemented in the Relevant Member State), and includes any relevant implementing measure in the Relevant Member State, and the expression “2010 PD Amending Directive” means Directive 2010/73/EU.
United Kingdom
Each underwriter has represented and agreed that:
| (a) | it has only communicated or caused to be communicated and will only communicate or cause to be communicated an invitation or inducement to engage in investment activity (within the meaning of Section 21 of the Financial Services and Markets Act 2000 (“FSMA”) received by it in connection with the issue or sale of the shares of our Class A common stock in circumstances in which Section 21(1) of the FSMA does not apply to us; and |
| (b) | it has complied and will comply with all applicable provisions of the FSMA with respect to anything done by it in relation to the shares of our Class A common stock in, from or otherwise involving the United Kingdom. |
Japan
No registration pursuant to Article 4, paragraph 1 of the Financial Instruments and Exchange Law of Japan (Law No. 25 of 1948, as amended) (the “FIEL”) has been made or will be made with respect to the solicitation of the application for the acquisition of the shares of Class A common stock.
Accordingly, the shares of Class A common stock have not been, directly or indirectly, offered or sold and will not be, directly or indirectly, offered or sold in Japan or to, or for the benefit of, any resident of Japan (which term as used herein means any person resident in Japan, including any corporation or other entity organized under the laws of Japan) or to others for re-offering or re-sale, directly or indirectly, in Japan or to, or for the benefit of, any resident of Japan except pursuant to an exemption from the registration requirements, and otherwise in compliance with, the FIEL and the other applicable laws and regulations of Japan.
For Qualified Institutional Investors (“QII”)
Please note that the solicitation for newly-issued or secondary securities (each as described in Paragraph 2, Article 4 of the FIEL) in relation to the shares of Class A common stock constitutes either a “QII only private
211
Table of Contents
placement” or a “QII only secondary distribution” (each as described in Paragraph 1, Article 23-13 of the FIEL). Disclosure regarding any such solicitation, as is otherwise prescribed in Paragraph 1, Article 4 of the FIEL, has not been made in relation to the shares of Class A common stock. The shares of Class A common stock may only be transferred to QIIs.
For Non-QII Investors
Please note that the solicitation for newly-issued or secondary securities (each as described in Paragraph 2, Article 4 of the FIEL) in relation to the shares of Class A common stock constitutes either a “small number private placement” or a “small number private secondary distribution” (each as is described in Paragraph 4, Article 23-13 of the FIEL). Disclosure regarding any such solicitation, as is otherwise prescribed in Paragraph 1, Article 4 of the FIEL, has not been made in relation to the shares of Class A common stock. The shares of common stock may only be transferred en bloc without subdivision to a single investor.
Switzerland
The shares may not be publicly offered in Switzerland and will not be listed on the SIX Swiss Exchange (“SIX”) or on any other stock exchange or regulated trading facility in Switzerland. This document has been prepared without regard to the disclosure standards for issuance prospectuses under art. 652a or art. 1156 of the Swiss Code of Obligations or the disclosure standards for listing prospectuses under art. 27 ff. of the SIX Listing Rules or the listing rules of any other stock exchange or regulated trading facility in Switzerland. Neither this document nor any other offering or marketing material relating to the shares or the offering may be publicly distributed or otherwise made publicly available in Switzerland.
Neither this document nor any other offering or marketing material relating to the offering, the Company, the shares have been or will be filed with or approved by any Swiss regulatory authority. In particular, this document will not be filed with, and the offer of shares will not be supervised by, the Swiss Financial Market Supervisory Authority FINMA, and the offer of shares has not been and will not be authorized under the Swiss Federal Act on Collective Investment Schemes (“CISA”). The investor protection afforded to acquirers of interests in collective investment schemes under the CISA does not extend to acquirers of shares.
Dubai International Financial Centre
This prospectus relates to an Exempt Offer in accordance with the Offered Securities Rules of the Dubai Financial Services Authority (“DFSA”). This prospectus is intended for distribution only to persons of a type specified in the Offered Securities Rules of the DFSA. It must not be delivered to, or relied on by, any other person. The DFSA has no responsibility for reviewing or verifying any documents in connection with Exempt Offers. The DFSA has not approved this prospectus nor taken steps to verify the information set forth herein and has no responsibility for the prospectus. The shares to which this prospectus relates may be illiquid and/or subject to restrictions on their resale. Prospective purchasers of the shares offered should conduct their own due diligence on the shares. If you do not understand the contents of this prospectus you should consult an authorized financial advisor.
Australia
No placement document, prospectus, product disclosure statement or other disclosure document has been lodged with the Australian Securities and Investments Commission (“ASIC”), in relation to the offering. This prospectus does not constitute a prospectus, product disclosure statement or other disclosure document under the Corporations Act 2001 (the “Corporations Act”), and does not purport to include the information required for a prospectus, product disclosure statement or other disclosure document under the Corporations Act.
Any offer in Australia of the shares may only be made to persons (the “Exempt Investors”) who are “sophisticated investors” (within the meaning of section 708(8) of the Corporations Act), “professional
212
Table of Contents
investors” (within the meaning of section 708(11) of the Corporations Act) or otherwise pursuant to one or more exemptions contained in section 708 of the Corporations Act so that it is lawful to offer the shares without disclosure to investors under Chapter 6D of the Corporations Act.
The shares applied for by Exempt Investors in Australia must not be offered for sale in Australia in the period of 12 months after the date of allotment under the offering, except in circumstances where disclosure to investors under Chapter 6D of the Corporations Act would not be required pursuant to an exemption under section 708 of the Corporations Act or otherwise or where the offer is pursuant to a disclosure document which complies with Chapter 6D of the Corporations Act. Any person acquiring shares must observe such Australian on-sale restrictions.
This prospectus contains general information only and does not take account of the investment objectives, financial situation or particular needs of any particular person. It does not contain any securities recommendations or financial product advice. Before making an investment decision, investors need to consider whether the information in this prospectus is appropriate to their needs, objectives and circumstances, and, if necessary, seek expert advice on those matters.
Hong Kong
The shares have not been offered or sold and will not be offered or sold in Hong Kong, by means of any document, other than (a) to “professional investors” as defined in the Securities and Futures Ordinance (Cap. 571) of Hong Kong and any rules made under that Ordinance; or (b) in other circumstances which do not result in the document being a “prospectus” as defined in the Companies Ordinance (Cap. 32) of Hong Kong or which do not constitute an offer to the public within the meaning of that Ordinance. No advertisement, invitation or document relating to the shares has been or may be issued or has been or may be in the possession of any person for the purposes of issue, whether in Hong Kong or elsewhere, which is directed at, or the contents of which are likely to be accessed or read by, the public of Hong Kong (except if permitted to do so under the securities laws of Hong Kong) other than with respect to shares which are or are intended to be disposed of only to persons outside Hong Kong or only to “professional investors” as defined in the Securities and Futures Ordinance and any rules made under that Ordinance.
Singapore
This prospectus has not been registered as a prospectus with the Monetary Authority of Singapore. Accordingly, this prospectus and any other document or material in connection with the offer or sale, or invitation for subscription or purchase, of shares may not be circulated or distributed, nor may the shares be offered or sold, or be made the subject of an invitation for subscription or purchase, whether directly or indirectly, to persons in Singapore other than (i) to an institutional investor under Section 274 of the Securities and Futures Act, Chapter 289 of Singapore (the “SFA”), (ii) to a relevant person pursuant to Section 275(1), or any person pursuant to Section 275(1A), and in accordance with the conditions specified in Section 275, of the SFA, or (iii) otherwise pursuant to, and in accordance with the conditions of, any other applicable provision of the SFA.
Where the shares are subscribed or purchased under Section 275 of the SFA by a relevant person which is:
| (a) | a corporation (which is not an accredited investor (as defined in Section 4A of the SFA)) the sole business of which is to hold investments and the entire share capital of which is owned by one or more individuals, each of whom is an accredited investor; or |
| (b) | a trust (where the trustee is not an accredited investor) whose sole purpose is to hold investments and each beneficiary of the trust is an individual who is an accredited investor, |
213
Table of Contents
securities (as defined in Section 239(1) of the SFA) of that corporation or the beneficiaries’ rights and interest (howsoever described) in that trust shall not be transferred within six months after that corporation or that trust has acquired the shares pursuant to an offer made under Section 275 of the SFA except:
| (a) | to an institutional investor or to a relevant person defined in Section 275(2) of the SFA, or to any person arising from an offer referred to in Section 275(1A) or Section 276(4)(i)(B) of the SFA; |
| (b) | where no consideration is or will be given for the transfer; |
| (c) | where the transfer is by operation of law; |
| (d) | as specified in Section 276(7) of the SFA; or |
| (e) | as specified in Regulation 32 of the Securities and Futures (Offers of Investments) (Shares and Debentures) Regulations 2005 of Singapore. |
214
Table of Contents
Certain legal matters in connection with the offering, including the validity of the shares of Class A common stock offered hereby, will be passed upon for us by Kirkland & Ellis LLP, New York, New York. Certain legal matters in connection with the offering will be passed upon for us by Sheppard, Mullin, Richter & Hampton LLP, San Diego, California. The underwriters are represented by Davis Polk & Wardwell LLP, New York, New York.
The balance sheet of loanDepot, Inc. as of August 28, 2015, included in this prospectus has been audited by Ernst & Young LLP, an independent registered public accounting firm, as stated in their report appearing herein. Such financial statement has been so included in reliance upon the report of such firm given upon their authority as experts in accounting and auditing.
The consolidated financial statements of loanDepot.com, LLC and subsidiary, as of and for the six months ended June 30, 2015, included in this prospectus have been audited by Ernst & Young LLP, an independent registered public accounting firm, as stated in their report appearing herein, which report expresses an unqualified opinion on the consolidated financial statements. Such consolidated financial statements have been so included in reliance upon the report of such firm given upon their authority as experts in accounting and auditing.
The consolidated financial statements of loanDepot.com, LLC and subsidiary, as of and for the years ended December 31, 2014 and 2013, included in this prospectus have been audited by Grant Thornton LLP, independent certified public accountants, as stated in their report appearing herein, which report expresses an unqualified opinion on the consolidated financial statements. Such consolidated financial statements have been so included in reliance upon the report of such firm given upon their authority as experts in accounting and auditing.
The financial statements of Mortgage Master, Inc., as of and for the years ended December 31, 2014 and 2013, included in this prospectus have been audited by Wolf & Company, P.C., independent auditors, as stated in their report appearing herein, which report expresses an unmodified opinion on the financial statements. Such financial statements have been so included in reliance upon the report of such firm given upon their authority as experts in accounting and auditing.
The financial statements of imortgage.com, Inc., as of and for the nine months ended September 30, 2013 and the year ended December 31, 2012, included in this prospectus have been audited by Grant Thornton LLP, independent certified public accountants, as stated in their report appearing herein, which report expresses an unqualified opinion on the financial statements. Such financial statements have been so included in reliance upon the report of such firm given upon their authority as experts in accounting and auditing.
On June 25, 2015, we engaged Ernst & Young LLP (“E&Y”) as our independent registered public accounting firm for the six-month period ended June 30, 2015 and the year ending December 31, 2015. As a result of the engagement of E&Y, we dismissed Grant Thornton LLP (“GT”) as our independent registered public accounting firm which was approved by our audit committee.
During the years ended December 31, 2014 and 2013, GT’s reports on our consolidated financial statements did not contain an adverse opinion or disclaimer of opinion, and were not qualified or modified as to uncertainty, audit scope or accounting principles.
215
Table of Contents
During the years ended December 31, 2014 and 2013 and the subsequent interim period through June 25, 2015, (i) there were no disagreements between us and GT regarding any matter of accounting principles or practices, financial statement disclosure or auditing scope or procedure, which, if not resolved to the satisfaction of GT would have caused GT to make reference to the subject matter of the disagreement with its reports on our financial statements, and (ii) there were no reportable events as described in paragraph (a)(1)(v) of Item 304 of Regulation S-K.
During the years ended December 31, 2014 and 2013 and the subsequent interim period through June 25, 2015, we did not consult with E&Y regarding either (i) application of accounting principles to a specified transaction, either completed or proposed, or the type of audit opinion that might be rendered on our financial statements, or (ii) any matter that was either the subject of a disagreement (as defined in paragraph (a)(1)(iv) of Item 304 of Regulation S-K and the related instructions thereto) or a “reportable event” (as defined in paragraph (a)(1)(v) of Item 304 of Regulation S-K).
WHERE YOU CAN FIND MORE INFORMATION
We have filed with the SEC a registration statement on Form S-1 under the Securities Act with respect to the shares of Class A common stock offered hereby. This prospectus, which constitutes a part of the registration statement, does not contain all of the information set forth in the registration statement or the exhibits and schedules filed therewith. For further information about us and our Class A common stock offered hereby, we refer you to the registration statement and the exhibits and schedules filed thereto. Statements contained in this prospectus regarding the contents of any contract or any other document that is filed as an exhibit to the registration statement are not necessarily complete, and each such statement is qualified in all respects by reference to the full text of such contract or other document filed as an exhibit to the registration statement. Upon completion of the offering, we will be required to file periodic reports, proxy statements and other information with the SEC pursuant to the Exchange Act. You may read and copy this information at the Public Reference Room of the SEC, 100 F Street, N.E., Room 1580, Washington, D.C. 20549. You may obtain information on the operation of the public reference rooms by calling the SEC at 1-800-SEC-0330. The SEC also maintains an internet website that contains reports, proxy statements and other information about issuers, like us, that file electronically with the SEC. The address of that site is www.sec.gov.
216
Table of Contents
F-1
Table of Contents
Report of Independent Registered Public Accounting Firm
The Board of Directors and Shareholder of
loanDepot, Inc.
We have audited the accompanying balance sheet of loanDepot, Inc. as of August 28, 2015. This financial statement is the responsibility of the Company’s management. Our responsibility is to express an opinion on this financial statement based on our audit.
We conducted our audit in accordance with the standards of the Public Company Accounting Oversight Board (United States). Those standards require that we plan and perform the audit to obtain reasonable assurance about whether the financial statement is free of material misstatement. We were not engaged to perform an audit of the Company’s internal control over financial reporting. Our audit included consideration of internal control over financial reporting as a basis for designing audit procedures that are appropriate in the circumstances, but not for the purpose of expressing an opinion on the effectiveness of the Company’s internal control over financial reporting. Accordingly, we express no such opinion. An audit also includes examining, on a test basis, evidence supporting the amounts and disclosures in the financial statement, assessing the accounting principles used and significant estimates made by management, and evaluating the overall financial statement presentation. We believe that our audit provides a reasonable basis for our opinion.
In our opinion, the financial statement referred to above presents fairly, in all material respects, the consolidated financial position of loanDepot, Inc. at August 28, 2015, in conformity with U.S. generally accepted accounting principles.
/s/ Ernst & Young LLP
Los Angeles, California
August 31, 2015
F-2
Table of Contents
BALANCE SHEET
| August 28, 2015 |
||||
| Assets |
||||
| Current assets: |
||||
| Cash and cash equivalents |
$ | 1 | ||
|
|
|
|||
| Total assets |
$ | 1 | ||
|
|
|
|||
| Commitments and contingencies |
||||
| Stockholder’s equity |
||||
| Stockholder’s equity: |
||||
| Common stock, 0.001 par value, 1,000 shares authorized, issued and outstanding |
$ | 1 | ||
|
|
|
|||
| Total stockholder’s equity |
$ | 1 | ||
|
|
|
|||
See accompanying notes to balance sheet.
F-3
Table of Contents
NOTES TO BALANCE SHEET
| 1. | Organization and Background |
loanDepot, Inc. (“we” or “our”) was incorporated in Delaware on July 10, 2015. Pursuant to a reorganization into a holding company structure, we will be a holding company and our principal asset will be a controlling equity interest in loanDepot Holdings, LLC (“LD Holdings”), which will hold all of the equity interest in loanDepot.com, LLC (“LDLLC”). Through our ability to appoint the board of managers of LD Holdings, we will operate and control all of the business and affairs of LD Holdings, and through LD Holdings and its subsidiaries, conduct our business.
Basis of Presentation
The balance sheet has been prepared in accordance with U.S. generally accepted accounting principles. Statements of income, stockholders’ equity and cash flows have not been presented because we have not engaged in any business or other activities except in connection with our formation.
| 2. | Summary of Significant Accounting Policies |
Cash and Cash Equivalents
Cash and cash equivalents includes cash on hand and other highly liquid investments purchased with a remaining maturity of 90 days or less at the date of acquisition. Cash and cash equivalents are carried at fair value, which approximates carrying value.
Income Taxes
We are treated as a subchapter C corporation, and therefore, are subject to both federal and state income taxes. LDLLC continues to be recognized as a limited liability company, a pass-through entity for income tax purposes.
| 3. | Stockholders’ Equity |
On July 31, 2015, we were authorized to issue 1,000 shares of common stock, $0.001 par value. On July 31, 2015, we issued 1,000 shares for $1.00, all of which are owned by LDLLC.
| 4. | Subsequent Events |
We have evaluated subsequent events through August 28, 2015, the date on which our audited balance sheet was available to be issued.
F-4
Table of Contents
Report of Independent Registered Public Accounting Firm
The Board of Directors and Unitholders of
loanDepot.com, LLC
We have audited the accompanying consolidated balance sheet of loanDepot.com, LLC and subsidiary as of June 30, 2015, and the related consolidated statements of operations, unitholders’ equity and cash flows for the six-month period ended June 30, 2015. These financial statements are the responsibility of the Company’s management. Our responsibility is to express an opinion on these financial statements based on our audit.
We conducted our audit in accordance with the standards of the Public Company Accounting Oversight Board (United States). Those standards require that we plan and perform the audit to obtain reasonable assurance about whether the financial statements are free of material misstatement. We were not engaged to perform an audit of the Company’s internal control over financial reporting. Our audit included consideration of internal control over financial reporting as a basis for designing audit procedures that are appropriate in the circumstances, but not for the purpose of expressing an opinion on the effectiveness of the Company’s internal control over financial reporting. Accordingly, we express no such opinion. An audit also includes examining, on a test basis, evidence supporting the amounts and disclosures in the financial statements, assessing the accounting principles used and significant estimates made by management, and evaluating the overall financial statement presentation. We believe that our audit provides a reasonable basis for our opinion.
In our opinion, the financial statements referred to above present fairly, in all material respects, the consolidated financial position of loanDepot.com, LLC and subsidiary at June 30, 2015, and the consolidated results of their operations and their cash flows for the six-month period ended June 30, 2015, in conformity with U.S. generally accepted accounting principles.
/s/ Ernst & Young LLP
Los Angeles, California
August 31, 2015
F-5
Table of Contents
loanDepot.com, LLC and Subsidiary
CONSOLIDATED BALANCE SHEET
($ in thousands)
| June 30, 2015 | ||||
| ASSETS |
||||
| Cash and cash equivalents |
$ | 53,350 | ||
| Restricted cash |
3,227 | |||
| Accounts receivable, net |
39,420 | |||
| Loans held for sale, at fair value |
1,504,603 | |||
| Derivative assets, at fair value |
87,443 | |||
| Servicing rights, at fair value |
194,093 | |||
| Property and equipment, net |
50,056 | |||
| Prepaid expenses and other assets |
15,035 | |||
| Loans eligible for repurchase |
71,608 | |||
| Investments in joint ventures |
16,687 | |||
| Goodwill |
35,422 | |||
| Intangible assets, net |
5,432 | |||
|
|
|
|||
| Total assets |
$ | 2,076,376 | ||
|
|
|
|||
| LIABILITIES, REDEEMABLE UNITS AND UNITHOLDERS’ EQUITY |
||||
| Warehouse lines of credit |
$ | 1,410,794 | ||
| Accounts payable and accrued expenses |
130,558 | |||
| Contingent consideration |
28,100 | |||
| Derivative liabilities, at fair value |
2,020 | |||
| Liability for loans eligible for repurchase |
71,608 | |||
| Capital lease obligations |
14,388 | |||
| Debt obligations |
128,754 | |||
|
|
|
|||
| Total liabilities |
1,786,222 | |||
| Commitments and contingencies (Note 22) |
||||
| Redeemable units: |
||||
| Class I Units (par value $18.7 million; 1,190,093 units authorized and issued/outstanding) |
27,275 | |||
| Class A Units (par value $26.9 million; 269,000 units authorized and issued/outstanding) |
26,900 | |||
| Class B Units (par value $5.0 million; 50,000 units authorized and issued/outstanding) |
5,000 | |||
| Class P Units (par value $12.5 million; 12,500 units authorized and issued/outstanding) |
12,500 | |||
| Class P-2 Units (par value $20.0 million; 20,000 units authorized and issued/outstanding) |
20,000 | |||
| Class Z-1 Units (no par value; 48,882 units authorized and 44,502 units issued/outstanding) |
— | |||
|
|
|
|||
| Total redeemable units |
91,675 | |||
| Unitholders’ equity: |
||||
| Class Z-2 Units (no par value; 92,333 units authorized and 83,189 units issued/outstanding) |
— | |||
| Class Z-3 Units (no par value; 149,154 units authorized and 133,789 units issued/outstanding) |
— | |||
| Class Z-4 Units (no par value; 277,000 units authorized and 268,239 units issued/outstanding) |
— | |||
| Class Y Units (no par value; 41,391 units authorized and 14,567 units issued/outstanding) |
— | |||
| Class W Units (no par value; 10,000 units authorized and issued/outstanding) |
— | |||
| Class X Units (no par value; 3,023,062,840 units authorized and issued/outstanding) |
— | |||
| Additional paid-in capital |
11,259 | |||
| Retained earnings |
187,220 | |||
|
|
|
|||
| Total unitholders’ equity |
198,479 | |||
|
|
|
|||
| Total liabilities, redeemable units and unitholders’ equity |
$ | 2,076,376 | ||
|
|
|
|||
See accompanying notes to the consolidated financial statements.
F-6
Table of Contents
loanDepot.com, LLC and Subsidiary
CONSOLIDATED STATEMENT OF OPERATIONS
($ in thousands)
| For the six months ended June 30, 2015 |
||||
| REVENUES: |
||||
| Interest income |
$ | 30,815 | ||
| Interest expense |
(20,651 | ) | ||
|
|
|
|||
| Net interest income |
10,164 | |||
| Gain on origination and sale of loans, net |
425,438 | |||
| Origination income, net |
41,649 | |||
| Servicing income |
20,195 | |||
| Servicing losses |
(19,284 | ) | ||
| Other income |
11,471 | |||
|
|
|
|||
| Total net revenues |
489,633 | |||
| EXPENSES: |
||||
| Personnel expense |
273,182 | |||
| Marketing and advertising expense |
54,369 | |||
| Direct origination expense |
28,594 | |||
| General and administrative expense |
33,618 | |||
| Occupancy expense |
11,118 | |||
| Depreciation and amortization |
8,593 | |||
| Subservicing expense |
5,651 | |||
| Other interest expense |
5,124 | |||
|
|
|
|||
| Total expenses |
420,249 | |||
|
|
|
|||
| Income before income taxes |
69,384 | |||
| Provision for income taxes |
216 | |||
|
|
|
|||
| Net income |
$ | 69,168 | ||
|
|
|
|||
See accompanying notes to the consolidated financial statements.
F-7
Table of Contents
loanDepot.com, LLC and Subsidiary
CONSOLIDATED STATEMENT OF UNITHOLDERS’ EQUITY
($ in thousands)
| Class Z-2 | Class Z-3 | Class Z-4 | Class Y | Class W | Class X | Additional paid-in capital |
Retained Earnings |
Total | ||||||||||||||||||||||||||||||||||||||||||||||||||||
| Shares | Amount | Shares | Amount | Shares | Amount | Shares | Amount | Shares | Amount | Shares | Amount | |||||||||||||||||||||||||||||||||||||||||||||||||
| Balance at 12/31/14 |
84,113 | $ | — | 135,280 | $ | — | 269,624 | $ | — | 15,439 | $ | — | 10,000 | $ | — | 16,184 | $ | — | $ | 1,821 | $ | 118,147 | $ | 119,968 | ||||||||||||||||||||||||||||||||||||
| Issuances |
— | — | — | — | — | — | — | — | — | — | 3,026,230,573 | — | — | — | — | |||||||||||||||||||||||||||||||||||||||||||||
| Repurchase |
(739 | ) | — | (1,193 | ) | — | (1,108 | ) | — | — | — | — | — | — | — | — | (95 | ) | (95 | ) | ||||||||||||||||||||||||||||||||||||||||
| Forfeitures |
(185 | ) | — | (298 | ) | — | (277 | ) | — | (872 | ) | — | — | — | (3,183,917 | ) | — | — | — | — | ||||||||||||||||||||||||||||||||||||||||
| Equity-based compensation |
— | — | — | — | — | — | — | — | — | — | — | — | 9,438 | — | 9,438 | |||||||||||||||||||||||||||||||||||||||||||||
| Net income |
— | — | — | — | — | — | — | — | — | — | — | — | 69,168 | 69,168 | ||||||||||||||||||||||||||||||||||||||||||||||
|
|
|
|
|
|
|
|
|
|
|
|
|
|
|
|
|
|
|
|
|
|
|
|
|
|
|
|
|
|
|
|||||||||||||||||||||||||||||||
| Balance at 6/30/15 |
83,189 | $ | — | 133,789 | $ | — | 268,239 | $ | — | 14,567 | $ | — | 10,000 | $ | — | 3,023,062,840 | $ | — | $ | 11,259 | $ | 187,220 | $ | 198,479 | ||||||||||||||||||||||||||||||||||||
|
|
|
|
|
|
|
|
|
|
|
|
|
|
|
|
|
|
|
|
|
|
|
|
|
|
|
|
|
|
|
|||||||||||||||||||||||||||||||
See accompanying notes to the consolidated financial statements.
F-8
Table of Contents
loanDepot.com, LLC and Subsidiary
CONSOLIDATED STATEMENT OF CASH FLOWS
($ in thousands)
| For the six months ended June 30, 2015 |
||||
| CASH FLOWS FROM OPERATING ACTIVITIES |
||||
| Net income from operations |
$ | 69,168 | ||
| Adjustments to reconcile net income from operations to net cash used in operating activities: |
||||
| Depreciation and amortization expense |
8,593 | |||
| Gain on origination and sale of mortgage loans |
(403,290 | ) | ||
| Loss on sale of mortgage servicing rights |
3,702 | |||
| Provision for loan loss obligation on sold loans |
4,719 | |||
| Fair value change in derivative assets |
(26,537 | ) | ||
| Fair value change in derivative liabilities |
(5,570 | ) | ||
| Premium paid on derivatives |
(3,303 | ) | ||
| Fair value change in loans held for sale |
5,240 | |||
| Fair value change in servicing rights |
15,583 | |||
| Equity compensation |
11,888 | |||
| Change in contingent consideration |
1,229 | |||
| Originations of mortgage loans |
(14,302,664 | ) | ||
| Proceeds from sales of mortgage loans |
14,043,541 | |||
| Proceeds from principal payments on mortgage loans |
8,731 | |||
| Payments to investors for loan losses |
(566 | ) | ||
| Change in restricted cash |
5,872 | |||
| Other changes in operating assets and liabilities |
3,892 | |||
|
|
|
|||
| Net cash used in operating activities |
(559,772 | ) | ||
|
|
|
|||
| CASH FLOWS FROM INVESTING ACTIVITIES |
||||
| Purchase of property and equipment |
(12,085 | ) | ||
| Proceeds from sale of mortgage servicing rights |
73,519 | |||
| Purchase of mortgage servicing rights |
(25 | ) | ||
| Disbursements from joint ventures |
3,445 | |||
| Cash received net of cash paid for acquisition of Mortgage Master, net |
4,875 | |||
|
|
|
|||
| Net cash flows provided by investing activities |
69,729 | |||
|
|
|
|||
See accompanying notes to the consolidated financial statements.
F-9
Table of Contents
loanDepot.com, LLC and Subsidiary
CONSOLIDATED STATEMENT OF CASH FLOWS—CONTINUED
($ in thousands)
| For the six months ended June 30, 2015 |
||||
| CASH FLOWS FROM FINANCING ACTIVITIES |
||||
| Proceeds from borrowings on warehouse lines of credit |
$ | 14,251,632 | ||
| Repayment of borrowings on warehouse lines of credit |
(13,779,455 | ) | ||
| Proceeds from debt obligations |
54,240 | |||
| Payments on debt obligations |
(28,486 | ) | ||
| Payments on capital lease obligation |
(3,079 | ) | ||
| Contributed capital from members |
20,000 | |||
| Payments on repurchase of units |
(96 | ) | ||
|
|
|
|||
| Net cash provided by financing activities |
514,756 | |||
|
|
|
|||
| Net change in cash and cash equivalents |
24,713 | |||
|
|
|
|||
| Cash and cash equivalents at beginning of the period |
28,637 | |||
|
|
|
|||
| Cash and cash equivalents at end of the period |
$ | 53,350 | ||
|
|
|
|||
| SUPPLEMENTAL DISCLOSURES OF CASH FLOW INFORMATION |
||||
| Cash paid during the period for: |
||||
| Interest |
$ | 25,880 | ||
| Income taxes |
216 | |||
| SUPPLEMENTAL DISCLOSURES OF NONCASH INVESTING AND FINANCING ACTIVITIES |
||||
| Purchase of equipment under capital leases |
$ | 6,297 | ||
| Acquisition of Mortgage Master |
||||
| Fair value of assets acquired |
$ | 18,081 | ||
| Less: Fair value of liabilities assumed |
(218 | ) | ||
|
|
|
|||
| Net assets acquired |
$ | 17,863 | ||
|
|
|
|||
See accompanying notes to the consolidated financial statements.
F-10
Table of Contents
loanDepot.com, LLC and Subsidiary
NOTES TO CONSOLIDATED FINANCIAL STATEMENTS
($ in thousands, unless otherwise indicated)
NOTE 1—ORGANIZATION AND BASIS OF PRESENTATION
Organization
loanDepot.com, LLC (“loanDepot” or the “Company”), was formed as a California corporation on April 1, 2009. Pursuant to reorganization through merger, the Company became a limited liability company shortly thereafter. The Company operates under the loanDepot.com, LLC Fifth Amended and Restated Limited Liability Company Agreement (the “LLC Agreement”).
loanDepot.com engages in the originating, financing and selling of mortgage loans secured by residential real estate and derives income primarily from fees charged for services related to the origination of mortgage loans, gains from the subsequent sale of the loans to investors, and income from loan servicing.
Basis of Presentation
The Company’s consolidated financial statements have been prepared in conformity with accounting principles generally accepted in the United States of America (“GAAP”) as codified in the Financial Accounting Standards Board’s (“FASB”) Accounting Standards Codification (the “Codification”). All intercompany accounts and transactions have been eliminated in consolidation.
Management has made a number of estimates and assumptions relating to the reporting of assets and liabilities, the disclosure of contingent assets and liabilities at the date of the financial statements and the reported amounts of revenues and expenses during the reporting period to prepare these consolidated financial statements in conformity with GAAP. Actual results will likely differ from those estimates.
NOTE 2—SUMMARY OF SIGNIFICANT ACCOUNTING POLICIES
A description of the Company’s significant accounting policies applied in the preparation of the accompanying consolidated financial statements follows.
Principles of Consolidation
The consolidated financial statements include the accounts of loanDepot and its wholly-owned subsidiary (LD Escrow, Inc.). Entities in which the Company does not have a controlling financial interest, including variable interest entities (“VIEs”) where the Company has determined that it is not the primary beneficiary, are not consolidated. Intercompany accounts and transactions have been eliminated.
Equity Method of Accounting
Joint ventures that are not consolidated, but over which the Company exercises significant influence, are accounted for under the equity method of accounting. Whether or not the Company exercises significant influence with respect to a joint venture depends on an evaluation of several factors including ownership level which is generally a 20% to 50% ownership interest in the joint venture. Under the equity method of accounting, the joint venture’s accounts are not reflected within the Company’s consolidated balance sheet and statement of operations. However, the Company’s share of the earnings or losses of the joint venture is reflected in other income. The Company’s carrying values in equity method joint ventures are reflected in Investments in joint ventures. The joint ventures pay dividends to the Company on a regular basis which reduces the Company’s investment in joint ventures.
F-11
Table of Contents
When the Company’s carrying value in an equity method joint venture is reduced to zero, no further losses are recorded in the Company’s consolidated financial statements unless the Company guaranteed obligations of the joint venture or has committed additional funding. When the joint venture subsequently reports income, the Company will not record its share of such income until it equals the amount of its share of losses not previously recognized.
Use of Estimates
The preparation of financial statements in conformity with GAAP requires management to make estimates and assumptions that affect the reported amounts of assets and liabilities and disclosure of contingent assets and liabilities at the date of the financial statements and the reported amounts of income and expenses during the reporting period. Management has made significant estimates in certain areas, including determining the fair value of loans held for sale, servicing rights, derivative assets and derivative liabilities, awards granted under the incentive equity plan and determining the loan loss obligation on sold loans. Actual results could differ from those estimates.
Reportable Segments
The Company’s organizational structure is currently comprised of one operating segment. This determination is based on our organizational structure, which reflects how the chief operating decision maker evaluates the performance of the business. The Company’s chief operating decision maker evaluates the performance of the Mortgage Banking segment based on the measurement of income before income taxes.
Cash and Cash Equivalents
All highly liquid investments with an original maturity of three months or less are considered to be cash equivalents. As of June 30, 2015, all amounts recorded in cash and cash equivalents represent cash held in banks, with the exception of insignificant amounts of petty cash held on hand.
Restricted Cash
Cash balances that have restrictions as to the Company’s ability to withdraw funds are considered restricted cash. Restricted cash is the result of the terms of the Company’s warehouse lines of credit and debt obligations. In accordance with the terms of the warehouse lines of credit and debt obligations, the Company is required to maintain cash balances with the lender as additional collateral for the borrowings.
Fair Value
Assets and liabilities measured at fair value are categorized based on whether the inputs are observable in the market and the degree that the inputs are observable. The categorization of assets and liabilities measured at fair value within the valuation hierarchy is based on the lowest level of input that is significant to the fair value measurement. The hierarchy is prioritized into three levels (with Level 3 being the lowest) defined as follows:
| • | Level 1—Quoted prices in active markets for identical assets or liabilities that the Company has the ability to access. |
| • | Level 2—Prices determined or determinable using other significant observable inputs. Observable inputs are inputs that other market participants would use in pricing an asset or liability and are developed based on market data obtained from sources independent of the Company. These may include quoted prices for similar assets and liabilities, interest rates, prepayment speeds, credit risk and other inputs. |
| • | Level 3—Prices determined using significant unobservable inputs. In situations where quoted prices or observable inputs are unavailable (for example, when there is little or no market activity), unobservable |
F-12
Table of Contents
| inputs may be used. Unobservable inputs reflect the Company’s own assumptions about the factors that market participants would use in pricing the asset or liability, and are based on the best information available in the circumstances. |
The fair value option provides an option to elect fair value as an alternative measurement for selected financial assets, financial liabilities, unrecognized firm commitments, and written loan commitments not previously carried at fair value. The Company has elected the fair value option on loans held for sale and servicing rights. Elections were made to mitigate income statement volatility caused by differences in the measurement basis of elected instruments with derivative financial instruments that are carried at fair value.
Loans Held for Sale, at Fair Value
Management has elected to account for loans held for sale (“LHFS”) at fair value, with changes in fair value recognized in current period income, to more timely reflect the Company’s performance. All changes in fair value, including changes arising from the passage of time, are recognized as a component of gain on origination and sale of loans, net. The Company classifies LHFS as “Level 2” fair value financial statement items.
Sale Recognition
The Company recognizes transfers of loans held for sale as sales when it surrenders control over the loans. Control over transferred assets is deemed to be surrendered when (i) the assets have been isolated from the Company, (ii) the transferee has the right (free of conditions that constrain it from taking advantage of that right) to pledge or exchange the transferred assets, and (iii) the Company does not maintain effective control over the transferred assets through either (a) an agreement that entitles and obligates the Company to repurchase or redeem them before their maturity or (b) the ability to unilaterally cause the holder to return specific assets.
Interest Income Recognition
Interest income on loans held for sale at fair value is recognized over the life of the loans using their contractual interest rates. Interest income recognition is suspended for loans when they become 90 days delinquent, or when, in management’s opinion, a full recovery of interest and principal becomes doubtful. Interest income recognition is resumed when the loan becomes contractually current. When loans are placed on non-accrual status, all interest previously accrued but not collected is reversed against current period interest income. Interest income on non-accrual loans is subsequently recognized only to the extent cash is received.
Origination Income, net Recognition
Origination income, net, reflects the fees earned, net of lender credits paid from originating loans. Origination income includes loan origination fees, processing fees, underwriting fees and other fees collected from the borrower at the time of funding, as well as the platform licensing fee income received from personal loan products. Lender credits typically include rebates or concessions to borrowers for certain loan origination costs.
Derivative Financial Instruments
The Company is exposed to price risk related to its loans held for sale as well as to the commitments it makes to loan applicants to originate loans or to third parties to acquire loans at specified interest rates (“interest rate lock commitments” or “IRLCs”). IRLCs are included in derivative assets, at fair value on the consolidated balance sheet. IRLCs are accounted for as derivative financial instruments. The Company bears price risk from the time a commitment to originate a loan is made to a borrower or to purchase a loan from a third party, to the time the mortgage loan is sold. During this period, the Company is exposed to losses if mortgage interest rates rise, because the value of the IRLC or the loan held for sale decreases. Reductions in the value of these assets affect income primarily through change in fair value.
F-13
Table of Contents
The Company manages the risk created by IRLCs and loans held for sale by entering into forward sale agreements to sell the loans and by the purchase and sale of mortgage-backed securities (“MBS”) trades and options on Treasury futures. Such agreements are also accounted for as derivative financial instruments. Forward sale agreements and options are included in derivative assets, at fair value and derivative liabilities, at fair value on the consolidated balance sheet. The Company classifies its IRLCs as “Level 3” financial statement items and the derivative financial instruments it acquires to manage the risks created by IRLCs and loans held for sale as “Level 2” fair value financial statement items. The Company does not use derivative financial instruments for purposes other than in support of its risk management activities.
The Company does not designate its derivative financial instruments for hedge accounting. All derivative financial instruments are recognized on the consolidated balance sheet at fair value with changes in the fair values being reported in current period income. Changes in fair value of derivatives hedging IRLCs and loans held for sale at fair value are included in gain on origination and sale of loans, net.
The Company has master netting arrangements with certain counterparties of derivative instruments and warehouse lines. Under these master netting arrangements, the Company can offset the fair value of the derivative instrument against the fair value of the LHFS collateralizing the warehouse line, thereby netting the increase or decrease in the fair value of the derivative instruments against the increase or decrease in the fair value of the LHFS. The Company’s policy is to present such arrangements on the associated assets and liabilities on a gross basis in the consolidated balance sheet.
Servicing Rights
Servicing rights arise from contractual agreements between the Company and investors (or their agents) in mortgage securities and mortgage loans. Under these contracts, the Company is required to perform loan servicing functions in exchange for fees and other remuneration. Servicing functions typically include, among other responsibilities, collecting and remitting loan payments; responding to borrower inquiries; accounting for principal and interest; holding custodial (impound) funds for payment of property taxes and insurance premiums; counseling delinquent mortgagors; supervising the acquisition of real estate in settlement of loans and property disposition. The Company utilizes a sub-servicer to service its loan servicing portfolio. The Company is required to make servicing advances on behalf of borrowers and investors to cover delinquent balances for property taxes, insurance premiums and other costs. Advances are made in accordance with servicing agreements and are recoverable upon collection from the borrower or foreclosure of the underlying loans. The Company periodically reviews the receivable for collectability and amounts are written-off when deemed uncollectible. As of June 30, 2015, the Company had $2.5 million in outstanding servicing advances.
When the Company sells a loan on a servicing-retained basis, it recognizes a servicing asset and the gain on the sale of the loan includes the fair value of the servicing asset retained in the sale. The gain related to servicing rights is recorded to gain on origination and sale of loans, net. The Company has made the election to carry its servicing rights at fair value.
The value of the servicing rights is derived from the net positive cash flows associated with the servicing contracts. The Company receives a servicing fee annually on the remaining outstanding principal balances of the loans subject to the servicing contracts. The servicing fees are collected from the monthly payments made by the mortgagors. The Company is contractually entitled to receive other remuneration including rights to various mortgagor-contracted fees such as late charges, collateral reconveyance charges and loan prepayment penalties, and the Company is generally entitled to retain the interest earned on funds held pending remittance related to its collection of mortgagor payments. The Company also generally has the right to solicit the mortgagors for other products and services as well as for new mortgages for those considering refinancing or purchasing a new home.
The Company is exposed to fair value risk related to its servicing rights. Servicing rights are generally subject to loss in fair value when market mortgage interest rates decrease. Decreasing market mortgage interest
F-14
Table of Contents
rates normally encourage increased mortgage refinancing activity. Increased refinancing activity reduces the life of the loans underlying the servicing rights, thereby reducing their value. Reductions in the value of these assets affect income primarily through change in fair value.
The fair value of servicing rights is difficult to determine because servicing rights are not actively traded in observable stand-alone markets. The Company uses a discounted cash flow approach to estimate the fair value of servicing rights. This approach consists of projecting servicing cash flows. The inputs used in the Company’s discounted cash flow model are based on market factors which management believes are consistent with assumptions and data used by market participants valuing similar servicing rights. The key inputs used in the valuation of servicing rights include mortgage prepayment speeds, cost to service the loans and discount rates. These inputs can, and generally do, change from period to period as market conditions change. Considerable judgment is required to estimate the fair values of servicing rights and the exercise of such judgment can significantly affect the Company’s income. Therefore, the Company classifies its servicing rights as “Level 3” fair value financial statement items.
Servicing Income
The Company receives servicing income from its servicing portfolio. Servicing income is recognized on an accrual basis and is recorded to servicing income. The Company’s subservicing expenses are recorded to subservicing expense.
Servicing Gains (Losses)
Unrealized gains (losses) resulting from changes in the fair value of servicing rights are recorded to servicing gains (losses). Realized gains (losses) from the sale of servicing rights are also included in servicing gains (losses).
Sale Recognition
The Company recognizes sales of servicing rights as sales when it surrenders control over the servicing rights. Control over transferred assets is deemed to be surrendered when (i) the assets have been isolated from the Company, (ii) the transferee has the right (free of conditions that constrain it from taking advantage of that right) to pledge or exchange the transferred assets, and (iii) the Company does not maintain effective control over the transferred assets through either (a) an agreement that entitles and obligates the Company to repurchase or redeem them before their maturity or (b) the ability to unilaterally cause the holder to return specific assets.
Accounts Receivable
Accounts receivable are stated amounts due from customers or from investors for loans sold, net of an allowance for doubtful accounts. Accounts receivable that are outstanding longer than the contractual payment terms are considered past due. The Company establishes a reserve for all amounts due from borrowers and investors that are over 150 days old. The allowance for doubtful accounts was $0.3 million as of June 30, 2015. The Company writes off accounts receivable when management deems them uncollectible. There were $0.1 million of accounts receivable write-offs during the six months ended June 30, 2015.
F-15
Table of Contents
Property and Equipment
Property and equipment are recorded at cost and depreciated over their estimated useful lives using the straight-line method. Leasehold improvements are capitalized and amortized over the lesser of the life of the lease or the estimated useful life of the asset. Useful lives for purposes of computing depreciation are as follows:
| Years | ||||
| Leasehold improvements |
|
2-15 |
| |
| Furniture and equipment |
5-7 | |||
| Computer software |
3-5 | |||
Expenditures that materially increase the asset life are capitalized, while ordinary maintenance and repairs are charged to operations as incurred. When assets are sold or retired, the cost and related accumulated depreciation are removed from the accounts and any resulting gains or losses are included in earnings.
Goodwill and Other Intangible Assets
Business combinations are accounted for using the acquisition method of accounting. Acquired intangible assets are recognized and reported separately from goodwill. Goodwill represents the excess cost of acquisition over the fair value of net assets acquired.
Intangible assets with finite lives are amortized over their estimated lives using the straight-line method. On an annual basis, the Company evaluates whether there has been a change in the estimated useful life or if certain impairment indicators exist.
Goodwill must be allocated to reporting units and tested for impairment. Goodwill is tested for impairment at least annually, and more frequently if events or circumstances, such as adverse changes in the business climate, indicate there may be justification for conducting an interim test. Impairment testing is performed at the reporting unit level.
In testing goodwill for impairment, the Company first assesses qualitative factors to determine whether it is more likely than not that the fair value of a reporting unit is less than its carrying amount. In making this assessment, the Company considers all relevant events and circumstances. These include, but are not limited to, macroeconomic conditions, industry and market considerations and the reporting unit’s overall financial performance. If the Company concludes, based on its qualitative assessment, that it is more likely than not that the fair value of the reporting unit is at least equal to its carrying amount, then the Company presumes that the goodwill of the reporting unit is not impaired and no further testing is performed. However, if the Company concludes, based on its qualitative assessment, that it is more likely than not that the fair value of a reporting unit is less than its carrying amount, then the Company proceeds with a two-step method to assess and measure impairment of the reporting unit’s goodwill. At the Company’s option, it may, in any given period, bypass the qualitative assessment and proceed directly to the two step approach.
The two-step method begins with a comparison of the fair value of a reporting unit to its carrying amount, including goodwill. If the fair value of the reporting unit is less than its carrying amount, the Company then compares the implied fair value of the reporting unit’s goodwill with the carrying amount of that goodwill. The implied fair value of a reporting unit’s goodwill is measured as the excess of the fair value of the reporting unit over the aggregate fair values of all the reporting unit’s assets and liabilities. If the implied fair value of the reporting unit’s goodwill is less than its carrying amount, the Company records an impairment loss equal to that difference. If the fair value of the reporting unit exceeds its carrying amount or if the fair value of the reporting unit’s goodwill exceeds the carrying amount of that goodwill, no impairment loss is recognized.
During the six months ended June 30, 2015, the Company did not record any goodwill impairment as no events or circumstances indicated any justification for conducting an interim impairment test.
F-16
Table of Contents
Long-Lived Assets
The Company periodically assesses long-lived assets, including property and equipment, for recoverability when events or changes in circumstances indicate that their carrying amount may not be recoverable. If management identifies an indicator of impairment, it assesses recoverability by comparing the carrying amount of the asset to the sum of the undiscounted cash flows expected to result from the use and the eventual disposal of the asset. An impairment loss is recognized when the carrying amount is not recoverable and is measured as the excess of carrying value over fair value. No such impairment was recorded during the six months ended June 30, 2015.
Loan Loss Obligation on Loans Sold
When the Company sells loans to investors, the risk of loss or default by the borrower is generally transferred to the investor. However, the Company is required by these investors to make certain representations relating to credit information, loan documentation and collateral. These representations and warranties may extend through the contractual life of the mortgage loan. Subsequent to the sale, if underwriting deficiencies, borrower fraud or documentation defects are discovered in individual mortgage loans, the Company may be obligated to repurchase the respective mortgage loan or indemnify the investors for any losses from borrower defaults if such deficiency or defect cannot be cured within the specified period following discovery.
In the case of early loan payoffs and early defaults on certain loans, the Company may be required to repay all or a portion of the premium initially paid by the investor on loans. The estimated obligation associated with early loan payoffs and early defaults is calculated based on historical loss experience.
The obligation for losses related to the representations and warranties and other provisions discussed above is recorded based upon an estimate of losses. Because the Company does not service all of the loans it sells, it does not maintain nor have access to the current balances and loan performance data with respect to all of the individual loans previously sold to investors. However, the Company uses historical and projected loss frequency and loss severity ratios to estimate its exposure to losses on loans previously sold. Given current general industry trends in mortgage loans as well as housing prices, market expectations around losses related to the Company’s obligations could vary significantly from the obligation recorded as of the balance sheet date.
Income Taxes
loanDepot.com, LLC is a limited liability company (“LLC”). Under federal and applicable state laws, taxes based on income of an LLC treated as a partnership are payable by the LLC’s members individually. The Company is not subject to federal income taxes but is, however, subject to annual state LLC franchise taxes and state LLC fees. These taxes and fees are included in the provision for income taxes. The Company evaluates tax positions taken or expected to be taken in the course of preparing the Company’s tax returns to determine whether the tax positions are “more-likely-than-not” of being sustained by the applicable tax authority. Tax positions deemed to meet the more-likely than-not threshold of being sustained would be recorded as a tax benefit in the current period. The Company has reviewed all open tax years (2011-2014 in each respective jurisdiction) and concluded that it has no tax liability resulting from unrecognized tax benefits relating to uncertain income tax positions.
Redeemable Units
In accordance with the guidance in FASB ASC Topic 480, Distinguishing Liabilities from Equity, outstanding Class I, A, B, P, P-2 and Z-1 Redeemable Units were classified outside of permanent equity and within temporary equity due to their associated redemption features and liquidation preferences. In a liquidation event, the Redeemable Units have preference over the Units classified as permanent equity to any proceeds from a liquidation event at amounts described for each Unit Class. Proceeds include cash or the issuance of stock to Unitholders in a qualified public offering. A liquidation event includes (i) the sale or disposition of substantially all of the Company’s assets, (ii) a merger or consolidation in which the stockholders of the Company prior to the
F-17
Table of Contents
transaction no longer hold at least 50 percent of the voting power of the merged or consolidated entity, (iii) a liquidation, dissolution, or winding up of the Company, or (iv) a qualified public offering. Upon a qualified public offering each Unit would receive proceeds (cash or shares of stock) at the applicable liquidation preference proportional to its value in the overall Company.
Equity-Based Compensation
The Company’s 2009 Incentive Equity Plan (the “Plan”) provides for awards of various classes of Common Units, as described in the Plan. The Company uses the grant-date fair value of equity awards to determine the compensation cost associated with each award. Grant-date fair value is determined using the Black-Scholes pricing model adjusted for unique characteristics of the specific awards. Compensation cost for service-based equity awards is recognized on a straight-line basis over the requisite service period, which is generally the vesting period. Compensation cost for awards with only service conditions that have graded vesting schedules is recognized on a straight-line basis over the requisite service period for the entire award such that compensation cost recognized at any date is at least equal to the portion of the grant-date value of the award that is vested at that date.
In conjunction with the merger with imortgage.com, Inc. (“imortgage”), a total of 1,190,093 I Units were issued of which 88%, or 1,047,604, are held by employees of imortgage and employees of the Company subsequent to the acquisition. If a holder’s employment is terminated during the first three years following the merger date (October 1, 2013), the Company shall be permitted to repurchase 50% of the fair market value of the units. Accordingly, 50%, or $14.7 million, of these units were deemed as compensation and are being recognized into earnings over a three year period ending October 1, 2016. The cost of equity-based compensation is recorded to personnel expense.
Advertising
Advertising costs are expensed in the period incurred and principally represent online advertising costs, including fees paid to search engines, distribution partners, master service agreements with brokers, and desk rental agreements with realtors. Advertising expense amounted to $54.4 million for the six months ended June 30, 2015. Prepaid advertising expenses are capitalized and recognized during the period the expenses are incurred. As of June 30, 2015, capitalized advertising expense is $1.4 million, recorded in prepaid expenses and other assets.
Concentration of Risk
The Company has concentrated its credit risk for cash by maintaining deposits in several financial institutions, which may at times exceed amounts covered by insurance provided by the Federal Deposit Insurance Corporation (FDIC). The Company has not experienced any losses in such accounts and believes it is not exposed to any significant credit risk related to cash.
Due to the nature of the mortgage lending industry, changes in interest rates may significantly impact revenue from originating mortgages and subsequent sales of loans to investors, which are the primary source of income for the Company. The Company originates mortgage loans on property located throughout the United States, with loans originated for property located in California totaling approximately 32% of total loan originations for the six months ended June 30, 2015.
The Company sells mortgage loans to various third-party investors. Three investors accounted for 34%, 29% and 25%, respectively, of the Company’s loan sales for the six months ended June 30, 2015. No other investors accounted for more than 10% of the loan sales for the six months ended June 30, 2015.
The Company funds loans through warehouse lines of credit. As of June 30, 2015, 36% and 19% was payable to two separate lenders.
F-18
Table of Contents
NOTE 3—RECENT ACCOUNTING PRONOUNCEMENTS
In January 2014, the FASB issued Accounting Standards Update (“ASU”) No. 2014-04, “Receivables—Troubled Debt Restructurings by Creditors (Subtopic 310-40): Reclassification of Residential Real Estate Collateralized Consumer Mortgage Loans upon Foreclosure.” This update clarifies when a creditor is considered to have received physical possession of residential real estate property collateralized by a consumer mortgage loan in order to reduce diversity in practice for when a creditor derecognizes the loan receivable and recognizes the real estate property. The guidance in ASU No. 2014-04 also requires interim and annual disclosure of the amount of foreclosed residential real estate property held by the creditor and the recorded investment in consumer mortgage loans collateralized by residential real estate property that are in the process of foreclosure. The new guidance was effective for the Company beginning on January 1, 2015 and the adoption of the new guidance did not have a material impact on its financial statements.
In May 2014, the FASB issued ASU No. 2014-09, Revenue from Contracts with Customers to standardize revenue recognition process between public and private companies as well as across industries in an effort to more closely align GAAP revenue recognition with international standards to provide a more comparable revenue number for the users of the financial statements. The standard outlines that for all contracts, revenue should be recognized when or as the entity satisfies a performance obligation. Revenue is recognized either over a period or at one point in time in accordance with how the control of the service or good is transferred. This amendment update is for all year-end and interim periods beginning after December 15, 2016 and early application is not permitted. The adoption of ASU 2014-09 is not expected to have a material impact on our financial condition, liquidity or results of operations, but the Company is still assessing the possible impact of the implementation of the new standard.
In June 2014, the FASB issued ASU No. 2014-11, “Transfers and Servicing (Topic 860): Repurchase-to-Maturity Transactions, Repurchase Financings, and Disclosures.” The pronouncement in this update changes the accounting for repurchase-to-maturity transactions and linked repurchase financings to secured borrowing accounting, which is consistent with the accounting for other repurchase agreements. The pronouncement also requires two new disclosures. The first disclosure requires an entity to disclose information on transfers accounted for as sales in transactions that are economically similar to repurchase agreements. The second disclosure provides increased transparency about the types of collateral pledged in repurchase agreements and similar transactions accounted for as secured borrowings. The new guidance was effective for the Company beginning on January 1, 2015 and the adoption of the new guidance did not have a material impact on its financial statements.
In June 2014, the FASB issued ASU No. 2014-12, Compensation-Stock Compensation (Topic 718): Accounting for Share-Based Payments When the Terms of an Award Provide That a Performance Target Could Be Achieved after the Requisite Service Period, which requires that a performance target that affects vesting and that could be achieved after the requisite service period be treated as a performance condition. As such, the performance target should not be reflected in estimating the grant-date fair value of the award. Compensation cost should be recognized in the period in which it becomes probable that the performance target will be achieved and should represent the compensation cost attributable to the period(s) for which the requisite service has already been rendered. ASU 2014-12 is effective for annual and interim periods beginning after December 15, 2015, with early adoption permitted. The adoption of ASU 2014-12 is not expected to have a material impact on our financial condition, liquidity or results of operation.
In January 2015, the FASB issued ASU No. 2015-01, Income Statement-Extraordinary and Unusual Items (Subtopic 225-20). ASU 2015-01 addresses the elimination from U.S. GAAP the concept of extraordinary items. Presently, an event or transaction is presumed to be an ordinary and usual activity of the reporting entity unless evidence clearly supports its classification as an extraordinary item. If an event or transaction meets the criteria for extraordinary classification, an entity is required to segregate the extraordinary item from the results of ordinary operations and show the item separately in the income statement, net of tax, after income from
F-19
Table of Contents
continuing operations. This amended guidance will prohibit separate disclosure of extraordinary items in the income statement. This amendment is effective for years, and interim periods within those years, beginning after December 15, 2015. Entities may apply the amendment prospectively or retrospectively to all prior periods presented in the financial statements. Early adoption is permitted provided that the guidance is applied from the beginning of the year of adoption. The adoption of this ASU is not expected to have a material impact on the Company’s financial statements.
In February 2015, ASU No. 2015-02, “Consolidation (Topic 810)—Amendments to the Consolidation Analysis.” This update affects reporting entities that are required to evaluate whether they should consolidate certain legal entities. The amendments in this update affect the following areas: 1) limited partnerships and similar legal entities, 2) evaluating fees paid to a decision maker or a service provider as a variable interest, 3) the effect of fee arrangements on the primary beneficiary determination, 4) the effect of related parties on the primary beneficiary determination, and 5) certain investment funds. The new guidance will be effective for the Company beginning on January 1, 2016. The Company does not expect the adoption of the new guidance to have a material impact on its financial statements.
In April 2015, the FASB issued ASU 2015-03, Interest—Imputation of Interest (Subtopic 835-30), Simplifying the Presentation of Debt Issuance Costs, which requires that debt issuance costs related to a recognized debt liability be presented in the balance sheet as a direct deduction from the carrying amount of that debt liability. For public business entities, the ASU is effective for financial statements issued for fiscal years beginning after December 15, 2015, and interim periods within those fiscal years. Entities should apply the new guidance on a retrospective basis, wherein the balance sheet of each individual period presented should be adjusted to reflect the period-specific effects of applying the new guidance. Upon transition, entities are required to comply with the applicable disclosures for a change in an accounting principle. Early adoption is permitted for financial statements that have not been previously issued. The Company does not expect the adoption of the new guidance to have a material impact on its financial statements.
In April 2015, the FASB issued ASU No. 2015-05 “Intangibles—Goodwill and Other—Internal Use Software (Topic 350-40): “Customer’s Accounting for Fees Paid in a Cloud Computing Arrangement.” This update provides guidance to customers about whether a cloud computing arrangement includes a software license and how to account for it. The new guidance will be effective for the Company beginning on January 1, 2016. The Company does not expect the adoption of the new guidance to have a material impact on its financial statements.
NOTE 4—BUSINESS COMBINATIONS
Acquisition of Mortgage Master
On November 12, 2014, the Company entered into an Asset Purchase Agreement (“APA”) with Mortgage Master, LLC (“Mortgage Master”) pursuant to which the Company agreed to purchase certain assets and assume certain liabilities of Mortgage Master’s retail residential mortgage operation. The Company completed the acquisition on January 2, 2015. The acquisition expanded the Company’s distributed retail channel into the Northeast, Tri-State and mid-Atlantic regions. On June 2, 2015, the Company and Mortgage Master entered into an amendment to the APA (“Amendment”) which included additional consideration that increased the purchase price by $4.3 million. The Mortgage Master acquisition was accounted for under the acquisition method of accounting pursuant to FASB Accounting Standards Codification (“ASC”) 805, Business Combinations.
Pursuant to the APA and the Amendment, and subject to the terms and conditions contained therein, the purchase price consisted of $15.5 million in promissory notes (“Seller Notes”) and an estimated $26.9 million earn-out (“Contingent Consideration”). The Seller Notes accrue interest at 5.0% per annum through June 2, 2015 and at 10.0% per annum thereafter. The Seller Notes mature on the earlier of December 31, 2015 or a merger, consolidation, reorganization, recapitalization or other business combination (“Liquidity Event”). The Company
F-20
Table of Contents
repaid $2.1 million in Seller Notes as of June 30, 2015. The Contingent Consideration consists of an annual earn-out amount and a Liquidity Event earn-out amount. The annual earn-out amount is equal to 30% of Mortgage Master’s pre-tax earnings for each calendar year (“Annual Earn-out”). The Liquidity event earn-out amount is equal to the greater of (a) 300% of Mortgage Master’s net income for the 12 full calendar months preceding the Liquidity Event, or (b) $12.5 million if the Liquidity Event occurs subsequent to January 2, 2016 or $15.0 million, less the aggregate amount of any Annual Earn-out payments made by the Company prior to a Liquidity Event. The earn-out is capped at $50.0 million. The fair value of the Contingent Consideration was estimated to be $26.9 million as of January 2, 2015 and was estimated using a calibrated Monte-Carlo simulation. The fair value was primarily based on (i) the Company’s estimate of Mortgage Master’s net income over the relevant earn-out period, (ii) a volatility factor of 25.0% and (iii) a discount rate of 30.5%.
The Company updated the estimated fair value of the Contingent Consideration to $28.1 million as of June 30, 2015 using the calibrated Monte-Carlo simulation. The increase in fair value of $1.2 million is recorded within general and administrative expense in the Company’s consolidated statement of operations for the six months ended June 30, 2015.
The table below presents the purchase price allocation of the estimated acquisition date fair values of assets acquired and the liabilities assumed as of January 2, 2015.
| Consideration paid: |
||||
| Seller Notes |
$ | 11,282 | ||
| Additional consideration |
4,250 | |||
| Contingent consideration |
26,871 | |||
|
|
|
|||
| $ | 42,403 | |||
|
|
|
|||
| Assets acquired: |
||||
| Cash |
$ | 7,000 | ||
| Prepaids |
360 | |||
| Property and equipment |
3,784 | |||
| Security deposits |
357 | |||
| Interest rate lock commitments |
4,751 | |||
| Trademarks and trade name |
1,300 | |||
| Non-compete agreements |
530 | |||
|
|
|
|||
| $ | 18,082 | |||
|
|
|
|||
| Liabilities assumed: |
||||
| Accrued liabilities |
$ | (218 | ) | |
|
|
|
|||
| Net assets acquired |
$ | 17,864 | ||
|
|
|
|||
| Goodwill |
$ | 24,539 | ||
|
|
|
The acquired assets and assumed liabilities, both tangible and intangible, were recorded at their fair values as of the acquisition date. The Company made significant estimates and exercised significant judgment in estimating the fair values of the acquired assets and assumed liabilities. The fair value of all assets acquired and liabilities assumed are based on information that was available as of the acquisition date. The application of the acquisition method of accounting resulted in goodwill of $24.5 million. Acquisition related costs of $0.6 million were expensed as incurred and is included in general and administrative expense in the consolidated statement of operations. The expenses were comprised of legal and professional fees. The results of Mortgage Master’s operations are included in the accompanying consolidated statement of operations subsequent to the acquisition date.
F-21
Table of Contents
Unaudited Pro Forma Results of Operations
The following table presents unaudited pro forma results of operations for the periods presented as if the Mortgage Master acquisition had been completed on January 1, 2014. The unaudited pro forma results of operations include the historical accounts of the Company and Mortgage Master and pro forma adjustments, including the amortization of intangibles with definite lives, depreciation of fixed assets, amortization of prepaid expenses, accretion of discount on contingent consideration and interest expense on Seller Notes. The unaudited pro forma information is intended for informational purposes only and is not necessarily indicative of the future operating results that would have occurred had the Mortgage Master acquisition been completed at the beginning of 2014. No assumptions have been applied to the pro forma results of operations regarding possible revenue enhancements, expense efficiencies or asset dispositions.
| For the six months ended June 30, 2015 |
||||
| Revenues |
$ | 489,633 | ||
| Expenses |
421,026 | |||
|
|
|
|||
| Pre-tax net earnings |
$ | 68,607 | ||
|
|
|
|||
Mortgage Master revenues of $83.9 million and expenses of $72.3 million are included in the Company’s consolidated statement of operations since the January 2, 2015 acquisition date.
NOTE 5—FAIR VALUE
The Company’s consolidated financial statements include assets and liabilities that are measured based on their estimated fair values. The application of fair value estimates may be on a recurring or nonrecurring basis depending on the accounting principles applicable to the specific asset or liability and whether management has elected to carry the item at its estimated fair value as discussed in the following paragraphs.
Financial Statement Items Measured at Fair Value on a Recurring Basis
The Company enters into IRLCs with prospective borrowers, which are commitments to originate loans at a specified interest rate. The IRLCs are recorded as a component of derivative assets on the consolidated balance sheet with changes in fair value being recorded in current earnings as a component of gain on origination and sale of loans, net.
IRLCs for loans to be sold to investors are economically hedged using mandatory or assignment of trades (“AOT”), best efforts sale commitments or options on U.S. treasury futures. The Company estimates the fair value of the IRLCs based on quoted Agency to be announced mortgage-backed securities (“TBA MBS”) prices, its estimate of the fair value of the servicing rights it expects to receive in the sale of the loans and the probability that the mortgage loan will fund or be purchased (the “pull-through rate”) and estimated transformative costs. The pull-through rate is based on the Company’s own experience and is a significant unobservable input used in the fair value measurement of these instruments and results in the classification of these instruments as Level 3. Significant changes in the pull-through rate of the IRLCs, in isolation, could result in significant changes in fair value measurement. At June 30, 2015, there was $4.8 billion of IRLCs notional value outstanding.
LHFS to be sold to investors are also hedged using mandatory trades or AOTs, best efforts sale commitments or put options. The LHFS are valued at the best execution value based on the underlying characteristics of the loan, which is either based off of the TBA MBS market, or investor pricing, based on product, note rate and term. The most significant data inputs used in this valuation include, but are not limited to, loan type, underlying loan amount, note rate, loan program, and expected sale date of the loan. The valuations for LHFS are adjusted at the loan level to consider the servicing release premium and loan level pricing adjustments specific to each loan. LHFS, excluding impaired loans, are classified as Level 2. LHFS measured at fair value
F-22
Table of Contents
that become impaired are transferred from Level 2 to Level 3. There were no identified impaired loans as of June 30, 2015. Changes in the fair value of the LHFS are recorded in current earnings as a component of gain on origination and sale of loans, net.
As described above, the Company economically hedges the changes in fair value of IRLCs and LHFS caused by changes in interest rates by using mandatory trades (“AOTs”), best efforts forward delivery commitments, and put options. These instruments are considered derivative instruments and are recorded at fair value as a component of derivative assets or derivative liabilities on the consolidated balance sheet. The changes in fair value for these hedging instruments are recorded in current earnings as a component of gain on origination and sale of loans, net.
Mandatory trades are valued using inputs related to characteristics of the TBA MBS stratified by product, coupon, and settlement date. These derivatives are classified as Level 2. As of June 30, 2015, there was $2.6 billion of unsettled mandatory trade notional value outstanding.
Best efforts forward delivery commitments are valued using investor pricing considering the current base loan price. An anticipated loan funding probability is applied to value best efforts commitments hedging IRLCs, which results in the classification of these contracts as Level 3. The current base loan price and the anticipated loan funding probability are the most significant assumptions affecting the value of the best efforts commitments. The best efforts forward delivery commitments hedging LHFS are classified as Level 2; such contracts are transferred from Level 3 to Level 2 at the time the underlying loan is originated. As of June 30, 2015, there were no best effort forward delivery commitments.
The Company also purchases out-of-the-money put options on 10-year treasury futures to economically hedge interest rate risk. Risk of loss associated with the put options is limited to the premium paid for the option. These put options are actively traded in a liquid market and thus, these instruments are considered to be valued with Level 1 inputs.
The fair value of the servicing rights is based on applying the inputs to calculate the net present value of estimated servicing rights income. Significant inputs in the valuation of the servicing rights include discount rates, prepayment speeds and the cost of servicing. These inputs are predominantly Level 3 in nature as they utilize certain significant unobservable inputs including prepayment rate, default rate and discount rate assumptions. The weighted average discount rate, prepayment rate and cost to service as of June 30, 2015 was 8.7%, 11.3% and $86 per loan respectively. Changes in the fair value of servicing rights occur primarily due to realization of expected cash flows as well as the changes in valuation inputs and assumptions. If prepayments occur at a rate greater than our estimate, the fair value of the servicing rights will decrease accordingly.
The Company employs a discounted cash flow model to estimate the fair value of the unsecured term loan utilizing a discount rate derived from credit spreads commensurate with similar risk-rated instruments. Because the discount rate is an unobservable input, the unsecured term loan is classified as Level 3.
F-23
Table of Contents
The following table presents the carrying amount and estimated fair value of financial instruments included in the consolidated financial statements as of the dates indicated:
| June 30, 2015 | ||||||||||||||||
| Carrying Amount |
Estimated Fair Value | |||||||||||||||
| Level 1 | Level 2 | Level 3 | ||||||||||||||
| Assets | ||||||||||||||||
| Cash and cash equivalents |
$ | 53,350 | $ | 53,350 | $ | — | $ | — | ||||||||
| Restricted cash |
3,227 | 3,227 | — | — | ||||||||||||
| Loans held for sale, at fair value |
1,504,603 | — | 1,504,603 | — | ||||||||||||
| Derivative assets, at fair value (1) |
87,443 | — | — | 87,443 | ||||||||||||
| Servicing rights, at fair value |
194,093 | — | — | 194,093 | ||||||||||||
| Liabilities | ||||||||||||||||
| Warehouse lines of credit |
$ | 1,410,794 | $ | — | $ | 1,410,794 | $ | — | ||||||||
| Derivative liabilities, at fair value (2) |
2,020 | — | 2,020 | — | ||||||||||||
| Contingent consideration |
28,100 | — | — | 28,100 | ||||||||||||
| Secured credit facility |
48,754 | — | 48,754 | — | ||||||||||||
| Unsecured term loan |
80,000 | — | — | 83,069 | ||||||||||||
| (1) | Amounts include interest rate lock commitments, forward sales contracts and put options. |
| (2) | Amounts include forward sales contracts. |
The following presents the Company’s assets and liabilities that are measured at fair value on a recurring basis at June 30, 2015:
| June 30, 2015 | ||||||||||||||||
| Recurring Fair Value Measurements of Assets (Liabilities) Using: | ||||||||||||||||
| Quoted Market Prices in Active Markets for Identical Assets (Level 1) |
Significant Other Observable Inputs (Level 2) |
Significant Unobservable Inputs (Level 3) |
Total Fair Value Measurements |
|||||||||||||
| Loans held for sale |
$ | — | $ | 1,504,603 | $ | — | $ | 1,504,603 | ||||||||
| Interest rate lock commitments (1) |
— | — | 79,965 | 79,965 | ||||||||||||
| Servicing rights |
— | — | 194,093 | 194,093 | ||||||||||||
| Forward sales contracts—assets (1) |
— | 6,454 | — | 6,454 | ||||||||||||
| Put options on treasuries—assets (1) |
1,025 | — | — | 1,025 | ||||||||||||
| Forward sales contracts—liabilities (2) |
— | (2,020 | ) | — | (2,020 | ) | ||||||||||
| Contingent consideration |
— | — | (28,100 | ) | (28,100 | ) | ||||||||||
|
|
|
|
|
|
|
|
|
|||||||||
| Total |
$ | 1,025 | $ | 1,509,037 | $ | 245,958 | $ | 1,756,020 | ||||||||
|
|
|
|
|
|
|
|
|
|||||||||
| (1) | Amounts included in derivative asses, at fair value on the consolidated balance sheet. |
| (2) | Amounts included in derivative liabilities, at fair value on the consolidated balance sheet. |
F-24
Table of Contents
The following presents the changes in the Company’s assets and liabilities that are measured at fair value on a recurring basis using significant unobservable inputs (Level 3) for the six months ended June 30, 2015:
| For the six months ended June 30, 2015 | ||||||||||||
| Interest Rate Lock Commitments |
Servicing Rights |
Contingent Consideration |
||||||||||
| Balance at beginning of year |
$ | 52,065 | $ | 138,837 | $ | — | ||||||
| IRLCs attributable to Mortgage Master acquisition |
4,751 | — | — | |||||||||
| Contingent consideration attributable to Mortgage Master acquisition |
— | — | (26,871 | ) | ||||||||
| Total net gains or losses included in earnings (realized and unrealized) |
248,732 | 128,752 | (1,229 | ) | ||||||||
| Sales and settlements |
||||||||||||
| Purchases |
— | 25 | — | |||||||||
| Sales |
— | (73,521 | ) | — | ||||||||
| Settlements |
(106,907 | ) | — | — | ||||||||
| Transfers of IRLCs to closed loans |
(118,676 | ) | — | — | ||||||||
|
|
|
|
|
|
|
|||||||
| Balance at end of period |
$ | 79,965 | $ | 194,093 | $ | (28,100 | ) | |||||
|
|
|
|
|
|
|
|||||||
The following presents the gains and losses included in earnings for the six months ended June 30, 2015 relating to the Company’s assets and liabilities that are measured at fair value on a recurring basis using significant unobservable inputs (Level 3):
| For the six months ended June 30, 2015 | ||||||||||||
| Interest Rate Lock Commitments (1) |
Servicing Rights (2) |
Contingent Consideration (3) |
||||||||||
| Total net gains (losses) included in earnings |
$ | 23,149 | $ | 128,752 | $ | (1,229 | ) | |||||
|
|
|
|
|
|
|
|||||||
| Change in unrealized gains (losses) relating to assets and liabilities still held at period end |
$ | 79,965 | $ | 111,470 | $ | (1,229 | ) | |||||
|
|
|
|
|
|
|
|||||||
| (1) | Gains (losses) included in gain on origination and sale of loans, net. |
| (2) | Gains (losses) included in servicing gains (losses). |
| (3) | Gains (losses) included in general and administrative expense. |
The following table presents quantitative information about the valuation techniques and unobservable inputs applied to Level 3 fair value measurements for financial instruments measured at fair value on a recurring and non-recurring basis at June 30, 2015:
| June 30, 2015 | ||||||
| Unobservable Input |
Range of inputs | Weighted Average | ||||
| IRLCs: |
||||||
| Pull-through rate |
0.1% - 99.0% | 74.2 | % | |||
| Servicing rights: |
||||||
| Discount rate |
6.6% - 12.6% | 8.7 | % | |||
| Prepayment rate |
9.3% - 15.7% | 11.3 | % | |||
| Cost to service |
71-96 | 86 | ||||
| Contingent consideration: |
||||||
| Discount rate |
30.5% | 30.5 | % | |||
| Volatility |
25% | 25 | % | |||
F-25
Table of Contents
Financial Statement Items Measured at Fair Value on a Nonrecurring Basis
The Company does not have any assets or liabilities that are recorded at fair value on a non-recurring basis as of June 30, 2015.
Fair Value of Financial Instruments Carried at Amortized Cost
As of June 30, 2015, financial instruments were either recorded at fair value or the carrying value approximated fair value. For financial instruments that were not recorded at fair value, such as cash and cash equivalents, restricted cash, accounts receivable, accounts payable, and accrued expenses and other liabilities, their carrying values approximated fair value due to the short-term nature of such instruments (Level 1).
The Company’s warehouse lines of credit bear interest at a rate that is periodically adjusted based on a market index. The carrying value of warehouse lines of credit approximates fair value as of June 30, 2015.
The Company’s $25.0 million secured credit facility to finance servicing rights was entered into in October 2014. The stated rate of interest is 30-day LIBOR plus 4.00%, and is the same as the market rate for this instrument as of June 30, 2015. The secured credit facility was increased to $42.5 million in June 2015 and later reduced to $30.0 million in August 2015. The carrying value of this Secured Credit Facility approximates fair value as of June 30, 2015.
The Company’s $80.0 million Unsecured Term Loan was entered into in October 2013. The stated rate of interest is 11% per annum. As of June 30, 2015, the fair value of this Unsecured Term Loan was $83.1 million, utilizing a discounted cash flow method using market interest rates.
The fair value estimate for contingent consideration was determined using a calibrated Monte-Carlo simulation model. The fair value estimate requires significant judgment and assumptions to be made about future operating results, discount rates, volatility and probabilities of various projected operating result scenarios over the relevant earn-out period. As of June 30, 2015, the fair value of contingent consideration was $28.1 million.
NOTE 6—BALANCE SHEET NETTING
Certain derivatives, loan warehouse and repurchase agreements are subject to master netting arrangements or similar agreements. Under GAAP, in certain circumstances the Company may elect to present certain financial assets, liabilities, and related collateral subject to master netting arrangements in a net position on the consolidated balance sheet. However, the Company does not report any of these financial assets or liabilities on a net basis, and presents them on a gross basis on the consolidated balance sheet.
F-26
Table of Contents
The table below represents financial assets and liabilities that are subject to master netting arrangements or similar agreements categorized by financial instrument, together with corresponding financial instruments and corresponding collateral received or pledged at June 30, 2015.
| June 30, 2015 | ||||||||||||||||||||||||
| Gross Amounts of Recognized Assets (Liabilities) |
Gross Amounts Offset in Consolidated Balance Sheet |
Net Amounts of Assets (Liabilities) Presented in Consolidated Balance Sheet |
Gross Amounts Not Offset in Consolidated Balance Sheet |
Net Amount |
||||||||||||||||||||
| Financial Instruments |
Cash Collateral (Received) Pledged |
|||||||||||||||||||||||
| Assets |
||||||||||||||||||||||||
| Forward delivery contracts |
$ | 6,454 | $ | — | $ | 6,454 | $ | (3,859 | ) | $ | — | $ | 2,595 | |||||||||||
| Put options on treasuries |
1,025 | — | 1,025 | — | — | 1,025 | ||||||||||||||||||
|
|
|
|
|
|
|
|
|
|
|
|
|
|||||||||||||
| Total Assets |
$ | 7,479 | $ | — | $ | 7,479 | $ | (3,859 | ) | $ | — | $ | 3,620 | |||||||||||
|
|
|
|
|
|
|
|
|
|
|
|
|
|||||||||||||
| Liabilities |
||||||||||||||||||||||||
| Forward delivery contracts |
$ | (2,020 | ) | $ | — | $ | (2,020 | ) | $ | 20 | $ | — | $ | (2,000 | ) | |||||||||
| Warehouse lines of credit |
(1,410,794 | ) | — | (1,410,794 | ) | 1,498,036 | 3,254 | 90,496 | ||||||||||||||||
| Debt obligations |
(128,754 | ) | — | (128,754 | ) | 81,989 | 487 | (46,278 | ) | |||||||||||||||
|
|
|
|
|
|
|
|
|
|
|
|
|
|||||||||||||
| Total Liabilities |
$ | (1,541,568 | ) | $ | — | $ | (1,541,568 | ) | $ | 1,580,045 | $ | 3,741 | $ | 42,218 | ||||||||||
|
|
|
|
|
|
|
|
|
|
|
|
|
|||||||||||||
The Company has entered into agreements with counterparties which include netting arrangements whereby the counterparties are entitled to settle their positions on a net basis. In certain circumstances, the Company is required to provide certain counterparties collateral against derivative financial instrument, warehouse line of credit or debt obligation. As of June 30, 2015, counterparties held $3.7 million of the Company’s cash and cash equivalents in margin accounts as collateral (which is classified as “Restricted cash” on the Company’s consolidated balance sheet).
NOTE 7—LOANS HELD FOR SALE, AT FAIR VALUE
Loans Held for Sale: The following table represents the unpaid principal balance of LHFS by product type of loan as of June 30, 2015:
| June 30, 2015 | ||||||||
| Amount | % | |||||||
| Conforming - fixed |
$ | 867,737 | 59 | % | ||||
| Conforming - ARM |
56,721 | 4 | ||||||
| FHA - fixed |
195,489 | 13 | ||||||
| FHA - ARM |
10,775 | 1 | ||||||
| Other |
336,371 | 23 | ||||||
|
|
|
|
|
|||||
| 1,467,093 | 100 | |||||||
| Fair Value Adjustment |
37,510 | |||||||
|
|
|
|||||||
| Total |
$ | 1,504,603 | ||||||
|
|
|
|||||||
F-27
Table of Contents
A summary of the changes in the balance of loans held for sale for the six months ended June 30, 2015 is as follows:
| 2015 | ||||
| Balance at beginning of period |
$ | 1,004,195 | ||
| Origination of loans |
14,302,664 | |||
| Sales |
(13,788,285 | ) | ||
| Principal payments |
(8,731 | ) | ||
| Fair value loss |
(5,240 | ) | ||
|
|
|
|||
| Balance at end of period |
$ | 1,504,603 | ||
|
|
|
|||
Gain on origination and sale of loans, net is comprised of the following components for the six months ended June 30, 2015:
| For the six months ended June 30, 2015 |
||||
| Premium from loan sales |
$ | 358,503 | ||
| Servicing rights |
148,034 | |||
| Unrealized gains from derivative assets and liabilities |
32,107 | |||
| Realized gains from derivative assets and liabilities |
1,821 | |||
| Discount points, rebates and lender paid costs |
(105,068 | ) | ||
| Mark to market loss on loans held for sale |
(5,240 | ) | ||
| Provision for loan loss obligation for loans sold |
(4,719 | ) | ||
|
|
|
|||
| $ | 425,438 | |||
|
|
|
|||
The Company did not have any loans on non-accrual status as of June 30, 2015.
Continuing Involvement in Loans Sold through Servicing Arrangements
Loans held for sale includes repurchase eligible loans representing certain mortgage loans sold pursuant to Government National Mortgage Association (“Ginnie Mae”) programs where the Company, as servicer, has the unilateral option to repurchase the loan if certain criteria are met, including if a loan is greater than 90 days delinquent. Regardless of whether the repurchase option has been exercised, the Company must recognize eligible loans and a corresponding repurchase liability in its consolidated balance sheet.
The balances of Ginnie Mae serviced loans that were 90 or more days past due at June 30, 2015 totaled $71.6 million and represent loans that the Company is eligible to repurchase from Ginnie Mae guaranteed securitizations as part of its contractual obligations as the servicer of the loans. The terms of the Ginnie Mae MBS program allow, but do not require, the Company to repurchase mortgage loans when the borrower has made no payments for three consecutive months. As a result of this right, the Company records the loans in Loans eligible for repurchase and records a corresponding liability in Liability for loans eligible for repurchase on its consolidated balance sheet.
NOTE 8—SERVICING RIGHTS, AT FAIR VALUE
At June 30, 2015, the outstanding principal balance of the servicing portfolio was comprised of the following:
| June 30, 2015 | ||||
| Conventional |
$ | 7,721,322 | ||
| Government |
8,843,261 | |||
|
|
|
|||
| Total mortgage servicing portfolio |
$ | 16,564,583 | ||
|
|
|
|||
F-28
Table of Contents
A summary of the unpaid principal balance of servicing rights at June 30, 2015 is as follows:
| June 30, 2015 | ||||
| Current loans |
$ | 16,232,977 | ||
| Loans 30 - 89 days delinquent |
224,001 | |||
| Loans 90 or more days delinquent or in foreclosure |
107,605 | |||
|
|
|
|||
| Total mortgage servicing portfolio |
$ | 16,564,583 | ||
|
|
|
|||
A summary of the changes in the balance of servicing rights for the six months ended June 30, 2015 is as follows:
| Balance at beginning of period |
$ | 138,837 | ||
| Additions |
148,059 | |||
| Sales proceeds (net of loss) |
(77,223 | ) | ||
| Changes in fair value: |
||||
| Due to changes in valuation inputs or assumptions |
2,053 | |||
| Other changes in fair value |
(17,633 | ) | ||
|
|
|
|||
| Balance at end of period |
$ | 194,093 | ||
|
|
|
The following is a summary of the components of loan servicing fees as reported in the Company’s consolidated statement of operations for the six months ended June 30, 2015:
| For the six months ended June 30, 2015 |
||||
| Contractual servicing fees |
$ | 19,783 | ||
| Late, ancillary and other fees |
412 | |||
|
|
|
|||
| $ | 20,195 | |||
|
|
|
|||
The table below illustrates hypothetical changes in fair values of servicing rights, caused by assumed immediate changes to key assumptions that are used to determine fair value.
| Servicing Rights Sensitivity Analysis |
June 30, 2015 |
|||
| Fair Value of Servicing Rights |
$ | 194,093 | ||
| Change in Fair Value from adverse changes: |
||||
| Discount Rate: |
||||
| Increase 1% |
(7,165 | ) | ||
| Increase 2% |
(13,819 | ) | ||
| Cost of Servicing: |
||||
| Increase 10% |
(2,529 | ) | ||
| Increase 20% |
(5,058 | ) | ||
| Prepayment Speed: |
||||
| Increase 10% |
(7,471 | ) | ||
| Increase 20% |
(14,419 | ) | ||
Sensitivities are hypothetical changes in fair value and cannot be extrapolated because the relationship of changes in assumptions to changes in fair value may not be linear. Also, the effect of a variation in a particular
F-29
Table of Contents
assumption is calculated without changing any other assumption, whereas a change in one factor may result in changes to another. Accordingly, no assurance can be given that actual results would be consistent with the results of these estimates. As a result, actual future changes in servicing rights values may differ significantly from those displayed above.
NOTE 9—DERIVATIVE FINANCIAL INSTRUMENTS AND HEDGING ACTIVITIES
Derivatives instruments utilized by the Company primarily include IRLCs, AOT, TBA MBS, and out-of-the-money put options on 10-year treasury futures to hedge interest rate risk. See Note 5—Fair Value for further details on derivatives.
The following summarizes the Company’s outstanding derivative instruments as of June 30, 2015:
| June 30, 2015: | Fair Value | |||||||||||||
| Notional | Balance Sheet Location |
Asset | Liability | |||||||||||
| Interest rate lock commitments |
$ | 4,755,458 | Derivative asset, at fair value | $ | 79,965 | $ | — | |||||||
| Forward sales contracts—assets |
1,330,135 | Derivative asset, at fair value | 6,454 | — | ||||||||||
| Forward sales contracts—liabilities |
1,236,057 | Derivative liabilities, at fair value | — | (2,020 | ) | |||||||||
| Put options on treasuries—assets |
10,775 | Derivative asset, at fair value | 1,025 | — | ||||||||||
| Put options on treasuries—liabilities |
— | — | — | |||||||||||
|
|
|
|
|
|
|
|||||||||
| Total derivative financial instruments |
$ | 7,332,425 | $ | 87,444 | $ | (2,020 | ) | |||||||
|
|
|
|
|
|
|
|||||||||
Because many of our current derivative agreements are not exchange-traded, we are exposed to credit loss in the event of nonperformance by the counterparty to the agreements. We control this risk through credit monitoring procedures including financial analysis, dollar limits and other monitoring procedures. The notional amount of our contracts does not represent our exposure to credit loss.
The following summarizes the realized and unrealized gains and losses on derivative instruments, included in gain on origination and sale of loans, net in the consolidated statement of operations, for the six months ended June 30, 2015:
| Six months ended June 30, 2015 |
||||
| Interest rate lock commitments |
$ | 23,149 | ||
| Forward sales contracts |
11,452 | |||
| Put options on treasuries |
(2,494 | ) | ||
| Pair off |
1,821 | |||
|
|
|
|||
| Total gains |
$ | 33,928 | ||
|
|
|
|||
NOTE 10—GOODWILL AND INTANGIBLE ASSETS, NET
The following table presents changes in the carrying amount of goodwill for the periods indicated:
| Balance at December 31, 2014 |
$ | 10,883 | ||
| Mortgage Master business combination |
24,539 | |||
|
|
|
|||
| Balance at June 30, 2015 |
$ | 35,422 | ||
|
|
|
F-30
Table of Contents
The Company performs its annual assessment of possible impairment of goodwill in December. This assessment will be performed more frequently if events and circumstances indicate that impairment may have occurred. The Company’s goodwill is attributable to the distributed retail channel and its analysis is performed at this level, with no impairment noted during the six months ended June 30, 2015.
The Company’s other intangible assets relate to its asset acquisition of imortgage in October 2013 and asset acquisition of Mortgage Master in January 2015, as described in Note 4—Business Combinations. The following table presents the Company’s intangible assets for the periods indicated:
| June 30, 2015 | ||||||||||||||||
| Gross carrying amount |
Accumulated amortization |
Net carrying amount |
Weighted average life (years) |
|||||||||||||
| Non compete |
$ | 2,030 | $ | (575 | ) | $ | 1,455 | 5 | ||||||||
| Favorable lease |
100 | (53 | ) | 47 | 3 | |||||||||||
|
|
|
|
|
|||||||||||||
| Total |
$ | 2,130 | $ | (628 | ) | |||||||||||
|
|
|
|
|
|||||||||||||
| Trademarks, tradename and domain name (1) |
3,930 | |||||||||||||||
|
|
|
|||||||||||||||
| Total |
$ | 5,432 | ||||||||||||||
|
|
|
|||||||||||||||
| (1) | Indefinite lived asset not subject to amortization. |
Amortization expense for amortizing intangible assets is $0.2 million for the six months ended June 30, 2015. The weighted average amortization period for these assets is 43 months as of June 30, 2015. The following is a schedule of estimated amortization expense for the six months ending December 31, 2015 and each of the next five fiscal years:
| Six months ending December 31, |
||||
| 2015 |
$ | 220 | ||
| Year ending December 31, |
||||
| 2016 |
436 | |||
| 2017 |
409 | |||
| 2018 |
331 | |||
| 2019 |
106 | |||
| 2020 |
— | |||
|
|
|
|||
| Estimated amortization expense |
$ | 1,502 | ||
|
|
|
NOTE 11—INVESTMENTS IN JOINT VENTURES
The Company has financial interests in certain joint ventures accounted for under the variable interest entity or voting interests models. Under this guidance, the Company has determined that none of its involvement with any of its joint ventures should be consolidated with the Company’s consolidated balance sheet and statement of operations.
MTH Mortgage, LLC (“MTH”) was formed in August 2000 as a joint venture between imortgage (subsequently purchased by the Company) and Meritage Paseo Crossing, LLC a subsidiary of Meritage Homes Corporation (together “Meritage”). Meritage is a nationwide homebuilder while MTH is a mortgage loan broker that provides loan origination services to customers of Meritage. MTH earns fees paid by the Company for the successful funding and closing of these mortgage loans. The Company and Meritage own 35% and 65% of the joint venture, respectively.
F-31
Table of Contents
Polygon Mortgage, LLC (“Polygon”) was formed as a joint venture between the Company and PNW Homebuilders, LLC (“PNW”) in October 2013. PNW is a homebuilder while Polygon is a mortgage loan broker that provides loan origination services to customers of PNW. Polygon earns fees paid by the Company for the successful funding and closing of these mortgage loans. Effective August 12, 2014, there was a change in ownership in which PNW sold its 50% ownership in Polygon to William Lyon Homes in conjunction with the acquisition of PNW Homebuilders by William Lyon Homes. The Company and Polygon WLH, LLC, a wholly owned subsidiary of William Lyon Homes each own 50% of the joint venture.
MSC Mortgage, LLC (“MSC”) was formed as a joint venture between the Company and Michael Saunders & Company (“Michael Saunders”) in June 2014. Michael Saunders is a real estate broker while MSC is a mortgage loan broker that provides loan origination services to customers of Michael Saunders. MSC earns fees paid by the Company for the successful funding and closing of these mortgage loans. The Company and Michael Saunders each own 50% of the joint venture.
TRI Pointe Connect, LLC (“TRI Pointe”) was formed as a joint venture between the Company and TRI Pointe Solutions, Inc. (“TPS”) in October 2014. TPS is a home builder while TRI Pointe is a mortgage loan broker that provides loan origination services to customers of TPS. TRI Pointe earns fees paid by the Company for the successful funding and closing of these mortgage loans. The Company and TPS own 45% and 55% of the joint venture, respectively.
The Company’s maximum exposure to loss as a result of its involvement with its joint ventures is the carrying value noted below. The Company’s pro rata share of net earnings of joint ventures is recorded in other income while the carrying value of the Company’s equity investments in joint ventures is recorded in Investments in Joint Ventures. The combined results of operations and financial position of the Company’s equity-basis investments in joint ventures are summarized, below:
| Six months ended June 30, 2015 |
||||
| Condensed income statement information: |
||||
| Total revenues of joint ventures |
$ | 17,591 | ||
| Total net income of joint ventures |
9,429 | |||
| Company’s pro rata share of net earnings of joint ventures |
3,447 | |||
| June 30, 2015 | ||||
| Carrying value of the Company’s equity investments in joint ventures |
$ | 16,687 | ||
NOTE 12—ACCOUNTS RECEIVABLE, NET
Accounts receivable, net as of June 30, 2015 consists of the following:
| June 30, 2015 |
||||
| Servicing fee income, net |
7,145 | |||
| Loan sales |
14,285 | |||
| Servicing sales, net |
2,641 | |||
| Hedging |
9,943 | |||
| Other |
5,406 | |||
|
|
|
|||
| $ | 39,420 | |||
|
|
|
|||
F-32
Table of Contents
NOTE 13—PROPERTY AND EQUIPMENT, NET
Property and equipment, net consists of the following at June 30, 2015:
| June 30, 2015 |
||||
| Furniture and equipment |
$ | 37,438 | ||
| Computer software |
10,502 | |||
| Software development |
22,412 | |||
| Leasehold improvements |
7,816 | |||
| Work in progress |
1,428 | |||
|
|
|
|||
| Property and equipment |
79,596 | |||
| Accumulated depreciation and amortization |
(29,540 | ) | ||
|
|
|
|||
| Property and equipment, net |
$ | 50,056 | ||
|
|
|
|||
The Company charged $8.4 million of depreciation and amortization expense related to property and equipment for the six months ended June 30, 2015 which includes assets financed under capital leases.
Capitalized computer software development costs consist of the following at June 30, 2015:
| June 30, 2015 | ||||||||||||||||
| Gross carrying amount |
Accumulated depreciation |
Net carrying amount |
Weighted average life (years) |
|||||||||||||
| Software development |
$ | 22,412 | $ | (8,358 | ) | $ | 14,054 | 3 | ||||||||
Future software development depreciation as of June 30, 2015 for the six months ending December 31, 2015 and for the remaining years are:
| Six months ending December 31, |
||||
| 2015 |
$ | 3,316 | ||
| Year ending December 31, |
||||
| 2016 |
6,069 | |||
| 2017 |
3,994 | |||
| 2018 |
675 | |||
|
|
|
|||
| Total |
$ | 14,054 | ||
|
|
|
NOTE 14—WAREHOUSE LINES OF CREDIT
At June 30, 2015, the Company is a party to eight lines of credit with lenders providing $2.2 billion of warehouse facilities. The warehouse facilities are used to fund, and are secured by, residential loans held for sale. Interest expense from warehouse lines of credit is recorded to interest expense.
The lines of credit are repaid using proceeds from the sale of loans. The base interest rates on the Company’s warehouse lines of credit range from 30 day LIBOR plus 1.75% to 30 day LIBOR plus 2.75%. Some of the lines carry additional fees in the form of annual facility fees charged on the total line amount, commitment fees charged on the committed portion of the line and non-usage fees charged when monthly usage falls below 50% of the line amount; which range from 0.25% to 0.50% per annum. The weighted average interest rate at June 30, 2015 totaled 2.45%. All of the Company’s warehouse lines are scheduled to expire in 2015 and 2016 under one year terms and all lines are subject to renewal based on an annual credit review conducted by the lender.
F-33
Table of Contents
The base interest rates for all warehouse lines of credit are subject to increase based upon the characteristics of the underlying loans collateralizing the lines of credit, including, but not limited to product type and number of days held for sale. Certain of the warehouse line lenders require the Company, at all times, to maintain cash accounts with minimum required balances. As of June 30, 2015, there was $3.3 million held in these accounts which are recorded as a component of restricted cash on the consolidated balance sheet.
Under the terms of these warehouse lines, the Company is required to maintain various financial and other covenants. These financial covenants include, but are not limited to, maintaining (i) minimum tangible net worth, (ii) minimum liquidity, (iii) a minimum current ratio, (iv) a maximum distribution requirement, (v) a maximum leverage ratio, (vi) pre-tax net income requirements and (vii) a maximum warehouse capacity ratio. As of June 30, 2015, the Company was in compliance with its warehouse lending related covenants.
The following table presents certain information on warehouse borrowings and related accrued interest at June 30, 2015:
| Total Facility amount |
Outstanding Balance June 30, 2015 |
Expiration date | Margin (8) | |||||||||
| Facility 1 (1) |
$ | 500,000 | $ | 158,945 | 12/16/2015 | 2.750% | ||||||
| Facility 2 (2)(3) |
300,000 | 269,335 | 7/17/2015 | 2.125 | ||||||||
| Facility 3 |
550,000 | 505,560 | 4/26/2016 | 2.250 | ||||||||
| Facility 4 (4) |
150,000 | 88,735 | 3/17/2016 | 2.250 | ||||||||
| Facility 5 |
125,000 | 98,477 | 9/7/2015 | 2.500 | ||||||||
| Facility 6 (5) |
115,000 | 87,573 | 7/30/2015 | 2.500 | ||||||||
| Facility 7 (6) |
200,000 | 76,871 | 8/14/2015 | 1.750 | ||||||||
| Facility 8 (7) |
250,000 | 125,298 | N/A | 1.600 | ||||||||
|
|
|
|
|
|||||||||
| Total |
$ | 2,190,000 | $ | 1,410,794 | ||||||||
|
|
|
|
|
|||||||||
| (1) | The total facility is available both to fund loan originations and also provide liquidity under a gestation facility for recently sold MBS up to the MBS settlement date. |
| (2) | On July 17, 2015, the expiration date was extended to July 15, 2016. |
| (3) | In addition to the $300.0 million warehouse facility, the lender provides a separate $150.0 million gestation facility to finance recently sold MBS up to the MBS settlement date. |
| (4) | In addition to the $88.7 million outstanding balance secured by mortgage loans, the Company has $26.1 million outstanding to finance servicing rights. See Note 15 – Debt Obligations. |
| (5) | On August 25, 2015, the expiration date was extended to September 28, 2015. |
| (6) | On August 17, 2015, the expiration date was extended to September 21, 2015. |
| (7) | Includes a LIBOR floor of 35 basis points. In addition to the $250.0 million warehouse line, the lender provides a separate gestation facility to finance recently sold MBS up to the MBS settlement date. |
| (8) | Applicable margin to one-month LIBOR. |
The following table presents certain information on warehouse borrowings for the six months ended June 30, 2015:
| For the six months ended June 30, 2015 |
||||
| Maximum outstanding balance during the period |
$ | 1,775,426 | ||
| Average balance outstanding during the period |
1,333,881 | |||
| Collateral pledged (loans held for sale) |
1,460,269 | |||
| Weighted average interest rate during the period |
2.66 | % | ||
F-34
Table of Contents
NOTE 15—DEBT OBLIGATIONS
Secured Credit Facilities
In May 2015, the Company amended one of its Warehouse Line facilities to provide a $50.0 million sub-limit to finance servicing rights (“New Secured Credit Facility”). The total capacity under the Warehouse Line facility is $150.0 million and is available to fund a combination of loans and servicing rights, subject to the $50.0 million sub-limit. As of June 30, 2015, $26.1 million was outstanding under the New Secured Credit Facility. The Company has pledged $48.2 million in fair value of servicing rights as collateral to secure outstanding advances related to the sub-limit. Advances for servicing rights are determined using a borrowing base formula calculated as 65% of the fair market value of the pledged servicing rights. The New Secured Credit Facility expires March 16, 2016 and accrues interest at a base rate per annum of 30-day LIBOR plus 4.00%. If the New Secured Credit Facility is not renewed or extended at the expiration date, the Company has the option to convert the outstanding principal balance to a term loan that accrues interest at a base rate per annum of 30-day LIBOR plus 5.75% and is due two years from the conversion date (“Term Loan”). The Term Loan requires monthly principal and interest payments based on a five year amortization period. Under the New Secured Credit Facility, the Company is required to satisfy certain financial covenants, including minimum tangible net worth, minimum liquidity, maximum leverage and profitability requirements.
In October 2014, the Company entered into a $25.0 million revolving secured credit facility (“Original Secured Credit Facility”) for working capital purposes, which was increased to $42.5 million in June 2015 and later reduced to $30.0 million in August 2015. The Original Secured Credit Facility is secured by servicing rights, matures in October 2015 and accrues interest at a base rate per annum of 30-day LIBOR plus 4.00%. The Company uses amounts borrowed under the Original Secured Credit Facility to retain servicing rights and for other working capital needs and general corporate purposes. As of June 30, 2015, $22.6 million was outstanding under the Original Secured Credit Facility. The Company has pledged $33.8 million in fair value of servicing rights as collateral to secure outstanding advances under the Original Secured Credit Facility. Under the Original Secured Credit Facility, we are required to satisfy certain financial covenants, including minimum tangible net worth, minimum liquidity, maximum leverage and debt service coverage. As of June 30, 2015, we were in compliance with all such covenants.
Unsecured Term Loan
In October 2013, the Company entered into an $80.0 million unsecured term loan facility (“Unsecured Term Loan”). The Unsecured Term Loan is unsecured, matures in October 2016 and accrues interest at a rate per annum ranging from 11.0% to 12.75%. The Company used the proceeds under the Unsecured Term Loan to fund the acquisition and retention of servicing rights and for working capital and general corporate purposes. As of June 30, 2015, $80.0 million was outstanding under the Unsecured Term Loan. Under the Unsecured Term Loan, the Company is required to satisfy certain financial covenants, including minimum tangible net worth, minimum cash balance and maximum consolidated leverage. As of June 30, 2015, we were in compliance with all such covenants. Interest expense from this credit agreement is recorded to other interest expense. The Company is allowed to draw against the $80.0 million principal at the rate of 75% to 90% of the fair market value of unencumbered servicing rights, such draw rate being dependent upon the Company’s leverage ratio as defined by the credit agreement. In the event the amount of the draw is less than $80.0 million, the Company is required to maintain the shortfall in a reserve account, where funds are held and released back to the Company when the shortfall is cured. In addition, the interest rate ranges from 11% to 12.75%, depending upon the 75% to 90% range used at the end of any particular month, and is charged monthly against the principal of $80.0 million. A servicing fee strip equal to the applicable service fee for each loan minus 10 basis points is deposited in a collection account to guarantee payment of interest due on the note and to provide for mandatory pre-payments in the event of a borrowing base deficiency or covenant breaches. The full principal amount of the loan is due in October 2016, however the Company may, at its option, prepay at any time on or prior to the maturity date any part of the loan, so long as the aggregate amount does not exceed 35% of the loan outstanding on the date of prepayment.
F-35
Table of Contents
NOTE 16—ACCRUED EXPENSES AND OTHER LIABILITIES
Accrued expenses and other liabilities as of June 30, 2015 consist of the following:
| June 30, 2015 |
||||
| Accounts payable |
$ | 34,861 | ||
| Loan loss obligation for sold loans |
14,020 | |||
| Accrued compensation and benefits |
34,396 | |||
| Accrued pricing adjustments on sold loans |
19,209 | |||
| Seller note payable |
13,407 | |||
| Deferred rent |
6,619 | |||
| Other |
8,046 | |||
|
|
|
|||
| $ | 130,558 | |||
|
|
|
|||
NOTE 17—CAPITAL LEASES
The Company leases certain equipment under agreements that are classified as capital leases. The cost of equipment under capital leases, net of accumulated amortization, is included in Property and Equipment in the consolidated balance sheet.
Minimum future lease payments under capital leases as of June 30, 2015 for the six months ending December 31, 2015 and for the remaining years under the capital leases are:
| Six months ending December 31, |
||||
| 2015 |
$ | 4,034 | ||
| Year ending December 31, |
||||
| 2016 |
7,089 | |||
| 2017 |
3,728 | |||
| 2018 |
836 | |||
| 2019 |
3 | |||
| 2020 |
— | |||
|
|
|
|||
| Total minimum lease payments remaining |
15,690 | |||
| Less: Amount representing interest |
(1,302 | ) | ||
|
|
|
|||
| $ | 14,388 | |||
|
|
|
Capital lease obligations have lease terms which are one to five years at an effective interest rate between 3.44% and 17.22%. The transactions have been accounted for as financing arrangements, wherein the property remains on the Company’s books and will continue to be depreciated.
Interest expense incurred on capital leases during the six months ended June 30, 2015 was $0.4 million and is included in general and administrative expense.
The cost and accumulated depreciation of equipment held under capital leases as of June 30, 2015 is as follows:
| 2015 | ||||
| Cost |
$ | 21,678 | ||
| Accumulated depreciation |
(7,647 | ) | ||
|
|
|
|||
| Capital lease asset, net |
$ | 14,031 | ||
|
|
|
|||
F-36
Table of Contents
Depreciation of assets under capital leases totaled $2.4 million for the six months ended June 30, 2015 and is included as a component of depreciation and amortization expense in the consolidated statement of operations.
NOTE 18—RELATED PARTY TRANSACTIONS
In conjunction with its various joint ventures, the Company entered into various agreements to provide services to the joint ventures for which it receives and pays fees. Services for which the Company earns fees comprise loan processing and administrative services (legal, accounting, human resources, data processing and management information, assignment processing, post-closing, underwriting, facilities management, quality control, management consulting, risk management, promotions, public relations, advertising and compliance with credit agreements). The Company also originates eligible mortgage loans referred to it by the joint ventures for which the Company pays the joint ventures a broker fee.
Fees earned and costs incurred from the joint ventures for the six months ended June 30, 2015 is as follows:
| Loan processing and administrative services fee income |
$ | 1,790 | ||
| Loan origination broker fees expense |
17,591 |
Receivables due from the joint ventures are as follows at June 30, 2015:
| Receivables from joint ventures |
$ | 799 |
The Company entered into a transitional services agreement on January 2, 2015 with the former owners of Mortgage Master. Under this agreement, the Company provided certain services to the former owner of Mortgage Master to complete the funding and sale of IRLCs and LHFS that the Company did not acquire under the APA, as well as other administrative activities associated with the former owner of Mortgage Master. Such services primarily consisted of personnel related costs. Total transitional services income from this agreement totaled $0.7 million for the six months ended June 30, 2015.
imortgage entered into a software licensing agreement with MTH on August 24, 2000. The terms of the agreement allows MTH to use the software of imortgage to help in the origination of mortgage applications. There is no fee for this agreement. The agreement was assigned to the Company as a part of the acquisition of imortgage.
As of June 30, 2015, the Company has a receivable from one of its owners for certain expenses totaling $0.2 million, which is included in accounts receivable, net. The Company provides loans to its employees at market terms.
The Company paid travel and promotional fees of $0.3 million to an entity controlled by a Unitholder of the Company during the six months ended June 30, 2015. The Company paid management fees of $0.2 million to a Unitholder of the Company during the six months ended June 30, 2015. The Company employed certain employees that provided services to a Unitholder whose salaries totaled $0.1 million for the six months ended June 30, 2015. The Company granted 86,362,745 fully vested Class X Common Units with an estimated fair value of $0.4 million to an entity controlled by a Unitholder during the six months ended June 30, 2015.
NOTE 19—REDEEMABLE UNITS AND UNITHOLDERS’ EQUITY
Class I, A, B, P, P-2 and Z-1 Redeemable Units were classified outside of permanent equity and within temporary equity due to their associated redemption features and liquidation preferences.
Class A Common Units
Class A Common Units are voting Units and holders are entitled to one vote per Class A Common Unit, unless designated as non-voting upon grant. Class A Common Units have a liquidation preference, equal to the
F-37
Table of Contents
aggregate Capital Contribution made for the Class A Common Units, over all other common unit classes except classes I, J and K. As of June 30, 2015 the liquidation preference of the Class A Common Units was $26.9 million. There were 269,000 Class A Common Units authorized and outstanding as of June 30, 2015.
Class B Common Units
Class B Common Units have no voting rights. Class B Common Units have a liquidation preference subordinate to Class A Common Units. As of June 30, 2015 the liquidation preference of the Class B Common Units was $5.0 million. There were 50,000 Class B Common Units authorized and outstanding as of June 30, 2015.
Class P Common Units
Class P Common Units have no voting rights. Class P Common Units have a liquidation preference subordinate to Class B Common Units and are pari passu with the Class P-2 Common Units described below. These Class P Common Units carry a liquidation preference of $12.5 million. There were 12,500 Class P Common Units authorized and outstanding as of June 30, 2015. Class P Common Unitholders have the right to receive distributions equal to the liquidation preference pari passu with the Class P-2 Common Units once the Class A and Class B Common Unitholders have received distributions equal to 1.5 times the amount contributed by the Class A and Class B Common Unitholders. Then, subsequent to the distributions to the Class A, Class B and Class Z-1 Common Units (as described below), the Class P Common Unitholders have the right to receive distributions, to the extent distributions are authorized by the board of directors, equal to the greater of (a) 225% of the amount contributed by the Class P Common Unitholders or (b) a 20% per annum return on the amount contributed by the Class P Common Unitholders. Upon the sale of the Company, the Class P Common Unitholders have the right to increase this distribution based upon a formula described in the LLC Agreement. Upon an initial public offering (“IPO”), the Class P Common Unitholders have the right to have the Company redeem the Class P Common Units at a redemption price equal to the distributions that the Class P Common Unitholder would receive from the IPO. The holders of the Class P Common Units also have the right to convert the Class P Common Units to the common shares sold in the IPO at a price equal to 87.5% of the public offering price. The Company also has the right, upon an IPO, to obligate the conversion of the Class P Common Units into common shares sold in the IPO.
Class P-2 Common Units
Class P-2 Common Units have no voting rights. Class P-2 Common Units have a liquidation preference subordinate to Class B Common Units and are pari passu with the Class P Common Units described above. These Class P-2 Common Units carry a liquidation preference of $20.0 million. There were 20,000 Class P-2 Common Units authorized and outstanding as of June 30, 2015. Class P-2 Common Unitholders have the right to receive distributions equal to the liquidation preference pari passu with the Class P Common Units once the Class A and Class B Common Unitholders have received distributions equal to 1.5 times the amount contributed by the Class A and Class B Common Unitholders. Then, subsequent to the distributions to the Class A, Class B and Class Z-1 Common Units (as described below), the Class P-2 Common Unitholders have the right to receive distributions, to the extent distributions are authorized by the board of directors, equal to the greater of (a) 125% of the amount contributed by the Class P-2 Common Unitholders if the Company successfully completes an IPO during 2015 or the Company meets or exceeds the 2015 operating budget metric of $110.0 million pre-tax, net income or (b) 165% if the Company does not complete an IPO during 2015 or meet or exceed the 2015 operating budget metric of $110 million pre-tax, net income or (c) a 20% per annum return on the amount contributed by the Class P-2 Common Unitholders. Upon the sale of the Company, the Class P-2 Common Unitholders have the right to increase this distribution based upon a formula described in the LLC Agreement. Upon an IPO, the Class P-2 Common Unitholders have the right to have the Company redeem the Class P-2 Common Units at a redemption price equal to the distributions that the Class P-2 Common Unitholder would receive from the IPO. The holders of the Class P-2 Common Units also have the right to convert the Class P-2 Common Units to the
F-38
Table of Contents
common shares sold in the IPO at a price equal to 87.5% of the public offering price. The Company also has the right, upon an IPO, to obligate the conversion of the Class P-2 Common Units into common shares sold in the IPO.
Class I Common Units
Class I Common Units have no voting rights. A total of 1,190,093 Class I Common Units were authorized, issued and outstanding as of June 30, 2015. The Class I Common Unitholders will receive distributions based upon the imortgage Division Economic Balance of the imortgage division, as defined in the loanDepot LLC Agreement. The Class I Common Unitholders have the right to receive 65% of the imortgage Division Economic Balance for the first $66.7 million. Thereafter, the Class I Common Unitholders receive 50% of the imortgage Division Economic Balance earned by the imortgage division. The Company is required to make regular distributions of this amount on a monthly, quarterly and annual basis to an escrow account for the estimated amounts to be distributed to the Class I Common Unitholders. In the event that those distributions are not made, the Class I Common Units earn interest of the undistributed amount at a rate of 12% per annum.
Class J and Class K Common Units
Holders of Class J and Class K Common Units are eligible to receive distributions, in a proportionate share with Class I Common Units, subject to certain return thresholds as defined and set forth in the corresponding grant, purchase or other agreement pursuant to which such Class J and Class K Common Units were issued. There were no Class J or Class K Common Units grants as of June 30, 2015.
Class Z, Class Y, Class X and Class W Common Units
Class Z, Class Y, Class X and Class W Common Units have no voting rights and may be issued to existing or new employees, officers, directors, consultants or other service providers of the Company or any of its subsidiaries. Holders of Class Z, Class Y, Class X and Class W Common Units are eligible to receive distributions, in a proportionate share with Class A Common Units and Class B Common Units, subject to certain return thresholds as defined and set forth in the corresponding grant, purchase or other agreement pursuant to which such Class Z, Class Y, Class X, and Class W Common Units were issued.
The Company has granted the following Class Z, Class Y, Class X, and Class W Common Units:
| • | Class Z-1 Common Units: Holders of Class Z-1 Common Units are not eligible to receive distributions until distributions have been made to the holders of Class P and P-2 Common Units have received distributions equal to the liquidation preference of the Class P and P-2 Common Units (“Class Z-1 Minimum Threshold”). Once the Class Z-1 Minimum Threshold is reached, the holders of Class Z-1 Common Units will share in distributions with Class A Common Unit and Class B Common Unitholders at a ratio of 85% Class A and Class B Common Unit and 15% Class Z-1 Common Units until the Class A Common Unit and Class B Common Unitholders receive distributions equal to 2.5 times the aggregate capital contribution made for said Common Units (“Class Z-1 Maximum Threshold”). No further distributions will be made to the holders of Class Z-1 Common Units once the Class Z-1 Maximum Threshold is reached. As of June 30, 2015, the Company has granted 44,502 of Class Z-1 Common Units and an additional 4,380 of Class Z-1 Common Units are held in reserve for future issuance. There were 48,882 Class Z-1 Common Units authorized as of June 30, 2015. |
| • | Class Z-2 Common Units: Holders of Class Z-2 Common Units are not eligible to receive distributions until all distributions have been made to the holders of Class P and P-2 Common Units and holders of Class Z-1 Common Units have received their distributions as described above (“Class Z-2 Minimum Threshold”). Once the Class Z-2 Minimum Threshold is reached, the holders of Class Z-2 Common Units will share in distributions with Class A Common Unit and Class B Common Unitholders at a ratio of 75% Class A and Class B Common Unit and 25% Class Z-2 Common Units until the Class A Common Unit and Class B Common Unitholders receive distributions equal to 3.5 times the aggregate |
F-39
Table of Contents
| capital contribution made for said Common Units (“Class Z-2 Maximum Threshold”). No further distributions will be made to the holders of Class Z-2 Common Units once the Class Z-2 Maximum Threshold is reached. As of June 30, 2015 the Company has granted 83,189 of Class Z-2 Common Units and an additional 9,144 of Class Z-2 Common Units are held in reserve for future issuance. There were 92,333 Class Z-2 Common Units authorized as of June 30, 2015. |
| • | Class Z-3 Common Units: Holders of Class Z-3 Common Units are not eligible to receive distributions until distributions have been made to the holders of Class A Common Units and Class B Common Units equal to 3.5 times the aggregate capital contribution made in exchange for the Class A Common Units and Class B Common Units (“Class Z-3 Minimum Threshold”). Once the Class Z-3 Minimum Threshold is reached, the holders of Class Z-3 Common Units will share in distributions with Class A Common Unit and Class B Common Unitholders at a ratio of 65% Class A and Class B Common Unit and 35% Class Z-3 Common Units until the Class A Common Unit and Class B Common Unitholders receive distributions equal to 4.5 times the aggregate capital contribution made for said Common Units (“Class Z-3 Maximum Threshold”). No further distributions will be made to the holders of Class Z-3 Common Units once the Class Z-3 Maximum Threshold is reached. As of June 30, 2015, the Company has granted 133,789 of Class Z-3 Common Units and an additional 15,365 of Class Z-3 Common Units are held in reserve for future issuance. There were 149,154 Class Z-3 Common Units authorized as of June 30, 2015. |
| • | Class Z-4, Class Y, Class X, and Class W Common Units: Holders of Class Z-4 and Class Y Common Units are not eligible to receive distributions until distributions have been made to the holders of Class A Common Units and Class B Common Units equal to 4.5 times the aggregate capital contribution made in exchange for the Class A Common Units and Class B Common Units (“Class Z-4 Minimum Threshold”). Once the Class Z-4 Minimum Threshold is reached, the holders of Class Z-4 and Class Y Common Units will share in distributions with Class A Common Unit and Class B Common Unitholders at a ratio of 50% Class A and Class B Common Unit and 50% Class Z-4 and Class Y Common Units until the Class A and Class B Common Unitholders receive distributions equal to 8.0 times the aggregate capital contributions made for said Common Units. |
Then, the holders of Class Z-4, Class Y and Class X Common Units will share in distributions with Class A Common Units and Class B Common Unitholders at a ratio of 50% Class A and Class B Common Units and 50% Class Z-4, Class Y and Class X Common Units until the Class A and Class B Common Unitholders receive distributions equal to 14.265 times the aggregate capital contributions made for said Common Units.
Then, the holders of Class W will share in distributions with Class A Common Unit and Class B Common Unitholders at a ratio of 50% Class A and Class B Common Unit and 50% Class W Common Units until the Class W holders have received $2 million.
Then, the holders of Class Z-4, Class Y and Class X Common Units will share in distributions with Class A Common Unit and Class B Common Unitholders at a ratio of 50% Class A and Class B Common Unit and 50% Class Z-4, Class Y and Class X Common Units.
| • | As of June 30, 2015 the Company has granted 268,239 of Class Z-4 Common Units and an additional 8,761 of Class Z-4 Common Units are held in reserve for future issuance. There were 277,000 Class Z-4 Common Units authorized as of June 30, 2015. As of June 30, 2015 the Company has granted 14,567 of Class Y Common Units and an additional 26,824 of Class Y Common Units are held in reserve for future issuance. There were 41,391 Class Y Common Units authorized as of June 30, 2015. As of June 30, 2015 the Company has authorized, issued and granted 3,023,062,840 of Class X Common Units and no additional Class X Common Units are held in reserve for future issuance. As of June 30, 2015 the Company has authorized, issued and granted 10,000 of Class W Common Units and no additional Class W Common Units are held in reserve for future issuance. |
F-40
Table of Contents
All classes of units are entitled to receive distributions equal to their estimated tax liability. These distributions have priority over distributive rights granted to any class of units and do not factor into the distributions for the purposes of calculating the minimum thresholds for the Class Z, Class Y, Class X and Class W Common Units. The liability of Unitholders or Members of the LLC Agreement for debts, liabilities and losses of the Company is limited to their share of Company assets.
NOTE 20—EQUITY-BASED COMPENSATION
The Company’s 2009 Incentive Equity Plan provides for the granting of Class Z, Class Y, Class X, and Class W Common Units to employees, managers, consultants and advisors of the Company and its Subsidiaries. The number of Class Z, Class Y, Class X, and Class W Common Units which may be granted or sold under the Plan shall not exceed, in the aggregate, 567,370 Class Z Common Units (of which 48,882 shall be Class Z-1 Common Units and 92,333 shall be Class Z-2 Common Units, 149,154 shall be Class Z-3 Common Units and 277,000 shall be Class Z-4 Common Units) and 41,391 Class Y Common Units; provided that, to the extent any Class Z and Class Y Common Units (i) expire, (ii) are canceled, terminated or forfeited in any manner, or (iii) are repurchased by the Company, then in each case such common Units shall again be available for issuance and sale under the Plan.
Participants receiving grants or purchasing Class Z, Class Y, Class X, or Class W Common Units pursuant to the Plan are required to become a party to the Limited Liability Company Agreement. No Common Units shall be issued after the tenth anniversary of the adoption of the Plan.
During the six months ended June 30, 2015 the Company granted to employees of the Company 2,939,867,828 Class X Common Units.
The unit grants typically vest 20% on the one year anniversary of the grant and 1.667% each month thereafter, and are subject to accelerated vesting upon the sale of the Company.
The following assumptions were used for the grants in the six months ended June 30, 2015:
| Six months ended June 30, 2015 | ||
| Risk-free interest rate |
0.16% - 2.00% | |
| Expected life |
0.78 - 5.00 years | |
| Expected volatility |
25.0% - 40.0% |
The risk-free interest rate is the U.S. Treasury yield curve in effect at the time of grant based on the expected life of the unit grants. The expected life of the units granted represents the period of time the unit grants are expected to be outstanding. The expected volatility is based on the historical volatility of a public peer group of Companies’ stock price in the most recent period that is equal to the expected term of the unit grants being valued.
| Six months ended June 30, 2015 | ||||||||
| Shares | Weighted Average Grant Date Fair Value |
|||||||
| Unvested—beginning of period |
50,307 | $ | 4.750 | |||||
| Granted |
2,939,867,828 | 0.005 | ||||||
| Vested |
(2,085,894,176 | ) | 0.004 | |||||
| Forfeited/Cancelled |
(3,185,376 | ) | (0.006 | ) | ||||
|
|
|
|||||||
| Unvested—end of period |
850,838,583 | 0.010 | ||||||
|
|
|
|||||||
F-41
Table of Contents
The compensation expense associated with the Class Z, Class Y, Class X, and Class W Common Units was $9.4 million for the six months ended June 30, 2015. At June 30, 2015, the total unrecognized compensation cost related to unvested unit grants was $4.6 million. This cost is expected to be recognized over the next 5 years.
NOTE 21—EMPLOYEE BENEFIT PLAN
The Company’s employees are eligible to participate in a defined contribution plan (“401(k) Plan”). The Company matches 50% of participant contributions, up to 6% of each participant’s total eligible gross compensation. Matching contributions totaled approximately $3.7 million for the six months ended June 30, 2015.
NOTE 22—COMMITMENTS AND CONTINGENCIES
Operating Leases
The Company is obligated under various non-cancelable operating leases, which are subject to rent escalation clauses, for its office facilities and equipment that expire at various times through 2023. The following is a schedule of future minimum lease payments for operating leases with initial terms in excess of one year as of June 30, 2015:
| Six months ending December 31, |
||||
| 2015 |
$ | 9,459 | ||
| Year ending December 31, |
||||
| 2016 |
19,014 | |||
| 2017 |
17,167 | |||
| 2018 |
15,755 | |||
| 2019 |
14,280 | |||
| 2020 |
9,863 | |||
| Thereafter |
13,674 | |||
|
|
|
|||
| Total |
$ | 99,212 | ||
|
|
|
|||
The Company recognizes rent expense on a straight-line basis. Rent expense for operating leases was $9.2 million for the six months ended June 30, 2015. Rent expense is included in occupancy expense on the consolidated statement of operations.
Escrow Services
In conducting its operations, the Company, through its wholly-owned subsidiary, LD Escrow, Inc., routinely holds customers’ assets in escrow pending completion of real estate financing transactions. These amounts are maintained in segregated bank accounts and are offset with the related liabilities resulting in no amounts reported in the accompanying consolidated balance sheet. The balances held for the Company’s customers totaled $3.9 million at June 30, 2015. The Company earned $7.8 million in fees from escrow related services for the six months ended June 30, 2015. Escrow fees are included in other income on the consolidated statement of operations.
Legal Proceedings
The Company is a defendant in or a party to a number of legal actions or proceedings that arise in the ordinary course of business. In some of these actions and proceedings, claims for monetary damages are asserted against the Company. In view of the inherent difficulty of predicting the outcome of such legal actions and proceedings, the Company generally cannot predict what the eventual outcome of the pending matters will be, what the timing of the ultimate resolution of these matters will be, or what the eventual loss related to each pending matter may be, if any.
F-42
Table of Contents
The Company seeks to resolve all litigation and regulatory matters in the manner management believes is in the best interest of the Company and contests liability, allegations of wrongdoing and, where applicable, the amount of damages or scope of any penalties or other relief sought as appropriate in each pending matter. On at least a quarterly basis, the Company assesses its liabilities and contingencies in connection with outstanding legal and regulatory proceedings utilizing the latest information available. Any estimated loss is subject to significant judgment and is based upon currently available information, a variety of assumptions, and known and unknown uncertainties. Where available information indicates that it is probable a liability has been incurred and the Company can reasonably estimate the amount of the loss, an accrued liability is established. The actual costs of resolving these proceedings may be substantially higher or lower than the amounts accrued.
Based on the Company’s current understanding of these pending legal actions and proceedings, management does not believe that judgments or settlements arising from pending or threatened legal matters, individually or in the aggregate, will have a material adverse effect on the consolidated financial position, operating results or cash flows of the Company. However, unfavorable resolution could affect the consolidated financial position, results of operations or cash flows for the years in which they are resolved.
Regulatory Requirements
The Company is subject to various capital requirements by the U.S. Department of Housing and Urban Development (“HUD”); lenders of the warehouse lines of credit; and secondary markets investors. Failure to maintain minimum capital requirements could result in the inability to participate in HUD-assisted mortgage insurance programs, to borrow funds from warehouse line lenders or to sell or service mortgage loans. As of June 30, 2015, the Company was in compliance with its selling and servicing capital requirements.
Commitments to Extend Credit
The Company enters into IRLCs with customers who have applied for residential mortgage loans and meet certain credit and underwriting criteria. These commitments expose the Company to market risk if interest rates change and the loan is not economically hedged or committed to an investor. The Company is also exposed to credit loss if the loan is originated and not sold to an investor and the customer does not perform. The collateral upon extension of credit typically consists of a first deed of trust in the mortgagor’s residential property. Commitments to originate loans do not necessarily reflect future cash requirements as some commitments are expected to expire without being drawn upon. Total commitments to originate loans as of June 30, 2015 approximated $4.8 billion. These loan commitments are treated as derivatives and are carried at fair value (See Note 9—Derivative Financial Instruments and Hedging Activities).
Loan Loss Obligation for Sold Loans
When the Company sells mortgage loans, it makes customary representations and warranties to the purchasers about various characteristics of each loan such as the origination and underwriting guidelines, including but not limited to the validity of the lien securing the loan, property eligibility, borrower credit, income and asset requirements, and compliance with applicable federal, state and local law. The Company’s whole loan sale agreements generally require it to repurchase loans if the Company breached a representation or warranty given to the loan purchaser.
The Company’s loan loss obligation for sold loans is reflected in accrued expenses and other liabilities. For the six months ended June 30, 2015, the Company refunded premiums of $0.2 million related to early payoffs. There have been losses of $0.4 million associated with early payment defaults or losses related to representations, warranties and other provisions for the six months ended June 30, 2015.
F-43
Table of Contents
The activity related to the loan loss obligation for sold loans for the six months ended June 30, 2015 is as follows:
| For the six months ended June 30, 2015 |
||||
| Balance at beginning of period |
$ | 10,382 | ||
| Provision for loan losses |
4,719 | |||
| Payments, realized losses and other |
(566 | ) | ||
|
|
|
|||
| Balance at end of period |
$ | 14,535 | ||
|
|
|
|||
NOTE 23—SUBSEQUENT EVENTS
Following the Company’s acquisition of imortgage on October 1, 2013, disagreements arose among the Company, the former stockholders of imortgage (“imortgage Stockholders”) and Unitholders of the Company with respect to the interpretation of certain provisions of the Fifth Amended and Restated LLC Agreement relating to amounts payable to the Class I common units in connection with an initial public offering (“IPO”). In particular, in connection with an IPO, the imortgage Stockholders believed that they were entitled to a percentage of the overall value of the Company based on the earnings from the imortgage division relative to the overall earnings of the Company. The Company and the Unitholders of the Company believed that the imortgage Stockholders were entitled to a percentage of the net proceeds from an IPO based on the earnings from the imortgage division relative to the overall earnings of the Company. In order to eliminate uncertainty and resolve all disagreements, the parties agreed to eliminate the potential variable nature of the formula specified in the Fifth Amended and Restated LLC Agreement and amend the formula to provide for a fixed amount which reflects the mutual intent of the parties with respect to the provisions that had been in dispute.
On August 25, 2015, the Company entered into a warehouse line of credit with a lender providing a $100.0 million line of credit. The base interest rate is 30 day LIBOR plus 2.50% and expires August 23, 2016.
F-44
Table of Contents
REPORT OF INDEPENDENT REGISTERED PUBLIC ACCOUNTING FIRM
Board of Directors and Members
loanDepot.com, LLC
We have audited the accompanying consolidated balance sheets of loanDepot.com, LLC and subsidiary (the “Company”) as of December 31, 2014 and 2013, and the related consolidated statements of operations, unitholders’ equity, and cash flows for the years then ended, and the related notes to the financial statements. These financial statements are the responsibility of the Company’s management. Our responsibility is to express an opinion on these financial statements based on our audits.
We conducted our audits in accordance with the standards of the Public Company Accounting Oversight Board (United States). Those standards require that we plan and perform the audit to obtain reasonable assurance about whether the financial statements are free of material misstatement. We were not engaged to perform an audit of the Company’s internal control over financial reporting. Our audits included consideration of internal control over financial reporting as a basis for designing audit procedures that are appropriate in the circumstances, but not for the purpose of expressing an opinion on the effectiveness of the Company’s internal control over financial reporting. Accordingly, we express no such opinion. An audit also includes examining, on a test basis, evidence supporting the amounts and disclosures in the financial statements, assessing the accounting principles used and significant estimates made by management, as well as evaluating the overall financial statement presentation. We believe that our audits provide a reasonable basis for our opinion.
In our opinion, the consolidated financial statements referred to above present fairly, in all material respects, the financial position of loanDepot.com, LLC and subsidiary as of December 31, 2014 and 2013, and the results of their operations and their cash flows for the years then ended in conformity with accounting principles generally accepted in the United States of America.
/s/ GRANT THORNTON LLP
Irvine, California
August 31, 2015
F-45
Table of Contents
loanDepot.com, LLC and Subsidiary
CONSOLIDATED BALANCE SHEETS
December 31,
| 2014 | 2013 | |||||||
| ASSETS |
||||||||
| Cash and cash equivalents |
$ | 28,636,542 | $ | 40,885,332 | ||||
| Restricted cash |
9,099,059 | 17,661,552 | ||||||
| Accounts receivable, net |
18,758,557 | 12,750,203 | ||||||
| Loans held for sale, at fair value |
1,004,194,757 | 741,508,910 | ||||||
| Derivative assets, at fair value |
52,851,440 | 44,572,070 | ||||||
| Servicing rights, at fair value |
138,836,689 | 93,823,253 | ||||||
| Property and equipment, net |
36,285,520 | 26,994,903 | ||||||
| Prepaid expenses and other assets |
10,362,353 | 6,736,166 | ||||||
| Loans eligible for repurchase |
39,839,967 | 5,310,865 | ||||||
| Investments in joint ventures |
16,790,640 | 18,063,633 | ||||||
| Goodwill |
10,882,511 | 10,882,511 | ||||||
| Intangible assets, net |
3,817,500 | 4,147,500 | ||||||
|
|
|
|
|
|||||
| Total assets |
$ | 1,370,355,535 | $ | 1,023,336,898 | ||||
|
|
|
|
|
|||||
| LIABILITIES, REDEEMABLE UNITS AND UNITHOLDERS’ EQUITY |
||||||||
| Warehouse lines of credit |
$ | 938,617,395 | $ | 697,755,678 | ||||
| Accounts payable and accrued expenses |
80,944,676 | 63,568,749 | ||||||
| Derivative liabilities, at fair value |
7,589,782 | 199,117 | ||||||
| Member distributions payable |
— | 7,089,237 | ||||||
| Liability for loans eligible for repurchase |
39,839,967 | 5,310,865 | ||||||
| Capital lease obligations |
11,170,672 | 6,104,233 | ||||||
| Debt obligations |
103,000,000 | 80,000,000 | ||||||
|
|
|
|
|
|||||
| Total liabilities |
1,181,162,492 | 860,027,879 | ||||||
| Commitments and contingencies (Note Q) |
||||||||
| Redeemable units: |
||||||||
| Class I Units (par value $18.7 million at December 31, 2014 and 2013; 1,190,093 units authorized and issued/outstanding at December 31, 2014 and 2013) |
24,824,694 | 19,924,522 | ||||||
| Class A Units (par value $26.9 million; 269,000 units authorized and issued/outstanding at December 31, 2014 and 2013) |
26,900,000 | 26,900,000 | ||||||
| Class B Units (par value $5.0 million; 50,000 units authorized and issued/outstanding at December 31, 2014 and 2013) |
5,000,000 | 5,000,000 | ||||||
| Class P Units (par value $12.5 million; 12,500 units authorized at December 31, 2014 and 2013; 12,500 units and 12,500 units issued/outstanding at December 31, 2014 and 2013) |
12,500,000 | 12,199,000 | ||||||
| Class Z-1 Units (no par value; 48,882 units authorized at December 31, 2014 and 2013; 44,991 units and 45,734 units issued/outstanding at December 31, 2014 and 2013) |
— | — | ||||||
|
|
|
|
|
|||||
| Total redeemable units |
69,224,694 | 64,023,522 | ||||||
| Unitholders’ equity: |
||||||||
| Class Z-2 Units (no par value; 92,333 units authorized at December 31, 2014 and 2013; 84,113 units and 86,386 units issued/outstanding at December 31, 2014 and 2013) |
— | — | ||||||
| Class Z-3 Units (no par value; 149,154 units authorized at December 31, 2014 and 2013; 135,280 units and 139,546 units issued/ outstanding at December 31, 2014 and 2013) |
— | — | ||||||
| Class Z-4 Units (no par value; 277,000 units authorized at December 31, 2014 and 2013; 269,624 units and 274,080 units issued/outstanding at December 31, 2014 and 2013) |
— | — | ||||||
| Class Y Units (no par value; 41,391 units authorized at December 31, 2014 and 2013; 15,439 units and 27,267 units issued/outstanding at December 31, 2014 and 2013) |
— | — | ||||||
| Class W Units (no par value; 10,000 units authorized and issued/outstanding at December 31, 2014 and 2013) |
— | — | ||||||
| Class X Units (no par value; 16,184 units and 320 units authorized and issued/outstanding at December 31, 2014 and 2013) |
— | — | ||||||
| Additional paid-in capital |
1,821,345 | 1,459,009 | ||||||
| Retained earnings |
118,147,004 | 97,826,488 | ||||||
|
|
|
|
|
|||||
| Total unitholders’ equity |
119,968,349 | 99,285,497 | ||||||
|
|
|
|
|
|||||
| Total liabilities, redeemable units and unitholders’ equity |
$ | 1,370,355,535 | $ | 1,023,336,898 | ||||
|
|
|
|
|
|||||
The accompanying notes are an integral part of these statements.
F-46
Table of Contents
loanDepot.com, LLC and Subsidiary
CONSOLIDATED STATEMENTS OF OPERATIONS
Year ended December 31,
| 2014 | 2013 | |||||||
| REVENUES: |
||||||||
| Interest income |
$ | 34,416,048 | $ | 18,902,204 | ||||
| Interest expense |
(19,966,356 | ) | (12,692,263 | ) | ||||
|
|
|
|
|
|||||
| Net interest income |
14,449,692 | 6,209,941 | ||||||
| Gain on origination and sale of loans, net |
435,461,510 | 246,477,565 | ||||||
| Origination income, net |
75,064,114 | 51,994,760 | ||||||
| Servicing income |
28,517,198 | 12,913,752 | ||||||
| Servicing (losses) gains |
(26,521,703 | ) | 10,667,339 | |||||
| Other income |
17,504,341 | 10,232,174 | ||||||
|
|
|
|
|
|||||
| Total net revenues |
544,475,152 | 338,495,531 | ||||||
| EXPENSES: |
||||||||
| Personnel expense |
293,551,908 | 153,179,177 | ||||||
| Marketing and advertising expense |
93,906,211 | 51,265,362 | ||||||
| Direct origination expense |
43,892,859 | 22,906,625 | ||||||
| General and administrative expense |
44,069,529 | 17,769,380 | ||||||
| Occupancy expense |
15,082,645 | 5,716,119 | ||||||
| Depreciation and amortization |
11,692,252 | 5,777,602 | ||||||
| Subservicing expense |
11,156,933 | 6,883,559 | ||||||
| Other interest expense |
8,929,565 | 1,967,202 | ||||||
|
|
|
|
|
|||||
| Total expenses |
522,281,902 | 265,465,026 | ||||||
|
|
|
|
|
|||||
| Income before income taxes |
22,193,250 | 73,030,505 | ||||||
| Provision for income taxes |
509,120 | 772,715 | ||||||
|
|
|
|
|
|||||
| Net income |
$ | 21,684,130 | $ | 72,257,790 | ||||
|
|
|
|
|
|||||
The accompanying notes are an integral part of these statements.
F-47
Table of Contents
loanDepot.com, LLC and Subsidiary
CONSOLIDATED STATEMENT OF UNITHOLDERS’ EQUITY
For the two years ended December 31, 2014
| Class Z-2 | Class Z-3 | Class Z-4 | Class Y | Class W | Class X | Additional paid-in capital |
Retained Earnings |
Total | ||||||||||||||||||||||||||||||||||||||||||||||||||||
| Shares | Amount | Shares | Amount | Shares | Amount | Shares | Amount | Shares | Amount | Shares | Amount | |||||||||||||||||||||||||||||||||||||||||||||||||
| Balance at 12/31/12 |
88,332 | $ | — | 142,691 | $ | — | 277,000 | $ | — | 13,800 | $ | — | — | $ | — | — | $ | — | $ | 1,072,281 | $ | 38,562,825 | $ | 39,635,106 | ||||||||||||||||||||||||||||||||||||
| Issuances |
— | — | — | — | — | — | 16,178 | — | 10,000 | — | 320 | — | — | — | — | |||||||||||||||||||||||||||||||||||||||||||||
| Repurchase |
(415 | ) | — | (672 | ) | — | (624 | ) | — | — | — | — | — | — | — | — | — | — | ||||||||||||||||||||||||||||||||||||||||||
| Forfeitures |
(1,531 | ) | — | (2,473 | ) | — | (2,296 | ) | — | (2,711 | ) | — | — | — | — | — | — | — | — | |||||||||||||||||||||||||||||||||||||||||
| Contributed capital from members |
— | — | — | — | — | — | — | — | — | — | — | — | — | — | — | |||||||||||||||||||||||||||||||||||||||||||||
| Equity-based compensation |
— | — | — | — | — | — | — | — | — | — | — | — | 386,728 | — | 386,728 | |||||||||||||||||||||||||||||||||||||||||||||
| Distribution to members |
— | — | — | — | — | — | — | — | — | — | — | — | — | (12,994,127 | ) | (12,994,127 | ) | |||||||||||||||||||||||||||||||||||||||||||
| Net income |
— | — | — | — | — | — | — | — | — | — | — | — | — | 72,257,790 | 72,257,790 | |||||||||||||||||||||||||||||||||||||||||||||
|
|
|
|
|
|
|
|
|
|
|
|
|
|
|
|
|
|
|
|
|
|
|
|
|
|
|
|
|
|
|
|||||||||||||||||||||||||||||||
| Balance at 12/31/13 |
86,386 | $ | — | 139,546 | $ | — | 274,080 | $ | — | 27,267 | $ | — | 10,000 | $ | — | 320 | $ | — | $ | 1,459,009 | $ | 97,826,488 | $ | 99,285,497 | ||||||||||||||||||||||||||||||||||||
|
|
|
|
|
|
|
|
|
|
|
|
|
|
|
|
|
|
|
|
|
|
|
|
|
|
|
|
|
|
|
|||||||||||||||||||||||||||||||
| Issuances |
958 | — | 954 | — | 391 | — | — | — | — | — | 15,864 | — | — | — | — | |||||||||||||||||||||||||||||||||||||||||||||
| Repurchase |
(2,154 | ) | — | (3,481 | ) | — | (3,232 | ) | — | (2,563 | ) | — | — | — | — | — | — | (715,000 | ) | (715,000 | ) | |||||||||||||||||||||||||||||||||||||||
| Forfeitures |
(1,077 | ) | — | (1,739 | ) | — | (1,615 | ) | — | (9,265 | ) | — | — | — | — | — | — | — | — | |||||||||||||||||||||||||||||||||||||||||
| Contributed capital from members |
— | — | — | — | — | — | — | — | — | — | — | — | — | 465,000 | 465,000 | |||||||||||||||||||||||||||||||||||||||||||||
| Equity-based compensation |
— | — | — | — | — | — | — | — | — | — | — | — | 362,336 | — | 362,336 | |||||||||||||||||||||||||||||||||||||||||||||
| Distribution to members |
— | — | — | — | — | — | — | — | — | — | — | — | — | (1,113,614 | ) | (1,113,614 | ) | |||||||||||||||||||||||||||||||||||||||||||
| Net income |
— | — | — | — | — | — | — | — | — | — | — | — | — | 21,684,130 | 21,684,130 | |||||||||||||||||||||||||||||||||||||||||||||
|
|
|
|
|
|
|
|
|
|
|
|
|
|
|
|
|
|
|
|
|
|
|
|
|
|
|
|
|
|
|
|||||||||||||||||||||||||||||||
| Balance at 12/31/14 |
84,113 | $ | — | 135,280 | $ | — | 269,624 | $ | — | 15,439 | $ | — | 10,000 | $ | — | 16,184 | $ | — | $ | 1,821,345 | $ | 118,147,004 | $ | 119,968,349 | ||||||||||||||||||||||||||||||||||||
|
|
|
|
|
|
|
|
|
|
|
|
|
|
|
|
|
|
|
|
|
|
|
|
|
|
|
|
|
|
|
|||||||||||||||||||||||||||||||
The accompanying notes are an integral part of this statement.
F-48
Table of Contents
loanDepot.com, LLC and Subsidiary
CONSOLIDATED STATEMENTS OF CASH FLOWS
Year ended December 31,
| 2014 | 2013 | |||||||
| CASH FLOWS FROM OPERATING ACTIVITIES |
||||||||
| Net income from operations |
$ | 21,684,130 | $ | 72,257,790 | ||||
| Adjustments to reconcile net income from operations to net cash used in operating activities: |
||||||||
| Depreciation and amortization expense |
11,692,254 | 5,777,602 | ||||||
| Gain on origination and sale of mortgage loans |
(418,752,926 | ) | (239,412,368 | ) | ||||
| Loss on sale of servicing rights |
848,325 | — | ||||||
| Provision for loan loss obligation on sold loans |
2,557,141 | 3,111,986 | ||||||
| Fair value change in derivative assets |
(2,017,424 | ) | (12,874,179 | ) | ||||
| Fair value change in derivative liabilities |
7,390,665 | (1,049,797 | ) | |||||
| Premium paid on derivatives |
(6,261,945 | ) | — | |||||
| Fair value change in loans held for sale |
(23,543,922 | ) | 4,536,538 | |||||
| Fair value change attributable to imortgage transition pipeline |
1,240,966 | (1,364,599 | ) | |||||
| Fair value change in servicing rights |
25,983,277 | (10,667,339 | ) | |||||
| Equity compensation |
5,262,508 | 1,611,771 | ||||||
| Originations of mortgage loans |
(13,125,675,138 | ) | (8,366,889,740 | ) | ||||
| Proceeds from sales of mortgage loans |
13,162,459,808 | 8,326,957,407 | ||||||
| Proceeds from principal payments |
8,795,173 | 6,761,246 | ||||||
| Payments to (recoveries from) investors for loan losses |
(586,842 | ) | 134,146 | |||||
| Changes in operating assets and liabilities: |
||||||||
| Change in restricted cash |
8,562,492 | (18,923,718 | ) | |||||
| Other changes in operating assets and liabilities |
5,806,382 | 12,950,217 | ||||||
|
|
|
|
|
|||||
| Net cash used in operating activities |
(314,555,076 | ) | (217,083,037 | ) | ||||
|
|
|
|
|
|||||
| CASH FLOWS FROM INVESTING ACTIVITIES |
||||||||
| Purchase of property and equipment |
(18,003,018 | ) | (11,671,524 | ) | ||||
| Proceeds from sale of servicing rights |
61,224,169 | — | ||||||
| Purchase of servicing rights |
(279,016 | ) | — | |||||
| Disbursements from joint ventures |
1,272,993 | (2,053,756 | ) | |||||
| Acquisition of imortgage |
— | (20,300,637 | ) | |||||
|
|
|
|
|
|||||
| Net cash flows provided by (used in) investing activities |
44,215,128 | (34,025,917 | ) | |||||
|
|
|
|
|
|||||
| CASH FLOWS FROM FINANCING ACTIVITIES |
||||||||
| Proceeds from borrowings on warehouse lines of credit |
$ | 12,887,090,598 | $ | 8,134,344,892 | ||||
| Repayment of borrowings on warehouse lines of credit |
(12,646,228,881 | ) | (7,931,659,680 | ) | ||||
| Proceeds from debt obligations |
23,000,000 | 95,000,000 | ||||||
| Proceeds from sale-leaseback transactions |
7,199,580 | 3,248,314 | ||||||
| Payments on capital lease obligation |
(4,818,288 | ) | (1,878,701 | ) | ||||
| Contributed capital from members |
766,000 | 12,199,000 | ||||||
| Payments on repurchase of units |
(715,000 | ) | — | |||||
| Distributions to members |
(8,202,851 | ) | (31,904,889 | ) | ||||
|
|
|
|
|
|||||
| Net cash provided by financing activities |
258,091,158 | 264,348,936 | ||||||
|
|
|
|
|
|||||
| Net change in cash and cash equivalents |
(12,248,790 | ) | 13,239,982 | |||||
|
|
|
|
|
|||||
| Cash and cash equivalents at beginning of the period |
40,885,332 | 27,645,350 | ||||||
|
|
|
|
|
|||||
| Cash and cash equivalents at end of the period |
$ | 28,636,542 | $ | 40,885,332 | ||||
|
|
|
|
|
|||||
| SUPPLEMENTAL DISCLOSURES OF CASH FLOW INFORMATION |
||||||||
| Cash paid during the period for: |
||||||||
| Interest |
$ | 492,695 | $ | 14,691,634 | ||||
| Income taxes |
509,120 | 772,715 | ||||||
| SUPPLEMENTAL DISCLOSURES OF NONCASH INVESTING AND FINANCING ACTIVITIES |
||||||||
| Purchase of equipment under capital leases |
$ | 2,685,147 | $ | 3,447,291 | ||||
| Distributions declared but not paid |
— | 7,089,237 | ||||||
The accompanying notes are an integral part of these statements.
F-49
Table of Contents
loanDepot.com, LLC and Subsidiary
NOTES TO CONSOLIDATED FINANCIAL STATEMENTS
loanDepot.com, LLC (“loanDepot” or the “Company”), was formed as a California corporation on April 1, 2009. Pursuant to reorganization through merger, the Company became a limited liability company shortly thereafter. The Company operates under the loanDepot.com, LLC Fourth Amended and Restated Limited Liability Company Agreement (the “LLC Agreement”).
loanDepot.com engages in the originating, financing and selling of mortgage loans secured by residential real estate and derives income primarily from fees charged for services related to the origination of mortgage loans, gains from the subsequent sale of the loans to investors, and income from loan servicing.
NOTE B—SUMMARY OF SIGNIFICANT ACCOUNTING POLICIES
A description of the Company’s significant accounting policies applied in the preparation of the accompanying consolidated financial statements follows.
Basis of Presentation
The Company’s consolidated financial statements have been prepared in conformity with accounting principles generally accepted in the United States of America (“GAAP”) as codified in the Financial Accounting Standards Board’s (“FASB”) Accounting Standards Codification (the “Codification”).
Principles of Consolidation
The consolidated financial statements include the accounts of loanDepot and its wholly-owned subsidiary (LD Escrow, Inc.). Entities in which the Company does not have a controlling financial interest, including variable interest entities (“VIEs”) where the Company has determined that it is not the primary beneficiary, are not consolidated. Intercompany accounts and transactions have been eliminated.
Equity Method of Accounting
Joint ventures that are not consolidated, but over which the Company exercises significant influence, are accounted for under the equity method of accounting. Whether or not the Company exercises significant influence with respect to a joint venture depends on an evaluation of several factors including ownership level which is generally a 20% to 50% ownership interest in the joint venture. Under the equity method of accounting, the joint venture’s accounts are not reflected within the Company’s consolidated balance sheets and statements of operations. However, the Company’s share of the earnings or losses of the joint venture is reflected in other income. The Company’s carrying values in equity method joint ventures is reflected in Investments in joint ventures.
When the Company’s carrying value in an equity method joint venture is reduced to zero, no further losses are recorded in the Company’s consolidated financial statements unless the Company guaranteed obligations of the joint venture or has committed additional funding. When the joint venture subsequently reports income, the Company will not record its share of such income until it equals the amount of its share of losses not previously recognized.
Cost Method
Joint ventures not accounted for under the consolidation or the equity method of accounting are accounted for under the cost method of accounting. Under this method, the Company’s share of the earnings or losses of such joint venture is not included in the consolidated balance sheet or statement of operations. However, impairment charges are recognized in the consolidated statement of operations. If circumstances suggest that the value of the joint venture has subsequently recovered, such recovery is not recorded.
F-50
Table of Contents
When a cost method joint venture initially qualifies for use of the equity method, the Company’s carrying value is adjusted for the Company’s share of the past results of the joint venture’s operations. Therefore, prior losses could significantly decrease the Company’s carrying value in that joint venture at that time. The Company currently has no joint ventures recorded under the cost method.
Use of Estimates
The preparation of financial statements in conformity with GAAP requires management to make estimates and assumptions that affect the reported amounts of assets and liabilities and disclosure of contingent assets and liabilities at the date of the financial statements and the reported amounts of income and expenses during the reporting period. Management has made significant estimates in certain areas, including determining the fair value of mortgage loans held for sale, mortgage servicing rights, derivative assets and derivative liabilities, awards granted under the incentive equity plan and determining the loan loss obligation on sold loans. Actual results could differ from those estimates.
Fair Value
Assets and liabilities measured at fair value are categorized based on whether the inputs are observable in the market and the degree that the inputs are observable. The categorization of assets and liabilities measured at fair value within the valuation hierarchy is based on the lowest level of input that is significant to the fair value measurement. The hierarchy is prioritized into three levels (with Level 3 being the lowest) defined as follows:
| • | Level 1—Quoted prices in active markets for identical assets or liabilities that the Company has the ability to access. |
| • | Level 2—Prices determined or determinable using other significant observable inputs. Observable inputs are inputs that other market participants would use in pricing an asset or liability and are developed based on market data obtained from sources independent of the Company. These may include quoted prices for similar assets and liabilities, interest rates, prepayment speeds, credit risk and other inputs. |
| • | Level 3—Prices determined using significant unobservable inputs. In situations where quoted prices or observable inputs are unavailable (for example, when there is little or no market activity), unobservable inputs may be used. Unobservable inputs reflect the Company’s own assumptions about the factors that market participants would use in pricing the asset or liability, and are based on the best information available in the circumstances. |
Mortgage Loans Held for Sale at Fair Value
Management has elected to account for mortgage loans held for sale (“LHFS”) at fair value, with changes in fair value recognized in current period income, to more timely reflect the Company’s performance. All changes in fair value, including changes arising from the passage of time, are recognized as a component of gain on origination and sale of mortgage loans, net. The Company classifies LHFS as “Level 2” fair value financial statement items.
Sale Recognition
The Company recognizes transfers of mortgage loans held for sale as sales when it surrenders control over the mortgage loans. Control over transferred assets is deemed to be surrendered when (i) the assets have been isolated from the Company, (ii) the transferee has the right (free of conditions that constrain it from taking advantage of that right) to pledge or exchange the transferred assets, and (iii) the Company does not maintain effective control over the transferred assets through either (a) an agreement that entitles and obligates the Company to repurchase or redeem them before their maturity or (b) the ability to unilaterally cause the holder to return specific assets.
F-51
Table of Contents
Interest Income Recognition
Interest income on mortgage loans held for sale at fair value is recognized over the life of the loans using their contractual interest rates. Income recognition is suspended for loans when they become 90 days delinquent, or when, in management’s opinion, a full recovery of interest and principal becomes doubtful. Income recognition is resumed when the loan becomes contractually current. When loans are placed on non-accrual status, all interest previously accrued but not collected is reversed against current period interest income. Income on non-accrual loans is subsequently recognized only to extent cash is received. Balances due on loans are written off when deemed uncollectible.
Origination Income (Loss) Recognition
Origination Income (Loss) represents revenue earned from originating mortgage loans. Loan origination and other loan fees generally represent flat, per-loan fee amounts and are recognized as revenue, net of loan origination costs (excluding those direct loan origination costs that are recorded as a component of the recorded investment in mortgage loans held for sale), at the time the loans are funded.
Derivative Financial Instruments
The Company is exposed to price risk related to its mortgage loans held for sale as well as to the commitments it makes to loan applicants to originate loans or to third parties to acquire loans at specified interest rates (“interest rate lock commitments” or “IRLCs”). IRLCs are accounted for as derivative financial instruments. The Company bears price risk from the time a commitment to originate a loan is made to a borrower or to purchase a loan from a third party, to the time the mortgage loan is sold. During this period, the Company is exposed to losses if mortgage interest rates rise, because the value of the IRLC or the mortgage loan held for sale decreases. Reductions in the value of these assets affect income primarily through change in fair value.
The Company manages the risk created by IRLCs and mortgage loans held for sale by entering into forward sale agreements to sell the mortgage loans and by the purchase and sale of mortgage-backed securities (“MBS”) trades and options on Treasury futures. Such agreements are also accounted for as derivative financial instruments. The Company classifies its IRLCs as “Level 3” financial statement items and the derivative financial instruments it acquires to manage the risks created by IRLCs and mortgage loans held for sale as “Level 2” fair value financial statement items. The Company does not use derivative financial instruments for purposes other than in support of its risk management activities.
The Company accounts for its derivative financial instruments as free-standing derivatives. The Company does not designate its derivative financial instruments for hedge accounting. All derivative financial instruments are recognized on the consolidated balance sheet at fair value with changes in the fair values being reported in current period income. Changes in fair value of derivatives hedging IRLCs and mortgage loans held for sale at fair value are included in gain on origination and sale of mortgage loans, net.
The Company has master netting arrangements with certain counterparties of derivative instruments and warehouse lines. Under these master netting arrangements, the Company can offset the fair value of the derivative instrument against the fair value of the LHFS collateralizing the warehouse line, thereby netting the increase or decrease in the fair value of the derivative instruments against the increase or decrease in the fair value of the LHFS. The Company presents the impact of all such arrangements on the associated assets and liabilities on a gross basis in the consolidated balance sheets.
Servicing Rights
MSRs arise from contractual agreements between the Company and investors (or their agents) in mortgage securities and mortgage loans. Under these contracts, the Company is required to perform loan servicing functions in exchange for fees and other remuneration. Servicing functions typically include, among other
F-52
Table of Contents
responsibilities, collecting and remitting loan payments; responding to borrower inquiries; accounting for principal and interest; holding custodial (impound) funds for payment of property taxes and insurance premiums; counseling delinquent mortgagors; supervising the acquisition of real estate in settlement of loans and property disposition. The Company utilizes a sub-servicer to service its mortgage loan servicing portfolio.
When the Company sells a loan on a servicing-retained basis, it recognizes an MSR asset and the gain on the sale of the loan includes the fair value of the MSRs retained in the sale. The gain related to MSRs is recorded to gain on origination and sale of loans, net. The Company has made the irrevocable election to carry its MSRs at fair value.
The value of MSRs is derived from the net positive cash flows associated with the servicing contracts. The Company receives a servicing fee annually on the remaining outstanding principal balances of the mortgage loans subject to the servicing contracts. The servicing fees are collected from the monthly payments made by the mortgagors. The Company is contractually entitled to receive other remuneration including rights to various mortgagor-contracted fees such as late charges, collateral reconveyance charges and loan prepayment penalties, and the Company is generally entitled to retain the interest earned on funds held pending remittance related to its collection of mortgagor payments. The Company also generally has the right to solicit the mortgagors for other products and services as well as for new mortgages for those considering refinancing or purchasing a new home.
The Company is exposed to fair value risk related to its mortgage servicing rights (“MSRs”). MSRs are generally subject to loss in fair value when market mortgage interest rates decrease. Decreasing market mortgage interest rates normally encourage increased mortgage refinancing activity. Increased refinancing activity reduces the life of the loans underlying the MSRs, thereby reducing their value. Reductions in the value of these assets affect income primarily through change in fair value.
The fair value of MSRs is difficult to determine because MSRs are not actively traded in observable stand-alone markets. The Company uses a discounted cash flow approach to estimate the fair value of MSRs. This approach consists of projecting servicing cash flows. The inputs used in the Company’s discounted cash flow model are based on market factors which management believes are consistent with assumptions and data used by market participants valuing similar MSRs. The key inputs used in the valuation of MSRs include mortgage prepayment speeds, cost to service the loans and discount rates. These inputs can, and generally do, change from period to period as market conditions change. Considerable judgment is required to estimate the fair values of MSRs and the exercise of such judgment can significantly affect the Company’s income. Therefore, the Company classifies its MSRs as “Level 3” fair value financial statement items.
Servicing Income
The Company receives servicing income from its servicing portfolio. Servicing income is recognized on an accrual basis and is recorded to mortgage servicing income. The Company’s sub-servicing expenses are recorded to sub-servicing expense. Changes in the fair value of MSRs are recorded to servicing (losses) gains.
Sale Recognition
The Company recognizes sales of MSRs as sales when it surrenders control over the MSRs. Control over transferred assets is deemed to be surrendered when (i) the assets have been isolated from the Company, (ii) the transferee has the right (free of conditions that constrain it from taking advantage of that right) to pledge or exchange the transferred assets, and (iii) the Company does not maintain effective control over the transferred assets through either (a) an agreement that entitles and obligates the Company to repurchase or redeem them before their maturity or (b) the ability to unilaterally cause the holder to return specific assets.
F-53
Table of Contents
Accounts Receivable
Accounts receivable are stated amounts due from customers or from investors for loans sold, net of an allowance for doubtful accounts. Accounts receivable that are outstanding longer than the contractual payment terms are considered past due. The Company establishes a reserve for all amounts due from borrowers and investors that are over 150 days old. The allowance for doubtful accounts was $329,089 and $462,647 as of December 31, 2014 and 2013, respectively. The Company writes off accounts receivable when management deems them uncollectible. There were $417,459 and $277,529 write-offs of accounts receivable during the years ended December 31, 2014 and 2013, respectively.
Property and Equipment
Property and equipment are recorded at cost and depreciated over their estimated useful lives using the straight-line method. Leasehold improvements are capitalized and amortized over the lesser of the life of the lease or the estimated useful life of the asset. Useful lives for purposes of computing depreciation are as follows:
| Years | ||
| Leasehold improvements |
2-15 | |
| Furniture and equipment |
5-7 | |
| Computer software |
3-5 |
Expenditures that materially increase the asset life are capitalized, while ordinary maintenance and repairs are charged to operations as incurred. When assets are sold or retired, the cost and related accumulated depreciation are removed from the accounts and any resulting gains or losses are included in earnings.
Goodwill and Other Intangible Assets
Goodwill is attributable to the merger with imortgage.com, Inc. (“imortgage”) during 2013. Intangible assets consist primarily of non-compete agreements, favorable leases, trademarks, tradenames and domain names. The non-compete agreements and favorable leases are amortized on a straight-line basis over their estimated useful lives which are 60 and 40 months, respectively. The trademarks, tradenames and domain names have indefinite lives.
Goodwill must be allocated to reporting units and tested for impairment. Goodwill is tested for impairment at least annually, and more frequently if events or circumstances, such as adverse changes in the business climate, indicate there may be justification for conducting an interim test. Impairment testing is performed at the reporting unit level.
In testing goodwill for impairment, the Company first assesses qualitative factors to determine whether it is more likely than not that the fair value of a reporting unit is less than its carrying amount. In making this assessment, the Company considers all relevant events and circumstances. These include, but are not limited to, macroeconomic conditions, industry and market considerations and the reporting unit’s overall financial performance. If the Company concludes, based on its qualitative assessment, that it is more likely than not that the fair value of the reporting unit is at least equal to its carrying amount, then the Company presumes that the goodwill of the reporting unit is not impaired and no further testing is performed. However, if the Company concludes, based on its qualitative assessment, that it is more likely than not that the fair value of a reporting unit is less than its carrying amount, then the Company proceeds with a two-step method to assess and measure impairment of the reporting unit’s goodwill. At the Company’s option, it may, in any given period, bypass the qualitative assessment and proceed directly to the two step approach.
The two-step method begins with a comparison of the fair value of a reporting unit to its carrying amount, including goodwill. If the fair value of the reporting unit is less than its carrying amount, the Company then compares the implied fair value of the reporting unit’s goodwill with the carrying amount of that goodwill. The implied fair value of a reporting unit’s goodwill is measured as the excess of the fair value of the
F-54
Table of Contents
reporting unit over the aggregate fair values of all the reporting unit’s assets and liabilities. If the implied fair value of the reporting unit’s goodwill is less than its carrying amount, the Company records an impairment loss equal to that difference. If the fair value of the reporting unit exceeds its carrying amount or if the fair value of the reporting unit’s goodwill exceeds the carrying amount of that goodwill, no impairment loss is recognized.
During the years ended December 31, 2014 and 2013, the Company did not record any goodwill impairment.
Long-Lived Assets
The Company periodically assesses long-lived assets, including property and equipment, for recoverability when events or changes in circumstances indicate that their carrying amount may not be recoverable. If management identifies an indicator of impairment, it assesses recoverability by comparing the carrying amount of the asset to the sum of the undiscounted cash flows expected to result from the use and the eventual disposal of the asset. An impairment loss is recognized when the carrying amount is not recoverable and is measured as the excess of carrying value over fair value. No such impairment was recorded during the two years ended December 31, 2014 and 2013.
Cash and Cash Equivalents
The Company considers all highly liquid investments with an original maturity of three months or less to be cash equivalents. As of December 31, 2014 and 2013, all amounts recorded in cash and cash equivalents represent cash held in banks, with the exception of insignificant amounts of petty cash held on hand.
Restricted Cash
Restricted cash consists of minimum required cash balances held by the Company’s warehouse lenders and borrower funds collected by the Company.
Loan Loss Obligation on Loans Sold
When the Company sells loans to investors, the risk of loss or default by the borrower is generally transferred to the investor. However, the Company is required by these investors to make certain representations relating to credit information, loan documentation and collateral. These representations and warranties may extend through the contractual life of the mortgage loan. Subsequent to the sale, if underwriting deficiencies, borrower fraud or documentation defects are discovered in individual mortgage loans, the Company may be obligated to repurchase the respective mortgage loan or indemnify the investors for any losses from borrower defaults if such deficiency or defect cannot be cured within the specified period following discovery.
In the case of early loan payoffs and early defaults on certain loans, the Company may be required to repay all or a portion of the premium initially paid by the investor on loans. The estimated obligation associated with early loan payoffs and early defaults is calculated based on historical loss experience.
The obligation for losses related to the representations and warranties and other provisions discussed above is recorded based upon an estimate of expected future losses. Because the Company does not service all of the loans it sells, it does not maintain nor have access to the current balances and loan performance data with respect to all of the individual loans previously sold to investors. However, the Company uses historical and projected loss frequency and loss severity ratios to estimate its exposure to losses on loans previously sold. Given current general industry trends in mortgage loans as well as housing prices, market expectations around losses related to the Company’s obligations could vary significantly from the obligation recorded as of the balance sheet date.
F-55
Table of Contents
Income Taxes
loanDepot.com, LLC is a limited liability company (“LLC”). Under federal and applicable state laws, taxes based on income of an LLC treated as a partnership are payable by the LLC’s members individually. The Company is not subject to federal income taxes but is, however, subject to annual state LLC franchise taxes and state LLC fees. These taxes and fees are included in the provision for income taxes.
Redeemable Units
In accordance with the guidance in FASB ASC Topic 480, Distinguishing Liabilities from Equity, outstanding Class I, A, B, P, and Z-1 Redeemable Units were classified outside of permanent equity and within temporary equity due to their associated redemption features and liquidation preferences. In a liquidation event, the Redeemable Units have preference over the Units classified as permanent equity to any proceeds from a liquidation event at amounts described for each Unit Class. Proceeds include cash or the issuance of stock to Unitholders in a qualified public offering. A liquidation event includes (i) the sale or disposition of substantially all of the Company’s assets, (ii) a merger or consolidation in which the stockholders of the Company prior to the transaction no longer hold at least 50 percent of the voting power of the merged or consolidated entity, (iii) a liquidation, dissolution, or winding up of the Company, or (iv) a qualified public offering. Upon a qualified public offering each Unit would receive proceeds (cash or shares of stock) at the applicable liquidation preference proportional to its value in the overall Company.
Equity-Based Compensation
The Company’s 2009 Incentive Equity Plan (the “Plan”) provides for awards of various classes of Common Units, as described in the Plan. The Company uses the grant-date fair value of equity awards to determine the compensation cost associated with each award. Grant-date fair value is determined using the Black-Scholes pricing model adjusted for unique characteristics of the specific awards. Compensation cost for service-based equity awards is generally recognized on a straight-line basis over the requisite service period, which is generally the vesting period.
In conjunction with the merger with imortgage, a total of 1,190,093 I Units were issued of which 88%, or 1,047,604, are held by employees of imortgage and employees of the Company subsequent to the acquisition. If a holder’s employment is terminated during the first three years following the merger date (October 1, 2013), the Company shall be permitted to repurchase 50% of the fair market value of the units. Accordingly, 50%, or $14,700,521, of these units were deemed as compensation and are being recognized into earnings over a three year period ending October 1, 2016.
The cost of equity-based compensation is recorded to personnel expense.
Advertising
Advertising costs are expensed in the period incurred and principally represent online advertising costs, including fees paid to search engines, distribution partners, master service agreements with brokers, and desk rental agreements with realtors. Advertising expense amounted to $93,906,211 and $51,265,362 for the years ended December 31, 2014 and 2013, respectively. Prepaid advertising expenses are capitalized and recognized during the period the expenses are incurred. As of December 31, 2014 and 2013, capitalized advertising expense is $887,952 and $0, respectively, recorded in prepaid expenses and other assets.
Concentration of Risk
The Company has concentrated its credit risk for cash by maintaining deposits in several financial institutions, which may at times exceed amounts covered by insurance provided by the Federal Deposit Insurance Corporation (FDIC). The Company has not experienced any losses in such accounts and believes it is not exposed to any significant credit risk to cash.
F-56
Table of Contents
Due to the nature of the mortgage lending industry, changes in interest rates may significantly impact revenue from originating mortgages and subsequent sales of loans to investors, which are the primary source of income for the Company. The Company originates mortgage loans on property located throughout the United States, with loans originated for property located in California totaling approximately 40% and 31% of total loan originations for the years ended December 31, 2014 and 2013, respectively.
The Company sells mortgage loans to various third-party investors. Three investors accounted for 36%, 28% and 24%, respectively, of the Company’s loan sales for the year ended December 31, 2014. Three investors accounted for 35%, 27%, and 21%, respectively, of the Company’s loan sales for the year ended December 31, 2013. No other investors accounted for more than 10% of the loan sales for the years ended December 31, 2014 and 2013.
The Company funds loans through warehouse lines of credit. As of December 31, 2014, 35% and 21% was payable to two separate lenders. As of December 31, 2013, 35% and 35% was payable to two separate lenders.
Reclassifications
Certain amounts in the prior year’s consolidated financial statements have been reclassified to conform to the current year presentation. The statement of operations reclassification adjustments principally involved disaggregating interest expense into mortgage interest expense, subordinated notes interest expense and general and administrative expenses. In addition, amounts previously classified as mortgage servicing income and sub-servicing expenses were combined into sub-servicing expenses.
NOTE C—FAIR VALUE
The Company’s consolidated financial statements include assets and liabilities that are measured based on their estimated fair values. The application of fair value estimates may be on a recurring or nonrecurring basis depending on the accounting principles applicable to the specific asset or liability and whether management has elected to carry the item at its estimated fair value as discussed in the following paragraphs.
Financial Statement Items Measured at Fair Value on a Recurring Basis
The Company enters into IRLCs with prospective borrowers, which are commitments to originate loans at a specified interest rate. The IRLCs are recorded as a component of derivative assets on the consolidated balance sheets with changes in fair value being recorded in current earnings as a component of gain on origination and sale of loans, net.
IRLCs for loans to be sold to investors are economically hedged using mandatory or assignment of trades (“AOT”), best efforts sale commitments or options on U.S. treasury futures. The Company estimates the fair value of the IRLCs based on quoted Agency to be announced mortgage-backed securities (“TBA MBS”) prices, its estimate of the fair value of the MSRs it expects to receive in the sale of the loans and the probability that the mortgage loan will fund or be purchased (the “pull-through rate”). The pull-through rate is based on the Company’s own experience and is a significant unobservable input used in the fair value measurement of these instruments and results in the classification of these instruments as Level 3. Significant changes in the pull-through rate of the IRLCs, in isolation, could result in significant changes in fair value measurement. The weighted average pull-through rate as of December 31, 2014 and 2013 was 64% and 76%, respectively. At December 31, 2014 and 2013, there were $2,281.4 million and $1,445.7 million, respectively, of IRLCs notional value outstanding.
LHFS to be sold to investors are also hedged using mandatory trades or AOTs, best efforts sale commitments or put options. The LHFS are valued at the best execution value based on the underlying characteristics of the loan, which is either based off of the TBA MBS market, or investor pricing, based on
F-57
Table of Contents
product, note rate and term. The most significant data inputs used in this valuation include, but are not limited to, loan type, underlying loan amount, note rate, loan program, and expected sale date of the loan. The valuations for are adjusted at the loan level to consider the servicing release premium and loan level pricing adjustments specific to each loan. LHFS, excluding impaired loans, are classified as Level 2. LHFS measured at fair value that become impaired are transferred from Level 2 to Level 3. There were no identified impaired loans as of December 31, 2014 and 2013. Changes in the fair value of the LHFS are recorded in current earnings as a component of gain on origination and sale of loans, net.
As described above, the Company economically hedges the changes in fair value of IRLCs and LHFS caused by changes in interest rates by using mandatory trades (AOTs), best efforts forward delivery commitments, and put options. These instruments are considered derivative instruments and are recorded at fair value as a component of derivative assets or derivative liabilities on the consolidated balance sheets. The Company accounts for these derivative instruments at fair value. The changes in fair value for these hedging instruments are recorded in current earnings as a component of gain on origination and sale of loans, net.
Mandatory trades are valued using inputs related to characteristics of the TBA MBS stratified by product, coupon, and settlement date. These derivatives are classified as Level 2. As of December 31, 2014 and 2013, there were $1,665.6 million and $1,347.0 million, respectively, of unsettled mandatory trade notional value outstanding.
Best efforts forward delivery commitments are valued using investor pricing considering the current base loan price. An anticipated loan funding probability is applied to value best efforts commitments hedging IRLCs, which results in the classification of these contracts as Level 3. The current base loan price and the anticipated loan funding probability are the most significant assumptions affecting the value of the best efforts commitments. The best efforts forward delivery commitments hedging LHFS are classified as Level 2; such contracts are transferred from Level 3 to Level 2 at the time the underlying loan is originated. As of December 31, 2014 and 2013, there were no best effort forward delivery commitments.
The Company also purchases out-of-the-money put options on 10-year treasury futures to economically hedge interest rate risk. Risk of loss associated with the put options is limited to the premium paid for the option. These put options are actively traded in a liquid market and thus, these instruments are considered to be valued with Level 1 inputs.
The fair value of the MSRs is based on applying the inputs to calculate the net present value of estimated MSR income. Significant inputs in the valuation of the MSRs include discount rates, prepayment speeds and default rates of serviced loans, and the cost of servicing. These inputs are predominantly Level 3 in nature as they utilize certain significant unobservable inputs including prepayment rate, default rate and discount rate assumptions. The weighted average prepayment rate, default rate and discount rate as of December 31, 2014 and 2013 were 12.89%, 1.26% and 11.66%, and 9.09%, 0.71%, 10.24%, respectively. Changes in the fair value of MSRs occur primarily due to realization of expected cash flows as well as the changes in valuation inputs and assumptions. If prepayments occur at a rate greater than our estimate, the fair value of the MSRs will decrease accordingly. The Company does not hedge the prepayment risk associated with the fair value of its mortgage servicing rights.
F-58
Table of Contents
The following table presents the carrying amount and estimated fair value of financial instruments included in the consolidated financial statements as of the dates indicated:
| 2014 | ||||||||||||||||
| Carrying Amount |
Estimated Fair Value | |||||||||||||||
| Level 1 | Level 2 | Level 3 | ||||||||||||||
| Assets | ||||||||||||||||
| Cash and cash equivalents |
$ | 28,636,542 | $ | 28,636,542 | $ | — | $ | — | ||||||||
| Restricted cash |
9,099,059 | 9,099,059 | — | — | ||||||||||||
| Loans held for sale, at fair value |
1,004,194,757 | — | 1,004,194,757 | — | ||||||||||||
| Derivative assets, at fair value |
52,851,440 | 214,844 | 571,626 | 52,064,970 | ||||||||||||
| Servicing rights, at fair value |
138,836,689 | — | — | 138,836,689 | ||||||||||||
| Liabilities | ||||||||||||||||
| Warehouse lines of credit |
$ | 938,617,395 | $ | — | $ | 938,617,395 | $ | — | ||||||||
| Derivative liabilities, at fair value |
7,589,782 | — | 7,589,782 | — | ||||||||||||
| Secured credit facility |
23,000,000 | — | 23,000,000 | — | ||||||||||||
| Unsecured term loan |
80,000,000 | — | — | 83,200,000 | ||||||||||||
| 2013 | ||||||||||||||||
| Carrying Amount |
Estimated Fair Value | |||||||||||||||
| Level 1 | Level 2 | Level 3 | ||||||||||||||
| Assets | ||||||||||||||||
| Cash and cash equivalents |
$ | 40,885,332 | $ | 40,885,332 | $ | — | $ | — | ||||||||
| Restricted cash |
17,661,552 | 17,661,552 | — | — | ||||||||||||
| Loans held for sale, at fair value |
741,508,910 | — | 741,508,910 | — | ||||||||||||
| Derivative assets, at fair value |
44,572,070 | 1,001,578 | 9,883,981 | 33,686,511 | ||||||||||||
| Servicing rights, at fair value |
93,823,253 | — | — | 93,823,253 | ||||||||||||
| Liabilities | ||||||||||||||||
| Warehouse lines of credit |
$ | 697,755,678 | $ | — | $ | 697,755,678 | $ | — | ||||||||
| Derivative liabilities, at fair value |
199,117 | — | 199,117 | — | ||||||||||||
| Unsecured term loan |
80,000,000 | — | — | 80,000,000 | ||||||||||||
The following presents the Company’s assets and liabilities that are measured at fair value on a recurring basis at December 31, 2014 and 2013:
| 2014 | ||||||||||||||||
| Recurring Fair Value Measurements of Assets (Liabilities) Using: | ||||||||||||||||
| Quoted Market Prices in Active Markets for Identical Assets (Level 1) |
Significant Other Observable Inputs (Level 2) |
Significant Unobservable Inputs (Level 3) |
Total Fair Value Measurements |
|||||||||||||
| Loans held for sale |
$ | — | $ | 1,004,194,757 | $ | — | $ | 1,004,194,757 | ||||||||
| Interest rate lock commitments (“IRLCs”) |
— | — | 52,064,970 | 52,064,970 | ||||||||||||
| Mortgage servicing rights |
— | — | 138,836,689 | 138,836,689 | ||||||||||||
| Forward sales contracts—assets |
— | 571,626 | — | 571,626 | ||||||||||||
| Put options on treasuries—assets |
214,844 | — | — | 214,844 | ||||||||||||
| Forward sales contracts—liabilities |
— | (7,589,782 | ) | — | (7,589,782 | ) | ||||||||||
|
|
|
|
|
|
|
|
|
|||||||||
| Total |
$ | 214,844 | $ | 997,176,600 | $ | 190,901,659 | $ | 1,188,293,103 | ||||||||
|
|
|
|
|
|
|
|
|
|||||||||
F-59
Table of Contents
| 2013 | ||||||||||||||||
| Recurring Fair Value Measurements of Assets (Liabilities) Using: | ||||||||||||||||
| Quoted Market Prices in Active Markets for Identical Assets (Level 1) |
Significant Other Observable Inputs (Level 2) |
Significant Unobservable Inputs (Level 3) |
Total Fair Value Measurements |
|||||||||||||
| Loans held for sale |
$ | — | $ | 741,508,910 | $ | — | $ | 741,508,910 | ||||||||
| Interest rate lock commitments (“IRLCs”) |
— | — | 33,686,511 | 33,686,511 | ||||||||||||
| Mortgage servicing rights |
— | — | 93,823,253 | 93,823,253 | ||||||||||||
| Forward sales contracts—assets |
— | 9,883,981 | — | 9,883,981 | ||||||||||||
| Put options on treasuries—assets |
1,001,578 | — | — | 1,001,578 | ||||||||||||
| Forward sales contracts—liabilities |
— | (199,117 | ) | — | (199,117 | ) | ||||||||||
|
|
|
|
|
|
|
|
|
|||||||||
| Total |
$ | 1,001,578 | $ | 751,193,774 | $ | 127,509,764 | $ | 879,705,116 | ||||||||
|
|
|
|
|
|
|
|
|
|||||||||
The following presents the changes in the Company’s assets and liabilities that are measured at fair value on a recurring basis using significant unobservable inputs (Level 3) for the years ended December 31, 2014 and 2013:
| 2014 | 2013 | |||||||||||||||||||||||
| Interest Rate Lock Commitments |
Mortgage Servicing Rights |
Forward Delivery Contracts |
Interest Rate Lock Commitments |
Mortgage Servicing Rights |
Forward Delivery Contracts |
|||||||||||||||||||
| Balance at beginning of year |
$ | 33,686,511 | $ | 93,823,253 | $ | — | $ | 30,062,398 | $ | 22,918,668 | $ | (4,079 | ) | |||||||||||
| Transfers into Level 3 |
— | — | — | — | — | — | ||||||||||||||||||
| Transfers out of Level 3 |
— | — | — | — | — | — | ||||||||||||||||||
| IRLCs attributable to iMortgage transition |
(547,760 | ) | — | — | 547,760 | — | — | |||||||||||||||||
| Total net gains included in earnings (realized and unrealized) |
422,850,949 | 106,268,490 | — | 241,370,630 | 70,904,585 | 350,985 | ||||||||||||||||||
| Sales and settlements |
||||||||||||||||||||||||
| Purchases |
— | 279,016 | — | — | — | — | ||||||||||||||||||
| Sales |
— | (61,534,070 | ) | — | — | — | (346,906 | ) | ||||||||||||||||
| Settlements |
(127,329,398 | ) | — | — | (71,421,512 | ) | — | — | ||||||||||||||||
| Transfers of IRLCs to closed loans |
(276,595,332 | ) | — | — | (166,872,766 | ) | — | — | ||||||||||||||||
|
|
|
|
|
|
|
|
|
|
|
|
|
|||||||||||||
| Balance at end of year |
$ | 52,064,970 | $ | 138,836,689 | $ | — | $ | 33,686,511 | $ | 93,823,253 | $ | — | ||||||||||||
|
|
|
|
|
|
|
|
|
|
|
|
|
|||||||||||||
F-60
Table of Contents
The following presents the gains included in earnings for the years ended December 31, 2014 and 2013 relating to the Company’s assets and liabilities that are measured at fair value on a recurring basis using significant unobservable inputs (Level 3):
| 2014 | 2013 | |||||||||||||||||||
| Interest Rate Lock Commitments |
Mortgage Servicing Rights |
Interest Rate Lock Commitments |
Mortgage Servicing Rights |
Forward Delivery Contracts |
||||||||||||||||
| Total net gains (losses) included in earnings, which are included in gain on sale of mortgage loans |
$ | 18,926,218 | $ | 132,790,192 | $ | 3,076,961 | $ | 70,904,585 | $ | 4,079 | ||||||||||
|
|
|
|
|
|
|
|
|
|
|
|||||||||||
| Change in unrealized gains (losses) relating to assets and liabilities still held at year end which are included in gain on sale of mortgage loans |
$ | 52,064,970 | $ | 98,024,975 | $ | 33,138,751 | $ | 72,044,505 | $ | — | ||||||||||
|
|
|
|
|
|
|
|
|
|
|
|||||||||||
The following table presents quantitative information about the valuation techniques and unobservable inputs applied to Level 3 fair value measurements for financial instruments measured at fair value on a recurring and non-recurring basis at December 31, 2014 and 2013:
| 2014 | 2013 | |||||||
| Unobservable Input |
Range of inputs | Weighted Average |
Range of inputs | Weighted Average | ||||
| IRLCs: |
||||||||
| Pull-through rate |
4.0%-99.0% | 64.2% | 20.0%-99.1% | 76.2% | ||||
| Servicing rights: |
||||||||
| Discount rate |
7.0%-13.1% | 9.0% | 10.0%-11.0% | 10.2% | ||||
| Prepayment rate |
9.9%-15.2% | 12.9% | 8.1% -10.9% | 9.1% | ||||
| Cost to service |
71-94 | 83 | 71-83 | 75 | ||||
Financial Statement Items Measured at Fair Value on a Nonrecurring Basis
The Company does not have any assets or liabilities that are recorded at fair value on a non-recurring basis as of December 31, 2014 and 2013.
Fair Value of Financial Instruments Carried at Amortized Cost
As of December 31, 2014 and 2013, all financial instruments were either recorded at fair value or the carrying value approximated fair value. For financial instruments that were not recorded at fair value, such as cash and cash equivalents, restricted cash, accounts receivable, warehouse lines of credit, accounts payable, and accrued expenses and other liabilities, their carrying values approximated fair value due to the short-term nature of such instruments (Level 1).
The Company’s $25 million line of credit to finance MSRs was entered into in October 2014. The stated rate of interest is 30-day LIBOR plus 4.00%, and is the same as the market rate for this instrument as of December 31, 2014. The carrying value of this line of credit approximates fair value as of December 31, 2014.
The Company’s $80 million credit agreement was entered into in October 2013. The stated rate of interest is 11% per annum. As of December 31, 2014 and 2013, the fair value of this credit agreement was $83.2 million and $80.0 million, respectively, utilizing a discounted cash flow method.
F-61
Table of Contents
NOTE D—BALANCE SHEET NETTING
Certain derivatives, loan warehouse and repurchase agreements are subject to master netting arrangements or similar agreements. Under GAAP, in certain circumstances the Company may elect to present certain financial assets, liabilities, and related collateral subject to master netting arrangements in a net position on the consolidated balance sheets. However, the Company does not report any of these financial assets or liabilities on a net basis, and presents them on a gross basis on the consolidated balance sheets.
The table below represents financial assets and liabilities that are subject to master netting arrangements or similar agreements categorized by financial instrument, together with corresponding financial instruments and corresponding collateral received or pledged at December 31, 2014 and 2013.
| 2014 | ||||||||||||||||||||||||
| Gross Amounts of Recognized Assets (Liabilities) |
Gross Amounts Offset in Consolidated Balance Sheets |
Net Amounts of Assets (Liabilities) Presented in Consolidated Balance Sheets |
Gross Amounts Not Offset in Consolidated Balance Sheets |
|||||||||||||||||||||
| Financial Instruments |
Cash Collateral (Received) Pledged |
Net Amount | ||||||||||||||||||||||
| Assets |
||||||||||||||||||||||||
| Forward delivery contracts |
$ | 571,626 | $ | — | $ | 571,626 | $ | (372,270 | ) | $ | — | $ | 199,356 | |||||||||||
| Put options on treasuries |
214,844 | — | 214,844 | — | — | 214,844 | ||||||||||||||||||
| TBAs |
— | — | — | — | — | — | ||||||||||||||||||
|
|
|
|
|
|
|
|
|
|
|
|
|
|||||||||||||
| Total Assets |
$ | 786,470 | $ | — | $ | 786,470 | $ | (372,270 | ) | $ | — | $ | 414,199 | |||||||||||
|
|
|
|
|
|
|
|
|
|
|
|
|
|||||||||||||
| Liabilities |
||||||||||||||||||||||||
| Forward delivery contracts |
$ | (7,589,782 | ) | $ | — | $ | (7,589,782 | ) | $ | 5,123,019 | $ | — | $ | (2,466,763 | ) | |||||||||
| TBAs |
— | — | — | — | — | — | ||||||||||||||||||
| Warehouse lines of credit |
(938,617,395 | ) | — | (938,617,395 | ) | 938,617,395 | 2,377,386 | 2,377,386 | ||||||||||||||||
| Debt obligation |
(103,000,000 | ) | — | (103,000,000 | ) | 37,561,619 | 8,227,689 | (57,210,692 | ) | |||||||||||||||
|
|
|
|
|
|
|
|
|
|
|
|
|
|||||||||||||
| Total Liabilities |
$ | (1,049,207,178 | ) | $ | — | $ | (1,049,207,178 | ) | $ | 981,302,033 | $ | 10,605,076 | $ | (57,300,069 | ) | |||||||||
|
|
|
|
|
|
|
|
|
|
|
|
|
|||||||||||||
| 2013 | ||||||||||||||||||||||||
| Gross Amounts of Recognized Assets (Liabilities) |
Gross Amounts Offset in Consolidated Balance Sheets |
Net Amounts of Assets (Liabilities) Presented in Consolidated Balance Sheets |
Gross Amounts Not Offset in Consolidated Balance Sheets |
|||||||||||||||||||||
| Financial Instruments |
Cash Collateral (Received) Pledged |
Net Amount | ||||||||||||||||||||||
| Assets |
||||||||||||||||||||||||
| Forward delivery contracts |
$ | 9,883,981 | $ | — | $ | 9,883,981 | $ | (2,459,931 | ) | $ | — | $ | 7,424,051 | |||||||||||
| Put options on treasuries |
1,001,578 | — | 1,001,578 | — | — | 1,001,578 | ||||||||||||||||||
| TBAs |
— | — | — | — | — | — | ||||||||||||||||||
|
|
|
|
|
|
|
|
|
|
|
|
|
|||||||||||||
| Total Assets |
$ | 10,885,559 | $ | — | $ | 10,885,559 | $ | (2,459,931 | ) | $ | — | $ | 8,425,629 | |||||||||||
|
|
|
|
|
|
|
|
|
|
|
|
|
|||||||||||||
| Liabilities |
||||||||||||||||||||||||
| Forward delivery contracts |
$ | (199,117 | ) | $ | — | $ | (199,117 | ) | $ | 207,645 | $ | — | $ | 8,528 | ||||||||||
| TBAs |
— | — | — | — | — | — | ||||||||||||||||||
| Warehouse lines of credit |
(697,755,678 | ) | — | (697,755,678 | ) | 697,755,678 | 2,938,234 | 2,938,234 | ||||||||||||||||
| Debt obligation |
(80,000,000 | ) | — | (80,000,000 | ) | — | 15,192,144 | (64,807,856 | ) | |||||||||||||||
|
|
|
|
|
|
|
|
|
|
|
|
|
|||||||||||||
| Total Liabilities |
$ | (777,954,796 | ) | $ | — | $ | (777,954,796 | ) | $ | 697,963,323 | $ | 18,130,378 | $ | (61,861,094 | ) | |||||||||
|
|
|
|
|
|
|
|
|
|
|
|
|
|||||||||||||
F-62
Table of Contents
NOTE E—LOANS HELD FOR SALE
Origination: A summary of the initial unpaid principal balance of loans originated by type of loan for the years ended December 31, 2014 and 2013 is presented below ($ amounts in thousands):
| 2014 | 2013 | |||||||||||||||
| Amount | % | Amount | % | |||||||||||||
| Conforming—fixed |
$ | 7,417,346 | 56 | % | $ | 6,026,902 | 72 | % | ||||||||
| Conforming—ARM |
660,800 | 5 | % | 308,950 | 4 | % | ||||||||||
| FHA—fixed |
4,445,244 | 34 | % | 1,855,963 | 22 | % | ||||||||||
| FHA—ARM |
435,975 | 3 | % | 99,290 | 1 | % | ||||||||||
| Other |
202,459 | 2 | % | 75,784 | 1 | % | ||||||||||
|
|
|
|
|
|
|
|
|
|||||||||
| Total |
$ | 13,161,824 | 100 | % | $ | 8,366,889 | 100 | % | ||||||||
|
|
|
|
|
|
|
|
|
|||||||||
Gain on origination and sale of loans, net is comprised of the following components for the years ended December 31, 2014 and 2013:
| 2014 | 2013 | |||||||
| Premium from loan sales |
$ | 455,326,332 | $ | 196,269,450 | ||||
| Servicing rights |
132,840,476 | 60,237,247 | ||||||
| Unrealized gains/(losses) from derivative assets and liabilities |
(4,328,482 | ) | 14,713,721 | |||||
| Realized gains/(losses) from derivative assets and liabilities |
(68,192,409 | ) | 28,174,986 | |||||
| Discount points, rebates and lender paid costs |
(101,171,188 | ) | (45,269,314 | ) | ||||
| Mark to market gain (loss) on loans held for sale |
23,543,922 | (4,536,538 | ) | |||||
| Provision for loan loss obligation for loans sold |
(2,557,141 | ) | (3,111,986 | ) | ||||
|
|
|
|
|
|||||
| $ | 435,461,510 | $ | 246,477,566 | |||||
|
|
|
|
|
|||||
Mortgage Loans Held for Sale: The following table represents the unpaid principal balance of LHFS by product type of loan as of December 31, 2014 and 2013:
| 2014 | 2013 | |||||||||||||||
| Amount | % | Amount | % | |||||||||||||
| Conforming—fixed |
$ | 558,343,894 | 58 | % | $ | 458,547,714 | 64 | % | ||||||||
| Conforming—ARM |
61,968,869 | 6 | % | 33,983,561 | 5 | % | ||||||||||
| FHA—fixed |
286,512,018 | 30 | % | 203,794,723 | 28 | % | ||||||||||
| FHA—ARM |
22,713,674 | 2 | % | 15,746,014 | 2 | % | ||||||||||
| Other |
31,905,991 | 3 | % | 8,989,543 | 1 | % | ||||||||||
|
|
|
|
|
|
|
|
|
|||||||||
| Total |
$ | 961,444,445 | 100 | % | $ | 721,061,555 | 100 | % | ||||||||
|
|
|
|
|
|
|
|
|
|||||||||
The following table represents the unpaid principal balance of LHFS by borrower credit score (FICO) range as of December 31, 2014:
| As of December 31, 2014 | As of December 31, 2013 | |||||||||||||||
| Unpaid Principal Balance |
Percentage of Total |
Unpaid Principal Balance |
Percentage of Total |
|||||||||||||
| Under 650 |
$ | 115,716,975 | 12 | % | $ | 106,982,084 | 15 | % | ||||||||
| 650-700 |
241,407,539 | 25 | % | 172,851,359 | 24 | % | ||||||||||
| 700-750 |
249,133,311 | 26 | % | 181,645,947 | 25 | % | ||||||||||
| Greater than 750 |
355,186,620 | 37 | % | 259,583,164 | 36 | % | ||||||||||
|
|
|
|
|
|
|
|
|
|||||||||
| Total |
$ | 961,444,445 | 100 | % | $ | 721,062,554 | 100 | % | ||||||||
|
|
|
|
|
|
|
|
|
|||||||||
F-63
Table of Contents
The following table represents the unpaid principal balance of LHFS by loan-to-value range of loan as of December 31, 2014:
| As of December 31, 2014 | As of December 31, 2013 | |||||||||||||||
| Unpaid Principal Balance |
Percentage of Total |
Unpaid Principal Balance |
Percentage of Total |
|||||||||||||
| Less than 60% |
$ | 92,471,287 | 10 | % | $ | 69,505,075 | 10 | % | ||||||||
| 60% - 70% |
97,213,440 | 10 | % | 62,853,871 | 9 | % | ||||||||||
| 70% - 80% |
198,149,334 | 21 | % | 200,286,722 | 28 | % | ||||||||||
| 80% - 90% |
256,659,764 | 27 | % | 115,974,202 | 16 | % | ||||||||||
| 90% - 100% |
293,184,308 | 30 | % | 223,328,819 | 31 | % | ||||||||||
| Greater than 100% |
23,766,311 | 2 | % | 49,112,865 | 6 | % | ||||||||||
|
|
|
|
|
|
|
|
|
|||||||||
| Total |
$ | 961,444,445 | 100 | % | $ | 721,061,554 | 100 | % | ||||||||
|
|
|
|
|
|
|
|
|
|||||||||
As of December 31, 2014 and 2013, the components of the loans held for sale measured at fair value are as follows:
| 2014 | 2013 | |||||||
| Aggregate unpaid principal balance |
$ | 961,444,445 | $ | 721,061,554 | ||||
| Difference between fair value and aggregate unpaid principal balance |
42,750,312 | 20,447,356 | ||||||
|
|
|
|
|
|||||
| $ | 1,004,194,757 | $ | 741,508,910 | |||||
|
|
|
|
|
|||||
The Company did not have any loans on non-accrual status as of December 31, 2014 and 2013.
Loan Loss Obligation for Sold Loans: The Company’s loan loss obligation for sold loans is reflected in accrued expenses and other liabilities. For the years ended December 31, 2014 and 2013, the Company refunded premiums of $15,297 and $371,566, respectively related to early payoffs. There have been losses of $572,547 and $127,940 associated with early payment defaults or losses related to representations, warranties and other provisions for the years ended December 31, 2014 and 2013, respectively.
The activity related to the loan loss obligation for sold loans for the years ended December 31, 2014 and 2013 is as follows:
| 2014 | 2013 | |||||||
| Balance at beginning of year |
$ | 8,411,449 | $ | 5,165,317 | ||||
| Assumption of loan loss reserve from discontinued operations |
— | — | ||||||
| Provision for loan losses |
2,557,141 | 3,111,986 | ||||||
| Payments, realized losses and other |
(586,842 | ) | 134,146 | |||||
|
|
|
|
|
|||||
| Balance at end of year |
$ | 10,381,748 | $ | 8,411,449 | ||||
|
|
|
|
|
|||||
NOTE F—SERVICING RIGHTS
The principal balance of the loans underlying the Company’s MSRs was $13,629.2 million and $8,300.9 million as of December 31, 2014 and 2013, respectively. The following table presents activity for MSRs for the years ended December 31, 2014 and 2013:
| 2014 | 2013 | |||||||
| Balance at beginning of year |
$ | 93,823,253 | $ | 22,918,668 | ||||
| Additions |
133,069,207 | 60,237,246 | ||||||
| Sales Proceeds (net of Gain/Loss) |
(62,072,494 | ) | — | |||||
| Changes in fair value |
(25,983,277 | ) | 10,667,339 | |||||
|
|
|
|
|
|||||
| Balance at end of year |
$ | 138,836,689 | $ | 93,823,253 | ||||
|
|
|
|
|
|||||
F-64
Table of Contents
Servicing fees, late charges and other fees related to MSRS are recoded in servicing income. The fees are summarized below:
| 2014 | 2013 | |||||||
| Contractual servicing fees |
$ | 42,241,546 | $ | 18,813,872 | ||||
| Ancillary and other fees: |
||||||||
| Late charges |
464,267 | 153,233 | ||||||
| Other |
3,172 | — | ||||||
|
|
|
|
|
|||||
| $ | 42,708,984 | $ | 18,967,104 | |||||
|
|
|
|
|
|||||
The table below illustrates hypothetical changes in fair values of MSRs, caused by assumed immediate changes to key assumptions that are used to determine fair value.
| Servicing Rights Sensitivity Analysis |
2014 | 2013 | ||||||
| Fair Value of Servicing Rights |
$ | 138,836,689 | $ | 93,823,253 | ||||
| Change in Fair Value from adverse changes: |
||||||||
| Discount Rate: |
||||||||
| Increase 1% |
(4,866,784 | ) | (3,512,931 | ) | ||||
| Increase 2% |
(9,365,362 | ) | (6,975,257 | ) | ||||
| Cost of Servicing: |
||||||||
| Increase 10% |
(3,050,153 | ) | (1,279,791 | ) | ||||
| Increase 20% |
(5,548,385 | ) | (2,774,807 | ) | ||||
| Prepayment Speed: |
||||||||
| Increase 10% |
(6,804,259 | ) | (2,114,315 | ) | ||||
| Increase 20% |
(12,941,904 | ) | (4,283,049 | ) | ||||
Sensitivities are hypothetical changes in fair value and cannot be extrapolated because the relationship of changes in assumptions to changes in fair value may not be linear. Also, the effect of a variation in a particular assumption is calculated without changing any other assumption, whereas a change in one factor may result in changes to another. Accordingly, no assurance can be given that actual results would be consistent with the results of these estimates. As a result, actual future changes in servicing rights values may differ significantly from those displayed above.
NOTE G—GOODWILL AND OTHER INTANGIBLE ASSETS
Effective October, 1, 2013, the Company acquired certain assets and assumed certain liabilities of imortgage, a company based in Scottsdale, Arizona that engages in the business of originating, financing, and selling mortgage loans secured by residential real estate and derives income primarily from fees related to the origination of mortgage loans and the subsequent sale of the loans to investors. This acquisition was undertaken in order to expand the Company’s lending footprint into the distributed retail space. Subsequent to the acquisition, imortgage became a division within loanDepot.
The total purchase consideration was $53,700,637 which consists of $33,400,000 in loanDepot Class I Units ($18,699,479 allocated to the purchase price and $14,700,521 deemed compensatory) and $20,300,637 in cash, non-compete and restrictive covenant payments. The total purchase price was $39,000,116. The Company accounted for the acquisition as a purchase in accordance with Accounting Standards Codification (“ASC”) 805, Business Combinations.
A total of 1,190,093 I Units were issued in conjunction with the acquisition, of which 88%, or 1,047,604, are held by employees of imortgage and employees of the Company subsequent to the acquisition. If a
F-65
Table of Contents
holder’s employment is terminated during the first three years following October 1, 2013, the Company shall be permitted to repurchase 50% of the fair market value of the units. Accordingly, 50%, or $14,700,521, of these units are deemed as compensation and are being recognized into earnings over the three year period. The estimated amount owed to the Class I Unitholders as of December 31, 2014 and 2013 was $0.
As of October 1, 2013, the Company recorded the excess of purchase price over net tangible assets acquired as goodwill and other identifiable intangible assets. The Company engaged an independent valuation expert to perform a valuation of the assets and liabilities acquired from imortgage. Based on this valuation, adjustments were recorded against goodwill including amounts to record investment in joint venture, trademark and tradename, non-compete, favorable and unfavorable leases, and fixed assets. The excess of purchase price over net assets acquired resulted in goodwill of $10,882,511. For income tax purposes, the goodwill is expected to be non-deductible.
The allocation of the excess purchase price over net tangible assets to goodwill and other identifiable intangible assets was as follows:
| Goodwill |
$ | 10,882,511 | ||
| Interest in joint venture |
16,000,000 | |||
| Trademark and tradename |
2,600,000 | |||
| Non-compete |
1,500,000 | |||
| Favorable leases |
100,000 | |||
|
|
|
|||
| $ | 31,082,511 | |||
|
|
|
A summary of the values assigned to the assets acquired and liabilities assumed in connection with the acquisition is as follows:
| Fixed assets |
$ | 10,060,000 | ||
| Prepaid assets, deposits and other assets |
1,548,397 | |||
| Investment in joint venture |
16,000,000 | |||
| Trademarks and tradename |
2,600,000 | |||
| Non-compete |
1,500,000 | |||
| Favorable leases |
100,000 | |||
| Goodwill |
10,882,511 | |||
|
|
|
|||
| Total assets acquired |
42,690,908 | |||
|
|
|
|||
| Compensation obligation |
2,838,874 | |||
| Unfavorable leases |
200,000 | |||
| Other accrued liabilities |
651,918 | |||
|
|
|
|||
| Total liabilities assumed |
3,690,792 | |||
|
|
|
|||
| Net assets acquired |
$ | 39,000,116 | ||
|
|
|
The results of imortgage’s operations are included in the accompanying consolidated statements of operations subsequent to the acquisition date of October 1, 2013.
F-66
Table of Contents
Other intangible assets consist of:
| 2014 | ||||||||||||||||
| Gross carrying amount |
Accumulated amortization |
Net carrying amount |
Weighted average life (years) |
|||||||||||||
| Non compete |
$ | 1,500,000 | $ | (375,000 | ) | $ | 1,125,000 | 5 | ||||||||
| Favorable lease |
100,000 | (37,500 | ) | 62,500 | 3 | |||||||||||
|
|
|
|
|
|
|
|||||||||||
| Total |
$ | 1,600,000 | $ | (412,500 | ) | 1,187,500 | ||||||||||
|
|
|
|
|
|||||||||||||
| Trademarks and domain name, not subject to amortization |
2,630,000 | |||||||||||||||
|
|
|
|||||||||||||||
| Total |
$ | 3,817,500 | ||||||||||||||
|
|
|
|||||||||||||||
| 2013 | ||||||||||||||||
| Gross carrying amount |
Accumulated amortization |
Net carrying amount |
Weighted average life (years) |
|||||||||||||
| Non compete |
$ | 1,500,000 | $ | (75,000 | ) | $ | 1,425,000 | 5 | ||||||||
| Favorable lease |
100,000 | (7,500 | ) | 92,500 | 3 | |||||||||||
|
|
|
|
|
|
|
|||||||||||
| Total |
$ | 1,600,000 | $ | (82,500 | ) | 1,517,500 | ||||||||||
|
|
|
|
|
|||||||||||||
| Trademarks and domain name, not subject to amortization |
2,630,000 | |||||||||||||||
|
|
|
|||||||||||||||
| Total |
$ | 4,147,500 | ||||||||||||||
|
|
|
|||||||||||||||
Amortization expense for amortizing intangible assets is $294,706 and $73,676 for the years ended December 31, 2014 and 2013, respectively. The weighted average amortization period for these assets is 59 months as of December 31, 2013 and 2014. The following is a schedule of estimated amortization expense for each of the next five fiscal years:
| Year ending December 31, |
||||
| 2015 |
$ | 330,000 | ||
| 2016 |
330,000 | |||
| 2017 |
302,500 | |||
| 2018 |
225,000 | |||
| 2019 |
— | |||
|
|
|
|||
| Estimated amortization expense |
$ | 1,187,500 | ||
|
|
|
NOTE H—INVESTMENTS IN JOINT VENTURES
MTH Mortgage, LLC (“MTH”) was formed in August 2000 as a joint venture between imortgage (subsequently purchased by the Company) and Meritage Paseo Crossing, LLC a subsidiary of Meritage Homes Corporation (together “Meritage”). Meritage is a nationwide homebuilder while MTH is a mortgage loan broker that provides loan origination services to customers of Meritage. MTH earns fees paid by the Company for the successful funding and closing of these mortgage loans. The Company and Meritage own 35% and 65% of the joint venture, respectively. The Company is the manager of MTH and has determined that it has a variable interest in MTH. However, as Meritage is the majority owner and has the primary control and responsibility to identify and attract potential borrowers, the Company has concluded that Meritage is the primary beneficiary. As such, MTH is not consolidated within the Company’s financial statements for the periods presented.
F-67
Table of Contents
Polygon Mortgage, LLC (“Polygon”) was formed as a joint venture between the Company and PNW Homebuilders, LLC (“PNW”) in October 2013. PNW is a homebuilder while Polygon is a mortgage loan broker that provides loan origination services to customers of PNW. Polygon earns fees paid by the Company for the successful funding and closing of these mortgage loans. Effective August 12, 2014, there was a change in ownership in which PNW sold its 50% ownership in Polygon to William Lyon Homes in conjunction with the acquisition of PNW Homebuilders by William Lyon Homes. The Company and Polygon WLH, LLC, a wholly owned subsidiary of William Lyon Homes each own 50% of the joint venture. The Company is the manager of Polygon and has determined that it has a variable interest in Polygon. However, as Polygon WLH, LLC has the primary control and responsibility to identify and attract potential borrowers, the Company has concluded that Polygon WLH, LLC is the primary beneficiary. As such, Polygon is not consolidated within the Company’s financial statements for the periods presented.
MSC Mortgage, LLC (“MSC”) was formed as a joint venture between the Company and Michael Saunders & Company (“Michael Saunders”) in June 2014. Michael Saunders is a real estate broker while MSC is a mortgage loan broker that provides loan origination services to customers of Michael Saunders. MSC earns fees paid by the Company for the successful funding and closing of these mortgage loans. The Company and Michael Saunders each own 50% of the joint venture. The Company is the manager of MSC and has determined that it has a variable interest in MSC. However, as Michael Saunders has the primary control and responsibility to identify and attract potential borrowers, the Company has concluded that Michael Saunders is the primary beneficiary. As such, MSC is not consolidated within the Company’s financial statements for the periods presented.
TRI Pointe Connect, LLC (“TRI Pointe”) was formed as a joint venture between the Company and TRI Pointe Solutions, Inc. (“TPS”) in October 2014. TPS is a home builder while TRI Pointe is a mortgage loan broker that provides loan origination services to customers of TPS. TRI Pointe earns fees paid by the Company for the successful funding and closing of these mortgage loans. The Company and TPS own 45% and 55% of the joint venture, respectively. The Company is the manager of TRI Pointe and has determined that it has a variable interest in TRI Pointe. However, as TPS is the majority owner and has the primary control and responsibility to identify and attract potential borrowers, the Company has concluded that TPS is the primary beneficiary. As such, TRI Pointe is not consolidated within the Company’s financial statements for the periods presented.
The Company’s pro rata share of net earnings of joint ventures is recorded in other income while the carrying value of the Company’s equity investments in joint ventures is recorded in Investments in Joint Ventures. The combined results of operations and financial position of the Company’s equity-basis investments in joint ventures are summarized, below:
| 2014 | 2013 | |||||||
| Condensed income statement information: |
||||||||
| Total revenues of joint ventures |
$ | 30,452,498 | $ | 24,345,028 | ||||
| Total net income of joint ventures |
17,912,912 | 17,054,740 | ||||||
| Condensed balance sheet information: |
||||||||
| Total assets of joint ventures |
7,082,506 | 5,275,335 | ||||||
| Total liabilities of joint ventures |
5,288,062 | 486,981 | ||||||
| Total equity of joint ventures |
1,794,444 | 4,788,355 | ||||||
| Company’s pro rata share of net earnings of joint ventures |
6,526,141 | 1,913,756 | ||||||
| Carrying value of the Company’s equity investments in joint ventures |
16,790,640 | 18,063,633 | ||||||
F-68
Table of Contents
The Company’s maximum exposure to loss as a result of its involvement with is joint ventures is the carrying value noted below.
NOTE I—ACCRUED EXPENSES AND OTHER LIABILITIES
Accrued expenses and other liabilities as of December 31, 2014 and 2013 consist of the following:
| 2014 | 2013 | |||||||
| Accounts payable |
$ | 27,878,756 | $ | 19,410,283 | ||||
| Loan loss obligation for sold loans |
10,381,748 | 8,411,449 | ||||||
| Accrued compensation and benefits |
29,829,205 | 23,048,063 | ||||||
| Accrued pricing adjustments on sold loans |
5,923,437 | 5,178,792 | ||||||
| Deferred rent |
4,844,861 | 3,272,752 | ||||||
| Other |
2,086,669 | 4,247,409 | ||||||
|
|
|
|
|
|||||
| $ | 80,944,676 | $ | 63,568,748 | |||||
|
|
|
|
|
|||||
NOTE J—PROPERTY AND EQUIPMENT
Property and equipment consist of the following at December 31, 2014 and 2013:
| 2014 | 2013 | |||||||
| Furniture and equipment |
$ | 28,100,414 | $ | 20,044,074 | ||||
| Computer software |
22,176,039 | 11,604,422 | ||||||
| Leasehold improvements |
6,616,682 | 5,089,258 | ||||||
| Work in progress |
1,093,554 | 579,972 | ||||||
| Accumulated depreciation and amortization |
(21,701,170 | ) | (10,322,823 | ) | ||||
|
|
|
|
|
|||||
| $ | 36,285,520 | $ | 26,994,903 | |||||
|
|
|
|
|
|||||
The Company charged $11,397,546 and $5,703,926 of depreciation and amortization expense for the years ended December 31, 2014 and 2013, respectively.
In 2014 and 2013, the Company entered into agreements with an independent third party to sell and leaseback certain equipment. In conjunction with these agreements, the Company received $7.0 million and $3.2 million in cash and recorded a capital lease obligation in the same amount which is recorded in capital lease obligations (see Note M). These capital lease obligations have lease terms which are three years at an effective interest rate range of 5.00% and 7.75% with an option to purchase the equipment at the end of the leases. The transactions have been accounted for as financing arrangements, wherein the property remains on the Company’s books and will continue to be depreciated.
NOTE K—WAREHOUSE LINES OF CREDIT
Borrowings on warehouse lines of credit were $938,617,395 and $697,755,678 at December 31, 2014 and 2013, respectively. Interest expense from warehouse lines of credit is recorded to mortgage interest expense.
As of December 31, 2014, the Company had eight lines of credit totaling $1,675 million of borrowing capacity. Borrowings under these lines of credit are used to fund, and are secured by, residential mortgage loans held for sale. The lines of credit are repaid using proceeds from the sale of loans. The base interest rates on the Company’s warehouse lines of credit range from 30 day LIBOR plus 2.375% to 30 day LIBOR plus 3.00%. Some of the lines carry additional fees in the form of annual facility fees charged on the total line amount, commitment fees charged on the committed portion of the line and non-usage fees charged when monthly usage falls below 50% of the line amount; all of which are 0.25% per annum. All of the Company’s warehouse lines are scheduled to expire in 2015 under one year terms and all lines are subject to renewal based on an annual credit review conducted by the lender.
F-69
Table of Contents
The base interest rates for all warehouse lines of credit are subject to increase based upon the characteristics of the underlying loans collateralizing the lines of credit, including, but not limited to product type and number of days held for sale. Certain of the warehouse line lenders require the Company, at all times, to maintain cash accounts with minimum required balances. As of December 31, 2014 and 2013, there was $2,377,386 and $2,938,234, respectively, held in these accounts which are recorded as a component of restricted cash on the consolidated balance sheets.
Under the terms of these warehouse lines, the Company is required to maintain various financial and other covenants. These financial covenants include, but are not limited to, maintaining (i) minimum tangible net worth, (ii) minimum liquidity, (iii) a minimum current ratio, (iv) a maximum distribution requirement, (v) a maximum leverage ratio, (vi) pre-tax net income requirements and (vii) a maximum warehouse capacity ratio. As of December 31, 2014 and 2013, the Company was in compliance with all of its warehouse lending related covenants.
The Company’s business is highly dependent on the availability of these warehouse lines. Although management believes that the existing lines of credit are adequate for current operations, reductions in the available credit, or the inability to renew or replace these lines, would have a material adverse effect on the Company’s business, financial condition and results of operations. Management has determined that it could continue to operate the Company’s business at a reduced capacity if some, but not all, of the warehouse lines were terminated.
NOTE L—DEBT OBLIGATIONS
In October 2014, the Company entered into a line of credit for $25 million used for working capital and is secured by MSRs (“Secured Credit Facility”). Interest expense from this line of credit is recorded to other interest expense. The base interest rate is 30 day LIBOR plus 4.00%. This line is subject to certain financial covenants, including tangible net worth, minimum liquidity, maximum leverage, and quarterly debt service coverage ratio requirements (calculated as a ratio of EBITDA to debt service payments). As of December 31, 2014 there have been no covenant breaches and the amount drawn was $23 million and is secured by $37 million of MSRs. This Secured Credit Facility expires in October 2015.
In October 2013, the Company entered into a credit agreement for $80 million on an unsecured basis (“Unsecured Term Loan”). Interest expense from this credit agreement is recorded to other interest expense. The Company is allowed to draw against the $80 million principal at the rate of 75% to 90% of the fair market value of unencumbered MSRs, such draw rate being dependent upon the Company’s leverage ratio as defined by the credit agreement. In the event the amount of the draw is less than $80 million, the Company is required to maintain the shortfall in a reserve account, where funds are held and released back to the Company when the shortfall is cured. In addition, the interest rate ranges from 11% to 12.75%, depending upon the 75% to 90% range used at the end of any particular month, and is charged monthly against the principal of $80 million. A servicing fee strip equal to the applicable service fee for each loan minus 10 basis points is deposited in a collection account to guarantee payment of interest due on the note and to provide for mandatory pre-payments in the event of a borrowing base deficiency or covenant breaches. The full principal amount of the Unsecured Term Loan is due in October 2016, however the Company may, at its option, prepay at any time on or prior to the maturity date any part of the loan, so long as the aggregate amount does not exceed 35% of the loan outstanding on the date of prepayment. As of December 31, 2014 and 2013 there have been no covenant breaches and the amount drawn was $80,000,000 at each year end.
During the year ended December 31, 2013, the Company entered into two subordinated note agreements with its members and borrowed $15,000,000 under these agreements at an interest rate of 15%. The entire $15,000,000 was paid off prior to December 31, 2013.
F-70
Table of Contents
NOTE M—CAPITAL LEASES
The Company leases certain equipment under agreements that are classified as capital leases. The cost of equipment under capital leases, net of accumulated amortization, is included in Property and Equipment in the consolidated balance sheets.
Minimum future lease payments under capital leases as of December 31, 2014 for the remaining years under the capital leases are:
| Year ending December 31, |
||||
| 2015 |
$ | 6,057,370 | ||
| 2016 |
4,756,232 | |||
| 2017 |
1,353,233 | |||
| 2018 |
7,036 | |||
| 2019 |
— | |||
|
|
|
|||
| Total minimum lease payments remaining |
12,173,871 | |||
| Less: Amount representing interest |
(1,003,199 | ) | ||
|
|
|
|||
| $ | 11,170,672 | |||
|
|
|
Interest expense incurred on capital leases during the years ended December 31, 2014 and 2013 was $569,727 and $331,623, respectively and is included in general and administrative expense.
The cost and accumulated depreciation of equipment held under capital leases as of December 31, 2014 and 2013, is as follows:
| 2014 | 2013 | |||||||
| Cost |
$ | 17,972,353 | $ | 8,090,627 | ||||
| Accumulated amortization |
(6,576,229 | ) | (1,807,572 | ) | ||||
|
|
|
|
|
|||||
| Capital lease asset, net |
$ | 11,396,124 | $ | 6,283,055 | ||||
|
|
|
|
|
|||||
Amortization of assets under capital leases is included as a component of depreciation and amortization expense.
NOTE N—RELATED PARTY TRANSACTIONS
In conjunction with its various joint ventures, the Company entered into various agreements to provide services to the joint ventures for which it receives and pays fees. Services for which the Company earns fees comprise loan processing and administrative services (legal, accounting, human resources, data processing and management information, assignment processing, post-closing, underwriting, facilities management, quality control, management consulting, risk management, promotions, public relations, advertising and compliance with credit agreements). The Company also originates eligible mortgage loans referred to it by the joint ventures for which the Company pays the joint ventures a broker fee. Amounts earned, incurred and due from the joint ventures as of and for the year ended December 31, 2014 and 2013 follow:
| 2014 | 2013 | |||||||
| Loan processing and administrative services fee income |
$ | 2,917,800 | $ | 219,534 | ||||
| Loan origination broker fees expense |
30,452,496 | 3,523,295 | ||||||
| Receivables from joint ventures |
3,954,561 | 165,857 | ||||||
loanDepot and imortgage entered into a Transition Support Agreement to address the loans which were locked by imortgage and have not funded prior to October 1, 2013. These loans are identified as the ‘Transition Pipeline’. imortgage is the sole owner of the Transition Pipeline. Under the agreement,
F-71
Table of Contents
loanDepot provides certain services to imortgage in order to close out the pipeline. Such services include the use of personnel, access to equipment, office space, telecommunications and computer systems. Total transition services income from this agreement is $103,235 and $425,843 for the years ended December 31, 2014 and 2013, respectively. The total amount due to imortgage for the transition pipeline as of December 31, 2014 and 2013 is $0 and $2,134,889, respectively. This amount is recorded on the consolidated balance sheets within accrued expenses and other liabilities. All transactions related to the Transition Pipeline have been settled during the year ended December 31, 2014.
imortgage entered into a software licensing agreement with MTH on August 24, 2000. The terms of the agreement allows MTH to use the software of imortgage to help in the origination of mortgage applications. There is no fee for this agreement. The agreement was assigned to the Company as a part of the acquisition of imortgage.
As of December 31, 2014 and 2013, the Company recorded a receivable from one of its owners for tax payments or other miscellaneous items of $248,453 which is included in accounts receivable.
The Company paid travel and promotional fees of $0.5 million and $0.5 million to an entity controlled by a Unitholder of the Company during the years ended December 31, 2014 and 2013, respectively. The Company paid management fees of $0.3 million and $0.7 million to a Unitholder of the Company during the years ended December 31, 2014 and 2013, respectively. The Company employed certain employees that provided services to a Unitholder whose salaries totaled $0.1 million and $0.1 million for the years ended December 31, 2014 and 2013, respectively.
NOTE O—REDEEMABLE UNITS AND UNITHOLDERS’ EQUITY
The Company has designated the following classes of Common Units:
Class A Common Units
Class A Common Units are voting Units and holders are entitled to one vote per Class A Common Unit, unless designated as non-voting upon grant. Class A Common Units have a liquidation preference, equal to the aggregate Capital Contribution made for the Class A Common Units, over all other common unit classes except classes I, J and K. As of December 31, 2014 and 2013, the liquidation preference of the Class A Common Units was $26,900,000. There were 269,000 Class A Common Units authorized and outstanding as of December 31, 2014 and 2013.
Class B Common Units
Class B Common Units have no voting rights. Class B Common Units have a liquidation preference subordinate to Class A Common Units. As of December 31, 2014 and 2013, the liquidation preference of the Class B Common Units was $5,000,000. There were 50,000 Class B Common Units authorized and outstanding as of December 31, 2014 and 2013.
Class P Common Units
Class P Common Units have no voting rights. Class P Common Units have a liquidation preference subordinate to Class B Common Units. These Class P Common Units were issued on December 31, 2013 and carried a liquidation preference of $12,500,000. There were 12,500 Class P Common Units authorized and outstanding as of December 31, 2014. Class P Common Unitholders have the right to receive distributions equal to the liquidation preference once the Class A and Class B Common Unitholders have received distributions equal to 1.5 times the amount contributed by the Class A and Class B Common Unitholders. Then, subsequent to the distributions to the Class A, Class B and Class Z-1 Common Units (as described below), the Class P Common Unitholders have the right to receive
F-72
Table of Contents
distributions, to the extent distributions are authorized by the board of directors, equal to the greater of (a) 225% of the amount contributed by the Class P Common Unitholders or (b) a 20% per annum return on the amount contributed by the Class P Common Unitholders. Upon the sale of the Company, the Class P Common Unitholders have the right to increase this distribution based upon a formula described in the LLC Agreement. Upon an initial public offering (“IPO”), the Class P holder have the right to have the Company redeem the Class P Common Units at a redemption price equal to the distributions that the Class P Common Unitholder would receive from the IPO. The holders of the Class P Common Units also have the right to convert the Class P Common Units to the common shares sold in the IPO at a price equal to 87.5% of the public offering price. The Company also has the right, upon an IPO, to obligate the conversion of the Class P Common Units into common shares sold in the IPO.
Class I Common Units
A total of 1,190,093 Class I Common Units were issued in conjunction with the acquisition of imortgage. The Class I Common Unitholders will receive distributions based upon the iMortgage Division Economic Balance of the imortgage division, as defined in the loanDepot LLC Agreement. The Class I Common Unitholders have the right to receive 65% of the iMortgage Division Economic Balance for the first $66.67 million. Thereafter, the Class I Common Unitholders receive 50% of the iMortgage Division Economic Balance earned by the imortgage division. The Company is required to make regular distributions of this amount on a monthly, quarterly and annual basis to an escrow account for the estimated amounts to be distributed to the Class I Common Unitholders. In the event that those distributions are not made, the Class I Common Units earn interest of the undistributed amount at a rate of 12% per annum. The estimated amounts owed to the Class I Unitholders as of December 31, 2014 and 2013 was $0.
Class J and Class K Common Units
Holders of Class J and Class K Common Units are eligible to receive distributions, in a proportionate share with Class I Common Units, subject to certain return thresholds as defined and set forth in the corresponding grant, purchase or other agreement pursuant to which such Class J and Class K Common Units were issued. There were no Class J or Class K Common Units grants as of December 31, 2014 and 2013.
Class Z, Class Y, Class X and Class W Common Units
Class Z, Class Y, Class X and Class W Common Units have no voting rights and may be issued to existing or new employees, officers, directors, consultants or other service providers of the Company or any of its subsidiaries. Holders of Class Z, Class Y, Class X and Class W Common Units are eligible to receive distributions, in a proportionate share with Class A Common Units and Class B Common Units, subject to certain return thresholds as defined and set forth in the corresponding grant, purchase or other agreement pursuant to which such Class Z, Class Y, Class X, and Class W Common Units were issued.
The Company has granted the following Class Z, Class Y, Class X, and Class W Common Units:
| • | Class Z-1 Common Units: Holders of Class Z-1 Common Units are not eligible to receive distributions until distributions have been made to the holders of Class P Common Units have received distributions equal to the liquidation preference of the Class P Common Units (“Class Z-1 Minimum Threshold”). Once the Class Z-1 Minimum Threshold is reached, the holders of Class Z-1 Common Units will share in distributions with Class A Common Unit and Class B Common Unitholders at a ratio of 85% Class A and Class B Common Unit and 15% Class Z-1 Common Units until the Class A Common Unit and Class B Common Unitholders receive |
F-73
Table of Contents
| distributions equal to 2.5 times the aggregate capital contribution made for said Common Units (“Class Z-1 Maximum Threshold”). No further distributions will be made to the holders of Class Z-1 Common Units once the Class Z-1 Maximum Threshold is reached. As of December 31, 2014 and 2013, the Company has granted 44,991 and 45,734, respectively, of Class Z-1 Common Units and an additional 3,891 and 3,148, respectively, of Class Z-1 Common Units are held in reserve for future issuance. |
| • | Class Z-2 Common Units: Holders of Class Z-2 Common Units are not eligible to receive distributions until distributions have been made to the holders Class P Common Unitholders receive their distributions as described above (“Class Z-2 Minimum Threshold”). Once the Class Z-2 Minimum Threshold is reached, the holders of Class Z-2 Common Units will share in distributions with Class A Common Unit and Class B Common Unitholders at a ratio of 75% Class A and Class B Common Unit and 25% Class Z-2 Common Units until the Class A Common Unit and Class B Common Unitholders receive distributions equal to 3.5 times the aggregate capital contribution made for said Common Units (“Class Z-2 Maximum Threshold”). No further distributions will be made to the holders of Class Z-2 Common Units once the Class Z-2 Maximum Threshold is reached. As of December 31, 2014 and 2013, the Company has granted 84,113 and 86,386, respectively, of Class Z-2 Common Units and an additional 8,220 and 5,947, respectively, of Class Z-2 Common Units are held in reserve for future issuance. |
| • | Class Z-3 Common Units: Holders of Class Z-3 Common Units are not eligible to receive distributions until distributions have been made to the holders of Class A Common Units and Class B Common Units equal to 3.5 times the aggregate capital contribution made in exchange for the Class A Common Units and Class B Common Units (“Class Z-3 Minimum Threshold”). Once the Class Z-3 Minimum Threshold is reached, the holders of Class Z-3 Common Units will share in distributions with Class A Common Unit and Class B Common Unitholders at a ratio of 65% Class A and Class B Common Unit and 35% Class Z-3 Common Units until the Class A Common Unit and Class B Common Unitholders receive distributions equal to 4.5 times the aggregate capital contribution made for said Common Units (“Class Z-3 Maximum Threshold”). No further distributions will be made to the holders of Class Z-3 Common Units once the Class Z-3 Maximum Threshold is reached. As of December 31, 2014 and 2013, the Company has granted 135,280 and 139,546, respectively, of Class Z-3 Common Units and an additional 13,873 and 9,607, respectively, of Class Z-3 Common Units are held in reserve for future issuance. |
| • | Class Z, Class Y, Class X, and Class W Common Units: Holders of Class Z-4 and Class Y Common Units are not eligible to receive distributions until distributions have been made to the holders of Class A Common Units and Class B Common Units equal to 4.5 times the aggregate capital contribution made in exchange for the Class A Common Units and Class B Common Units (“Class Z-4 Minimum Threshold”). Once the Class Z-4 Minimum Threshold is reached, the holders of Class Z-4 and Class Y Common Units will share in distributions with Class A Common Unit and Class B Common Unitholders at a ratio of 50% Class A and Class B Common Unit and 50% Class Z-4 and Class Y Common Units until the Class A and Class B Common Unitholders receive distributions equal to 8.0 times the aggregate capital contributions made for said Common Units. |
Then, the holders of Class Z-4, Class Y and Class X Common Units will share in distributions with Class A Common Units and Class B Common Unitholders at a ratio of 50% Class A and Class B Common Units and 50% Class Z-4, Class Y and Class X Common Units until the Class A and Class B Common Unitholders receive distributions equal to 14.265 times the aggregate capital contributions made for said Common Units.
Then, the holders of Class W will share in distributions with Class A Common Unit and Class B Common Unitholders at a ratio of 50% Class A and Class B Common Unit and 50% Class W Common Units until the Class W holders have received $2 million.
F-74
Table of Contents
Then, the holders of Class Z-4, Class Y and Class X Common Units will share in distributions with Class A Common Unit and Class B Common Unitholders at a ratio of 50% Class A and Class B Common Unit and 50% Class Z-4, Class Y and Class X Common Units.
| • | As of December 31, 2014 and 2013, the Company has granted 269,264 and 274,080, respectively, of Class Z-4 Common Units and an additional 7,376 and 2,920, respectively, of Class Z-4 Common Units are held in reserve for future issuance. As of December 31, 2014 and 2013, the Company has granted 15,439 and 29,239, respectively, of Class Y Common Units and an additional 25,952 and 12,152, respectively, of Class Y Common Units are held in reserve for future issuance. As of December 31, 2014 and 2013, the Company has granted 16,184 and 320, respectively, of Class X Common Units and an additional 0 and 0, respectively, of Class X Common Units are held in reserve for future issuance. As of December 31, 2014 and 2013, the Company has granted 10,000 and 10,000, respectively, of Class W Common Units and an additional 0 and 0, respectively, of Class W Common Units are held in reserve for future issuance. |
All classes of units are entitled to receive distributions equal to their estimated tax liability. These distributions have priority over distributive rights granted to any class of units and do not factor into the distributions for the purposes of calculating the minimum thresholds for the Class Z, Class Y, Class X and Class W Common Units.
NOTE P—EQUITY-BASED COMPENSATION
The Company’s 2009 Incentive Equity Plan provides for the granting of Class Z, Class Y, Class X, and Class W Common Units to employees, managers, consultants and advisors of the Company and its Subsidiaries. The number of Class Z, Class Y, Class X, and Class W Common Units which may be granted or sold under the Plan shall not exceed, in the aggregate, 567,370 Class Z Common Units (of which 48,882 shall be Class Z-1 Common Units and 92,333 shall be Class Z-2 Common Units, 149,154 shall be Class Z-3 Common Units and 277,000 shall be Class Z-4 Common Units) and 41,391 Class Y Common Units; provided that, to the extent any Class Z and Class Y Common Units (i) expire, (ii) are canceled, terminated or forfeited in any manner, or (iii) are repurchased by the Company, then in each case such common Units shall again be available for issuance and sale under the Plan.
Participants receiving grants or purchasing Class Z, Class Y, Class X, or Class W Common Units pursuant to the Plan shall be required to become a party to the Limited Liability Company Agreement. No Common Units shall be issued after the tenth anniversary of the adoption of the Plan.
During the years ended December 31, 2014 and 2013, the Company granted to employees of the Company the following:
| Units Granted |
2014 | 2013 | ||||||
| Class Z-1 Common Units |
968 | — | ||||||
| Class Z-2 Common Units |
958 | — | ||||||
| Class Z-3 Common Units |
954 | — | ||||||
| Class Z-4 Common Units |
391 | — | ||||||
| Class Y Common Units |
— | 15,506 | ||||||
| Class X Common Units |
15,864 | 320 | ||||||
| Class W Common Units |
— | 10,000 | ||||||
|
|
|
|
|
|||||
| Total |
19,135 | 25,827 | ||||||
|
|
|
|
|
|||||
The unit grants typically vest 20% on the one year anniversary of the grant and 1.667% each month thereafter, and are subject to accelerated vesting upon the sale of the Company.
F-75
Table of Contents
The following assumptions were used for the grants in the year ended December 31, 2014 and 2013:
| 2014 | 2013 | |||||||
| Risk-free interest rate |
1.68 | % | 2.34 | % | ||||
| Expected life |
5 years | 5 years | ||||||
| Expected volatility |
25.10 | % | 47.20 | % | ||||
The risk-free interest rate is the U.S. Treasury yield curve in effect at the time of grant based on the expected life of the unit grants. The expected life of the units granted represents the period of time the unit grants are expected to be outstanding. The expected volatility is based on the historical volatility of a public peer group of Companies’ stock price in the most recent period that is equal to the expected term of the unit grants being valued.
| 2014 | 2013 | |||||||||||||||
| Shares | Weighted Average Grant Date Fair Value |
Shares | Weighted Average Grant Date Fair Value |
|||||||||||||
| Unvested—beginning of year |
155,391 | $ | 3.80 | 257,614 | $ | 3.25 | ||||||||||
| Granted |
19,135 | 2.39 | 25,827 | 6.98 | ||||||||||||
| Vested |
(114,144 | ) | 3.22 | (119,009 | ) | 3.25 | ||||||||||
| Forfeited/Cancelled |
(16,574 | ) | 3.25 | (9,041 | ) | 3.25 | ||||||||||
|
|
|
|
|
|
|
|
|
|||||||||
| Unvested—end of year |
43,808 | $ | 4.74 | 155,391 | $ | 3.80 | ||||||||||
|
|
|
|
|
|
|
|
|
|||||||||
The compensation expense associated with the Class Z, Class Y, Class X, and Class W Common Units was $362,334 and $386,727 for the years ended December 31, 2014 and 2013, respectively. There is $211,938 of unrecognized compensation as of December 31, 2014 that is expected to be recognized over the next 5 years.
NOTE Q—COMMITMENTS AND CONTINGENCIES
Operating Leases
The Company is obligated under various non-cancelable operating leases, which are subject to rent escalation clauses, for its office facilities and equipment that expire at various times through 2023. The following is a schedule of future minimum lease payments for operating leases with initial terms in excess of one year as of December 31, 2014:
| 2014 | ||||
| Year ending December 31, |
||||
| 2015 |
$ | 14,268,666 | ||
| 2016 |
12,658,472 | |||
| 2017 |
9,662,438 | |||
| 2018 |
8,656,344 | |||
| 2019 |
7,417,682 | |||
| Thereafter |
4,378,038 | |||
|
|
|
|||
| Total |
$ | 57,041,641 | ||
|
|
|
|||
The Company recognizes rent expense on a straight-line basis. Rent expense for operating leases was $12,957,373 and $5,021,383 during the years ended December 31, 2014 and 2013, respectively.
F-76
Table of Contents
Escrow Services
In conducting its operations, the Company, through its wholly-owned subsidiary, LD Escrow, Inc., routinely holds customers’ assets in escrow pending completion of real estate financing transactions. These amounts are maintained in segregated bank accounts and are offset with the related liabilities resulting in no amounts reported in the accompanying consolidated balance sheets. The balances held for the Company’s customers totaled $2,163,063 and $2,149,119 at December 31, 2014 and 2013, respectively.
Legal Matters
The Company is party to general legal proceedings which have arisen in the ordinary course of business. While the results of these matters cannot be predicted with certainty, the Company’s management believes that losses, if any, resulting from the ultimate resolution of these matters will not have a material adverse effect on the Company’s consolidated financial position, results of operations or cash flows. However, unfavorable resolution could affect the consolidated financial position, results of operations or cash flows for the years in which they are resolved.
IRLC Purchase Commitment
In connection with the acquisition and assumption of certain assets and liabilities of Mortgage Master, Inc. (“Mortgage Master”) that occurred subsequent to year end, the Company entered into purchase commitments of IRLCs with a net fair value of $18,550 as of December 31, 2014.
NOTE R—REGULATORY CAPITAL REQUIREMENTS
The Company is subject to various capital requirements by the U.S. Department of Housing and Urban Development (“HUD”); lenders of the warehouse lines of credit; and secondary markets investors. Failure to maintain minimum capital requirements could result in the inability to participate in HUD-assisted mortgage insurance programs, to borrow funds from warehouse line lenders or to sell mortgage loans to investors.
The Company’s adjusted net worth and minimum capital requirements as of December 31, 2014 and 2013 are as follows:
| 2014 | 2013 | |||||||||||||||
| Adjusted Net Worth |
Minimum Capital Requirement |
Adjusted Net Worth |
Minimum Capital Requirement |
|||||||||||||
| HUD |
$ | 156,234,225 | $ | 2,500,000 | $ | 147,897,195 | $ | 2,500,000 | ||||||||
|
|
|
|
|
|
|
|
|
|||||||||
| Fannie Mae |
$ | 174,493,031 | $ | 11,002,757 | $ | 147,897,195 | $ | 4,159,000 | ||||||||
|
|
|
|
|
|
|
|
|
|||||||||
| Freddie Mac |
$ | 174,493,031 | $ | 12,737,386 | $ | 147,897,195 | $ | 4,159,000 | ||||||||
|
|
|
|
|
|
|
|
|
|||||||||
| Ginnie Mae |
$ | 156,234,225 | $ | 17,706,000 | $ | 132,015,639 | $ | 6,705,000 | ||||||||
|
|
|
|
|
|
|
|
|
|||||||||
NOTE S—SUBSEQUENT EVENT
On November 13, 2014, Mortgage Master and the Company announced that they had entered into an asset purchase agreement pursuant to which loanDepot acquired and assumed certain assets and liabilities of Mortgage Master, respectively. The transaction closed on January 2, 2015. As such, all balances related to the acquisition are not included in the financial statements as of December 31, 2014.
Following the Company’s acquisition of imortgage on October 1, 2013, disagreements arose among the Company, the former stockholders of imortgage (“imortgage Stockholders”) and Unitholders of the Company with respect to the interpretation of certain provisions of the Fifth Amended and Restated LLC
F-77
Table of Contents
Agreement relating to amounts payable to the Class I common units in connection with an initial public offering (“IPO”). In particular, in connection with an IPO, the imortgage Stockholders believed that they were entitled to a percentage of the overall value of the Company based on the earnings from the imortgage division relative to the overall earnings of the Company. The Company and the Unitholders of the Company believed that the imortgage Stockholders were entitled to a percentage of the net proceeds from an IPO based on the earnings from the imortgage division relative to the overall earnings of the Company. In order to eliminate uncertainty and resolve all disagreements, the parties agreed to eliminate the potential variable nature of the formula specified in the Fifth Amended and Restated LLC Agreement and amend the formula to provide for a fixed amount which reflects the mutual intent of the parties with respect to the provisions that had been in dispute.
F-78
Table of Contents
loanDepot.com, LLC and Subsidiary
CONSOLIDATED BALANCE SHEET
($ in thousands)
| June 30, 2014 | ||||
| (Unaudited) | ||||
| ASSETS |
||||
| Cash and cash equivalents |
$ | 24,225 | ||
| Restricted cash |
662 | |||
| Accounts receivable, net |
18,762 | |||
| Loans held for sale, at fair value |
883,585 | |||
| Derivative assets, at fair value |
63,807 | |||
| Servicing rights, at fair value |
108,361 | |||
| Property and equipment, net |
31,233 | |||
| Prepaid expenses and other assets |
7,855 | |||
| Loans eligible for repurchase |
17,298 | |||
| Investments in joint ventures |
16,273 | |||
| Goodwill |
10,883 | |||
| Intangible assets, net |
3,983 | |||
|
|
|
|||
| Total assets |
$ | 1,186,927 | ||
|
|
|
|||
| LIABILITIES, REDEEMABLE UNITS AND UNITHOLDERS’ EQUITY |
||||
| Warehouse lines of credit |
$ | 825,917 | ||
| Accounts payable and accrued expenses |
62,242 | |||
| Derivative liabilities, at fair value |
13,748 | |||
| Liability for loans eligible for repurchase |
17,298 | |||
| Capital lease obligations |
12,489 | |||
| Debt obligations |
80,000 | |||
|
|
|
|||
| Total liabilities |
1,011,694 | |||
| Commitments and contingencies (Note 9) |
||||
| Redeemable units: |
||||
| Class I Units (par value $18.7 million; 1,190,093 units authorized and issued/outstanding) |
22,375 | |||
| Class A Units (par value $26.9 million; 269,000 units authorized and issued/outstanding) |
26,900 | |||
| Class B Units (par value $5.0 million; 50,000 units authorized and issued/outstanding) |
5,000 | |||
| Class P Units (par value $12.5 million; 12,500 units authorized and 12,425 units issued/outstanding) |
12,500 | |||
| Class Z-1 Units (no par value; 48,882 units authorized and 46,131 units issued/outstanding) |
— | |||
|
|
|
|||
| Total redeemable units |
66,775 | |||
| Unitholders’ equity: |
||||
| Class Z-2 Units (no par value; 92,333 units authorized and 86,267 units issued/outstanding) |
— | |||
| Class Z-3 Units (no par value; 149,154 units authorized and 138,761 units issued/outstanding) |
— | |||
| Class Z-4 Units (no par value; 277,000 units authorized and 272,856 units issued/outstanding) |
— | |||
| Class Y Units (no par value; 41,391 units authorized and 16,819 units issued/outstanding) |
— | |||
| Class W Units (no par value; 10,000 units authorized and issued/outstanding) |
— | |||
| Class X Units (no par value; 8,125 units authorized and issued/outstanding) |
— | |||
| Additional paid-in capital |
1,652 | |||
| Retained earnings |
106,806 | |||
|
|
|
|||
| Total unitholders’ equity |
108,458 | |||
|
|
|
|||
| Total liabilities, redeemable units and unitholders’ equity |
$ | 1,186,927 | ||
|
|
|
|||
See accompanying notes to the unaudited consolidated financial statements.
F-79
Table of Contents
loanDepot.com, LLC and Subsidiary
CONSOLIDATED STATEMENT OF OPERATIONS
($ in thousands)
| For the six months ended June 30, 2014 |
||||
| (Unaudited) | ||||
| REVENUES: |
||||
| Interest income |
$ | 14,462 | ||
| Interest expense |
(8,132 | ) | ||
|
|
|
|||
| Net interest income |
6,330 | |||
| Gain on origination and sale of loans, net |
193,849 | |||
| Origination income, net |
34,635 | |||
| Servicing income |
12,652 | |||
| Servicing losses |
(10,368 | ) | ||
| Other income |
7,122 | |||
|
|
|
|||
| Total net revenues |
244,220 | |||
| EXPENSES: |
||||
| Personnel expense |
130,210 | |||
| Marketing and advertising expense |
43,024 | |||
| Direct origination expense |
20,503 | |||
| General and administrative expense |
18,126 | |||
| Occupancy expense |
7,065 | |||
| Depreciation and amortization |
5,207 | |||
| Subservicing expense |
4,919 | |||
| Other interest expense |
4,400 | |||
|
|
|
|||
| Total expenses |
233,454 | |||
|
|
|
|||
| Income before income taxes |
10,766 | |||
| Provision for income taxes |
598 | |||
|
|
|
|||
| Net income |
$ | 10,168 | ||
|
|
|
|||
See accompanying notes to the unaudited consolidated financial statements.
F-80
Table of Contents
loanDepot.com, LLC and Subsidiary
CONSOLIDATED STATEMENT OF CASH FLOWS
($ in thousands)
| For the six months ended June 30, 2014 |
||||
| (Unaudited) | ||||
| CASH FLOWS FROM OPERATING ACTIVITIES |
||||
| Net income from operations |
$ | 10,168 | ||
| Adjustments to reconcile net income from operations to net cash used in operating activities: |
||||
| Depreciation and amortization expense |
5,207 | |||
| Gain on origination and sale of mortgage loans |
(170,935 | ) | ||
| Loss on sale of mortgage servicing rights |
(417 | ) | ||
| Provision for loan loss obligation on sold loans |
748 | |||
| Fair value change in derivative assets |
(16,045 | ) | ||
| Fair value change in derivative liabilities |
13,549 | |||
| Premium paid on derivatives |
(3,189 | ) | ||
| Fair value change in loans held for sale |
(20,118 | ) | ||
| Fair value change attributable to imortgage transition pipeline |
1,241 | |||
| Fair value change in mortgage servicing rights |
10,833 | |||
| Equity compensation |
2,643 | |||
| Originations of mortgage loans |
(5,356,199 | ) | ||
| Proceeds from sales of mortgage loans |
5,352,393 | |||
| Proceeds from principal payments |
344 | |||
| Payments to investors for loan losses |
(516 | ) | ||
| Change in restricted cash |
16,999 | |||
| Other changes in operating assets and liabilities |
(9,269 | ) | ||
|
|
|
|||
| Net cash used in operating activities |
(162,923 | ) | ||
|
|
|
|||
| CASH FLOWS FROM INVESTING ACTIVITIES |
||||
| Purchase of property and equipment |
(8,179 | ) | ||
| Proceeds from sale of mortgage servicing rights |
26,245 | |||
| Disbursements from joint ventures |
2,731 | |||
|
|
|
|||
| Net cash flows provided by investing activities |
20,797 | |||
|
|
|
|||
| CASH FLOWS FROM FINANCING ACTIVITIES |
||||
| Proceeds from borrowings on warehouse lines of credit |
$ | 5,237,994 | ||
| Repayment of borrowings on warehouse lines of credit |
(5,109,833 | ) | ||
| Proceeds from sale-leaseback transactions |
7,203 | |||
| Payments on capital lease obligation |
(1,936 | ) | ||
| Contributed capital from members |
301 | |||
| Payments on repurchase of units |
(75 | ) | ||
| Distributions to members |
(8,188 | ) | ||
|
|
|
|||
| Net cash provided by financing activities |
125,466 | |||
|
|
|
|||
| Net change in cash and cash equivalents |
(16,660 | ) | ||
|
|
|
|||
| Cash and cash equivalents at beginning of the period |
40,885 | |||
|
|
|
|||
| Cash and cash equivalents at end of the period |
$ | 24,225 | ||
|
|
|
|||
| SUPPLEMENTAL DISCLOSURES OF CASH FLOW INFORMATION |
||||
| Cash paid during the period for: |
||||
| Interest |
$ | 12,707 | ||
| Income taxes |
598 | |||
| SUPPLEMENTAL DISCLOSURES OF NONCASH INVESTING AND FINANCING ACTIVITIES |
||||
| Purchase of equipment under capital leases |
$ | 1,118 | ||
See accompanying notes to the unaudited consolidated financial statements.
F-81
Table of Contents
loanDepot.com, LLC and Subsidiary
NOTES TO THE UNAUDITED CONSOLIDATED FINANCIAL STATEMENTS
NOTE 1—ORGANIZATION AND BASIS OF PRESENTATION
Organization
loanDepot.com, LLC (“loanDepot” or the “Company”), was formed as a California corporation on April 1, 2009. Pursuant to reorganization through merger, the Company became a limited liability company shortly thereafter. The Company operates under the loanDepot.com, LLC Fifth Amended and Restated Limited Liability Company Agreement (the “LLC Agreement”).
loanDepot.com engages in the originating, financing and selling of mortgage loans secured by residential real estate and derives income primarily from fees charged for services related to the origination of mortgage loans, gains from the subsequent sale of the loans to investors, and income from loan servicing.
Basis of Presentation
The consolidated financial statements presented herein are at June 30, 2014 and for the six months ended June 30, 2014. These interim unaudited consolidated financial statements have been prepared in accordance with the rules and regulations of the Securities and Exchange Commission (“SEC”). Certain information and note disclosures normally included in financial statements prepared in accordance with U.S. generally accepted accounting principles (“GAAP”)—as prescribed by the Financial Accounting Standards Board’s (“FASB”) Accounting Standards Codification (“ASC”)—have been condensed or omitted according to these SEC rules and regulations. Management believes that the disclosures included in these interim financial statements should be read in conjunction with consolidated financial statements and notes thereto included in the Company’s financial statements for the year ended December 31, 2014 and for the six months ended June 30, 2015. In the opinion of management, all normal and recurring adjustments to present fairly the financial condition of the company at June 30, 2014 and results of operations for the six months ended June 30, 2014 have been made. The results of operations for the six months ended June 30, 2014 should not be construed as indicative of the results to be expected for the full year.
NOTE 2—RECENT ACCOUNTING PRONOUNCEMENTS
In January 2014, the FASB issued Accounting Standards Update (“ASU”) No. 2014-04, “Receivables—Troubled Debt Restructurings by Creditors (Subtopic 310-40): Reclassification of Residential Real Estate Collateralized Consumer Mortgage Loans upon Foreclosure.” This update clarifies when a creditor is considered to have received physical possession of residential real estate property collateralized by a consumer mortgage loan in order to reduce diversity in practice for when a creditor derecognizes the loan receivable and recognizes the real estate property. The guidance in ASU No. 2014-04 also requires interim and annual disclosure of the amount of foreclosed residential real estate property held by the creditor and the recorded investment in consumer mortgage loans collateralized by residential real estate property that are in the process of foreclosure. The new guidance was effective for the Company beginning on January 1, 2015 and the adoption of the new guidance did not have a material impact on its financial statements.
In May 2014, the FASB issued ASU No. 2014-09, Revenue from Contracts with Customers to standardize revenue recognition process between public and private companies as well as across industries in an effort to more closely align GAAP revenue recognition with international standards to provide a more comparable revenue number for the users of the financial statements. The standard outlines that for all contracts, revenue should be recognized when or as the entity satisfies a performance obligation. Revenue is recognized either over a period or at one point in time in accordance with how the control of the service or good is transferred. This amendment update is for all year-end and interim periods beginning after December 15, 2016 and early
F-82
Table of Contents
application is not permitted. The adoption of ASU 2014-09 is not expected to have a material impact on our financial condition, liquidity or results of operations, but the Company is still assessing the possible impact of the implementation of the new standard.
In June 2014, the FASB issued ASU No. 2014-11, “Transfers and Servicing (Topic 860): Repurchase-to-Maturity Transactions, Repurchase Financings, and Disclosures.” The pronouncement in this update changes the accounting for repurchase-to-maturity transactions and linked repurchase financings to secured borrowing accounting, which is consistent with the accounting for other repurchase agreements. The pronouncement also requires two new disclosures. The first disclosure requires an entity to disclose information on transfers accounted for as sales in transactions that are economically similar to repurchase agreements. The second disclosure provides increased transparency about the types of collateral pledged in repurchase agreements and similar transactions accounted for as secured borrowings. The new guidance was effective for the Company beginning on January 1, 2015 and the adoption of the new guidance did not have a material impact on its financial statements.
In June 2014, the FASB issued ASU No. 2014-12, Compensation-Stock Compensation (Topic 718): Accounting for Share-Based Payments When the Terms of an Award Provide That a Performance Target Could Be Achieved after the Requisite Service Period, which requires that a performance target that affects vesting and that could be achieved after the requisite service period be treated as a performance condition. As such, the performance target should not be reflected in estimating the grant-date fair value of the award. Compensation cost should be recognized in the period in which it becomes probable that the performance target will be achieved and should represent the compensation cost attributable to the period(s) for which the requisite service has already been rendered. ASU 2014-12 is effective for annual and interim periods beginning after December 15, 2015, with early adoption permitted. The adoption of ASU 2014-12 is not expected to have a material impact on our financial condition, liquidity or results of operation.
NOTE 3—FAIR VALUE
The Company’s consolidated financial statements include assets and liabilities that are measured based on their estimated fair values. The application of fair value estimates may be on a recurring or nonrecurring basis depending on the accounting principles applicable to the specific asset or liability and whether management has elected to carry the item at its estimated fair value as discussed in the following paragraphs.
Financial Statement Items Measured at Fair Value on a Recurring Basis
The Company enters into IRLCs with prospective borrowers, which are commitments to originate loans at a specified interest rate. The IRLCs are recorded as a component of derivative assets on the consolidated balance sheet with changes in fair value being recorded in current earnings as a component of gain on origination and sale of loans, net.
IRLCs for loans to be sold to investors are economically hedged using mandatory or assignment of trades (“AOT”), best efforts sale commitments or options on U.S. treasury futures. The Company estimates the fair value of the IRLCs based on quoted Agency to be announced mortgage-backed securities (“TBA MBS”) prices, its estimate of the fair value of the servicing rights it expects to receive in the sale of the loans and the probability that the mortgage loan will fund or be purchased (the “pull-through rate”) and estimated transformative costs. The pull-through rate is based on the Company’s own experience and is a significant unobservable input used in the fair value measurement of these instruments and results in the classification of these instruments as Level 3. Significant changes in the pull-through rate of the IRLCs, in isolation, could result in significant changes in fair value measurement. At June 30, 2014, there was $2.2 billion of IRLCs notional value outstanding.
LHFS to be sold to investors are also hedged using mandatory trades or AOTs, best efforts sale commitments or put options. The LHFS are valued at the best execution value based on the underlying
F-83
Table of Contents
characteristics of the loan, which is either based off of the TBA MBS market, or investor pricing, based on product, note rate and term. The most significant data inputs used in this valuation include, but are not limited to, loan type, underlying loan amount, note rate, loan program, and expected sale date of the loan. The valuations for LHFS are adjusted at the loan level to consider the servicing release premium and loan level pricing adjustments specific to each loan. LHFS, excluding impaired loans, are classified as Level 2. LHFS measured at fair value that become impaired are transferred from Level 2 to Level 3. There were no identified impaired loans as of June 30, 2014. Changes in the fair value of the LHFS are recorded in current earnings as a component of gain on origination and sale of loans, net.
As described above, the Company economically hedges the changes in fair value of IRLCs and LHFS caused by changes in interest rates by using mandatory trades (“AOTs”), best efforts forward delivery commitments, and put options. These instruments are considered derivative instruments and are recorded at fair value as a component of derivative assets or derivative liabilities on the consolidated balance sheet. The changes in fair value for these hedging instruments are recorded in current earnings as a component of gain on origination and sale of loans, net.
Mandatory trades are valued using inputs related to characteristics of the TBA MBS stratified by product, coupon, and settlement date. These derivatives are classified as Level 2. As of June 30, 2014, there was $1.7 billion of unsettled mandatory trade notional value outstanding.
Best efforts forward delivery commitments are valued using investor pricing considering the current base loan price. An anticipated loan funding probability is applied to value best efforts commitments hedging IRLCs, which results in the classification of these contracts as Level 3. The current base loan price and the anticipated loan funding probability are the most significant assumptions affecting the value of the best efforts commitments. The best efforts forward delivery commitments hedging LHFS are classified as Level 2; such contracts are transferred from Level 3 to Level 2 at the time the underlying loan is originated. As of June 30, 2014, there were no best effort forward delivery commitments.
The Company also purchases out-of-the-money put options on 10-year treasury futures to economically hedge interest rate risk. Risk of loss associated with the put options is limited to the premium paid for the option. These put options are actively traded in a liquid market and thus, these instruments are considered to be valued with Level 1 inputs.
The fair value of the servicing rights is based on applying the inputs to calculate the net present value of estimated servicing rights income. Significant inputs in the valuation of the servicing rights include discount rates, prepayment speeds and the cost of servicing. These inputs are predominantly Level 3 in nature as they utilize certain significant unobservable inputs including prepayment rate, default rate and discount rate assumptions. The weighted average discount rate, prepayment rate and cost to service as of June 30, 2014 was 9.6%, 11.8% and $77 per loan respectively. Changes in the fair value of servicing rights occur primarily due to realization of expected cash flows as well as the changes in valuation inputs and assumptions. If prepayments occur at a rate greater than our estimate, the fair value of the servicing rights will decrease accordingly.
The Company employs a discounted cash flow model to estimate the fair value of the unsecured term loan utilizing a discount rate derived from credit spreads commensurate with similar risk-rated instruments. Because the discount rate is an unobservable input, the unsecured term loan is classified as Level 3.
F-84
Table of Contents
The following table presents the carrying amount and estimated fair value of financial instruments included in the consolidated financial statements as of the dates indicated:
| June 30, 2014 | ||||||||||||||||
| Carrying Amount |
Estimated Fair Value | |||||||||||||||
| Level 1 | Level 2 | Level 3 | ||||||||||||||
| Assets | ||||||||||||||||
| Cash and cash equivalents |
$ | 24,225 | $ | 24,225 | $ | — | $ | — | ||||||||
| Restricted cash |
662 | 662 | — | — | ||||||||||||
| Loans held for sale, at fair value |
883,585 | — | 883,585 | — | ||||||||||||
| Derivative assets, at fair value |
63,807 | — | — | 63,807 | ||||||||||||
| Servicing rights, at fair value |
108,361 | — | — | 108,361 | ||||||||||||
| Liabilities | ||||||||||||||||
| Warehouse lines of credit |
$ | 825,917 | $ | — | $ | 825,917 | $ | — | ||||||||
| Derivative liabilities, at fair value |
13,748 | — | 13,748 | — | ||||||||||||
| Unsecured term loan |
80,000 | — | — | 84,057 | ||||||||||||
The following presents the Company’s assets and liabilities that are measured at fair value on a recurring basis at June 30, 2014:
| June 30, 2014 | ||||||||||||||||
| Recurring Fair Value Measurements of Assets (Liabilities) Using: | ||||||||||||||||
| Quoted Market Prices in Active Markets for Identical Assets (Level 1) |
Significant Other Observable Inputs (Level 2) |
Significant Unobservable Inputs (Level 3) |
Total Fair Value Measurements |
|||||||||||||
| Loans held for sale |
$ | — | $ | 883,585 | $ | — | $ | 883,585 | ||||||||
| Interest rate lock commitments (1) |
— | — | 63,605 | 63,605 | ||||||||||||
| Servicing rights |
— | — | 108,361 | 108,361 | ||||||||||||
| Forward sales contracts—assets (1) |
— | 54 | — | 54 | ||||||||||||
| Put options on treasuries—assets (1) |
1,025 | — | — | 1,025 | ||||||||||||
| Forward sales contracts—liabilities (2) |
— | (13,748 | ) | — | (13,748 | ) | ||||||||||
|
|
|
|
|
|
|
|
|
|||||||||
| Total |
$ | 1,025 | $ | 869,891 | $ | 171,966 | $ | 1,042,882 | ||||||||
|
|
|
|
|
|
|
|
|
|||||||||
| (1) | Amounts included in derivative assets, at fair value on the consolidated balance sheet. |
| (2) | Amounts included in derivative liabilities, at fair value on the consolidated balance sheet. |
The following presents the changes in the Company’s assets and liabilities that are measured at fair value on a recurring basis using significant unobservable inputs (Level 3) for the six months ended June 30, 2014:
| For the six months ended June 30, 2014 | ||||||||
| Interest Rate Lock Commitments |
Servicing Rights |
|||||||
| Balance at beginning of year |
$ | 33,687 | $ | 93,823 | ||||
| Total net gains included in earnings (realized and unrealized) |
186,019 | 40,783 | ||||||
| Sales and settlements |
||||||||
| Purchases |
— | — | ||||||
| Sales |
— | (26,245 | ) | |||||
| Settlements |
(30,417 | ) | — | |||||
| Transfers of IRLCs to closed loans |
(125,684 | ) | — | |||||
|
|
|
|
|
|||||
| Balance at end of period |
$ | 63,605 | $ | 108,361 | ||||
|
|
|
|
|
|||||
F-85
Table of Contents
The following presents the gains and losses included in earnings for the six months ended June 30, 2014 relating to the Company’s assets and liabilities that are measured at fair value on a recurring basis using significant unobservable inputs (Level 3):
| For the six months ended June 30, 2014 | ||||||||
| Interest Rate Lock Commitments (1) |
Servicing Rights (2) |
|||||||
| Total net gains (losses) included in earnings |
$ | 30,466 | $ | 40,783 | ||||
|
|
|
|
|
|||||
| Change in unrealized gains (losses) relating to assets and liabilities still held at period end |
$ | 63,605 | $ | 43,034 | ||||
|
|
|
|
|
|||||
| (1) | Gains (losses) included in gain on origination and sale of loans, net |
| (2) | Gains (losses) included in servicing gains (losses) |
The following table presents quantitative information about the valuation techniques and unobservable inputs applied to Level 3 fair value measurements for financial instruments measured at fair value on a recurring and non-recurring basis at June 30, 2014:
| June 30, 2014 | ||||
| Unobservable Input |
Range of inputs |
Weighted Average | ||
| IRLCs: |
||||
| Pull-through rate |
23.0% - 99.0% | 70.5% | ||
| Servicing rights: |
||||
| Discount rate |
8.3% - 13.0% | 9.6% | ||
| Prepayment rate |
8.8% - 16.9% | 11.8% | ||
| Cost to service |
67-89 | 77 | ||
Financial Statement Items Measured at Fair Value on a Nonrecurring Basis
The Company does not have any assets or liabilities that are recorded at fair value on a non-recurring basis as of June 30, 2014.
Fair Value of Financial Instruments Carried at Amortized Cost
As of June 30, 2014, financial instruments were either recorded at fair value or the carrying value approximated fair value. For financial instruments that were not recorded at fair value, such as cash and cash equivalents, restricted cash, accounts receivable, accounts payable, and accrued expenses and other liabilities, their carrying values approximated fair value due to the short-term nature of such instruments.
The Company’s warehouse lines of credit bear interest at a rate that is periodically adjusted based on a market index. The carrying value of warehouse lines of credit approximates fair value as of June 30, 2014.
The Company’s $80.0 million Unsecured Term Loan was entered into in October 2013. The stated rate of interest is 11% per annum. As of June 30, 2014, the fair value of this Unsecured Term Loan was $84.1 million, utilizing a discounted cash flow method using market interest rates.
NOTE 4—BALANCE SHEET NETTING
Certain derivatives, loan warehouse and repurchase agreements are subject to master netting arrangements or similar agreements. Under GAAP, in certain circumstances the Company may elect to present certain financial
F-86
Table of Contents
assets, liabilities, and related collateral subject to master netting arrangements in a net position on the consolidated balance sheet. However, the Company does not report any of these financial assets or liabilities on a net basis, and presents them on a gross basis on the consolidated balance sheet.
The table below represents financial assets and liabilities that are subject to master netting arrangements or similar agreements categorized by financial instrument, together with corresponding financial instruments and corresponding collateral received or pledged at June 30, 2014.
| June 30, 2014 | ||||||||||||||||||||||||
| Gross Amounts of Recognized Assets (Liabilities) |
Gross Amounts Offset in Consolidated Balance Sheet |
Net Amounts of Assets (Liabilities) Presented in Consolidated Balance Sheet |
Gross Amounts Not Offset in Consolidated Balance Sheet |
Net Amount | ||||||||||||||||||||
| Financial Instruments |
Cash Collateral (Received) Pledged |
|||||||||||||||||||||||
| Assets |
||||||||||||||||||||||||
| Forward delivery contracts |
$ | 54 | $ | — | $ | 54 | $ | — | $ | — | $ | 54 | ||||||||||||
| Put options on treasuries |
148 | — | 148 | — | — | 148 | ||||||||||||||||||
|
|
|
|
|
|
|
|
|
|
|
|
|
|||||||||||||
| Total Assets |
$ | 202 | $ | — | $ | 202 | $ | — | $ | — | $ | 202 | ||||||||||||
|
|
|
|
|
|
|
|
|
|
|
|
|
|||||||||||||
| Liabilities |
||||||||||||||||||||||||
| Forward delivery contracts |
$ | (13,748 | ) | $ | — | $ | (13,748 | ) | $ | 4,058 | $ | — | $ | (9,690 | ) | |||||||||
| Warehouse lines of credit |
(825,917 | ) | — | (825,917 | ) | 879,660 | 2,189 | 55,932 | ||||||||||||||||
| Debt obligations |
(80,000 | ) | — | (80,000 | ) | — | 430 | (79,570 | ) | |||||||||||||||
|
|
|
|
|
|
|
|
|
|
|
|
|
|||||||||||||
| Total Liabilities |
$ | (919,665 | ) | $ | — | $ | (919,665 | ) | $ | 883,718 | $ | 2,619 | $ | (33,328 | ) | |||||||||
|
|
|
|
|
|
|
|
|
|
|
|
|
|||||||||||||
The Company has entered into agreements with counterparties which include netting arrangements whereby the counterparties are entitled to settle their positions on a net basis. In certain circumstances, the Company is required to provide certain counterparties collateral against derivative financial instrument, warehouse line of credit or debt obligation. As of June 30, 2014, counterparties held $2.6 million of the Company’s cash and cash equivalents in margin accounts as collateral (which is classified as “Restricted cash” on the Company’s consolidated balance sheet).
NOTE 5—LOANS HELD FOR SALE, AT FAIR VALUE
Loans Held for Sale: The following table represents the unpaid principal balance of LHFS by product type of loan as of June 30, 2014:
| June 30, 2014 | ||||||||
| Amount | % | |||||||
| Conforming—fixed |
$ | 428,828 | 51 | % | ||||
| Conforming—ARM |
71,300 | 8 | ||||||
| FHA—fixed |
134,286 | 16 | ||||||
| FHA—ARM |
21,389 | 3 | ||||||
| Other |
188,457 | 22 | ||||||
|
|
|
|
|
|||||
| 844,260 | 100 | |||||||
| Fair Value Adjustment |
39,325 | |||||||
|
|
|
|||||||
| Total |
$ | 883,585 | ||||||
|
|
|
|||||||
F-87
Table of Contents
A summary of the changes in the balance of loans held for sale for the six months ended June 30, 2014 is as follows:
| 2014 | ||||
| Balance at beginning of period |
$ | 741,509 | ||
| Origination of loans |
5,356,199 | |||
| Sales |
(5,232,656 | ) | ||
| Principal payments |
(344 | ) | ||
| Fair value gain |
18,877 | |||
|
|
|
|||
| Balance at end of period |
$ | 883,585 | ||
|
|
|
|||
Gain on origination and sale of loans, net is comprised of the following components for the six months ended June 30, 2014:
| For the six months ended June 30, 2014 |
||||
| Premium from loan sales |
$ | 186,465 | ||
| Servicing rights |
51,200 | |||
| Unrealized gains from derivative assets and liabilities |
3,543 | |||
| Realized losses from derivative assets and liabilities |
(30,631 | ) | ||
| Discount points, rebates and lender paid costs |
(36,097 | ) | ||
| Mark to market gain on loans held for sale |
20,118 | |||
| Provision for loan loss obligation for loans sold |
(748 | ) | ||
|
|
|
|||
| $ | 193,849 | |||
|
|
|
|||
The Company did not have any loans on non-accrual status as of June 30, 2014.
Continuing Involvement in Loans Sold through Servicing Arrangements
Loans held for sale includes repurchase eligible loans representing certain mortgage loans sold pursuant to Government National Mortgage Association (“Ginnie Mae”) programs where the Company, as servicer, has the unilateral option to repurchase the loan if certain criteria are met, including if a loan is greater than 90 days delinquent. Regardless of whether the repurchase option has been exercised, the Company must recognize eligible loans and a corresponding repurchase liability in its consolidated balance sheet.
The balances of Ginnie Mae serviced loans that were 90 or more days past due at June 30, 2014 totaled $17.3 million and represent loans that the Company is eligible to repurchase from Ginnie Mae guaranteed securitizations as part of its contractual obligations as the servicer of the loans. The terms of the Ginnie Mae MBS program allow, but do not require, the Company to repurchase mortgage loans when the borrower has made no payments for three consecutive months. As a result of this right, the Company records the loans in Loans eligible for repurchase and records a corresponding liability in Liability for loans eligible for repurchase on its consolidated balance sheet.
F-88
Table of Contents
NOTE 6—SERVICING RIGHTS, AT FAIR VALUE
At June 30, 2014, the outstanding principal balance of the servicing portfolio was comprised of the following:
| June 30, 2014 |
||||
| Conventional |
$ | 6,852,867 | ||
| Government |
3,841,373 | |||
|
|
|
|||
| Total mortgage servicing portfolio |
$ | 10,694,240 | ||
|
|
|
|||
A summary of the unpaid principal balance of servicing rights at June 30, 2014 is as follows:
| June 30, 2014 |
||||
| Current loans |
$ | 10,577,644 | ||
| Loans 30 - 89 days delinquent |
92,632 | |||
| Loans 90 or more days delinquent or in foreclosure |
23,964 | |||
|
|
|
|||
| Total mortgage servicing portfolio |
$ | 10,694,240 | ||
|
|
|
|||
A summary of the changes in the balance of servicing rights for the six months ended June 30, 2014 is as follows:
| Balance at beginning of period |
$ | 93,823 | ||
| Additions |
51,199 | |||
| Sales proceeds (net of loss) |
(25,828 | ) | ||
| Changes in fair value: |
||||
| Due to changes in valuation inputs or assumptions |
(7,165 | ) | ||
| Other changes in fair value |
(3,668 | ) | ||
|
|
|
|||
| Balance at end of period |
$ | 108,361 | ||
|
|
|
The following is a summary of the components of loan servicing fees as reported in the Company’s consolidated statement of operations for the six months ended June 30, 2014:
| For the six months ended June 30, 2014 |
||||
| Contractual servicing fees |
$ | 12,479 | ||
| Late, ancillary and other fees |
173 | |||
|
|
|
|||
| $ | 12,652 | |||
|
|
|
|||
F-89
Table of Contents
The table below illustrates hypothetical changes in fair values of servicing rights, caused by assumed immediate changes to key assumptions that are used to determine fair value.
| Servicing Rights Sensitivity Analysis |
June 30, 2014 |
|||
| Fair Value of Servicing Rights |
$ | 108,361 | ||
| Change in Fair Value from adverse changes: |
||||
| Discount Rate: |
||||
| Increase 1% |
(3,748 | ) | ||
| Increase 2% |
(7,248 | ) | ||
| Cost of Servicing: |
||||
| Increase 10% |
(1,505 | ) | ||
| Increase 20% |
(3,009 | ) | ||
| Prepayment Speed: |
||||
| Increase 10% |
(4,705 | ) | ||
| Increase 20% |
(9,080 | ) | ||
Sensitivities are hypothetical changes in fair value and cannot be extrapolated because the relationship of changes in assumptions to changes in fair value may not be linear. Also, the effect of a variation in a particular assumption is calculated without changing any other assumption, whereas a change in one factor may result in changes to another. Accordingly, no assurance can be given that actual results would be consistent with the results of these estimates. As a result, actual future changes in servicing rights values may differ significantly from those displayed above.
NOTE 7—DERIVATIVE FINANCIAL INSTRUMENTS AND HEDGING ACTIVITIES
Derivatives instruments utilized by the Company primarily include IRLCs, AOT, TBA MBS, and out-of-the-money put options on 10-year treasury futures to hedge interest rate risk. See Note 3—Fair Value for further details on derivatives.
The following summarizes the Company’s outstanding derivative instruments as of June 30, 2014:
| Fair Value | ||||||||||||||
| Notional | Balance Sheet Location |
Asset | Liability | |||||||||||
| June 30, 2014: |
||||||||||||||
| Interest rate lock commitments |
$ | 2,226,334 | Derivative asset, at fair value | $ | 63,605 | $ | — | |||||||
| Forward sales contracts—assets |
66,000 | Derivative asset, at fair value | 54 | — | ||||||||||
| Forward sales contracts—liabilities |
1,600,980 | Derivative liabilities, at fair value | — | (13,748 | ) | |||||||||
| Put options on treasuries—assets |
1,963 | Derivative asset, at fair value | 148 | — | ||||||||||
| Put options on treasuries—liabilities |
— | — | — | |||||||||||
|
|
|
|
|
|
|
|||||||||
| Total derivative financial instruments |
$ | 3,895,277 | $ | 63,807 | $ | (13,748 | ) | |||||||
|
|
|
|
|
|
|
|||||||||
Because many of our current derivative agreements are not exchange-traded, we are exposed to credit loss in the event of nonperformance by the counterparty to the agreements. We control this risk through credit monitoring procedures including financial analysis, dollar limits and other monitoring procedures. The notional amount of our contracts does not represent our exposure to credit loss.
F-90
Table of Contents
The following summarizes the realized and unrealized gains and losses on derivative instruments, included in gain on origination and sale of loans, net in the consolidated statement of operations, for the six months ended June 30, 2014:
| Six months ended June 30, 2014 |
||||
| Interest rate lock commitments |
$ | 30,466 | ||
| Forward sales contracts |
(22,880 | ) | ||
| Put options on treasuries |
(4,043 | ) | ||
| Pair off |
(30,631 | ) | ||
|
|
|
|||
| Total losses |
$ | (27,088 | ) | |
|
|
|
|||
NOTE 8—WAREHOUSE LINES OF CREDIT
At June 30, 2014, the Company is a party to eight lines of credit with lenders providing $1.2 billion of warehouse facilities. The warehouse facilities are used to fund, and are secured by, residential loans held for sale. Interest expense from warehouse lines of credit is recorded to interest expense.
The lines of credit are repaid using proceeds from the sale of loans. The base interest rates on the Company’s warehouse lines of credit range from 30 day LIBOR plus 1.95% to 30 day LIBOR plus 2.75%. All of the Company’s warehouse lines are scheduled to expire in 2014 and 2015 under one year terms and all lines are subject to renewal based on an annual credit review conducted by the lender.
The base interest rates for all warehouse lines of credit are subject to increase based upon the characteristics of the underlying loans collateralizing the lines of credit, including, but not limited to product type and number of days held for sale. Certain of the warehouse line lenders require the Company, at all times, to maintain cash accounts with minimum required balances. As of June 30, 2014, there was $2.2 million held in these accounts which are recorded as a component of restricted cash on the consolidated balance sheet.
Under the terms of these warehouse lines, the Company is required to maintain various financial and other covenants. These financial covenants include, but are not limited to, maintaining (i) minimum tangible net worth, (ii) minimum liquidity, (iii) a minimum current ratio, (iv) a maximum distribution requirement, (v) a maximum leverage ratio, (vi) pre-tax net income requirements and (vii) a maximum warehouse capacity ratio. As of June 30, 2014, the Company was in compliance with its warehouse lending related covenants.
The following table presents certain information on warehouse borrowings and related accrued interest at June 30, 2014:
| Total Facility amount |
Outstanding Balance June 30, 2014 |
Expiration date | Margin (1) | |||||||||||
| Facility 1 |
$ | 150,000 | $ | 120,818 | 3/20/2015 | 2.750 | % | |||||||
| Facility 2 |
250,000 | 225,327 | 6/17/2015 | 2.125 | ||||||||||
| Facility 3 |
250,000 | 216,544 | 4/28/2015 | 2.500 | ||||||||||
| Facility 4 |
100,000 | 92,456 | 3/19/2015 | 2.375 | ||||||||||
| Facility 5 |
200,000 | 64,724 | 8/22/2014 | 2.500 | ||||||||||
| Facility 6 |
100,000 | 63,470 | 6/30/2015 | 2.500 | ||||||||||
| Facility 7 |
75,000 | — | 6/15/2015 | 2.500 | ||||||||||
| Facility 8(2) |
100,000 | 42,580 | N/A | 1.600 | ||||||||||
|
|
|
|
|
|||||||||||
| Total |
$ | 1,225,000 | $ | 825,917 | ||||||||||
|
|
|
|
|
|||||||||||
| (1) | Applicable margin to one-month LIBOR |
| (2) | Includes a LIBOR floor of 35 basis points |
F-91
Table of Contents
NOTE 9—COMMITMENTS AND CONTINGENCIES
Escrow Services
In conducting its operations, the Company, through its wholly-owned subsidiary, LD Escrow, Inc., routinely holds customers’ assets in escrow pending completion of real estate financing transactions. These amounts are maintained in segregated bank accounts and are offset with the related liabilities resulting in no amounts reported in the accompanying consolidated balance sheet. The balances held for the Company’s customers totaled $1.8 million at June 30, 2014. The Company earned $4.0 million in fees from escrow related services for the six months ended June 30, 2014. Escrow fees are included in other income on the consolidated statement of operations.
Legal Proceedings
The Company is a defendant in or a party to a number of legal actions or proceedings that arise in the ordinary course of business. In some of these actions and proceedings, claims for monetary damages are asserted against the Company. In view of the inherent difficulty of predicting the outcome of such legal actions and proceedings, the Company generally cannot predict what the eventual outcome of the pending matters will be, what the timing of the ultimate resolution of these matters will be, or what the eventual loss related to each pending matter may be, if any.
The Company seeks to resolve all litigation and regulatory matters in the manner management believes is in the best interest of the Company and contests liability, allegations of wrongdoing and, where applicable, the amount of damages or scope of any penalties or other relief sought as appropriate in each pending matter. On at least a quarterly basis, the Company assesses its liabilities and contingencies in connection with outstanding legal and regulatory proceedings utilizing the latest information available. Any estimated loss is subject to significant judgment and is based upon currently available information, a variety of assumptions, and known and unknown uncertainties. Where available information indicates that it is probable a liability has been incurred and the Company can reasonably estimate the amount of the loss, an accrued liability is established. The actual costs of resolving these proceedings may be substantially higher or lower than the amounts accrued.
Based on the Company’s current understanding of these pending legal actions and proceedings, management does not believe that judgments or settlements arising from pending or threatened legal matters, individually or in the aggregate, will have a material adverse effect on the consolidated financial position, operating results or cash flows of the Company. However, unfavorable resolution could affect the consolidated financial position, results of operations or cash flows for the years in which they are resolved.
Regulatory Requirements
The Company is subject to various capital requirements by the U.S. Department of Housing and Urban Development (“HUD”); lenders of the warehouse lines of credit; and secondary markets investors. Failure to maintain minimum capital requirements could result in the inability to participate in HUD-assisted mortgage insurance programs, to borrow funds from warehouse line lenders or to sell or service mortgage loans. As of June 30, 2014, the Company was in compliance with its selling and servicing capital requirements.
Commitments to Extend Credit
The Company enters into IRLCs with customers who have applied for residential mortgage loans and meet certain credit and underwriting criteria. These commitments expose the Company to market risk if interest rates change and the loan is not economically hedged or committed to an investor. The Company is also exposed to credit loss if the loan is originated and not sold to an investor and the customer does not perform. The collateral upon extension of credit typically consists of a first deed of trust in the mortgagor’s residential property. Commitments to originate loans do not necessarily reflect future cash requirements as some commitments are
F-92
Table of Contents
expected to expire without being drawn upon. Total commitments to originate loans as of June 30, 2014 approximated $2.2 billion. These loan commitments are treated as derivatives and are carried at fair value (See Note 7—Derivative Financial Instruments and Hedging Activities).
Loan Loss Obligation for Sold Loans
When the Company sells mortgage loans, it makes customary representations and warranties to the purchasers about various characteristics of each loan such as the origination and underwriting guidelines, including but not limited to the validity of the lien securing the loan, property eligibility, borrower credit, income and asset requirements, and compliance with applicable federal, state and local law. The Company’s whole loan sale agreements generally require it to repurchase loans if the Company breached a representation or warranty given to the loan purchaser.
The Company’s loan loss obligation for sold loans is reflected in accrued expenses and other liabilities. For the six months ended June 30, 2014, the Company refunded premiums of $32.0 thousand related to early payoffs. There have been losses of $0.5 million associated with early payment defaults or losses related to representations, warranties and other provisions for the six months ended June 30, 2014.
The activity related to the loan loss obligation for sold loans for the six months ended June 30, 2014 is as follows:
| For the six months ended June 30, 2014 |
||||
| Balance at beginning of period |
$ | 8,411 | ||
| Provision for loan losses |
748 | |||
| Payments, realized losses and other |
(515 | ) | ||
|
|
|
|||
| Balance at end of period |
$ | 8,645 | ||
|
|
|
|||
F-93
Table of Contents

Independent Auditors’ Report
To the Board of Directors of Mortgage Master, Inc.:
Report on the Financial Statements
We have audited the accompanying financial statements of Mortgage Master, Inc., which comprise the balance sheets as of December 31, 2014 and 2013, and the related statements of income, changes in stockholders’ equity, and cash flows for the years then ended and the related notes to the financial statements.
Management’s Responsibility for the Financial Statements
Management is responsible for the preparation and fair presentation of these financial statements in accordance with accounting principles generally accepted in the United States of America; this includes the design, implementation, and maintenance of internal control relevant to the preparation and fair presentation of financial statements that are free from material misstatement, whether due to fraud or error.
Auditors’ Responsibility
Our responsibility is to express an opinion on these financial statements based on our audits. We conducted our audits in accordance with auditing standards generally accepted in the United States of America. Those standards require that we plan and perform the audit to obtain reasonable assurance about whether the financial statements are free from material misstatement.
An audit involves performing procedures to obtain audit evidence about the amounts and disclosures in the financial statements. The procedures selected depend on the auditors’ judgment, including the assessment of the risks of material misstatement of the financial statements, whether due to fraud or error. In making those risk assessments, the auditor considers internal control relevant to the entity’s preparation and fair presentation of the financial statements in order to design audit procedures that are appropriate in the circumstances, but not for the purpose of expressing an opinion on the effectiveness of the entity’s internal control. Accordingly, we express no such opinion. An audit also includes evaluating the appropriateness of accounting policies used and the reasonableness of significant accounting estimates made by management, as well as evaluating the overall presentation of the financial statements.
We believe that the audit evidence we have obtained is sufficient and appropriate to provide a basis for our audit opinion.
Opinion
In our opinion, the financial statements referred to above present fairly, in all material respects, the financial position of Mortgage Master, Inc. as of December 31, 2014 and 2013, and the results of their operations and their cash flows for the years then ended, in accordance with accounting principles generally accepted in the United States of America.
/s/ Wolf & Company, P.C.
Boston, Massachusetts
April 21, 2015
F-94
Table of Contents
BALANCE SHEETS
December 31, 2014 and 2013
| 2014 | 2013 | |||||||
| ASSETS |
||||||||
| Current assets: |
||||||||
| Cash and cash equivalents |
$ | 11,846,143 | $ | 26,938,590 | ||||
| Loans held for sale |
334,571,799 | 214,717,975 | ||||||
| Other loans |
5,073,365 | 4,572,454 | ||||||
| Derivative assets |
5,524,476 | 3,879,689 | ||||||
| Client funds held in escrow |
406,213 | 323,340 | ||||||
| Funds due from attorneys and investors |
1,868,233 | 1,040,298 | ||||||
| Prepaid expenses and other current assets |
656,592 | 1,145,543 | ||||||
|
|
|
|
|
|||||
| Total current assets |
359,946,821 | 252,617,889 | ||||||
|
|
|
|
|
|||||
| Property and equipment: |
||||||||
| Building and improvements |
153,362 | 153,362 | ||||||
| Office equipment and software |
9,627,537 | 8,783,151 | ||||||
| Furniture and fixtures |
2,295,948 | 2,279,899 | ||||||
| Vehicles |
520,933 | 520,933 | ||||||
|
|
|
|
|
|||||
| Total cost |
12,597,780 | 11,737,345 | ||||||
| Less: Accumulated depreciation and amortization |
(8,814,171 | ) | (6,959,148 | ) | ||||
|
|
|
|
|
|||||
| Property and equipment, net |
3,783,609 | 4,778,197 | ||||||
|
|
|
|
|
|||||
| Other assets: |
||||||||
| Security deposits |
357,499 | 353,998 | ||||||
|
|
|
|
|
|||||
| Total assets |
$ | 364,087,929 | $ | 257,750,084 | ||||
|
|
|
|
|
|||||
| LIABILITIES AND STOCKHOLDERS’ EQUITY |
||||||||
| Current liabilities: |
||||||||
| Warehouse lines of credit |
$ | 316,347,775 | $ | 201,637,989 | ||||
| Accounts payable |
761,141 | 1,215,359 | ||||||
| Accrued expenses |
5,059,114 | 6,481,613 | ||||||
| Derivative liabilities |
1,085,325 | 828,180 | ||||||
| Refundable loan origination fees |
406,213 | 323,340 | ||||||
| Deferred state taxes |
608,199 | 422,954 | ||||||
| Funds due to investors |
1,371,628 | 786,554 | ||||||
|
|
|
|
|
|||||
| Total current liabilities |
325,639,395 | 211,695,989 | ||||||
|
|
|
|
|
|||||
| Commitments and contingencies (Notes 4 and 7) |
||||||||
| Stockholders’ equity: |
||||||||
| Common stock, no par value; 15,000 shares authorized; 200 shares issued and outstanding |
2,500 | 2,500 | ||||||
| Additional paid-in capital |
4,834,764 | 4,834,764 | ||||||
| Retained earnings |
33,611,270 | 41,216,831 | ||||||
|
|
|
|
|
|||||
| Total stockholders’ equity |
38,448,534 | 46,054,095 | ||||||
|
|
|
|
|
|||||
| Total liabilities and stockholders’ equity |
$ | 364,087,929 | $ | 257,750,084 | ||||
|
|
|
|
|
|||||
See accompanying notes to financial statements
F-95
Table of Contents
STATEMENTS OF INCOME
Years ended December 31, 2014 and 2013
| 2014 | 2013 | |||||||
| Loan origination income |
$ | 84,650,095 | $ | 131,104,950 | ||||
|
|
|
|
|
|||||
| Direct loan origination costs: |
||||||||
| Commissions |
32,760,515 | 52,521,851 | ||||||
| Other salaries and benefits |
20,782,586 | 25,783,364 | ||||||
| Other costs |
10,733,651 | 13,820,614 | ||||||
|
|
|
|
|
|||||
| Total direct loan origination costs |
64,276,752 | 92,125,829 | ||||||
|
|
|
|
|
|||||
| Net gains on sales of mortgage loans |
20,373,343 | 38,979,121 | ||||||
| Interest income on loans held for sale |
8,128,279 | 12,151,281 | ||||||
|
|
|
|
|
|||||
| Total operating income |
28,501,622 | 51,130,402 | ||||||
|
|
|
|
|
|||||
| Operating expenses: |
||||||||
| Salary and benefits |
14,130,827 | 20,995,040 | ||||||
| Occupancy and equipment |
6,539,348 | 6,079,765 | ||||||
| Interest expense on warehouse lines of credit |
4,660,250 | 8,307,837 | ||||||
| General and administrative |
9,644,663 | 11,771,049 | ||||||
|
|
|
|
|
|||||
| Total operating income |
34,975,088 | 47,153,691 | ||||||
|
|
|
|
|
|||||
| Net income (loss) from operations |
(6,473,466 | ) | 3,976,711 | |||||
| Other income |
418,938 | 320,093 | ||||||
|
|
|
|
|
|||||
| Income (loss) before state income taxes |
(6,054,528 | ) | 4,296,804 | |||||
| State income tax provision |
338,505 | 125,564 | ||||||
|
|
|
|
|
|||||
| Net income (loss) |
$ | (6,393,033 | ) | $ | 4,171,240 | |||
|
|
|
|
|
|||||
See accompanying notes to financial statements.
F-96
Table of Contents
STATEMENTS OF CHANGES IN STOCKHOLDERS’ EQUITY
Years Ended December 31, 2014 and 2013
| Common Stock |
Additional Paid-in Capital |
Retained Earnings |
Total Stockholders’ Equity |
|||||||||||||
| Balance at December 31, 2012 |
$ | 2,500 | $ | 4,834,764 | $ | 52,480,796 | $ | 57,318,060 | ||||||||
| Net income |
— | — | 4,171,240 | 4,171,240 | ||||||||||||
| Distributions to stockholders |
— | — | (15,435,205 | ) | (15,435,205 | ) | ||||||||||
|
|
|
|
|
|
|
|
|
|||||||||
| Balance at December 31, 2013 |
2,500 | 4,834,764 | 41,216,831 | 46,054,095 | ||||||||||||
| Net loss |
— | — | (6,393,033 | ) | (6,393,033 | ) | ||||||||||
| Distributions to stockholders |
— | — | (1,212,528 | ) | (1,212,528 | ) | ||||||||||
|
|
|
|
|
|
|
|
|
|||||||||
| Balance at December 31, 2014 |
$ | 2,500 | $ | 4,834,764 | $ | 33,611,270 | $ | 38,448,534 | ||||||||
|
|
|
|
|
|
|
|
|
|||||||||
See accompanying notes to financial statements.
F-97
Table of Contents
STATEMENTS OF CASH FLOWS
Years Ended December 31, 2014 and 2013
| 2014 | 2013 | |||||||
| Cash flows from operating activities: |
||||||||
| Net income (loss) |
$ | (6,393,033 | ) | $ | 4,171,240 | |||
| Adjustments to reconcile net income (loss) to net cash provided (used) by operating activities: |
||||||||
| Depreciation and amortization |
1,855,028 | 1,425,349 | ||||||
| Change in fair value of derivative instruments, net |
(2,884,285 | ) | 7,583,134 | |||||
| Deferred state tax provision (benefit) |
185,245 | (591,188 | ) | |||||
| Net change in: |
||||||||
| Loans held for sale |
(118,357,181 | ) | 282,318,712 | |||||
| Funds due to/from attorneys and investors |
(242,861 | ) | 57,228 | |||||
| Prepaid expenses and other current assets |
488,951 | (825,077 | ) | |||||
| Security deposits |
(3,501 | ) | (70,974 | ) | ||||
| Accounts payable |
(454,218 | ) | (637,573 | ) | ||||
| Accrued expenses |
(1,422,499 | ) | (6,273,820 | ) | ||||
|
|
|
|
|
|||||
| Net cash provided (used) by operating activities |
(127,228,354 | ) | 287,157,031 | |||||
|
|
|
|
|
|||||
| Cash flows from investing activities: |
||||||||
| Net decrease (increase) in other loans |
(500,911 | ) | 23,280 | |||||
| Purchases of property and equipment, net |
(860,440 | ) | (2,204,939 | ) | ||||
|
|
|
|
|
|||||
| Net cash used by investing activities |
(1,361,351 | ) | (2,181,659 | ) | ||||
|
|
|
|
|
|||||
| Cash flows from financing activities: |
||||||||
| Net increase (decrease) in warehouse lines of credit |
114,709,786 | (265,383,182 | ) | |||||
| Distributions to stockholders |
(1,212,528 | ) | (15,435,205 | ) | ||||
|
|
|
|
|
|||||
| Net cash provided (used) by financing activities |
113,497,258 | (280,818,387 | ) | |||||
|
|
|
|
|
|||||
| Change in cash and cash equivalents |
(15,092,447 | ) | 4,156,985 | |||||
|
|
|
|
|
|||||
| Cash and cash equivalents at beginning of year |
26,938,590 | 22,781,605 | ||||||
|
|
|
|
|
|||||
| Cash and cash equivalents at end of year |
$ | 11,846,143 | $ | 26,781,605 | ||||
|
|
|
|
|
|||||
| Supplemental cash flow information: |
||||||||
| Interest paid |
$ | 4,562,666 | $ | 8,646,289 | ||||
| Income taxes paid |
99,549 | 1,893,880 | ||||||
See accompanying notes to financial statements.
F-98
Table of Contents
NOTES TO FINANCIAL STATEMENTS
Years ended December 31, 2014 and 2013
1. Summary of Significant Accounting Policies
Basis of presentation and business of the Company
Mortgage Master, Inc. (the “Company”) originates residential mortgage loans from its headquarters in Walpole, Massachusetts, and offices throughout the United States. All loans are generally originated for sale and subsequently sold on a servicing released basis.
Use of estimates
The preparation of financial statements requires management to make estimates and assumptions that affect the reported amounts of assets and liabilities and disclosure of contingent assets and liabilities at the date of the financial statements and the reported amounts of revenues and expenses during the reporting period. Actual results could differ from those estimates.
The valuation of derivative assets and liabilities and loans held for sale is a material estimate particularly susceptible to change in the near term.
Cash and cash equivalents
Cash equivalents consist of interest-bearing overnight deposits in financial institutions.
At December 31, 2014, pursuant to requirements under several of the Company’s warehouse line of credit agreements, the Company was required to maintain a combined compensating cash balance of $3,000,000 on hand with correspondent financial institutions.
Revenue recognition
Net gains on sales of mortgage loans consist of loan origination income less direct loan origination costs. Loan origination income includes points earned on mortgage loans, net premiums and discounts on the sale of loans and related servicing rights, other mortgage origination related income and changes in fair value of mortgage banking derivatives. Net gains on sales of mortgage loans are recognized at the time of loan sale closing.
In connection with mortgage originations, the Company holds funds in trust for mortgages in process representing amounts collected for commitment fees, appraisal fees, credit report fees, and fees for locking in mortgage rates. Such funds are reported as client funds held in escrow and refundable loan origination fees on the accompanying balance sheets.
Fair value hierarchy
The Company groups its assets and liabilities measured at fair value in three levels, based on the markets in which the assets and liabilities are traded and the reliability of the assumptions used to determine fair value.
Level 1—Valuation is based on quoted prices in active markets for identical assets or liabilities. Valuations are obtained from readily available pricing sources for market transactions involving identical assets or liabilities.
Level 2—Valuation is based on observable inputs other than Level 1 prices, such as quoted prices for similar assets or liabilities; quoted prices in markets that are not active; or other inputs that are observable or can be corroborated by observable market data for substantially the full term of the assets or liabilities.
F-99
Table of Contents
MORTGAGE MASTER, INC.
NOTES TO FINANCIAL STATEMENTS—(Continued)
Level 3—Valuation is based on unobservable inputs that are supported by little or no market activity and that are significant to the fair value of the assets or liabilities. Level 3 assets and liabilities include financial instruments whose value is determined using unobservable inputs to pricing models, discounted cash flow methodologies, or similar techniques, as well as instruments for which the determination of fair value requires significant management judgment or estimation.
Transfers between levels are recognized at the end of a reporting period, if applicable.
Loans held for sale
Loans originated and intended for sale in the secondary market are carried at the lower of cost or estimated fair value in the aggregate. In determining fair value, consideration is given to commitments on hand from investors and prevailing market prices. Net unrealized losses, if any, are recognized through a valuation allowance by charges to income.
Transfers of financial assets
Transfers of an entire financial asset, a group of entire financial assets, or a participating interest in an entire financial asset are accounted for as sales when control over the assets has been surrendered. Control over transferred assets is deemed to be surrendered when (1) the assets have been isolated from the Company, (2) the transferee obtains the right to pledge or exchange the transferred assets, and (3) the Company does not maintain effective control over the transferred assets.
Other loans
Other loans consist of bridge loans that the Company expects to hold until maturity or payoff and are carried at the outstanding principal balance.
Funds due from attorneys and investors
Funds due from attorneys and investors consist of funds received after the balance sheet date for closings and loan sales that occurred during the year.
Funds due to investors
Funds due to investors consist of escrow payments collected from borrowers for loans sold before year end and due to the investor that purchased the loan.
Property and equipment
Property and equipment are carried at cost, less accumulated depreciation and amortization computed on an accelerated method over the estimated useful lives of the assets or expected terms of the related leases, if shorter. Expected terms include lease option periods to the extent that the exercise of such options is reasonably assured.
Advertising
The Company expenses advertising costs as incurred. Advertising expense for the years ended December 31, 2014 and 2013 was $1,815,941 and $2,134,927, respectively, and is included in general and administrative expenses in the statements of income.
F-100
Table of Contents
MORTGAGE MASTER, INC.
NOTES TO FINANCIAL STATEMENTS—(Continued)
Income taxes
The Company, with the consent of each of its stockholders, elected to have its earnings taxed in accordance with Subchapter S of Chapter 1 of the Internal Revenue Code of 1986, as amended. Accordingly, for U.S. Federal income tax purposes, the Company’s earnings are taxed directly to the Company’s stockholders.
The tax provision includes primarily the tax assessed to the Massachusetts S Corporation at the Massachusetts corporate excise tax rate of 2.80% on its Massachusetts income. The Company is also taxed in other states in which it does business at rates ranging from approximately 5-10%.
Deferred state taxes are provided on temporary differences between the reporting of income for financial statement and income tax reporting purposes, to the extent that their realization is more likely than not. The temporary differences result primarily from certain expenses being deducted in different periods for financial and tax reporting purposes. During the years ended December 31, 2014 and 2013, the Company recorded a deferred tax benefit (provision) of ($185,245) and $591,188, respectively, which is included in state income tax provision in the statements of income.
The Company follows accounting guidance regarding the recognition, measurement, presentation and disclosure of uncertain tax positions in the financial statements. Tax positions taken or expected to be taken in the course of preparing the Company’s tax returns are required to be evaluated to determine whether the tax positions are “more-likely-than-not” to be upheld under regulatory review. The resulting tax impact of these tax positions are recognized in the financial statements based on the results of this evaluation. The Company’s policy is to recognize interest and penalties related to income tax matters in income tax expense. As of December, 31, 2014 and 2013, the Company did not recognize any tax liabilities associated with uncertain tax positions, nor have any interest or penalties been recorded in relation to uncertain tax positions.
The Company is subject to federal and state tax examinations for all years subsequent to December 31, 2011.
2. Sale to Loandepot
On November 12, 2014, the Company executed an Asset Purchase Agreement (“APA”) for the sale of specified assets and assumption of specified liabilities to loanDepot.com, LLC (“loanDepot”). The closing date of the APA was January 2, 2015. The assets sold and liabilities assumed are those identified as necessary for the continuation of business operations under loanDepot’s name, effective January 2, 2015, and specifically excludes automobiles used by the Company’s shareholders, certain pipeline loans, loans held for sale, bridge loans and excess cash not transferred to loanDepot. The purchase price for sale of the Company’s assets and operations is the book value of assets acquired, a percentage of earnings on acquired pipeline loans and a variable earnout amount. The variable earnout amount ranges from $12,500,000 to $45,000,000 depending on the operations of loanDepot’s Mortgage Master Division.
3. Concentration of Credit Risk
The Company maintains its cash accounts at various financial institutions. The Company may maintain cash amounts in excess of federally insured limits at certain financial institutions. At December 31, 2014, the Company had $13,351,888 of cash at financial institutions in excess of federally-insured limits.
4. Property and Equipment
Depreciation and amortization expense for the years ended December 31, 2014 and 2013 amounted to $1,855,028 and $1,425,349, respectively.
F-101
Table of Contents
MORTGAGE MASTER, INC.
NOTES TO FINANCIAL STATEMENTS—(Continued)
The Company had various noncancelable lease agreements in effect at December 31, 2014 pertaining to property and equipment. All commitments under noncancelable lease agreements were assumed by loanDepot on January 2, 2015, the closing date of the APA (see Note 2).
Total rent expense for the years ended December 31, 2014 and 2013 amounted to $3,453,891 and $3,008,975, respectively, and is included in occupancy and equipment expense in the statements of income.
5. Related Party Transactions
The Company has a Branch Operator Agreement with a limited liability company, whose sole member is an employee of the Company. The agreement requires the Company to pay this company a set amount of basis points per quarter based on the loan volume of the Greenwich, CT office of the Company. For the years ended December 31, 2014 and 2013, expense under this agreement amounted to $99,759 and $277,774, respectively, and is included in general and administrative expense in the statements of income.
6. Warehouse Lines of Credit
At December 31, 2014 and 2013, the Company has $500,000,000 and $550,000,000, respectively, in warehouse line of credit agreements with unrelated third parties. Advances under the lines are secured by certain eligible loans or liquid assets (as defined). Interest is payable monthly and accrues at a rate which is tied to the monthly average LIBOR, adjusted based on the nature of the underlying collateral. The Company is required to maintain adjusted tangible net worth (as defined in each agreement). See Note 10 – Capital Requirements. The Company is subject to financial and non-financial covenants in connection with these agreements. The Company received waivers for various covenant violations at December 31, 2014 and throughout the year then ended. Certain counterparties to the agreements elected to not formally waive covenant violations at December 31, 2014 due to the termination and payoff of the lines subsequent to the closing of the APA with loanDepot, as further described in Note 2.
7. Other Commitments and Contingencies and Derivatives
In the normal course of business, there are outstanding commitments which are not reflected on the accompanying balance sheets.
Loan commitments
The Company is a party to financial instruments with off-balance sheet risk in the normal course of business to meet the financing needs of its customers. These financial instruments include commitments to extend credit. These instruments involve, to varying degrees, elements of credit and interest rate risk in excess of the amount recognized in the balance sheets. The Company’s exposure to credit loss is represented by the contractual amount of these instruments. The Company uses the same credit policies in making commitments and conditional obligations as it does for on-balance-sheet instruments.
Commitments to originate loans are agreements to lend to a customer provided there is no violation of any condition established in the contract. Commitments generally have fixed expiration dates or other termination clauses and may require payment of a fee.
Mortgage loan commitments are referred to as derivative loan commitments if the loan that will result from exercise of the commitment will be held for sale upon funding. The Company enters into commitments to fund
F-102
Table of Contents
MORTGAGE MASTER, INC.
NOTES TO FINANCIAL STATEMENTS—(Continued)
residential mortgage loans at specified times in the future, with the intention that these loans will subsequently be sold in the secondary market. A mortgage loan commitment binds the Company to lend funds to a potential borrower at a specified interest rate and within a specified period of time, generally up to 60 days after inception of the rate lock. Outstanding derivative loan commitments expose the Company to the risk that the price of the loans arising from exercise of the loan commitment might decline from inception of the rate lock to funding of the loan due to increases in mortgage interest rates. If interest rates increase, the value of these loan commitments decreases. Conversely, if interest rates decrease, the value of these loan commitments increases.
The Company utilizes both “best efforts” and “mandatory delivery” forward loan sale commitments to mitigate the risk of potential decreases in the values of loans that would result from the exercise of the derivative loan commitments.
With a “best efforts” contract, the Company commits to deliver an individual mortgage loan of a specified principal amount and quality to an investor if the loan to the underlying borrower closes. Generally, the price the investor will pay the seller for an individual loan is specified prior to the loan being funded (e.g., on the same day the lender commits to lend funds to a potential borrower). These best efforts commitments and related rate lock agreements amounted to $596,591,699 and $311,776,791 at December 31, 2014 and 2013, respectively.
The Company also enters into forward mandatory mortgage-backed securities commitments as an economic hedge against certain borrower rate lock agreements and loans held for sale, whereby the Company commits to sell mortgage-backed securities at a specified price on or before a specified date. On the settlement date, the Company purchases the same security to cover the sale and net gain or loss (pair off) is received or paid by the Company. The Company records the fair value of these derivative instruments, along with the corresponding derivative loan commitments, through the income statement. These instruments involve, to varying degrees, elements of credit and interest rate risk in excess of the amount recognized on the balance sheets. The Company’s exposure to credit loss is represented by the contractual amount of these instruments. The Company uses the same credit policies in making commitments and conditional obligations as it does for on-balance-sheet instruments.
The following table presents information pertaining to the Company’s derivative instruments that are recorded at fair value in the financial statements:
| At December 31, 2014 | Year Ended December 31, 2014 | |||||||||||||||
| Derivative Instruments on Balance Sheet |
Notional Amount |
Fair Value |
Location of Gain (Loss) |
Amount of Gain (Loss) |
||||||||||||
| (In thousands) | ||||||||||||||||
| Forward mandatory securities commitments: |
||||||||||||||||
| Gains |
$ | 1,000 | $ | — | ||||||||||||
| Losses |
67,000 | (649 | ) | |||||||||||||
|
|
|
|
|
|||||||||||||
| 68,000 | (649 | ) | Loan origination income | $ | (1,697 | ) | ||||||||||
|
|
|
|
|
|||||||||||||
| Derivative loan commitments: |
||||||||||||||||
| Gains |
$ | 607,660 | 5,524 | |||||||||||||
| Losses |
61,175 | (436 | ) | |||||||||||||
|
|
|
|
|
|||||||||||||
| $ | 668,835 | 5,088 | Loan origination income | 3,085 | ||||||||||||
|
|
|
|
|
|
|
|||||||||||
| Net gain on derivative instruments |
$ | 4,439 | $ | 1,388 | ||||||||||||
|
|
|
|
|
|||||||||||||
F-103
Table of Contents
MORTGAGE MASTER, INC.
NOTES TO FINANCIAL STATEMENTS—(Continued)
| At December 31, 2013 | Year Ended December 31, 2013 | |||||||||||||||
| Derivative Instruments on Balance Sheet |
Notional Amount |
Fair Value |
Location of Gain (Loss) |
Amount of Gain (Loss) |
||||||||||||
| (In thousands) | ||||||||||||||||
| Forward mandatory securities commitments: |
||||||||||||||||
| Gains |
$ | 84,000 | $ | 1,088 | ||||||||||||
| Losses |
8,000 | (40 | ) | |||||||||||||
|
|
|
|
|
|||||||||||||
| 92,000 | 1,048 | Loan origination income | $ | (1,230 | ) | |||||||||||
|
|
|
|
|
|||||||||||||
| Derivative loan commitments: |
||||||||||||||||
| Gains |
$ | 320,339 | 2,791 | |||||||||||||
| Losses |
83,887 | (788 | ) | |||||||||||||
|
|
|
|
|
|||||||||||||
| $ | 404,226 | 2,003 | Loan origination income | (7,165 | ) | |||||||||||
|
|
|
|
|
|
|
|||||||||||
| Net gain on derivative instruments |
$ | 3,051 | $ | (5,935 | ) | |||||||||||
|
|
|
|
|
|||||||||||||
Recourse provisions
The Company has sold certain loans to an investor pursuant to an agreement which includes recourse provisions that give the investor the authority to require the Company to repurchase loans in the event a borrower defaults on the loan. The Company has never been required to repurchase any loans under this agreement. The Company no longer sells loans to this investor.
Other contingencies
Various legal claims arise from time to time in the normal course of business which, in the opinion of management, will have no material effect on the Company’s financial position.
8. Retirement Plan
The Company has a 401(k) profit sharing plan which covers substantially all employees, as defined in the plan document. The Company’s contribution is discretionary and is determined by its Board of Directors on an annual basis. There were no contributions.
9. Fair Value of Assets and Liabilities
Determination of fair value
The Company uses fair value measurements to record fair value adjustments to certain assets and liabilities and to determine fair value disclosures. The fair value of a financial instrument is the price that would be received to sell an asset or paid to transfer a liability in an orderly transaction between market participants at the measurement date. Fair value is best determined based upon quoted market prices. However, in many instances, there are no quoted market prices for the Company’s various financial instruments. In cases where quoted market prices are not available, fair values are based on estimates using present value or other valuation techniques. Those techniques are significantly affected by the assumptions used, including the discount rate and estimates of future cash flows. Accordingly, the fair value estimates may not be realized in an immediate settlement of the instrument.
F-104
Table of Contents
MORTGAGE MASTER, INC.
NOTES TO FINANCIAL STATEMENTS—(Continued)
The following methods and assumptions were used by the Company in estimating fair value:
Cash and cash equivalents—The carrying amounts of cash and short-term investments approximate fair values based on the short-term nature of the assets.
Loans held for sale—The fair value of loans held for sale is based on commitments in effect from investors or prevailing market prices.
Other loans—The carrying value of other loans approximates fair value due to the short-term nature of substantially all of these loans.
Warehouse lines of credit—The carrying amounts of warehouse lines of credit approximate fair value based upon the short-term nature of the liabilities at variable interest rates.
Derivative financial instruments—The fair value of these instruments are based on fair values of the underlying instruments adjusted for the probability the commitments will be exercised.
Off-balance sheet credit-related instruments—Fair values for off-balance-sheet, credit-related financial instruments are based on fees currently charged to enter into similar agreements, taking into account the remaining terms of the agreements and the counterparties’ credit standing. The fair value of these instruments are not material.
Assets and liabilities measured at fair value
Assets and liabilities measured at fair value on a recurring basis at December 31, 2014 and 2013 are summarized below:
| December 31, 2014 | ||||||||||||||||
| Level 1 | Level 2 | Level 3 | Fair Value | |||||||||||||
| Assets |
||||||||||||||||
| Derivative assets |
$ | — | $ | 5,524,476 | $ | — | $ | 5,524,476 | ||||||||
|
|
|
|
|
|
|
|
|
|||||||||
| Liabilities |
||||||||||||||||
| Derivative liabilities |
$ | — | $ | 1,085,325 | $ | — | $ | 1,085,325 | ||||||||
|
|
|
|
|
|
|
|
|
|||||||||
| December 31, 2013 | ||||||||||||||||
| Level 1 | Level 2 | Level 3 | Fair Value | |||||||||||||
| Assets |
||||||||||||||||
| Derivative assets |
$ | — | $ | 3,879,689 | $ | — | $ | 3,879,689 | ||||||||
|
|
|
|
|
|
|
|
|
|||||||||
| Liabilities |
||||||||||||||||
| Derivative liabilities |
$ | — | $ | 828,180 | $ | — | $ | 828,180 | ||||||||
|
|
|
|
|
|
|
|
|
|||||||||
At December 31, 2014 and 2013, the Company did not record any assets or liabilities at fair value on a nonrecurring basis.
F-105
Table of Contents
MORTGAGE MASTER, INC.
NOTES TO FINANCIAL STATEMENTS—(Continued)
Summary of fair values of financial instruments
The estimated fair values, and related carrying amounts, of the Company’s financial instruments at December 31, 2014 and 2013 are as follows. Certain financial instruments and all non-financial instruments are exempt from disclosure requirements. Accordingly, the aggregate fair value of amounts presented below may not necessarily represent the underlying fair value of the Company.
| December 31, | ||||||||||||||||
| 2014 | 2013 | |||||||||||||||
| Carrying Amount |
Fair Value |
Carrying Amount |
Fair Value |
|||||||||||||
| Financial assets: |
||||||||||||||||
| Cash and cash equivalents |
$ | 11,846,143 | $ | 11,846,143 | $ | 26,938,590 | $ | 26,938,590 | ||||||||
| Loans held for sale |
334,571,799 | 336,711,951 | 214,717,975 | 218,768,677 | ||||||||||||
| Other loans |
5,073,365 | 5,073,365 | 4,572,454 | 4,572,454 | ||||||||||||
| Derivative assets |
5,524,476 | 5,524,476 | 3,879,689 | 3,879,689 | ||||||||||||
| Financial liabilities: |
||||||||||||||||
| Warehouse lines of credit |
316,347,775 | 316,347,775 | 201,637,989 | 201,637,989 | ||||||||||||
| Derivative liabilities |
1,085,325 | 1,085,325 | 828,180 | 828,180 | ||||||||||||
10. Capital Requirements
The Company is required to comply with capital requirements in connection with its warehouse lines of credit (see Note 6). In addition, the Company is subject to various capital requirements in connection with seller/servicer agreements that the Company has entered into with secondary market investors. Failure to maintain minimum capital requirements could result in the Company’s inability to originate and sell loans to the respective investor and, therefore, could have a direct material effect on the Company’s financial statements. As of December 31, 2014, the Company did not maintain sufficient capital to comply with the requirement under the US Bank agreement. US Bank did not waive this instance of non-compliance due to the payoff of the respective line of credit in 2015. Other than this described instance, management believes, as of December 31, 2014 and 2013, that the Company met all capital requirements to which it is subject. The Company’s actual capital amounts (as defined in the agreements) and the minimum amounts required by each significant investor/debtor are as follows:
| Actual Capital |
Minimum Capital Requirement |
|||||||
| (In thousands) | ||||||||
| December 31, 2014: |
||||||||
| UBS |
$ | 38,177 | $ | 34,000 | ||||
| US Bank |
39,181 | 40,000 | ||||||
| JP Morgan Chase |
36,644 | 35,000 | ||||||
| Bank of America |
34,107 | 30,000 | ||||||
| December 31, 2013: |
||||||||
| UBS |
$ | 43,437 | $ | 34,000 | ||||
| US Bank |
46,054 | 40,000 | ||||||
| JP Morgan Chase |
43,768 | 40,000 | ||||||
| Bank of America |
41,073 | 30,000 | ||||||
F-106
Table of Contents
MORTGAGE MASTER, INC.
NOTES TO FINANCIAL STATEMENTS—(Continued)
11. Subsequent Events
Management has evaluated subsequent events through April 21, 2015, which is the date the financial statements were available to be issued. Other than summarized in Note 2, there were no subsequent events that require adjustment to or disclosure in the financial statements.
F-107
Table of Contents

| Report of Independent Certified Public Accountants |
Audit • Tax • Advisory
Grant Thornton LLP 18400 Von Karman Avenue, Suite 900 Irvine, CA 92612-0525 T 949.553.1600 F 949.553.0168 |
To the Board of Directors
imortgage.com, Inc.
We have audited the accompanying financial statements of imortgage.com, Inc. (a Delaware corporation), which comprise the balance sheet as of September 30, 2013 and December 31, 2012, and the related statements of operations, changes in stockholders’ equity, and cash flows for the nine months ended September 30, 2013 and year ended December 31, 2012, and the related notes to the financial statements.
Management’s responsibility for the financial statements
Management is responsible for the preparation and fair presentation of these financial statements in accordance with accounting principles generally accepted in the United States of America; this includes the design, implementation, and maintenance of internal control relevant to the preparation and fair presentation of financial statements that are free from material misstatement, whether due to fraud or error.
Auditor’s responsibility
Our responsibility is to express an opinion on these financial statements based on our audit. We conducted our audit in accordance with auditing standards generally accepted in the United States of America. Those standards require that we plan and perform the audit to obtain reasonable assurance about whether the financial statements are free from material misstatement.
An audit involves performing procedures to obtain audit evidence about the amounts and disclosures in the financial statements. The procedures selected depend on the auditor’s judgment, including the assessment of the risks of material misstatement of the financial statements, whether due to fraud or error. In making those risk assessments, the auditor considers internal control relevant to the entity’s preparation and fair presentation of the financial statements in order to design audit procedures that are appropriate in the circumstances, but not for the purpose of expressing an opinion on the effectiveness of the entity’s internal control. Accordingly, we express no such opinion. An audit also includes evaluating the appropriateness of accounting policies used and the reasonableness of significant accounting estimates made by management, as well as evaluating the overall presentation of the financial statements.
We believe that the audit evidence we have obtained is sufficient and appropriate to provide a basis for our audit opinion.
Opinion
In our opinion, the financial statements referred to above present fairly, in all material respects, the financial position of imortgage.com, Inc. as of September 30, 2013 and December 31, 2012, and the results of its operations and its cash flows for the nine months ended September 30, 2013 and year ended December 31, 2012 in accordance with accounting principles generally accepted in the United States of America.
/s/ Grant Thornton LLP
Irvine, CA
April 28, 2015
F-108
Table of Contents
BALANCE SHEET
| As of September 30, 2013 |
As of December 31, 2012 |
|||||||
| ASSETS |
||||||||
| Cash and cash equivalents |
$ | 34,450,152 | $ | 17,216,006 | ||||
| Restricted cash |
4,309,340 | 4,540,727 | ||||||
| Accounts receivable |
5,431,875 | 2,611,667 | ||||||
| Receivables from related party |
940,637 | 950,065 | ||||||
| Loans held for sale, at fair value |
312,508,974 | 460,435,558 | ||||||
| Derivative assets, at fair value |
11,483,651 | 10,674,602 | ||||||
| Loans held for investment, net |
1,763,825 | 1,964,261 | ||||||
| Property and equipment, net |
9,686,215 | 6,197,236 | ||||||
| Deferred tax assets, net |
4,844,595 | — | ||||||
| Other assets |
1,581,347 | 2,479,329 | ||||||
|
|
|
|
|
|||||
| Total assets |
$ | 387,000,611 | $ | 507,069,451 | ||||
|
|
|
|
|
|||||
| LIABILITIES AND STOCKHOLDERS’ EQUITY |
||||||||
| Warehouse lines of credit |
$ | 282,419,555 | $ | 424,724,202 | ||||
| Bank line of credit |
— | 3,000,000 | ||||||
| Accounts payable |
4,217,706 | 5,599,916 | ||||||
| Accrued expenses and other liabilities |
29,339,846 | 11,946,322 | ||||||
| Derivative liabilities, at fair value |
6,839,459 | 5,303,388 | ||||||
| Financial instrument liabilities, at fair value |
829,892 | 3,600,823 | ||||||
| Income taxes payable |
5,121,570 | 2,182,092 | ||||||
| Deferred income taxes |
— | 1,331,102 | ||||||
| Repurchase obligation on loans previously sold |
3,936,384 | 7,260,733 | ||||||
| Capital lease obligation |
637,501 | |||||||
|
|
|
|
|
|||||
| Total liabilities |
332,704,412 | 465,586,079 | ||||||
| Preferred stock, $.01 par value; 5,000,000 shares authorized; none issued or outstanding |
— | — | ||||||
| Common stock, $.01 par value; 10,000,000 shares authorized; 1,227,956 shares issued and outstanding |
12,280 | 12,280 | ||||||
| Treasury stock |
(2,660,000 | ) | (160,000 | ) | ||||
| Additional paid-in capital |
1,093,954 | 1,093,954 | ||||||
| Retained earnings |
55,849,965 | 40,537,138 | ||||||
|
|
|
|
|
|||||
| Total stockholders’ equity |
54,296,199 | 41,483,372 | ||||||
|
|
|
|
|
|||||
| Total liabilities and stockholders’ equity |
$ | 387,000,611 | $ | 507,069,451 | ||||
|
|
|
|
|
|||||
The accompanying notes are an integral part of this statement.
F-109
Table of Contents
STATEMENT OF OPERATIONS
| For the Nine Months Ended September 30, 2013 |
For the Year Ended December 31, 2012 |
|||||||
| REVENUES: |
||||||||
| Interest income |
$ | 9,724,633 | $ | 10,751,482 | ||||
| Interest expense |
(9,036,567 | ) | (11,127,228 | ) | ||||
|
|
|
|
|
|||||
| Net interest income (expense) |
688,066 | (375,746 | ) | |||||
| Gain on sale of mortgage loans, net |
102,670,189 | 143,628,804 | ||||||
| Origination income |
22,700,462 | 19,549,545 | ||||||
| Other loan based-income |
19,219,831 | 1,543,374 | ||||||
|
|
|
|
|
|||||
| Total net revenues |
145,278,548 | 164,345,977 | ||||||
| EXPENSES: |
||||||||
| Personnel expense |
81,800,048 | 86,268,563 | ||||||
| Direct origination expense |
26,523,597 | 25,924,865 | ||||||
| General and administrative expense |
7,245,195 | 9,979,036 | ||||||
| Marketing and advertising expense |
2,010,489 | 2,490,974 | ||||||
| Provision for loan losses on loans held for investment |
— | 253,246 | ||||||
| Occupancy expense |
6,295,179 | 5,562,784 | ||||||
| Depreciation and amortization |
1,608,940 | 1,493,661 | ||||||
|
|
|
|
|
|||||
| Total expenses |
125,483,448 | 131,973,129 | ||||||
|
|
|
|
|
|||||
| OTHER INCOME (EXPENSE): |
||||||||
| Joint venture income |
5,773,249 | 5,035,748 | ||||||
| Other expenses |
(252,100 | ) | (1,306,622 | ) | ||||
|
|
|
|
|
|||||
| Total other expenses |
5,521,149 | 3,729,126 | ||||||
|
|
|
|
|
|||||
| Income before income taxes |
25,316,249 | 36,101,974 | ||||||
|
|
|
|
|
|||||
| Provision for income taxes |
(10,003,422 | ) | (14,729,251 | ) | ||||
|
|
|
|
|
|||||
| Net income |
$ | 15,312,827 | $ | 21,372,723 | ||||
|
|
|
|
|
|||||
The accompanying notes are an integral part of this statement.
F-110
Table of Contents
STATEMENT OF STOCKHOLDERS’ EQUITY
For the period ended September 30, 2013 (nine months ended) and year ended December 31, 2012
| Common Stock | Treasury stock | Additional Paid-in Capital |
Total Stockholders’ Equity |
|||||||||||||||||||||||||
| Shares Outstanding |
Amount | Shares Outstanding |
Amount | Retained Earnings |
||||||||||||||||||||||||
| Balance at December 31, 2011 |
1,227,956 | $ | 12,280 | (27,487 | ) | $ | (160,000 | ) | $ | 1,093,954 | $ | 25,164,415 | $ | 26,110,649 | ||||||||||||||
| Dividends |
— | — | — | — | — | (6,000,000 | ) | (6,000,000 | ) | |||||||||||||||||||
| Net income |
— | — | — | — | — | 21,372,723 | 21,372,723 | |||||||||||||||||||||
|
|
|
|
|
|
|
|
|
|
|
|
|
|
|
|||||||||||||||
| Balance at September 30, 2012 |
1,227,956 | $ | 12,280 | (27,487 | ) | $ | (160,000 | ) | $ | 1,093,954 | $ | 40,537,138 | $ | 41,483,372 | ||||||||||||||
| Net income |
— | — | — | — | — | 15,312,827 | 15,312,827 | |||||||||||||||||||||
| Repurchase of stock |
— | — | (58,982 | ) | (2,500,000 | ) | — | — | (2,500,000 | ) | ||||||||||||||||||
|
|
|
|
|
|
|
|
|
|
|
|
|
|
|
|||||||||||||||
| Balance at September 30, 2013 (nine months ended) |
1,227,956 | $ | 12,280 | (86,469 | ) | $ | (2,660,000 | ) | $ | 1,093,954 | $ | 55,849,965 | $ | 54,296,199 | ||||||||||||||
|
|
|
|
|
|
|
|
|
|
|
|
|
|
|
|||||||||||||||
The accompanying notes are an integral part of this statement.
F-111
Table of Contents
STATEMENT OF CASH FLOWS
| For the Nine Months Ended September 30, 2013 |
For the Year Ended December 31, 2012 |
|||||||
| CASH FLOWS FROM OPERATING ACTIVITIES |
||||||||
| Net income from operations |
$ | 15,312,827 | $ | 21,372,723 | ||||
| Adjustments to reconcile net income from continuing operations to net cash used in operating activities: |
||||||||
| Depreciation and amortization expense |
1,608,940 | 1,493,661 | ||||||
| Gain on sale of loans held for sale |
(106,763,207 | ) | (138,647,321 | ) | ||||
| (Gain)/loss on disposal of property and equipment |
(24,398 | ) | 127,761 | |||||
| Provision for repurchase obligation on loans previously sold |
512,026 | 9,163,021 | ||||||
| Provision for loan losses on loans held for investment |
3,129 | 253,246 | ||||||
| Mark to market loss/(gain) on derivatives |
727,022 | (5,371,214 | ) | |||||
| Mark to market (gain)/loss on other financial instruments |
(2,770,931 | ) | 3,600,823 | |||||
| Mark to market loss/(gain) on loans held for sale |
5,621,771 | (12,374,113 | ) | |||||
| Joint venture income |
(5,773,249 | ) | (5,035,748 | ) | ||||
| Deferred income taxes |
(6,175,697 | ) | 425,422 | |||||
| Originations of loans held for sale |
(3,722,054,525 | ) | (4,096,585,153 | ) | ||||
| Proceeds from sales of loans held for sale |
3,951,360,450 | 4,011,823,719 | ||||||
| Proceeds from principal payments and payoffs |
19,762,095 | 58,695,994 | ||||||
| Payments to investors for repurchase obligation on loans previously sold |
(3,836,375 | ) | (2,246,140 | ) | ||||
| Changes in operating assets and liabilities: |
||||||||
| Restricted cash from borrower escrows |
(43,137 | ) | (2,140,042 | ) | ||||
| Accounts receivable |
(2,820,208 | ) | (1,473,190 | ) | ||||
| Receivables from related party |
9,428 | (66,301 | ) | |||||
| Other assets |
727,017 | (157,146 | ) | |||||
| Accounts payable |
(1,382,210 | ) | 2,272,011 | |||||
| Accrued expenses and other liabilities |
17,393,524 | 4,357,719 | ||||||
| Income taxes payable |
2,939,478 | 1,031,654 | ||||||
|
|
|
|
|
|||||
| Net cash provided by (used in) operating activities |
164,333,770 | (149,478,614 | ) | |||||
|
|
|
|
|
|||||
| CASH FLOWS FROM INVESTING ACTIVITIES |
||||||||
| Net change in loans held for investment |
367,204 | (601,224 | ) | |||||
| Distributions from investment in joint venture |
5,774,317 | 4,671,427 | ||||||
| Purchase of property and equipment |
(5,073,521 | ) | (2,527,347 | ) | ||||
|
|
|
|
|
|||||
| Stock Repurchase |
||||||||
| Net cash flows (used in) provided by investing activities |
1,068,000 | 1,542,856 | ||||||
|
|
|
|
|
|||||
The accompanying notes are an integral part of this statement.
F-112
Table of Contents
IMORTGAGE.COM, INC.
STATEMENT OF CASH FLOWS—(Continued)
| For the Nine Months Ended September 30, 2013 |
For the Year Ended December 31, 2012 |
|||||||
| CASH FLOWS FROM FINANCING ACTIVITIES |
||||||||
| Net change in warehouse lines of credit |
$ | (142,304,647 | ) | $ | 159,583,028 | |||
| Net change in bank line of credit |
(3,000,000 | ) | 3,000,000 | |||||
| Change in restricted cash from warehouse lines of credit |
274,524 | (875,713 | ) | |||||
| Payments on capital lease obligation |
(637,501 | ) | (527,252 | ) | ||||
| Repurchase of common stocks |
(2,500,000 | ) | ||||||
| Distributions to common stockholders |
— | (6,000,000 | ) | |||||
|
|
|
|
|
|||||
| Net cash (used in) provided by financing activities |
(148,167,624 | ) | 155,180,063 | |||||
|
|
|
|
|
|||||
| Net increase in cash and cash equivalents |
17,234,146 | 7,244,305 | ||||||
|
|
|
|
|
|||||
| Cash and cash equivalents at beginning of year |
17,216,006 | 9,971,701 | ||||||
|
|
|
|
|
|||||
| Cash and cash equivalents at end of year |
$ | 34,450,152 | $ | 17,216,006 | ||||
|
|
|
|
|
|||||
| SUPPLEMENTAL DISCLOSURES OF CASH FLOW INFORMATION |
||||||||
| Cash paid during the year for: |
||||||||
| Interest |
$ | (9,101,701 | ) | $ | 11,176,775 | |||
|
|
|
|
|
|||||
| Income taxes |
$ | (12,734,329 | ) | $ | 11,037,500 | |||
|
|
|
|
|
|||||
| SUPPLEMENTAL DISCLOSURE OF NONCASH INVESTING AND FINANCING ACTIVITIES |
||||||||
| Financing of purchase of equipment under capital lease |
$ | — | $ | 139,873 | ||||
|
|
|
|
|
|||||
The accompanying notes are an integral part of this statement.
F-113
Table of Contents
NOTES TO FINANCIAL STATEMENTS
Note A—Nature of Operations
imortgage.com, Inc. (“imortgage” or the “Company”), a Delaware corporation, was originally incorporated as imortgage, Inc. on May 13, 1999. The name of the Company was changed to imortgage.com, Inc. effective July 12, 1999. Effective January 1, 2002, the Company changed from an S-Corporation to a C-Corporation for income taxes purposes.
The Company engages in the business of originating, financing and selling mortgage loans secured by residential real estate and derives income primarily from fees related to the origination of mortgage loans and the subsequent sale of the loans to investors.
Note B—Summary of Significant Accounting Policies
Use of Estimates
The preparation of financial statements in conformity with accounting principles generally accepted in the United States of America requires management to make estimates and assumptions that affect the amounts reported in the consolidated financial statements and accompanying notes. Actual results could differ from these estimates. Material estimates that are particularly susceptible to significant changes relate to the determination of the fair value of loans held for sale, fair value of derivatives and other financial instruments, and repurchase obligation on loans previously sold.
Cash and Cash Equivalents
For purposes of the statement of cash flows, the Company considers all highly liquid instruments purchased with an original maturity of three months or less to be cash equivalents. As of September 30, 2013 and December 31, 2012 all amounts recorded in cash and cash equivalents represent cash held in banks, with no other components to cash and cash equivalents.
Restricted Cash
Restricted cash consists of minimum required balances for warehouse lines of credit and mortgage lending escrow funds.
Accounts Receivable
Accounts receivable are stated amounts due from customers or from investors for loans sold, net of an allowance for doubtful accounts. Accounts receivable that are outstanding longer than the contractual payment terms are considered past due. The Company determines the allowance for doubtful accounts by considering the length of time accounts receivable are past due, previous loss history and the specific customer’s ability to pay its obligation.
There was no allowance for doubtful accounts as of September 30, 2013. The Company writes off accounts receivable when management deems them uncollectible. There were no write-offs during the nine months ended September 30, 2013 and year ended December 31, 2012.
Loans Held for Sale
The Company originates all of its residential real estate loans with the intent to sell them in the secondary market. Loans held for sale consist primarily of residential first lien mortgage loans that are secured by residential real estate.
F-114
Table of Contents
IMORTGAGE.COM, INC.
NOTES TO FINANCIAL STATEMENTS—(Continued)
The Company has elected to measure newly originated residential mortgage loans held for sale at fair value, as permitted under Financial Accounting Standards Board (“FASB”) Accounting Standards Codification (“ASC”) 825, Financial Instruments. Loans are recorded at fair value at the time of origination. Prior to the sale of the loans to investors, changes in the fair value of loans are recorded through current earnings as a component of gain on sale of mortgage loans in the statement of operations. At the time of sale, any difference between the estimated fair value of the loan and the sales price is recorded as an adjustment to the gain or loss.
Loans held for sale are pledged as collateral under the Company’s warehouse lines of credit. The Company relies substantially on the secondary mortgage market as all of the loans originated are sold into this market.
Loans Held for Investment
Loans held for investment are stated at unpaid principal balance adjusted for deferred fees and costs on originated loans and the allowance for loan losses.
An allowance for loan losses is established by recording a provision for loan losses in the statement of operations when management believes a loss has occurred on a loan held for investment. When management determines that a loan held for investment is partially or fully uncollectible, the estimated loss is charged against the allowance for loan losses. Recoveries on losses previously charged to the allowance are credited to the allowance at the time the recovery is collected.
The Company accounts for its allowance for loan losses for loans held for investment in accordance with ASC 450-20, Loss Contingencies. The allowance for loan losses represents management’s best estimate of probable losses inherent in the loans held for investment portfolio. The mortgage loans held for investment portfolio is comprised of homogeneous residential mortgage loans. These loans are evaluated collectively based on the loan’s present delinquency status. The estimate of probable losses on these loans considers the rate of default of the loans and the amount of loss in the event of default. The rate of default is based on historical experience. The entire allowance is available to absorb probable credit losses from the entire held for investment portfolio.
Revenue Recognition
The Company’s revenues are primarily derived from the origination and sale of mortgage loans. Loans are funded through warehouse lines of credit and are sold to investors, typically within thirty days. The gain or loss on the sale of loans is realized on the date the loans are sold. The Company sells its loans on a servicing released basis in which the Company gives up the right to service the loans. The Company earns origination income from fees, points and other revenues from customers upon the origination of the mortgage loans.
Interest on mortgage loans held for sale and investment are recognized as earned and is only accrued if deemed collectible. Interest is generally deemed uncollectible when a loan becomes three months or more delinquent or when a loan has a defect affecting its salability. Delinquency is calculated based on the contractual due date of the loan. When loans are placed on non-accrual status, all interest previously accrued but not collected is reversed against current period interest income. Income on non-accrual loans is subsequently recognized only to the extent cash is received. Loans are written off when deemed uncollectible.
Repurchase Obligation on Loans Previously Sold
The Company sells loans it originates to investors on a servicing released basis and the risk of loss or default by the borrower is generally transferred to the investor. However, the Company is required by these investors to make certain representations relating to credit information, loan documentation and collateral. These
F-115
Table of Contents
IMORTGAGE.COM, INC.
NOTES TO FINANCIAL STATEMENTS—(Continued)
representations and warranties may extend through the contractual life of the mortgage loan. Subsequent to the sale, if underwriting deficiencies, borrower fraud or documentation defects are discovered in individual mortgage loans, the Company may be obligated to repurchase the respective mortgage loan or indemnify the investors for any losses from borrower defaults if such deficiency or defect cannot be cured within the specified period following discovery.
In the case of early loan payoffs and early defaults on certain loans, the Company may be required to repay all or a portion of the premium initially paid by the investor plus a fee. The estimated obligation associated with early loan payoffs and early defaults is calculated based on historical loss experience by type of loan.
The obligation for losses related to the representations and warranties and other provisions discussed above is recorded based upon an estimate of expected future losses. Because the Company does not service the loans it sells, it does not maintain nor have access to the current balances and loan performance data with respect to the individual loans previously sold to investors. Accordingly, the Company is unable to determine, with precision, its maximum exposure under its representations and warranties. However, the Company uses historical and projected losses to estimate its exposure to losses on loans previously sold. Given current general industry trends in mortgage loans as well as housing prices, market expectations around losses related to the Company’s obligations could vary significantly from the obligation recorded as of the balance sheet date.
Derivative Instruments and Hedging Activities
The Company is exposed to certain risks in connection with its mortgage banking operations. In particular, the Company is exposed to interest rate risk for commitments and loans it originates until those loans are sold in the secondary market. The fair value of interest rate lock commitments (“IRLC”) and loans held for sale are subject to change primarily due to changes in market interest rates. IRLCs are carried at fair value in accordance with ASC 815, Derivatives and Hedging. The initial and subsequent changes in the value of IRLCs are a component of gain on sale of mortgage loans in the statement of operations.
The Company economically hedges the changes in fair value of IRLCs and loans held for sale primarily by using mandatory and best efforts forward delivery commitments. Mandatory forward delivery commitments are carried at fair value in accordance with ASC 815 with the initial and subsequent changes in the value of these commitments recorded as a component of gain on sale of mortgage loans in the statement of operations.
The Company has elected to record best efforts forward delivery commitments at fair value, as permitted under ASC 825. The fair value of best efforts forward delivery commitments are recorded in financial instrument liabilities on the balance sheet with the initial and subsequent changes in the value of these commitments recorded as a component of gain on sale of mortgage loans in the statement of operations.
Real Estate Owned
The Company holds real estate owned (“REO”) as a result of foreclosures on delinquent mortgage loans held for investment. REO is recorded at estimated fair value less costs to sell at the date of foreclosure with any subsequent declines in fair value are credited to a valuation allowance and charged to operations as incurred. For the periods ended September 30, 2013 and December 31, 2012, the carrying value of REO was $0 and $169,897, respectively, which is included in other assets on the balance sheet.
F-116
Table of Contents
IMORTGAGE.COM, INC.
NOTES TO FINANCIAL STATEMENTS—(Continued)
Property and Equipment
Property and equipment are recorded at cost and depreciated over their estimated useful lives using the straight-line method. Leasehold improvements are capitalized and amortized over the lesser of the life of the lease or the estimated useful life of the asset. Useful lives for purposes of computing depreciation are as follows:
| Years | ||
| Furniture and equipment |
5-7 | |
| Leasehold improvements |
5-15 | |
| Computer equipment |
5-7 | |
| Computer software |
5 |
Expenditures that materially increase the asset life are capitalized, while ordinary maintenance and repairs are charged to operations as incurred. When assets are sold or retired, the cost and related accumulated depreciation are removed from the accounts and any resulting gain or loss is included in earnings.
Investment in Joint Venture
The Company is the managing member of MTH Mortgage, LLC (“MTH”) which was formed in 2000 through a joint venture between the Company and Meritage Homes Corporation (“Meritage Homes”). The Company has a 45% ownership interest in MTH with Meritage Homes owning 55% of MTH. The Company records its investment in MTH under the equity method of accounting. Under the equity method of accounting, MTH’s accounts are not reflected within the Company’s balance sheet and statement of operations. However, the Company’s share of the earnings or losses of MTH is recorded in joint venture income (loss) in the statement of operations. The Company determined it has a variable interest in MTH under ASC 810-10, Consolidation. However, as the Meritage Homes Corporation is a majority owner and has the primary control and responsibility to identify and attract potential borrowers, the Company concluded that Meritage Homes Corporation is the primary beneficiary. As such, MTH is not consolidated within the Company’s financial statements for periods presented.
As of September 30, 2013 and December 31, 2012, the carrying value of the Company’s equity investment in MTH was $118,367 and $119,445, respectively, and are included in other assets on the balance sheet. For the period ended September 30, 2013 and year ended December 31, 2012, the Company’s pro rata share of the net earnings of MTH was $5,773,249 and $5,035,748, respectively.
At September 30, 2013 and December 31, 2012, MTH had total assets of $2,617,865 and $2,429,471, respectively. For the nine months ended September 30, 2013 and year ended December 31, 2012, total revenues for MTH was $18,213,912 and $15,987,473 and net income for MTH was $12,829,445 and $11,192,135, respectively. The Company’s maximum exposure to loss as a result of its involvement with the variable interest entity is the carrying value noted above. See Note K for further details on MTH.
Long-Lived Assets
In accordance with ASC 360, Property, Plant and Equipment, long-lived assets, such as property and equipment, are reviewed for impairment whenever events or changes in circumstances indicate that the carrying amount of an asset may not be recoverable. Recoverability of assets to be held and used is measured by a comparison of the carrying amount of an asset to estimated undiscounted future cash flows expected to be generated by the asset. If the carrying amount of an asset exceeds its estimated future cash flows, an impairment charge is recognized by the amount by which the carrying amount of the asset exceeds the fair value of the asset. There has been no impairment of long-lived assets for the period ended September 30, 2013.
F-117
Table of Contents
IMORTGAGE.COM, INC.
NOTES TO FINANCIAL STATEMENTS—(Continued)
Income Taxes
The Company accounts for income taxes under the asset and liability method of ASC 740, Income Taxes, under which it recognizes deferred income taxes, net of any required valuation allowances, for the estimated future tax effects of temporary differences between the financial statement carrying amounts of existing assets and liabilities and its tax bases and net operating loss and tax credit carryforwards. Deferred tax assets and liabilities are measured using enacted tax rates expected to apply to taxable income in the years in which those temporary differences are expected to be recovered or settled. The effect on deferred tax assets and liabilities of a change in tax rates is recognized in income in the period that includes the enactment date.
In assessing the realizability of deferred tax assets, management considers whether it is more likely than not that some portion or all of the deferred tax assets will not be realized. Generally, the ultimate realization of deferred tax assets is dependent upon the generation of future taxable income during the periods in which those temporary differences become deductible. Based on historical performance, management believes that it is more likely than not that the deferred income tax assets as of September 30, 2013 will be utilized.
The Company recognizes and measures uncertain tax positions using a two-step approach. The first step is to evaluate the tax position for recognition by determining if the weight of available evidence indicates it is more likely than not, that the position will be sustained on audit, including resolution of related appeals or litigation processes, if any. The second step is to measure the tax benefit as the largest amount, which is more than 50% likely of being realized upon ultimate settlement. The Company considers many factors when evaluating and estimating tax positions and tax benefits, which may require periodic adjustments. As of September 30, 2013 and December 31, 2012, the Company does not expect the total amount of unrecognized tax benefits will significantly increase or decrease within 12 months.
Interest and penalties related to unrecognized tax benefits are recognized in income tax expense. At September 30, 2013 and December 31, 2012, appropriate interest and penalties were included in income tax expense.
Advertising
Advertising costs are expensed in the period incurred and are included as part of marketing and advertising expense.
Concentration of Risk
The Company has concentrated its credit risk for cash by maintaining deposits in several financial institutions, which may at times exceed amounts covered by insurance provided by the Federal Deposit Insurance Corporation (FDIC). The Company has not experienced any losses in such accounts and believes it is not exposed to any significant credit risk to cash.
Due to the nature of the mortgage lending industry, changes in interest rates may significantly impact revenue from originating mortgages and subsequent sales of loans to investors, which are the primary source of income for the Company. The Company originates mortgage loans on property located within the States of Arizona, California, Colorado, Nevada, Oregon, Texas, North Carolina, and Florida. In the event of a major downturn within these markets, the operations of the Company could be adversely affected.
The Company sells mortgage loans to various third-party investors on a servicing released basis. Four investors accounted for 34%, 16%, 14%, and 8%, respectively, of the Company’s loan sales for the nine months ended September 30, 2013. No other investors accounted for more than 6% of the loan sales for the nine months
F-118
Table of Contents
IMORTGAGE.COM, INC.
NOTES TO FINANCIAL STATEMENTS—(Continued)
ended September 30, 2013. For the year ended December 31, 2012, four investors accounted for 30%, 22%, 13%, and 12%, respectively, of the Company’s loan sales. No other investors accounted for more than 10% of the loan sales for the year ended December 31, 2012.
The Company funds loans through warehouse lines of credit. At September 30, 2013 and December 31, 2012, 87% and 70%, respectively, of the total balance due on warehouse lines of credit was payable to two lenders.
Note C—Loans Held for Sale and Investment
Origination: A summary of the initial unpaid principal balance of loans originated by type of loan for the nine months ended September 30, 2013 and year ended December 31, 2012 is presented below:
| Nine Months Ended September 30, 2013 |
Year Ended December 31, 2012 | |||||||||||||||
| Amount | % | Amount | % | |||||||||||||
| Conforming—fixed |
$ | 2,099,243,635 | 56.4 | % | $ | 2,198,904,624 | 53.7 | % | ||||||||
| FHA—fixed |
1,093,360,339 | 29.4 | % | 1,350,984,723 | 33.0 | % | ||||||||||
| VA—fixed |
394,758,600 | 10.6 | % | 391,317,182 | 9.6 | % | ||||||||||
| Other |
134,691,951 | 3.6 | % | 155,378,624 | 3.8 | % | ||||||||||
|
|
|
|
|
|
|
|
|
|||||||||
| Total |
$ | 3,722,054,525 | 100 | % | $ | 4,096,585,153 | 100 | % | ||||||||
|
|
|
|
|
|
|
|
|
|||||||||
Gain (loss) on sale of mortgage loans, net is comprised of the following components for the nine months ended September 30, 2013 and year ended December 31, 2012:
| Nine Months Ended September 30, 2013 |
Year Ended December 31, 2012 |
|||||||
| Realized gains from whole loan sales |
$ | 106,763,207 | $ | 138,647,321 | ||||
| Mark to market (losses)/gains on loans held for sale |
(5,621,771 | ) | 12,374,113 | |||||
| Unrealized (losses)/gains from derivatives |
(727,022 | ) | 5,371,214 | |||||
| Unrealized (losses)/gains from financial instruments |
2,770,930 | (3,600,823 | ) | |||||
| Provision for repurchase obligation on loans previously sold |
(515,155 | ) | (9,163,021 | ) | ||||
|
|
|
|
|
|||||
| $ | 102,670,189 | $ | 143,628,804 | |||||
|
|
|
|
|
|||||
Loans Held for Sale: The following table represents the unpaid principal balance of loans held for sale by type as of September 30, 2013 and December 31, 2012:
| As of September 30, 2013 | As of December 31, 2012 | |||||||||||||||
| Amount | % | Amount | % | |||||||||||||
| Conforming—fixed |
$ | 145,668,183 | 49.0 | % | $ | 227,211,438 | 51.7 | % | ||||||||
| FHA—fixed |
100,013,373 | 33.7 | % | 143,236,113 | 32.6 | % | ||||||||||
| VA—fixed |
40,724,561 | 13.7 | % | 55,376,414 | 12.6 | % | ||||||||||
| Other |
10,641,893 | 3.6 | % | 13,528,858 | 3.1 | % | ||||||||||
|
|
|
|
|
|
|
|
|
|||||||||
| Total |
$ | 297,048,010 | 100 | % | $ | 439,352,823 | 100 | % | ||||||||
|
|
|
|
|
|
|
|
|
|||||||||
F-119
Table of Contents
IMORTGAGE.COM, INC.
NOTES TO FINANCIAL STATEMENTS—(Continued)
As of September 30, 2013 and December 31, 2012, the components of the loans held for sale measured at fair value are as follows:
| As of September 30, 2013 |
As of December 31, 2012 |
|||||||
| Aggregate unpaid principal balance |
$ | 297,048,010 | $ | 439,352,823 | ||||
| Difference between fair value and aggregate unpaid principal balance |
15,460,964 | 21,082,735 | ||||||
|
|
|
|
|
|||||
| $ | 312,508,974 | $ | 460,435,558 | |||||
|
|
|
|
|
|||||
The Company does not have any delinquent or non-accrual loans held for sale as of September 30, 2013.
Repurchase Obligation on Loans Previously Sold: During 2012, the Company entered into settlement agreements (“global settlements”) with four counterparties who previously purchased loans from the Company and are no longer purchasing loans from the Company. Under the global settlements, the Company was able to eliminate all pending and potential future repurchase obligations under the representations and warranties provisions of the loans previously sold to each counterparty in exchange for a negotiated amount to be paid to each counterparty. For the nine months ended September 30, 2013 and year ended December 31, 2012, the Company made payments totaling $2,994,167 and $1,526,875 respectively, to counterparties under the global settlements. As of September 30, 2013 and December 31, 2012, the balance payable on these global settlements is $2,807,818 and $5,801,985, respectively which is included as a component of repurchase obligation on loans previously sold on the balance sheet.
For the nine months ended September 30, 2013 and year ended December 31, 2012 the Company also incurred losses of $842,208 and $719,295, respectively, from early payoffs, early payment defaults, and repurchase requests related to representations, warranties, and other provisions on loans previously sold not related to the global settlements. As of September 30, 2013 and December 31, 2012, the estimated repurchase reserve is $1,128,566 and $1,458,748, respectively, which is included as a component of the repurchase obligation on loans previously sold on the balance sheet.
The activity related to the repurchase obligation on loans previously sold for the nine months ended September 30, 2013 and year ended December 31, 2012 is as follows:
| Nine Months Ended September 30, 2013 |
Year Ended December 31, 2012 |
|||||||
| Balance at beginning of year |
$ | 7,260,733 | $ | 343,852 | ||||
| Provisions |
512,026 | 9,163,021 | ||||||
| Charge offs |
(3,836,375 | ) | (2,246,140 | ) | ||||
|
|
|
|
|
|||||
| Balance at end of period |
$ | 3,936,384 | $ | 7,260,733 | ||||
|
|
|
|
|
|||||
F-120
Table of Contents
IMORTGAGE.COM, INC.
NOTES TO FINANCIAL STATEMENTS—(Continued)
Loans Held for Investment, Net: The following table represents the unpaid principal balance of loans held for investment and the allowance for loan loss as of September 30, 2013 and December 31, 2012:
| As of September 30, 2013 |
As of December 31, 2012 |
|||||||
| Loans held for investment |
$ | 1,997,155 | $ | 2,466,192 | ||||
| Allowance for loan loss |
(233,330 | ) | (501,931 | ) | ||||
|
|
|
|
|
|||||
| Loans held for investment, net |
$ | 1,763,825 | $ | 1,964,261 | ||||
|
|
|
|
|
|||||
The activity related to the allowance for loan loss for the nine months ended September 30, 2013 and year ended December 31, 2012 is as follows:
| Nine Months Ended September 30, 2013 |
Year Ended December 31, 2012 |
|||||||
| Balance at beginning of year |
$ | 501,931 | $ | 532,508 | ||||
| Provisions |
3,129 | 253,246 | ||||||
| Charge offs |
(271,730 | ) | (283,823 | ) | ||||
|
|
|
|
|
|||||
| Balance at end of period |
$ | 233,330 | $ | 501,931 | ||||
|
|
|
|
|
|||||
Note D—Property and Equipment
Property and equipment consist of the following:
| As of September 30, 2013 |
As of December 31, 2012 |
|||||||
| Furniture and equipment |
$ | 7,962,648 | $ | 5,707,968 | ||||
| Computer equipment |
3,258,236 | 2,864,665 | ||||||
| Computer software |
1,115,224 | 941,299 | ||||||
| Leasehold improvements |
2,285,062 | 148,500 | ||||||
|
|
|
|
|
|||||
| 14,621,170 | 9,662,432 | |||||||
| Less: accumulated depreciation and amortization |
(4,934,955 | ) | (3,465,196 | ) | ||||
|
|
|
|
|
|||||
| $ | 9,686,215 | $ | 6,197,236 | |||||
|
|
|
|
|
|||||
The Company charged $1,608,940 and $1,493,661 of depreciation and amortization expense to continuing operations for the nine months ended September 30, 2013 and for the year ended December 31, 2012, respectively.
F-121
Table of Contents
IMORTGAGE.COM, INC.
NOTES TO FINANCIAL STATEMENTS—(Continued)
Note E—Accrued Expenses and Other Liabilities
Accrued expenses and other liabilities consist of the following:
| As of September 30, 2013 |
As of December 31, 2012 |
|||||||
| Accrued compensation and benefits |
$ | 6,733,183 | $ | 8,463,378 | ||||
| Deferred rent |
2,591,660 | 1,440,704 | ||||||
| Accrued interest and fees on warehouse lines |
536,458 | 601,593 | ||||||
| Other |
19,478,545 | 1,440,647 | ||||||
|
|
|
|
|
|||||
| $ | 29,339,846 | $ | 11,946,322 | |||||
|
|
|
|
|
|||||
Note F—Warehouse Lines of Credit
Borrowings on warehouse lines of credit were $282,419,555 at September 30, 2013 and $424,724,202 at December 31, 2012.
As of September 30, 2013, the Company had five lines of credit totaling $575,000,000 of borrowing capacity. Borrowings under these lines of credit are used to fund, and are secured by, consumer residential loans that are held for sale. Loans under these lines of credit are repaid using proceeds from the sales of loans held for sale by the Company.
The Company has a warehouse line of credit with Bank of America under the Master Repurchase Agreement (“Bank of America Agreement”). Terms of the agreement require the Company to maintain a minimum adjustable tangible net worth and additional financial covenants measuring minimum liquidity, maximum leverage, and minimum rolling two quarter net income. In addition, a deposit with the lender is required based on the total available line with the lender. Interest accrues at the Base Rate plus the Applicable Margin of 2.25% where the Base Rate is defined as the greater of Libor (see below) or 1.00%. Interest is paid on a loan level basis at settlement.
“Libor” means the daily rate per annum for one month US Dollar denominated deposits as offered to prime banks in the London interbank market.
On March 26, 2013, the Company entered into an amendment to the Bank of America Agreement to extend the maturity date to March 25, 2014, increase the borrowing capacity to $250,000,000, and to revise certain financial covenants and other terms.
The Company has a warehouse line of credit with Viewpoint Bank under the Loan Participation Agreement (“Viewpoint Agreement”). Terms of the agreement require the Company to maintain a minimum adjustable tangible net worth and additional financial covenants measuring minimum liquidity, maximum leverage, minimum rolling three month net income, and a required deposit with the lender. Interest shall accrue at the Base Rate plus the Applicable Margin (ranging from 2.00%–5.00%) where the Base Rate is defined as the greater of Libor (see above) or 1.50%. Interest is payable on a per loan basis at loan purchase settlement.
During 2013, the Company entered into several amendments to the Viewpoint Agreement to extend the maturity date to May 15, 2014, increase the borrowing capacity to $50,000,000, increase the cash pledge requirement, and revisions to certain financial covenants and other terms.
F-122
Table of Contents
IMORTGAGE.COM, INC.
NOTES TO FINANCIAL STATEMENTS—(Continued)
The Company maintains a warehouse line of credit with Comerica Bank under the Mortgage Warehouse Agreement (“Comerica Agreement”). Terms of the agreement contain various restrictive and financial covenants including a financial covenant requirement to maintain a minimum adjustable tangible net worth and a required deposit with the lender. Interest shall accrue at the Base Rate plus the Applicable Margin of 2.00% where the Base Rate is defined as the greater of Libor (see above) or 1.50%. Interest is billed monthly in arrears.
On July 3, 2013, the Company entered into an amendment to the Comerica Agreement to increase the borrowing capacity to $50,000,000, and revisions to certain financial covenants.
The Company maintains a warehouse line of credit with JP Morgan Chase Bank under a Master Repurchase Agreement (“Chase Agreement”). Terms of the agreement require the Company to maintain a minimum adjustable tangible net worth along with additional financial covenants measuring minimum liquidity, maximum leverage, quarterly minimum net income, and a requirement to place a minimum deposit with the lender. Interest shall accrue at the Base Rate plus the Applicable Margin of 2.25% where the Base Rate is defined as the greater of Libor (see above) or 1.50%.
During 2013, the Company entered into several amendments to the Chase Agreement to extend the maturity date to August 29, 2014, increase the borrowing capacity to $125,000,000, increase the cash pledge requirement, and revisions to certain financial covenants and other terms.
On September 21, 2012, the Company executed a Master Repurchase Agreement with EverBank (“EverBank Agreement”) to secure a borrowing facility for $75,000,000. Terms of the agreement require the Company to maintain various financial and non-financial covenants including maintaining a minimum adjustable tangible net worth and additional financial covenants measuring minimum liquidity, maximum leverage, quarterly minimum net income, and cash flows. In addition, a deposit with the lender is required based on the total available line with the lender. Interest shall accrue at the Base Rate plus the Applicable Margin (ranging from 2.00% to 2.75% depending on the loan characteristics) where the Base Rate is defined as the greater of the one month Libor rate or 1.00%.
On April 16, 2013, the Company entered into an amendment to the EverBank Agreement to increase the borrowing capacity to $100,000,000, increased cash pledge requirement, and revisions to certain financial covenants.
The interest rates for all five warehouse lines of credit are subject to increase based upon the characteristics of the underlying loans collateralizing the lines of credit, including, but not limited to, the delinquency status of the loans. Certain warehouse line lenders require the Company, at all times, to maintain cash accounts with minimum required balances. As of September 30, 2013 and December 31, 2012, there was $2,552,737 and $2,278,213, respectively, held in these accounts which is recorded as a component of restricted cash on the balance sheet.
Under the terms of these warehouse lines, the Company is required to maintain various financial and other covenants. These financial covenants include, but are not limited to, maintaining (i) minimum tangible net worth, (ii) minimum liquidity, (iii) a minimum current ratio, (iv) a maximum distribution requirement, (v) a maximum leverage ratio, (vi) pre-tax net income requirements and (vii) a maximum warehouse capacity ratio. As of September 30, 2013, the Company was in compliance with the financial covenants required by the warehouse lines.
The Company’s business is highly dependent on the availability of these warehouse lines. Although Management believes that the existing lines of credit are adequate for current operations, reductions in the available credit, or the inability to renew or replace these lines, would have a material adverse effect on the
F-123
Table of Contents
IMORTGAGE.COM, INC.
NOTES TO FINANCIAL STATEMENTS—(Continued)
Company’s business, financial condition and results of operations. Management has determined that it could continue to operate the Company’s business at a reduced capacity if some, but not all, of the warehouse lines were lost.
Note G—Bank Line of Credit
On May 24, 2012, the Company entered into a $3,000,000 line of credit agreement with a bank, with an initial maturity date of May 24, 2013. The line of credit bears interest at the prime rate as reported by the Wall Street Journal plus 0.50% and is subject to a minimum interest rate floor of 5.25%, which was the rate in effect at December 31, 2012. The line of credit is personally guaranteed by the two primary stockholders of the Company and is secured by substantially all of the assets of the Company. At December 31, 2012 the Company had borrowings outstanding of $3,000,000 on the line of credit. On January 3, 2013, the Company paid off the total outstanding balance. The Company elected not to renew the line of credit upon the maturity date, and as such, the line was closed and the total borrowings as of September 30, 2013 is $0.
Note H—Capital Lease Obligations
The Company leases certain equipment under obligations that are classified as capital leases. At December 31, 2012 the Company had total capital lease obligations of $637,501. On August 6, 2013, the Company elected to pay off the remaining $288,647 balance on the existing capital lease. The payoff included a $1 buyout option that transferred ownership of the assets to the Company. As of September 30, 2013 the Company has no outstanding capital lease obligations.
Interest expense incurred on capital leases during the nine months ended September 30, 2013 and year ended December 31, 2012 was $15,751 and $31,000, respectively.
Note I—Fair Value
The Company categorizes its assets and liabilities measured at fair value into a fair value hierarchy that prioritizes the assumptions used in pricing the asset or liability into the following three levels:
| • | Level 1—Quoted prices in active markets for identical assets or liabilities. |
| • | Level 2—Inputs other than Level 1 that are observable, either directly or indirectly, such as quoted prices for similar assets or liabilities; quoted prices in markets that are not active; or other inputs that can be corroborated by observable market data for substantially the full term of the assets or liabilities. |
| • | Level 3—Unobservable inputs that are supported by little or no market activity and that are significant to the fair value of the assets or liabilities. |
The Company enters into commitments with consumers to originate loans at a specified interest rate. The Company reports IRLCs as derivative instruments at fair value and are recorded as a component of derivative assets on the balance sheet with changes in fair value being recorded in current earnings as a component of gain on sale of mortgage loans in the statement of operations.
The valuations for the IRLCs are based on current investor pricing from daily investor pricing tables in the Company’s principal market for a loan product with similar loan amount, note rate, term, loan program and other characteristics. The valuations for all IRLCs are adjusted at the loan level to consider the servicing release premium, anticipated origination income and expected future cost to originate specific to each underlying loan. The Company applies an anticipated loan funding probability based on its own experience to value IRLCs, which results in the classification of these instruments as Level 3. The value of the underlying loan and the anticipated
F-124
Table of Contents
IMORTGAGE.COM, INC.
NOTES TO FINANCIAL STATEMENTS—(Continued)
loan funding probability are the most significant assumptions affecting the valuation of IRLCs. As of September 30, 2013 and December 31, 2012, the notional value of IRLCs outstanding was $321,508,951 and $317,634,524, respectively.
The Company has elected the irrevocable option to account for the loans held for sale at fair value in accordance with ASC 825. The fair value for loans held for sale is based on current investor pricing from daily investor pricing tables in the Company’s principal market for a loan product with similar loan amount, note rate, term, loan program and other characteristics. The valuations for all loans held for sale are adjusted at the loan level to consider the servicing release premium specific to each loan. Loans held for sale are classified as Level 2. Loans held for sale measured at fair value that become impaired are transferred from Level 2 to Level 3. There were no identified impaired loans as of September 30, 2013. Changes in the fair value of the loans held for sale is recorded in current earnings as a component of gain on sale of mortgage loans in the statement of operations. The Company recognizes interest income separately from other changes in fair value.
The Company economically hedges the changes in fair value of IRLCs and loans held for sale caused by changes in interest rates by entering into mandatory and best efforts forward delivery commitments. Mandatory forward delivery commitments are considered derivative instruments and are recorded as a component of derivative liabilities on the balance sheet. The Company has elected the irrevocable option to account for the best efforts forward delivery commitments at fair value in accordance with ASC 825 and they are recorded as a component of financial instrument liabilities on the balance sheet. The changes in fair value for these hedging instruments are recorded in current earnings as a component of gain on sale of mortgage loans in the statement of operations. Mandatory forward delivery commitments used to hedge both IRLCs and loans held for sale are valued using inputs related to characteristics of the “to be announced mortgage-backed securities” (“TBA MBS”) stratified by product, coupon, and settlement date. These derivatives are classified as Level 2. As of September 30, 2013 and December 31, 2012, there was $492,905,816 and $388,632,921, respectively, of unsettled mandatory forward delivery commitments notional value outstanding.
Best efforts forward delivery commitments are valued using investor pricing considering the current base loan price. An anticipated loan funding probability is applied to value best efforts commitments hedging IRLCs, which results in the classification of these contracts as Level 3. The current base loan price and the anticipated loan funding probability are the most significant assumptions affecting the value of the best efforts commitments. The best efforts forward delivery commitments hedging loans held for sale are classified as Level 2; such contracts are transferred from Level 3 to Level 2 at the time the underlying loan is originated. As of September 30, 2013 and December 31, 2012, there was $75,278,884 and $315,394,874, respectively, of best efforts forward delivery commitments notional value outstanding.
The following presents the Company’s assets and liabilities that are measured at fair value on a recurring basis as of September 30, 2013:
| Recurring Fair Value Measurements of Assets (Liabilities) Using | ||||||||||||||||
| Quoted Market Prices in Active Markets for Identical Assets (Level 1) |
Significant Other Observable Inputs (Level 2) |
Significant Unobservable Inputs (Level 3) |
Total Fair Value Measurements |
|||||||||||||
| Loans held for sale |
$ | — | $ | 312,508,974 | $ | — | $ | 312,508,974 | ||||||||
| Interest rate lock commitments (“IRLCs”) |
— | — | 11,483,651 | 11,483,651 | ||||||||||||
| Mandatory forward delivery contracts |
— | (6,839,459 | ) | — | (6,839,459 | ) | ||||||||||
| Best efforts forward delivery contracts |
— | (684,024 | ) | (145,869 | ) | (829,893 | ) | |||||||||
|
|
|
|
|
|
|
|
|
|||||||||
| Total |
$ | — | $ | 304,985,491 | $ | 11,337,782 | $ | 316,323,273 | ||||||||
|
|
|
|
|
|
|
|
|
|||||||||
F-125
Table of Contents
IMORTGAGE.COM, INC.
NOTES TO FINANCIAL STATEMENTS—(Continued)
The following presents the Company’s assets and liabilities that are measured at fair value on a recurring basis as of December 31, 2012:
| Recurring Fair Value Measurements of Assets (Liabilities) Using | ||||||||||||||||
| Quoted Market Prices in Active Markets for Identical Assets (Level 1) |
Significant Other Observable Inputs (Level 2) |
Significant Unobservable Inputs (Level 3) |
Total Fair Value Measurements |
|||||||||||||
| Loans held for sale |
$ | — | $ | 460,435,558 | $ | — | $ | 460,435,558 | ||||||||
| Interest rate lock commitments (“IRLCs”) |
— | — | 10,674,602 | 10,674,602 | ||||||||||||
| Mandatory forward delivery contracts |
— | (5,303,388 | ) | — | (5,303,388 | ) | ||||||||||
| Best efforts forward delivery contracts |
— | (2,496,261 | ) | (1,104,562 | ) | (3,600,823 | ) | |||||||||
|
|
|
|
|
|
|
|
|
|||||||||
| Total |
$ | — | $ | 452,635,909 | $ | 9,570,040 | $ | 462,205,949 | ||||||||
|
|
|
|
|
|
|
|
|
|||||||||
The following presents the changes in the Company’s assets and liabilities that are measured at fair value on a recurring basis using significant unobservable inputs (Level 3) for the nine months ended September 30, 2013:
| Interest Rate Lock Commitments |
Best Efforts Forward Delivery Contracts |
|||||||
| Balance at beginning of year |
$ | 10,674,602 | $ | (1,104,562 | ) | |||
| Transfers into Level 3 |
— | — | ||||||
| Transfers out of Level 3 |
— | — | ||||||
| Total net gains (losses) included in earnings (realized and unrealized) |
809,049 | 958,693 | ||||||
| Sales and settlements |
||||||||
| Purchases |
— | — | ||||||
| Sales |
— | — | ||||||
| Settlements |
— | — | ||||||
| Transfers of IRLCs to closed loans |
— | — | ||||||
|
|
|
|
|
|||||
| Balance at end of year |
$ | 11,483,651 | $ | (145,869 | ) | |||
|
|
|
|
|
|||||
The following presents the changes in the Company’s assets and liabilities that are measured at fair value on a recurring basis using significant unobservable inputs (Level 3) for the year ended December 31, 2012:
| Commitments | Delivery Contracts |
|||||||
| Balance at beginning of year |
$ | — | $ | |||||
| Transfers into Level 3 |
— | — | ||||||
| Transfers out of Level 3 |
— | — | ||||||
| Total net gains (losses) included in earnings (realized and unrealized) |
10,674,602 | (1,104,562 | ) | |||||
| Sales and settlements |
||||||||
| Purchases |
— | — | ||||||
| Sales |
— | — | ||||||
| Settlements |
— | — | ||||||
| Transfers of IRLCs to closed loans |
— | — | ||||||
|
|
|
|
|
|||||
| Balance at end of year |
$ | 10,674,602 | $ | (1,104,562 | ) | |||
|
|
|
|
|
|||||
F-126
Table of Contents
IMORTGAGE.COM, INC.
NOTES TO FINANCIAL STATEMENTS—(Continued)
The following presents the gains included in earnings for the nine months ended September 30, 2013 relating to the Company’s assets and liabilities that are measured at fair value on a recurring basis using significant unobservable inputs (Level 3):
| Interest Rate Lock Commitments |
Best Efforts Forward Delivery Contracts |
|||||||
| Total net gains (losses) included in earnings, which are included in gain on sale of mortgage loans |
$ | 809,049 | $ | 958,693 | ||||
|
|
|
|
|
|||||
| Change in unrealized gains (losses) relating to assets and liabilities still held at year end which are included in gain on sale of mortgage loans |
$ | 11,483,651 | $ | (145,869 | ) | |||
|
|
|
|
|
|||||
The following presents the gains included in earnings for the year ended December 31, 2012 relating to the Company’s assets and liabilities that are measured at fair value on a recurring basis using significant unobservable inputs (Level 3):
| Interest Rate Lock Commitments |
Best Efforts Forward Delivery Contracts |
|||||||
| Total net gains (losses) included in earnings, which are included in gain on sale of mortgage loans |
$ | 10,674,602 | $ | (1,104,562 | ) | |||
|
|
|
|
|
|||||
| Change in unrealized gains (losses) relating to assets and liabilities still held at year end which are included in gain on sale of mortgage loans |
$ | 10,674,602 | $ | (1,104,562 | ) | |||
|
|
|
|
|
|||||
The Company does not have any assets or liabilities that are recorded at fair value on a non-recurring basis as of September 30, 2013 and December 31, 2012.
The following disclosures represent financial instruments in which the ending balances at September 30, 2013 and December 31, 2012 are not carried at fair value on the Company’s balance sheet. The additional disclosure below of the estimated fair value of financial instruments has been determined by the Company using available market information and appropriate valuation methodologies. However, considerable judgment is required to interpret market data to develop the estimates of fair value. Accordingly, the estimates presented herein may not necessarily be indicative of the amounts that could be realized in a current market exchange. The use of different market assumptions or estimation methodologies may have a material impact on the estimated fair value amounts.
| As of September 30, 2013: | ||||||||
| Carrying Amount |
Fair Value | |||||||
| Cash and cash equivalents |
$ | 34,450,152 | $ | 34,450,152 | ||||
| Restricted cash |
4,309,340 | 4,309,340 | ||||||
| Accounts receivable |
5,431,875 | 5,431,875 | ||||||
| Warehouse lines of credit |
(282,419,555 | ) | (282,419,555 | ) | ||||
| Bank line of credit |
— | — | ||||||
| Accounts payable |
(4,217,706 | ) | (4,217,706 | ) | ||||
F-127
Table of Contents
IMORTGAGE.COM, INC.
NOTES TO FINANCIAL STATEMENTS—(Continued)
| As of December 31, 2012: | ||||||||
| Carrying Amount |
Fair Value | |||||||
| Cash and cash equivalents |
$ | 17,216,006 | $ | 17,216,006 | ||||
| Restricted cash |
4,540,727 | 4,540,727 | ||||||
| Accounts receivable |
2,611,667 | 2,611,667 | ||||||
| Warehouse lines of credit |
424,724,202 | 424,724,202 | ||||||
| Bank line of credit |
3,000,000 | 3,000,000 | ||||||
| Accounts payable |
5,599,916 | 5,599,916 | ||||||
The carrying amounts of cash and cash equivalents and restricted cash reflected in the balance sheet approximate fair value as they are maintained with various high-quality financial institutions and are considered by the Company to be highly liquid. Accounts receivable, warehouse lines of credit, bank line of credit and accounts payable are all short-term in nature and have current market rates and therefore the carrying amount approximates fair value (Level 1).
Note J—Income Taxes
The components of the income tax expenses (benefit) are as follows, for the nine months ended September 30, 2013 and the year ended December 31, 2012:
| As of September 30, 2013 |
As of December 31, 2012 |
|||||||
| Current tax expense |
||||||||
| Federal |
$ | 1,312,514 | $ | 11,453,354 | ||||
| State |
3,057,606 | 2,850,475 | ||||||
|
|
|
|
|
|||||
| Total current tax expense |
16,179,120 | 14,303,829 | ||||||
| Deferred tax (benefit) expense |
||||||||
| Federal |
(4,948,496 | ) | 341,531 | |||||
| State |
(1,227,202 | ) | 83,891 | |||||
|
|
|
|
|
|||||
| Total deferred tax benefit |
(6,175,698 | ) | 425,422 | |||||
|
|
|
|
|
|||||
| Total |
$ | 10,003,422 | $ | 14,729,251 | ||||
|
|
|
|
|
|||||
Income tax expense for the period ended September 30, 2013 and year ended December 31, 2012 differs from the amounts computed by applying the U.S. federal income tax rate of 35% to earnings before income taxes due to the following: (a) state income taxes, (b) permanent differences related to expenses deductible for books but not for tax, and (c) unrecognized tax benefits.
F-128
Table of Contents
IMORTGAGE.COM, INC.
NOTES TO FINANCIAL STATEMENTS—(Continued)
Significant components of the Company’s deferred income tax assets and liabilities are as follows:
| As of September 30, 2013 |
As of December 31, 2012 |
|||||||
| Deferred tax assets: |
||||||||
| Deferred rent |
$ | 1,050,270 | $ | 583,845 | ||||
| Compensation accruals |
2,136,258 | 217,286 | ||||||
| Bad debts |
551,908 | 794,566 | ||||||
| State and local taxes |
1,072,960 | 917,031 | ||||||
| Accruals, reserves and other |
1,137,869 | — | ||||||
|
|
|
|
|
|||||
| Total deferred tax assets |
5,949,265 | 2,512,728 | ||||||
| Deferred tax liabilities |
||||||||
| Fair value—derivatives |
— | 2,167,421 | ||||||
| Depreciation |
1,104,670 | 1,676,409 | ||||||
|
|
|
|
|
|||||
| Total deferred tax liabilities |
1,104,670 | 3,843,830 | ||||||
|
|
|
|
|
|||||
| Net deferred tax assets (liabilities) |
$ | 4,844,595 | $ | 1,331,102 | ||||
|
|
|
|
|
|||||
In assessing the realizability of deferred tax assets, management considers whether it is more likely than not that some portion or all of the deferred tax assets will not be realized. Generally, the ultimate realization of deferred tax assets is dependent upon the generation of future taxable income during the periods in which those temporary differences become deductible. Based on historical performance, management has determined that a valuation allowance is not needed with respect to the ending deferred tax asset balances at September 30, 2013 and December 31, 2012.
As of September 30, 2013, the Company established a reserve for unrecognized tax benefits of $4,730,000 and $273,000, respectively which includes accrued penalties of $70,000 and $46,000 respectively, and interest of $53,000 and $24,000 respectively, which are included as a component of income tax payable on the balance sheet and provision for income taxes on the statement of operations.
The Company is subject to U.S. federal, state and local income tax, and in the normal course of business, its income tax returns are subject to examination by the relevant taxing authorities. As of September 30, 2013, the 2009–2012 tax years remain subject to examination in the various jurisdictions. The Company does not expect its unrecognized tax benefits to change significantly over the next 12 months.
Note K—Related Party Transactions
The Company entered into a software licensing agreement with MTH on August 24, 2000. The terms of the agreement allows MTH to use the software of the Company to help in the origination of mortgage applications. There is no fee for this agreement.
MTH entered into a service agreement with the Company on August 24, 2000. Under the terms of the agreement, the Company will process all loan applications taken by MTH, provide accounting services and support, coordinate legal services, and provide any other administrative support needed by MTH. The Company earns a fee on a per loan basis of $600, calculated as: $225 processing fee and $375 administration fee. Total processing and administration fees for the period ended September 30, 2013 and year ended December 31, 2012 was $1,210,800 and $1,161,600, respectively, and is recorded in other loan based-income in the statement of operations.
F-129
Table of Contents
IMORTGAGE.COM, INC.
NOTES TO FINANCIAL STATEMENTS—(Continued)
Receivables due from MTH totaled $940,637 and $950,065 at September 30, 2013 and December 31, 2012, respectively, which was primarily comprised of capital distributions and processing and administration fees due to the Company.
MTH provides loan origination services as a mortgage broker to the Company. For the period ended September 30, 2013 and year ended December 31, 2012, the Company incurred $18,213,912 and $15,987,473, respectively, of loan broker expense due to the MTH which is recorded in direct origination expense in the statement of operations. Balances payable to MTH was $404 and $12,736 at September 30, 2013 and December 31, 2012, respectively.
At September 30, 2013 and December 31, 2012, classified within accounts receivable are employee receivable of 1,339,700 and 8,300, respectively which consist primarily of expense advances.
Note L—Commitments and Contingencies
Operating Leases
The Company is obligated under various non-cancelable operating leases, which are subject to rent escalation clauses and include rent holidays, for its office facilities that expire at various times through 2023. The following is a schedule of future minimum lease payments for operating leases with initial terms in excess of one year as of September 30, 2013:
| Year ending December 31, |
||||
| 2013 |
$ | 1,332,241 | ||
| 2014 |
6,090,168 | |||
| 2015 |
5,792,990 | |||
| 2016 |
5,210,331 | |||
| 2017 |
4,191,800 | |||
| Thereafter |
10,259,283 | |||
|
|
|
|||
| $ | 32,876,813 | |||
|
|
|
|||
Rent expense for operating leases was $5,741,986 and $4,861,710 during the nine months ended September 30, 2013 and year ended December 31, 2012
Legal Matters
The Company is party to general legal proceedings which have arisen in the ordinary course of business. While the results of these matters cannot be predicted with certainty, the Company’s management believes that losses, if any, resulting from the ultimate resolution of these matters will not have a material adverse effect on the Company’s financial position, results of operations or cash flows.
Note M—Capital Requirements
The Company is subject to various capital requirements by the U.S. Department of Housing and Urban Development (“HUD”). Failure to maintain minimum capital requirements could result in the inability to participate in HUD-assisted mortgage insurance programs.
F-130
Table of Contents
IMORTGAGE.COM, INC.
NOTES TO FINANCIAL STATEMENTS—(Continued)
The Company’s stockholders’ equity and minimum capital requirements as of September 30, 2013 is as follows:
| Stockholders’ Equity |
Minimum Capital Requirement |
|||||||
| HUD |
$ | 54,246,198 | $ | 1,000,000 | ||||
|
|
|
|
|
|||||
The Company’s stockholders’ equity and minimum capital requirements as of December 31, 2012 is as follows:
| Stockholders’ Equity |
Minimum Capital Requirement |
|||||||
| HUD |
$ | 41,483,372 | $ | 1,000,000 | ||||
|
|
|
|
|
|||||
Note N—Stockholders’ Equity
Authorized shares
On September 22, 2000, the stockholders of the Company approved an increase to the authorized number of $0.01 par value common stock from 10,000 to 10,000,000 shares, and the number of .01 par value preferred stock from 5,000 to 5,000,000 shares. The Company also approved a 1,000 to 1 stock split effective that date. All financial references presented have been adjusted to give effect for this stock split.
Preferred Stock
Under the terms of the Company’s Articles of Incorporation, the Board of Directors may determine the rights, preferences, and terms of the Company’s authorized but unissued shares of preferred stock. No preferred stock has ever been issued.
Treasury Stock
The Company purchased the stock of several of its shareholders during 2004 and 2005, and again in 2013. The Company plans to offer the stock to employees or other investors in the future. As of September 30, 2013 and December 31, 2012 the Company has 86,469 and 27,487 shares of treasury stock.
Note O—Subsequent Event
ASC 855, Subsequent Events (“ASC 855”), establishes general standards of accounting for, and disclosures of, events that occur after the balance sheet date, but before the financial statements are issued or available to be issued. In accordance with ASC 855, the Company has evaluated subsequent events through April 28, 2015, which is the date these financial statements were available to be issued.
On August 21, 2013, imortgage and loanDepot.com, LLC (“loanDepot”) announced that they had entered into a definitive agreement to merger (the “Merger”) pursuant to which imortgage merged with and into loanDepot. Under the terms of the Merger, stockholders of imortgage received cash and equity (or total consideration) of $39 million. The transaction closed on October 1, 2013.
F-131
Table of Contents
30,000,000 Shares
loanDepot, Inc.
Class A Common Stock
PRELIMINARY PROSPECTUS
Morgan Stanley
Goldman, Sachs & Co.
Wells Fargo Securities
Barclays
UBS Investment Bank
Citigroup
BMO Capital Markets
JMP Securities
Raymond James
William Blair
, 2015
Through and including , 2015 (the 25th day after the date of this prospectus), all dealers effecting transactions in these securities, whether or not participating in this offering, may be required to deliver a prospectus. This is in addition to a dealer’s obligation to deliver a prospectus when acting as an underwriter and with respect to an unsold allotment or subscription.
Table of Contents
INFORMATION NOT REQUIRED IN PROSPECTUS
Item 13. Other Expenses of Issuance and Distribution
The following table sets forth all costs and expenses, other than the underwriting discounts and commissions and financial advisory services fees payable by us, in connection with the offer and sale of the securities being registered. All amounts shown are estimates except for the SEC registration fee and the Financial Industry Regulatory Authority, Inc. (“FINRA”) filing fee.
| Amount | ||||
| SEC registration fee |
$ | 62,535 | ||
| FINRA filing fee |
93,650 | |||
| Listing fee |
250,000 | |||
| Printing expenses |
250,000 | |||
| Accounting fees and expenses |
1,250,000 | |||
| Legal fees and expenses |
2,350,000 | |||
| Blue Sky fees and expenses |
5,000 | |||
| Transfer Agent and Registrar fees and expenses |
5,000 | |||
| Miscellaneous expenses |
173,815 | |||
|
|
|
|||
| Total |
$ | 4,440,000 | ||
|
|
|
|||
Item 14. Indemnification of Officers and Directors
Section 102 of the DGCL allows a corporation to eliminate the personal liability of directors of a corporation to the corporation or its stockholders for monetary damages for breach of fiduciary duty as a director, except where the director breached the duty of loyalty, failed to act in good faith, engaged in intentional misconduct or knowingly violated a law, authorized the payment of a dividend or approved a stock repurchase in violation of the DGCL or obtained an improper personal benefit.
Section 145 of the DGCL provides, among other things, that we may indemnify any person who was or is a party or is threatened to be made a party to any threatened, pending or completed action, suit or proceeding—other than an action by or in the right of the registrant—by reason of the fact that the person is or was a director, officer, agent or employee of the registrant, or is or was serving at our request as a director, officer, agent or employee of another corporation, partnership, joint venture, trust or other enterprise against expenses, including attorneys’ fees, judgments, fines and amounts paid in settlement actually and reasonably incurred by the person in connection with such action, suit or proceeding. The power to indemnify applies (a) if such person is successful on the merits or otherwise in defense of any action, suit or proceeding, or (b) if such person acting in good faith and in a manner he or she reasonably believed to be in the best interest, or not opposed to the best interest, of the registrant, and with respect to any criminal action or proceeding had no reasonable cause to believe his or her conduct was unlawful. The power to indemnify applies to actions brought by or in the right of the registrant as well but only to the extent of defense expenses, including attorneys’ fees but excluding amounts paid in settlement, actually and reasonably incurred and not to any satisfaction of judgment or settlement of the claim itself, and with the further limitation that in such actions no indemnification shall be made in the event of any adjudication of liability to the registrant, unless the court believes that in light of all the circumstances indemnification should apply.
Section 174 of the DGCL provides, among other things, that a director, who willfully or negligently approves of an unlawful payment of dividends or an unlawful stock purchase or redemption, may be held liable for such actions. A director who was either absent when the unlawful actions were approved or dissented at the
II-1
Table of Contents
time, may avoid liability by causing his or her dissent to such actions to be entered in the books containing minutes of the meetings of the board of directors at the time such action occurred or immediately after such absent director receives notice of the unlawful acts.
The registrant’s amended and restated bylaws, to be filed as Exhibit 3.2 hereto, provide that the registrant shall indemnify its directors and executive officers to the fullest extent not prohibited by the DGCL or any other applicable law. In addition, the registrant intends to enter into separate indemnification agreements, to be filed as Exhibit 10.3 hereto, with its directors and officers which would require the registrant, among other things, to indemnify them against certain liabilities which may arise by reason of their status or service as directors or officers to the fullest extent not prohibited by law. These indemnification provisions and the indemnification agreements may be sufficiently broad to permit indemnification of the registrant’s officers and directors for liabilities, including reimbursement of expenses incurred, arising under the Securities Act. The registrant also intends to maintain director and officer liability insurance, if available on reasonable terms.
The form of Underwriting Agreement, to be filed as Exhibit 1.1 hereto, provides for indemnification by the underwriters of us and our officers and directors for certain liabilities, including liabilities arising under the Securities Act and affords certain rights of contribution with respect thereto.
Item 15. Recent Sales of Unregistered Securities
On July 31, 2015, the registrant issued 1,000 shares of the registrant’s common stock, par value $0.001 per share, to LDLLC for $1.00. The issuance of such shares of common stock was not registered under the Securities Act because the shares were offered and sold in a transaction exempt from registration under Section 4(a)(2) of the Securities Act.
In connection with the Reorganization Transactions, based on an assumed initial public offering price of $17.00 per share (the midpoint of the estimated price range set forth on the cover page of the prospectus included as part of this registration statement), the registrant will issue 88,430,533 shares of its Class B common stock, par value $0.001 per share, to the Continuing LLC Members and 38,548,603 shares of its Class A common stock to the Parthenon Stockholders. The issuance of such shares of Class A common stock and Class B common stock will not be registered under the Securities Act because the shares will be offered and sold in transactions exempt from registration under Section 4(a)(2) of the Securities Act.
Item 16. Exhibits
(1) Exhibits:
The exhibit index attached hereto is incorporated herein by reference.
(2) Financial Statement Schedules:
All schedules have been omitted because they are not required or because the required information is given in the financial statements or notes to those statements.
Item 17. Undertakings
The undersigned registrant hereby undertakes to provide to the underwriters at the closing specified in the underwriting agreement certificates in such denominations and registered in such names as required by the underwriters to permit prompt delivery to each purchaser.
Insofar as indemnification for liabilities arising under the Securities Act of 1933, as amended, may be permitted to directors, officers and controlling persons of the registrant pursuant to the foregoing provisions, or otherwise, the registrant has been advised that in the opinion of the Securities and Exchange Commission such
II-2
Table of Contents
indemnification is against public policy as expressed in the Securities Act and is, therefore, unenforceable. In the event that a claim for indemnification against such liabilities (other than the payment by the registrant of expenses incurred or paid by a director, officer or controlling person of the registrant in the successful defense of any action, suit or proceeding) is asserted by such director, officer or controlling person in connection with the securities being registered, the registrant will, unless in the opinion of its counsel the matter has been settled by controlling precedent, submit to a court of appropriate jurisdiction, the question whether such indemnification by it is against public policy as expressed in the Securities Act and will be governed by the final adjudication of such issue.
The undersigned registrant hereby further undertakes that:
| (1) | For purposes of determining any liability under the Securities Act of 1933, as amended, the information omitted from the form of prospectus filed as part of this registration statement in reliance upon Rule 430A and contained in a form of prospectus filed by the registrant pursuant to Rule 424(b)(1) or (4) or 497(h) under the Securities Act shall be deemed to be part of this registration statement as of the time it was declared effective. |
| (2) | For the purpose of determining any liability under the Securities Act of 1933, as amended, each post-effective amendment that contains a form of prospectus shall be deemed to be a new registration statement relating to the securities offered therein, and the offering of such securities at that time shall be deemed to be the initial bona fide offering thereof. |
II-3
Table of Contents
SIGNATURES
Pursuant to the requirements of the Securities Act of 1933, as amended, the registrant has duly caused this registration statement to be signed on its behalf by the undersigned, thereunto duly authorized in the City of Foothill Ranch, State of California, on November 3, 2015.
| loanDepot, Inc. (Registrant) | ||
| By: | /s/ Anthony Hsieh | |
| Name: Anthony Hsieh | ||
| Title: Chairman and Chief Executive Officer | ||
* * * *
Pursuant to the requirements of the Securities Act of 1933, as amended, this registration statement has been signed by the following persons in the capacities and on the dates indicated.
| Name |
Title |
Date | ||
| /s/ Anthony Hsieh Anthony Hsieh |
Chairman and Chief Executive Officer (Principal Executive Officer) |
November 3, 2015 | ||
| /s/ Bryan Sullivan Bryan Sullivan |
Executive Vice President, Chief Financial Officer (Principal Financial Officer) |
November 3, 2015 | ||
| /s/ Mike Smith Mike Smith |
Chief Accounting Officer (Principal Accounting Officer) |
November 3, 2015 | ||
| * Brian P. Golson |
Director | November 3, 2015 | ||
| * Andrew C. Dodson |
Director | November 3, 2015 | ||
| * John C. Dorman |
Director | November 3, 2015 | ||
| * Dawn Lepore |
Director | November 3, 2015 | ||
| * | /s/ Peter Macdonald | |
| Peter Macdonald as Attorney-in-fact | ||
II-4
Table of Contents
EXHIBIT INDEX
| Exhibit No. |
Description | |
| 1.1† | Form of Underwriting Agreement | |
| 2.1¥† | Asset Purchase Agreement dated August 19, 2013, by and among loanDepot.com, LLC, imortgage.com, Inc. and the other parties thereto | |
| 2.2¥† | Asset Purchase Agreement dated November 12, 2014, by and among loanDepot.com, LLC, Mortgage Master, Inc. and the other parties thereto (“MMI APA”) | |
| 2.2.1† | First Amendment to MMI APA dated January 2, 2015, by and among loanDepot.com, LLC, Mortgage Master, Inc. and the other parties thereto | |
| 2.2.2¥† | Side Letter to MMI APA dated February 12, 2015, by and among loanDepot.com, LLC, Mortgage Master, Inc. and the other parties thereto (“MMI Side Letter”) | |
| 2.2.3¥† | Commercial Promissory Notes issued by loanDepot.com, LLC to Mortgage Master, Inc. pursuant to the MMI Side Letter (collectively, “MMI Notes”) | |
| 2.2.4¥† | Amendment dated June 2, 2015 to (i) the MMI APA, (ii) the MMI Side Letter and (iii) the MMI Notes, by and among loanDepot.com, LLC, Mortgage Master, Inc. and the other parties thereto | |
| 3.1† | Form of Amended and Restated Certificate of Incorporation of loanDepot, Inc. | |
| 3.2† | Form of Amended and Restated Bylaws of loanDepot, Inc. | |
| 4.1 | Form of Registration Rights Agreement | |
| 5.1 | Opinion of Kirkland & Ellis LLP | |
| 10.1 | Form of Stockholders Agreement | |
| 10.2† | Form of Tax Receivable Agreement | |
| 10.3+† | Form of Directors and Officers Indemnification Agreement | |
| 10.4+ | 2015 Omnibus Incentive Plan | |
| 10.5+† | Form of Stock Appreciation Rights Agreement | |
| 10.6+† | Form of Restricted Stock Agreement | |
| 10.7+† | Form of Incentive Stock Option Agreement | |
| 10.8+† | Form of Restricted Stock Unit Agreement | |
| 10.9+† | Form of Nonqualified Stock Option Agreement | |
| 10.10+† | 2009 Incentive Equity Plan | |
| 10.11+† | 2012 Incentive Equity Plan | |
| 10.12† | Amended and Restated Management Services Agreement, dated as of May 17, 2015, by and between loanDepot.com, LLC and PCap, L.P. | |
| 10.13+† | Employment Agreement, dated as of December 30, 2009, by and between loanDepot.com, LLC and Anthony Hsieh | |
| 10.14+† | Employment Agreement, dated as of April 14, 2014, by and between loanDepot.com, LLC and David Norris | |
II-5
Table of Contents
| Exhibit No. |
Description | |
| 10.14.1+† | Advisory Agreement, dated as of August 30, 2015, by and between loanDepot.com, LLC and David Norris | |
| 10.15+† | Offer Letter, dated as of April 25, 2012, by and between loanDepot.com, LLC and Jeff DerGurahian | |
| 10.16+† | Employment Agreement, dated as of July 14, 2014, by and between loanDepot.com, LLC and Jon C. Frojen | |
| 10.17+#† | Employment Agreement, dated as of September 30, 2013, by and between loanDepot.com, LLC and Bryan Sullivan | |
| 10.18+† | Offer Letter, dated as of February 10, 2015, by and between loanDepot.com, LLC and Brian Biglin | |
| 10.19+ | Employment Agreement, dated as of September 1, 2009, by and between loanDepot.com, LLC and Peter Macdonald | |
| 10.20+† | Offer Letter, dated as of February 16, 2015, by and between loanDepot.com, LLC and Dominick Marchetti | |
| 10.21+ | Superseding Offer Letter, dated as of June 1, 2015, by and between loanDepot.com, LLC and John C. Dorman | |
| 10.22+#† | Offer Letter, dated as of April 8, 2015, by and between loanDepot.com, LLC and Dawn Lepore | |
| 10.23† | Form of Class P Subscription Agreement | |
| 10.24† | Form of Class P-2 Subscription Agreement | |
| 10.25† | Master Repurchase Agreement, dated March 14, 2012, between UBS Real Estate Securities, Inc., and loanDepot.com, LLC | |
| 10.25.1† | Amendment No. 1 to Pricing Letter and Amendment No. 1 to Master Repurchase Agreement, dated April 26, 2012, between UBS Real Estate Securities, Inc., and loanDepot.com, LLC | |
| 10.25.2#† | Amendment No. 3 to Pricing Letter and Amendment No. 2 to Master Repurchase Agreement, dated July 27, 2012, between UBS Real Estate Securities, Inc., and loanDepot.com, LLC | |
| 10.25.3#† | Amendment No. 4 to Pricing Letter and Amendment No. 3 to the Master Repurchase Agreement, dated September 25, 2012, between UBS Real Estate Securities, Inc., and loanDepot.com, LLC | |
| 10.25.4† | Amendment No. 4 to Master Repurchase Agreement, dated March 27, 2014, between UBS Real Estate Securities, Inc., and loanDepot.com, LLC | |
| 10.25.5#† | Amendment No. 8 to Pricing Letter and Amendment No. 5 to Master Repurchase Agreement, dated April 29, 2014, between UBS Real Estate Securities, Inc., and loanDepot.com, LLC | |
| 10.25.6#† | Amendment No. 9 to Pricing Letter and Amendment No. 6 to Master Repurchase Agreement, dated October 27, 2014, between UBS Real Estate Securities, Inc., and loanDepot.com, LLC | |
| 10.26† | Master Repurchase Agreement, dated November 21, 2013, between Jefferies Mortgage Funding, LLC, and loanDepot.com, LLC | |
| 10.26.1† | Amendment Number One to the Master Repurchase Agreement, dated March 20, 2014, between Jefferies Mortgage Funding, LLC, and loanDepot.com, LLC | |
| 10.26.2† | Amendment Number Two to the Master Repurchase Agreement, dated December 17, 2014, between Jefferies Funding LLC (f/k/a Jefferies Mortgage Funding, LLC), and loanDepot.com, LLC | |
II-6
Table of Contents
| Exhibit No. |
Description | |
| 10.26.3† | Amendment Number Three to the Master Repurchase Agreement, dated September 17, 2015, between Jefferies Funding LLC (f/k/a Jefferies Mortgage Funding, LLC) and loanDepot.com, LLC | |
| 10.27#† | Master Repurchase Agreement, dated December 23, 2009, between Bank of America, N.A., and loanDepot.com, LLC | |
| 10.27.1#† | Amendment No. 1 to Master Repurchase Agreement, dated September 14, 2011, between Bank of America, N.A., and loanDepot.com, LLC | |
| 10.27.2#† | Amendment No. 2 to Master Repurchase Agreement, dated June 20, 2012, between Bank of America, N.A., and loanDepot.com, LLC | |
| 10.27.3† | Amendment No. 3 to Master Repurchase Agreement, dated June 19, 2013, between Bank of America, N.A., and loanDepot.com, LLC | |
| 10.27.4† | Amendment No. 4 to Master Repurchase Agreement, dated May 13, 2014, between Bank of America, N.A., and loanDepot.com, LLC | |
| 10.27.5† | Amendment No. 5 to Master Repurchase Agreement, dated June 18, 2014, between Bank of America, N.A., and loanDepot.com, LLC | |
| 10.27.6† | Amendment No. 6 to Master Repurchase Agreement, dated January 26, 2015, between Bank of America, N.A., and loanDepot.com, LLC | |
| 10.28† | As Soon As Pooled Plus Agreement, dated as of October 3, 2012, between the Federal National Mortgage Association, and loanDepot.com, LLC | |
| 10.29† | Credit and Security Agreement, dated October 29, 2014, by and between loanDepot.com, LLC and NexBank SSB | |
| 10.29.1† | First Amendment to Credit and Security Agreement, dated May 29, 2015, between loanDepot.com, LLC and NexBank SSB | |
| 10.29.2#† | Second Amendment to Credit and Security Agreement, dated June 26, 2015, between loanDepot.com, LLC and NexBank SSB | |
| 10.30#† | Credit Agreement, dated October 18, 2013, by and among loanDepot.com, LLC, U.S. Bank National Association and the Lenders from time to time party thereto | |
| 10.30.1† | Amendment No. 1 to Credit Agreement, dated June 13, 2014, by and among loanDepot.com, LLC, U.S. Bank National Association and the Lenders from time to time party thereto | |
| 10.30.2† | Amendment No. 2 to Credit Agreement, dated December 31, 2014, by and among loanDepot.com, LLC, U.S. Bank National Association, and the Lenders from time to time party thereto | |
| 10.30.3† | Amendment No. 3 to Credit Agreement, dated February 17, 2015, by and among loanDepot.com, LLC, U.S. Bank National Association, and the Lenders from time to time party thereto | |
| 10.31† | Master Repurchase Agreement, dated March 20, 2014, between EverBank, and loanDepot.com, LLC | |
| 10.31.1#† | First Amendment to Master Repurchase Agreement and Pricing letter, dated May 6, 2014, between EverBank, and loanDepot.com, LLC | |
| 10.31.2#† | Second Amendment to Master Repurchase Agreement and Pricing Letter, dated December 23, 2014, between EverBank, and loanDepot.com, LLC | |
| 10.31.3† | Third Amendment to Master Repurchase Agreement and Pricing Letter, dated March 6, 2015, between EverBank, and loanDepot.com, LLC | |
| 10.31.4#† | Fourth Amendment to Master Repurchase Agreement and Pricing Letter, dated March 18, 2015, between EverBank, and loanDepot.com, LLC | |
II-7
Table of Contents
| Exhibit No. |
Description | |
| 10.31.5#† | Fifth Amendment to Master Repurchase Agreement and Pricing Letter, dated May 22, 2015, between EverBank and loanDepot.com, LLC | |
| 10.31.6#† | Loan and Security Agreement, dated May 22, 2015, between EverBank and loanDepot.com, LLC | |
| 10.31.7† | Amended and Restated Promissory Note, dated July 13, 2015, by loanDepot.com, LLC, in favor of EverBank | |
| 10.32#† | Loan Program Agreement dated May 6, 2015, by and between loanDepot.com, LLC and Cross River Bank | |
| 10.33#† | Subservicing Agreement dated April 19, 2012, by and between loanDepot.com, LLC and Cenlar FSB | |
| 10.34#† | Service Bureau Agreement dated September 8, 2014, by and between loanDepot.com, LLC and First Associates Loan Servicing, LLC | |
| 10.35#† | Standard Office Lease, dated March 10, 2011, between Arden Realty Limited Partnership and loanDepot.com, LLC | |
| 10.35.1#† | First Amendment to Lease, dated September 7, 2012, between Arden Realty Limited Partnership and loanDepot.com, LLC | |
| 10.35.2#† | Second Amendment to Lease, dated January 24, 2013, between Arden Realty Limited Partnership and loanDepot.com, LLC | |
| 10.35.3#† | Third Amendment to Lease, dated March 27, 2014, between Arden Realty Limited Partnership and loanDepot.com, LLC | |
| 10.35.4#† | Fourth Amendment to Lease, dated June 10, 2014, between Arden Realty Limited Partnership and loanDepot.com, LLC | |
| 10.35.5#† | Fifth Amendment to Lease, dated October 14, 2014, between Arden Realty Limited Partnership and loanDepot.com, LLC | |
| 10.35.6# | Sixth Amendment to Lease, dated May 1, 2015, between Arden Realty Limited Partnership and loanDepot.com, LLC | |
| 10.36† | Settlement Agreement and Release, dated August 25, 2015, by and between LD Investment Holdings, Inc., Trilogy Mortgage Holdings, Inc., and loanDepot.com, LLC, on the one hand, and the imortgage Stockholders, on the other hand | |
| 10.37† | Form of Seventh Amended and Restated Limited Liability Company Agreement of loanDepot.com, LLC | |
| 10.37.1† | Form of Eighth Amended and Restated Limited Liability Company Agreement of loanDepot.com, LLC | |
| 10.38† | Form of Limited Liability Company Agreement of loanDepot Holdings, LLC | |
| 10.39† | Form of Purchase Agreement | |
| 10.40#† | Master Repurchase Agreement, dated as of September 2, 2015, by and between loanDepot.com, LLC and Morgan Stanley Bank, N.A. | |
| 10.41#† | Master Repurchase Agreement, dated as of September 15, 2011, between Wells Fargo Bank, N.A. and loanDepot.com, LLC | |
| 10.41.1#† | Amendment to Master Repurchase Agreement, dated September 15, 2011, between Wells Fargo Bank, N.A. and loanDepot.com, LLC | |
| 10.41.2#† | Amendment to Master Repurchase Agreement, dated November 1, 2012, between Wells Fargo Bank, N.A. and loanDepot.com, LLC | |
II-8
Table of Contents
| Exhibit No. |
Description | |
| 10.41.3#† | Amended and Restated Addendum to Master Repurchase Agreement, dated February 16, 2015, between Wells Fargo Bank, N.A. and loanDepot.com, LLC | |
| 10.42#† | Mortgage Loan Participation Purchase and Sale Agreement, dated as of February 28, 2013, between loanDepot.com, LLC and Jefferies Mortgage Funding, LLC | |
| 10.42.1† | Amendment Number One to the Mortgage Loan Participation Purchase and Sale Agreement, dated November 21, 2013 | |
| 10.43+† | Form of Amended and Restated Unit Grant Agreement | |
| 10.44#† | Master Repurchase Agreement, dated August 25, 2015, between BMO Harris Bank N.A. and loanDepot.com, LLC | |
| 10.45+ | Form of Employee Stock Purchase Plan | |
| 10.46† | Master Repurchase Agreement, dated June 1, 2015, between UBS Bank USA and loanDepot.com, LLC | |
| 10.46.1† | Amendment No. 1 to Master Repurchase Agreement, dated September 4, 2015, between UBS Bank USA and loanDepot.com, LLC | |
| 10.47+ | Offer Letter, dated September 23, 2014, by and between loanDepot.com, LLC and Mike Smith | |
| 10.48# | Master Repurchase Agreement, dated July 26, 2011, between CITIBANK, N.A., and loanDepot.com, LLC, as amended | |
| 10.49# | Amended and Restated Master Repurchase Agreement and Securities Contract, dated October 22, 2015, between Wells Fargo, N.A., and loanDepot.com, LLC, as amended | |
| 10.50# | Amended and Restated Master Repurchase Agreement, dated July 17, 2015, between Bank of America, N.A., and loanDepot.com, LLC, as amended | |
| 16.1† | Letter from Grant Thornton LLP to the Securities and Exchange Commission | |
| 21.1† | List of Subsidiaries of loanDepot, Inc. | |
| 23.1 | Consent of Ernst & Young LLP | |
| 23.2 | Consent of Ernst & Young LLP | |
| 23.3 | Consent of Grant Thornton LLP | |
| 23.4 | Consent of Wolf & Company, P.C. | |
| 23.5 | Consent of Grant Thornton LLP | |
| 23.6 | Consent of Kirkland & Ellis LLP (included in Exhibit 5.1) | |
| 24.1† | Power of Attorney (included on the signature page of this registration statement) | |
| † | Previously filed as an exhibit to our Registration Statement on Form S-1 (No. 333-207343). |
| ¥ | Schedules (or similar attachments) have been omitted pursuant to Item 601(b)(2) of Regulation S-K. The registrant will furnish supplemental copies of any omitted schedules (or similar attachments) to the Securities and Exchange Commission upon request. |
| + | Management contract or compensatory plan or arrangement. |
| # | Portions of this exhibit (indicated by asterisks) have been omitted pursuant to a request for confidential treatment and this exhibit has been submitted separately to the Securities and Exchange Commission. |
II-9