Attached files
| file | filename |
|---|---|
| 8-K - 8-K - RED ROBIN GOURMET BURGERS INC | a8-kq3x2015.htm |
| EX-99.1 - EXHIBIT 99.1 - RED ROBIN GOURMET BURGERS INC | exhibit991q3-2015.htm |
CLASSIFIED – INTERNAL USE Third Quarter 2015 Results November 3, 2015
2CLASSIFIED – INTERNAL USE Forward-Looking Statements Forward-looking statements in this presentation regarding our revenues, restaurant-level operating profit margins, new restaurant growth (including Red Robin Burger Works and new prototypes) and remodels, future economic performance, costs, expenses, tax rate, capital investments, promotions, and other statements under the heading “2015 Outlook,” and all other statements that are not historical facts, are made under the safe harbor provisions of the Private Securities Litigation Reform Act of 1995. These statements are based on assumptions believed by the Company to be reasonable and speak only as of the date on which such statements are made. Without limiting the generality of the foregoing, words such as “expect,” “anticipate,” “intend,” “plan,” “project,” or “estimate,” or the negative or other variations thereof or comparable terminology are intended to identify forward-looking statements. We undertake no obligation to update such statements to reflect events or circumstances arising after such date, and we caution investors not to place undue reliance on any such forward-looking statements. Forward-looking statements involve risks and uncertainties that could cause actual results to differ materially from those described in the statements based on a number of factors, including but not limited to the following: the effectiveness of the Company’s marketing and menu strategies to achieve restaurant sales growth; the number, cost, timing, and ability to fulfill planned expansion and restaurant remodeling; the cost and availability of key food products, labor, and energy; the ability to achieve revenue and cost savings from our anticipated new technology systems and other initiatives; the macro economic and competitive environment; availability of capital or credit facility borrowings; the adequacy of cash flows or available debt resources to fund operations and growth opportunities; federal, state, and local regulation of our business; and other risk factors described from time to time in the Company’s Form 10-K, Form 10-Q, and Form 8-K reports (including all amendments to those reports) filed with the U.S. Securities and Exchange Commission. This presentation may also contain non-GAAP financial information. Management uses this information in its internal analysis of results and believes that this information may be informative to investors in gauging the quality of our financial performance, identifying trends in our results and providing meaningful period-to- period comparisons. For a reconciliation of non-GAAP measures presented in this document, see the Appendix of this presentation or the Schedules to the Q2 press release posted on redrobin.com.
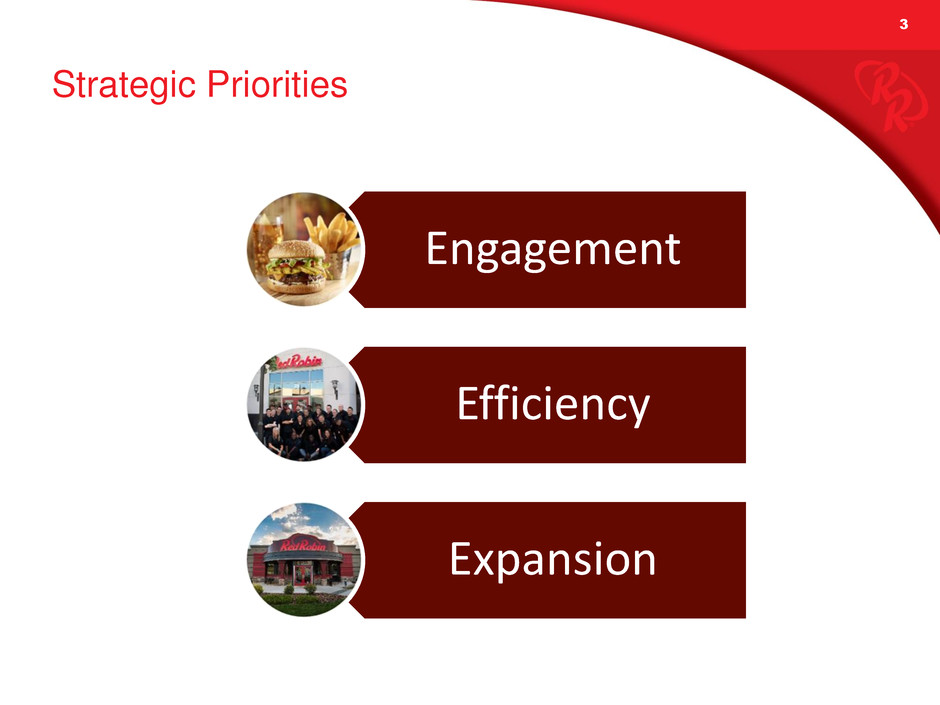
3CLASSIFIED – INTERNAL USE Strategic Priorities Engagement Efficiency Expansion
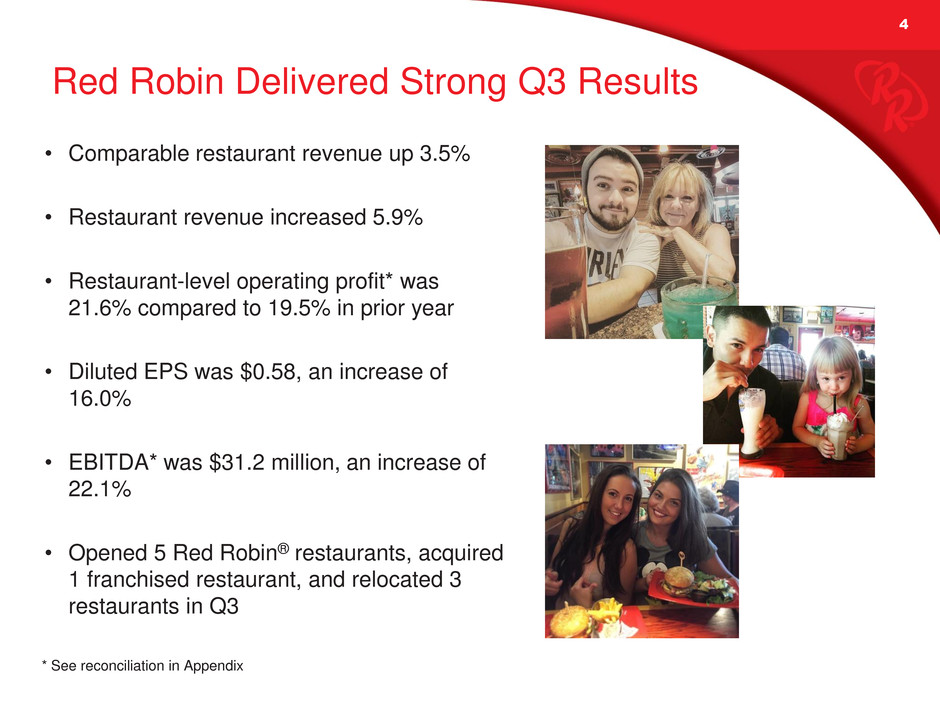
4CLASSIFIED – INTERNAL USE Red Robin Delivered Strong Q3 Results • Comparable restaurant revenue up 3.5% • Restaurant revenue increased 5.9% • Restaurant-level operating profit* was 21.6% compared to 19.5% in prior year • Diluted EPS was $0.58, an increase of 16.0% • EBITDA* was $31.2 million, an increase of 22.1% • Opened 5 Red Robin® restaurants, acquired 1 franchised restaurant, and relocated 3 restaurants in Q3 * See reconciliation in Appendix
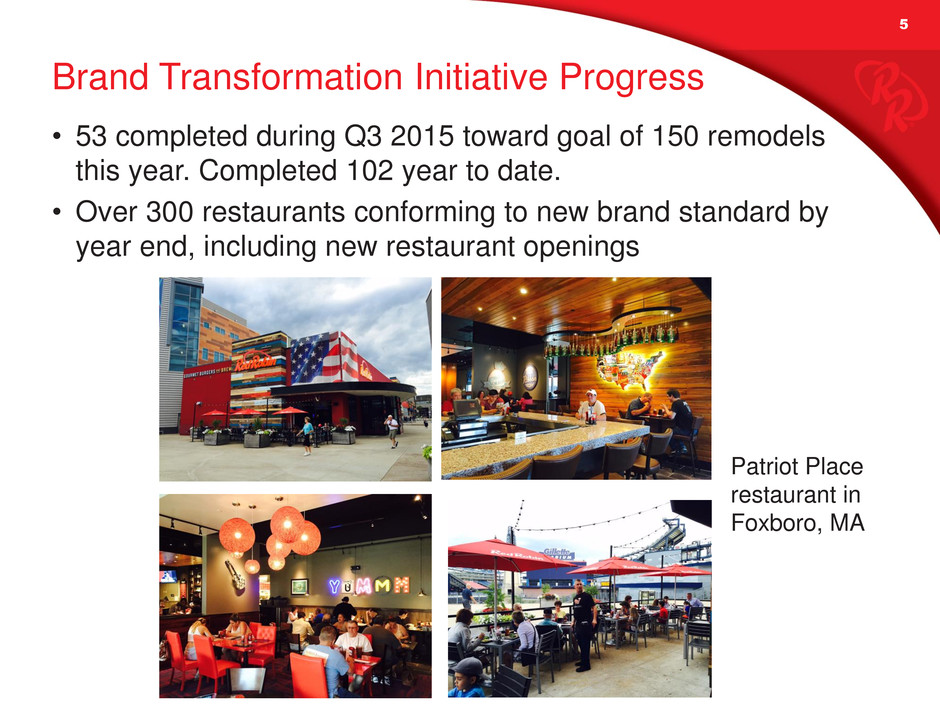
5CLASSIFIED – INTERNAL USE Brand Transformation Initiative Progress • 53 completed during Q3 2015 toward goal of 150 remodels this year. Completed 102 year to date. • Over 300 restaurants conforming to new brand standard by year end, including new restaurant openings Patriot Place restaurant in Foxboro, MA
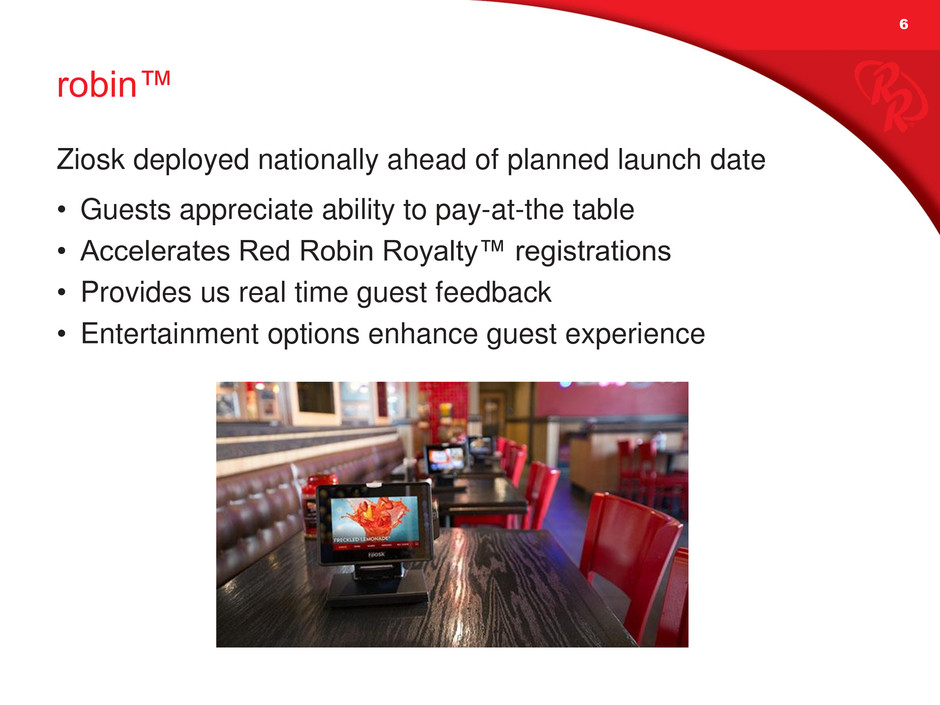
6CLASSIFIED – INTERNAL USE robin™ Ziosk deployed nationally ahead of planned launch date • Guests appreciate ability to pay-at-the table • Accelerates Red Robin Royalty™ registrations • Provides us real time guest feedback • Entertainment options enhance guest experience
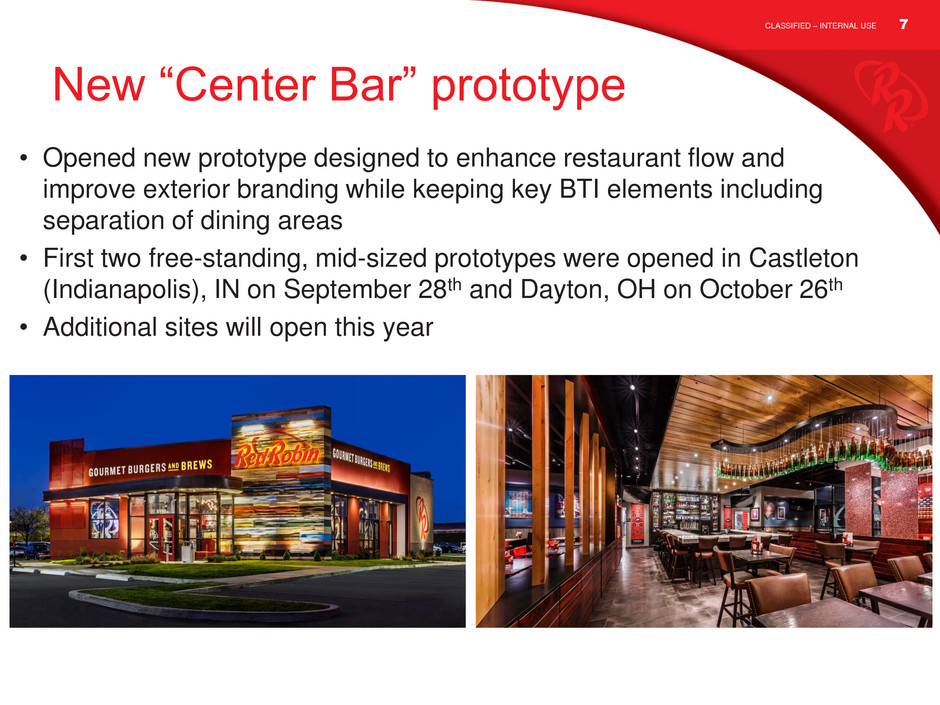
7CLASSIFIED – INTERNAL USE New “Center Bar” prototype • Opened new prototype designed to enhance restaurant flow and improve exterior branding while keeping key BTI elements including separation of dining areas • First two free-standing, mid-sized prototypes were opened in Castleton (Indianapolis), IN on September 28th and Dayton, OH on October 26th • Additional sites will open this year
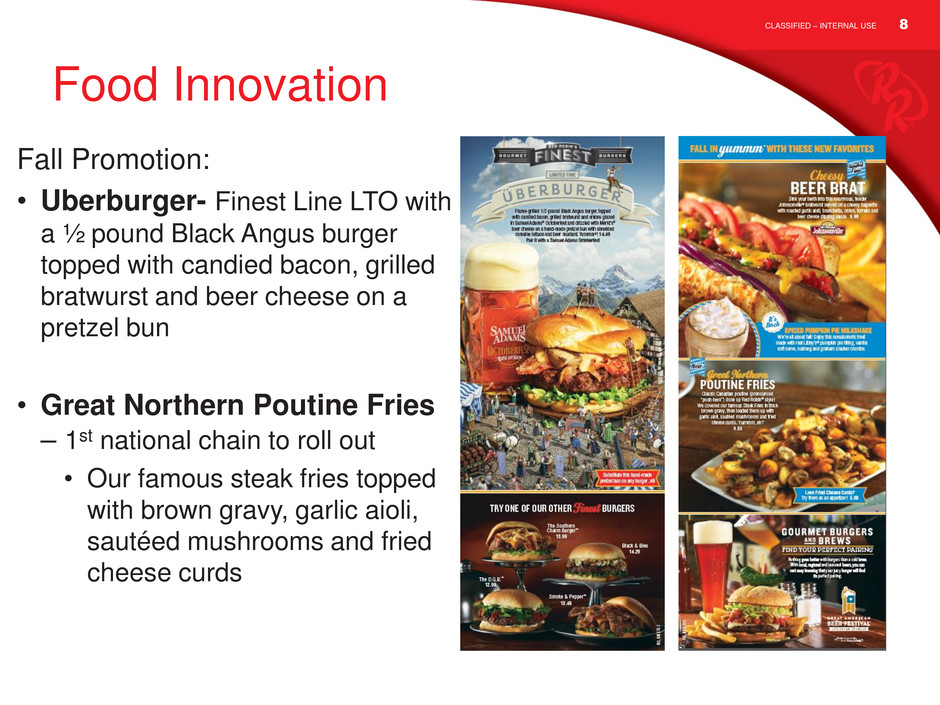
8CLASSIFIED – INTERNAL USE Food Innovation Fall Promotion: • Uberburger- Finest Line LTO with a ½ pound Black Angus burger topped with candied bacon, grilled bratwurst and beer cheese on a pretzel bun • Great Northern Poutine Fries – 1st national chain to roll out • Our famous steak fries topped with brown gravy, garlic aioli, sautéed mushrooms and fried cheese curds
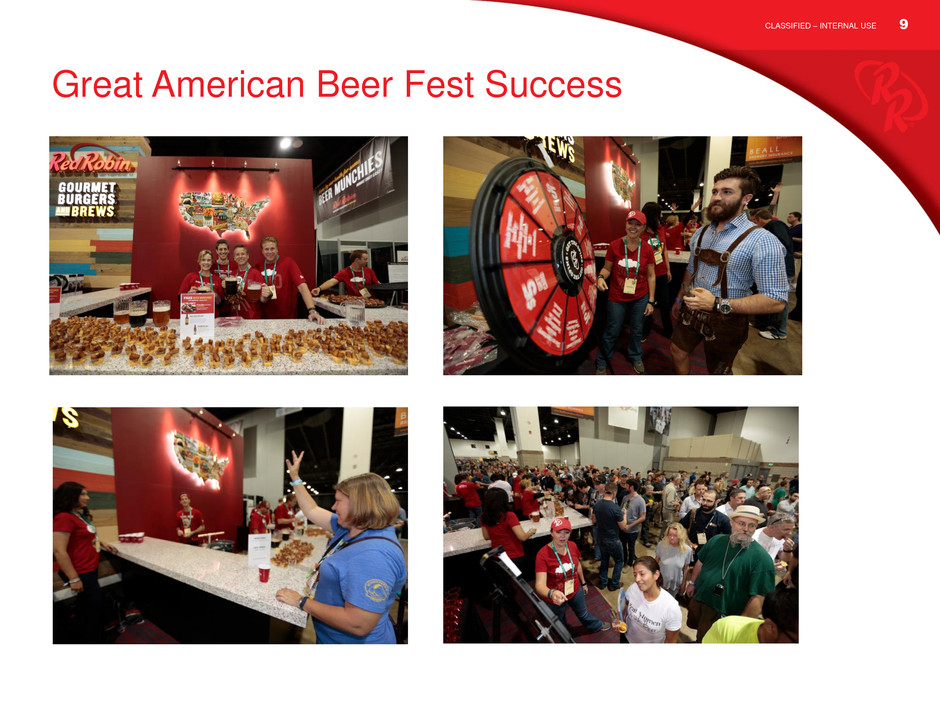
9CLASSIFIED – INTERNAL USE Great American Beer Fest Success

10CLASSIFIED – INTERNAL USE Red Robin Royalty - Earn money for your school! • Burgers for Better Schools • Visit www.redrobin.com/betterschools to sign up
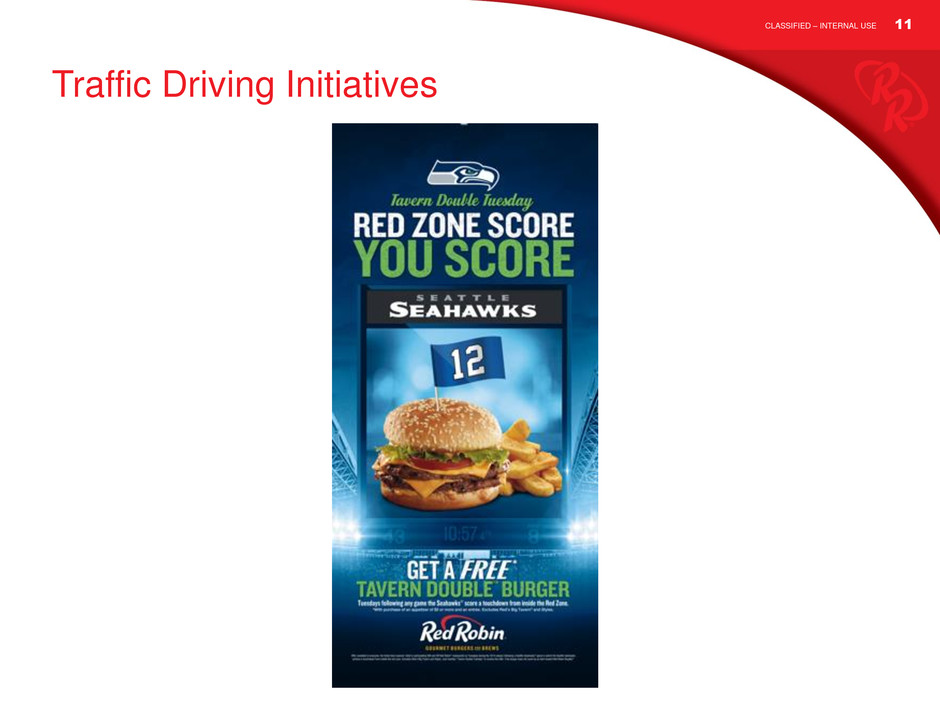
11CLASSIFIED – INTERNAL USE Traffic Driving Initiatives

CLASSIFIED – INTERNAL USE 12 Financial Update
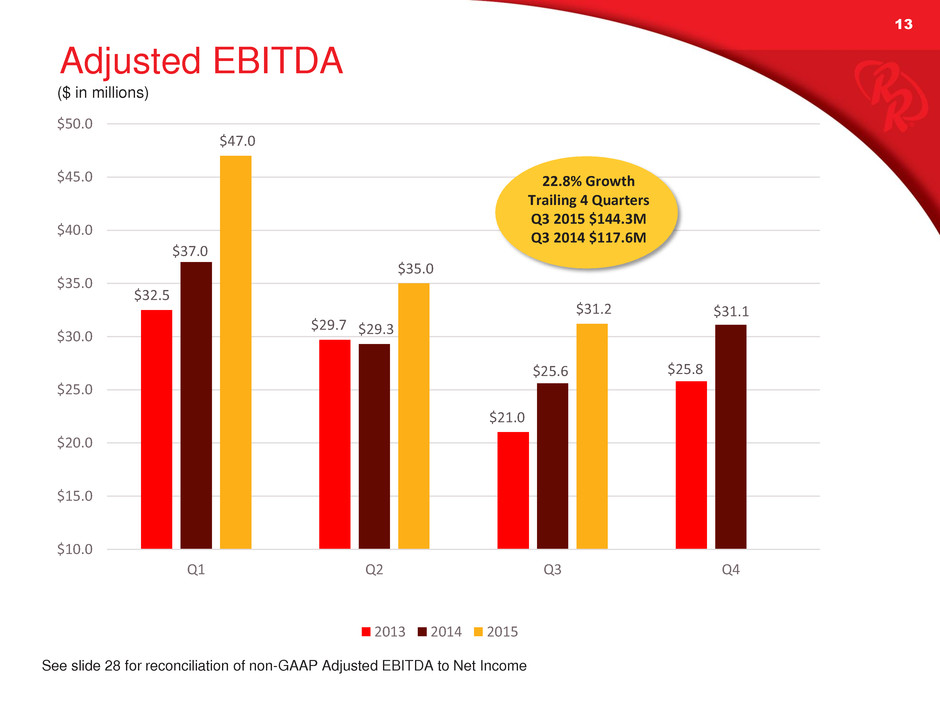
13CLASSIFIED – INTERNAL USE $32.5 $29.7 $21.0 $25.8 $37.0 $29.3 $25.6 $31.1 $47.0 $35.0 $31.2 $10.0 $15.0 $20.0 $25.0 $30.0 $35.0 $40.0 $45.0 $50.0 Q1 Q2 Q3 Q4 2013 2014 2015 22.8% Growth Trailing 4 Quarters Q3 2015 $144.3M Q3 2014 $117.6M Adjusted EBITDA ($ in millions) 13 See slide 28 for reconciliation of non-GAAP Adjusted EBITDA to Net Income
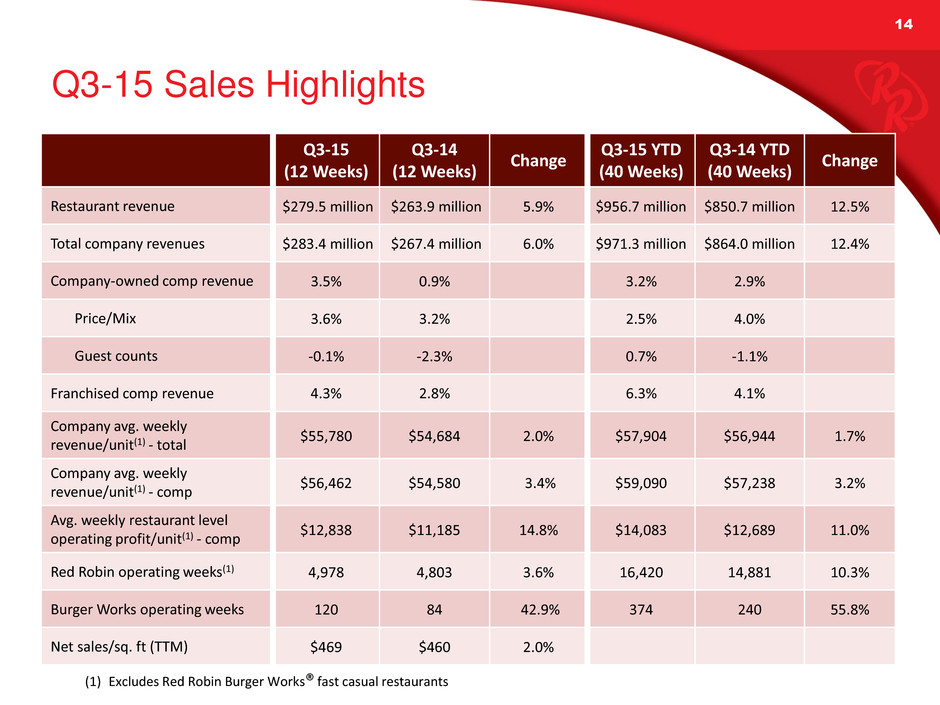
14CLASSIFIED – INTERNAL USE Q3-15 Sales Highlights Q3-15 (12 Weeks) Q3-14 (12 Weeks) Change Q3-15 YTD (40 Weeks) Q3-14 YTD (40 Weeks) Change Restaurant revenue $279.5 million $263.9 million 5.9% $956.7 million $850.7 million 12.5% Total company revenues $283.4 million $267.4 million 6.0% $971.3 million $864.0 million 12.4% Company-owned comp revenue 3.5% 0.9% 3.2% 2.9% Price/Mix 3.6% 3.2% 2.5% 4.0% Guest counts -0.1% -2.3% 0.7% -1.1% Franchised comp revenue 4.3% 2.8% 6.3% 4.1% Company avg. weekly revenue/unit(1) - total $55,780 $54,684 2.0% $57,904 $56,944 1.7% Company avg. weekly revenue/unit(1) - comp $56,462 $54,580 3.4% $59,090 $57,238 3.2% Avg. weekly restaurant level operating profit/unit(1) - comp $12,838 $11,185 14.8% $14,083 $12,689 11.0% Red Robin operating weeks(1) 4,978 4,803 3.6% 16,420 14,881 10.3% Burger Works operating weeks 120 84 42.9% 374 240 55.8% Net sales/sq. ft (TTM) $469 $460 2.0% (1) Excludes Red Robin Burger Works® fast casual restaurants
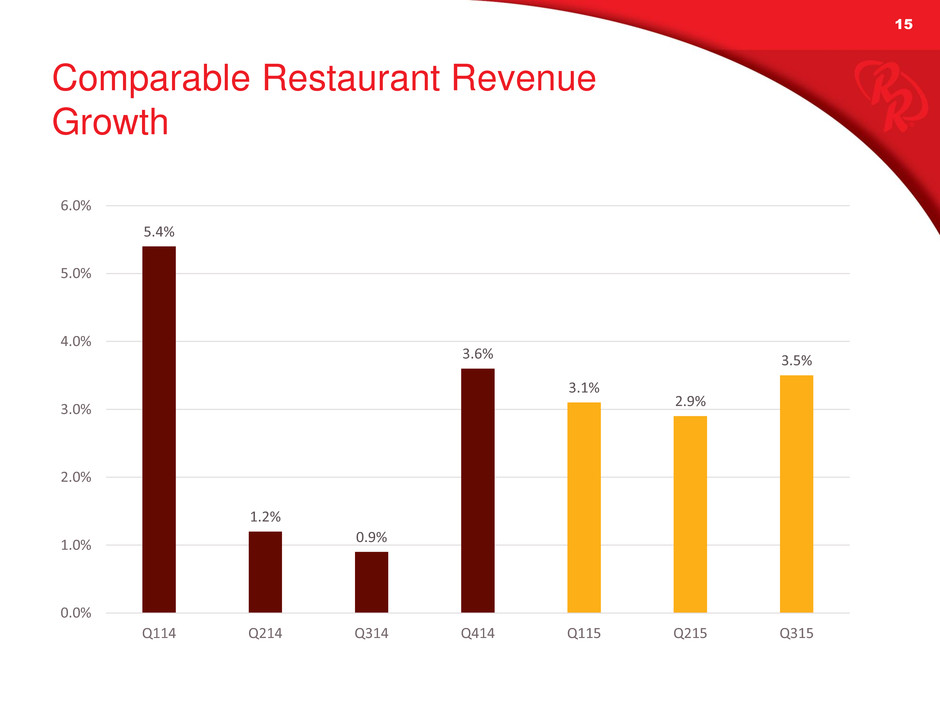
15CLASSIFIED – INTERNAL USE Comparable Restaurant Revenue Growth 5.4% 1.2% 0.9% 3.6% 3.1% 2.9% 3.5% 0.0% 1.0% 2.0% 3.0% 4.0% 5.0% 6.0% Q114 Q214 Q314 Q414 Q115 Q215 Q315
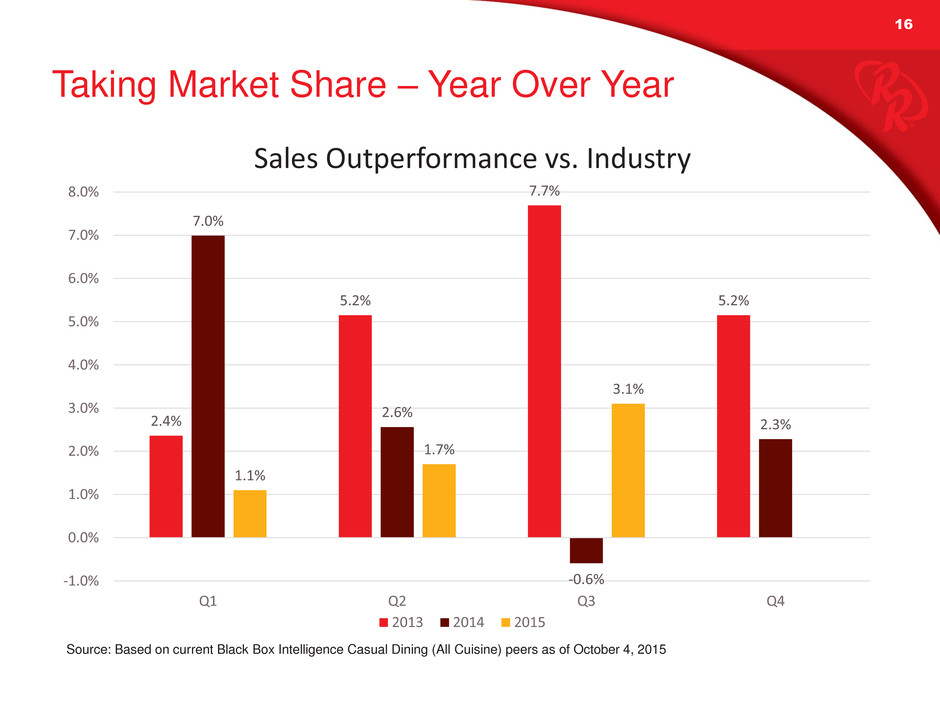
16CLASSIFIED – INTERNAL USE Taking Market Share – Year Over Year 2.4% 5.2% 7.7% 5.2% 7.0% 2.6% -0.6% 2.3% 1.1% 1.7% 3.1% -1.0% 0.0% 1.0% 2.0% 3.0% 4.0% 5.0% 6.0% 7.0% 8.0% Q1 Q2 Q3 Q4 Sales Outperformance vs. Industry 2013 2014 2015 Source: Based on current Black Box Intelligence Casual Dining (All Cuisine) peers as of October 4, 2015
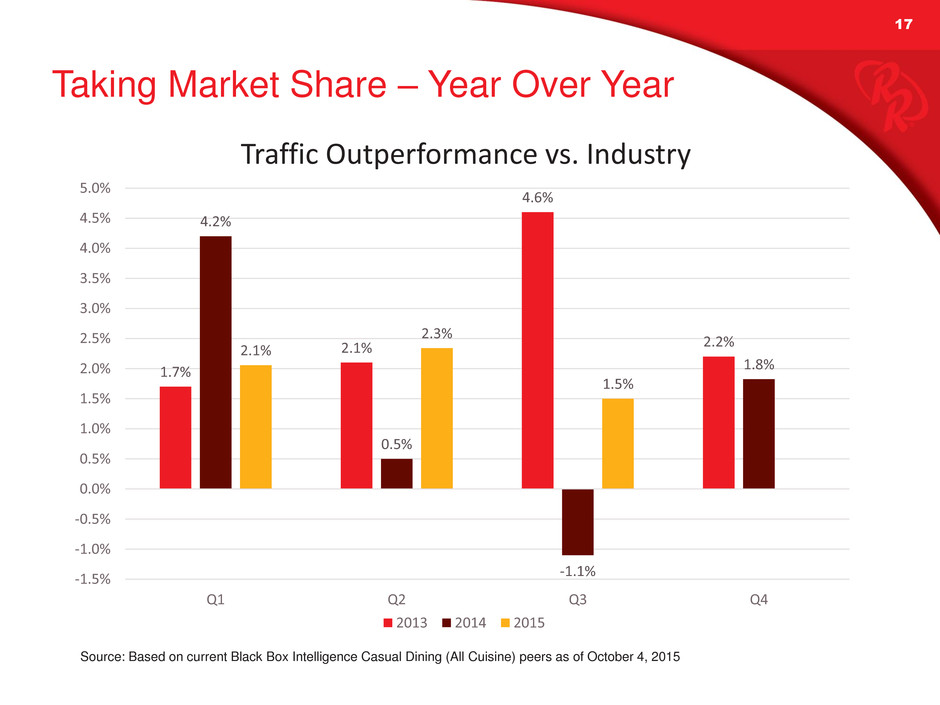
17CLASSIFIED – INTERNAL USE Taking Market Share – Year Over Year 1.7% 2.1% 4.6% 2.2% 4.2% 0.5% -1.1% 1.8% 2.1% 2.3% 1.5% -1.5% -1.0% -0.5% 0.0% 0.5% 1.0% 1.5% 2.0% 2.5% 3.0% 3.5% 4.0% 4.5% 5.0% Q1 Q2 Q3 Q4 Traffic Outperformance vs. Industry 2013 2014 2015 Source: Based on current Black Box Intelligence Casual Dining (All Cuisine) peers as of October 4, 2015
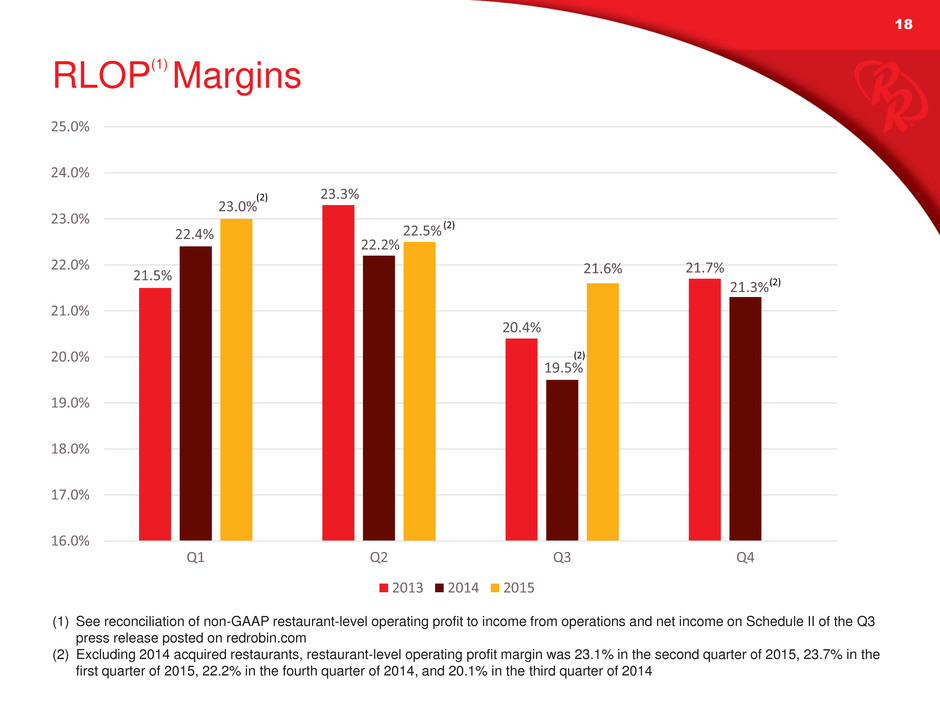
18CLASSIFIED – INTERNAL USE 21.5% 23.3% 20.4% 21.7% 22.4% 22.2% 19.5% 21.3% 23.0% 22.5% 21.6% 16.0% 17.0% 18.0% 19.0% 20.0% 21.0% 22.0% 23.0% 24.0% 25.0% Q1 Q2 Q3 Q4 2013 2014 2015 (2) (2) (2) (2) RLOP (1) Margins 18 (1) See reconciliation of non-GAAP restaurant-level operating profit to income from operations and net income on Schedule II of the Q3 press release posted on redrobin.com (2) Excluding 2014 acquired restaurants, restaurant-level operating profit margin was 23.1% in the second quarter of 2015, 23.7% in the first quarter of 2015, 22.2% in the fourth quarter of 2014, and 20.1% in the third quarter of 2014
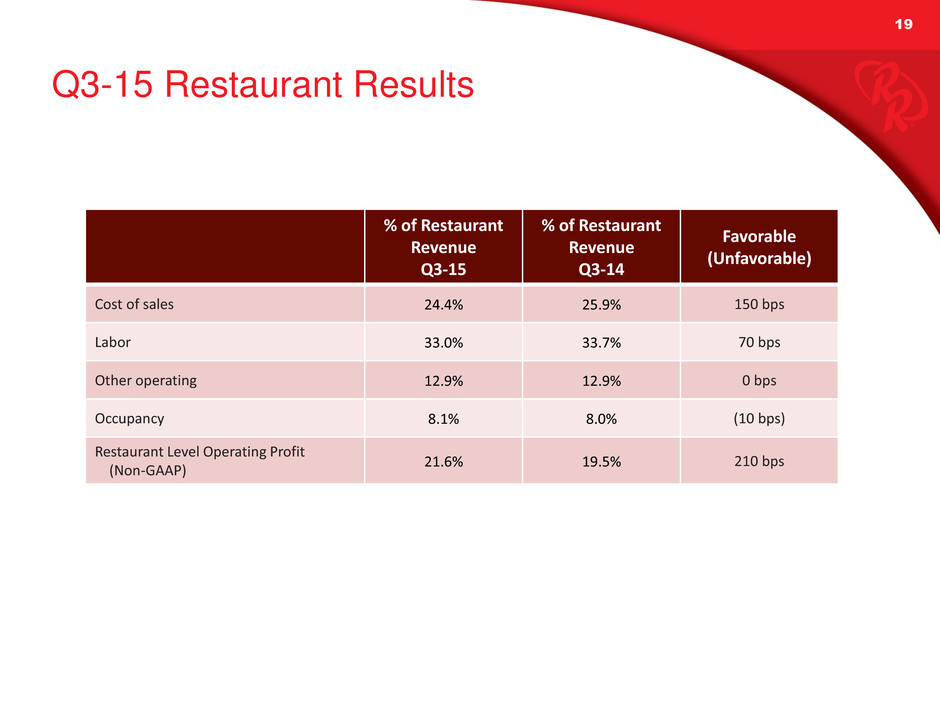
19CLASSIFIED – INTERNAL USE Q3-15 Restaurant Results 19 % of Restaurant Revenue Q3-15 % of Restaurant Revenue Q3-14 Favorable (Unfavorable) Cost of sales 24.4% 25.9% 150 bps Labor 33.0% 33.7% 70 bps Other operating 12.9% 12.9% 0 bps Occupancy 8.1% 8.0% (10 bps) Restaurant Level Operating Profit (Non-GAAP) 21.6% 19.5% 210 bps
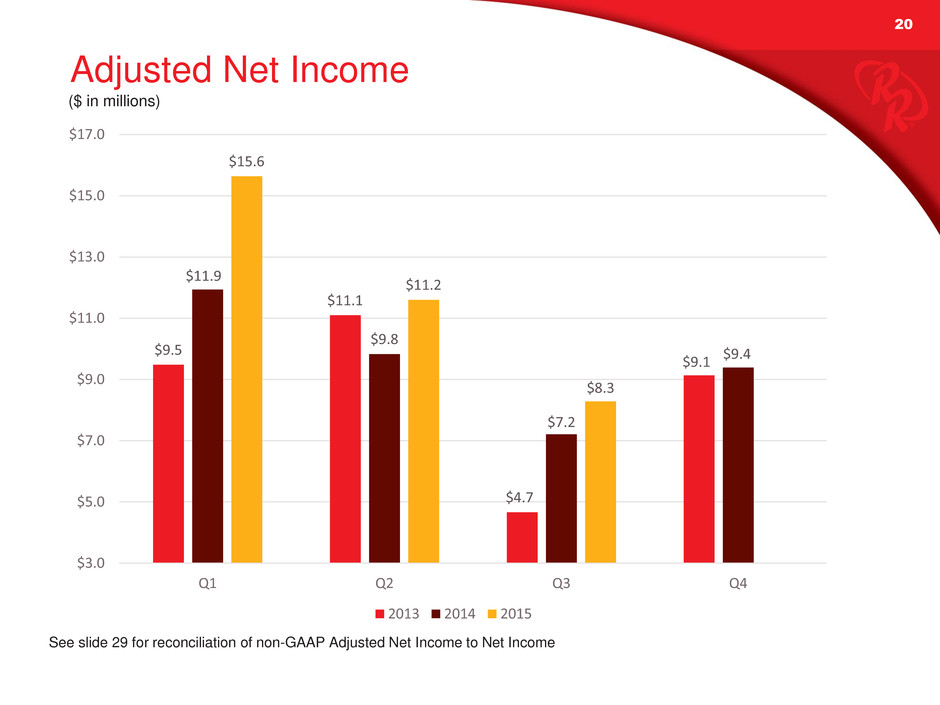
20CLASSIFIED – INTERNAL USE Adjusted Net Income $9.5 $11.1 $4.7 $9.1 $11.9 $9.8 $7.2 $9.4 $15.6 $11.2 $8.3 $3.0 $5.0 $7.0 $9.0 $11.0 $13.0 $15.0 $17.0 Q1 Q2 Q3 Q4 2013 2014 2015 ($ in millions) 20 See slide 29 for reconciliation of non-GAAP Adjusted Net Income to Net Income
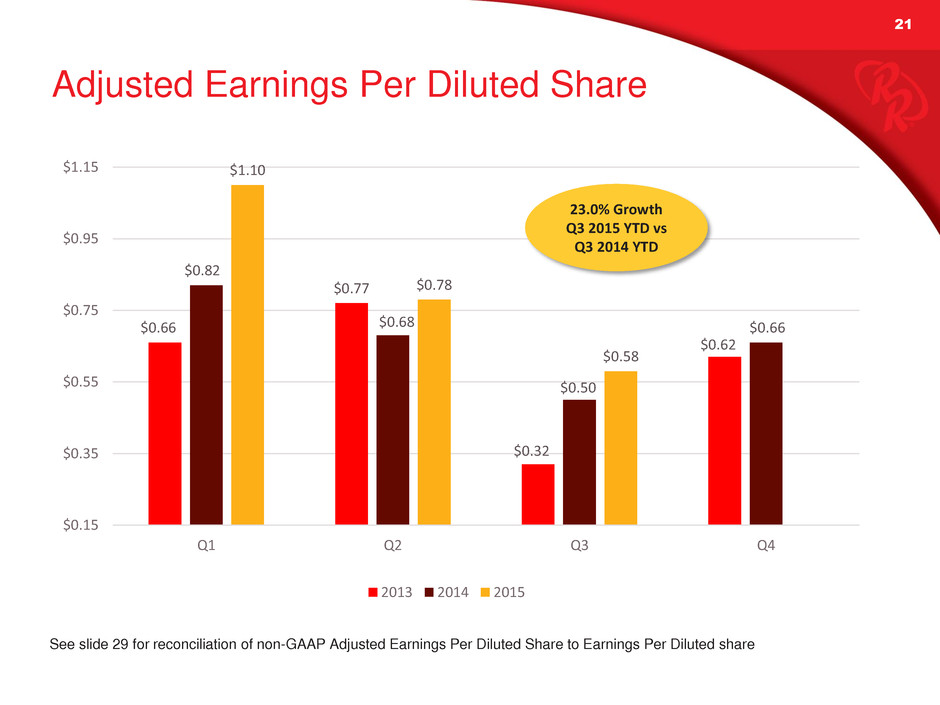
21CLASSIFIED – INTERNAL USE Adjusted Earnings Per Diluted Share $0.66 $0.77 $0.32 $0.62 $0.82 $0.68 $0.50 $0.66 $1.10 $0.78 $0.58 $0.15 $0.35 $0.55 $0.75 $0.95 $1.15 Q1 Q2 Q3 Q4 2013 2014 2015 21 See slide 29 for reconciliation of non-GAAP Adjusted Earnings Per Diluted Share to Earnings Per Diluted share 23.0% Growth Q3 2015 YTD vs Q3 2014 YTD
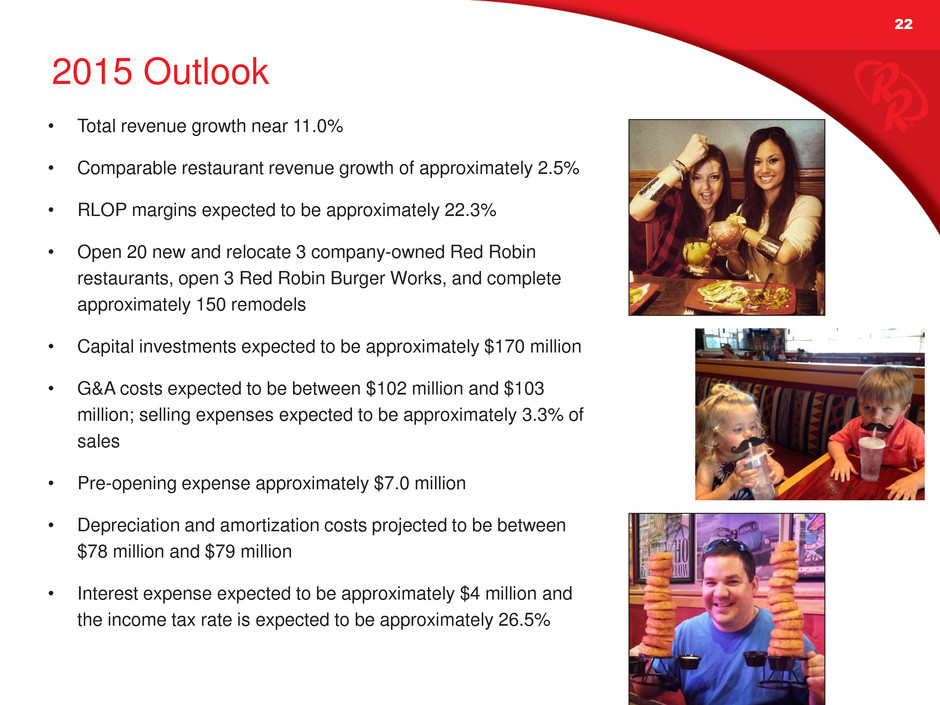
22CLASSIFIED – INTERNAL USE 2015 Outlook • Total revenue growth near 11.0% • Comparable restaurant revenue growth of approximately 2.5% • RLOP margins expected to be approximately 22.3% • Open 20 new and relocate 3 company-owned Red Robin restaurants, open 3 Red Robin Burger Works, and complete approximately 150 remodels • Capital investments expected to be approximately $170 million • G&A costs expected to be between $102 million and $103 million; selling expenses expected to be approximately 3.3% of sales • Pre-opening expense approximately $7.0 million • Depreciation and amortization costs projected to be between $78 million and $79 million • Interest expense expected to be approximately $4 million and the income tax rate is expected to be approximately 26.5%
23CLASSIFIED – INTERNAL USE In Closing 23
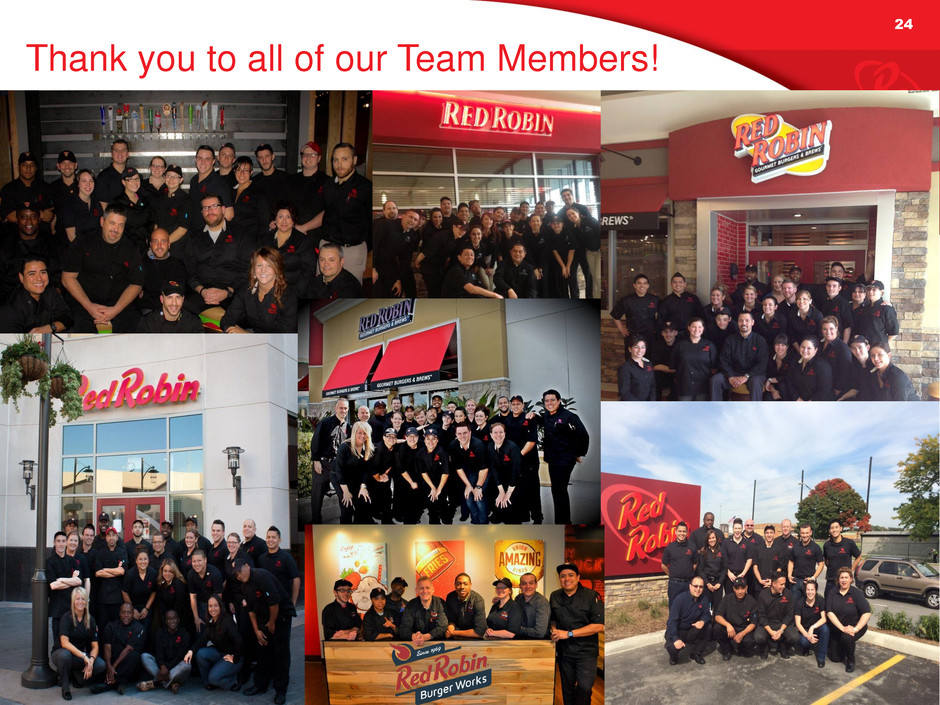
24CLASSIFIED – INTERNAL USE Thank you to all of our Team Members! 17

CLASSIFIED – INTERNAL USE 25 Appendix
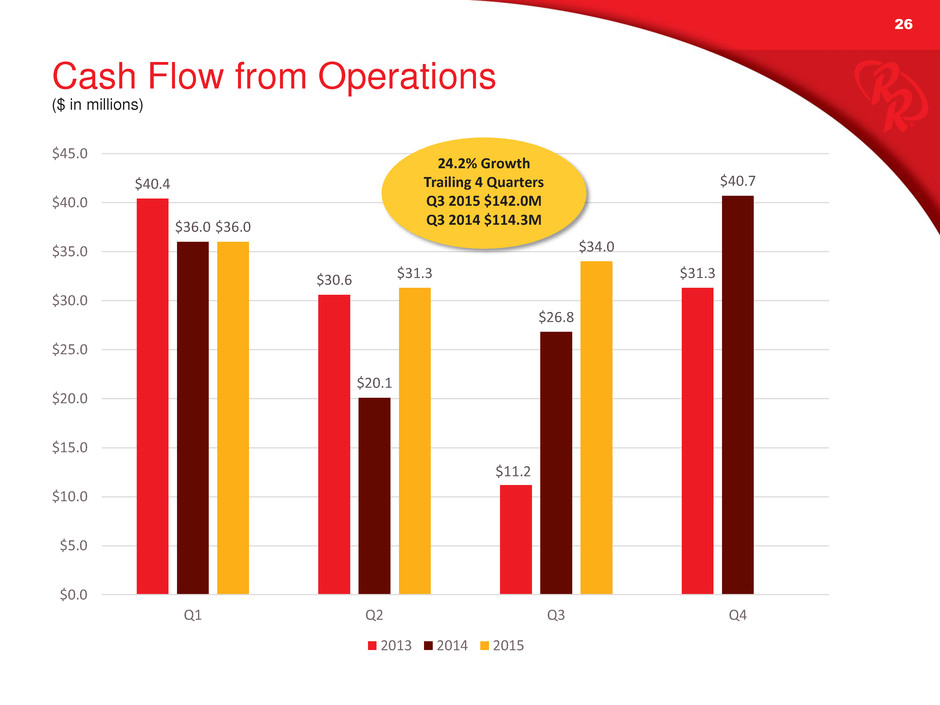
26CLASSIFIED – INTERNAL USE $40.4 $30.6 $11.2 $31.3 $36.0 $20.1 $26.8 $40.7 $36.0 $31.3 $34.0 $0.0 $5.0 $10.0 $15.0 $20.0 $25.0 $30.0 $35.0 $40.0 $45.0 Q1 Q2 Q3 Q4 2013 2014 2015 Cash Flow from Operations ($ in millions) 26 24.2% Growth Trailing 4 Quarters Q3 2015 $142.0M Q3 2014 $114.3M
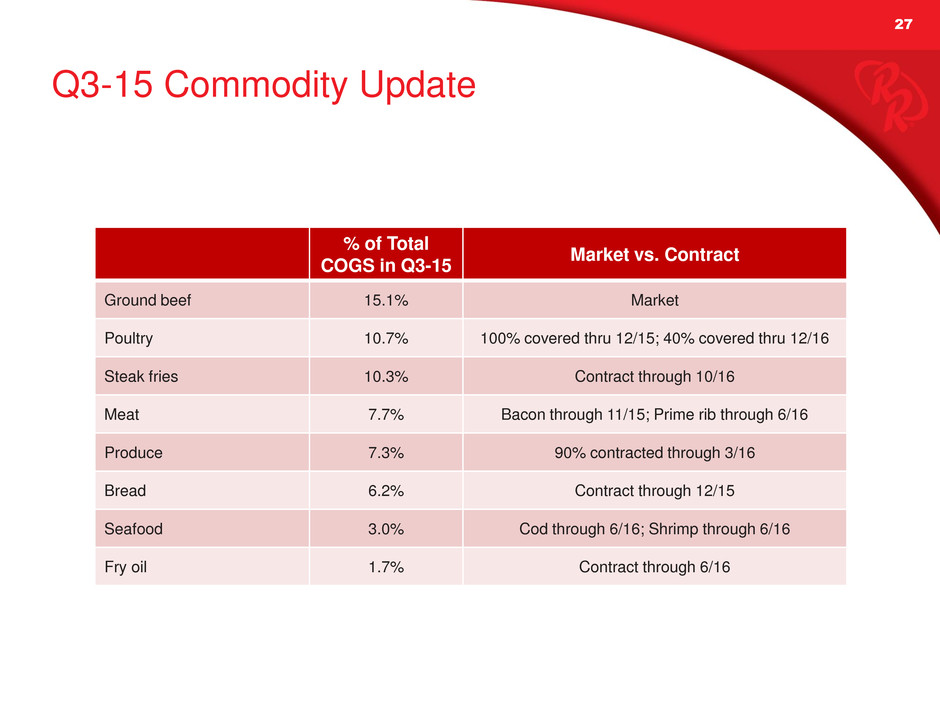
27CLASSIFIED – INTERNAL USE Q3-15 Commodity Update 27 % of Total COGS in Q3-15 Market vs. Contract Ground beef 15.1% Market Poultry 10.7% 100% covered thru 12/15; 40% covered thru 12/16 Steak fries 10.3% Contract through 10/16 Meat 7.7% Bacon through 11/15; Prime rib through 6/16 Produce 7.3% 90% contracted through 3/16 Bread 6.2% Contract through 12/15 Seafood 3.0% Cod through 6/16; Shrimp through 6/16 Fry oil 1.7% Contract through 6/16
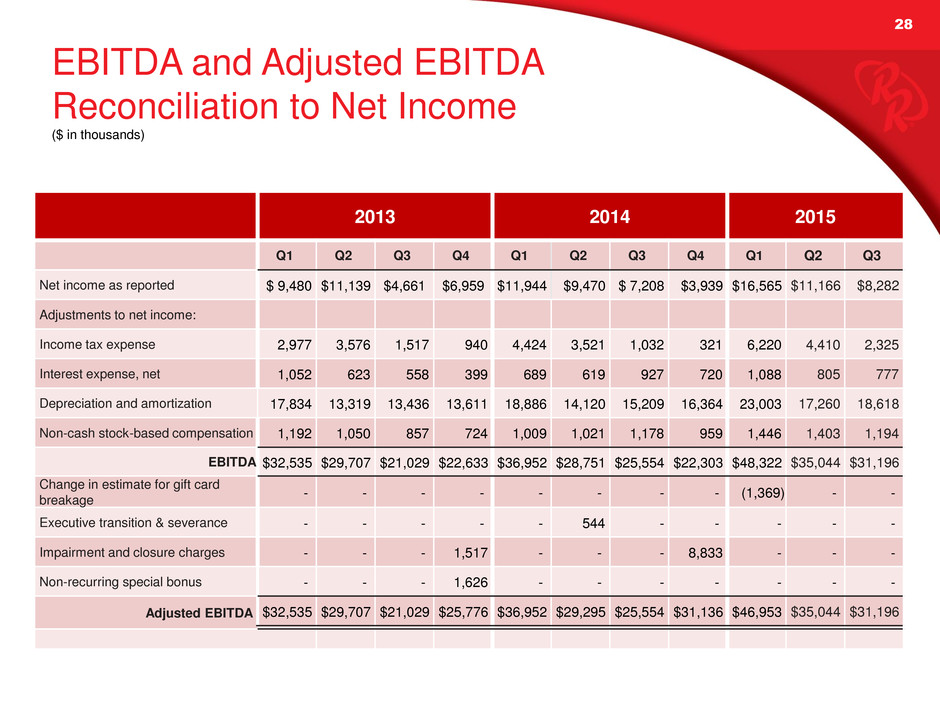
28CLASSIFIED – INTERNAL USE EBITDA and Adjusted EBITDA Reconciliation to Net Income 28 2013 2014 2015 Q1 Q2 Q3 Q4 Q1 Q2 Q3 Q4 Q1 Q2 Q3 Net income as reported $ 9,480 $11,139 $4,661 $6,959 $11,944 $9,470 $ 7,208 $3,939 $16,565 $11,166 $8,282 Adjustments to net income: Income tax expense 2,977 3,576 1,517 940 4,424 3,521 1,032 321 6,220 4,410 2,325 Interest expense, net 1,052 623 558 399 689 619 927 720 1,088 805 777 Depreciation and amortization 17,834 13,319 13,436 13,611 18,886 14,120 15,209 16,364 23,003 17,260 18,618 Non-cash stock-based compensation 1,192 1,050 857 724 1,009 1,021 1,178 959 1,446 1,403 1,194 EBITDA $32,535 $29,707 $21,029 $22,633 $36,952 $28,751 $25,554 $22,303 $48,322 $35,044 $31,196 Change in estimate for gift card breakage - - - - - - - - (1,369) - - Executive transition & severance - - - - - 544 - - - - - Impairment and closure charges - - - 1,517 - - - 8,833 - - - Non-recurring special bonus - - - 1,626 - - - - - - - Adjusted EBITDA $32,535 $29,707 $21,029 $25,776 $36,952 $29,295 $25,554 $31,136 $46,953 $35,044 $31,196 ($ in thousands)
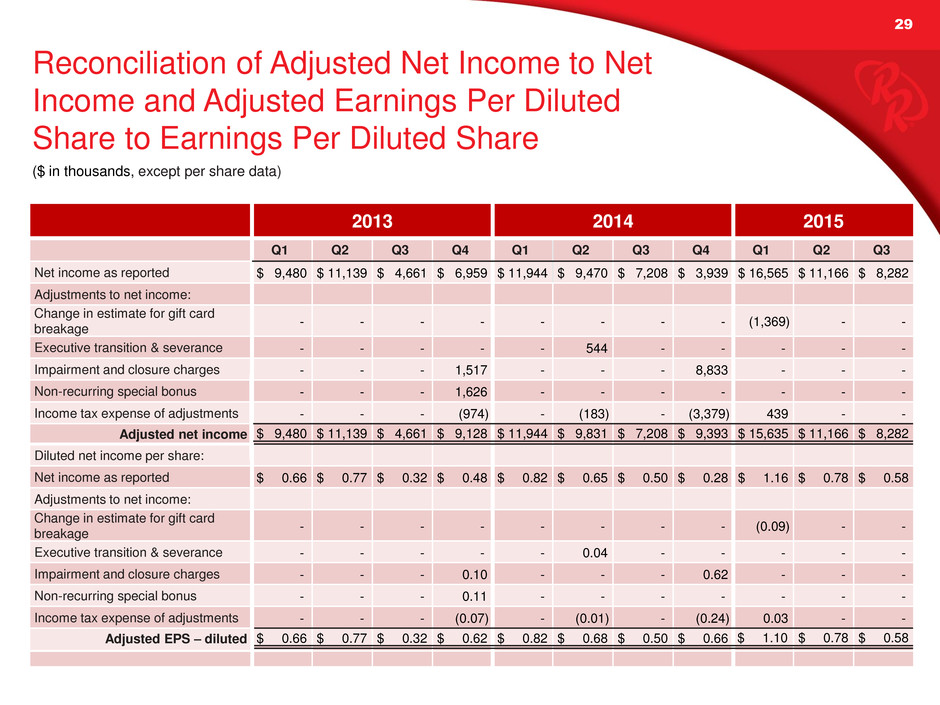
29CLASSIFIED – INTERNAL USE Reconciliation of Adjusted Net Income to Net Income and Adjusted Earnings Per Diluted Share to Earnings Per Diluted Share 29 2013 2014 2015 Q1 Q2 Q3 Q4 Q1 Q2 Q3 Q4 Q1 Q2 Q3 Net income as reported $ 9,480 $ 11,139 $ 4,661 $ 6,959 $ 11,944 $ 9,470 $ 7,208 $ 3,939 $ 16,565 $ 11,166 $ 8,282 Adjustments to net income: Change in estimate for gift card breakage - - - - - - - - (1,369) - - Executive transition & severance - - - - - 544 - - - - - Impairment and closure charges - - - 1,517 - - - 8,833 - - - Non-recurring special bonus - - - 1,626 - - - - - - - Income tax expense of adjustments - - - (974) - (183) - (3,379) 439 - - Adjusted net income $ 9,480 $ 11,139 $ 4,661 $ 9,128 $ 11,944 $ 9,831 $ 7,208 $ 9,393 $ 15,635 $ 11,166 $ 8,282 Diluted net income per share: Net income as reported $ 0.66 $ 0.77 $ 0.32 $ 0.48 $ 0.82 $ 0.65 $ 0.50 $ 0.28 $ 1.16 $ 0.78 $ 0.58 Adjustments to net income: Change in estimate for gift card breakage - - - - - - - - (0.09) - - Executive transition & severance - - - - - 0.04 - - - - - Impairment and closure charges - - - 0.10 - - - 0.62 - - - Non-recurring special bonus - - - 0.11 - - - - - - - Income tax expense of adjustments - - - (0.07) - (0.01) - (0.24) 0.03 - - Adjusted EPS – diluted $ 0.66 $ 0.77 $ 0.32 $ 0.62 $ 0.82 $ 0.68 $ 0.50 $ 0.66 $ 1.10 $ 0.78 $ 0.58 ($ in thousands, except per share data)
