Attached files
| file | filename |
|---|---|
| 8-K - 8-K - HEALTHPEAK PROPERTIES, INC. | a15-22108_18k.htm |
| EX-99.1 - EX-99.1 - HEALTHPEAK PROPERTIES, INC. | a15-22108_1ex99d1.htm |
Exhibit 99.2
suppleStratemgy. Executioen. Resunlts. tal report third quarter 2015 Woodlands Medical Plaza I The Woodlands, TX T H E O N LY R E I T I N T H E S & P 5 0 0 ® DIVIDEND ARISTOCRATS® I NDE X THE FIR S T HEALTHC ARE REIT S&P 500 IN THE 1
Sustainability 3 Summary 4 Heat Map - Triple-Net Master Lease Profile 6 Credit Profile 7 Capitalization 9 Indebtedness and Ratios 11 Investments 13 Portfolio Portfolio Summary 16 Senior Housing 21 Post-Acute/Skilled 26 Life Science 29 Medical Office 32 Hospital 34 Unconsolidated Joint Ventures 35 Entrance Fee CCRC Portfolio 36 Definitions 37 Reconciliations 41 TABLE OF Contents Company Information 43 Forward Looking Statements & Risk Factors 44 2
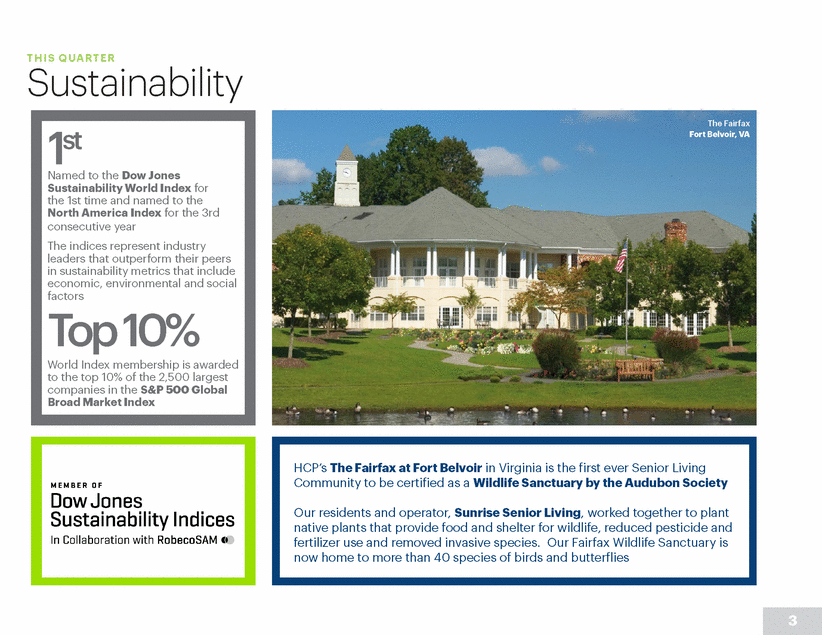
THIS QUAR TER Sustainability The Fairfax Fort Belvoir, VA 3 HCP’s The Fairfax at Fort Belvoir in Virginia is the first ever Senior Living Community to be certified as a Wildlife Sanctuary by the Audubon Society Our residents and operator, Sunrise Senior Living, worked together to plant native plants that provide food and shelter for wildlife, reduced pesticide and fertilizer use and removed invasive species. Our Fairfax Wildlife Sanctuary is now home to more than 40 species of birds and butterflies Named to the Dow Jones 1st Sustainability World Index for the 1st time and named to the North America Index for the 3rd consecutive year The indices represent industry leaders that outperform their peers in sustainability metrics that include economic, environmental and social factors Top10% World Index membership is awarded to the top 10% of the 2,500 largest companies in the S&P 500 Global Broad Market Index
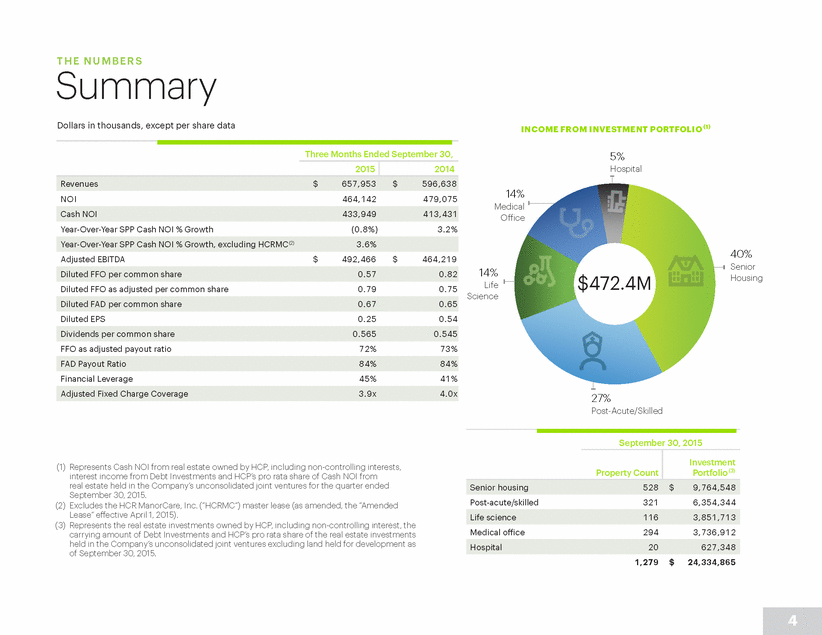
THE NUMBER S Summary Dollars in thousands, except per share data INCOME FROM INVESTMENT PORTFOLIO (1) Three Months Ended September 30, 5% Hospital 14% Medical Office NOI 464,142 479,075 Year-Over-Year SPP Cash NOI % Growth (0.8%) 3.2% 40% Senior Housing Adjusted EBITDA $ 492,466 $ 464,219 14% Life Science $472.4M Diluted FFO as adjusted per common share 0.79 0.75 Diluted EPS 0.25 0.54 FFO as adjusted payout ratio 72% 73% Financial Leverage 45% 41% 27% Post-Acute/Skilled September 30, 2015 (1) Represents Cash NOI from real estate owned by HCP, including non-controlling interests, interest income from Debt Investments and HCP’s pro rata share of Cash NOI from real estate held in the Company’s unconsolidated joint ventures for the quarter ended September 30, 2015. (2) Excludes the HCR ManorCare, Inc. (“HCRMC”) master lease (as amended, the “Amended Lease” effective April 1, 2015). (3) Represents the real estate investments owned by HCP, including non-controlling interest, the carrying amount of Debt Investments and HCP’s pro rata share of the real estate investments held in the Company’s unconsolidated joint ventures excluding land held for development as of September 30, 2015. Post-acute/skilled 321 6,354,344 Medical office 294 3,736,912 1,279 $ 24,334,865 4 Hospital 20 627,348 Life science 116 3,851,713 Property Count Investment Portfolio (3) Senior housing 528 $ 9,764,548 Adjusted Fixed Charge Coverage 3.9x 4.0x FAD Payout Ratio 84%84% Dividends per common share 0.565 0.545 Diluted FAD per common share 0.67 0.65 Diluted FFO per common share 0.57 0.82 Year-Over-Year SPP Cash NOI % Growth, excluding HCRMC(2)3.6% Cash NOI 433,949 413,431 2015 2014 Revenues $ 657,953 $ 596,638
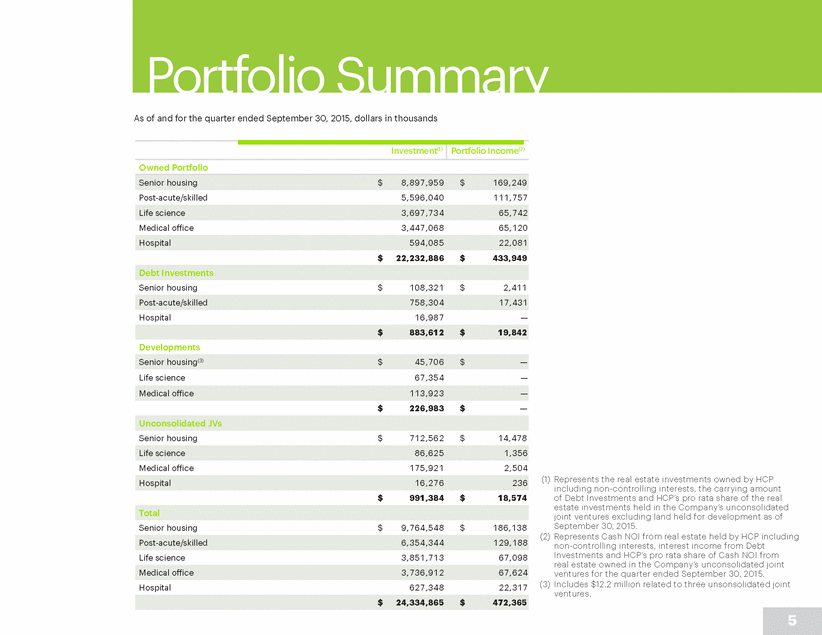
Portfolio Summary As of and for the quarter ended September 30, 2015, dollars in thousands Owned Portfolio Post-acute/skilled 5,596,040 111,757 Medical office 3,447,068 65,120 $ 22,232,886 $ 433,949 Senior housing $ 108,321 $ 2,411 Hospital 16,987 — Developments Life science 67,354 — $ 226,983 $ — Senior housing $ 712,562 $ 14,478 Medical office 175,921 2,504 (1) Represents the real estate investments owned by HCP including non-controlling interests, the carrying amount of Debt Investments and HCP’s pro rata share of the real estate investments held in the Company’s unconsolidated joint ventures excluding land held for development as of September 30, 2015. (2) Represents Cash NOI from real estate held by HCP including non-controlling interests, interest income from Debt Investments and HCP’s pro rata share of Cash NOI from real estate owned in the Company’s unconsolidated joint ventures for the quarter ended September 30, 2015. (3) Includes $12.2 million related to three unsonsolidated joint ventures. $ 991,384 $ 18,574 Senior housing $ 9,764,548 $ 186,138 Life science 3,851,713 67,098 Hospital 627,348 22,317 5 $ 24,334,865 $ 472,365 Medical office 3,736,912 67,624 Post-acute/skilled6,354,344 129,188 Total Hospital 16,276 236 Life science 86,625 1,356 Unconsolidated JVs Medical office 113,923 — Senior housing(3) $ 45,706 $ — $ 883,612 $ 19,842 Post-acute/skilled758,304 17,431 Debt Investments Hospital 594,085 22,081 Life science 3,697,734 65,742 Senior housing $ 8,897,959 $ 169,249 Investment(1) Portfolio Income(2)
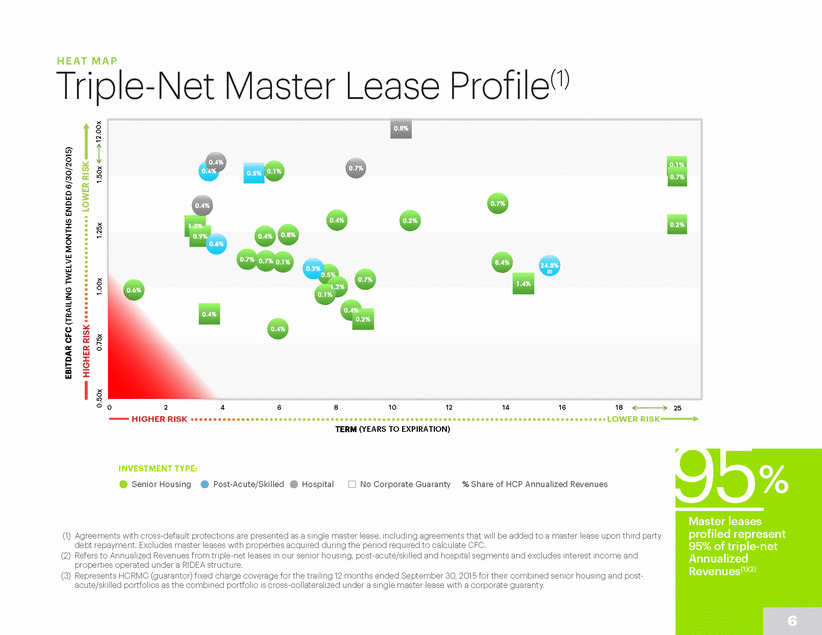
HEAT MAP Triple-Net Master Lease Profile(1) 0.8% 0.4% 0.4% 0.1% 0.7% 0.7% 0.1% 0.5% 0.7% 0.4% 0.4% 0.2% 0.2% 1.3% 0.8% 0.9% 0.4% 0.6% 0.7% 0.7% 0.1% 8.4% (3) 0.7% 0.2% 0 2 4 6 8 10 12 14 16 18 2205 TERM (YEARS TO EXPIRATION) 95% INVESTMENT TYPE: Senior Housing Post-Acute/Skilled Hospital No Corporate Guaranty % Share of HCP Annualized Revenues Master leases profiled represent 95% of triple-net Annualized Revenues(1)(2) (1) Agreements with cross-default protections are presented as a single master lease, including agreements that will be added to a master lease upon third party debt repayment. Excludes master leases with properties acquired during the period required to calculate CFC. (2) Refers to Annualized Revenues from triple-net leases in our senior housing, post-acute/skilled and hospital segments and excludes interest income and properties operated under a RIDEA structure. (3) Represents HCRMC (guarantor) fixed charge coverage for the trailing 12 months ended September 30, 2015 for their combined senior housing and post-acute/skilled portfolios as the combined portfolio is cross-collateralized under a single master lease with a corporate guaranty. 6 EBITDAR CFC (TRAILING TWELVE MONTHS ENDED 6/30/2015) 12.00x 0.50x 0.75x 1.00x 1.25x 1.50x 0.6% 0.4% 0.4% 0.2% 24.8% 0.5% 1.2% 1.4% 0.1% 0.4%
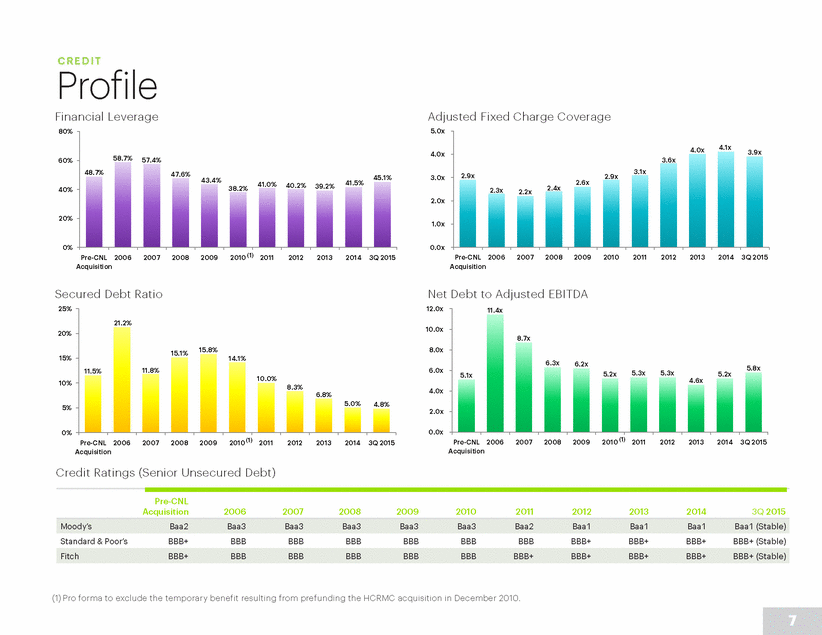
CREDIT Profile Financial Leverage Adjusted Fixed Charge Coverage 5.0x 80% 4.0x 60% 3.0x 2.4x 40% 2.3x 2.2x 2.0x 20% 1.0x 0% 0.0x 2010 (1) Pre-CNL 2006 2007 Acquisition 2008 2009 2011 2012 2013 2014 3Q 2015 Pre-CNL 2006 2007 2008 2009 Acquisition 2010 2011 2012 2013 2014 3Q 2015 Secured Debt Ratio Net Debt to Adjusted EBITDA 25% 12.0x 10.0x 20% 8.0x 15% 6.0x 5.3x 5.3x 5.2x 5.2x 5.1x 10% 4.0x 5% 2.0x 0.0x 0% 2010 (1) 2010 (1) Pre-CNL 2006 Acquisition 2007 2008 2009 2011 2012 2013 2014 3Q 2015 Pre-CNL 2006 2007 Acquisition 2008 2009 2011 2012 2013 2014 3Q 2015 Credit Ratings (Senior Unsecured Debt) Pre-CNL Acquisition 2006 2007 2008 2009 2010 2011 2012 2013 2014 3Q 2015 Standard & Poor’s BBB+ BBB BBB BBB BBB BBB BBB BBB+ BBB+ BBB+ BBB+ (Stable) (1) Pro forma to exclude the temporary benefit resulting from prefunding the HCRMC acquisition in December 2010. 7 Fitch BBB+BBBBBBBBBBBBBBBBBB+BBB+BBB+BBB+BBB+ (Stable) Moody’sBaa2Baa3Baa3Baa3Baa3Baa3Baa2Baa1Baa1Baa1Baa1 (Stable) 11.4x 8.7x 6.3x 6.2x 5.8x 4.6x 21.2% 15.1%15.8% 14.1% 11.5%11.8% 10.0% 8.3% 6.8% 5.0%4.8% 4.0x 4.1x3.9x 3.6x 2.9x 3.1x 2.6x 2.9x 58.7% 57.4% 48.7% 47.6% 43.4% 45.1% 38.2% 41.0% 40.2% 39.2% 41.5%
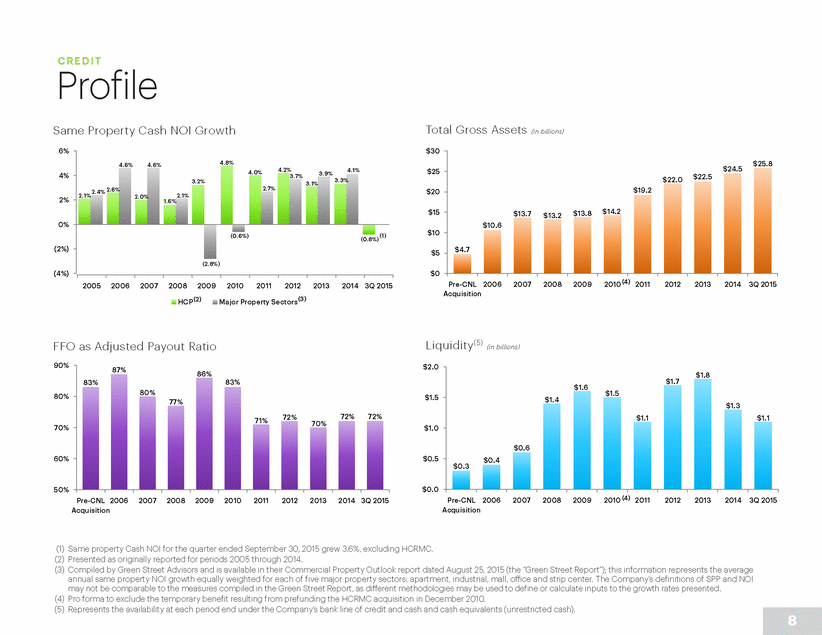
CREDIT Profile Same Property Cash NOI Growth Total Gross Assets (in billions) 6% $30 $25 4% 3.3% 3.2% 3.1% $20 2.1% 2.1% 2.0% 2% $15 0% $10 (0.8%) (2%) $5 (4%) $0 2010 (4) 2011 Pre-CNL 2006 2007 Acquisition 2008 2009 2012 2013 2014 3Q 2015 2005 2006 2007 2008 2009 2010 2011 2012 2013 2014 3Q 2015 Major Property Sectors (3) HCP(2) Liquidity(5) (in billions) FFO as Adjusted Payout Ratio 90% $2.0 $1.7 80% $1.5 $1.4 $1.3 70% $1.0 60% $0.5 $0.3 $0.0 50% 2010 (4) 2011 Pre-CNL 2006 2007 2008 2009 Acquisition 2010 2011 2012 2013 2014 3Q 2015 Pre-CNL 2006 2007 Acquisition 2008 2009 2012 2013 2014 3Q 2015 (1) Same property Cash NOI for the quarter ended September 30, 2015 grew 3.6%, excluding HCRMC. (2) Presented as originally reported for periods 2005 through 2014. (3) Compiled by Green Street Advisors and is available in their Commercial Property Outlook report dated August 25, 2015 (the “Green Street Report”); this information represents the average annual same property NOI growth equally weighted for each of five major property sectors: apartment, industrial, mall, office and strip center. The Company’s definitions of SPP and NOI may not be comparable to the measures compiled in the Green Street Report, as different methodologies may be used to define or calculate inputs to the growth rates presented. (4) Pro forma to exclude the temporary benefit resulting from prefunding the HCRMC acquisition in December 2010. (5) Represents the availability at each period end under the Company’s bank line of credit and cash and cash equivalents (unrestricted cash). 8 $1.8 $1.6 $1.5 $1.1$1.1 $0.6 $0.4 87%86% 83% 83% 80% 77% 71% 72%70% 72%72% 4.6% 4.6% 4.8% 4.0% 4.2% 4.1% 3.7%3.9% 2.4% 2.6% 2.7% 1.6% (0.6%) (1) (2.8%) $25.8 $24.5 $22.0 $22.5 $19.2 $13.7$13.2$13.8$14.2 $10.6 $4.7
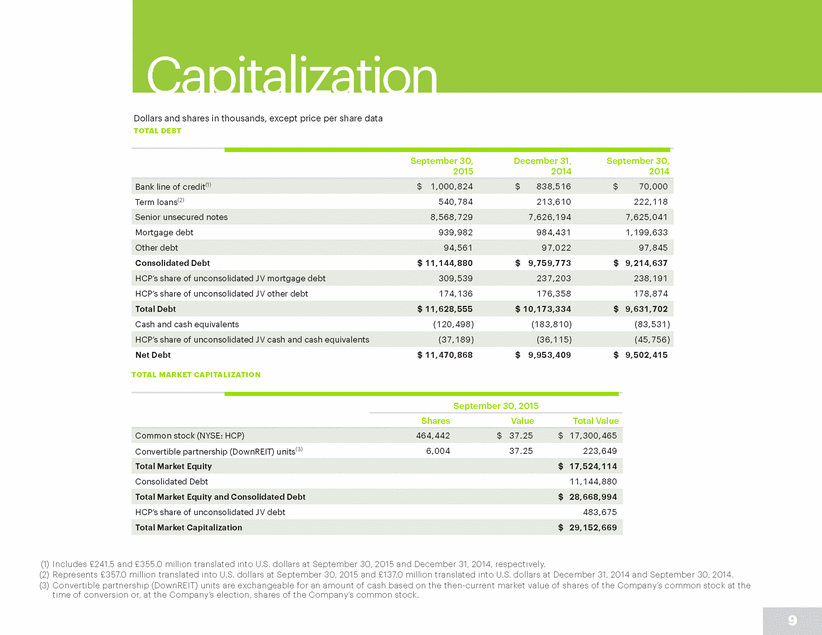
Capitalization Dollars and shares in thousands, except price per share data TOTAL DEBT September 30, 2015 December 31, 2014 September 30, 2014 Term loans(2) 540,784 213,610 222,118 Mortgage debt 939,982 984,431 1,199,633 Consolidated Debt $ 11,144,880 $ 9,759,773 $ 9,214,637 HCP’s share of unconsolidated JV other debt 174,136 176,358 178,874 Cash and cash equivalents (120,498) (183,810) (83,531) Net Debt $ 11,470,868 $ 9,953,409 $ 9,502,415 TOTAL MARKET CAPITALIZATION September 30, 2015 Shares Value Total Value Convertible partnership (DownREIT) units(3) 6,004 37.25 223,649 Consolidated Debt 11,144,880 HCP’s share of unconsolidated JV debt 483,675 (1) Includes £241.5 and £355.0 million translated into U.S. dollars at September 30, 2015 and December 31, 2014, respectively. (2) Represents £357.0 million translated into U.S. dollars at September 30, 2015 and £137.0 million translated into U.S. dollars at December 31, 2014 and September 30, 2014. (3) Convertible partnership (DownREIT) units are exchangeable for an amount of cash based on the then-current market value of shares of the Company’s common stock at the time of conversion or, at the Company’s election, shares of the Company’s common stock. 9 Total Market Capitalization $ 29,152,669 Total Market Equity and Consolidated Debt $ 28,668,994 Total Market Equity $ 17,524,114 Common stock (NYSE: HCP)464,442 $ 37.25 $ 17,300,465 HCP’s share of unconsolidated JV cash and cash equivalents (37,189) (36,115) (45,756) Total Debt $ 11,628,555 $ 10,173,334 $ 9,631,702 HCP’s share of unconsolidated JV mortgage debt 309,539 237,203 238,191 Other debt 94,561 97,022 97,845 Senior unsecured notes 8,568,729 7,626,194 7,625,041 Bank line of credit(1) $ 1,000,824 $ 838,516 $ 70,000
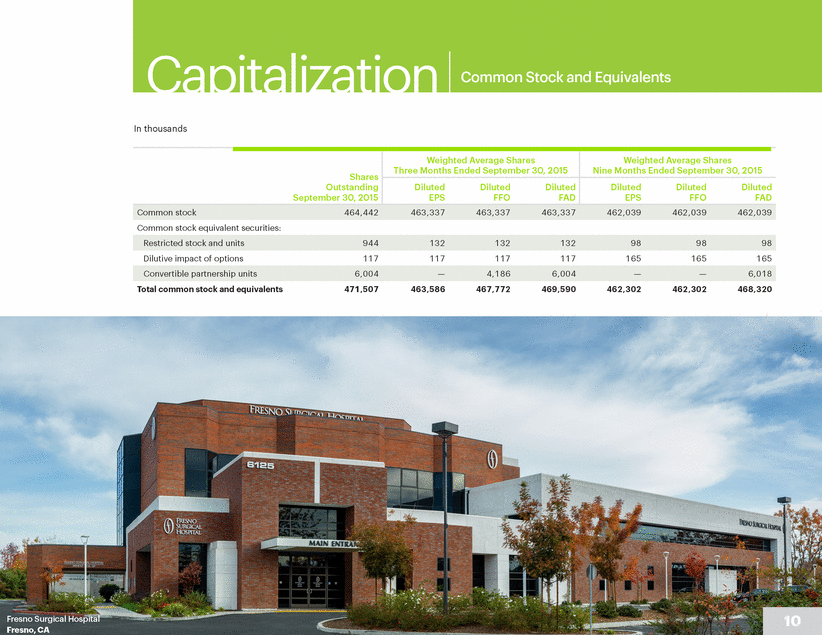
Capitalization Common Stock and Equivalents In thousands Common stock equivalent securities: Dilutive impact of options 117 117 117 117 165 165 165 Total common stock and equivalents 471,507 463,586 467,772 469,590 462,302 462,302 468,320 10 Fresno Surgical Hospital Fresno, CA Convertible partnership units 6,004 —4,186 6,004 ——6,018 Restricted stock and units 944 132 132 132 98 98 98 Shares Outstanding September 30, 2015 Weighted Average Shares Three Months Ended September 30, 2015 Weighted Average Shares Nine Months Ended September 30, 2015 Diluted Diluted Diluted EPSFFOFAD Diluted Diluted Diluted EPSFFOFAD Common stock 464,442 463,337 463,337 463,337 462,039 462,039 462,039
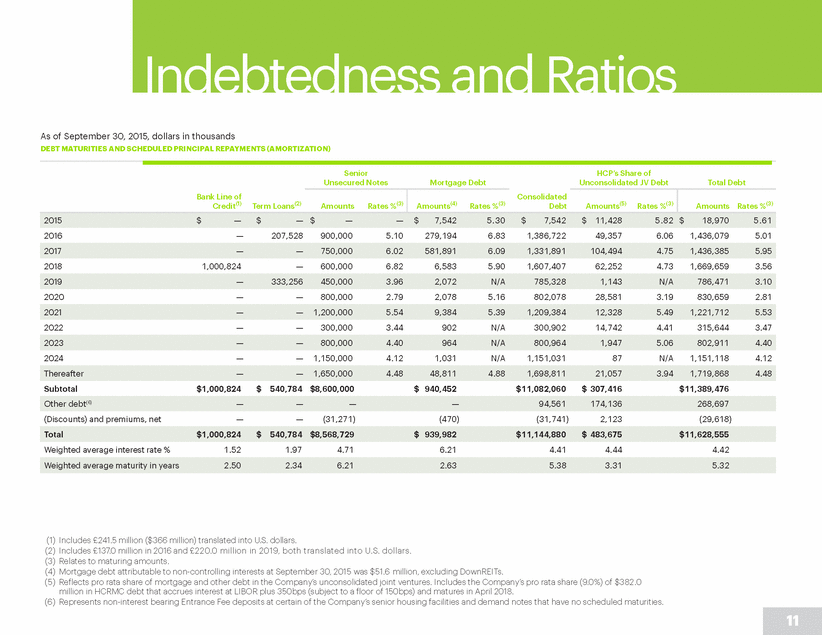
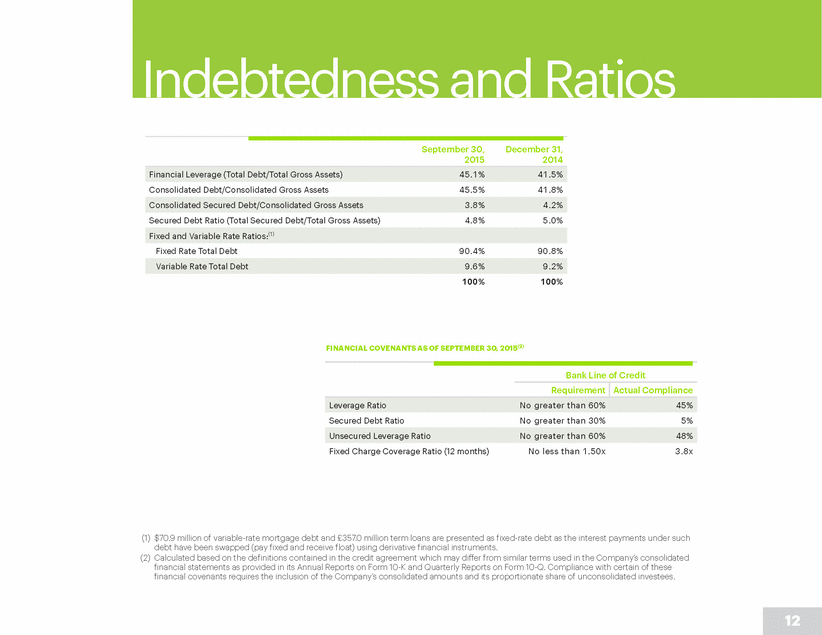
Indebtedness and Ratios As of September 30, 2015, dollars in thousands DEBT MATURITIES AND SCHEDULED PRINCIPAL REPAYMENTS (AMORTIZATION) Senior Unsecured Notes HCP’s Share of Unconsolidated JV Debt Mortgage Debt Total Debt 2016 — 207,528 900,000 5.10 279,194 6.83 1,386,722 49,357 6.06 1,436,079 5.01 2018 1,000,824 — 600,000 6.82 6,583 5.90 1,607,407 62,252 4.73 1,669,659 3.56 2020 — — 800,000 2.79 2,078 5.16 802,078 28,581 3.19 830,659 2.81 2022 — — 300,000 3.44 902 N/A 300,902 14,742 4.41 315,644 3.47 2024 — — 1,150,000 4.12 1,031 N/A 1,151,031 87 N/A 1,151,118 4.12 Subtotal $1,000,824 $ 540,784 $8,600,000 $ 940,452 $ 11,082,060 $ 307,416 $ 11,389,476 (Discounts) and premiums, net — — (31,271) (470) (31,741) 2,123 (29,618) Weighted average interest rate % 1.52 1.97 4.71 6.21 4.41 4.44 4.42 (1) Includes £241.5 million ($366 million) translated into U.S. dollars. (2) Includes £137.0 million in 2016 and £220.0 million in 2019, both translated into U.S. dollars. (3) Relates to maturing amounts. (4) Mortgage debt attributable to non-controlling interests at September 30, 2015 was $51.6 million, excluding DownREITs. (5) Reflects pro rata share of mortgage and other debt in the Company’s unconsolidated joint ventures. Includes the Company’s pro rata share (9.0%) of $382.0 million in HCRMC debt that accrues interest at LIBOR plus 350bps (subject to a floor of 150bps) and matures in April 2018. (6) Represents non-interest bearing Entrance Fee deposits at certain of the Company’s senior housing facilities and demand notes that have no scheduled maturities. 11 Weighted average maturity in years 2.50 2.34 6.21 2.63 5.38 3.31 5.32 Total $1,000,824$ 540,784 $8,568,729 $ 939,982 $ 11,144,880 $ 483,675 $ 11,628,555 Other debt(6) ————94,561 174,136 268,697 Thereafter —— 1,650,000 4.48 48,811 4.88 1,698,811 21,057 3.94 1,719,868 4.48 2023 ——800,000 4.40 964 N/A 800,964 1,947 5.06 802,911 4.40 2021—— 1,200,000 5.54 9,384 5.39 1,209,384 12,328 5.49 1,221,712 5.53 2019 —333,256 450,000 3.96 2,072 N/A 785,328 1,143 N/A 786,471 3.10 2017——750,000 6.02 581,891 6.09 1,331,891 104,494 4.75 1,436,385 5.95 Bank Line of Credit(1)Term Loans(2) Amounts Rates %(3) Consolidated Amounts(4) Rates %(3)Debt Amounts(5) Rates %(3) Amounts Rates %(3) 2015$ —$ — $ ——$ 7,542 5.30 $ 7,542 $ 11,428 5.82 $ 18,970 5.61
Indebtedness and Ratios September 30, 2015 December 31, 2014 Consolidated Debt/Consolidated Gross Assets 45.5% 41.8% Secured Debt Ratio (Total Secured Debt/Total Gross Assets) 4.8% 5.0% Fixed Rate Total Debt 90.4% 90.8% 100% 100% FINANCIAL COVENANTS AS OF SEPTEMBER 30, 2015(2) Bank Line of Credit Secured Debt Ratio No greater than 30% 5% Fixed Charge Coverage Ratio (12 months) No less than 1.50x 3.8x (1) $70.9 million of variable-rate mortgage debt and £357.0 million term loans are presented as fixed-rate debt as the interest payments under such debt have been swapped (pay fixed and receive float) using derivative financial instruments. (2) Calculated based on the definitions contained in the credit agreement which may differ from similar terms used in the Company’s consolidated financial statements as provided in its Annual Reports on Form 10-K and Quarterly Reports on Form 10-Q. Compliance with certain of these financial covenants requires the inclusion of the Company’s consolidated amounts and its proportionate share of unconsolidated investees. 12 Unsecured Leverage Ratio No greater than 60%48% Requirement Actual Compliance Leverage Ratio No greater than 60%45% Variable Rate Total Debt 9.6%9.2% Fixed and Variable Rate Ratios:(1) Consolidated Secured Debt/Consolidated Gross Assets 3.8%4.2% Financial Leverage (Total Debt/Total Gross Assets)45.1% 41.5%
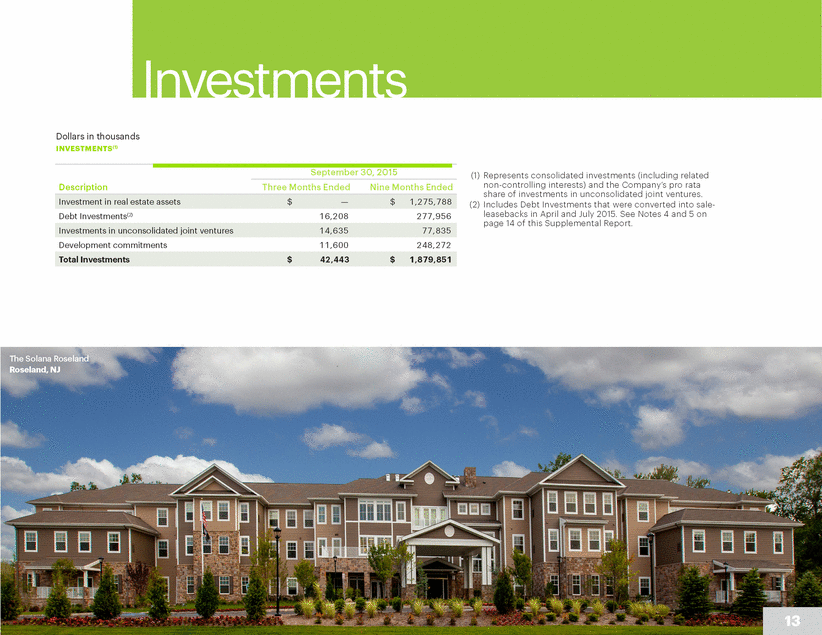
Investments Dollars in thousands INVESTMENTS(1) September 30, 2015 (1) Represents consolidated investments (including related non-controlling interests) and the Company’s pro rata share of investments in unconsolidated joint ventures. (2) Includes Debt Investments that were converted into sale-leasebacks in April and July 2015. See Notes 4 and 5 on page 14 of this Supplemental Report. Description Three Months Ended Nine Months Ended Debt Investments(2) 16,208 277,956 Development commitments 11,600 248,272 The Solana Roseland Roseland, NJ 13 Total Investments $ 42,443 $ 1,879,851 Investments in unconsolidated joint ventures 14,635 77,835 Investment in real estate assets$ —$ 1,275,788
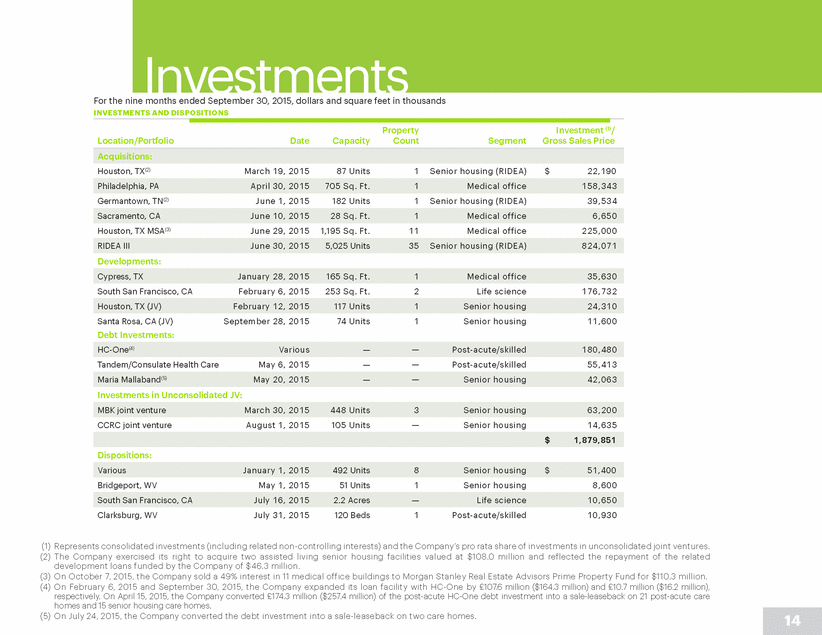
For the nine months ended September 30, 2015, dollars and square feet in thousands INVESTMENTS AND DISPOSITIONS Property Count Investment (1)/ Gross Sales Price Location/Portfolio Date Capacity Segment Houston, TX(2) March 19, 2015 87 Units 1 Senior housing (RIDEA) $ 22,190 Germantown, TN(2) June 1, 2015 182 Units 1 Senior housing (RIDEA) 39,534 Houston, TX MSA(3) June 29, 2015 1,195 Sq. Ft. 11 Medical office 225,000 Developments: South San Francisco, CA February 6, 2015 253 Sq. Ft. 2 Life science 176,732 Santa Rosa, CA (JV) Debt Investments: September 28, 2015 74 Units 1 Senior housing 11,600 Tandem/Consulate Health Care May 6, 2015 — — Post-acute/skilled 55,413 Investments in Unconsolidated JV: CCRC joint venture August 1, 2015 105 Units — Senior housing 14,635 Dispositions: Bridgeport, WV May 1, 2015 51 Units 1 Senior housing 8,600 Clarksburg, WV July 31, 2015 120 Beds 1 Post-acute/skilled 10,930 (1) Represents consolidated investments (including related non-controlling interests) and the Company’s pro rata share of investments in unconsolidated joint ventures. (2) The Company exercised its right to acquire two assisted living senior housing facilities valued at $108.0 million and reflected the repayment of the related development loans funded by the Company of $46.3 million. (3) On October 7, 2015, the Company sold a 49% interest in 11 medical office buildings to Morgan Stanley Real Estate Advisors Prime Property Fund for $110.3 million. (4) On February 6, 2015 and September 30, 2015, the Company expanded its loan facility with HC-One by £107.6 million ($164.3 million) and £10.7 million ($16.2 million), respectively. On April 15, 2015, the Company converted £174.3 million ($257.4 million) of the post-acute HC-One debt investment into a sale-leaseback on 21 post-acute care homes and 15 senior housing care homes. (5) On July 24, 2015, the Company converted the debt investment into a sale-leaseback on two care homes. 14 South San Francisco, CA July 16, 2015 2.2 Acres —Life science 10,650 Various January 1, 2015 492 Units 8 Senior housing $ 51,400 $1,879,851 MBK joint venture March 30, 2015 448 Units 3 Senior housing 63,200 Maria Mallaband(5) May 20, 2015 ——Senior housing 42,063 HC-One(4) Various ——Post-acute/skilled180,480 Houston, TX (JV)February 12, 2015 117 Units 1 Senior housing 24,310 Cypress, TXJanuary 28, 2015 165 Sq. Ft. 1 Medical office 35,630 RIDEA IIIJune 30, 2015 5,025 Units 35 Senior housing (RIDEA)824,071 Sacramento, CA June 10, 2015 28 Sq. Ft. 1 Medical office 6,650 Philadelphia, PAApril 30, 2015 705 Sq. Ft. 1 Medical office 158,343 Acquisitions:
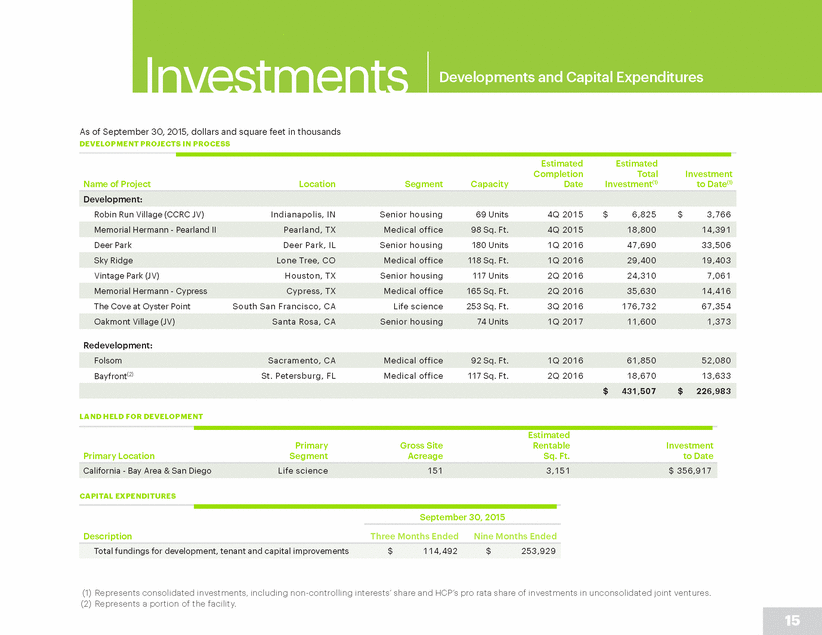
Developments and Capital Expenditures As of September 30, 2015, dollars and square feet in thousands DEVELOPMENT PROJECTS IN PROCESS Estimated Completion Date Estimated Total Investment(1) Investment to Date(1) Name of Project Location Segment Capacity Robin Run Village (CCRC JV) Indianapolis, IN Senior housing 69 Units 4Q 2015 $ 6,825 $ 3,766 Deer Park Deer Park, IL Senior housing 180 Units 1Q 2016 47,690 33,506 Vintage Park (JV) Houston, TX Senior housing 117 Units 2Q 2016 24,310 7,061 The Cove at Oyster Point South San Francisco, CA Life science 253 Sq. Ft. 3Q 2016 176,732 67,354 Redevelopment: Bayfront(2) St. Petersburg, FL Medical office 117 Sq. Ft. 2Q 2016 18,670 13,633 LAND HELD FOR DEVELOPMENT Estimated Rentable Sq. Ft. Primary Segment Gross Site Acreage Investment to Date Primary Location CAPITAL EXPENDITURES September 30, 2015 Description Three Months Ended Nine Months Ended (1) Represents consolidated investments, including non-controlling interests’ share and HCP’s pro rata share of investments in unconsolidated joint ventures. (2) Represents a portion of the facility. 15 Total fundings for development, tenant and capital improvements $ 114,492 $ 253,929 California - Bay Area & San Diego Life science 151 3,151 $ 356,917 $431,507 $226,983 Folsom Sacramento, CA Medical office 92 Sq. Ft.1Q 2016 61,850 52,080 Oakmont Village (JV)Santa Rosa, CA Senior housing 74 Units 1Q 2017 11,600 1,373 Memorial Hermann - Cypress Cypress, TXMedical office 165 Sq. Ft.2Q 2016 35,630 14,416 Sky Ridge Lone Tree, CO Medical office 118 Sq. Ft.1Q 2016 29,400 19,403 Memorial Hermann - Pearland IIPearland, TXMedical office 98 Sq. Ft.4Q 2015 18,800 14,391 Development:
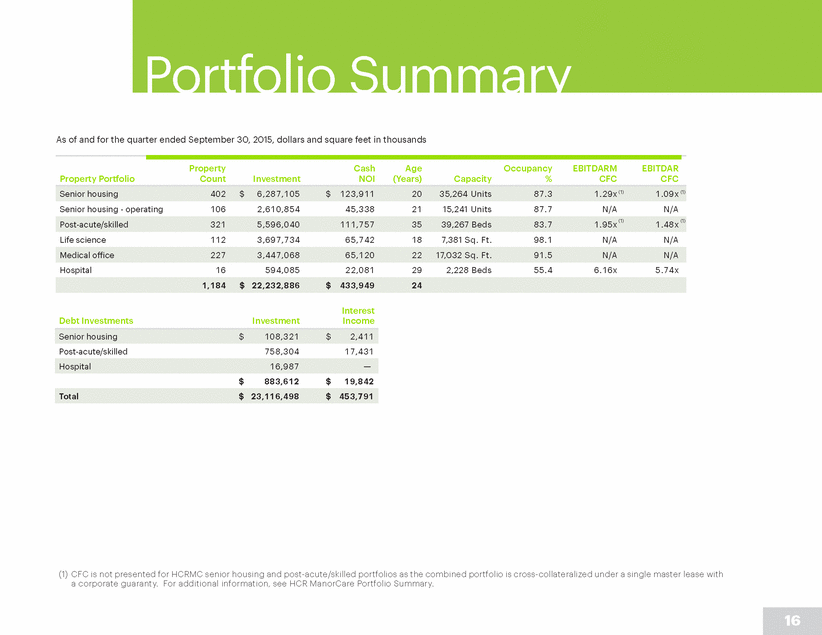
Portfolio Summary As of and for the quarter ended September 30, 2015, dollars and square feet in thousands Property Count Cash NOI Age (Years) Occupancy % EBITDARM CFC EBITDAR CFC Property Portfolio Investment Capacity Senior housing - operating 106 2,610,854 45,338 21 15,241 Units 87.7 N/A N/A Life science 112 3,697,734 65,742 18 7,381 Sq. Ft. 98.1 N/A N/A Hospital 16 594,085 22,081 29 2,228 Beds 55.4 6.16x 5.74x Interest Income Debt Investments Investment Post-acute/skilled 758,304 17,431 $ 883,612 $ 19,842 (1) CFC is not presented for HCRMC senior housing and post-acute/skilled portfolios as the combined portfolio is cross-collateralized under a single master lease with a corporate guaranty. For additional information, see HCR ManorCare Portfolio Summary. 16 Total $ 23,116,498 $ 453,791 Hospital 16,987 — Senior housing $ 108,321 $ 2,411 1,184 $ 22,232,886 $ 433,949 24 Medical office 227 3,447,068 65,120 22 17,032 Sq. Ft. 91.5 N/A N/A Post-acute/skilled321 5,596,040 111,757 35 39,267 Beds83.7 1.95x (1)1.48x (1) Senior housing 402 $ 6,287,105 $ 123,911 20 35,264 Units 87.3 1.29x (1)1.09x (1)
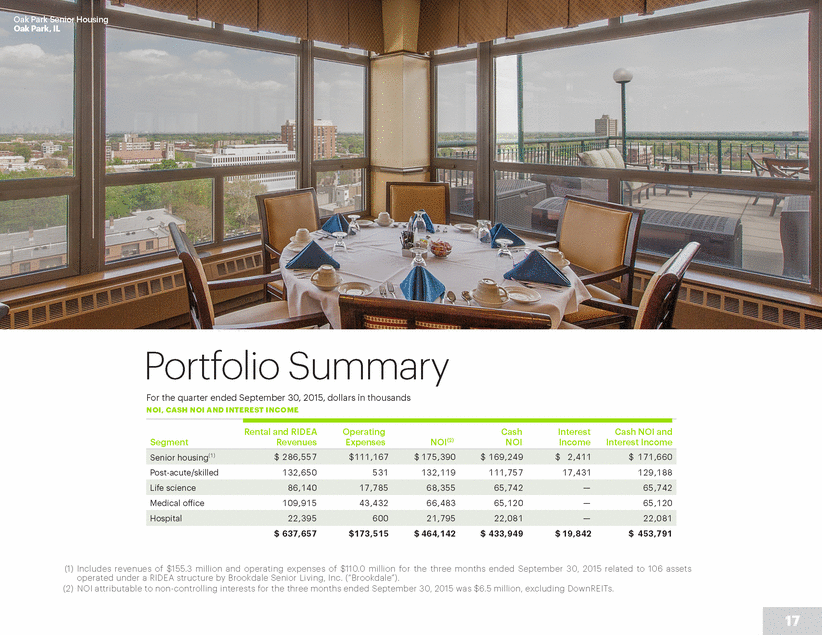
Oak Park Senior Housing Oak Park, IL Portfolio Summary For the quarter ended September 30, 2015, dollars in thousands NOI, CASH NOI AND INTEREST INCOME Rental and RIDEA Revenues Operating Expenses Cash NOI Interest Income Cash NOI and Interest Income Segment NOI(2) Post-acute/skilled 132,650 531 132,119 111,757 17,431 129,188 Medical office 109,915 43,432 66,483 65,120 — 65,120 $ 637,657 $173,515 $ 464,142 $ 433,949 $ 19,842 $ 453,791 (1) Includes revenues of $155.3 million and operating expenses of $110.0 million for the three months ended September 30, 2015 related to 106 assets operated under a RIDEA structure by Brookdale Senior Living, Inc. (“Brookdale”). (2) NOI attributable to non-controlling interests for the three months ended September 30, 2015 was $6.5 million, excluding DownREITs. 17 Hospital 22,395 600 21,795 22,081 —22,081 Life science 86,140 17,785 68,355 65,742 —65,742 Senior housing(1) $ 286,557 $111,167 $ 175,390 $ 169,249 $ 2,411 $ 171,660
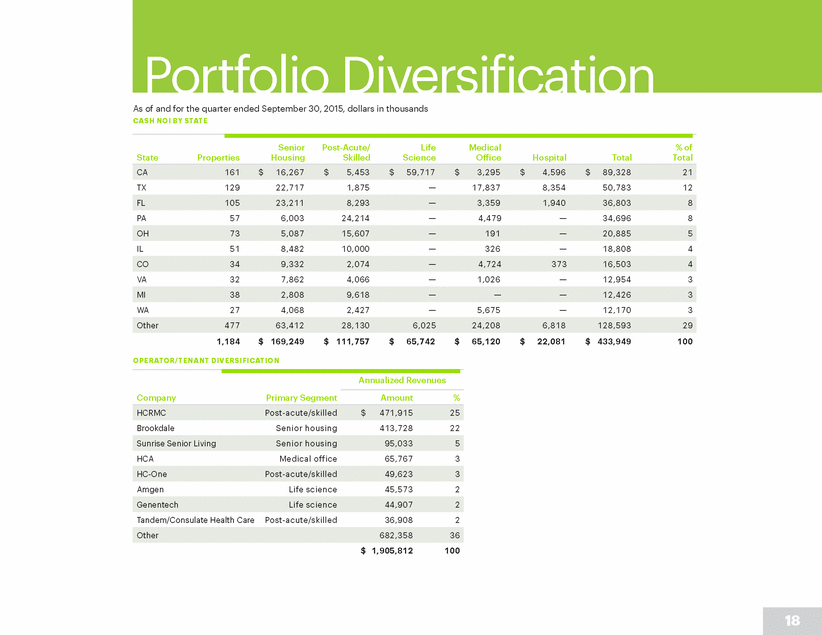
Portfolio Diversification As of and for the quarter ended September 30, 2015, dollars in thousands CASH NOI BY STATE Senior Housing Post-Acute/ Skilled Life Science Medical Office % of Total State Properties Hospital Total TX 129 22,717 1,875 — 17,837 8,354 50,783 12 — — PA 57 6,003 24,214 4,479 34,696 8 IL 51 8,482 10,000 — 326 — 18,808 4 VA 32 7,862 4,066 — 1,026 — 12,954 3 WA 27 4,068 2,427 — 5,675 — 12,170 3 1,184 $ 169,249 $ 111,757 $ 65,742 $ 65,120 $ 22,081 $ 433,949 100 OPERATOR/TENANT DIVERSIFICATION Annualized Revenues Company Primary Segment Amount % Brookdale Senior housing 413,728 22 HCA Medical office 65,767 3 Amgen Life science 45,573 2 Tandem/Consulate Health Care Post-acute/skilled 36,908 2 $ 1,905,812 100 18 Other 682,358 36 GenentechLife science44,9072 HC-One Post-acute/skilled49,6233 Sunrise Senior Living Senior housing95,0335 HCRMC Post-acute/skilled$ 471,915 25 Other 477 63,412 28,130 6,025 24,208 6,818 128,593 29 MI 38 2,808 9,618 ———12,4263 CO 34 9,332 2,074 —4,724 373 16,5034 OH 73 5,087 15,607 —191 —20,8855 FL105 23,211 8,293 —3,359 1,940 36,8038 CA 161 $ 16,267 $ 5,453 $ 59,717 $ 3,295 $ 4,596 $ 89,328 21
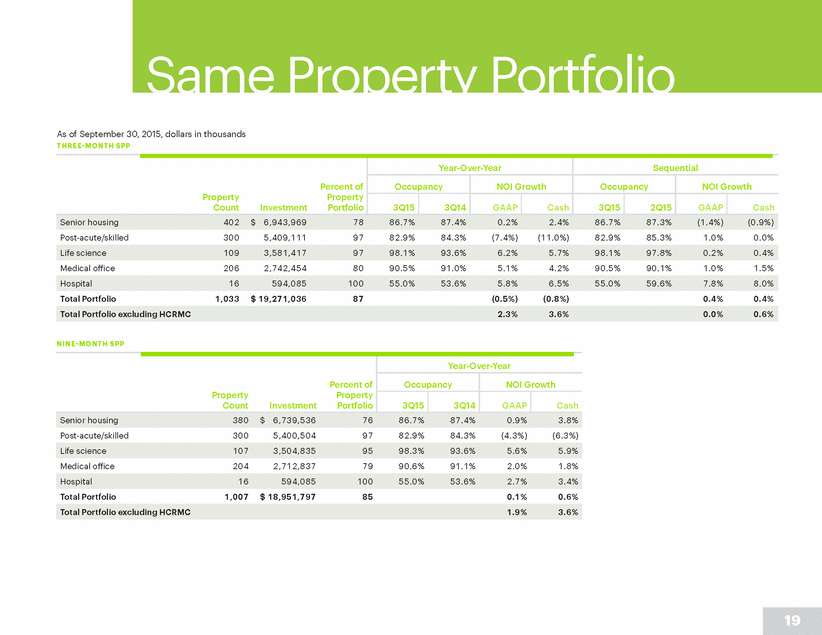
Same Property Portfolio As of September 30, 2015, dollars in thousands THREE-MONTH SPP Post-acute/skilled 300 5,409,111 97 82.9% 84.3% (7.4%) (11.0%) 82.9% 85.3% 1.0% 0.0% Medical office 206 2,742,454 80 90.5% 91.0% 5.1% 4.2% 90.5% 90.1% 1.0% 1.5% Total Portfolio 1,033 $ 19,271,036 87 (0.5%) (0.8%) 0.4% 0.4% NINE-MONTH SPP Post-acute/skilled 300 5,400,504 97 82.9% 84.3% (4.3%) (6.3%) Medical office 204 2,712,837 79 90.6% 91.1% 2.0% 1.8% Total Portfolio 1,007 $ 18,951,797 85 0.1% 0.6% 19 Total Portfolio excluding HCRMC 1.9%3.6% Hospital 16 594,085 100 55.0% 53.6% 2.7%3.4% Life science 107 3,504,835 95 98.3% 93.6% 5.6%5.9% Percent of Property Property Count Investment Portfolio Year-Over-Year Occupancy NOI Growth 3Q15 3Q14 GAAP Cash Senior housing 380 $ 6,739,536 76 86.7% 87.4% 0.9%3.8% Total Portfolio excluding HCRMC 2.3%3.6%0.0%0.6% Hospital 16 594,085 100 55.0% 53.6% 5.8%6.5%55.0% 59.6% 7.8%8.0% Life science 109 3,581,417 97 98.1% 93.6% 6.2%5.7%98.1% 97.8% 0.2%0.4% Percent of Property Property Count Investment Portfolio Year-Over-Year Sequential Occupancy NOI Growth Occupancy NOI Growth 3Q15 3Q14 GAAP Cash 3Q15 2Q15 GAAP Cash Senior housing 402 $ 6,943,969 78 86.7% 87.4% 0.2%2.4%86.7% 87.3% (1.4%)(0.9%)
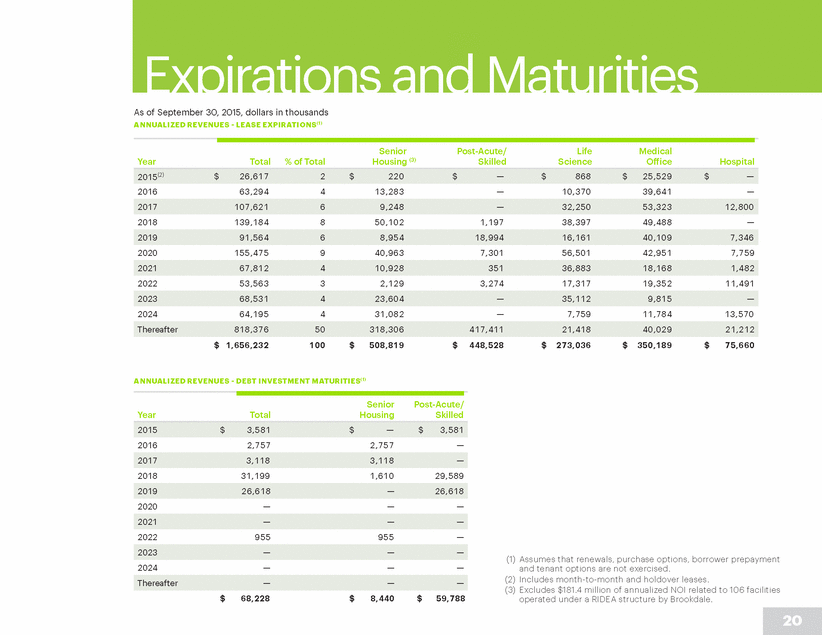
Expirations and Maturities As of September 30, 2015, dollars in thousands ANNUALIZED REVENUES - LEASE EXPIRATIONS(1) Senior Housing (3) Post-Acute/ Skilled Life Science Medical Office Year Total % of Total Hospital 2016 63,294 4 13,283 — 10,370 39,641 — 2018 139,184 8 50,102 1,197 38,397 49,488 — 2020 155,475 9 40,963 7,301 56,501 42,951 7,759 2022 53,563 3 2,129 3,274 17,317 19,352 11,491 2024 64,195 4 31,082 — 7,759 11,784 13,570 $ 1,656,232 100 $ 508,819 $ 448,528 $ 273,036 $ 350,189 $ 75,660 ANNUALIZED REVENUES - DEBT INVESTMENT MATURITIES(1) Senior Housing Post-Acute/ Skilled Year Total 2016 2,757 2,757 — 2018 31,199 1,610 29,589 2020 — — — 2022 955 955 — (1) Assumes that renewals, purchase options, borrower prepayment and tenant options are not exercised. (2) Includes month-to-month and holdover leases. (3) Excludes $181.4 million of annualized NOI related to 106 facilities operated under a RIDEA structure by Brookdale. 2024 — — — $ 68,228 $ 8,440 $ 59,788 20 Thereafter ——— 2023 ——— 2021 ——— 2019 26,618 —26,618 2017 3,118 3,118 — 2015 $ 3,581 $ —$ 3,581 Thereafter 818,376 50 318,306 417,411 21,418 40,029 21,212 2023 68,531 4 23,604 —35,112 9,815 — 2021 67,812 4 10,928 351 36,883 18,168 1,482 2019 91,564 6 8,954 18,994 16,161 40,109 7,346 2017 107,621 6 9,248 —32,250 53,323 12,800 2015(2) $ 26,617 2 $ 220 $ —$ 868 $ 25,529 $ —
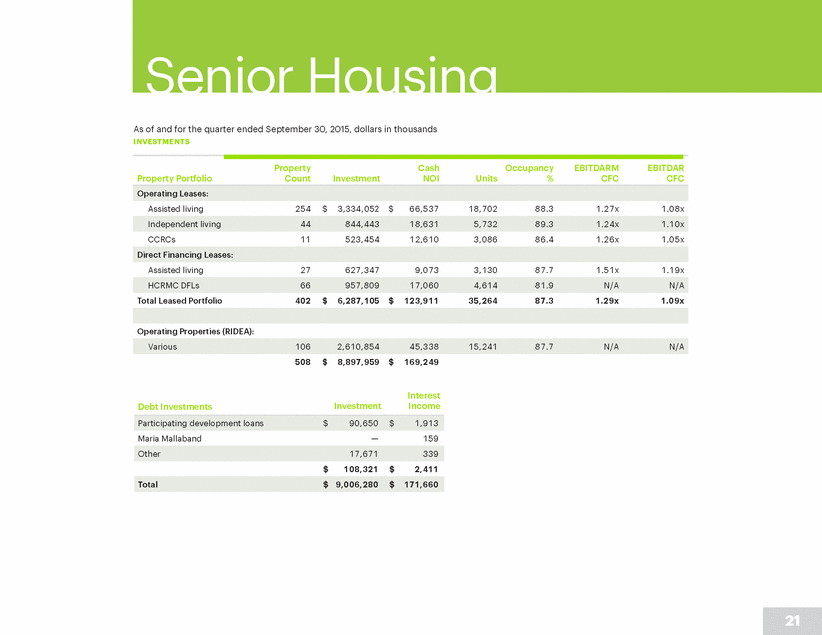
As of and for the quarter ended September 30, 2015, dollars in thousands INVESTMENTS Property Count Cash NOI Occupancy % EBITDARM CFC EBITDAR CFC Property Portfolio Investment Units Assisted living 254 $ 3,334,052 $ 66,537 18,702 88.3 1.27x 1.08x CCRCs 11 523,454 12,610 3,086 86.4 1.26x 1.05x Assisted living 27 627,347 9,073 3,130 87.7 1.51x 1.19x Total Leased Portfolio 402 $ 6,287,105 $ 123,911 35,264 87.3 1.29x 1.09x Operating Properties (RIDEA): 508 $ 8,897,959 $ 169,249 Interest Income Investment Debt Investments Maria Mallaband — 159 $ 108,321 $ 2,411 21 Total $ 9,006,280 $ 171,660 Other 17,671 339 Participating development loans $ 90,650 $ 1,913 Various 106 2,610,854 45,338 15,241 87.7 N/A N/A HCRMC DFLs66 957,809 17,060 4,614 81.9 N/A N/A Direct Financing Leases: Independent living 44 844,443 18,631 5,732 89.3 1.24x 1.10x Operating Leases:
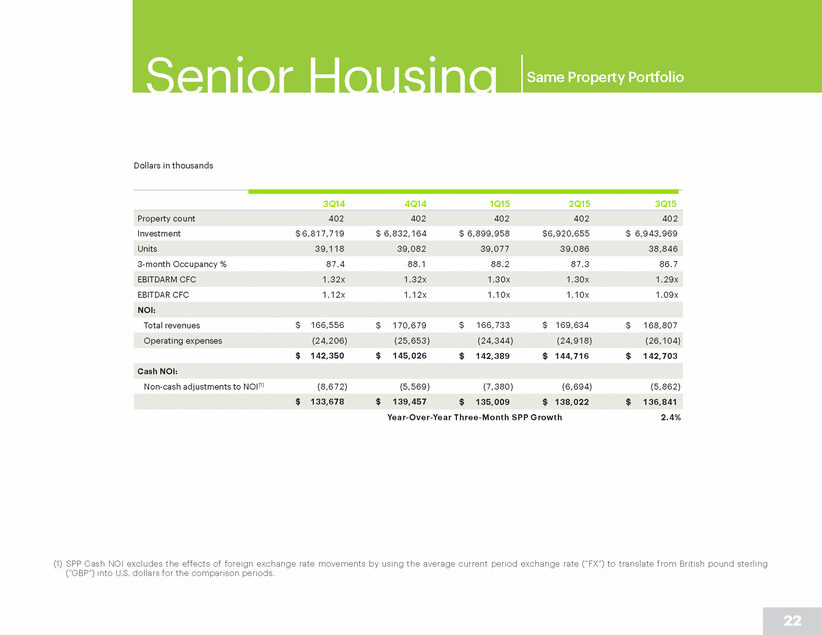
Same Property Portfolio Dollars in thousands 3Q14 4Q14 1Q15 2Q15 3Q15 Investment $ 6,817,719 $ 6,832,164 $ 6,899,958 $6,920,655 $ 6,943,969 3-month Occupancy % 87.4 88.1 88.2 87.3 86.7 EBITDAR CFC 1.12x 1.12x 1.10x 1.10x 1.09x Total revenues $ 166,556 $ 170,679 $ 166,733 $ 169,634 $ 168,807 $ 142,350 $ 145,026 $ 142,389 $ 144,716 $ 142,703 Non-cash adjustments to NOI(1) (8,672) (5,569) (7,380) (6,694) (5,862) Year-Over-Year Three-Month SPP Growth 2.4% (1) SPP Cash NOI excludes the effects of foreign exchange rate movements by using the average current period exchange rate (“FX”) to translate from British pound sterling (“GBP”) into U.S. dollars for the comparison periods. 22 $ 133,678 $ 139,457 $ 135,009 $ 138,022 $ 136,841 Cash NOI: Operating expenses (24,206) (25,653) (24,344) (24,918) (26,104) NOI: EBITDARM CFC1.32x 1.32x 1.30x 1.30x 1.29x Units 39,118 39,082 39,077 39,086 38,846 Property count 402 402 402 402 402
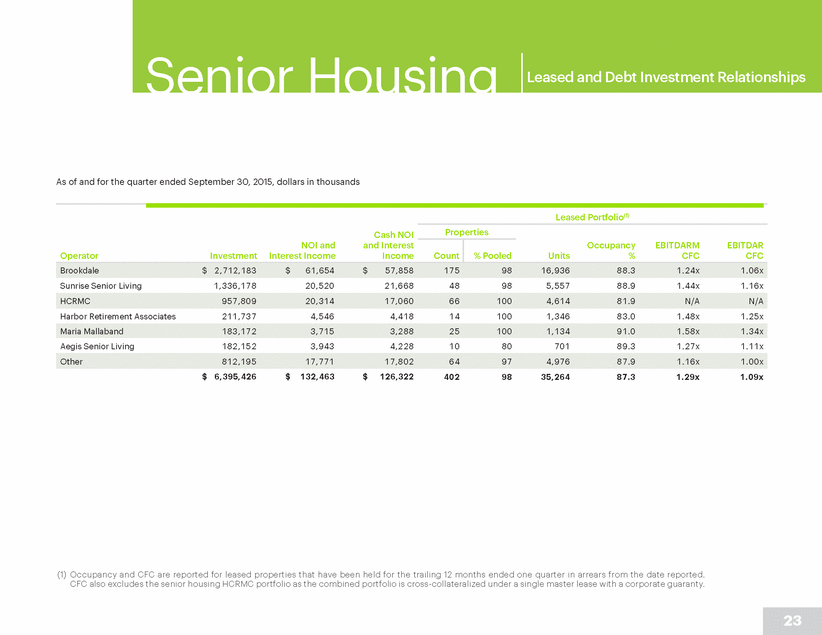
Leased and Debt Investment Relationships As of and for the quarter ended September 30, 2015, dollars in thousands Leased Portfolio(1) Properties Cash NOI Sunrise Senior Living 1,336,178 20,520 21,668 48 98 5,557 88.9 1.44x 1.16x Harbor Retirement Associates 211,737 4,546 4,418 14 100 1,346 83.0 1.48x 1.25x Aegis Senior Living 182,152 3,943 4,228 10 80 701 89.3 1.27x 1.11x $ 6,395,426 $ 132,463 $ 126,322 402 98 35,264 87.3 1.29x 1.09x (1) Occupancy and CFC are reported for leased properties that have been held for the trailing 12 months ended one quarter in arrears from the date reported. CFC also excludes the senior housing HCRMC portfolio as the combined portfolio is cross-collateralized under a single master lease with a corporate guaranty. 23 Other 812,195 17,771 17,802 64 97 4,976 87.9 1.16x 1.00x Maria Mallaband 183,172 3,715 3,288 25 100 1,134 91.0 1.58x 1.34x HCRMC957,809 20,314 17,060 66 100 4,614 81.9 N/A N/A NOI andand Interest Operator InvestmentInterest Income Income Count % Pooled Occupancy EBITDARMEBITDAR Units %CFCCFC Brookdale $ 2,712,183 $ 61,654 $ 57,858 175 98 16,936 88.3 1.24x 1.06x
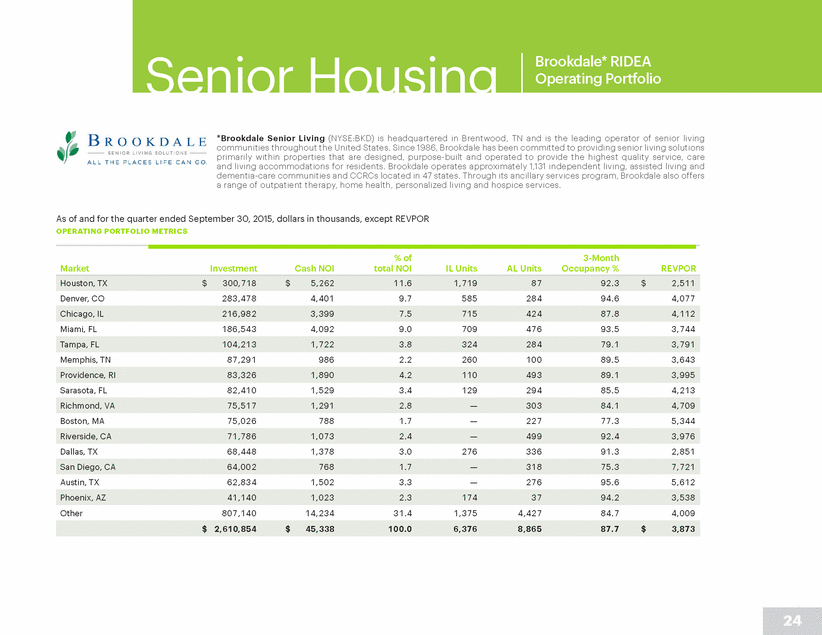
Brookdale* RIDEA Operating Portfolio *Brookdale Senior Living (NYSE:BKD) is headquartered in Brentwood, TN and is the leading operator of senior living communities throughout the United States. Since 1986, Brookdale has been committed to providing senior living solutions primarily within properties that are designed, purpose-built and operated to provide the highest quality service, care and living accommodations for residents. Brookdale operates approximately 1,131 independent living, assisted living and dementia-care communities and CCRCs located in 47 states. Through its ancillary services program, Brookdale also offers a range of outpatient therapy, home health, personalized living and hospice services. As of and for the quarter ended September 30, 2015, dollars in thousands, except REVPOR OPERATING PORTFOLIO METRICS % of total NOI 3-Month Occupancy % Market Investment Cash NOI IL Units AL Units REVPOR Denver, CO 283,478 4,401 9.7 585 284 94.6 4,077 Miami, FL 186,543 4,092 9.0 709 476 93.5 3,744 Memphis, TN 87,291 986 2.2 260 100 89.5 3,643 Sarasota, FL 82,410 1,529 3.4 129 294 85.5 4,213 Boston, MA 75,026 788 1.7 — 227 77.3 5,344 Dallas, TX 68,448 1,378 3.0 276 336 91.3 2,851 Austin, TX 62,834 1,502 3.3 — 276 95.6 5,612 Other 807,140 14,234 31.4 1,375 4,427 84.7 4,009 24 $ 2,610,854 $ 45,338 100.0 6,376 8,865 87.7 $ 3,873 Phoenix, AZ41,140 1,023 2.3 174 37 94.2 3,538 San Diego, CA 64,002 768 1.7 —318 75.3 7,721 Riverside, CA 71,786 1,073 2.4 —499 92.4 3,976 Richmond, VA75,517 1,291 2.8 —303 84.1 4,709 Providence, RI83,326 1,890 4.2 110 493 89.1 3,995 Tampa, FL104,213 1,722 3.8 324 284 79.1 3,791 Chicago, IL216,982 3,399 7.5 715 424 87.8 4,112 Houston, TX$ 300,718 $ 5,262 11.6 1,719 87 92.3 $ 2,511
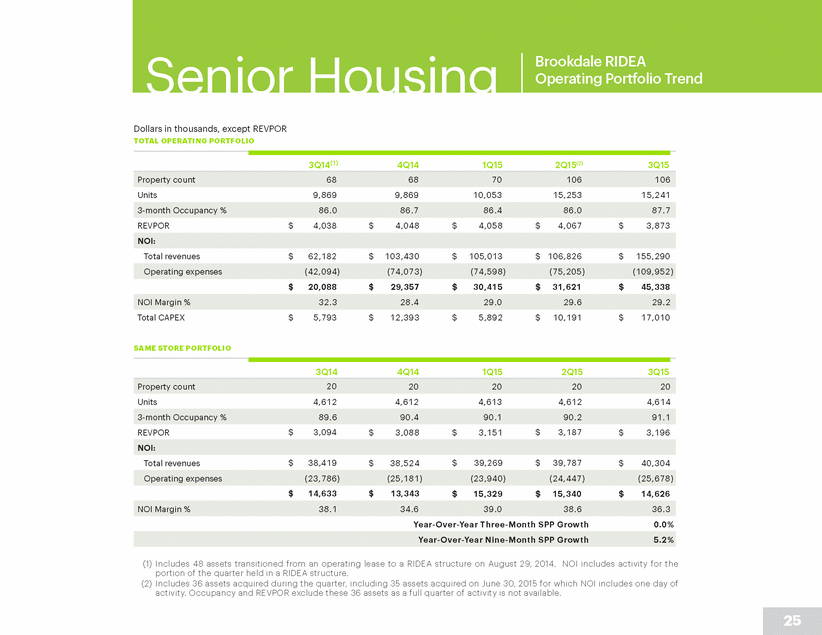
Brookdale RIDEA Operating Portfolio Trend Dollars in thousands, except REVPOR TOTAL OPERATING PORTFOLIO 3Q14(1) 4Q14 1Q15 2Q15(2) 3Q15 Units 9,869 9,869 10,053 15,253 15,241 REVPOR $ 4,038 $ 4,048 $ 4,058 $ 4,067 $ 3,873 Total revenues $ 62,182 $ 103,430 $ 105,013 $ 106,826 $ 155,290 $ 20,088 $ 29,357 $ 30,415 $ 31,621 $ 45,338 Total CAPEX $ 5,793 $ 12,393 $ 5,892 $ 10,191 $ 17,010 SAME STORE PORTFOLIO 3Q14 4Q14 1Q15 2Q15 3Q15 Units 4,612 4,612 4,613 4,612 4,614 REVPOR $ 3,094 $ 3,088 $ 3,151 $ 3,187 $ 3,196 Total revenues $ 38,524 $ 40,304 $ 38,419 $ 39,269 $ 39,787 $ 14,633 $ 13,343 $ 15,329 $ 15,340 $ 14,626 Year-Over-Year Three-Month SPP Growth 0.0% (1) Includes 48 assets transitioned from an operating lease to a RIDEA structure on August 29, 2014. NOI includes activity for the portion of the quarter held in a RIDEA structure. (2) Includes 36 assets acquired during the quarter, including 35 assets acquired on June 30, 2015 for which NOI includes one day of activity. Occupancy and REVPOR exclude these 36 assets as a full quarter of activity is not available. 25 Year-Over-Year Nine-Month SPP Growth 5.2% NOI Margin %38.1 34.6 39.0 38.6 36.3 Operating expenses (23,786) (25,181) (23,940) (24,447) (25,678) NOI: 3-month Occupancy %89.6 90.4 90.1 90.2 91.1 Property count 20 20 20 20 20 NOI Margin %32.3 28.4 29.0 29.6 29.2 Operating expenses (42,094) (74,073) (74,598) (75,205) (109,952) NOI: 3-month Occupancy %86.0 86.7 86.4 86.0 87.7 Property count 68 68 70 106 106
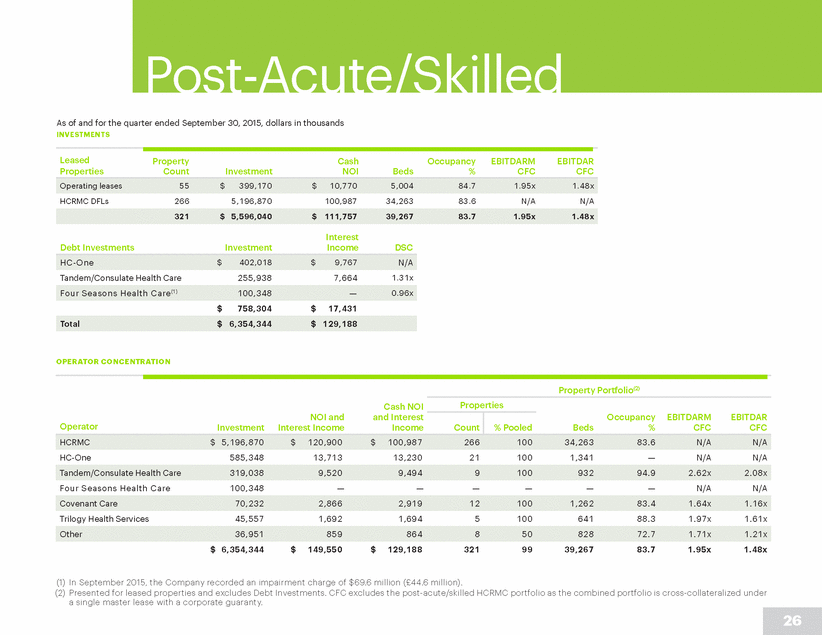
Post-Acute/Skilled As of and for the quarter ended September 30, 2015, dollars in thousands INVESTMENTS Leased Properties Property Count Cash NOI Occupancy % EBITDARM CFC EBITDAR CFC Investment Beds HCRMC DFLs 266 5,196,870 100,987 34,263 83.6 N/A N/A Interest Income Debt Investments Investment DSC Tandem/Consulate Health Care 255,938 7,664 1.31x $ 758,304 $ 17,431 OPERATOR CONCENTRATION Property Portfolio(2) Properties Cash NOI HC-One 585,348 13,713 13,230 21 100 1,341 — N/A N/A Four Seasons Health Care 100,348 — — — — — — N/A N/A Trilogy Health Services 45,557 1,692 1,694 5 100 641 88.3 1.97x 1.61x $ 6,354,344 $ 149,550 $ 129,188 321 99 39,267 83.7 1.95x 1.48x (1) In September 2015, the Company recorded an impairment charge of $69.6 million (£44.6 million). (2) Presented for leased properties and excludes Debt Investments. CFC excludes the post-acute/skilled HCRMC portfolio as the combined portfolio is cross-collateralized under a single master lease with a corporate guaranty. 26 Other 36,951 859 864 8 50 828 72.7 1.71x 1.21x Covenant Care 70,232 2,866 2,919 12 100 1,262 83.4 1.64x 1.16x Tandem/Consulate Health Care 319,038 9,520 9,494 9 100 932 94.9 2.62x 2.08x NOI andand Interest Operator InvestmentInterest Income Income Count % Pooled Occupancy EBITDARMEBITDAR Beds %CFCCFC HCRMC$ 5,196,870 $ 120,900 $ 100,987 266 100 34,263 83.6 N/A N/A Total $ 6,354,344 $ 129,188 Four Seasons Health Care(1) 100,348 —0.96x HC-One $ 402,018 $ 9,767 N/A 321 $ 5,596,040 $ 111,757 39,267 83.7 1.95x 1.48x Operating leases 55 $ 399,170 $ 10,770 5,004 84.7 1.95x 1.48x
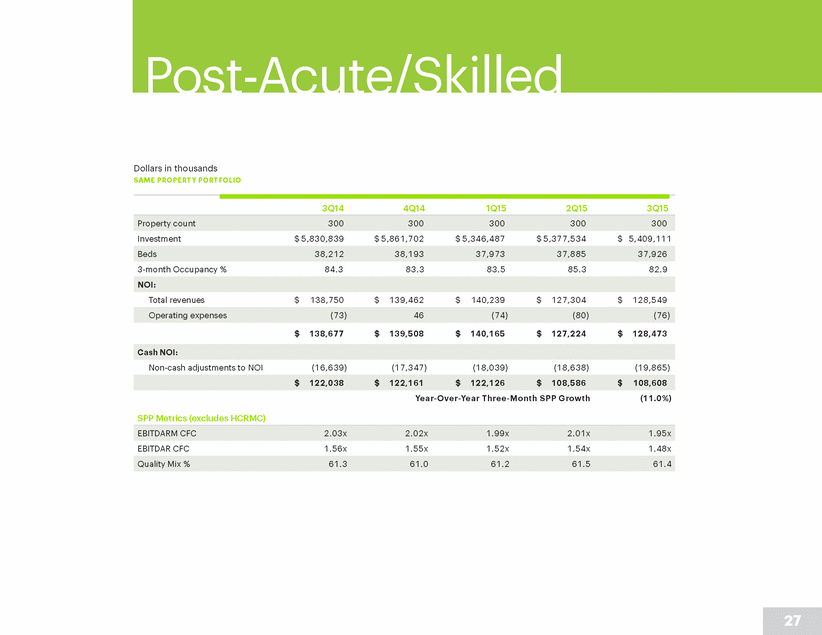
Post-Acute/Skilled Dollars in thousands SAME PROPERTY PORTFOLIO 3Q14 4Q14 1Q15 2Q15 3Q15 Investment $ 5,830,839 $ 5,861,702 $ 5,346,487 $ 5,377,534 $ 5,409,111 3-month Occupancy % 84.3 83.3 83.5 85.3 82.9 Total revenues $ 138,750 $ 139,462 $ 140,239 $ 127,304 $ 128,549 $ 138,677 $ 139,508 $ 140,165 $ 127,224 $ 128,473 Non-cash adjustments to NOI (16,639) (17,347) (18,039) (18,638) (19,865) Year-Over-Year Three-Month SPP Growth (11.0%) SPP Metrics (excludes HCRMC) EBITDAR CFC 1.56x 1.55x 1.52x 1.54x 1.48x 27 Quality Mix %61.3 61.0 61.2 61.5 61.4 EBITDARM CFC2.03x 2.02x 1.99x 2.01x 1.95x $ 122,038 $ 122,161 $ 122,126 $ 108,586 $ 108,608 Cash NOI: Operating expenses (73) 46 (74) (80) (76) NOI: Beds38,212 38,193 37,973 37,885 37,926 Property count 300 300 300 300 300
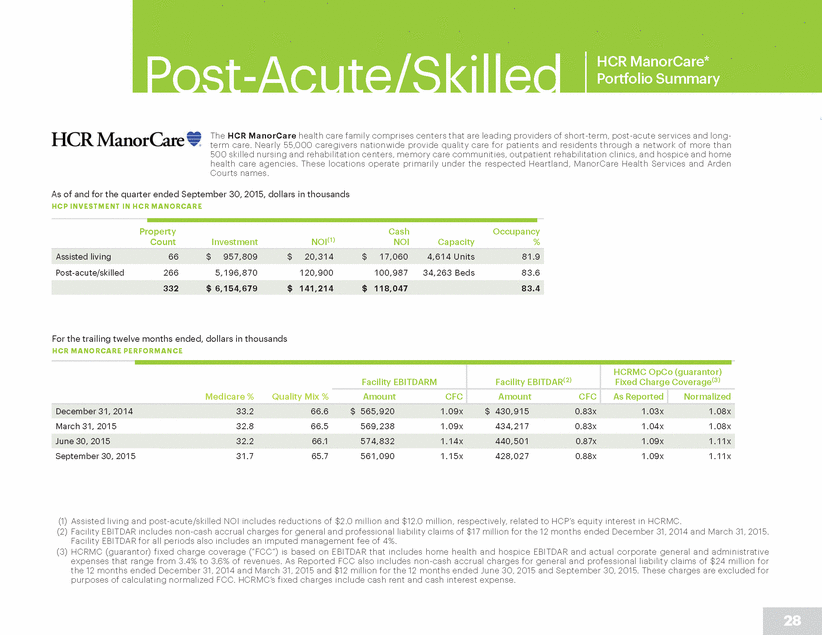
Post-Acute/Skilled HCR ManorCare* Portfolio Summary *HCR ManorCare is a privately held company headquartered in Toledo, Ohio that operates over 500 skilled nursing and rehabilitation centers, assisted living facilities, memory care facilities, outpatient rehabilitation clinics, and hospice and home health care agencies. HCRMC commenced operations in 1982 and is the second largest stand-alone memory care provider and the third largest hospice provider servicing over 100 markets. HCRMC has intensive rehabilitation and clinical capabilities and has achieved a readmission rate of 18% - significantly better than the industry average. As of and for the quarter ended September 30, 2015, dollars in thousands HCP INVESTMENT IN HCR MANORCARE Property Count Cash NOI Occupancy % Investment NOI(1) Capacity Post-acute/skilled 266 5,196,870 120,900 100,987 34,263 Beds 83.6 For the trailing twelve months ended, dollars in thousands HCR MANORCARE PERFORMANCE March 31, 2015 32.8 66.5 569,238 1.09x 434,217 0.83x 1.04x 1.08x September 30, 2015 31.7 65.7 561,090 1.15x 428,027 0.88x 1.09x 1.11x (1) Assisted living and post-acute/skilled NOI includes reductions of $2.0 million and $12.0 million, respectively, related to HCP’s equity interest in HCRMC. (2) Facility EBITDAR includes non-cash accrual charges for general and professional liability claims of $17 million for the 12 months ended December 31, 2014 and March 31, 2015. Facility EBITDAR for all periods also includes an imputed management fee of 4%. (3) HCRMC (guarantor) fixed charge coverage (“FCC”) is based on EBITDAR that includes home health and hospice EBITDAR and actual corporate general and administrative expenses that range from 3.4% to 3.6% of revenues. As Reported FCC also includes non-cash accrual charges for general and professional liability claims of $24 million for the 12 months ended December 31, 2014 and March 31, 2015 and $12 million for the 12 months ended June 30, 2015 and September 30, 2015. These charges are excluded for purposes of calculating normalized FCC. HCRMC’s fixed charges include cash rent and cash interest expense. 28 June 30, 2015 32.2 66.1 574,832 1.14x 440,501 0.87x 1.09x 1.11x Medicare %Quality Mix % Facility EBITDARM Facility EBITDAR(2) HCRMC OpCo (guarantor) Fixed Charge Coverage(3) AmountCFC AmountCFC As Reported Normalized December 31, 2014 33.2 66.6 $ 565,920 1.09x $ 430,915 0.83x 1.03x 1.08x 332 $ 6,154,679 $ 141,214 $ 118,047 83.4 Assisted living 66 $ 957,809 $ 20,314 $ 17,060 4,614 Units 81.9
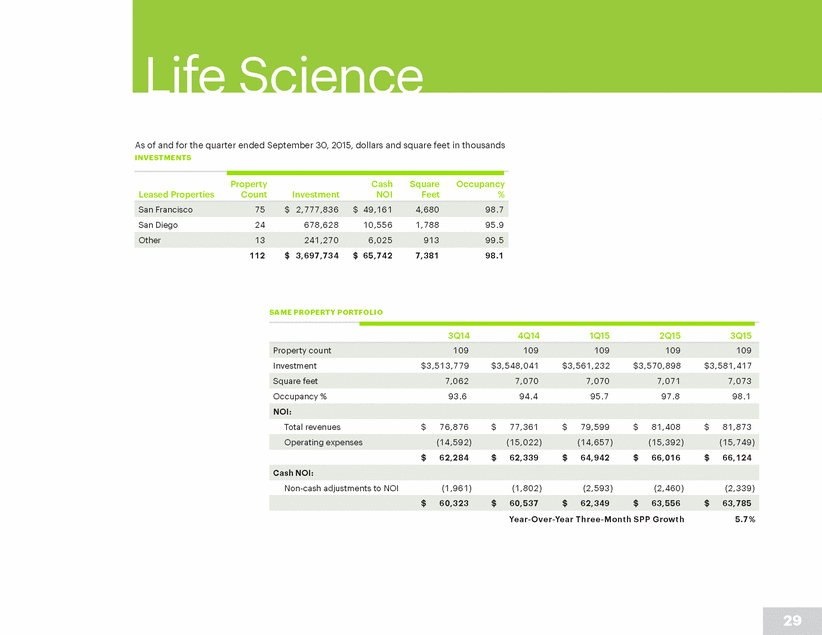
Life Science As of and for the quarter ended September 30, 2015, dollars and square feet in thousands INVESTMENTS Property Count Cash NOI Square Feet Occupancy % Leased Properties Investment San Diego 24 678,628 10,556 1,788 95.9 112 $ 3,697,734 $ 65,742 7,381 98.1 SAME PROPERTY PORTFOLIO 3Q14 4Q14 1Q15 2Q15 3Q15 Investment $3,513,779 $3,548,041 $3,561,232 $3,570,898 $3,581,417 Occupancy % 93.6 94.4 95.7 97.8 98.1 Total revenues $ 76,876 $ 77,361 $ 79,599 $ 81,408 $ 81,873 $ 62,284 $ 62,339 $ 64,942 $ 66,016 $ 66,124 Non-cash adjustments to NOI (1,961) (1,802) (2,593) (2,460) (2,339) Year-Over-Year Three-Month SPP Growth 5.7% 29 $ 60,323 $ 60,537 $ 62,349 $ 63,556 $ 63,785 Cash NOI: Operating expenses (14,592) (15,022) (14,657) (15,392) (15,749) NOI: Square feet 7,062 7,070 7,070 7,071 7,073 Property count 109 109 109 109 109 Other 13 241,270 6,025 913 99.5 San Francisco 75 $ 2,777,836 $ 49,161 4,680 98.7
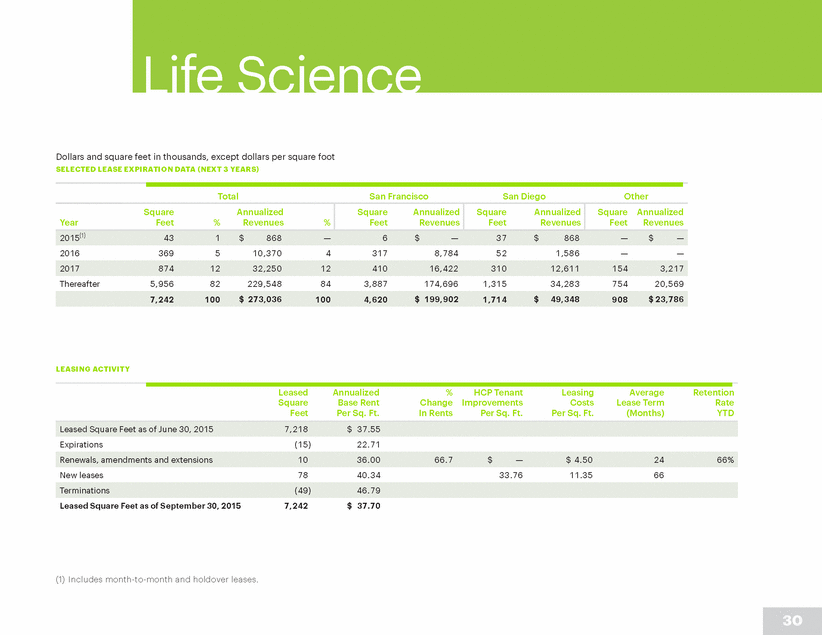
Life Science Dollars and square feet in thousands, except dollars per square foot SELECTED LEASE EXPIRATION DATA (NEXT 3 YEARS) Total San Francisco San Diego Other 2016 369 5 10,370 4 317 8,784 52 1,586 — — Thereafter 5,956 82 229,548 84 3,887 174,696 1,315 34,283 754 20,569 LEASING ACTIVITY Leased Square Feet Annualized Base Rent Per Sq. Ft. % Change In Rents HCP Tenant Improvements Per Sq. Ft. Leasing Costs Per Sq. Ft. Average Lease Term (Months) Retention Rate YTD Expirations (15) 22.71 New leases 78 40.34 33.76 11.35 66 Leased Square Feet as of September 30, 2015 7,242 $ 37.70 (1) Includes month-to-month and holdover leases. 30 Terminations (49) 46.79 Renewals, amendments and extensions 10 36.00 66.7 $ —$ 4.50 24 66% Leased Square Feet as of June 30, 2015 7,218 $ 37.55 7,242 100 $ 273,036 100 4,620 $ 199,902 1,714 $ 49,348 908 $ 23,786 2017 874 12 32,250 12 410 16,422 310 12,611 154 3,217 Square Annualized Year Feet %Revenues % Square Annualized Feet Revenues Square Annualized Feet Revenues Square Annualized Feet Revenues 2015(1)43 1 $ 868 —6 $ —37 $ 868 —$ —
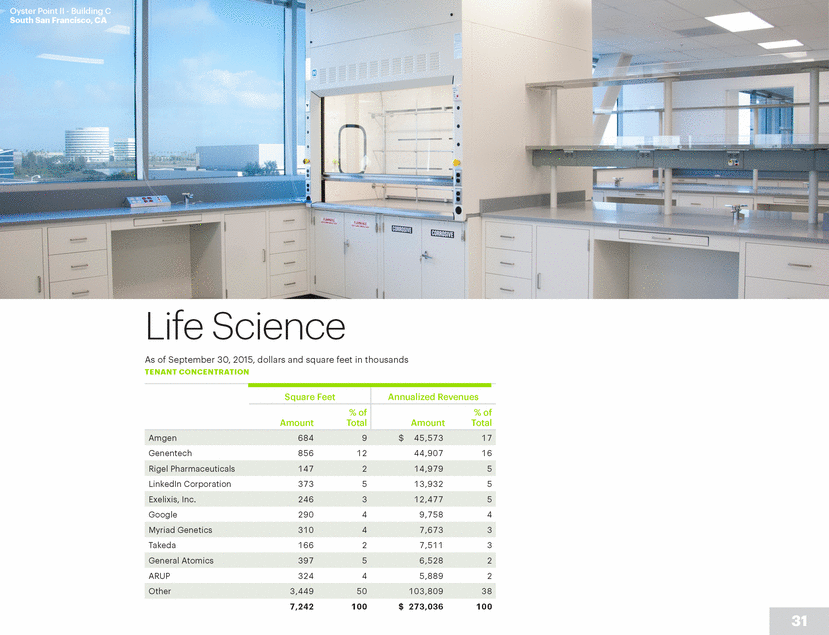
Oyster Point II - Building C South San Francisco, CA Life Science As of September 30, 2015, dollars and square feet in thousands TENANT CONCENTRATION Genentech 856 12 44,907 16 LinkedIn Corporation 373 5 13,932 5 Google 290 4 9,758 4 Takeda 166 2 7,511 3 ARUP 324 4 5,889 2 7,242 100 $ 273,036 100 31 Other 3,449 50 103,809 38 General Atomics 397 5 6,528 2 Myriad Genetics 310 4 7,673 3 Exelixis, Inc. 246 3 12,477 5 Rigel Pharmaceuticals 147 2 14,979 5 Square Feet Annualized Revenues % of AmountTotal % of AmountTotal Amgen 684 9 $ 45,573 17
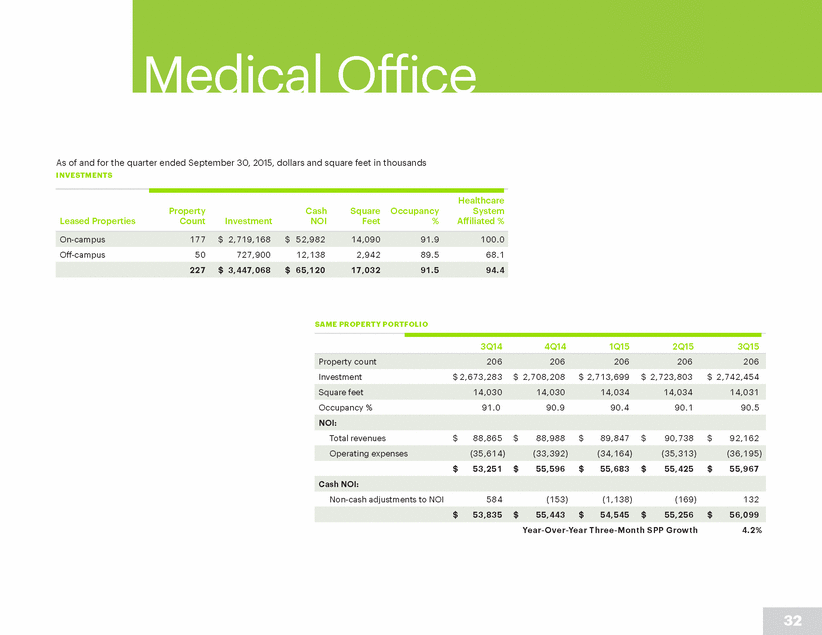
Medical Office As of and for the quarter ended September 30, 2015, dollars and square feet in thousands INVESTMENTS Healthcare System Affiliated % Property Count Cash NOI Square Feet Occupancy % Leased Properties Investment Off-campus 50 727,900 12,138 2,942 89.5 68.1 SAME PROPERTY PORTFOLIO 3Q14 4Q14 1Q15 2Q15 3Q15 Investment $ 2,673,283 $ 2,708,208 $ 2,713,699 $ 2,723,803 $ 2,742,454 Occupancy % 91.0 90.9 90.4 90.1 90.5 Total revenues $ 88,865 $ 88,988 $ 89,847 $ 90,738 $ 92,162 $ 53,251 $ 55,596 $ 55,683 $ 55,425 $ 55,967 Non-cash adjustments to NOI 584 (153) (1,138) (169) 132 Year-Over-Year Three-Month SPP Growth 4.2% 32 $ 53,835 $ 55,443 $ 54,545 $ 55,256 $ 56,099 Cash NOI: Operating expenses (35,614) (33,392) (34,164) (35,313) (36,195) NOI: Square feet 14,030 14,030 14,034 14,034 14,031 Property count 206 206 206 206 206 227 $ 3,447,068 $ 65,120 17,032 91.5 94.4 On-campus 177 $ 2,719,168 $ 52,982 14,090 91.9 100.0
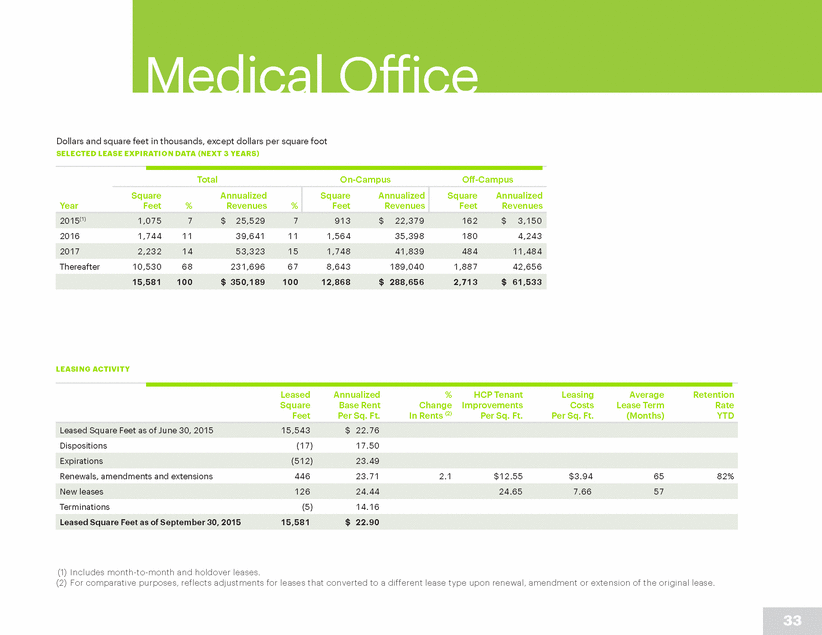
Medical Office Dollars and square feet in thousands, except dollars per square foot SELECTED LEASE EXPIRATION DATA (NEXT 3 YEARS) Total On-Campus Off-Campus 2016 1,744 11 39,641 11 1,564 35,398 180 4,243 Thereafter 10,530 68 231,696 67 8,643 189,040 1,887 42,656 LEASING ACTIVITY Leased Square Feet Annualized Base Rent Per Sq. Ft. % Change In Rents (2) HCP Tenant Improvements Per Sq. Ft. Leasing Costs Per Sq. Ft. Average Lease Term (Months) Retention Rate YTD Dispositions (17) 17.50 Renewals, amendments and extensions 446 23.71 2.1 $12.55 $3.94 65 82% Terminations (5) 14.16 (1) Includes month-to-month and holdover leases. (2) For comparative purposes, reflects adjustments for leases that converted to a different lease type upon renewal, amendment or extension of the original lease. 33 Leased Square Feet as of September 30, 2015 15,581 $ 22.90 New leases126 24.44 24.65 7.66 57 Expirations (512) 23.49 Leased Square Feet as of June 30, 2015 15,543 $ 22.76 15,581 100 $ 350,189 100 12,868 $ 288,656 2,713 $ 61,533 2017 2,232 14 53,323 15 1,748 41,839 484 11,484 Year Square Annualized Feet %Revenues % Square Annualized Feet Revenues Square Annualized Feet Revenues 2015(1) 1,075 7 $ 25,529 7 913 $ 22,379 162 $ 3,150
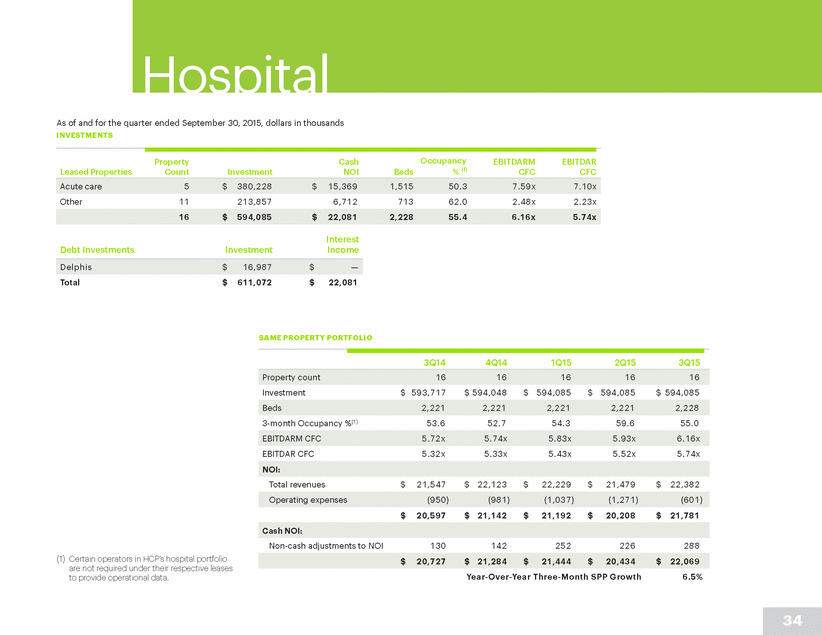
Hospital As of and for the quarter ended September 30, 2015, dollars in thousands INVESTMENTS Occupancy % (1) Property Count Cash NOI EBITDARM CFC EBITDAR CFC Leased Properties Investment Beds Other 11 213,857 6,712 713 62.0 2.48x 2.23x Interest Income Debt Investments Investment Total $ 611,072 $ 22,081 SAME PROPERTY PORTFOLIO 3Q14 4Q14 1Q15 2Q15 3Q15 Investment $ 593,717 $ 594,048 $ 594,085 $ 594,085 $ 594,085 3-month Occupancy %(1) 53.6 52.7 54.3 59.6 55.0 EBITDAR CFC 5.32x 5.33x 5.43x 5.52x 5.74x Total revenues $ 21,547 $ 22,123 $ 22,229 $ 21,479 $ 22,382 $ 20,597 $ 21,142 $ 21,192 $ 20,208 $ 21,781 Non-cash adjustments to NOI 130 142 252 226 288 (1) Certain operators in HCP’s hospital portfolio are not required under their respective leases to provide operational data. Year-Over-Year Three-Month SPP Growth 6.5% 34 $ 20,727 $ 21,284 $ 21,444 $ 20,434 $ 22,069 Cash NOI: Operating expenses (950) (981) (1,037) (1,271) (601) NOI: EBITDARM CFC5.72x 5.74x 5.83x 5.93x 6.16x Beds2,221 2,221 2,221 2,221 2,228 Property count 16 16 16 16 16 Delphis $ 16,987 $ — 16 $ 594,085 $ 22,081 2,228 55.4 6.16x 5.74x Acute care 5 $ 380,228 $ 15,369 1,515 50.3 7.59x 7.10x
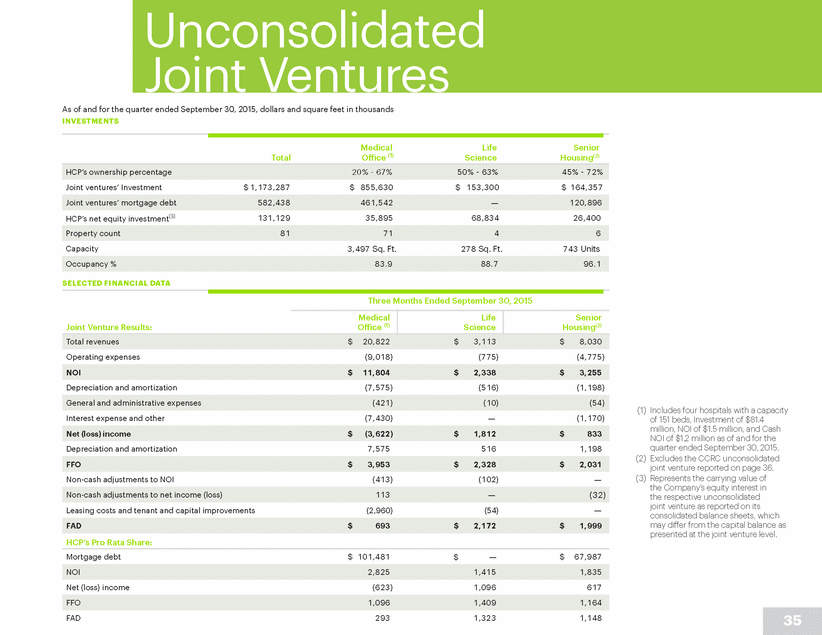
Unconsolidated Joint Ventures As of and for the quarter ended September 30, 2015, dollars and square feet in thousands INVESTMENTS Medical Office (1) Life Science Senior Housing(2) Total Joint ventures’ Investment $ 1,173,287 $ 855,630 $ 153,300 $ 164,357 HCP’s net equity investment(3) 131,129 35,895 68,834 26,400 Capacity 3,497 Sq. Ft. 278 Sq. Ft. 743 Units SELECTED FINANCIAL DATA Three Months Ended September 30, 2015 Operating expenses (9,018) (775) (4,775) Depreciation and amortization (7,575) (516) (1,198) (1) Includes four hospitals with a capacity of 151 beds, Investment of $81.4 million, NOI of $1.5 million, and Cash NOI of $1.2 million as of and for the quarter ended September 30, 2015. (2) Excludes the CCRC unconsolidated joint venture reported on page 36. (3) Represents the carrying value of the Company’s equity interest in the respective unconsolidated joint venture as reported on its consolidated balance sheets, which may differ from the capital balance as presented at the joint venture level. — Interest expense and other (7,430) (1,170) Depreciation and amortization 7,575 516 1,198 — Non-cash adjustments to NOI (413) (102) Leasing costs and tenant and capital improvements (2,960) (54) — HCP’s Pro Rata Share: Mortgage debt $ 101,481 $ — $ 67,987 Net (loss) income (623) 1,096 617 FAD 293 1,323 1,148 35 FFO1,096 1,409 1,164 NOI 2,825 1,415 1,835 FAD $ 693 $ 2,172 $ 1,999 Non-cash adjustments to net income (loss)113 —(32) FFO$ 3,953 $ 2,328 $ 2,031 Net (loss) income$ (3,622) $ 1,812 $ 833 General and administrative expenses (421) (10) (54) NOI $ 11,804 $ 2,338 $ 3,255 Joint Venture Results: Medical Office (1) Life Science Senior Housing(2) Total revenues $ 20,822 $ 3,113 $ 8,030 Occupancy %83.9 88.7 96.1 Property count 81 71 4 6 Joint ventures’ mortgage debt 582,438 461,542 —120,896 HCP’s ownership percentage 20% - 67%50% - 63%45% - 72%
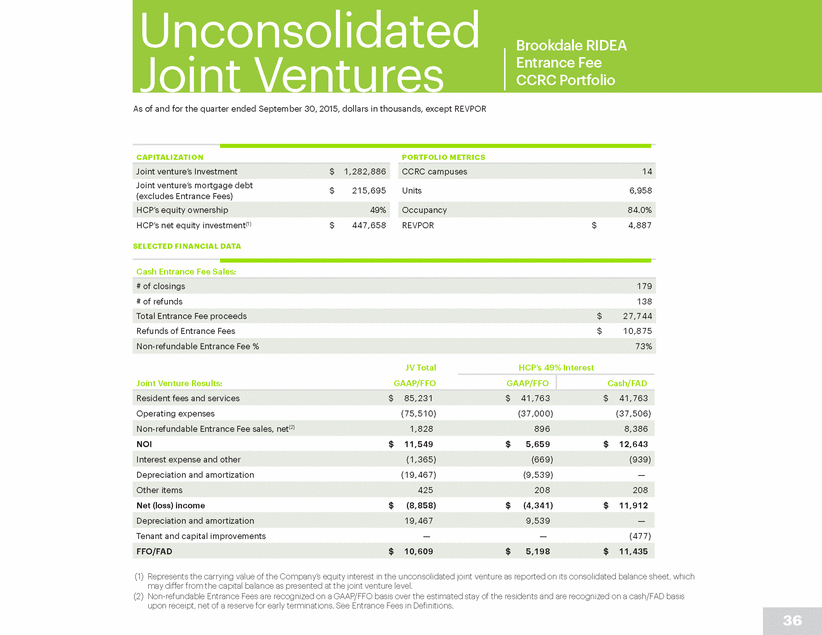
Unconsolidated Joint Ventures Brookdale RIDEA Entrance Fee CCRC Portfolio As of and for the quarter ended September 30, 2015, dollars in thousands, except REVPOR CAPITALIZATION PORTFOLIO METRICS Joint venture’s mortgage debt (excludes Entrance Fees) $ 215,695 Units 6,958 HCP’s net equity investment(1) $ 447,658 REVPOR $ 4,887 SELECTED FINANCIAL DATA Cash Entrance Fee Sales: # of refunds 138 Refunds of Entrance Fees $ 10,875 JV Total HCP’s 49% Interest Operating expenses (75,510) (37,000) (37,506) NOI $ 11,549 $ 5,659 $ 12,643 Depreciation and amortization (19,467) (9,539) — Net (loss) income $ (8,858) $ (4,341) $ 11,912 Tenant and capital improvements — — (477) (1) Represents the carrying value of the Company’s equity interest in the unconsolidated joint venture as reported on its consolidated balance sheet, which may differ from the capital balance as presented at the joint venture level. (2) Non-refundable Entrance Fees are recognized on a GAAP/FFO basis over the estimated stay of the residents and are recognized on a cash/FAD basis upon receipt, net of a reserve for early terminations. See Entrance Fees in Definitions. 36 FFO/FAD $ 10,609 $ 5,198 $ 11,435 Depreciation and amortization 19,467 9,539 — Other items 425 208 208 Interest expense and other (1,365) (669) (939) Non-refundable Entrance Fee sales, net(2) 1,828 896 8,386 Joint Venture Results: GAAP/FFO GAAP/FFO Cash/FAD Resident fees and services $ 85,231 $ 41,763 $ 41,763 Non-refundable Entrance Fee %73% Total Entrance Fee proceeds $ 27,744 # of closings 179 Occupancy 84.0% HCP’s equity ownership 49% CCRC campuses 14 Joint venture’s Investment $ 1,282,886
REP OR TING Definitions Adjusted Fixed Charge Coverage* Adjusted EBITDA divided by Fixed Charges. Adjusted Fixed Charge Coverage is a supplemental measure of liquidity and the Company’s ability to meet its interest payments on outstanding debt and pay dividends to its preferred stockholders, if applicable. The Company’s various debt agreements contain covenants that require the Company to maintain ratios similar to Adjusted Fixed Charge Coverage, and credit rating agencies utilize similar ratios in evaluating and determining the credit rating on certain debt instruments of the Company. Adjusted Fixed Charge Coverage is subject to the same limitations and qualifications as Adjusted EBITDA and Fixed Charges. Annualized Revenues The most recent month’s (or subsequent month’s if acquired in the most recent month) base rent including additional rent floors, cash income from DFLs and/or interest income annualized for 12 months. Annualized Revenues for operating properties under a RIDEA structure are calculated based on the most recent quarter’s NOI annualized for 12 months. Excludes properties sold or held for sale during the quarter. Further, Annualized Revenues do not include tenant recoveries, additional rents in excess of floors and non-cash revenue adjustments (i.e., straight-line rents, amortization of market lease intangibles, DFL interest accretion and deferred revenues). The Company uses Annualized Revenues for the purpose of determining Operator/Tenant Diversification, Lease Expirations and Debt Investment Maturities. Cash Flow Coverage (“CFC”)* Facility EBITDAR or Facility EBITDARM divided by the aggregate of base rent and any additional rent due to the Company for the same period. CFC is a supplemental measure of a property’s ability to generate cash flows for the operator/tenant (not the Company) to meet the operator’s/tenant’s related rent and other obligations to the Company. However, CFC is subject to the same limitations and qualifications as Facility EBITDAR or Facility EBITDARM. CFC is not presented for (i) the disaggregated HCRMC senior housing and post-acute/skilled portfolios, as the combined portfolio is cross-collateralized under a single master lease with a corporate guaranty; (ii) properties operated under a RIDEA structure; or (iii) newly completed facilities under lease-up, facilities acquired or transitioned to new operators during the relevant trailing 12-month period, vacant facilities and facilities for which data is not available or meaningful. Consolidated Debt The carrying amount of bank line of credit and term loans (if applicable), senior unsecured notes, mortgage debt and other debt, as reported in the Company’s consolidated financial statements. Consolidated Gross Assets The carrying amount of total assets, excluding investments in and advances to the Company’s unconsolidated joint ventures, after adding back accumulated depreciation and amortization, as reported in the Company’s consolidated financial statements. Consolidated Secured Debt Mortgage and other debt secured by real estate, as reported in the Company’s consolidated financial statements. Continuing Care Retirement Community (“CCRC”) A senior housing facility which provides at least three levels of care (i.e., independent living, assisted living and skilled nursing). Debt Investments Loans secured by a direct interest in real estate and mezzanine loans. Debt Service The periodic payment of interest expense and principal amortization on secured loans. Debt Service Coverage (“DSC”)* Facility EBITDA divided by Debt Service. DSC is a supplemental measure of the borrower’s ability to generate sufficient liquidity to meet their obligations to the Company under the respective loan agreements. DSC is subject to the same limitations and qualifications as Facility EBITDA. Development Includes ground-up construction and redevelopments. Direct Financing Lease (“DFL”) Lease for which future minimum lease payments are recorded as a receivable, and the difference between the future minimum lease payments and the estimated residual values less the cost of the properties is recorded as unearned income. Unearned income is deferred and amortized to income over the lease terms to provide a constant yield. EBITDA and Adjusted EBITDA* Earnings before interest, taxes, depreciation and amortization for the Company. EBITDA is a supplemental measure of both operating performance and liquidity. Adjusted EBITDA is calculated as EBITDA excluding impairments (recoveries), gains or losses from real estate dispositions, transaction-related items, severance-related charges, litigation settlement charges, gain upon consolidation of joint venture and foreign currency exchange gains (losses). Adjusted EBITDA permits investors to view income from the Company’s operations on an unleveraged basis before the effects of taxes, non-cash depreciation and amortization, impairments, impairment recoveries, and gains or losses from real estate dispositions. By excluding interest expense, EBITDA and Adjusted EBITDA allow investors to measure the Company’s operating performance independent of its capital structure and indebtedness and, therefore, allow for a more meaningful comparison of the Company’s operating performance between quarters as well as annual periods, and to the operating performance of other companies. As a liquidity measure, the Company believes that EBITDA and Adjusted EBITDA help investors analyze the Company’s ability to meet its interest payments on outstanding debt and to make preferred dividend payments (if applicable). EBITDA and Adjusted EBITDA do not reflect the Company’s historical cash expenditures or future cash requirements for capital expenditures or contractual commitments. 37
Entrance Fees Certain of the Company’s communities have residency agreements which require the resident to pay an upfront entrance fee prior to taking occupancy at the community. For GAAP NOI, net income and FFO, the non-refundable portion of the entrance fee is recorded as deferred entrance fee revenue and amortized over the estimated stay of the resident based on an actuarial valuation. For Cash NOI and FAD, the non-refundable entrance fees are recognized upon receipt, net of a reserve for statutory refunds due to early terminations. The refundable portion of a resident’s entrance fee is generally refundable within a certain number of months or days following contract termination or upon the sale of the unit. All refundable amounts due to residents at any time in the future are classified as current liabilities. Facility EBITDA* EBITDA for a particular facility (not the Company), for the trailing twelve months and one quarter in arrears from the date reported. The Company uses Facility EBITDA in determining Debt Service Coverage. Facility EBITDA is subject to the same limitations as EBITDA. In addition, Facility EBITDA does not represent a borrower’s net income or cash flow from operations and should not be considered an alternative to those indicators. The Company receives periodic financial information from borrowers regarding the performance under the loan agreement. The Company utilizes Facility EBITDA as a supplemental measure of the borrower’s ability to generate sufficient liquidity to meet their obligations to the Company. Facility EBITDA includes a management fee as specified in the borrower loan agreements with the Company. All borrower financial performance data was derived solely from information provided by borrowers without independent verification by the Company. Facility EBITDAR and Facility EBITDARM* Earnings before interest, taxes, depreciation, amortization and rent (and management fees (“mgmt fees”)), as applicable, for a particular facility accruing to the operator/tenant of the property (the Company as lessor), for the trailing 12 months and one quarter in arrears from the date reported. The Company uses Facility EBITDAR or Facility EBITDARM in determining Cash Flow Coverage and as a supplemental measure of the ability of the property to generate sufficient liquidity to meet related obligations to the Company. Facility EBITDAR includes (i) contractual management fees, (ii) an imputed management fee of 5% for senior housing facilities and post-acute/skilled facilities, with the exception of the HCRMC portfolio which uses 4% or (iii) an imputed management fee of 2% for hospitals. All facility financial performance data was derived solely from information provided by operators/tenants without independent verification by the Company. Facility EBITDAR and Facility EBITDARM are subject to the same limitations and qualifications as Facility EBITDA. Facility EBITDAR and Facility EBITDARM are not presented for (i) the disaggregated HCRMC senior housing and post-acute/skilled portfolios, as the combined portfolio is cross-collateralized under a single master lease with a corporate guaranty, (ii) properties operated under a RIDEA structure, or (iii) newly completed facilities under lease-up, facilities acquired or transitioned to new operators during the relevant trailing 12-month period, vacant facilities and facilities for which data is not available or meaningful. Financial Leverage* Total Debt divided by Total Gross Assets. Financial Leverage is a supplemental measure of the Company’s financial position, which enables both management and investors to analyze its leverage and to compare its leverage to that of other companies. The ratio of Consolidated Debt to Consolidated Gross Assets is the most directly comparable GAAP measure to Financial Leverage. The Company’s pro rata share of total debt from the Company’s unconsolidated joint ventures is not intended to reflect its actual liability or ability to access assets should there be a default under any or all such loans or a liquidation of the joint ventures. Fixed Charges* Total interest expense plus capitalized interest plus preferred stock dividends (if applicable). Fixed Charges is a supplemental measure of the Company’s interest payments on outstanding debt and dividends to preferred stockholders for purposes of presenting Fixed Charge Coverage and Adjusted Fixed Charge Coverage. Fixed Charges is subject to limitations and qualifications, as, among other things, it does not include all contractual obligations. Funds Available for Distribution (“FAD”)* See the “Funds Available for Distribution” section of the accompanying earnings release for information regarding FAD. Funds From Operations (“FFO”)* See the “Funds From Operations” section of the accompanying earnings release for information regarding FFO and FFO as adjusted. FAD Payout Ratio* Dividends declared per common share divided by diluted FAD per common share for a given period. The FAD Payout Ratio is a supplemental measure of the portion of FAD being declared as dividends to common stockholders. FAD Payout Ratio is subject to the same limitations and qualifications as FAD. REP OR TING Definitions FFO Payout Ratio* Dividends declared per common share divided by diluted FFO or FFO as adjusted per common share for a given period. The ratio is a supplemental measure of the portion of FFO or FFO as adjusted being declared as dividends to common stockholders. The ratio is subject to the same limitations and qualifications as FFO and FFO as adjusted. Healthcare System Affiliated Represents properties that are on-campus or adjacent to a healthcare system and properties that are leased 50% or more to a healthcare system. Investment Represents (i) the carrying amount of real estate assets, including intangibles, after adding back accumulated depreciation and amortization less the value attributable to refundable entrance fee liabilities and (ii) the carrying amount of DFLs and Debt Investments. 38
REP OR TING Definitions Net Debt* Total Debt less the carrying amount of cash and cash equivalents as reported in the Company’s consolidated financial statements and the Company’s pro rata share of cash and cash equivalents from the Company’s unconsolidated joint ventures. Net Debt to Adjusted EBITDA* Net Debt divided by Adjusted EBITDA is a supplemental measure of the Company’s ability to decrease its debt. Because the Company may not be able to use its cash to reduce its debt on a dollar-for-dollar basis, this measure may have material limitations. Pre-CNL Acquisition As of and for the six months ended June 30, 2006 (12 months for Adjusted Fixed Charge Coverage). The Company completed mergers with CNL Retirement Properties, Inc. and CNL Retirement Corp. (collectively, “CNL”) on October 5, 2006, with significant prefunding activities occurring in the quarter ended June 30, 2006. Quality Mix Non-Medicaid revenues as a percentage of total revenues for the trailing 12 months ended one quarter in arrears from the period presented. Redevelopment Properties that require significant capital expenditures (generally more than 25% of acquisition cost or existing basis) to achieve stabilization or to change the use of the properties. Net Operating Income from Continuing Op-erations (“NOI”) and Cash NOI* See the “Net Operating Income and Same Property Performance” section of the accompanying earnings release for information regarding NOI and Cash NOI. Rental and RIDEA Revenues Rental and related revenues, tenant recoveries, resident fees and services, and income from DFLs. Occupancy For life science facilities and medical office buildings, Occupancy represents the percentage of total rentable square feet leased where rental payments have commenced, including month-to-month leases, as of the end of the period reported. For senior housing leased facilities, post-acute/skilled facilities and hospitals, Occupancy represents the facilities’ average operating Occupancy for the trailing three-month and twelve-month periods ended one quarter in arrears from the date reported. For operating properties under a RIDEA structure, Occupancy represents the facilities’ average operating Occupancy for the trailing three-month period presented. The percentages are calculated based on units for senior housing facilities and available beds for post-acute/ skilled facilities and hospitals. The percentages shown exclude newly completed facilities under lease-up, facilities acquired or transitioned to new operators during the relevant period, vacant facilities and facilities for which data is not available or meaningful. All facility financial performance data was derived solely from information provided by operators/tenants and borrowers without independent verification by the Company. Retention Rate The ratio of total renewed square feet to the total square feet expiring and available for lease, excluding the square feet for tenant leases terminated for default or buy-out prior to the expiration of the lease. REVPOR The 3-month average revenue per occupied room for the most recent quarter end. RIDEA A structure whereby a taxable REIT subsidiary is permitted to rent a healthcare facility from its parent REIT and hire an independent contractor to operate the facility. Same Property Portfolio (“SPP”) Stabilized properties that remained in operations and were consistently reported as leased properties or operating properties (RIDEA) for the duration of the year-over-year comparison periods presented excluding assets held for sale. SPP statistics allow management to evaluate the performance of the Company’s real estate portfolio under a consistent population, which eliminates changes in the composition of the Company’s portfolio of properties. Newly acquired operating assets are generally considered stabilized at the earlier of lease-up (typically when the tenant(s) controls the physical use of at least 80% of the space) or 12 months from the acquisition date. Newly completed developments, including redevelopments, are considered stabilized at the earlier of lease-up or 24 months from the date the property is placed in service. SPP NOI excludes certain non-property specific operating expenses that are allocated to each operating segment on a consolidated basis. SPP Cash NOI excludes the effects of foreign exchange rate movements by using the average current period exchange rate to translate from GBP into U.S. dollars for the comparison periods. A property is removed from our SPP when it is sold, placed into redevelopment or changes its reporting structure. Owned Portfolio Represents owned properties subject to operating leases and DFLs, properties operated under a RIDEA structure and Debt Investments, and excludes properties under development, including redevelopment, land held for development and real estate owned by the Company’s unconsolidated joint ventures. Pooled Leases Two or more leases to the same operator/tenant or their subsidiaries under which their obligations are combined by virtue of cross default protection, a pooling agreement or multiple pooling agreements, or cross-guaranties. 39
REP OR TING Definitions Secured Debt Ratio* Total Secured Debt divided by Total Gross Assets. Secured Debt Ratio is a supplemental measure of the Company’s financial position, which enables both management and investors to analyze its leverage and to compare its leverage to that of other companies. The ratio of Consolidated Secured Debt to Consolidated Gross Assets is the most directly comparable GAAP measure to Secured Debt Ratio. The Company’s pro rata share of Total Secured Debt from the Company’s unconsolidated joint ventures is not intended to reflect its actual liability or ability to access assets should there be a default under any or all such loans or a liquidation of the joint ventures. Total Market Equity The total number of outstanding shares of the Company’s common stock multiplied by the closing price per share of its common stock on the New York Stock Exchange as of period end, plus the total number of convertible partnership units multiplied by the closing price per share of its common stock on the New York Stock Exchange as of period end (adjusted for stock splits), plus the total number of outstanding shares of the Company’s preferred stock (if applicable) multiplied by the closing price of its preferred stock on the New York Stock Exchange as of period end. Total Secured Debt Consolidated Secured Debt plus the Company’s pro rata share of mortgage debt from the Company’s unconsolidated joint ventures. Square Feet (Sq. Ft.) The square footage for properties, excluding square footage for development or redevelopment properties prior to completion. Units/Square Feet/Beds Senior housing facilities are measured in available units (e.g., studio, one or two bedroom units). Life science facilities and medical office buildings are measured in square feet. Post-acute/skilled facilities and hospitals are measured in available beds. Total Debt Consolidated Debt plus the Company’s pro rata share of total debt from the Company’s unconsolidated joint ventures. Total Gross Assets* Consolidated Gross Assets plus the Company’s pro rata share of total assets from the Company’s unconsolidated joint ventures and equity interest in HCRMC, after adding back accumulated depreciation and amortization. Yield* Cash NOI divided by Investment. For acquisitions, initial Yields are calculated as projected Cash NOI, 12 months forward, as of the closing date divided by total acquisition cost basis. The total acquisition cost basis includes the initial purchase price, the effects of adjusting assumed debt to market, lease intangible adjustments and all transaction costs. Yield is subject to the same limitations and qualifications as Cash NOI. Total Market Capitalization Total Debt plus Total Market Equity. * Non-GAAP Supplemental Measures The Company believes that net income, as defined by U.S. Generally Accepted Accounting Principles (GAAP), is the most appropriate measure of its operating performance. In addition to net income as defined by GAAP, the Company believes Adjusted Fixed Charge Coverage, CFC, DSC, EBITDA, Adjusted EBITDA, Facility EBITDA, Facility EBITDAR, Facility EBITDARM, Financial Leverage, Fixed Charges, FAD, FAD Payout Ratio, FFO, FFO Payout Ratio, FFO as adjusted, FFO as adjusted Payout Ratio, Net Debt, Net Debt to Adjusted EBITDA, NOI, Cash NOI, Secured Debt Ratio, Total Gross Assets and Yield are useful supplemental non-GAAP measures of its operating performance. As these non-GAAP measures have inherent limitations as analytical tools they should be used in conjunction with the Company’s most directly comparable GAAP presentations and not as alternatives to those indicators determined in accordance with GAAP. Further, the Company’s computations of these non-GAAP measures may not be comparable to similar measures reported by other companies. Historical reconciliations of Adjusted Fixed Charge Coverage, Financial Leverage and Secured Debt Ratio are available in the Company’s Current Reports on Form 8-K filed with the SEC on February 10, 2015 (2014 Metrics), February 11, 2014 (2013 Metrics), February 12, 2013 (2012 metrics), February 14, 2012 (2011 metrics), February 15, 2011 (2010 metrics), February 12, 2010 (2009 metrics), February 10, 2009 (2008 metrics), February 11, 2008 (2008 and 2007 metrics) and July 30, 2007 (Pre-CNL Acquisition metrics). The information in this supplemental information package should be read in conjunction with the accompanying earnings release. 40
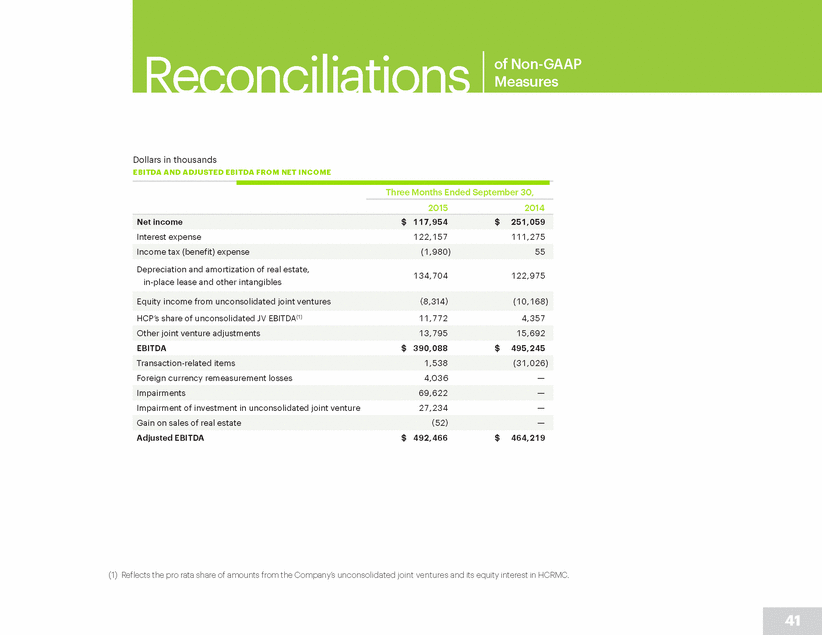
Reconciliations of Non-GAAP Measures Dollars in thousands EBITDA AND ADJUSTED EBITDA FROM NET INCOME Three Months Ended September 30, 2015 2014 Interest expense 122,157 111,275 Depreciation and amortization of real estate, in-place lease and other intangibles 134,704 122,975 HCP’s share of unconsolidated JV EBITDA(1) 11,772 4,357 EBITDA $ 390,088 $ 495,245 Foreign currency remeasurement losses 4,036 — Impairment of investment in unconsolidated joint venture 27,234 — Adjusted EBITDA $ 492,466 $ 464,219 (1) Reflects the pro rata share of amounts from the Company’s unconsolidated joint ventures and its equity interest in HCRMC. 41 Gain on sales of real estate (52)— Impairments69,622 — Transaction-related items 1,538 (31,026) Other joint venture adjustments 13,795 15,692 Equity income from unconsolidated joint ventures (8,314)(10,168) Income tax (benefit) expense (1,980) 55 Net income$ 117,954 $ 251,059
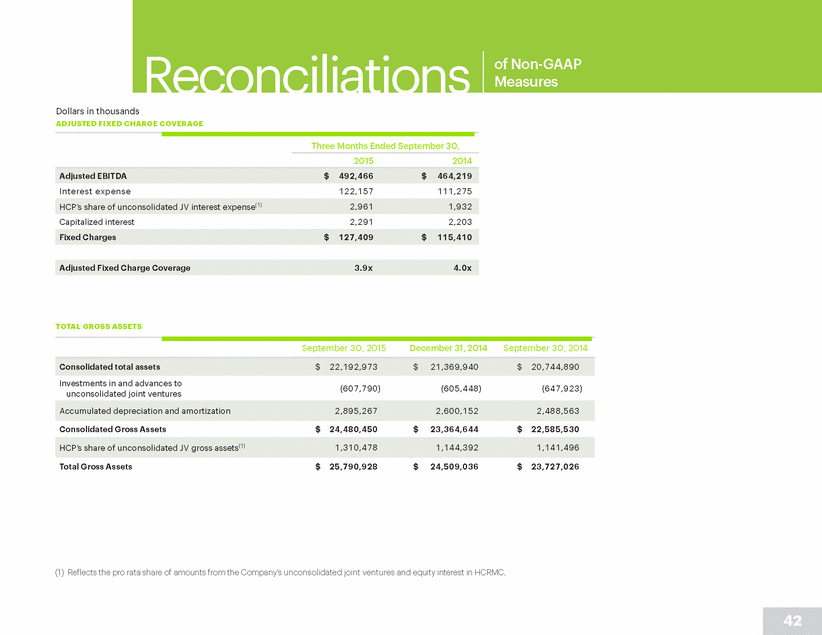
Reconciliations of Non-GAAP Measures Dollars in thousands ADJUSTED FIXED CHARGE COVERAGE Three Months Ended September 30, 2015 2014 Interest expense 122,157 111,275 Capitalized interest 2,291 2,203 TOTAL GROSS ASSETS September 30, 2015 December 31, 2014 September 30, 2014 Investments in and advances to unconsolidated joint ventures (607,790) (605,448) (647,923) Consolidated Gross Assets $ 24,480,450 $ 23,364,644 $ 22,585,530 Total Gross Assets $ 25,790,928 $ 24,509,036 $ 23,727,026 (1) Reflects the pro rata share of amounts from the Company’s unconsolidated joint ventures and equity interest in HCRMC. 42 HCP’s share of unconsolidated JV gross assets(1) 1,310,478 1,144,392 1,141,496 Accumulated depreciation and amortization 2,895,267 2,600,152 2,488,563 Consolidated total assets $ 22,192,973 $ 21,369,940 $ 20,744,890 Adjusted Fixed Charge Coverage 3.9x 4.0x Fixed Charges $ 127,409 $ 115,410 HCP’s share of unconsolidated JV interest expense(1) 2,961 1,932 Adjusted EBITDA$ 492,466 $ 464,219
COMPANY Information Board of Directors Michael D. McKee Chairman of the Board, HCP, Inc. and Chief Executive Officer, Bentall Kennedy U.S., L.P. James P. Hoffmann Former Partner and Senior Vice President Wellington Management Company Brian G. Cartwright Senior Advisor Patomak Global Partners LLC Lauralee E. Martin President and Chief Executive Officer HCP, Inc. Christine N. Garvey Former Global Head of Corporate Real Estate Services, Deutsche Bank AG Peter L. Rhein General Partner Sarlot & Rhein David B. Henry Vice Chairman and Chief Executive Officer Kimco Realty Corporation Joseph P. Sullivan Chairman Emeritus of the Board of Advisors RAND Health Senior Management Lauralee E. Martin President and Chief Executive Officer Darren A. Kowalske Senior Vice President Hospitals/Post-Acute Jonathan M. Bergschneider Executive Vice President Life Science Estates James W. Mercer Executive Vice President, Chief Administrative Officer, General Counsel and Corporate Secretary J. Justin Hutchens Executive Vice President and Chief Investment Officer - Senior Housing and Care Timothy M. Schoen Executive Vice President and Chief Financial Officer Thomas D. Kirby Executive Vice President Acquisitions and Valuations John D. Stasinos Senior Vice President International Thomas M. Klaritch Executive Vice President Medical Office Properties Kendall K. Young Executive Vice President Senior Housing 43
Physicians Park Nashville, TN Forward Looking Statements & Risk Factors “Safe Harbor” Statement under the Private Securities Litigation Reform Act of 1995: The statements contained in this supplemental report which are not historical facts are forward-looking statements within the meaning of Section 27A of the Securities Act of 1933, as amended, and Section 21E of the Securities Exchange Act of 1934, as amended. These statements include, among other things, the Company’s expectations regarding (i) completion dates, stabilization dates, rentable square feet and total investment for development projects in progress, (ii) rentable square feet for land held for development, and (iii) HCRMC’s facility level EBITDAR coverage and HCRMC OpCo FCC. These statements are made as of the date hereof, are not guarantees of future performance and are subject to known and unknown risks, uncertainties, assumptions and other factors—many of which are out of the Company’s and its management’s control and difficult to forecast—that could cause actual results to differ materially from those set forth in or implied by such forward-looking statements. These risks and uncertainties include but are not limited to: risks relating to the Company’s reliance on a concentration of a small number of tenants and operators for a significant portion of its revenues; the financial weakness of tenants and operators, including potential bankruptcies, significant litigation exposure and downturns in their businesses, which results in uncertainties regarding the Company’s ability to continue to realize the full benefit of such tenants’ and/or operators’ leases or loans; the ability of the Company’s tenants and operators to conduct their respective businesses in a manner sufficient to maintain or increase their revenues and to generate sufficient income to make rent and loan payments to the Company and the Company’s ability to recover investments made, if applicable, in their operations; competition for tenants and operators, including with respect to new leases and mortgages and the renewal or rollover of existing leases; availability of suitable properties to acquire at favorable prices and the competition for the acquisition and financing of those properties; the Company’s ability to negotiate the same or better terms with new tenants or operators if existing leases are not renewed or the Company exercises its right to replace an existing tenant or operator upon default; the risks associated with the Company’s investments in joint ventures and unconsolidated entities, including its lack of sole decision making authority and reliance on its partners’ financial condition and continued cooperation; the risk that the Company may not be able to achieve the benefits of investments within expected time frames or at all, or within expected cost projections; the potential impact of future litigation matters, including the possibility of larger than expected litigation costs, adverse results and related developments; the effect on healthcare providers of legislation addressing entitlement programs and related services, including Medicare and Medicaid, which may result in future reductions in reimbursements; changes in federal, state or local laws and regulations, including those affecting the healthcare industry that affect the Company’s costs of compliance or increase the costs, or otherwise affect the operations, of its tenants and operators; volatility or uncertainty in the capital markets, the availability and cost of capital as impacted by Continued 44
2201 Medical Plaza Nashville, TN Forward Looking Statements & Risk Factors (Continued) interest rates, changes in the Company’s credit ratings, and the value of its common stock, and other conditions that may adversely impact the Company’s ability to fund its obligations or consummate transactions, or reduce the earnings from potential transactions; changes in global, national and local economic conditions, and currency exchange rates; changes in the credit ratings on U.S. government debt securities or default or delay in payment by the U.S. of its obligations; the Company’s ability to manage its indebtedness level and changes in the terms of such indebtedness; and the Company’s ability to maintain its qualification as a real estate investment trust; and other risks and uncertainties described from time to time in the Company’s Securities and Exchange Commission (SEC) filings. The Company assumes no, and hereby disclaims any, obligation to update any of the foregoing or any other forward-looking statements as a result of new information or new or future developments, except as otherwise required by law. The information in this supplemental information package should be read in conjunction with the Company’s Annual Reports on Form 10-K, Quarterly Reports on Form 10-Q, Current Reports on Form 8-K and other information filed with the SEC. The Reporting Definitions and Reconciliations of Non-GAAP Measures are an integral part of the information presented herein. On the Company’s website, www.hcpi.com, you can access, free of charge, its Annual Reports on Form 10-K, Quarterly Reports on Form 10-Q, and Current Reports on Form 8-K, and amendments to those reports filed or furnished pursuant to Section 13(a) or 15(d) of the Exchange Act as soon as reasonably practicable after such material is electronically filed with, or furnished to, the SEC. The information contained on the Company’s website is not incorporated by reference into, and should not be considered a part of, this supplemental information package. In addition, the SEC maintains a website that contains reports, proxy and information statements, and other information regarding issuers, including HCP, that file electronically with the SEC at www.sec.gov. For more information, contact Timothy M. Schoen, Executive Vice President and Chief Financial Officer, at (949) 407-0400. 45
our commitment STRATEGY EXECUTION RESULTS Corporate Headquarters 1920 Main Street, Suite 1200 Irvine, CA 92614 (949) 407-0700 London Office 24 Berkeley Square London, WIJ 6HE Los Angeles Office 11150 Santa Monica Boulevard, Suite 1600 Los Angeles, CA 90025 Nashville Office 3000 Meridian Boulevard, Suite 200 Franklin, TN 37067 San Francisco Office 950 Tower Lane, Suite 1650 Foster City, CA 94404 46