Attached files
| file | filename |
|---|---|
| 8-K - FORM 8-K - CIT GROUP INC | e66771-8k.htm |
| EX-99.1 - PRESS RELEASE - CIT GROUP INC | e66771ex99-1.htm |
Exhibit 99.2
Third Quarter 2015 Financial Results November 3, 2015
1 Important Notices This presentation contains forward - looking statements within the meaning of applicable federal securities laws that are based upon our current expectations and assumptions concerning future events, which are subject to a number of risks and uncertainties that could cause actual results to differ materially from those anticipated . The words “expect,” “anticipate,” “estimate,” “forecast,” “initiative,” “objective,” “plan,” “goal,” “project,” “outlook,” “priorities,” “target,” “intend,” “evaluate,” “pursue,” “commence,” “seek,” “may,” “would,” “could,” “should,” “believe,” “potential,” and “continue,” or the negative of any of those words or similar expressions are intended to identify forward - looking statements . All statements contained in this presentation, other than statements of historical fact, including without limitation, statements about our plans, strategies, prospects and expectations regarding future events and our financial performance, are forward - looking statements that involve certain risks and uncertainties . While these statements represent our current judgment on what the future may hold, and we believe these judgments are reasonable, these statements are not guarantees of any events or financial results, and our actual results may differ materially . Important factors that could cause our actual results to be materially different from our expectations include, among others, the risk that CIT is unsuccessful in implementing its strategy and business plan, the risk that CIT is unable to react to and address key business and regulatory issues, the risk that CIT is unable to achieve the projected revenue growth from its new business initiatives or the projected expense reductions from efficiency improvements, and the risk that CIT becomes subject to liquidity constraints and higher funding costs . We describe these and other risks that could affect our results in Item 1 A, “Risk Factors,” of our latest Annual Report on Form 10 - K for the year ended December 31 , 2014 , which was filed with the Securities and Exchange Commission . Accordingly, you should not place undue reliance on the forward - looking statements contained in this presentation . These forward - looking statements speak only as of the date on which the statements were made . CIT undertakes no obligation to update publicly or otherwise revise any forward - looking statements, except where expressly required by law . This presentation is to be used solely as part of CIT management’s continuing investor communications program . This presentation shall not constitute an offer or solicitation in connection with any securities . | 3Q15 Earnings
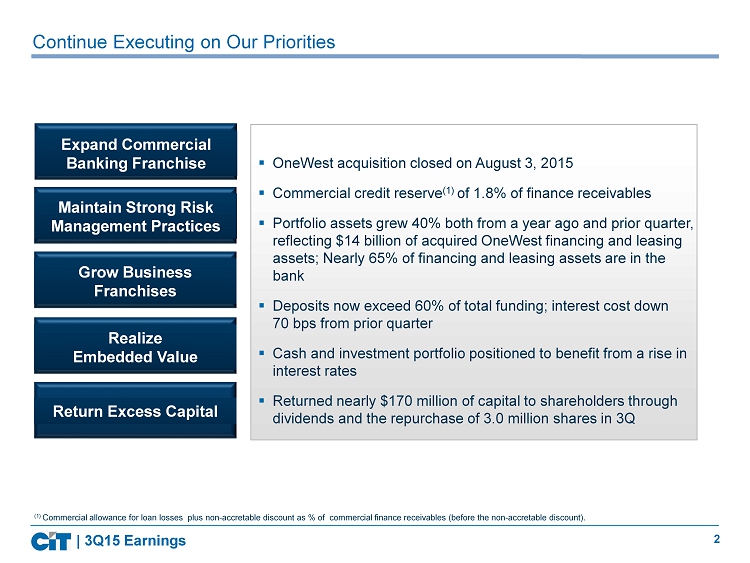
2 Continue Executing on Our Priorities ▪ OneWest acquisition closed on August 3, 2015 ▪ Commercial credit reserve (1) of 1.8% of finance receivables ▪ Portfolio assets grew 40% both from a year ago and prior quarter, reflecting $14 billion of acquired OneWest financing and leasing assets; Nearly 65% of financing and leasing assets are in the bank ▪ Deposits now exceed 60% of total funding; interest cost down 70 bps from prior quarter ▪ Cash and investment portfolio positioned to benefit from a rise in interest rates ▪ Returned nearly $170 million of capital to shareholders through dividends and the repurchase of 3.0 million shares in 3Q Expand Commercial Banking Franchise Maintain Strong Risk Management Practices Grow Business Franchises Realize Embedded Value Return Excess Capital | 3Q15 Earnings (1) Commercial allowance for loan losses plus non - accretable discount as % of commercial finance receivables (before the non - accretable discount).
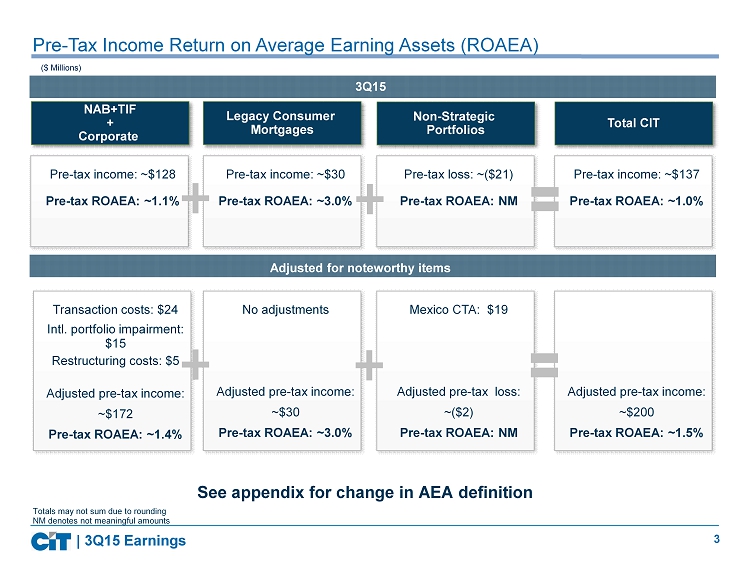
3 Pre - Tax Income Return on Average Earning Assets (ROAEA) Totals may not sum due to rounding NM denotes not meaningful amounts ($ Millions) NAB+TIF + Corporate Non - Strategic Portfolios Total CIT 3Q15 Pre - tax income: ~$128 Pre - tax ROAEA: ~1.1% Pre - tax loss: ~($21) Pre - tax ROAEA: NM Pre - tax income: ~$137 Pre - tax ROAEA: ~1.0% | 3Q15 Earnings Legacy Consumer Mortgages Pre - tax income: ~$30 Pre - tax ROAEA: ~3.0% Adjusted for noteworthy items Transaction costs: $24 Intl. portfolio impairment: $15 Restructuring costs: $5 Adjusted pre - tax income: ~$172 Pre - tax ROAEA: ~1.4% Mexico CTA: $ 1 9 Adjusted pre - tax loss: ~($2) Pre - tax ROAEA: NM No adjustments Adjusted pre - tax income: ~$30 Pre - tax ROAEA: ~3.0% Adjusted pre - tax income: ~$200 Pre - tax ROAEA: ~1.5% See appendix for change in AEA definition
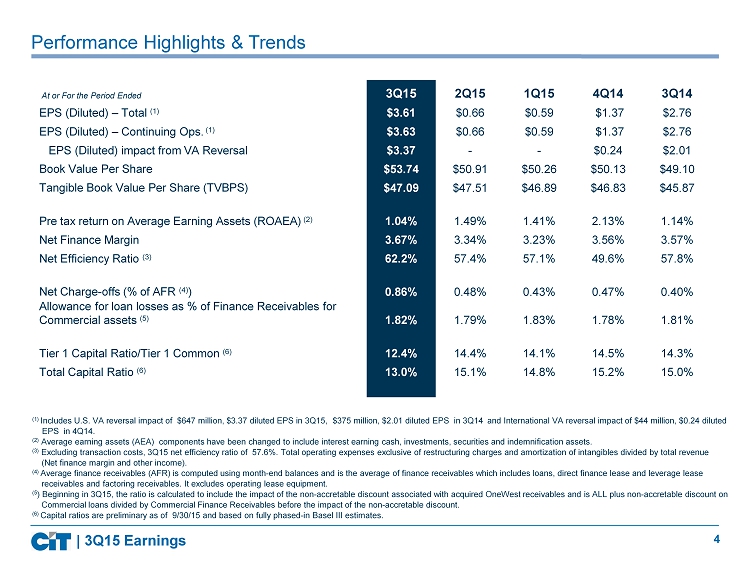
4 (1) Includes U.S . VA reversal impact of $647 million, $3.37 diluted EPS in 3Q15, $375 million, $2.01 diluted EPS in 3Q14 and International VA reversal impact of $4 4 million, $0.24 diluted EPS in 4Q14. (2) Average earning assets (AEA) components have been changed to include interest earning cash, investments, securities and indemnification assets. (3) Excluding transaction costs, 3Q15 net efficiency ratio of 57.6%. Total operating expenses exclusive of restructuring charges and amortization of intangibles divided by total revenue (Net finance margin and other income). (4) Average finance receivables (AFR) is computed using month - end balances and is the average of finance receivables which includes loans, direct finance lease and leverage lease receivables and factoring receivables. It excludes operating lease equipment. (5 ) Beginning in 3Q15 , the ratio is calculated to include the impact of the non - accretable discount associated with acquired OneWest receivables and is ALL plus non - accretable discount on Commercial loans divided by Commercial Finance Receivables before the impact of the non - accretable discount. (6) Capital ratios are preliminary as of 9/30/15 and based on fully phased - in Basel III estimates. At or For the Period Ended 3Q15 2Q15 1Q15 4Q14 3Q14 EPS (Diluted) – Total (1) $3.61 $0.66 $0.59 $1.37 $2.76 EPS (Diluted) – Continuing Ops. (1) $3.63 $0.66 $0.59 $1.37 $2.76 EPS (Diluted) impact from VA Reversal $3.37 - - $0.24 $2.01 Book Value Per Share $53.74 $50.91 $50.26 $50.13 $49.10 Tangible Book Value Per Share (TVBPS) $47.09 $47.51 $46.89 $46.83 $45.87 Pre tax return on Average Earning Assets (ROAEA) (2) 1.04% 1.49% 1.41% 2.13% 1.14% Net Finance Margin 3.67% 3.34% 3.23% 3.56% 3.57% Net Efficiency Ratio (3) 62.2% 57.4% 57.1% 49.6% 57.8% Net Charge - offs (% of AFR (4) ) 0.86% 0.48% 0.43% 0.47% 0.40% Allowance for loan losses as % of Finance Receivables for Commercial assets (5) 1.82% 1.79% 1.83% 1.78% 1.81% Tier 1 Capital Ratio/Tier 1 Common (6) 12.4% 14.4% 14.1% 14.5% 14.3% Total Capital Ratio (6) 13.0% 15.1% 14.8% 15.2% 15.0% Performance Highlights & Trends | 3Q15 Earnings
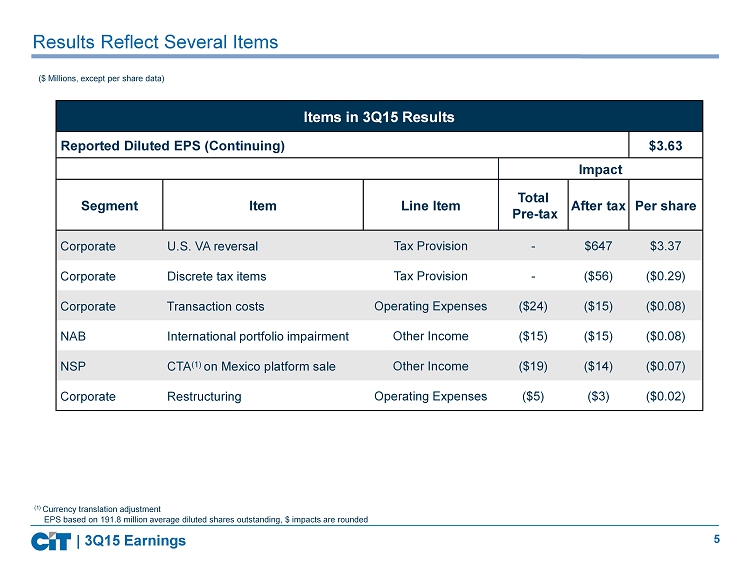
5 ($ Millions, except per share data) Results Reflect Several Items Items in 3Q15 Results Reported Diluted EPS (Continuing) $3.63 Impact Segment Item Line Item Total Pre - tax After tax Per share Corporate U.S. VA reversal Tax Provision - $647 $3.37 Corporate Discrete tax items Tax Provision - ($56) ($0.29) Corporate Transaction costs Operating Expenses ($24) ($15) ($0.08) NAB International portfolio impairment Other Income ($15) ($15) ($0.08) NSP CTA (1) on Mexico platform sale Other Income ($19) ($14) ($0.07) Corporate Restructuring Operating Expenses ($5) ($3) ($0.02) EPS based on 191.8 million average diluted shares outstanding, $ impacts are rounded | 3Q15 Earnings (1) Currency translation adjustment
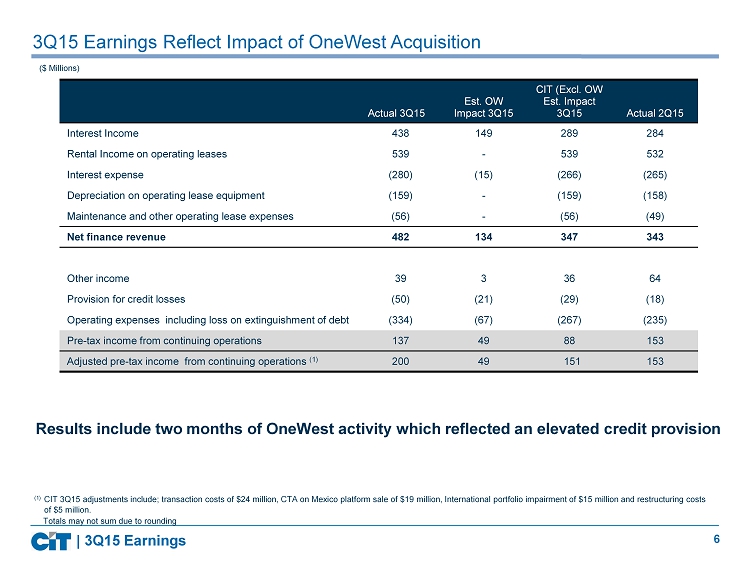
6 3Q15 Earnings Reflect Impact of OneWest Acquisition | 3Q15 Earnings Actual 3Q15 Est. OW Impact 3Q15 CIT (Excl. OW Est. Impact 3Q15 Actual 2Q15 Interest Income 438 149 289 284 Rental Income on operating leases 539 - 539 532 Interest expense (280) (15) (266) (265) Depreciation on operating lease equipment (159) - (159) (158) Maintenance and other operating lease expenses (56) - (56) (49) Net finance revenue 482 134 347 343 Other income 39 3 36 64 Provision for credit losses (50) (21) (29) (18) Operating expenses including loss on extinguishment of debt (334) (67) (267) (235) Pre - tax income from continuing operations 137 49 88 153 Adjusted pre - tax income from continuing operations (1) 200 49 151 153 ($ Millions) (1) CIT 3Q15 adjustments include; transaction costs of $24 million, CTA on Mexico platform sale of $19 million, International portfolio impairment of $15 million and restructuring costs of $5 million. Results include two months of OneWest activity which reflected an elevated credit provision Totals may not sum due to rounding
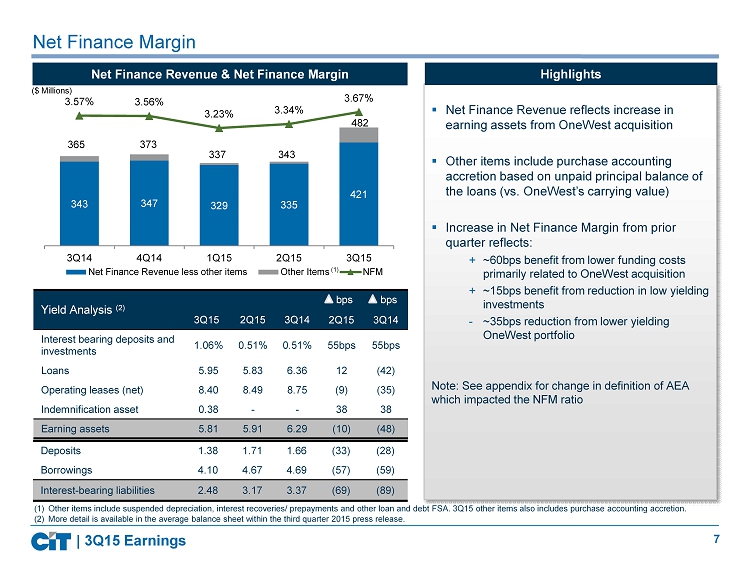
7 ▪ Net Finance Revenue reflects increase in earning assets from OneWest acquisition ▪ Other items include purchase accounting accretion based on unpaid principal balance of the loans (vs. OneWest’s carrying value) ▪ Increase in Net Finance Margin from prior quarter reflects: + ~60bps benefit from lower funding costs primarily related to OneWest acquisition + ~ 15bps benefit from reduction in low yielding investments - ~35bps reduction from lower yielding OneWest portfolio Note: See appendix for change in definition of AEA which impacted the NFM ratio 343 347 329 335 421 3.57% 3.56% 3.23% 3.34% 3.67% 3Q14 4Q14 1Q15 2Q15 3Q15 Net Finance Revenue less other items Other Items NFM Net Finance Margin ($ Millions) Yield Analysis (2) 3Q15 2Q15 3Q14 bps 2Q15 bps 3Q14 Interest bearing deposits and investments 1.06% 0.51% 0.51% 55bps 55bps Loans 5.95 5.83 6.36 12 (42) Operating leases (net) 8.40 8.49 8.75 (9) (35) Indemnification asset 0.38 - - 38 38 Earning assets 5.81 5.91 6.29 (10) (48) Deposits 1.38 1.71 1.66 (33) (28) Borrowings 4.10 4.67 4.69 (57) (59) Interest - bearing liabilities 2.48 3.17 3.37 (69) (89) | 3Q15 Earnings Net Finance Revenue & Net Finance Margin 365 373 337 343 482 (1) Other items include suspended depreciation, interest recoveries/ prepayments and other loan and debt FSA. 3Q15 other items also includes purchase accounting accretion. (2) More detail is available in the average balance sheet within the third quarter 2015 press release. (1) Highlights
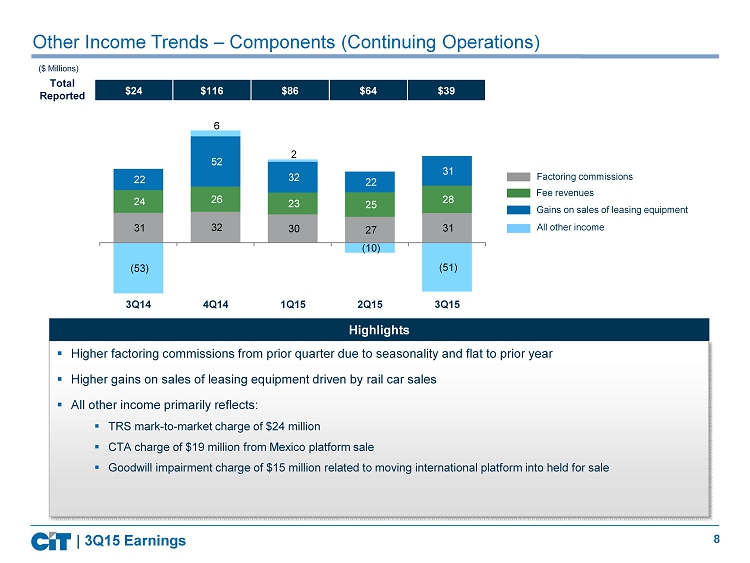
8 31 32 30 27 31 24 26 23 25 28 22 52 32 22 31 (53) 6 2 (10) (51) -55 -30 -5 20 45 70 95 120 145 Other Income Trends – Components (Continuing Operations) Factoring commissions Fee revenues Gains on sales of leasing equipment All other income ($ Millions) 3 Q14 1 Q15 2Q 15 3 Q15 4 Q14 Total Reported | 3Q15 Earnings ▪ Higher factoring commissions from prior quarter due to seasonality and flat to prior year ▪ Higher gains on sales of leasing equipment driven by rail car sales ▪ All other income primarily reflects: ▪ TRS mark - to - market charge of $24 million ▪ CTA charge of $19 million from Mexico platform sale ▪ Goodwill impairment charge of $15 million related to moving international platform into held for sale Highlights $24 $116 $86 $64 $39
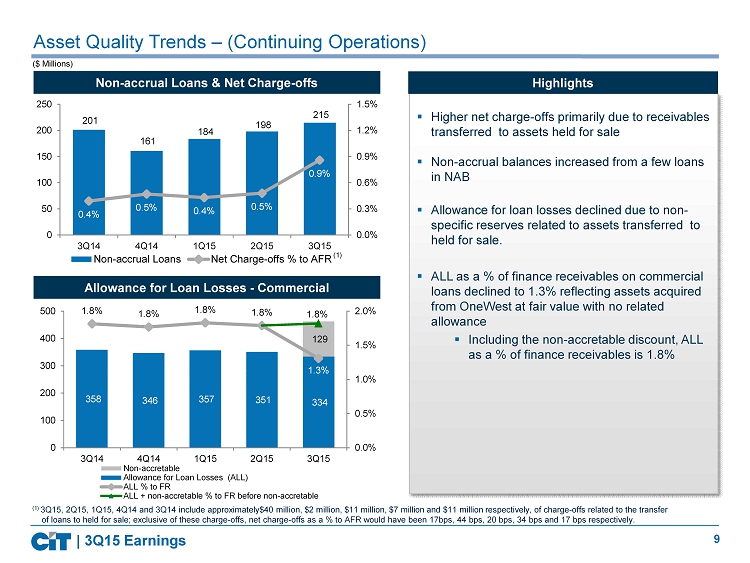
9 Asset Quality Trends – ( Continuing Operations) ($ Millions) 201 161 184 198 215 0.4% 0.5% 0.4% 0.5% 0.9% 0.0% 0.3% 0.6% 0.9% 1.2% 1.5% 0 50 100 150 200 250 3Q14 4Q14 1Q15 2Q15 3Q15 Non-accrual Loans Net Charge-offs % to AFR 358 346 357 351 334 129 1.8% 1.8% 1.8% 1.8% 1.3% 1.8% 0.0% 0.5% 1.0% 1.5% 2.0% 0 100 200 300 400 500 3Q14 4Q14 1Q15 2Q15 3Q15 Non-accretable Allowance for Loan Losses (ALL) ALL % to FR ALL + non-accretable % to FR before non-accretable (1) (1) 3Q15, 2Q15, 1Q15, 4Q14 and 3Q14 include approximately$40 million, $ 2 million, $11 million, $7 million and $11 million respectively, of charge - offs related to the transfer of loans to held for sale; exclusive of these charge - offs, net charge - offs as a % to AFR would have been 17bps, 44 bps, 20 bps, 34 bps and 17 bps respectively. | 3Q15 Earnings Non - accrual Loans & Net Charge - offs Allowance for Loan Losses - Commercial ▪ Higher net charge - offs primarily due to receivables transferred to assets held for sale ▪ Non - accrual balances increased from a few loans in NAB ▪ Allowance for loan losses declined due to non - specific reserves related to assets transferred to held for sale. ▪ ALL as a % of finance receivables on commercial loans declined to 1.3% reflecting assets acquired from OneWest at fair value with no related allowance ▪ Including the non - accretable discount, ALL as a % of finance receivables is 1.8% Highlights
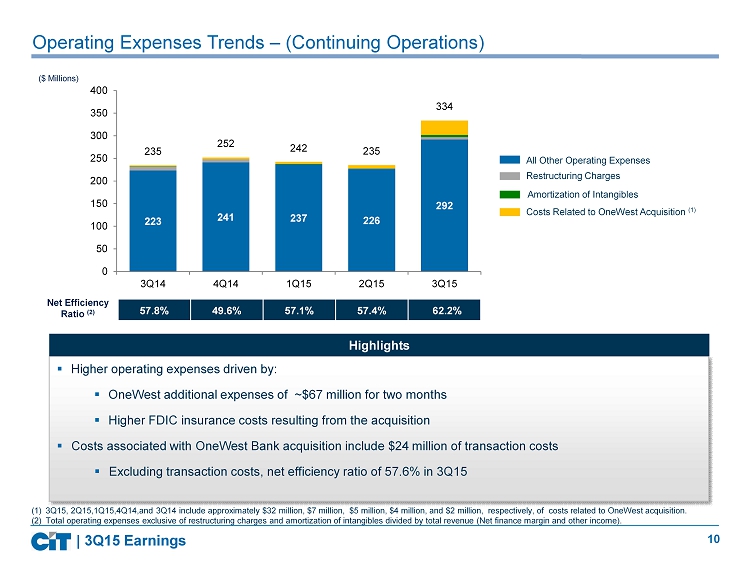
10 Restructuring Charges All Other Operating Expenses Costs Related to OneWest Acquisition Amortization of Intangibles 223 241 237 226 292 235 252 242 235 334 0 50 100 150 200 250 300 350 400 3Q14 4Q14 1Q15 2Q15 3Q15 Operating Expenses Trends – (Continuing Operations) ($ Millions) (1) 3Q15, 2Q15,1Q15,4Q14,and 3Q14 include approximately $32 million, $7 million, $ 5 million, $4 million, and $ 2 million, respectively, of costs related to OneWest acquisition. (2) Total operating expenses exclusive of restructuring charges and amortization of intangibles divided by total revenue (Net finance margin and other income). (1) | 3Q15 Earnings ▪ Higher operating expenses driven by: ▪ OneWest additional expenses of ~$67 million for two months ▪ Higher FDIC insurance costs resulting from the acquisition ▪ Costs associated with OneWest Bank acquisition include $24 million of transaction costs ▪ Excluding transaction costs, net efficiency ratio of 57.6% in 3Q15 Highlights 57.8% 49.6% 57.1% 57.4% 62.2% Net Efficiency Ratio (2)
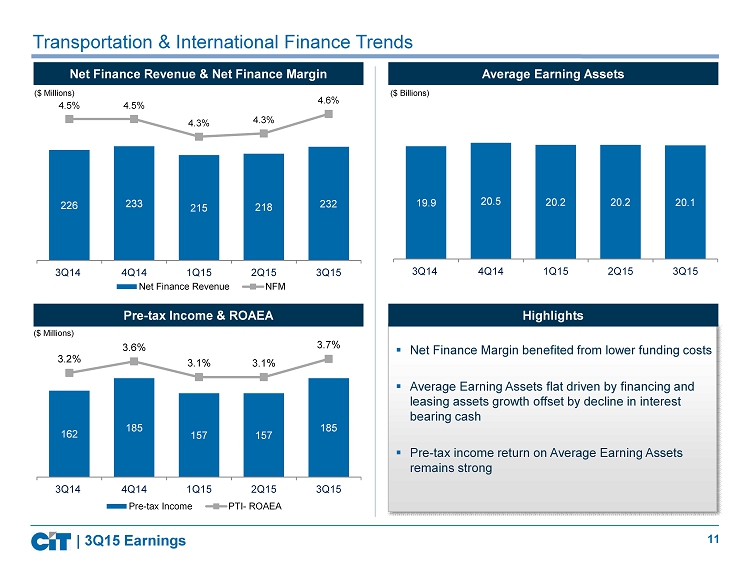
11 226 233 215 218 232 4.5% 4.5% 4.3% 4.3% 4.6% 3Q14 4Q14 1Q15 2Q15 3Q15 Net Finance Revenue NFM 162 185 157 157 185 3.2% 3.6% 3.1% 3.1% 3.7% 3Q14 4Q14 1Q15 2Q15 3Q15 Pre-tax Income PTI- ROAEA Transportation & International Finance Trends 19.9 20.5 20.2 20.2 20.1 3Q14 4Q14 1Q15 2Q15 3Q15 ($ Millions) ($ Billions) | 3Q15 Earnings Pre - tax Income & ROAEA Average Earning Assets Net Finance Revenue & Net Finance Margin ($ Millions) ▪ Net Finance Margin benefited from lower funding costs ▪ Average Earning Assets flat driven by financing and leasing assets growth offset by decline in interest bearing cash ▪ Pre - tax income return on Average Earning Assets remains strong Highlights
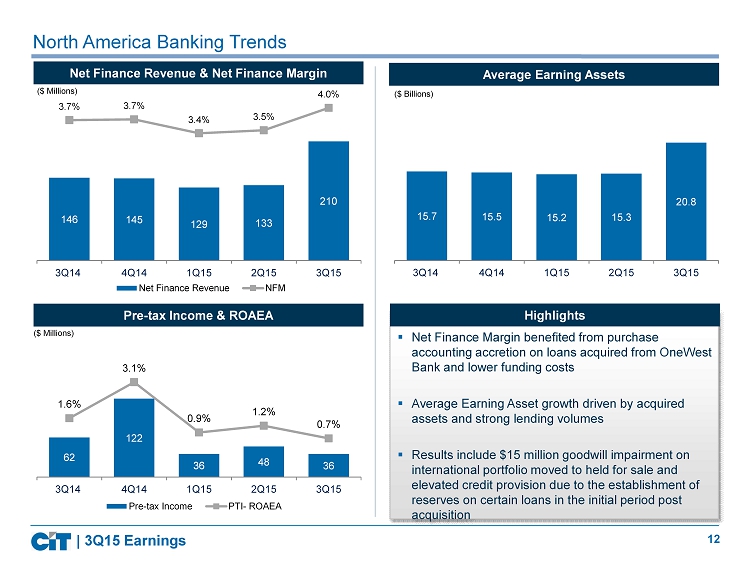
12 62 122 36 48 36 1.6% 3.1% 0.9% 1.2% 0.7% 3Q14 4Q14 1Q15 2Q15 3Q15 Pre-tax Income PTI- ROAEA 146 145 129 133 210 3.7% 3.7% 3.4% 3.5% 4.0% 3Q14 4Q14 1Q15 2Q15 3Q15 Net Finance Revenue NFM North America Banking Trends 15.7 15.5 15.2 15.3 20.8 3Q14 4Q14 1Q15 2Q15 3Q15 ($ Millions) ($ Billions) | 3Q15 Earnings Pre - tax Income & ROAEA Average Earning Assets Net Finance Revenue & Net Finance Margin ($ Millions) ▪ Net Finance Margin benefited from purchase accounting accretion on loans acquired from OneWest Bank and lower funding costs ▪ Average Earning Asset growth driven by acquired assets and strong lending volumes ▪ Results include $15 million goodwill impairment on international portfolio moved to held for sale and elevated credit provision due to the establishment of reserves on certain loans in the initial period post acquisition Highlights
13 APPENDIX | 3Q15 Earnings
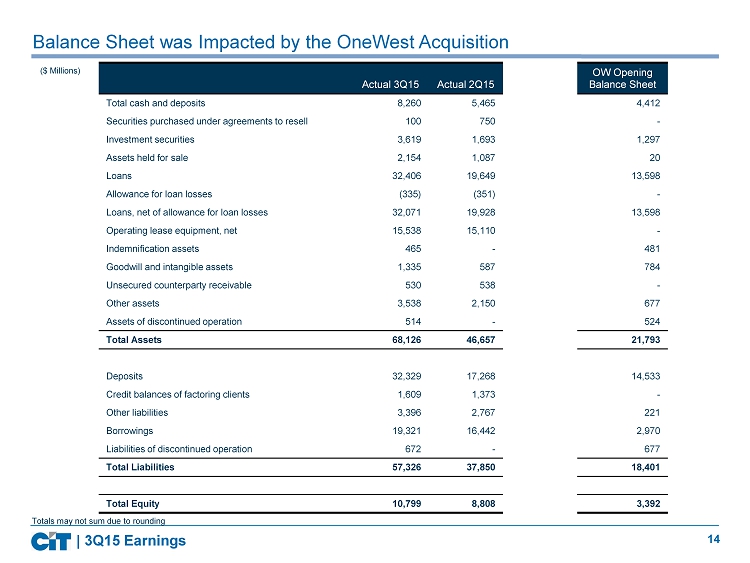
14 Balance Sheet was Impacted by the OneWest Acquisition | 3Q15 Earnings Actual 3Q15 Actual 2Q15 OW Opening Balance Sheet Total cash and deposits 8,260 5,465 4,412 Securities purchased under agreements to resell 100 750 - Investment securities 3,619 1,693 1,297 Assets held for sale 2,154 1,087 20 Loans 32,406 19,649 13,598 Allowance for loan losses (335) (351) - Loans, net of allowance for loan losses 32,071 19,928 13,598 Operating lease equipment, net 15,538 15,110 - Indemnification assets 465 - 481 Goodwill and intangible assets 1,335 587 784 Unsecured counterparty receivable 530 538 - Other assets 3,538 2,150 677 Assets of discontinued operation 514 - 524 Total Assets 68,126 46,657 21,793 Deposits 32,329 17,268 14,533 Credit balances of factoring clients 1,609 1,373 - Other liabilities 3,396 2,767 221 Borrowings 19,321 16,442 2,970 Liabilities of discontinued operation 672 - 677 Total Liabilities 57,326 37,850 18,401 Total Equity 10,799 8,808 3,392 ($ Millions) Totals may not sum due to rounding
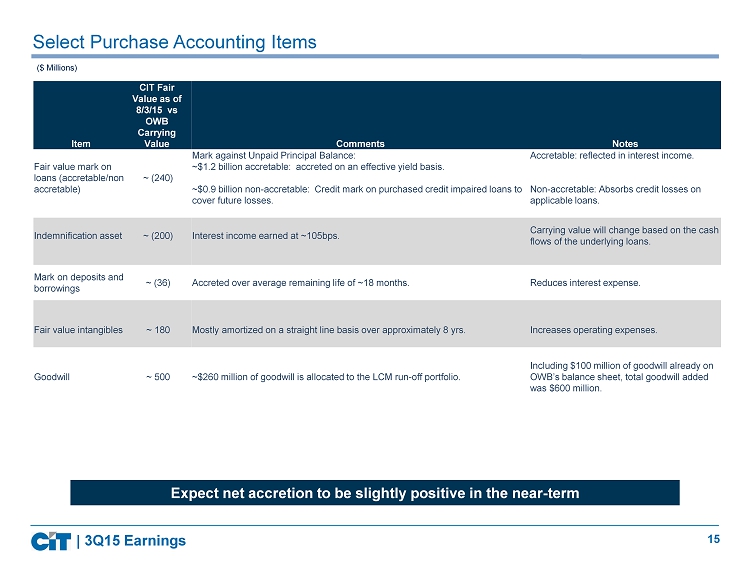
15 Select Purchase Accounting Items | 3Q15 Earnings ($ Millions) Expect net accretion to be slightly positive in the near - term Item CIT Fair Value as of 8/3/15 vs OWB Carrying Value Comments Notes Fair value mark on loans ( accretable /non accretable ) ~ (240) Mark against Unpaid Principal Balance: ~$1.2 billion accretable : accreted on an effective yield basis. ~$0.9 billion non - accretable : Credit mark on purchased credit impaired loans to cover future losses. Accretable : reflected in interest income. Non - accretable : Absorbs credit losses on applicable loans. Indemnification asset ~ (200) Interest income earned at ~105bps. Carrying value will change based on the cash flows of the underlying loans. Mark on deposits and borrowings ~ (36) Accreted over average remaining life of ~18 months. Reduces interest expense. Fair value intangibles ~ 180 Mostly amortized on a straight line basis over approximately 8 yrs . Increases operating expenses. Goodwill ~ 500 ~$ 260 million of goodwill is allocated to the LCM run - off portfolio. Including $100 million of goodwill already on OWB’s balance sheet, total goodwill added was $600 million.

16 Average Earning Assets (AEA) – Updated Definition | 3Q15 Earnings 3Q15 2Q15 1Q15 4Q14 3Q14 AEA - 34,098 33,772 34,346 34,295 NFM - 4.02% 4.00% 4.34% 4.26% Provision for Credit Losses - (0.22%) (0.41%) (0.17%) (0.45%) Other Income - 0.74% 1.02% 1.36% 0.28% Operating expenses - (2.76%) (2.86%) (2.93%) (2.74%) Pre - tax Income - 1.80% 1.75% 2.59% 1.36% AEA Components New Old Finance Receivables Operating Leases Assets Held For Sale Credit Balances of Factoring Clients Interest - bearing Cash Investment Securities Securities purchased under agreements to resell Indemnification Assets Metrics (Old AEA) 3Q15 2Q15 1Q15 4Q14 3Q14 AEA 52,448 41,113 41,796 41,861 40,949 NFM 3.67% 3.34% 3.23% 3.56% 3.57% Provision for Credit Losses (0.38%) (0.18%) (0.33%) (0.14%) (0.37%) Other Income 0.30% 0.62% 0.83% 1.08% 0.24% Operating expenses (2.55%) (2.29%) (2.31%) (2.38%) (2.29%) Pre - tax Income 1.04% 1.49% 1.41% 2.13% 1.14% Metrics (New AEA)
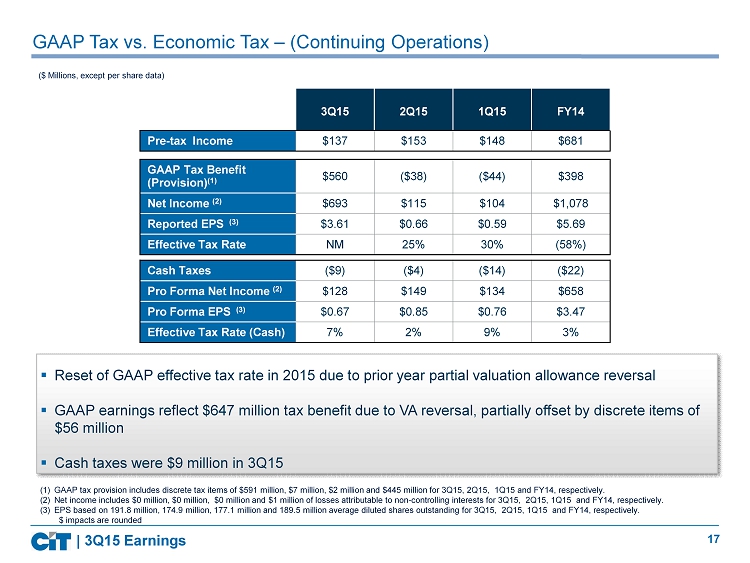
17 GAAP Tax vs. Economic Tax – (Continuing Operations ) 3Q15 2Q15 1Q15 FY14 Pre - tax Income $137 $153 $148 $681 (1) GAAP tax provision includes discrete tax items of $591 million, $7 million, $2 million and $445 million for 3Q15, 2Q15, 1Q15 and FY14 , respectively. (2) Net income includes $0 million, $0 million, $0 million and $1 million of losses attributable to non - controlling interests for 3 Q15, 2Q15, 1Q15 and FY14 , respectively. (3) EPS based on 191.8 million, 174.9 million, 177.1 million and 189.5 million average diluted shares outstanding for 3Q15, 2Q15, 1Q15 and FY14 , respectively. $ impacts are rounded ($ Millions, except per share data) GAAP Tax Benefit (Provision) (1) $560 ($38) ($44) $398 Net Income (2) $693 $115 $104 $1,078 Reported EPS (3) $3.61 $0.66 $0.59 $5.69 Effective Tax Rate NM 25% 30% (58%) Cash Taxes ($9) ($4) ($14) ($22) Pro Forma Net Income (2) $128 $149 $134 $658 Pro Forma EPS (3) $0.67 $0.85 $0.76 $3.47 Effective Tax Rate (Cash) 7% 2% 9% 3% ▪ Reset of GAAP effective tax rate in 2015 due to prior year partial valuation allowance reversal ▪ GAAP earnings reflect $ 647 million tax benefit due to VA reversal , partially offset by discrete items of $56 million ▪ Cash taxes were $ 9 million in 3Q15 | 3Q15 Earnings
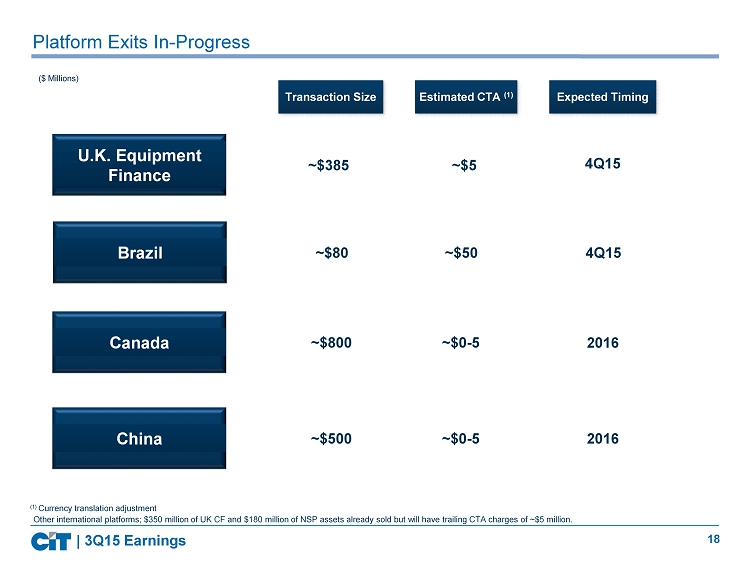
18 Platform Exits In - Progress Estimated CTA (1) Expected Timing Transaction Size ($ Millions) Other international platforms; $350 million of UK CF and $180 million of NSP assets already sold but will have trailing CTA charges of ~$5 million. Brazil ~$80 ~$50 4Q15 U.K . Equipment Finance ~$385 ~$5 4Q15 | 3Q15 Earnings Canada ~$800 ~$0 - 5 2016 China ~$500 ~$0 - 5 2016 (1) Currency translation adjustment
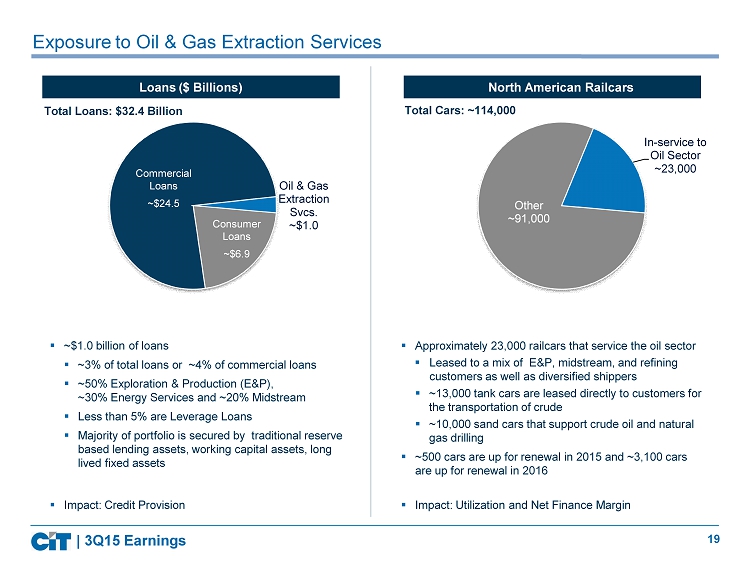
19 Oil & Gas Extraction Svcs . ~$ 1.0 Exposure to Oil & Gas Extraction Services Loans ($ Billions) Total Loans: $32.4 Billion ▪ ~$1.0 billion of loans ▪ ~ 3% of total loans or ~4% of commercial loans ▪ ~50% Exploration & Production ( E&P), ~30% Energy Services and ~20% Midstream ▪ Less than 5 % are Leverage Loans ▪ Majority of portfolio is secured by traditional reserve based lending assets, working capital assets, long lived fixed assets Other ~91,000 In - service to Oil Sector ~23,000 North American Railcars Total Cars: ~114,000 ▪ Approximately 23,000 railcars that service the oil sector ▪ Leased to a mix of E&P, midstream, and refining customers as well as diversified shippers ▪ ~13,000 tank cars are leased directly to customers for the transportation of crude ▪ ~10,000 sand cars that support crude oil and natural gas drilling ▪ ~500 cars are up for renewal in 2015 and ~3,100 cars are up for renewal in 2016 ▪ Impact: Utilization and Net Finance Margin ▪ Impact: Credit Provision | 3Q15 Earnings Consumer Loans ~$6.9 Commercial Loans ~$24.5
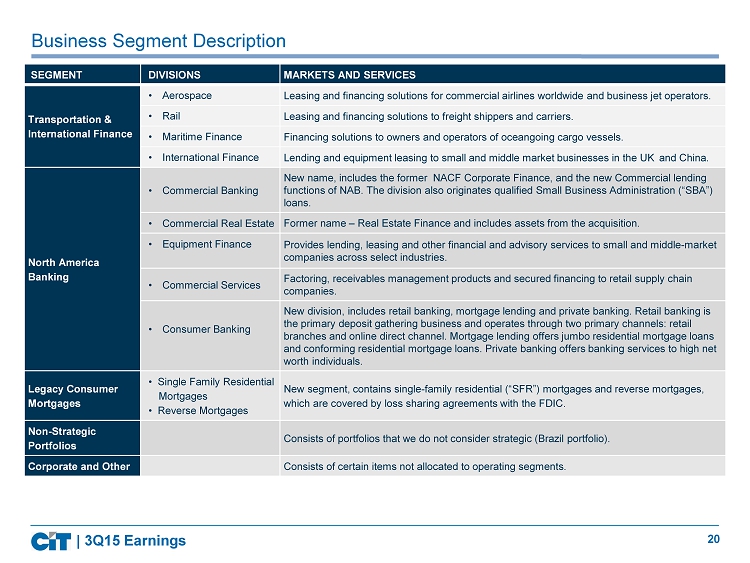
20 North American Commercial Finance Business Segment Description SEGMENT DIVISIONS MARKETS AND SERVICES Transportation & International Finance • Aerospace Leasing and financing solutions for commercial airlines worldwide and business jet operators. • Rail Leasing and financing solutions to freight shippers and carriers. • Maritime Finance Financing solutions to owners and operators of oceangoing cargo vessels. • International Finance Lending and equipment leasing to small and middle market businesses in the UK and China. North America Banking • Commercial Banking New name, includes the former NACF Corporate Finance, and the new Commercial lending functions of NAB. The division also originates qualified Small Business Administration (“SBA”) loans. • Commercial Real Estate Former name – Real Estate Finance and includes assets from the acquisition. • Equipment Finance Provides lending, leasing and other financial and advisory services to small and middle - market companies across select industries. • Commercial Services Factoring, receivables management products and secured financing to retail supply chain companies . • Consumer Banking New division, includes retail banking, mortgage lending and private banking. Retail banking is the primary deposit gathering business and operates through two primary channels: retail branches and online direct channel. Mortgage lending offers jumbo residential mortgage loans and conforming residential mortgage loans. Private banking offers banking services to high net worth individuals. Legacy Consumer Mortgages • Single Family Residential Mortgages • Reverse Mortgages New segment, contains single - family residential (“SFR”) mortgages and reverse mortgages, which are covered by loss sharing agreements with the FDIC . Non - Strategic Portfolios Consists of portfolios that we do not consider strategic (Brazil portfolio). Corporate and Other Consists of certain items not allocated to operating segments. | 3Q15 Earnings

21 North American Commercial Finance | 3Q15 Earnings