Attached files
| file | filename |
|---|---|
| 8-K - 8-K - Beneficial Bancorp Inc. | a15-22193_18k.htm |
Exhibit 99.1
third quarter 2015 update
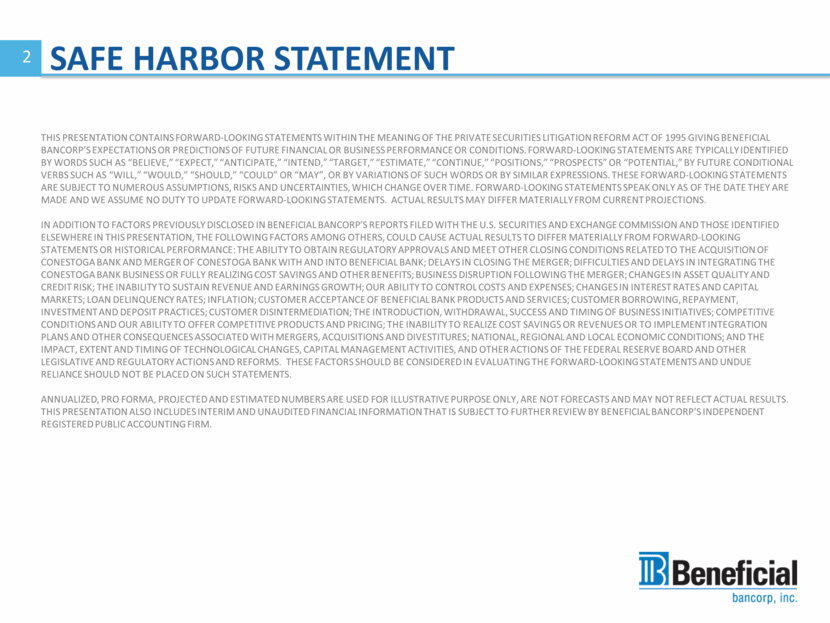
2 SAFE HARBOR STATEMENT This presentation contains forward-looking statements within the meaning of the Private Securities Litigation Reform Act of 1995 giving Beneficial Bancorp’s expectations or predictions of future financial or business performance or conditions. Forward-looking statements are typically identified by words such as “believe,” “expect,” “anticipate,” “intend,” “target,” “estimate,” “continue,” “positions,” “prospects” or “potential,” by future conditional verbs such as “will,” “would,” “should,” “could” or “may”, or by variations of such words or by similar expressions. These forward-looking statements are subject to numerous assumptions, risks and uncertainties, which change over time. Forward-looking statements speak only as of the date they are made and we assume no duty to update forward-looking statements. Actual results may differ materially from current projections. In addition to factors previously disclosed in Beneficial Bancorp’s reports filed with the U.S. Securities and Exchange Commission and those identified elsewhere in this presentation, the following factors among others, could cause actual results to differ materially from forward-looking statements or historical performance: the ability to obtain regulatory approvals and meet other closing conditions related to the acquisition of Conestoga Bank and merger of Conestoga Bank with and into Beneficial Bank; delays in closing the merger; difficulties and delays in integrating the Conestoga Bank business or fully realizing cost savings and other benefits; business disruption following the merger; changes in asset quality and credit risk; the inability to sustain revenue and earnings growth; our ability to control costs and expenses; changes in interest rates and capital markets; loan delinquency rates; inflation; customer acceptance of Beneficial Bank products and services; customer borrowing, repayment, investment and deposit practices; customer disintermediation; the introduction, withdrawal, success and timing of business initiatives; competitive conditions and our ability to offer competitive products and pricing; the inability to realize cost savings or revenues or to implement integration plans and other consequences associated with mergers, acquisitions and divestitures; national, regional and local economic conditions; and the impact, extent and timing of technological changes, capital management activities, and other actions of the Federal Reserve Board and other legislative and regulatory actions and reforms. These factors should be considered in evaluating the forward-looking statements and undue reliance should not be placed on such statements. Annualized, pro forma, projected and estimated numbers are used for illustrative purpose only, are not forecasts and may not reflect actual results. This presentation also includes interim and unaudited financial information that is subject to further review by Beneficial Bancorp’s independent registered public accounting firm.
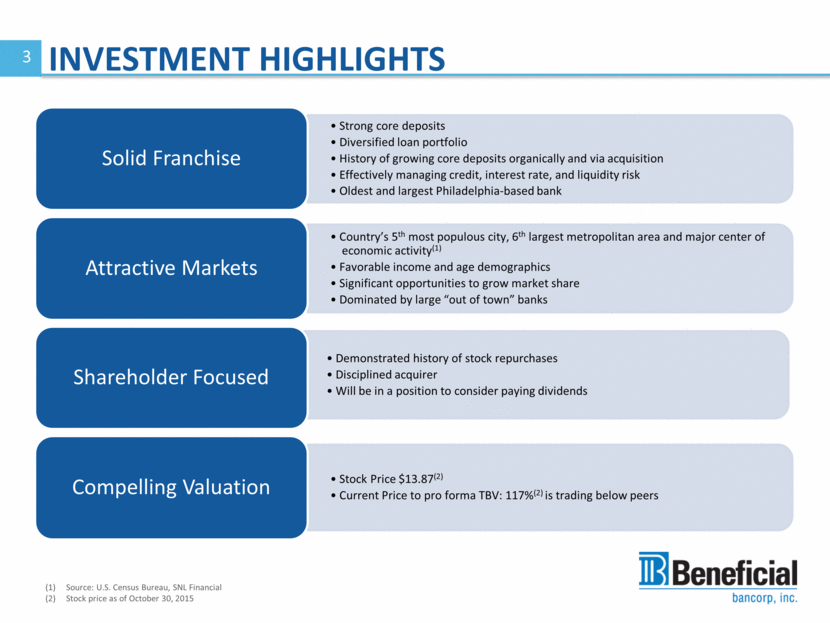
3 INVESTMENT HIGHLIGHTS Source: U.S. Census Bureau, SNL Financial Stock price as of October 30, 2015 Strong core deposits Diversified loan portfolio History of growing core deposits organically and via acquisition Effectively managing credit, interest rate, and liquidity risk Oldest and largest Philadelphia-based bank Solid Franchise Country’s 5th most populous city, 6th largest metropolitan area and major center of _economic activity(1) Favorable income and age demographics Significant opportunities to grow market share Dominated by large “out of town” banks Attractive Markets Demonstrated history of stock repurchases Disciplined acquirer Will be in a position to consider paying dividends Shareholder Focused Stock Price $13.87(2) Current Price to pro forma TBV: 117%(2) is trading below peers Compelling Valuation
4 OVERVIEW OF BENEFICIAL BANCORP Founded in 1853 Oldest and largest bank headquartered in Philadelphia #7 deposit market share in Philadelphia for all banks and thrifts Largest locally-headquartered bank or thrift by assets or deposits As of October 30, 2015 Source: SNL Financial
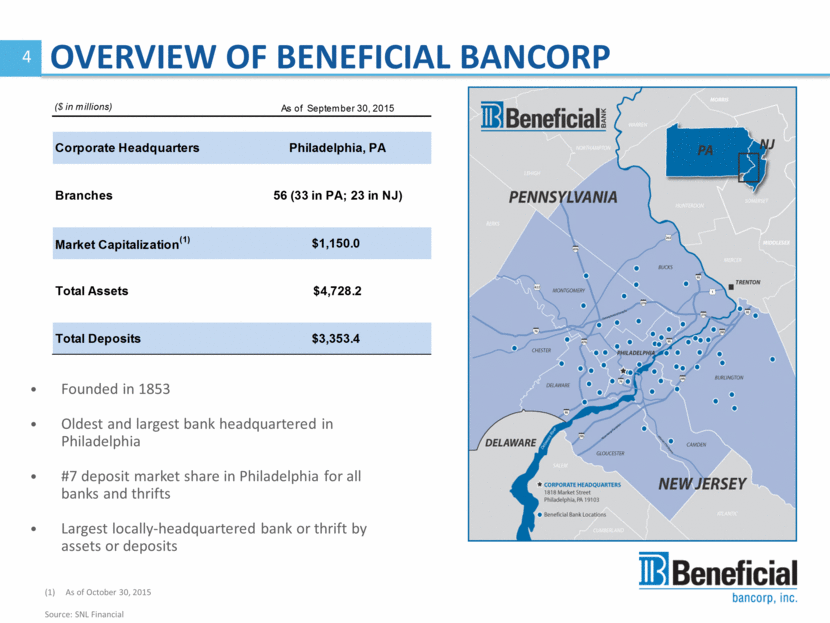
5 OUR MARKET – GREATER PHILADELPHIA Excludes Beneficial Bank Source: U.S. Census Bureau, SNL Financial, Bureau of Labor Statistics Opportunity for Growth Both Organically and through Acquisitions in the Attractive Philadelphia MSA Philadelphia is 6th largest metropolitan region in the U.S. 64 colleges and universities in the area Median household income of $64k versus national median of $56k Community banks comprise a large portion of total institutions in Philadelphia Metro area (95 of 108) 83 of 108 Philadelphia banking institutions have less than 10 branch locations Only 11 of 108 Philadelphia banking institutions have more than 50 branch locations Beneficial is large enough to compete with the largest financial institutions Beneficial has enough capital to enhance existing branch footprint or strategically grow in other key Philadelphia/Southern New Jersey markets
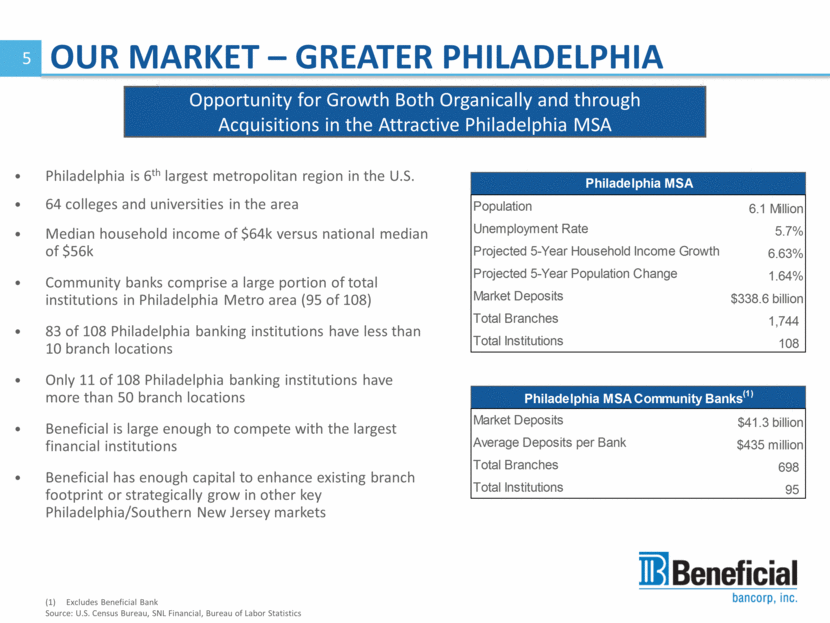
BENEFICIAL TODAY – COMPETITIVE ADVANTAGE Source: SNL Financial 6 ($ in thousands)
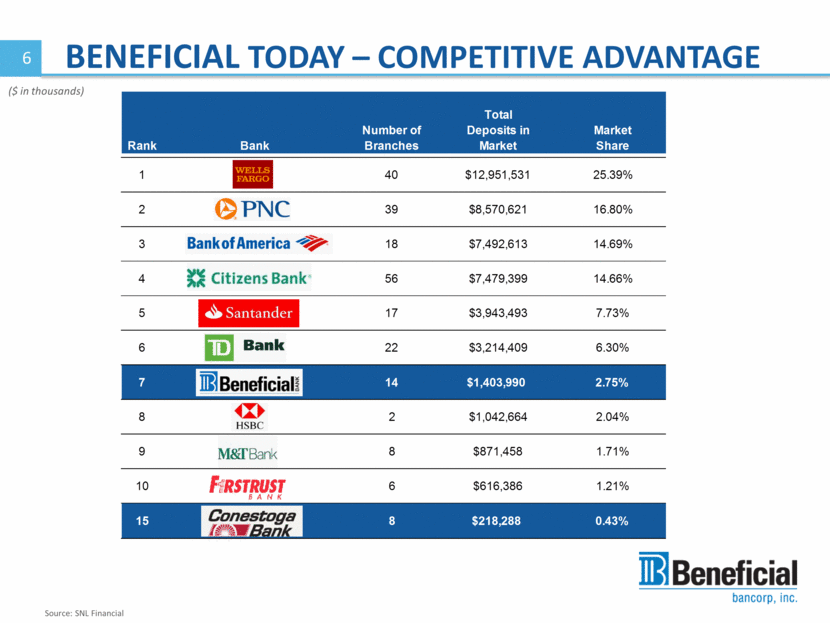
STRATEGIC PRIORITIES 7 Investing in and expanding lending teams to organically grow loans Improving balance sheet mix Disciplined in the pricing of loan and deposit products Focused on operating efficiency and cost structure Improve Profitability Maintain low levels of non-performing assets Reduce classified loan and REO expense Maintain strong reserves Employ prudent underwriting standards for new originations Asset Quality Maintain strong capital levels to allow strategic flexibility Invest in profitable businesses Expect to announce a share repurchase program upon the 1 year anniversary of conversion Execute acquisitions with strategic and financial fit Will be in a position to consider paying dividends Capital Management Invest in and leverage IT platform to improve efficiency, control, and scalability Continued focus on risk management and compliance functions Optimizing mobile banking Enhancing online capabilities Operations / Technology Educate our customers to do the right thing financially Continue marketing campaign and brand refresh on Beneficial as “YOUR KNOWLEDGE BANK” Highlight Beneficial’s commitment to financial education Focus on communicating our core mission to provide customers with the tools, knowledge _and guidance to help them make wise financial decisions Brand
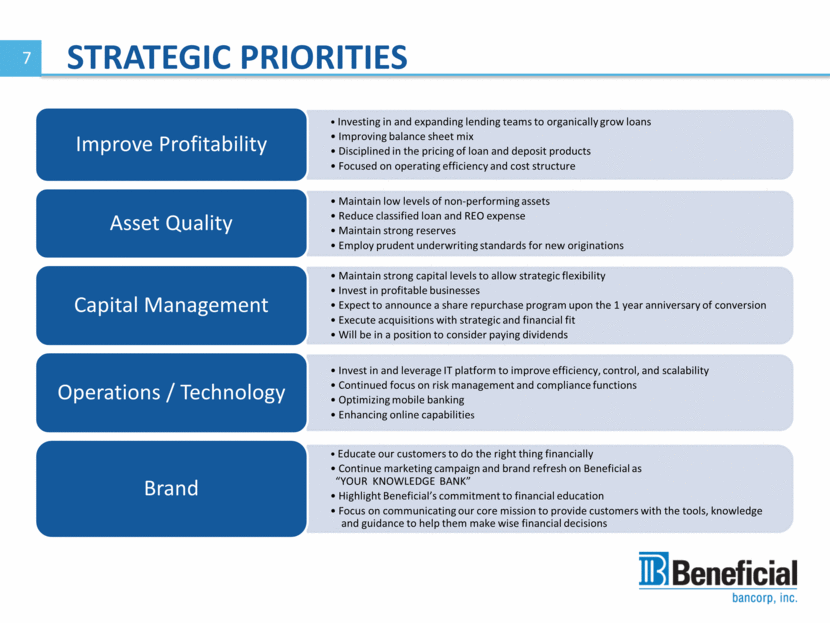
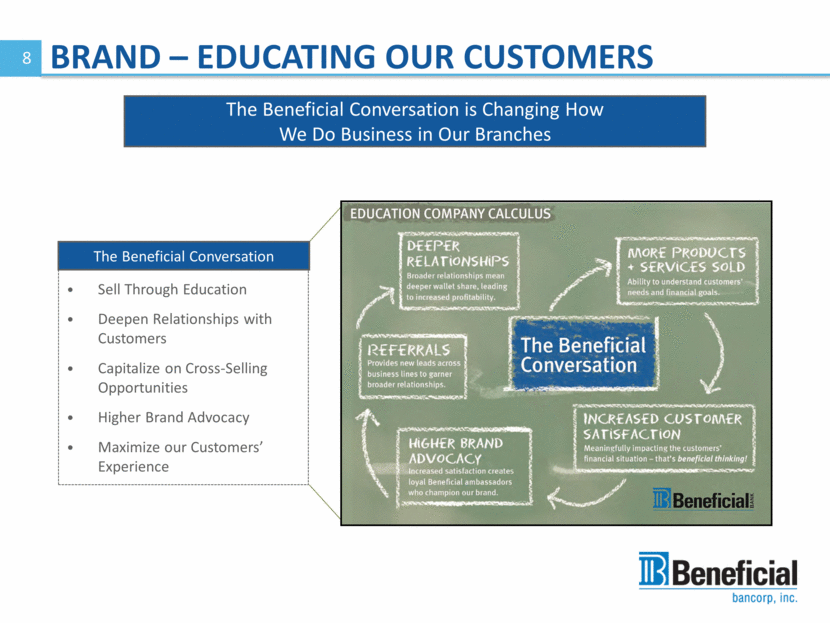
BRAND – EDUCATING OUR CUSTOMERS The Beneficial Conversation is Changing How We Do Business in Our Branches Sell Through Education Deepen Relationships with Customers Capitalize on Cross-Selling Opportunities Higher Brand Advocacy Maximize our Customers’ Experience The Beneficial Conversation 8
CAPTIAL MANAGEMENT Common Stock Repurchases Expect to announce a share repurchase program upon the 1 year anniversary of the second-step conversion History of repurchasing common stock 7.25 million shares repurchased through stock repurchase plans since initial IPO in 2007, or approximately 36% of the minority shares issued Dividends Will consider paying dividends based on financial performance and as an alternative use of capital Acquisitions Will focus on in-market and contiguous market opportunities Maintain discipline on financial hurdles including earnings accretion, tangible book value dilution, earn-back period and internal rate of return On October 22, 2015 announced acquisition of Conestoga Bank 9
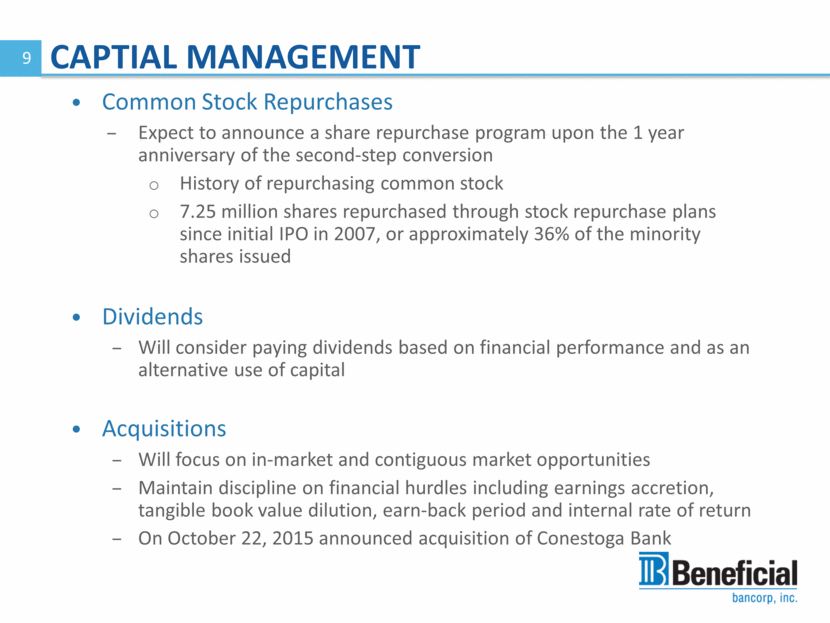
CAPITAL STRONG POST CONVERSION- FOCUSED ON PRUDENT CAPITAL MANAGMENT 10 (1) Pro forma Tangible Equity/Tangible Assets is based on an estimate of the impact from the Conestoga Bank transaction (1)
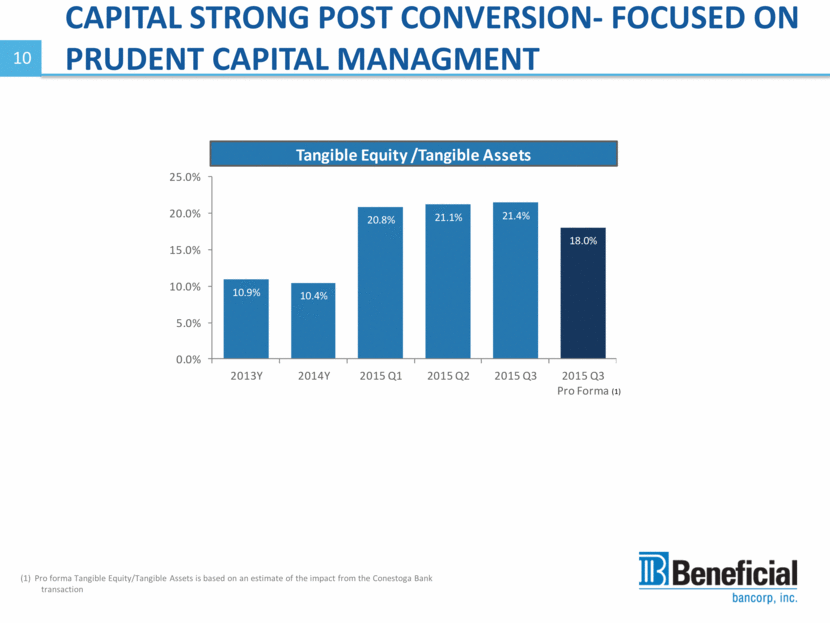
TRANSFORMING BALANCE SHEET COMPOSTION TO IMPROVE EARNINGS ($ in millions) ($ in millions) (1) Excludes Municipal, Time and Stock Subscription Proceeds Core Deposits (1) Loans Loan to Deposit Ratio 11 * Excludes Stock Subscription Proceeds Note: Pro forma Loan to Deposit ratio, loan amounts and core deposit amount includes loan and deposit amounts from Conestoga Bank’s June 30, 2015 unaudited financial statements
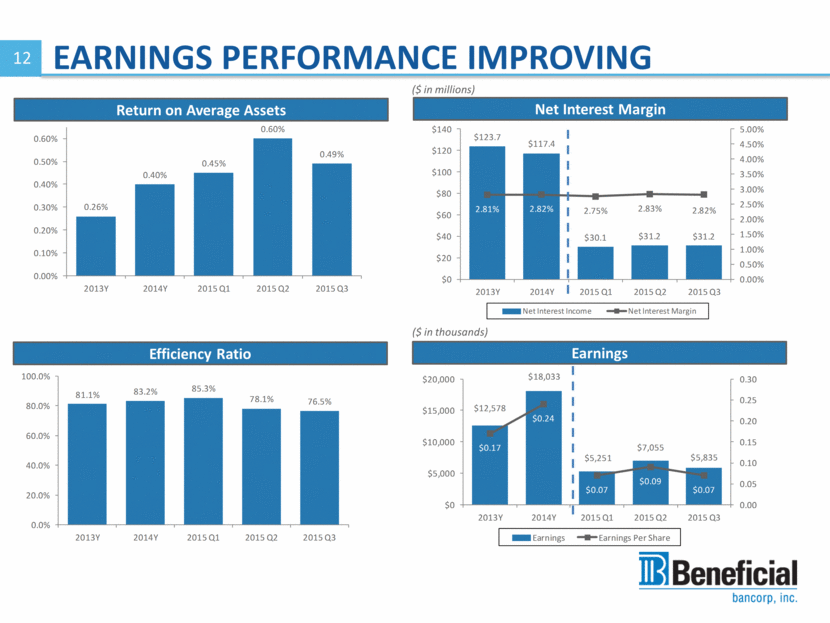
EARNINGS PERFORMANCE IMPROVING ($ in millions) Net Interest Margin Return on Average Assets Efficiency Ratio Earnings 12 ($ in thousands)
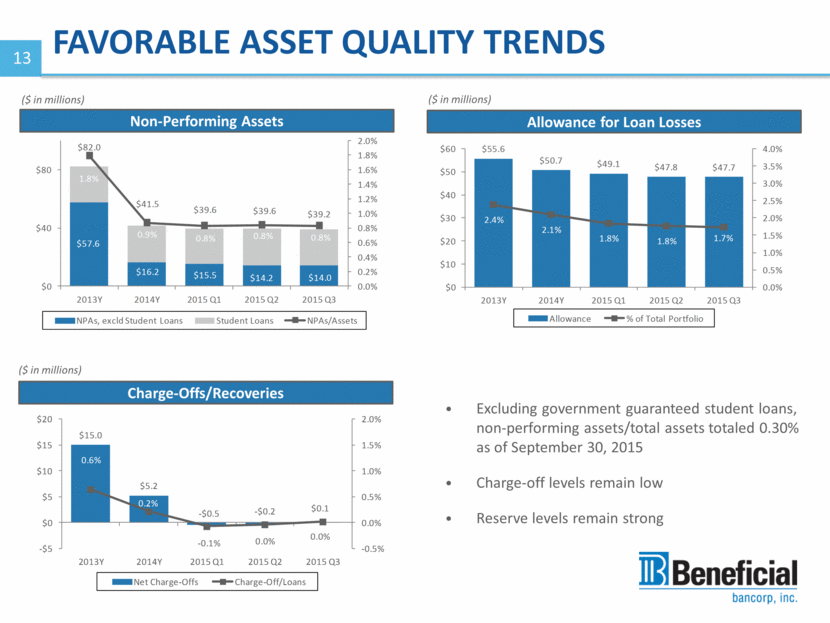
Excluding government guaranteed student loans, non-performing assets/total assets totaled 0.30% as of September 30, 2015 Charge-off levels remain low Reserve levels remain strong ($ in millions) FAVORABLE ASSET QUALITY TRENDS Non-Performing Assets Charge-Offs/Recoveries Allowance for Loan Losses 13 ($ in millions) ($ in millions)
Acquisition of Conestoga bank
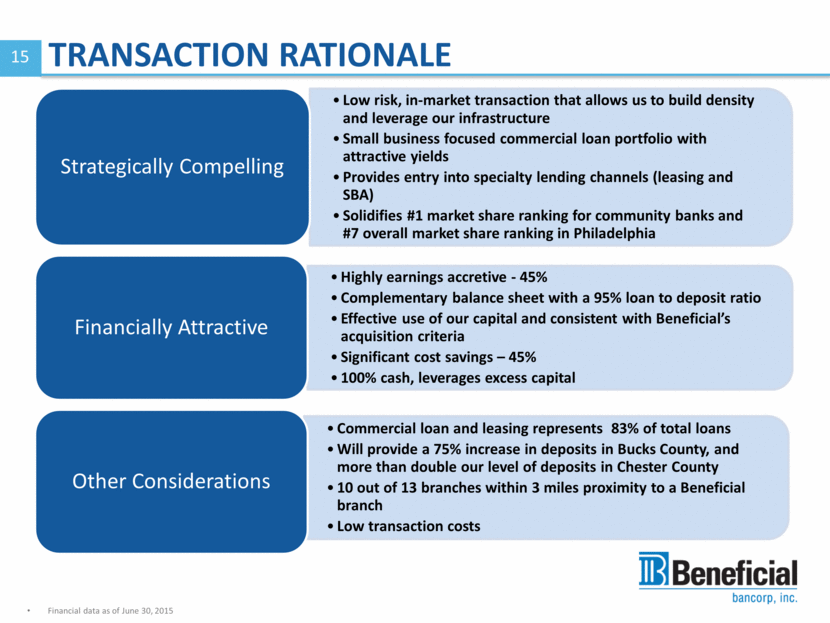
15 TRANSACTION RATIONALE Financial data as of June 30, 2015 Low risk, in-market transaction that allows us to build density and leverage our infrastructure Small business focused commercial loan portfolio with attractive yields Provides entry into specialty lending channels (leasing and SBA) Solidifies #1 market share ranking for community banks and #7 overall market share ranking in Philadelphia Strategically Compelling Highly earnings accretive - 45% Complementary balance sheet with a 95% loan to deposit ratio Effective use of our capital and consistent with Beneficial’s acquisition criteria Significant cost savings – 45% 100% cash, leverages excess capital Financially Attractive Commercial loan and leasing represents 83% of total loans Will provide a 75% increase in deposits in Bucks County, and more than double our level of deposits in Chester County 10 out of 13 branches within 3 miles proximity to a Beneficial branch Low transaction costs Other Considerations
16 TRANSACTION SUMMARY Purchase Price/Consideration Acquiring Conestoga Bancorp’s ownership interest in Conestoga Bank 160% tangible book value at closing, capped at $105 million 100% cash Negotiated transaction Credit Mark 2.5% credit mark Key Assumptions 45% cost savings when fully phased-in Transaction costs of approximately $10 million (pre-tax) Core deposit intangible of 1.5% Financial Impact 45% accretive to earnings when cost savings are fully realized 5% tangible book value dilution, earned back in 4.5 years Internal rate of return of 15% Due Diligence Detailed due diligence review completed 65% of commercial loan portfolio reviewed by independent firm and Beneficial Expected Closing First or Second Quarter 2016 Required Approvals Customary regulatory approvals
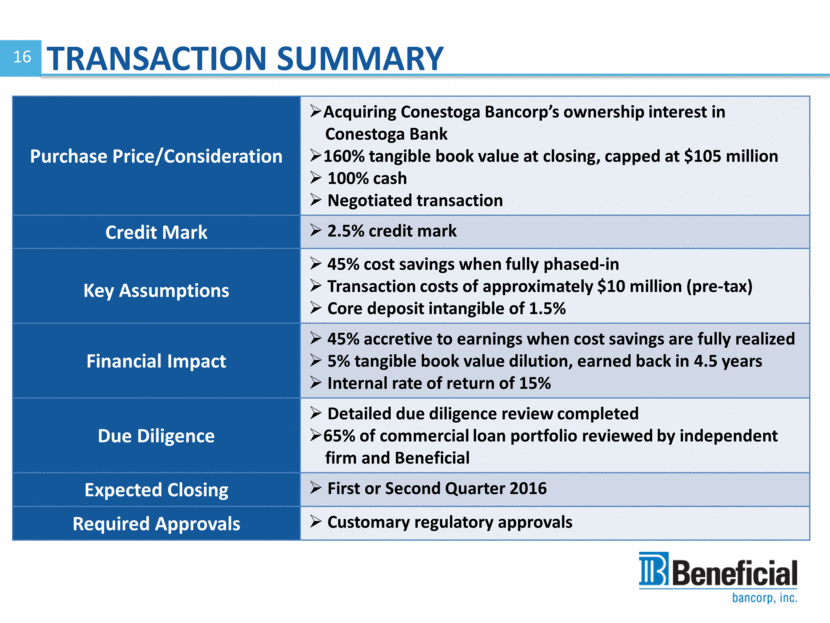
CONESTOGA OVERVIEW ($ in millions) CAGR = 8.5% Loan Growth Loan Composition Source: Conestoga June 30, 2015 unaudited financial statements, SNL Financial -Income statement amounts are year-to-date 17
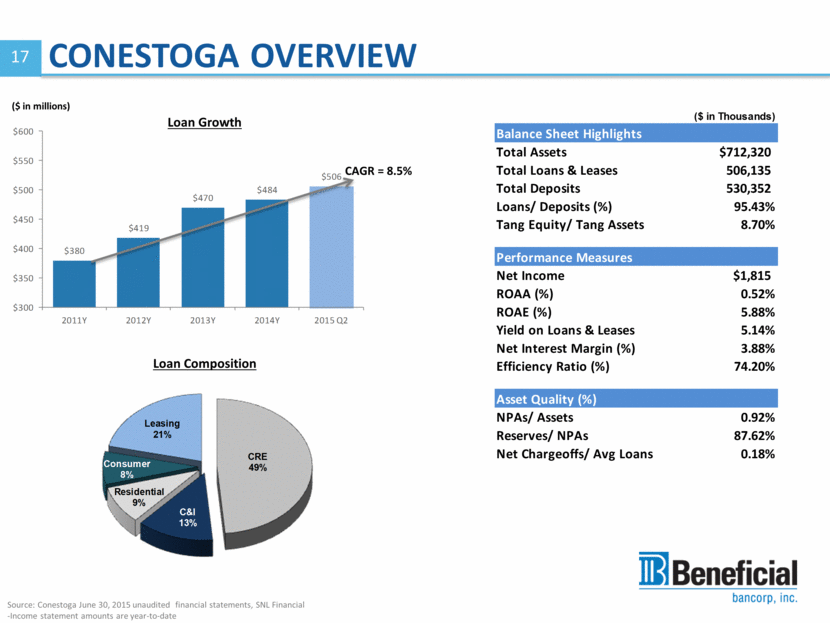
18 ATTRACTIVE COMBINED FRANCHISE Combination further strengthens our position in Philadelphia as the #1 ranked community bank by deposits Provides a deeper presence in surrounding suburbs with strong demographics Adds $215 million of deposits in Philadelphia and $315 million in surrounding suburbs Conestoga has 13 branches and 1 LPO in Lehigh County Financial data based on preliminary purchase accounting estimates as of June 30, 2015 Sources: Conestoga June 30, 2015 unaudited financial statements; SNL Financial Pennsylvania New Jersey Philadelphia Delaware Beneficial Bank Conestoga Bank
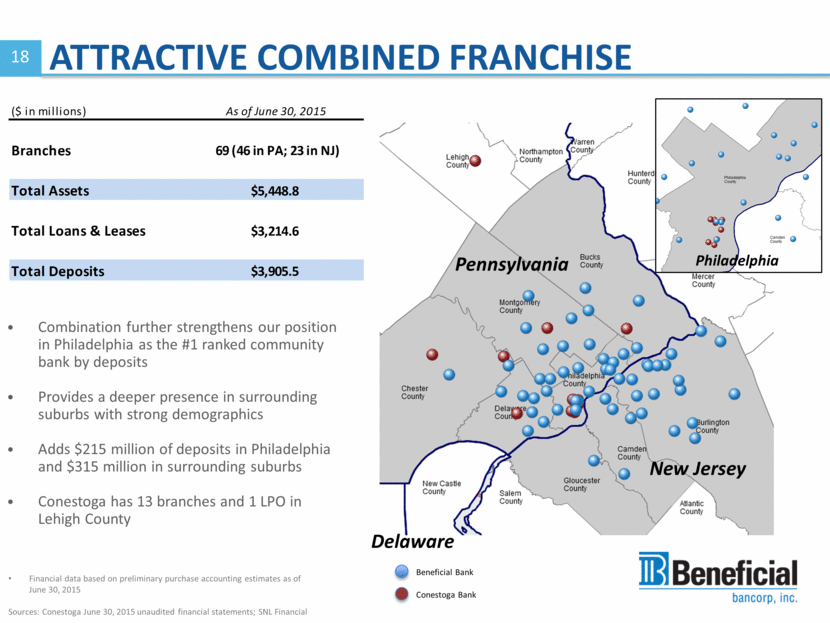
19 MARKET DEMOGRAPHICS Sources: SNL Financial, FRB of Philadelphia Conestoga operates in many of the same attractive markets as Beneficial, allowing Beneficial to further build density in its footprint (Deposit $ in thousands)
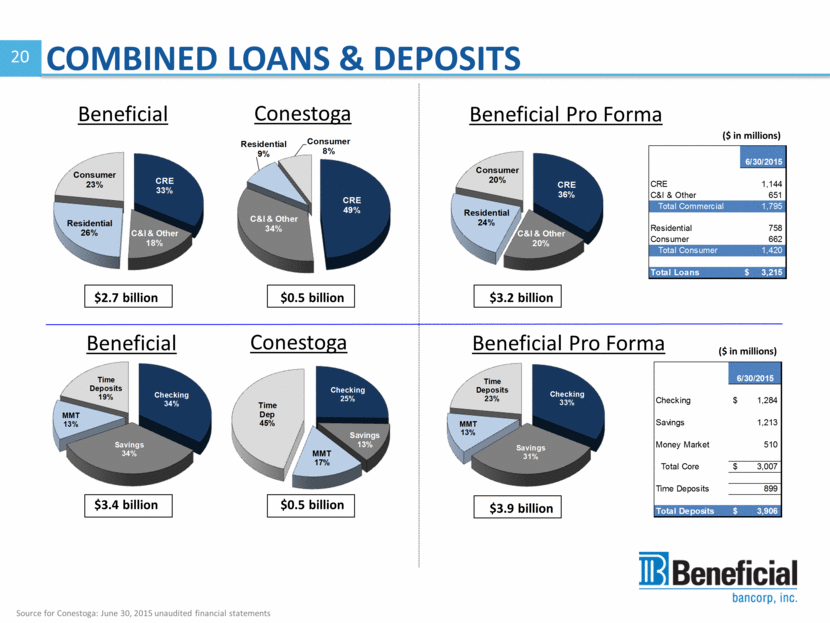
COMBINED LOANS & DEPOSITS Conestoga Beneficial Pro Forma $2.7 billion $0.5 billion $3.2 billion $3.4 billion Beneficial Conestoga $0.5 billion Beneficial Pro Forma $3.9 billion Beneficial ($ in millions) ($ in millions) Source for Conestoga: June 30, 2015 unaudited financial statements 20
APPENDIX FINANCIAL EXHIBITS
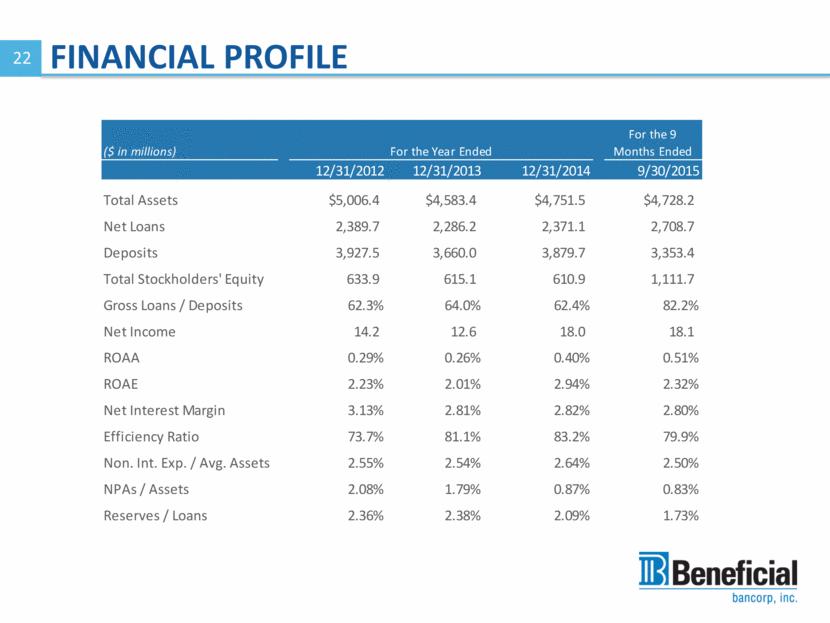
FINANCIAL PROFILE 22
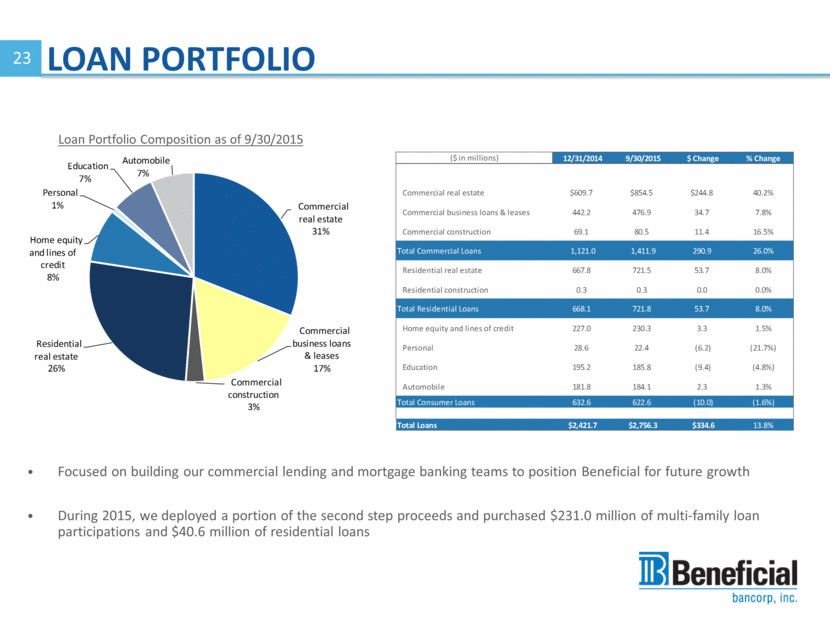
LOAN PORTFOLIO Focused on building our commercial lending and mortgage banking teams to position Beneficial for future growth During 2015, we deployed a portion of the second step proceeds and purchased $231.0 million of multi-family loan participations and $40.6 million of residential loans Loan Portfolio Composition as of 9/30/2015 23 ($ in millions) 12/31/2014 9/30/2015 $ Change % Change Commercial real estate $609.7 $854.5 $244.8 40.2% Commercial business loans & leases 442.2 476.9 34.7 7.8% Commercial construction 69.1 80.5 11.4 16.5% Total Commercial Loans 1,121.0 1,411.9 290.9 26.0% Residential real estate 667.8 721.5 53.7 8.0% Residential construction 0.3 0.3 0.0 0.0% Total Residential Loans 668.1 721.8 53.7 8.0% Home equity and lines of credit 227.0 230.3 3.3 1.5% Personal 28.6 22.4 (6.2) (21.7%) Education 195.2 185.8 (9.4) (4.8%) Automobile 181.8 184.1 2.3 1.3% Total Consumer Loans 632.6 622.6 (10.0) (1.6%) 0.0 Total Loans $2,421.7 $2,756.3 $334.6 13.8%
CASH AND INVESTMENTS $ in thousands We are focused on improving our balance sheet mix by reducing the percentage of our assets in cash and investments and growing our loan portfolio. Cash and overnight investments combined with the investment portfolio represented 35.3% of the balance sheet as of September 30, 2015 down from 42.5% at December 31, 2014 Deployed a portion of the second step proceeds into the loan portfolio. Remaining excess liquidity can be deployed for future loan growth and the Conestoga transaction, which will further improve profitability. Excludes Federal Home Loan Bank Stock ($ in millions) Cash and Overnight Securities Investment Securities(1) 24 ($ in millions)
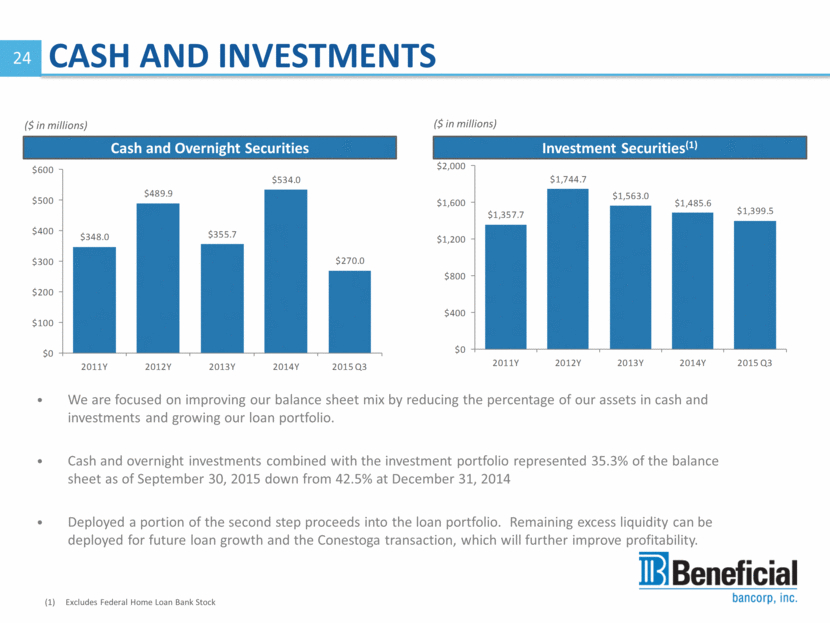
SECURITIES PORTFOLIO 25 High quality investment portfolio Provides steady stream of cash flow Focused on keeping duration short (4.1 years)
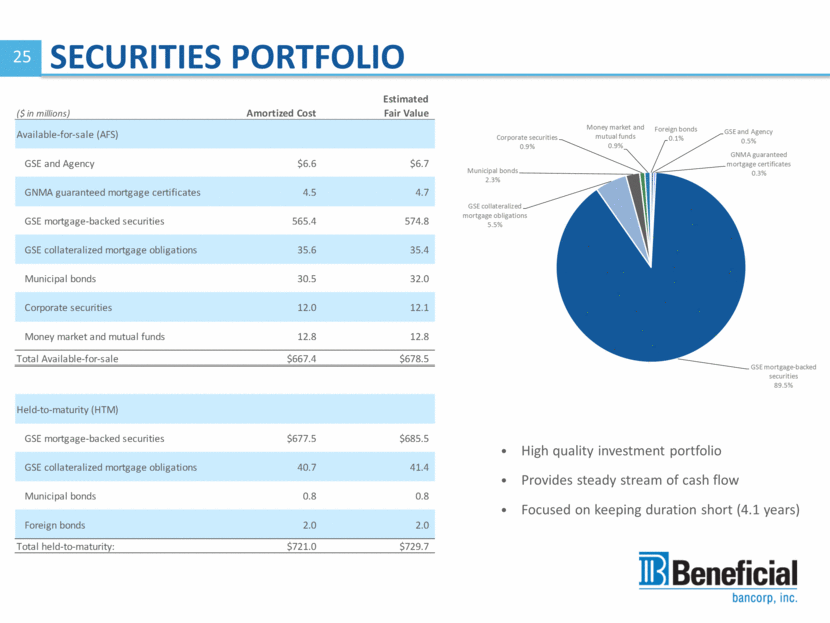
DEPOSIT COMPOSITION Core deposits, excluding municipal and stock subscription proceeds, have increased $25.5 million from December 31, 2014 Municipal deposits decreased by $48.3 million or 26.9% from December 31, 2014, as we re-priced and ran-off higher cost deposits 26
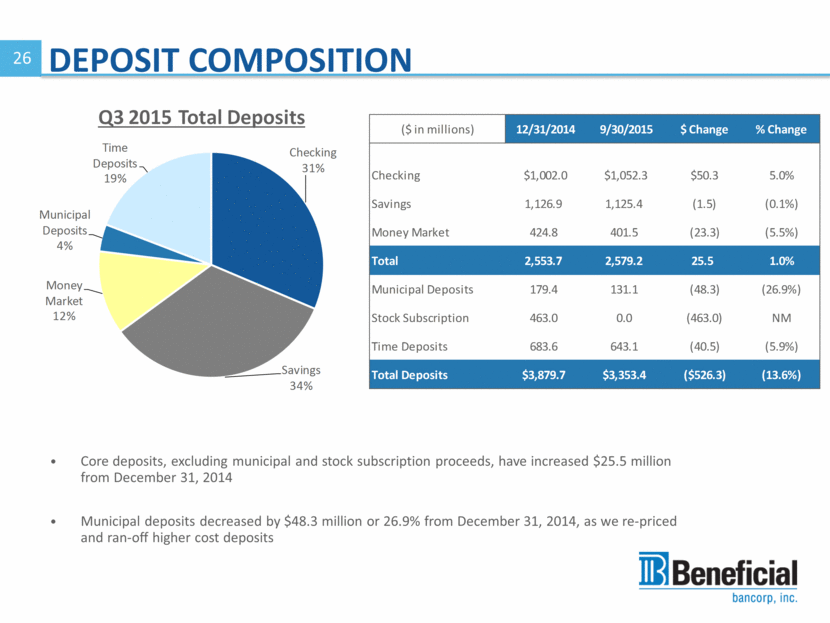
COST OF DEPOSITS Cost of deposits has significantly declined Actively assessing and managing our deposit mix, deposit balance levels and pricing to maximize net interest margin and ROE Have aggressively re-priced and decreased the municipal deposit portfolio since 2011 ($ in millions) Total Deposits (excluding Municipal Deposits) Municipal Deposits Certificates of Deposit 27 ($ in millions) ($ in millions)
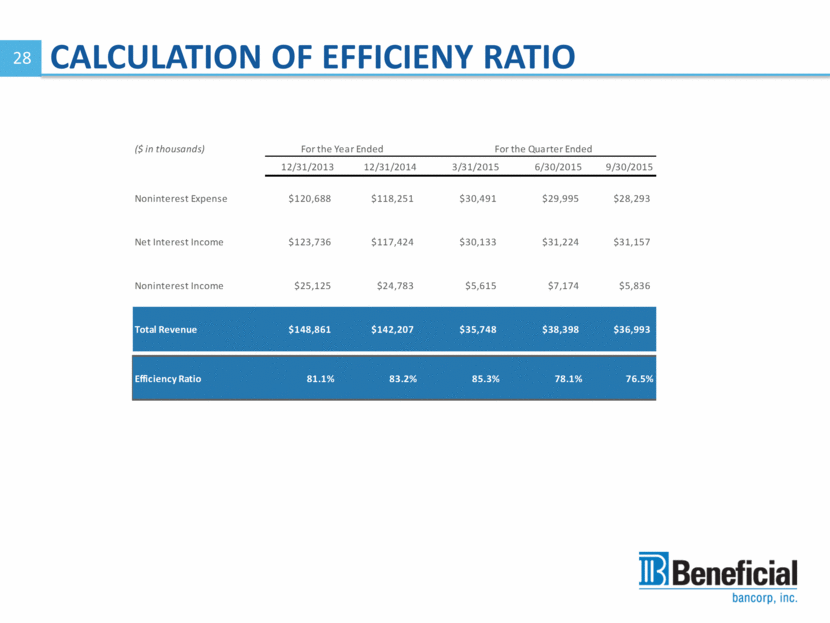
CALCULATION OF EFFICIENY RATIO 28
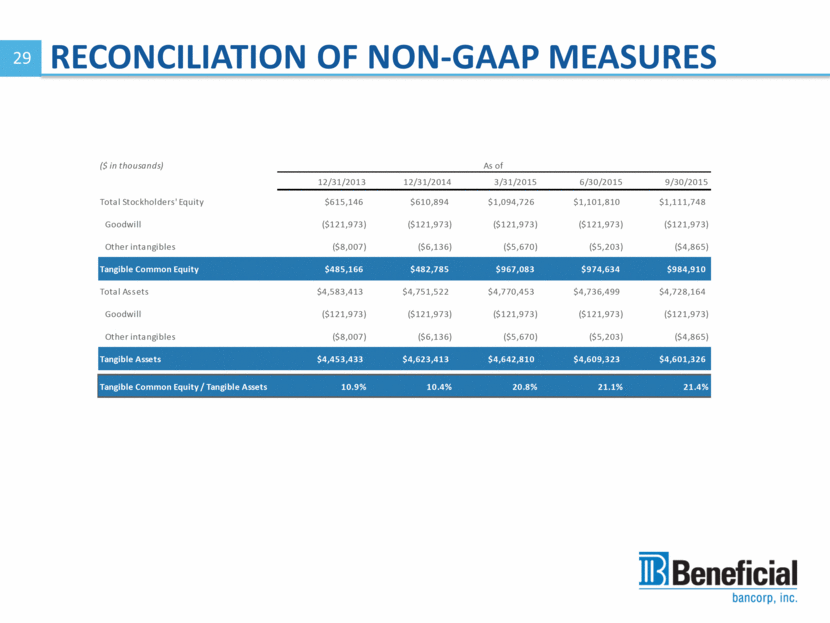
RECONCILIATION OF NON-GAAP MEASURES 29
30 For Additional Information Please Contact: Thomas Cestare, CFO @ (215)-864-6009 or tcestare@thebeneficial.com www.thebeneficial.com Corporate Headquarters: 1818 Beneficial Bank Place 1818 Market Street, 22nd Floor Philadelphia, PA 19103 ADDITIONAL INFORMATION
