Attached files
| file | filename |
|---|---|
| 8-K - 8-K - AMAG PHARMACEUTICALS, INC. | a15-22151_18k.htm |
| EX-99.1 - EX-99.1 - AMAG PHARMACEUTICALS, INC. | a15-22151_1ex99d1.htm |
Exhibit 99.2
AMAG Pharmaceuticals 3Q 2015 Financial Results November 3, 2015
This presentation contains forward-looking statements within the meaning of the Private Securities Litigation Reform Act of 1995 and other federal securities laws. Any statements contained herein which do not describe historical facts, including among others, statements regarding future growth drivers for Makena, including expectations for approval and commercialization of the single-dose (1 mL) preservative-free vial; expectations for the lifecycle management program for Makena, including the development and advantages of a subcutaneous auto-injector device and a longer-acting formulation of Makena (including the timing and clinical trial efforts in connection with such activities), as well as the potential approval of a single-dose, preservative free version of Makena; enhanced growth opportunities for the CBR services, including the impact of the increased size of the sales force and the benefits of a customer study that is underway; key drivers for the growth of Feraheme, including opportunities and plans to grow market share in the hospital and hematology/oncology segments and through improved patient identification, as well as plans to realize the benefits of performance-based contracting strategies; growth opportunities for Feraheme in the CKD market and if a broad IDA indication is approved; plans and expectations (including cost and timing) for the head-to-head Phase 3 clinical trial for the broader IDA indication for Feraheme; business development plans and expectations, including plans to leverage commercial expertise; 2015 financial guidance, including expected revenues, adjusted EBITDA and cash earnings; AMAG’s 2015 goals, including plans to drive sales across the product portfolio, improved adjusted EBITDA margin, plans to execute on brand expansion/extension for Makena and Feraheme and AMAG’s intention to expand its product portfolio through acquisitions are forward-looking statements which involve risks and uncertainties that could cause actual results to differ materially from those discussed in such forward-looking statements. Such risks and uncertainties include, among others, AMAG’s ability to realize the expected benefits and synergies from the CBR acquisition and the success of the CBR services as part of AMAG’s portfolio; AMAG’s inexperience with cord blood and stem cell services, including the attendant regulatory regime and increased legal and compliance risks; the ethical, legal, regulatory, and social implications of stem cell research; AMAG’s ability to successfully commercialize Makena, including if a generic version of hydroxyprogesterone caproate is introduced to the market or if AMAG is unable to otherwise maintain the benefits of Makena’s orphan drug exclusivity; the possibility that AMAG’s multi-pronged lifecycle management program for Makena will not be successful on expected timelines or at all, and that pursuit of the subcutaneous delivery system and longer-acting formulation of Makena will absorb significant resources, financial and otherwise, over a considerable period of time, and despite such efforts, might not be deemed adequate by the FDA and may not extend Makena’s commercial viability beyond February 2018; the possibility that AMAG’s level of indebtedness could restrict operations and limit its ability to plan for or respond to changes in its business or acquire additional products for its portfolio, as well as those risks identified in AMAG’s filings with the U.S. Securities and Exchange Commission (SEC), including its Annual Report on Form 10-K for the year ended December 31, 2014, its Quarterly Report on Form 10-Q for the quarter ended June 30, 2015 and subsequent filings with the SEC. AMAG disclaims any obligation to publicly update or revise any such statements to reflect any change in expectations or in events, conditions or circumstances on which any such statements may be based, or that may affect the likelihood that actual results will differ from those set forth in the forward-looking statements. Forward-Looking Statements
3Q15 Earnings Call Agenda Agenda 3Q15 Highlights 3Q15 Commercial Performance and Developments Portfolio Expansion 3Q15 Results and Financial Update 2015 Goals and Closing Remarks Q&A Speakers: Bill Heiden, Chief Executive Officer Frank Thomas, President & Chief Operating Officer Julie Krop, M.D., Chief Medical Officer Linda Lennox, Vice President, Investor Relations & Corporate Communications
Copyright © 2015 AMAG Pharmaceuticals. All Rights Reserved. 3Q15 Highlights

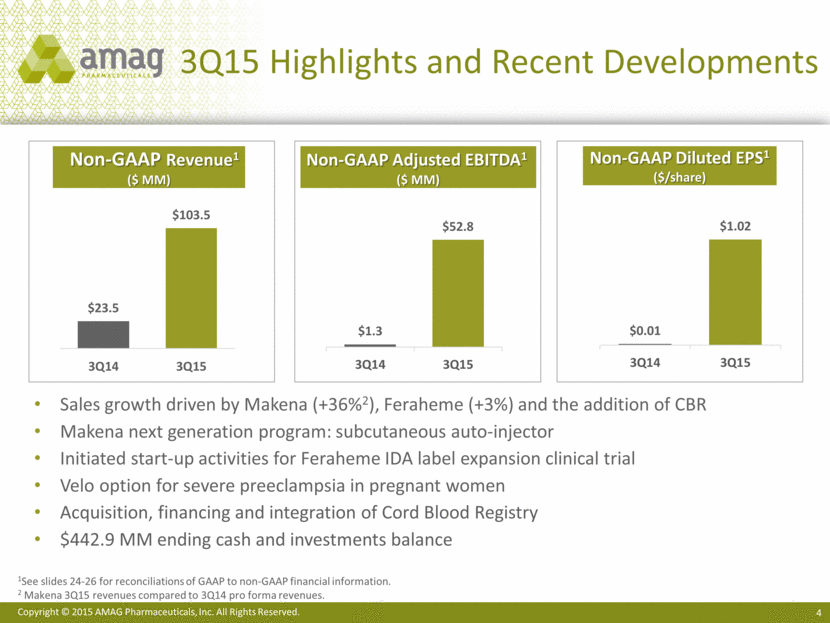
3Q15 Highlights and Recent Developments Non-GAAP Revenue1 ($ MM) Non-GAAP Adjusted EBITDA1 ($ MM) Non-GAAP Diluted EPS1 ($/share) Sales growth driven by Makena (+36%2), Feraheme (+3%) and the addition of CBR Makena next generation program: subcutaneous auto-injector Initiated start-up activities for Feraheme IDA label expansion clinical trial Velo option for severe preeclampsia in pregnant women Acquisition, financing and integration of Cord Blood Registry $442.9 MM ending cash and investments balance 1See slides 24-26 for reconciliations of GAAP to non-GAAP financial information. 2 Makena 3Q15 revenues compared to 3Q14 pro forma revenues. $1.3 $52.8 3Q14 3Q15 $0.01 $1.02 3Q14 3Q15
Diversified, Growing Product Portfolio Non-GAAP Product Revenues1 ($ MM) $20 $0 $120 $100 $80 $60 $40 3Q15 $103.5 2Q15 $84.7 1Q15 $77.4 4Q14 $49.6 3Q14 Makena2 CBR3,4 Feraheme/Mugard 1See slides 24-26 for reconciliations of GAAP to non-GAAP financial information. 2 Makena acquired in November 2014. 3 CBR acquired in August 2015. 4 Excludes purchase accounting adjustments related to CBR deferred revenue. $23.6

Maternal Health

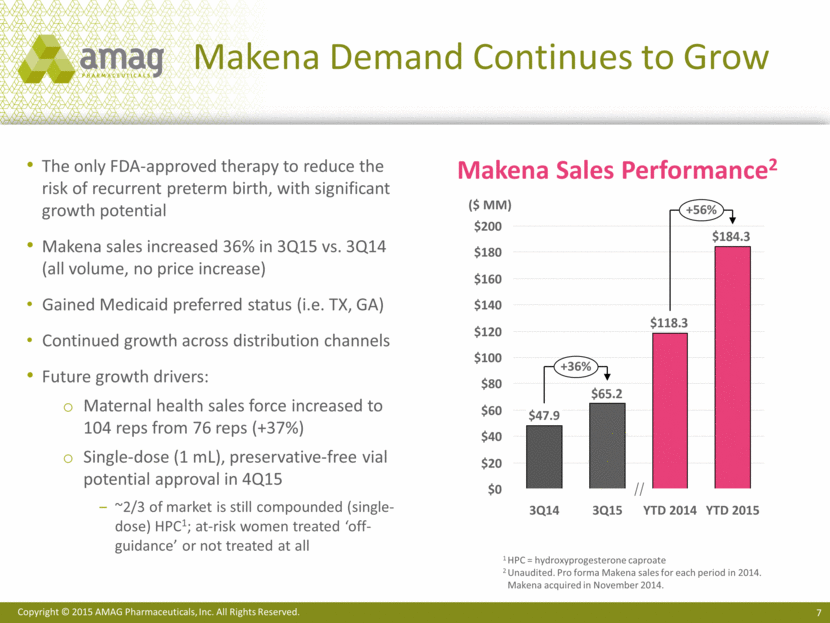
The only FDA-approved therapy to reduce the risk of recurrent preterm birth, with significant growth potential Makena sales increased 36% in 3Q15 vs. 3Q14 (all volume, no price increase) Gained Medicaid preferred status (i.e. TX, GA) Continued growth across distribution channels Future growth drivers: Maternal health sales force increased to 104 reps from 76 reps (+37%) Single-dose (1 mL), preservative-free vial potential approval in 4Q15 ~2/3 of market is still compounded (single-dose) HPC1; at-risk women treated ‘off-guidance’ or not treated at all Makena Sales Performance2 1 HPC = hydroxyprogesterone caproate 2 Unaudited. Pro forma Makena sales for each period in 2014. Makena acquired in November 2014. $120 $140 $100 $80 $60 $40 $20 $200 $180 $160 $0 YTD 2014 3Q14 +36% +56% YTD 2015 3Q15 $47.9 ($ MM) Makena Demand Continues to Grow $184.3 $118.3 $65.2
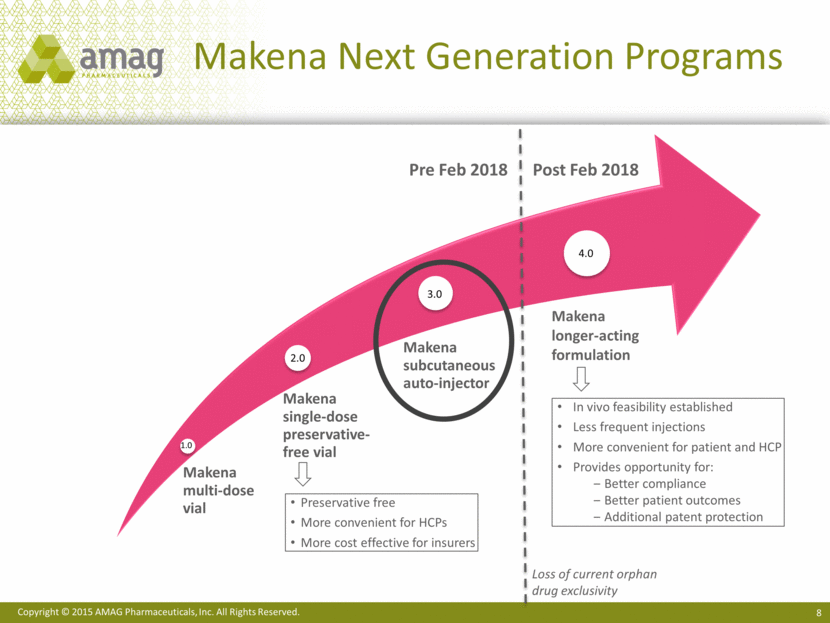
Makena Next Generation Programs Makena longer-acting formulation Pre Feb 2018 Post Feb 2018 Preservative free More convenient for HCPs More cost effective for insurers In vivo feasibility established Less frequent injections More convenient for patient and HCP Provides opportunity for: Better compliance Better patient outcomes Additional patent protection 1.0 2.0 3.0 4.0 Loss of current orphan drug exclusivity Makena multi-dose vial Makena single-dose preservative-free vial Makena subcutaneous auto-injector
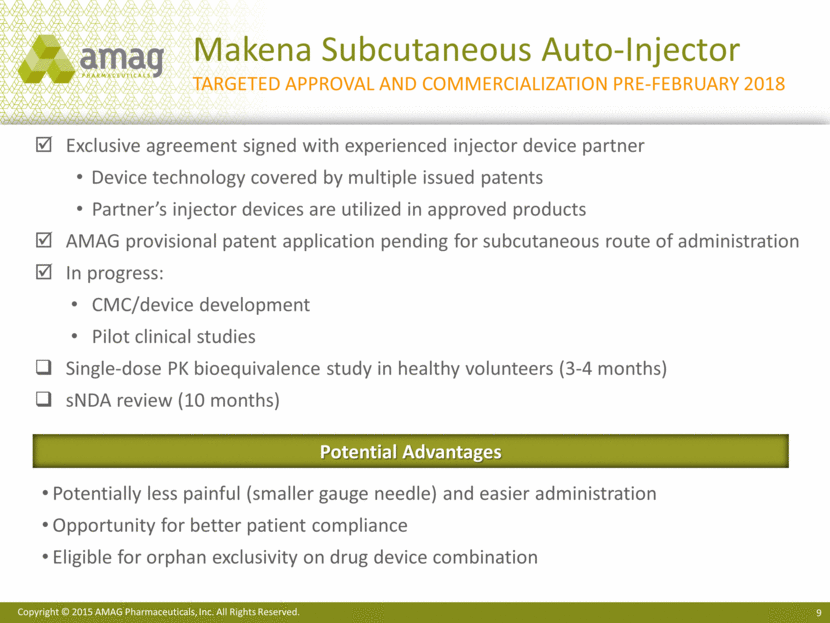
Makena Subcutaneous Auto-Injector Targeted Approval and Commercialization Pre-February 2018 Exclusive agreement signed with experienced injector device partner Device technology covered by multiple issued patents Partner’s injector devices are utilized in approved products AMAG provisional patent application pending for subcutaneous route of administration In progress: CMC/device development Pilot clinical studies Single-dose PK bioequivalence study in healthy volunteers (3-4 months) sNDA review (10 months) Potential Advantages Potentially less painful (smaller gauge needle) and easier administration Opportunity for better patient compliance Eligible for orphan exclusivity on drug device combination
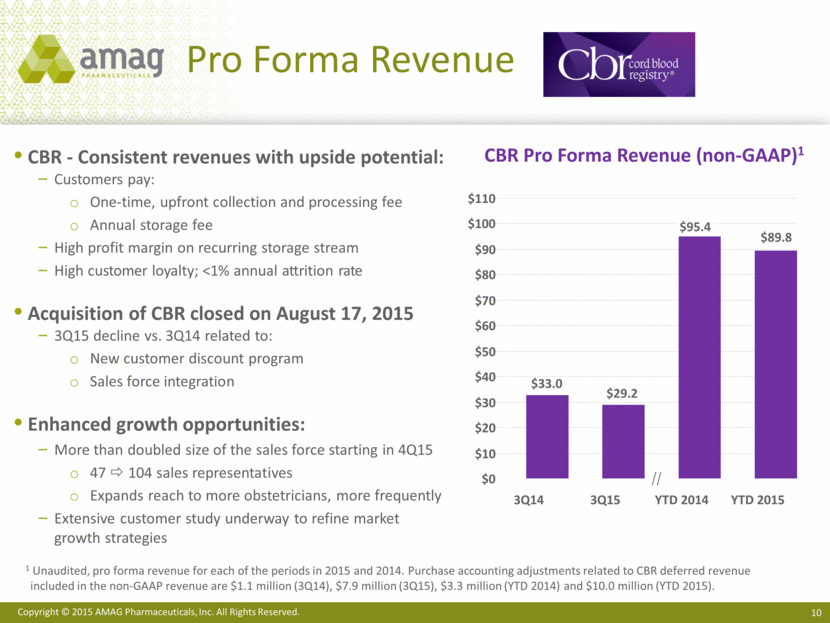
CBR - Consistent revenues with upside potential: Customers pay: One-time, upfront collection and processing fee Annual storage fee High profit margin on recurring storage stream High customer loyalty; <1% annual attrition rate Acquisition of CBR closed on August 17, 2015 3Q15 decline vs. 3Q14 related to: New customer discount program Sales force integration Enhanced growth opportunities: More than doubled size of the sales force starting in 4Q15 47 104 sales representatives Expands reach to more obstetricians, more frequently Extensive customer study underway to refine market growth strategies Pro Forma Revenue $100 $40 $110 $90 $70 $60 $80 $30 $20 $10 $0 $50 YTD 2014 3Q15 3Q14 $95.4 YTD 2015 CBR Pro Forma Revenue (non-GAAP)1 1 Unaudited, pro forma revenue for each of the periods in 2015 and 2014. Purchase accounting adjustments related to CBR deferred revenue included in the non-GAAP revenue are $1.1 million (3Q14), $7.9 million (3Q15), $3.3 million (YTD 2014) and $10.0 million (YTD 2015). $33.0 $29.2 $89.8
Hematology / Oncology and Hospital
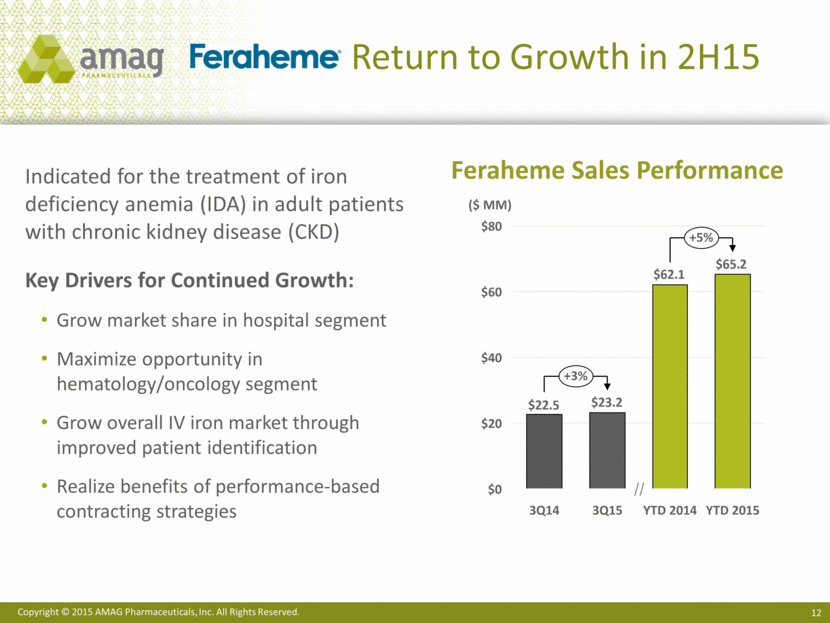
Return to Growth in 2H15 Indicated for the treatment of iron deficiency anemia (IDA) in adult patients with chronic kidney disease (CKD) Key Drivers for Continued Growth: Grow market share in hospital segment Maximize opportunity in hematology/oncology segment Grow overall IV iron market through improved patient identification Realize benefits of performance-based contracting strategies Feraheme Sales Performance $80 $60 $40 $20 $0 3Q15 3Q14 +3% +5% YTD 2015 YTD 2014 ($ MM) $65.2 $62.1 $23.2 $22.5
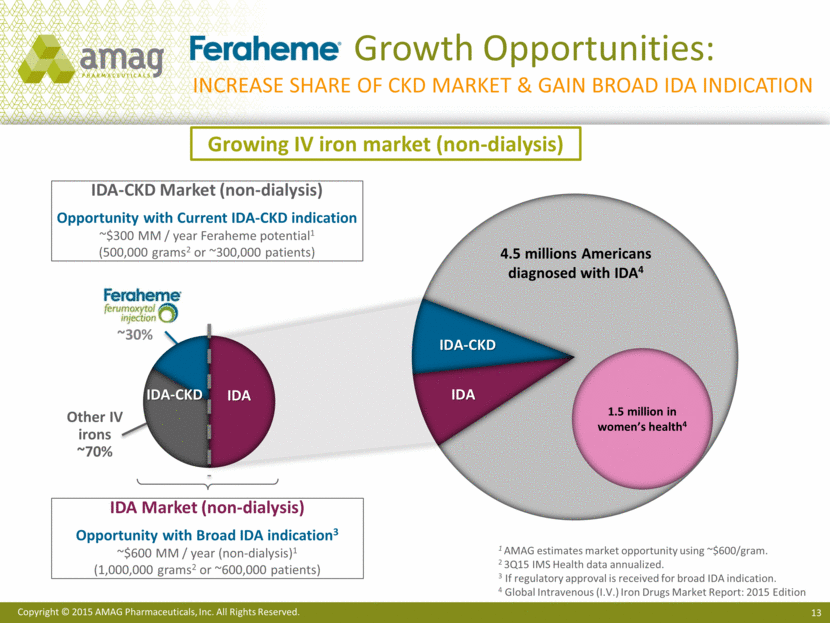
Growth Opportunities: Increase share of ckd market & Gain broad IDA indication ~30% 1 AMAG estimates market opportunity using ~$600/gram. 2 3Q15 IMS Health data annualized. 3 If regulatory approval is received for broad IDA indication. 4 Global Intravenous (I.V.) Iron Drugs Market Report: 2015 Edition Other IV irons ~70% IDA-CKD Market (non-dialysis) Opportunity with Current IDA-CKD indication ~$300 MM / year Feraheme potential1 (500,000 grams2 or ~300,000 patients) IDA Market (non-dialysis) Opportunity with Broad IDA indication3 ~$600 MM / year (non-dialysis)1 (1,000,000 grams2 or ~600,000 patients) Growing IV iron market (non-dialysis) IDA IDA-CKD 4.5 millions Americans diagnosed with IDA4 1.5 million in women’s health4 IDA - CKD IDA
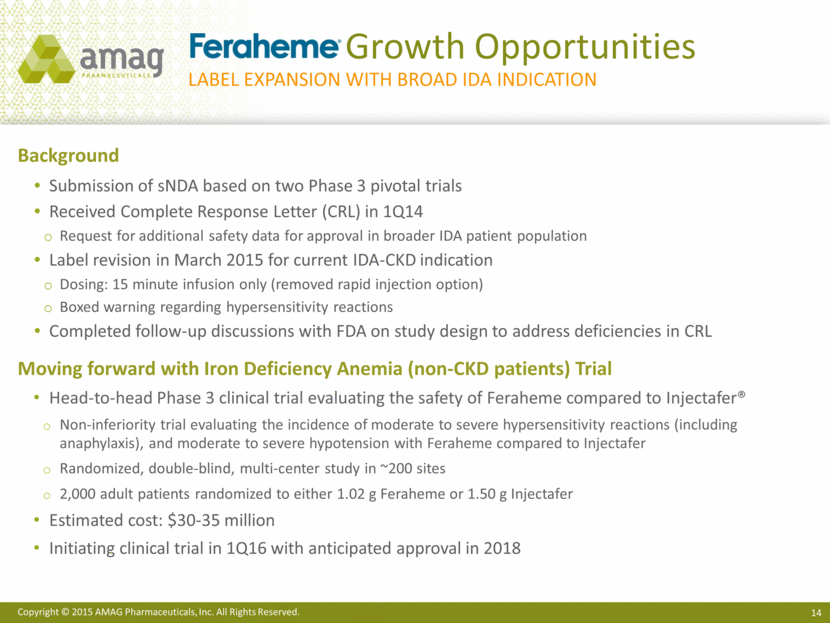
Growth Opportunities Background Submission of sNDA based on two Phase 3 pivotal trials Received Complete Response Letter (CRL) in 1Q14 Request for additional safety data for approval in broader IDA patient population Label revision in March 2015 for current IDA-CKD indication Dosing: 15 minute infusion only (removed rapid injection option) Boxed warning regarding hypersensitivity reactions Completed follow-up discussions with FDA on study design to address deficiencies in CRL Moving forward with Iron Deficiency Anemia (non-CKD patients) Trial Head-to-head Phase 3 clinical trial evaluating the safety of Feraheme compared to Injectafer® Non-inferiority trial evaluating the incidence of moderate to severe hypersensitivity reactions (including anaphylaxis), and moderate to severe hypotension with Feraheme compared to Injectafer Randomized, double-blind, multi-center study in ~200 sites 2,000 adult patients randomized to either 1.02 g Feraheme or 1.50 g Injectafer Estimated cost: $30-35 million Initiating clinical trial in 1Q16 with anticipated approval in 2018 Label expansion with Broad IDA indication
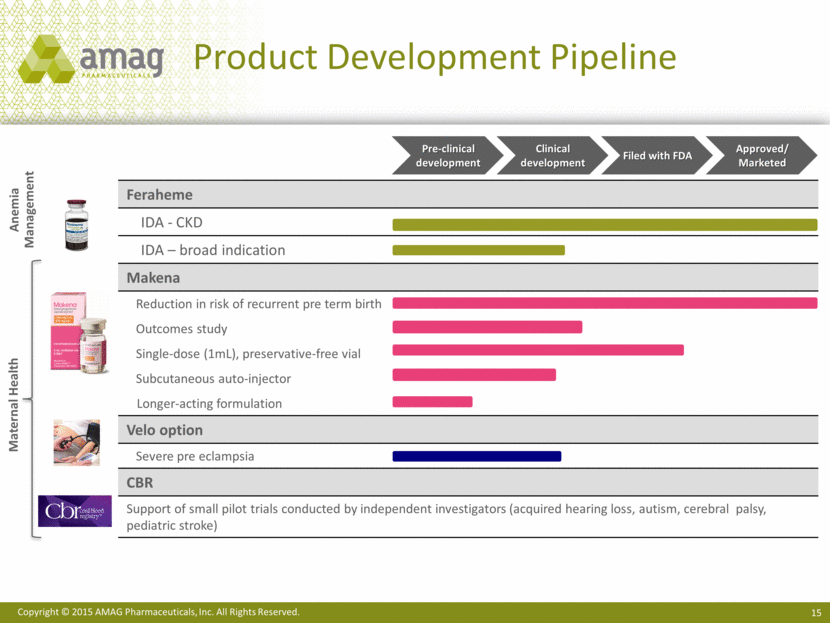
Feraheme IDA - CKD IDA – broad indication Makena Reduction in risk of recurrent pre term birth Outcomes study Single-dose (1mL), preservative-free vial Subcutaneous auto-injector Longer-acting formulation Velo option Severe pre eclampsia CBR Support of small pilot trials conducted by independent investigators (acquired hearing loss, autism, cerebral palsy, pediatric stroke) Product Development Pipeline Maternal Health Anemia Management Pre-clinical development Clinical development Filed with FDA Approved/ Marketed
Portfolio Expansion

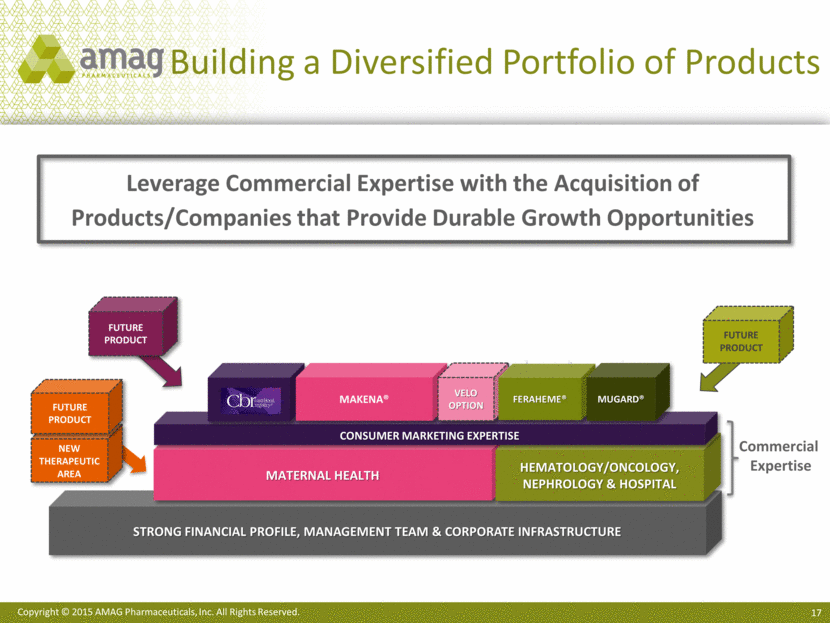
Building a Diversified Portfolio of Products Strong Financial profile, management team & corporate infrastructure Leverage Commercial Expertise with the Acquisition of Products/Companies that Provide Durable Growth Opportunities FUTURE PRODUCT Maternal Health Hematology/Oncology, Nephrology & Hospital Consumer marketing expertise FUTURE PRODUCT CBR Commercial Expertise Makena® Velo Option Feraheme® MuGard® FUTURE PRODUCT New Therapeutic Area
3Q15 Results & Financial Update

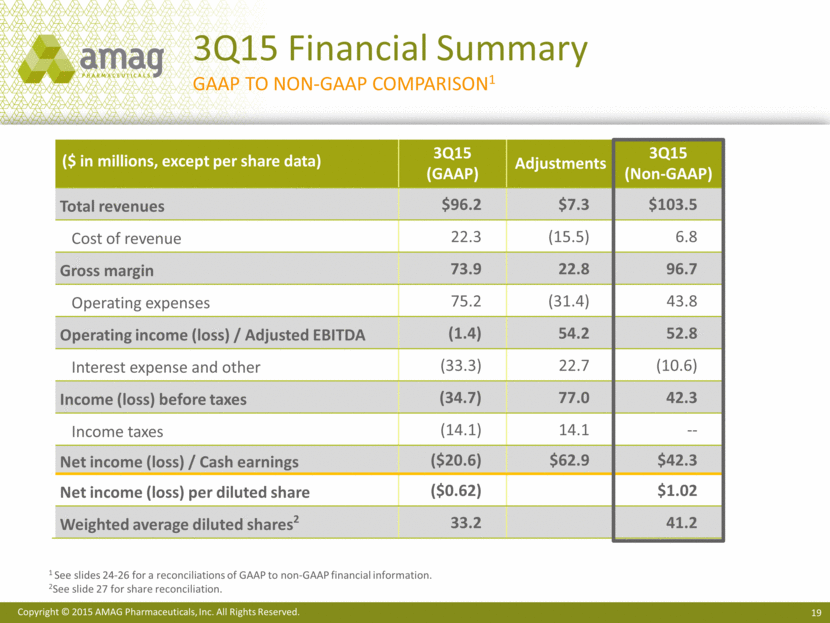
($ in millions, except per share data) 3Q15 (GAAP) Adjustments 3Q15 (Non-GAAP) Total revenues $96.2 $7.3 $103.5 Cost of revenue 22.3 (15.5) 6.8 Gross margin 73.9 22.8 96.7 Operating expenses 75.2 (31.4) 43.8 Operating income (loss) / Adjusted EBITDA (1.4) 54.2 52.8 Interest expense and other (33.3) 22.7 (10.6) Income (loss) before taxes (34.7) 77.0 42.3 Income taxes (14.1) 14.1 -- Net income (loss) / Cash earnings ($20.6) $62.9 $42.3 Net income (loss) per diluted share ($0.62) $1.02 Weighted average diluted shares2 33.2 41.2 3Q15 Financial Summary GAAP to NON-GAAP Comparison1 1 See slides 24-26 for a reconciliations of GAAP to non-GAAP financial information. 2See slide 27 for share reconciliation.
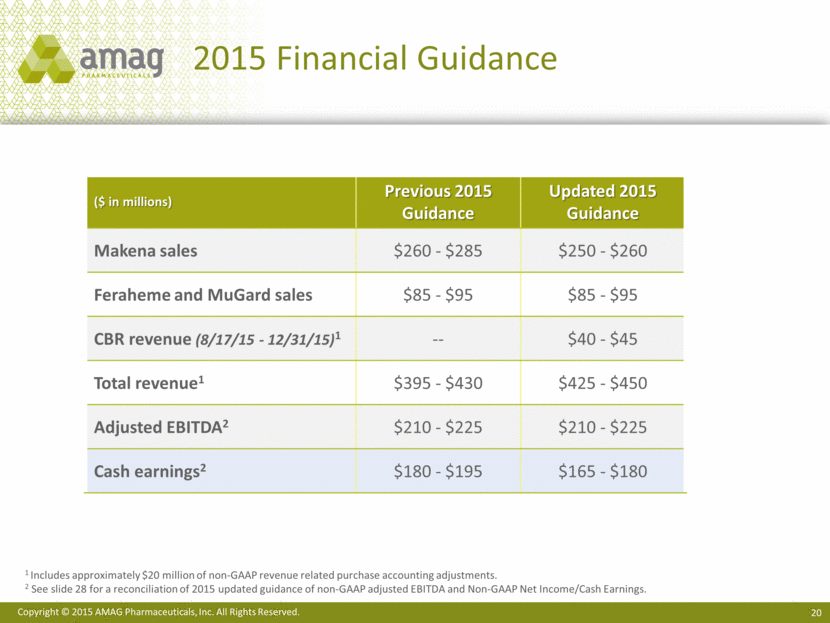
2015 Financial Guidance 1 Includes approximately $20 million of non-GAAP revenue related purchase accounting adjustments. 2 See slide 28 for a reconciliation of 2015 updated guidance of non-GAAP adjusted EBITDA and Non-GAAP Net Income/Cash Earnings. ($ in millions) Previous 2015 Guidance Updated 2015 Guidance Makena sales $260 - $285 $250 - $260 Feraheme and MuGard sales $85 - $95 $85 - $95 CBR revenue (8/17/15 - 12/31/15)1 -- $40 - $45 Total revenue1 $395 - $430 $425 - $450 Adjusted EBITDA2 $210 - $225 $210 - $225 Cash earnings2 $180 - $195 $165 - $180
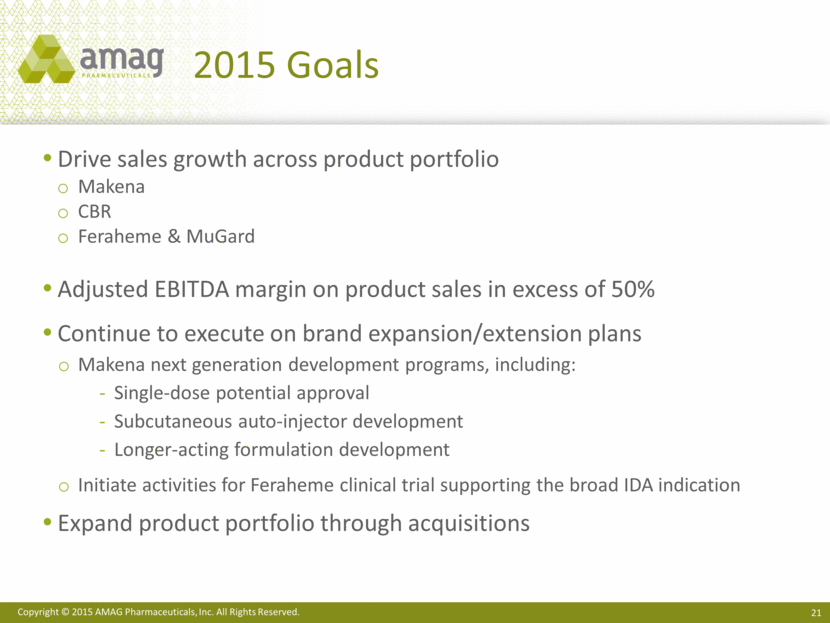
2015 Goals Drive sales growth across product portfolio Makena CBR Feraheme & MuGard Adjusted EBITDA margin on product sales in excess of 50% Continue to execute on brand expansion/extension plans Makena next generation development programs, including: Single-dose potential approval Subcutaneous auto-injector development Longer-acting formulation development Initiate activities for Feraheme clinical trial supporting the broad IDA indication Expand product portfolio through acquisitions
AMAG Pharmaceuticals 3Q15 Financial Results November 3, 2015
AMAG Pharmaceuticals Appendix 3Q 2015 Financial Results November 3, 2015
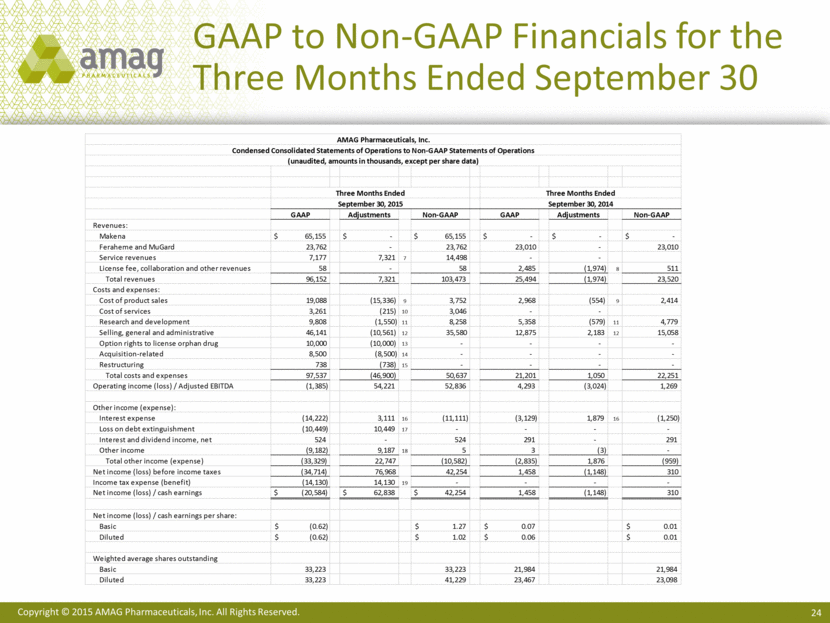
GAAP to Non-GAAP Financials for the Three Months Ended September 30 AMAG Pharmaceuticals, Inc. Condensed Consolidated Statements of Operations to Non-GAAP Statements of Operations (unaudited, amounts in thousands, except per share data) Three Months Ended Three Months Ended September 30, 2015 September 30, 2014 GAAP Adjustments Non-GAAP GAAP Adjustments Non-GAAP Revenues: Makena $ 65,155 $ - $ 65,155 $ - $ - $ - Feraheme and MuGard 23,762 - 23,762 23,010 - 23,010 Service revenues 7,177 7,321 7 14,498 - - License fee, collaboration and other revenues 58 - 58 2,485 (1,974) 8 511 Total revenues 96,152 7,321 103,473 25,494 (1,974) 23,520 Costs and expenses: Cost of product sales 19,088 (15,336) 9 3,752 2,968 (554) 9 2,414 Cost of services 3,261 (215) 10 3,046 - - Research and development 9,808 (1,550) 11 8,258 5,358 (579) 11 4,779 Selling, general and administrative 46,141 (10,561) 12 35,580 12,875 2,183 12 15,058 Option rights to license orphan drug 10,000 (10,000) 13 - - - - Acquisition-related 8,500 (8,500) 14 - - - - Restructuring 738 (738) 15 - - - - Total costs and expenses 97,537 (46,900) 50,637 21,201 1,050 22,251 Operating income (loss) / Adjusted EBITDA (1,385) 54,221 52,836 4,293 (3,024) 1,269 Other income (expense): Interest expense (14,222) 3,111 16 (11,111) (3,129) 1,879 16 (1,250) Loss on debt extinguishment (10,449) 10,449 17 - - - - Interest and dividend income, net 524 - 524 291 - 291 Other income (9,182) 9,187 18 5 3 (3) - Total other income (expense) (33,329) 22,747 (10,582) (2,835) 1,876 (959) Net income (loss) before income taxes (34,714) 76,968 42,254 1,458 (1,148) 310 Income tax expense (benefit) (14,130) 14,130 19 - - - - Net income (loss) / cash earnings $ (20,584) $ 62,838 $ 42,254 1,458 (1,148) 310 Net income (loss) / cash earnings per share: Basic $ (0.62) $ 1.27 $ 0.07 $ 0.01 Diluted $ (0.62) $ 1.02 $ 0.06 $ 0.01 Weighted average shares outstanding Basic 33,223 33,223 21,984 21,984 Diluted 33,223 41,229 23,467 23,098
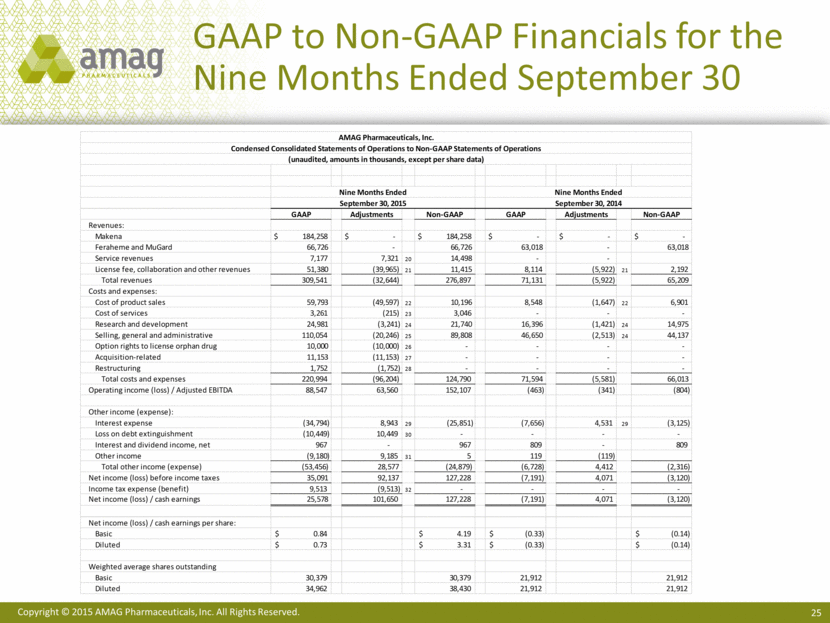
GAAP to Non-GAAP Financials for the Nine Months Ended September 30 AMAG Pharmaceuticals, Inc. Condensed Consolidated Statements of Operations to Non-GAAP Statements of Operations (unaudited, amounts in thousands, except per share data) Nine Months Ended Nine Months Ended September 30, 2015 September 30, 2014 GAAP Adjustments Non-GAAP GAAP Adjustments Non-GAAP Revenues: Makena $ 184,258 $ - $ 184,258 $ - $ - $ - Feraheme and MuGard 66,726 - 66,726 63,018 - 63,018 Service revenues 7,177 7,321 20 14,498 - - License fee, collaboration and other revenues 51,380 (39,965) 21 11,415 8,114 (5,922) 21 2,192 Total revenues 309,541 (32,644) 276,897 71,131 (5,922) 65,209 Costs and expenses: Cost of product sales 59,793 (49,597) 22 10,196 8,548 (1,647) 22 6,901 Cost of services 3,261 (215) 23 3,046 - - - Research and development 24,981 (3,241) 24 21,740 16,396 (1,421) 24 14,975 Selling, general and administrative 110,054 (20,246) 25 89,808 46,650 (2,513) 24 44,137 Option rights to license orphan drug 10,000 (10,000) 26 - - - - Acquisition-related 11,153 (11,153) 27 - - - - Restructuring 1,752 (1,752) 28 - - - - Total costs and expenses 220,994 (96,204) 124,790 71,594 (5,581) 66,013 Operating income (loss) / Adjusted EBITDA 88,547 63,560 152,107 (463) (341) (804) Other income (expense): Interest expense (34,794) 8,943 29 (25,851) (7,656) 4,531 29 (3,125) Loss on debt extinguishment (10,449) 10,449 30 - - - - Interest and dividend income, net 967 - 967 809 - 809 Other income (9,180) 9,185 31 5 119 (119) Total other income (expense) (53,456) 28,577 (24,879) (6,728) 4,412 (2,316) Net income (loss) before income taxes 35,091 92,137 127,228 (7,191) 4,071 (3,120) Income tax expense (benefit) 9,513 (9,513) 32 - - - - Net income (loss) / cash earnings 25,578 101,650 127,228 (7,191) 4,071 (3,120) Net income (loss) / cash earnings per share: Basic $ 0.84 $ 4.19 $ (0.33) $ (0.14) Diluted $ 0.73 $ 3.31 $ (0.33) $ (0.14) Weighted average shares outstanding Basic 30,379 30,379 21,912 21,912 Diluted 34,962 38,430 21,912 21,912
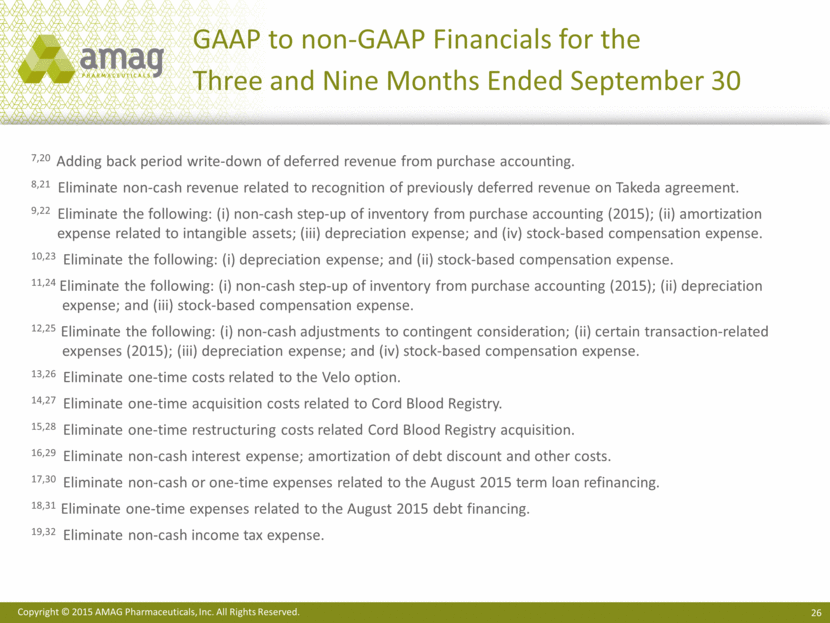
GAAP to non-GAAP Financials for the Three and Nine Months Ended September 30 7,20 Adding back period write-down of deferred revenue from purchase accounting. 8,21 Eliminate non-cash revenue related to recognition of previously deferred revenue on Takeda agreement. 9,22 Eliminate the following: (i) non-cash step-up of inventory from purchase accounting (2015); (ii) amortization expense related to intangible assets; (iii) depreciation expense; and (iv) stock-based compensation expense. 10,23 Eliminate the following: (i) depreciation expense; and (ii) stock-based compensation expense. 11,24 Eliminate the following: (i) non-cash step-up of inventory from purchase accounting (2015); (ii) depreciation expense; and (iii) stock-based compensation expense. 12,25 Eliminate the following: (i) non-cash adjustments to contingent consideration; (ii) certain transaction-related expenses (2015); (iii) depreciation expense; and (iv) stock-based compensation expense. 13,26 Eliminate one-time costs related to the Velo option. 14,27 Eliminate one-time acquisition costs related to Cord Blood Registry. 15,28 Eliminate one-time restructuring costs related Cord Blood Registry acquisition. 16,29 Eliminate non-cash interest expense; amortization of debt discount and other costs. 17,30 Eliminate non-cash or one-time expenses related to the August 2015 term loan refinancing. 18,31 Eliminate one-time expenses related to the August 2015 debt financing. 19,32 Eliminate non-cash income tax expense.
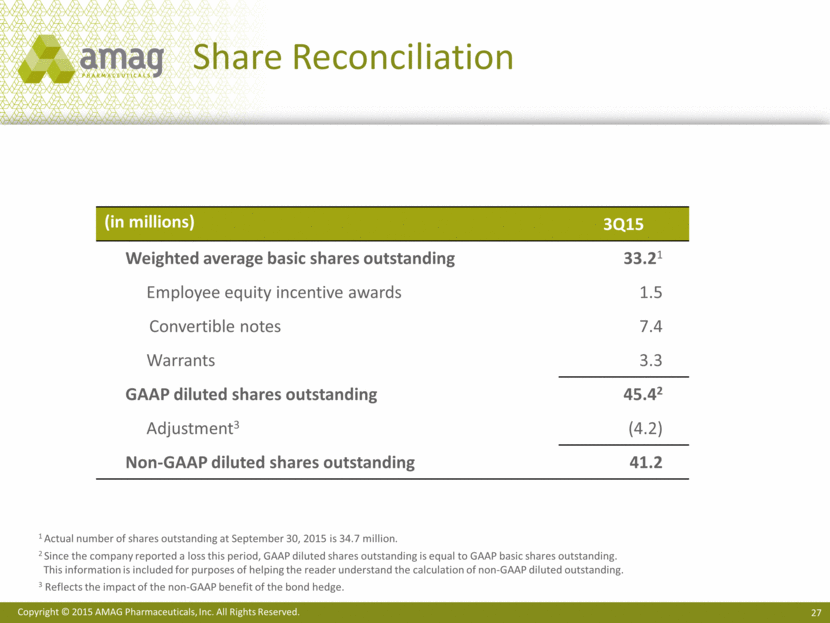
Share Reconciliation 1 Actual number of shares outstanding at September 30, 2015 is 34.7 million. 2 Since the company reported a loss this period, GAAP diluted shares outstanding is equal to GAAP basic shares outstanding. This information is included for purposes of helping the reader understand the calculation of non-GAAP diluted outstanding. 3 Reflects the impact of the non-GAAP benefit of the bond hedge. (in millions) 3Q15 Weighted average basic shares outstanding 33.21 Employee equity incentive awards 1.5 Convertible notes 7.4 Warrants 3.3 GAAP diluted shares outstanding 45.42 Adjustment3 (4.2) Non-GAAP diluted shares outstanding 41.2
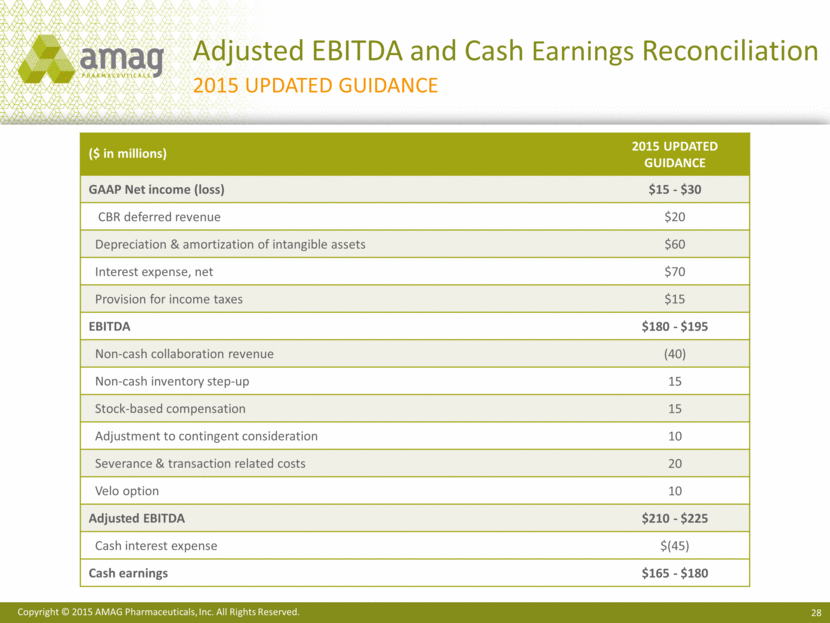
Adjusted EBITDA and Cash Earnings Reconciliation 2015 Updated Guidance ($ in millions) 2015 Updated Guidance GAAP Net income (loss) $15 - $30 CBR deferred revenue $20 Depreciation & amortization of intangible assets $60 Interest expense, net $70 Provision for income taxes $15 EBITDA $180 - $195 Non-cash collaboration revenue (40) Non-cash inventory step-up 15 Stock-based compensation 15 Adjustment to contingent consideration 10 Severance & transaction related costs 20 Velo option 10 Adjusted EBITDA $210 - $225 Cash interest expense $(45) Cash earnings $165 - $180
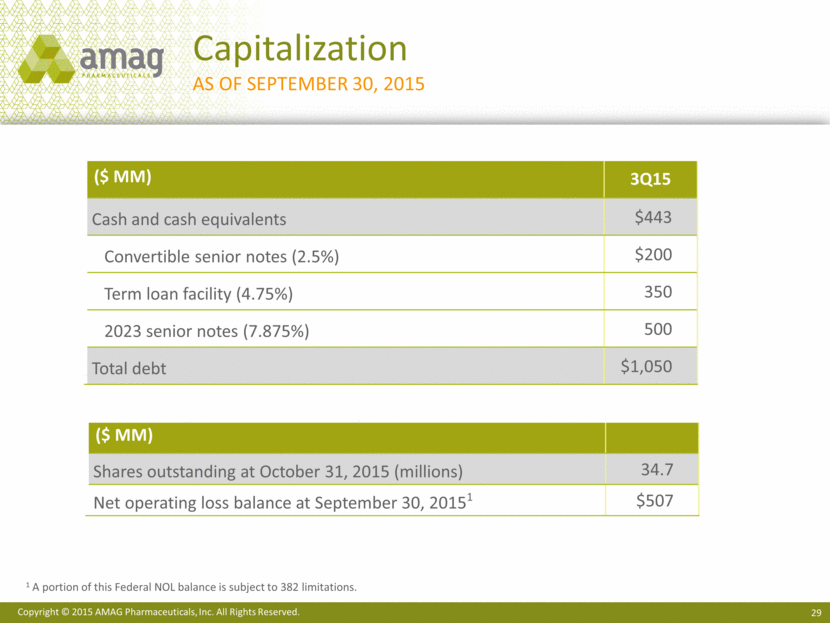
($ MM) 3Q15 Cash and cash equivalents $443 Convertible senior notes (2.5%) $200 Term loan facility (4.75%) 350 2023 senior notes (7.875%) 500 Total debt $1,050 Capitalization As of September 30, 2015 ($ MM) Shares outstanding at October 31, 2015 (millions) 34.7 Net operating loss balance at September 30, 20151 $507 1 A portion of this Federal NOL balance is subject to 382 limitations.
AMAG Pharmaceuticals 3Q15 Financial Results November 3, 2015

