Attached files
| file | filename |
|---|---|
| 8-K - FORM 8-K - Great Ajax Corp. | t1502510_8k.htm |
| EX-10.1 - EXHIBIT 10.1 - Great Ajax Corp. | t1502510_ex10-1.htm |
| EX-99.1 - EXHIBIT 99.1 - Great Ajax Corp. | t1502510_ex99-1.htm |
Exhibit 99.2

Third Quarter Earnings Conference Call November 2, 2015

Safe Harbor Disclosure 2 □ We make forward - looking statements in this presentation that are subject to risks and uncertainties. These forward - looking statements include information about possible or assumed future results of our business, financial condition, liquidity, resu lts of operations, cash flow and plans and objectives. When we use the words “believe,” “expect,” “anticipate,” “estimate,” “plan,” “continue,” “intend,” “should,” “may” or similar expressions, we intend to identify forward - looking statements. □ Statements regarding the following subjects, among others, may be forward - looking: market trends in our industry, interest rates, real estate values, the debt financing markets or the general economy or the demand for residential real estate loans; our business and investment strategy; our projected operating results; actions and initiatives of the U.S. government and changes to U.S. government policies and the execution and impact of these actions, initiatives and policies; the state of the U.S. economy generally or in specific geographic regions; economic trends and economic recoveries; our ability to obtain and maintain financing arrangements; changes in the value of our mortgage portfolio; changes to our portfolio of properties; impact of and changes in governmental regulations, tax law and rates, accounting guidance and similar matters; our ability to satisfy the REIT qualification requirements for U.S. federal income tax purposes; availability of qualified personnel; estima tes relating to our ability to make distributions to our shareholders in the future; general volatility of the capital markets an d t he market price of our shares of common stock; and degree and nature of our competition. □ The forward - looking statements are based on our beliefs, assumptions and expectations of our future performance, taking into account all information currently available to us. Forward - looking statements are not predictions of future events. These beliefs, assumptions and expectations can change as a result of many possible events or factors, not all of which are known t o us. If a change occurs, our business, financial condition, liquidity and results of operations may vary materially from those expressed in our forward - looking statements. Furthermore, forward - looking statements are subject to risks and uncertainties, including, among other things, those described under Item 1A of our Annual Report on Form 10 - K for the year ended December 31, 2014, which can be accessed through the link to our SEC filings on our website ( www.great - ajax.com ) or at the SEC's website ( www.sec.gov ). Other risks, uncertainties, and factors that could cause actual results to differ materially from those projected may be described from time to time in reports we file with the SEC, including reports on Forms 10 - Q, 10 - K and 8 - K. Any forward - looking statement speaks only as of the date on which it is made. New risks and uncertainties arise over time, and it is not possible for us to predict those events or how they may affect us. Except as required by law, we are not obligated to, and do not intend to, update or revise any forward - looking statements, whether as a result of new information, future events or otherwise.

Business Overview 3 □ Leverage long - standing relationships to acquire loans through privately negotiated transactions from a diverse group of customers – Over 90% of acquisitions by Great Ajax Corp. have been privately negotiated – Acquisitions made in 112 transactions □ Use our manager’s proprietary analytics to price each pool on an asset - by - asset basis □ Adjust individual loan bid price to accumulate clusters of loans in attractive demographic metropolitan areas – Typical acquisitions contain 25 – 100 loans with total market value between $5 – $20 million □ Our affiliated servicer services the loans asset - by - asset and borrower - by - borrower □ Objective is to maximize returns for each asset by utilizing full menu of loss mitigation and asset optimization techniques □ Use moderate non - mark - to - market leverage – Corporate leverage of 1.43x – Five securitizations since inception totaling $537.4 million of loan UPB. Approximate leverage of 2.48x from the sale of senior bonds

Highlights - Third Quarter 2015 4 □ Acquired re - performing mortgage loans with aggregate unpaid principal balance (“UPB”) of $91.8 million for total purchase price of $66.8 million at an average price to UPB approximately equal to 72.9% □ At September 30, 2015 owned a portfolio of 2,965 mortgage loans with aggregate UPB of $679.2 million and 64 properties □ Net interest income of $10.6 million and $24.9 million for the three months and nine months ended September 30, 2015, respectively, compared to $2.3 million for the period from commenced operations (July 8, 2014) through September 30, 2014 □ Net income attributable to common stockholders of $7.6 million and $16.7 million for the three and nine month periods, respectively, compared to $1.0 million for the period from commenced operations (July 8, 2014) through September 30, 2014 □ GAAP net income of $0.50 per diluted share and $1.15 per diluted share for the three and nine months ended September 30, 2015, respectively, compared to $0.13 per diluted share for the period from commenced operations (July 8, 2014) through September 30, 2014 □ Taxable net income for the three and nine months ended September 30, 2015 of $0.11 per diluted share and $0.46 per diluted share respectively, compared to $0.02 for the period from commenced operations (July 8, 2014) though September 30, 2014

Portfolio Overview – as of September 30, 2015 5 $679.2 MM $772.0 MM 83.4% 16.6% UPB as of Sep 30 2015 RPL NPL 83.2% 15.1% 1.6% Property Value as of Sep 30 2015 RPL NPL REO

Portfolio Growth 6 $64 $221 $481 $567 $84 $118 $113 0 100 200 300 400 500 600 700 800 Initial Assets (07/08/14) 12/31/2014 6/30/2015 9/30/2015 Millions NPLs RPLs Unpaid Principal Balance

Portfolio Growth 7 Re - performing Loans $64 $221 $481 $567 $73 $230 $541 $643 $49 $163 $375 $435 0 100 200 300 400 500 600 700 Initial Assets (07/08/14) 12/31/2014 6/30/2015 9/30/2015 Millions UPB BPO Price

Portfolio Growth 8 $84 $118 $113 $84 $122 $117 $50 $66 $64 0 20 40 60 80 100 120 140 Initial Assets (07/08/14) 12/31/2014 6/30/2015 9/30/2015 Millions UPB BPO Price Non - performing Loans

Portfolio Concentrated in Attractive Markets 9 □ Clusters of loans in attractive, densely populated markets □ Stable liquidity and home prices □ Over 80% of the portfolio in our target markets Target States Target Markets Los Angeles San Diego Dallas Houston Phoenix Washington DC Metro Area Chicago Atlanta Orlando Tampa Miami, Ft. Lauderdale, W. Palm Beach New York / New Jersey Metro Area Las Vegas REIT, Servicer & Manager Headquarters Property Management Business Management

Building Net Asset Value 10 This illustration has not been prepared in accordance with GAAP and is not intended to constitute a non - GAAP financial measure, but rather an additional tool for investors to consider. In evaluating our financial results, management regularly considers the following analysis, which is intended to arrive at a “ne t asset value” equivalent. Based on the leverage from the five securitizations, securitization investors value our loan portfolio at between $ 18.49 and $19.14 per share. As shown below, at September 30, 2015, if we were to lever our whole loan portfolio through a securitization, the face value of the equity tranche would be approximately $183.4MM under scenario 1 where the senior attachment point is 63% (similar to our most recent securitization) and $169.8 MM under scenario 2 where the senior attachment point is 55% (similar to the previous securitizati on) . Given that our securitization investors currently value the equity tranche at between 30% - 50%, using the average 40%, the value of our equi ty tranche would be $73.4MM under scenario 1, which is $61.3MM or $3.85 per share over the remaining basis of $12.0MM. Our current book va lue per share is $14.64. By contrast, our current NAV based on this securitization analysis would be the sum of $14.64 and $3.85, or $1 8.49 per share. Entire Portfolio 9/30/2015 UPB $679,231,350 Price $496,518,117 Book Value / Share $14.64 Leverage (Bond Face/UPB) Bond Face Value Bond Price Net Proceeds Equity Basis Implied value/Share Implied NAV Per Share Senior 63% $427,915,751 98.3% $420,730,746 B1 5% $33,961,568 97.7% $33,176,206 B2 5% $33,961,568 90% $30,565,411 Equity - Trust Certificate $183,392,465 40% $73,356,986 $12,045,754 $3.85 $18.49 Leverage (Bond Face/UPB) Bond Face Value Bond Price Net Proceeds Equity Basis Implied value/Share Implied NAV Per Share Senior 55% $373,577,243 99.8% $372,780,440 B1 10% $67,923,135 97.7% $66,352,413 B2 10% $67,923,135 90% $61,130,822 Equity - Trust Certificate $169,807,838 40% $67,923,135 - $3,745,557 $4.50 $19.14

Subsequent Events 11 □ Fifth securitization closed on October 30, 2015 □ Approximate leverage of 2.79x from the sale of senior bonds □ Senior bond interest rate of 3.875% □ October Acquisitions □ RPL □ UPB: $4.6 MM □ Collateral Value: $6.7 MM □ Price/UPB: 79.3% □ Price/Collateral Value: 54.6% □ November Acquisitions* □ RPL □ UPB: $47.9 MM □ Collateral Value: $57.1 MM □ Price/UPB: 75.0% □ Price/Collateral Value: 62.9% □ NPL □ UPB: $0.5 MM □ Collateral Value: $0.6 MM □ Price/UPB: 64.1% □ Price/Collateral Value: 49.7% * While these acquisitions are expected to close by November 30, 2015, there can be no assurance that these acquisition agreem ent s will close or that the terms thereof may not change.
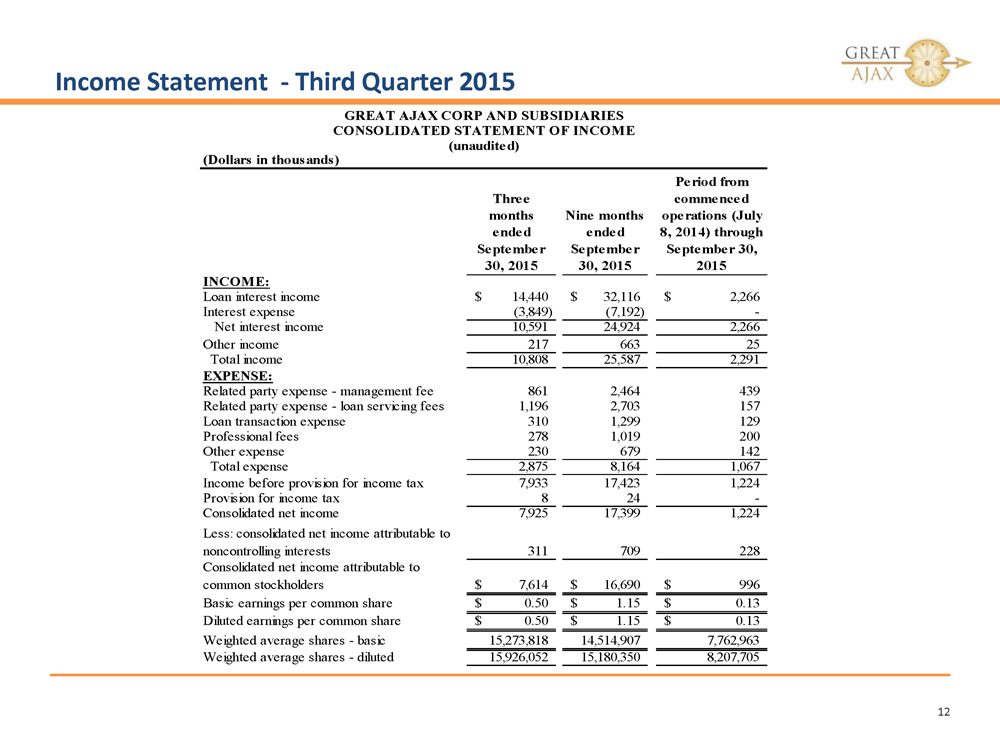
Income Statement - Third Quarter 2015 12 GREAT AJAX CORP AND SUBSIDIARIESCONSOLIDATED STATEMENT OF INCOME (unaudited) (Dollars in thousands) Three months ended September 30, 2015 Nine months ended September 30, 2015 Period from commenced operations (July 8, 2014) through September 30, 2015 INCOME: Loan interest income 14,440$ 32,116$ 2,266$ Interest expense (3,849) (7,192) - Net interest income 10,591 24,924 2,266 Other income 217 663 25 Total income 10,808 25,587 2,291 EXPENSE: Related party expense - management fee 861 2,464 439 Related party expense - loan servicing fees 1,196 2,703 157 Loan transaction expense 310 1,299 129 Professional fees 278 1,019 200 Other expense 230 679 142 Total expense 2,875 8,164 1,067 Income before provision for income tax 7,933 17,423 1,224 Provision for income tax 8 24 - Consolidated net income 7,925 17,399 1,224 311 709 228 7,614$ 16,690$ 996$ Basic earnings per common share 0.50$ 1.15$ 0.13$ Diluted earnings per common share 0.50$ 1.15$ 0.13$ Weighted average shares - basic 15,273,818 14,514,907 7,762,963 Weighted average shares - diluted 15,926,052 15,180,350 8,207,705 Less: consolidated net income attributable to noncontrolling interests Consolidated net income attributable to common stockholders

Balance Sheet as of September 30, 2015 13 (1) Mortgage loans includes $291,314 and $127,559 of loans transferred to variable interest entities (“VIEs”) at September 30, 2 015 and December 31, 2014, respectively, that can only be used to settle obligations of the VIEs. Secured borrowings consists of notes issued by VI Es that can only be settled with the assets and cash flows of the VIEs. The creditors do not have recourse to the primary beneficiary (Great Ajax Co rp). GREAT AJAX CORP AND SUBSIDIARIES CONSOLIDATED BALANCE SHEETS (unaudited) ASSETS September 30, 2015 December 31, 2014 Cash and cash equivalents 28,507$ 53,099$ Mortgage loans, net (1) 510,594 211,159 Property held-for-sale 9,168 1,316 Rental property, net 121 290 Receivable from servicer 6,458 1,340 Investment in affiliate 2,532 2,237 Prepaid expenses and other assets 8,218 3,317 Total Assets 565,598$ 272,758$ LIABILITIES AND EQUITY Liabilities: Secured borrowings (1) 197,836$ 84,679$ Borrowings under repurchase agreement 130,798 15,249 Management fee payable 646 258 Accrued expenses and other liabilities 3,209 1,292 Total liabilities 332,489 101,478 Equity: - - 152 112 Additional paid-in capital 211,595 158,951 Retained earnings 11,530 2,744 Noncontrolling interests 9,832 9,473 Total equity 233,109 171,280 Total Liabilities and Equity 565,598$ 272,758$ Preferred stock $.01 par value; 25,000,000 shares Common stock $.01 par value; 125,000,000 shares authorized, 15,285,528 and 11,223,984 shares issued and outstanding, respectively authorized, none issued or outstanding