Attached files
| file | filename |
|---|---|
| 8-K - FORM 8-K - UNITED COMMUNITY FINANCIAL CORP | d87346d8k.htm |
 Raymond James Presentation November 2, 2015 Presenter: Gary Small - President and Chief Executive Officer EXHIBIT 99 |
 When used
in this presentation the words or phrases “will likely result,” “are expected to,” “will continue,” “is anticipated,” “estimates,” “projects” or similar expressions are intended to identify “forward-looking
statements” within the meaning of the Private Securities Litigation
Reform Act of 1995. Such statements are subject to certain risks and
uncertainties, including changes in economic conditions in United Community’s market area, changes in policies by regulatory agencies, fluctuations in interest rates, demand for loans in
Home Savings’ market area, and competition, that could cause actual results to
differ materially from results presently anticipated or projected. United
Community cautions readers not to place undue reliance on any such
forward-looking statements, which speak only as of the date made. United Community advises readers that the factors listed above could affect United Community’s financial performance and could cause United
Community’s actual results for future periods to differ materially from any
opinions or statements expressed with respect to future periods in any
current statements. United Community undertakes no obligation to update
any forward-looking statement to reflect events or circumstances after the date on which the statement is made. Actual results may differ materially from our statements due to a number of risks and
uncertainties, including those described in the Company’s Form 10-K for the
year ended December 31, 2014 and subsequent filings. Please refer
to these SEC documents for a complete list of risk factors.
Forward-Looking Statement Disclosure
2 |
 This
presentation contains financial information determined by methods other than those prescribed by accounting principles generally accepted in the United States of America ("GAAP"). Management uses these non-GAAP financial measures because it believes that they are useful for evaluating our operations and
performance over periods of time, as well as in managing and evaluating our business
and in discussions about our operations and performance. Management
believes these non-GAAP financial measures provide users of our financial information with meaningful measures for assessing our financial results, as well as a comparison to financial results for prior periods. These non-GAAP financial measures
should not be considered as a substitute for financial measures
determined in accordance with GAAP and may not be comparable to other similarly titled financial measures used by other companies. A reconciliation of the differences between our non-GAAP financial measures and the
most comparable GAAP measures accompanies the use of such non-GAAP
financial measures within the body of this presentation.
Non-GAAP Financial Measures
3 Dec. 2013 Dec. 2014 Dec. 2015 Total equity/Total assets 10.1% 13.1% 12.4% Tangible common equity/Tangible assets (non-GAAP) 10.1% 13.1% 12.4% On page 20, UCFC uses a non-GAAP financial measure, the tangible common equity to tangible assets ratio (TCE), to provide information
for investors to effectively analyze financial trends of ongoing business
activities, and to enhance comparability with peers across the financial
sector. We believe TCE is useful because it is a measure utilized by regulators, market analysts and investors in evaluating a Company’s financial condition and capital strength. TCE, as defined by us, represents common equity less core deposit intangible
assets. A reconciliation from our GAAP total equity to total assets ratio
to the non-GAAP tangible common equity to tangible assets ratio is
presented below. |
 4 Loan Offices Branch Locations Company Profile |
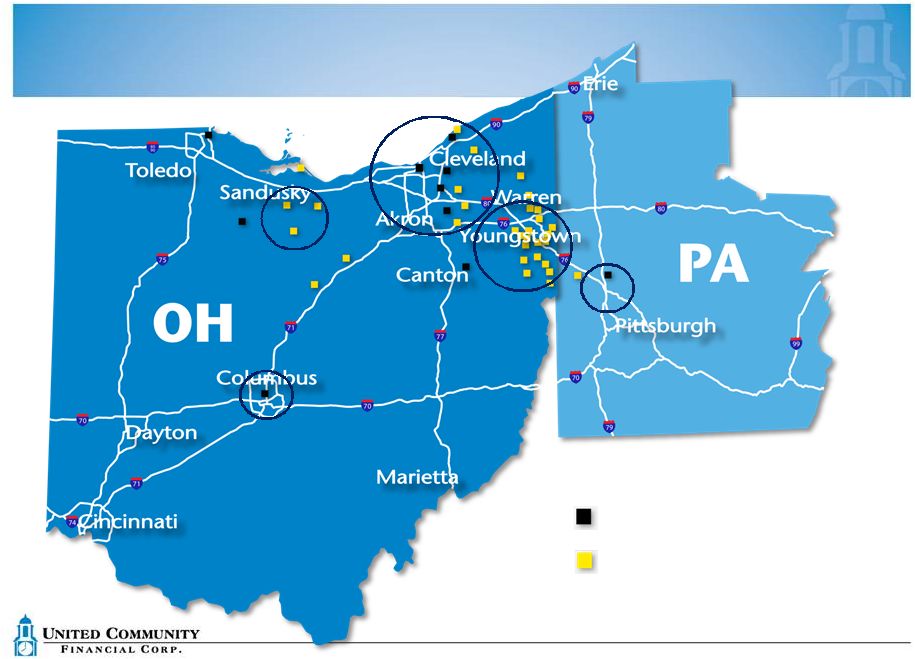 5 Loan Offices Branch Locations Size of circle corresponds to relative size of the bank’s business in that market Loan Balances by Region |
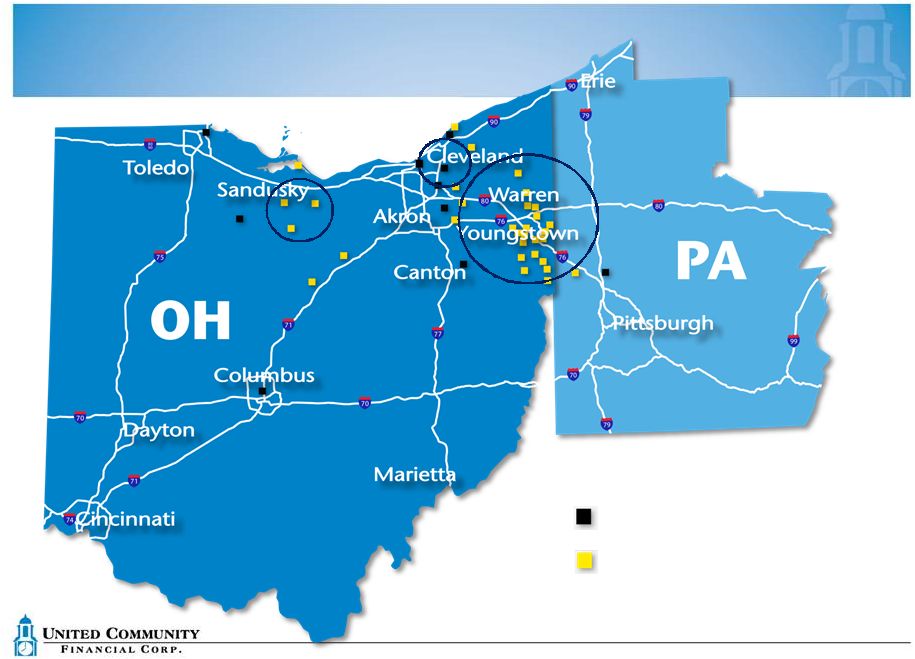 6 Loan Offices Branch Locations Size of circle corresponds to relative size of the bank’s business in that market Deposit Balances by Region |
 • Net income of $4.1 million • ROA of 0.85% and ROE of 6.87% • Annualized loan growth of 17.8% • Maintained improved efficiency ratio of 63.5% • Tangible book value improved to $5.12 per share • Dividend of $0.025 per common share declared 7 2015 Third Quarter Highlights |
 CRE,
Commercial and Commercial Construction Residential, residential
construction and AFS Consumer
Balance in millions Loan Composition (including AFS) $639 $752 $765 $778 $802 $226 $253 $270 $313 $343 $189 $181 $181 $184 $187 4Q '13 4Q '14 1Q '15 2Q '15 3Q '15 $1,054 $1,186 $1,216 4.99% 4.47% 4.46% 4.41% 8 $1,275 4.32% $1,332 4.29% |
 Balance
in millions Commercial Loan Growth
Commercial Balances
Unfunded Commercial Commitments
$237 $309 $330 9 $397 $426 $222 $251 $270 $313 $343 $15 $58 $60 $84 $83 $100 $200 $300 $400 $500 4Q '13 4Q '14 1Q '15 2Q '15 3Q '15 |
 Balance
in millions Commercial Loan Composition
10 Commercial balances are estimates for year end 2015. Total balances are estimated to be $366MM. 21.9% 22.7% 19.9% 9.0% 26.5% $0 $50 $100 C&I Multi-Family CRE - Non Owner Occupied CRE - Owner Occupied Comm'l Const. |
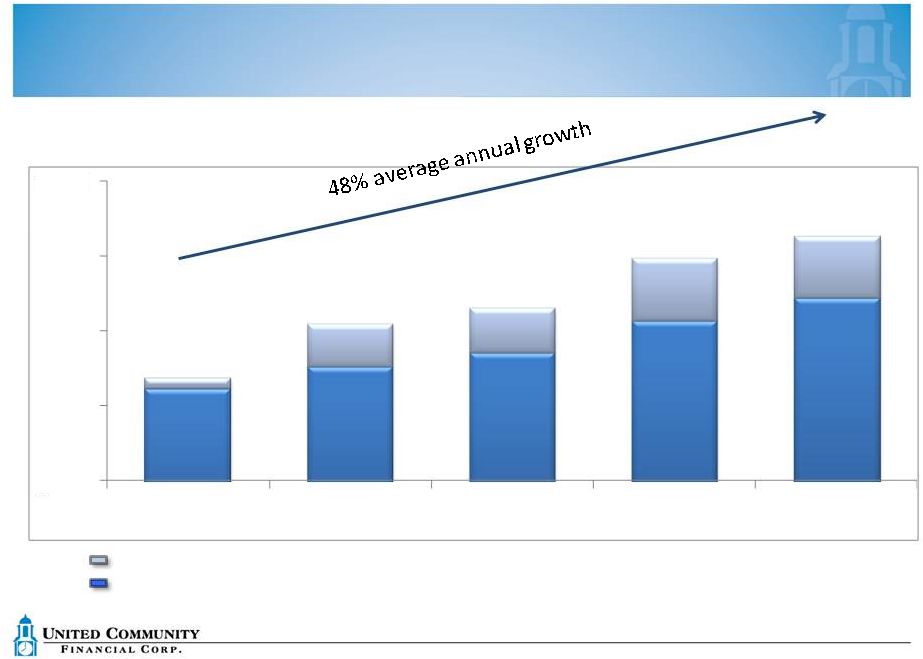
 Balance
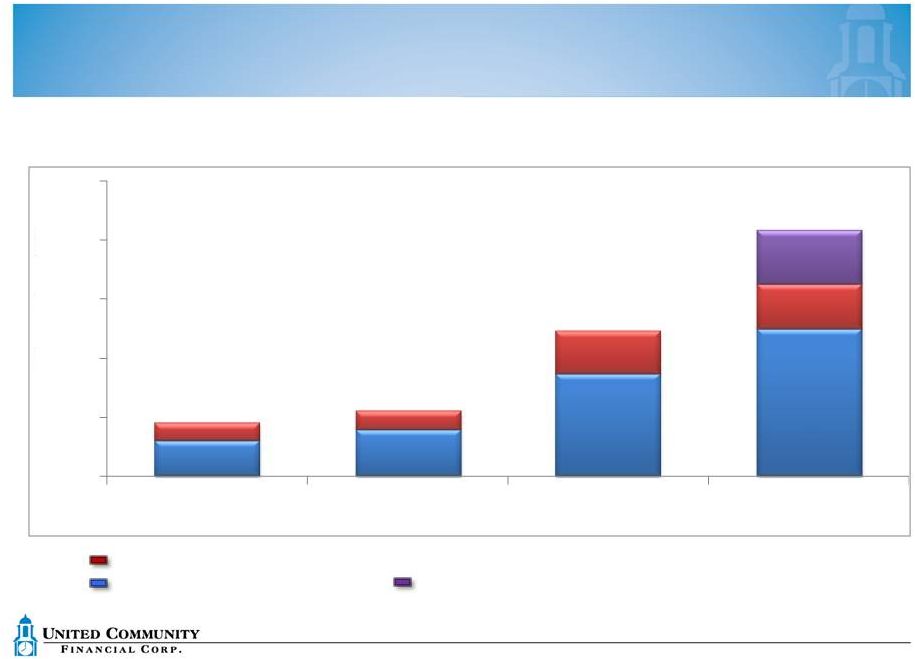
in millions Commercial Loan Origination Growth
CRE and Commercial Construction
C&I $45 $55 $123 11 $208 Projected Commercial Originations 4 quarter of 2015 $30 $39 $87 $125 $15 $16 $36 $38 $45 $0 $50 $100 $150 $200 $250 2012 2013 2014 2015 th |
 Balance
in millions Mortgage Loan Portfolio (including AFS)
15 Year Construction Perm including AFS 12 ARMs 30 Year $0 $100 $200 $300 $400 $500 $600 $700 $800 $900 4Q '13 4Q '14 1Q '15 3Q '15 $54 $58 $68 $79 $302 $387 $382 $390 $218 $242 $248 $269 $65 $65 $67 $64 $639 $752 $765 $802 |
 Mortgage Banking • Controlled balance growth • Fee income growth Volume of saleable loans originated Spread earned on sales • Market expansion – Columbus, Pittsburgh and Toledo • Construction perm business • Servicing $1.1 billion FNMA/FHLMC mortgages 13 |
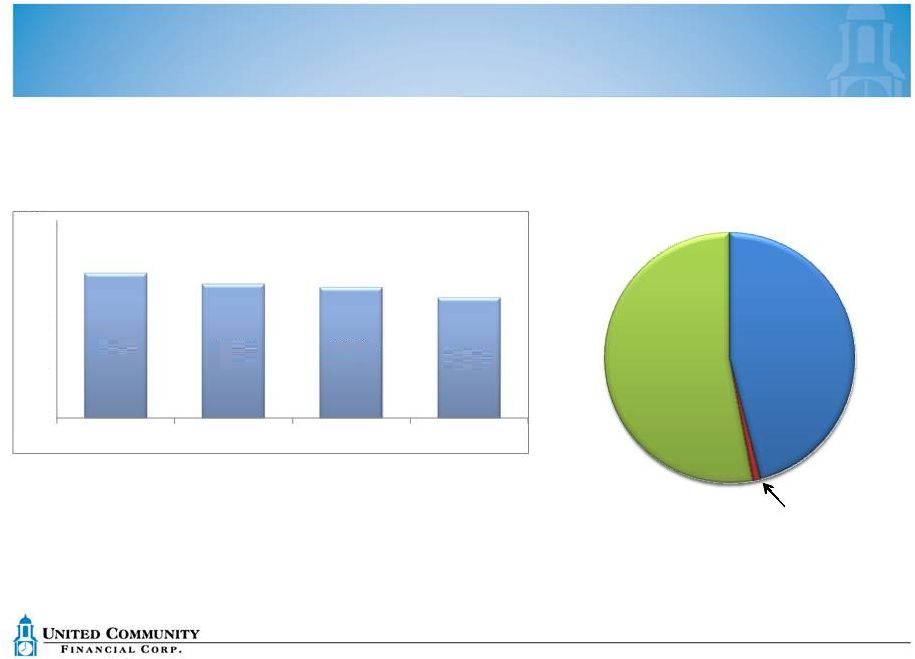 Investment Securities
Securities/Assets (%)
Investment Portfolio
September 30, 2015
Agency MBS 51% Yield 2.2% Duration 4.9 Gov’t Agency 47% Yield 2.2% Duration 7.0 Portfolio Duration 5.9 14 Municipals 2% FTE Yield 3.3% Duration 7.8 $511.0 $499.8 $492.4 $479.8 ($MM’s) 29.4% 27.3% 26.5% 24.4% 0.0% 10.0% 20.0% 30.0% 40.0% 4Q '13 4Q '14 1Q '15 3Q '15 |
 Noninterest-bearing deposits
Interest-bearing checking, money market & savings
Time deposits Borrowed funds Average Balances – Total Funding Composition Total Cost of Funds 0.76% 0.66% 0.55% Funding Structure and Cost of Funds 15 0.56% 0.55% 47.5% 46.4% 46.9% 48.1% 46.0% 29.2% 28.3% 27.0% 27.7% 27.0% 3Q '14 4Q '14 1Q '15 2Q '15 3Q '15 11.0% 13.6% 12.4% 12.3% 13.0% 12.7% 12.9% 12.5% 11.2% 14.3% |
 *Pro forma column assumes the prepayment of $30.0 million of high cost debt
Net Interest Income
Net Interest Margin
Dollars in thousands Net Interest Income and Margin 16 $12,725 $13,351 $13,880 $13,857 $14,321 $14,621 3.06% 3.16% 3.24% 3.16% 3.18% 3.25% 2.95% 3.00% 3.05% 3.10% 3.15% 3.20% 3.25% 3.30% $10,000 $10,500 $11,000 $11,500 $12,000 $12,500 $13,000 $13,500 $14,000 $14,500 $15,000 3Q '14 4Q '14 1Q'15 2Q '15 3Q '15 3Q'15 Proforma |
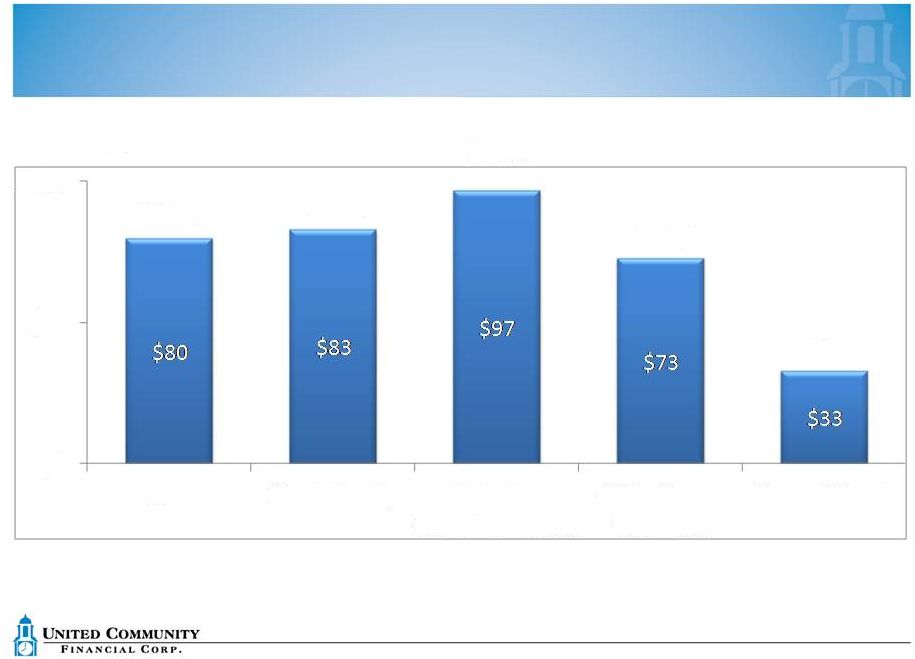
 Dollars
in thousands, excludes security gains Non Interest
Income Other
Deposit Fees $17,172 $13,297 17 $19,000 Mortgage Banking and Servicing Card/Interchange Fees $6,122 $2,562 $7,000 $5,564 $4,901 $5,700 $3,584 $3,354 $3,800 $1,902 $2,480 $2,500 $0 $5,000 $10,000 $15,000 $20,000 $25,000 2013 2014 2015 Estimated |
 Dollars
in thousands Non Interest Expense and Efficiency Ratio
Non Interest Expense -
LHS Efficiency Ratio – RHS – Annual for 2013 and 2014, quarterly for 2015 18 $56,737 $55,960 $50,724 $48,830 $49,140 80.2% 80.1% 70.1% 63.4% 63.5% 30.0% 40.0% 50.0% 60.0% 70.0% 80.0% 90.0% $40,000 $50,000 $60,000 2013 2014 1Q '15 Annualized 2Q '15 Annualized 3Q '15 Annualized |
 Tangible Book Value
19 $3.47 $4.88 $5.12 $0.00 $1.00 $2.00 $3.00 $4.00 $5.00 $6.00 $7.00 2013 2014 3Q '15 Total shareholders’ equity less core deposit intangible divided by number of
shares outstanding |
 Tangible Common Equity/Tangible Assets
20 10.1% 13.1% 12.4% 0.0% 5.0% 10.0% 15.0% 2013 2014 3Q '15 Tangible common equity is total shareholders’ equity less core deposit intangible
Tangible assets includes total assets less core deposit intangible
|
 Capital Management
• Tangible common equity to total assets 12.4% • Share buybacks – 3.1 million shares repurchased in last 18 months • Dividends – target 30% payout • Organic balance sheet growth • M&A capability 21 |
 Expectations for 2015
• 12%+ Loan Growth • Robust Fee Income Growth • Improving Efficiency Ratio • Consistent Credit Performance • Process Improvement Initiatives • Talent Additions 22 |
 Investor Relations Contact:
Troy Adair 330.742.0472 tadair@homesavings.com |