Attached files
| file | filename |
|---|---|
| 8-K - 8-K - TRIMAS CORP | trs_09302015x8k.htm |
| EX-99.1 - EXHIBIT 99.1 - TRIMAS CORP | trs_09302015xexhibit991.htm |
Third Quarter 2015 Earnings Presentation October 29, 2015
Forward-Looking Statement Forward-Looking Statement Any “forward-looking” statements, within the meaning of Section 27A of the Securities Act of 1933 and Section 21E of the Securities Exchange Act of 1934, contained herein, including, but not limited to, those relating to the Company’s business, financial condition or future results, involve risks and uncertainties, including, but not limited to, risks and uncertainties with respect to: the Company's leverage; liabilities imposed by the Company's debt instruments; market demand; competitive factors; supply constraints; material and energy costs; risks and uncertainties associated with intangible assets, including goodwill or other intangible asset impairment charges; technology factors; litigation; government and regulatory actions; the Company's accounting policies; future trends; general economic and currency conditions; various conditions specific to the Company's business and industry; the Company’s ability to integrate Allfast and attain the expected synergies, including that the acquisition is accretive; the Company’s ability to attain the Financial Improvement Plan targeted savings and free cash flow amounts; future prospects of the Company; and other risks that are detailed in the Company's Annual Report on Form 10-K for the fiscal year ended December 31, 2014. These risks and uncertainties may cause actual results to differ materially from those indicated by the forward-looking statements. All forward-looking statements made herein are based on information currently available, and the Company assumes no obligation to update any forward-looking statements. Non-GAAP Financial Measures In this presentation, certain non-GAAP financial measures may be used. Reconciliations of these non-GAAP financial measures to the most directly comparable GAAP financial measure may be found at the end of this presentation or in the earnings releases available on the Company’s website. Additional information is available at www.trimascorp.com under the “Investors” section. 2
Agenda • Opening Remarks • Financial Highlights • Segment Highlights • Outlook and Summary • Questions and Answers • Appendix 3

Opening Remarks • Third quarter sales of approximately $222.2 million – relatively flat year- over-year due to external headwinds • Attained $0.39(1) EPS for the quarter, an increase of 34.5% as compared to third quarter 2014 • Operating profit margin(1) improvement of approximately 300 basis points year-over-year • Focused on mitigating external headwinds • Launched Financial Improvement Plan to improve profitability, cash flow conversion and operational efficiency 4 Continue to implement actions to mitigate external headwinds and drive improved performance. (1) Defined as operating profit margin and diluted earnings per share from continuing operations attributable to TriMas Corporation, excluding “Special Items.” “Special Items” are provided in the Appendix.

External Headwinds and Tailwinds Headwinds • Oil and commodity price declines ‒ Drilling and well completion activity ‒ Capex reductions ‒ Resin and specialty steel prices • Inventory reductions at distributors ‒ Large aerospace distributors ‒ Overall supply chain reductions • Strength of U.S. dollar – Translation and transaction impacts – Exports in Engineered Components – Imports more competitive • Overall slow macroeconomic growth ‒ Certain industrial activity slowing 5 Tailwinds • Commercial aircraft build rates and backlog • Asia still growing, albeit at lower rates – uncertainty around China Pressure on the top-line and margin – ongoing actions to mitigate.
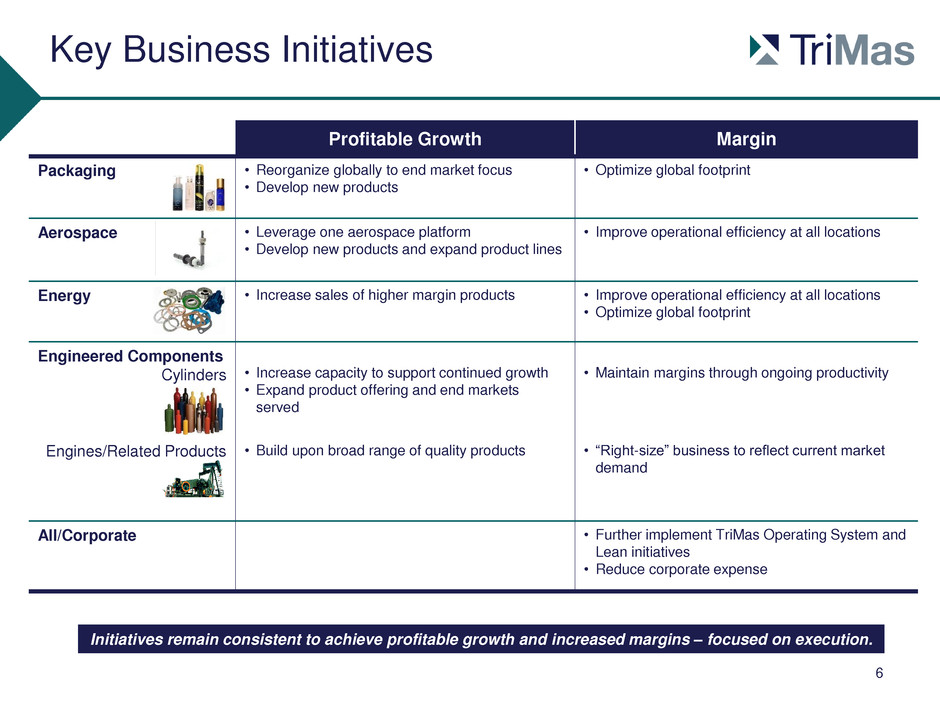
Key Business Initiatives 6 Profitable Growth Margin Packaging • Reorganize globally to end market focus • Develop new products • Optimize global footprint Aerospace • Leverage one aerospace platform • Develop new products and expand product lines • Improve operational efficiency at all locations Energy • Increase sales of higher margin products • Improve operational efficiency at all locations • Optimize global footprint Engineered Components Cylinders • Increase capacity to support continued growth • Expand product offering and end markets served • Maintain margins through ongoing productivity Engines/Related Products • Build upon broad range of quality products • “Right-size” business to reflect current market demand All/Corporate • Further implement TriMas Operating System and Lean initiatives • Reduce corporate expense Initiatives remain consistent to achieve profitable growth and increased margins – focused on execution.

Financial Highlights
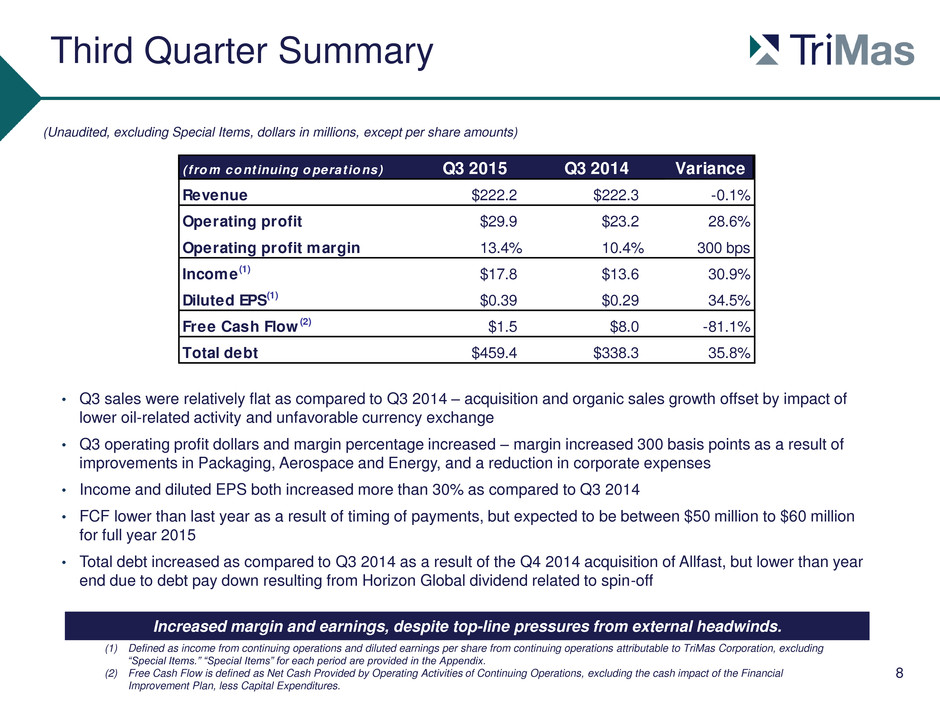
Third Quarter Summary • Q3 sales were relatively flat as compared to Q3 2014 – acquisition and organic sales growth offset by impact of lower oil-related activity and unfavorable currency exchange • Q3 operating profit dollars and margin percentage increased – margin increased 300 basis points as a result of improvements in Packaging, Aerospace and Energy, and a reduction in corporate expenses • Income and diluted EPS both increased more than 30% as compared to Q3 2014 • FCF lower than last year as a result of timing of payments, but expected to be between $50 million to $60 million for full year 2015 • Total debt increased as compared to Q3 2014 as a result of the Q4 2014 acquisition of Allfast, but lower than year end due to debt pay down resulting from Horizon Global dividend related to spin-off 8 (1) Defined as income from continuing operations and diluted earnings per share from continuing operations attributable to TriMas Corporation, excluding “Special Items.” “Special Items” for each period are provided in the Appendix. (2) Free Cash Flow is defined as Net Cash Provided by Operating Activities of Continuing Operations, excluding the cash impact of the Financial Improvement Plan, less Capital Expenditures. (Unaudited, excluding Special Items, dollars in millions, except per share amounts) Increased margin and earnings, despite top-line pressures from external headwinds. ( fro m co ntinuing o perat io ns) Q3 2015 Q3 2014 Variance Revenue $222.2 $222.3 -0.1% Operating profit $29.9 $23.2 28.6% Operating profit margin 13.4% 10.4% 300 bps Income (1) $17.8 $13.6 30.9% Diluted EPS(1) $0.39 $0.29 34.5% Free Cash Flow (2) $1.5 $8.0 -81.1% Total debt $459.4 $338.3 35.8%
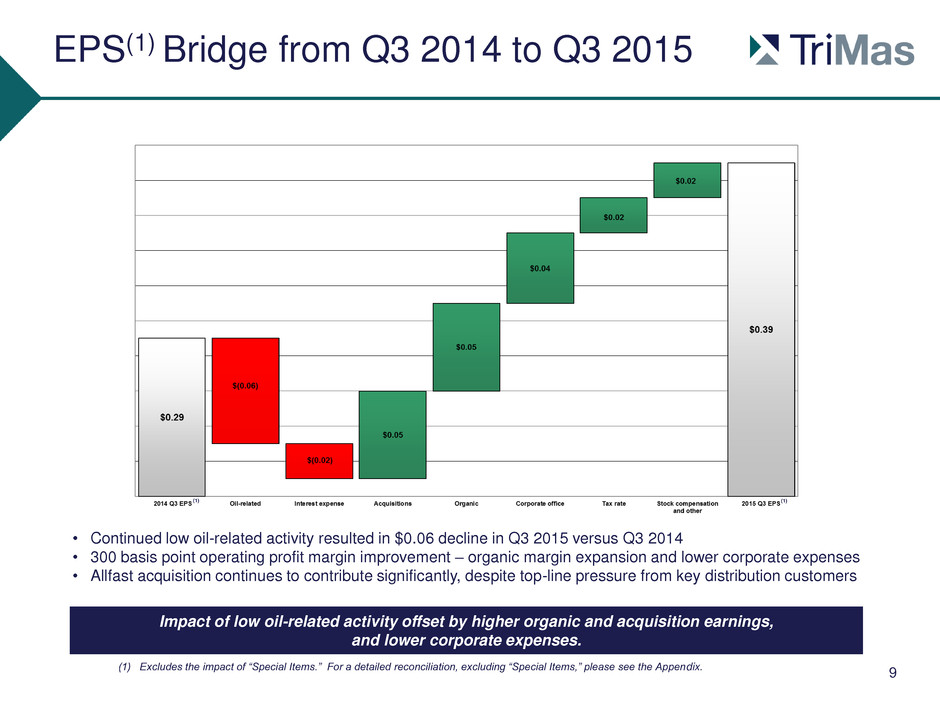
9 • Continued low oil-related activity resulted in $0.06 decline in Q3 2015 versus Q3 2014 • 300 basis point operating profit margin improvement – organic margin expansion and lower corporate expenses • Allfast acquisition continues to contribute significantly, despite top-line pressure from key distribution customers Impact of low oil-related activity offset by higher organic and acquisition earnings, and lower corporate expenses. (1) Excludes the impact of “Special Items.” For a detailed reconciliation, excluding “Special Items,” please see the Appendix. (1) (1) EPS(1) Bridge from Q3 2014 to Q3 2015
Financial Improvement Plan • Announced in September 2015 – implementation in progress • $15 million of annual savings – $5 million related to acceleration of Energy business restructuring – $10 million of fixed overhead and SG&A reductions across rest of Company – One-time charges of approximately $6 million to $7 million • Limited impact in Q3 and Q4 with majority of savings expected to be realized in 2016 • Mitigate top-line and conversion pressures • Improved free cash flow conversion of nearly 100% of net income – Aggressive management of capital expenditures and working capital 10 Focused on improving operational efficiency, profitability and cash flow conversion, while offsetting continued external headwinds in 2016.
Segment Highlights

Packaging 12 • Sales decreased due to $2.5 million of unfavorable currency exchange • Margin percentage increased due to reductions in certain acquisition-related liabilities, lower material costs, a favorable shift in product mix and lower SG&A Strategies • Deployed new brand and completed global reorganization to an end market focus to better serve customers • Continuing ramp-up of manufacturing capabilities in Asia • Developing world-class product development team and customer innovation center in India • Implementing continuous pipeline of productivity initiatives to fund growth while maintaining margins Quarterly Commentary (Unaudited, dollars in millions) (1) Operating profit excludes “Special Items” and corporate expense (in calculation of segment contribution). “Special Items” for each period are provided in the Appendix. Q3 YTD 2015 Segment Contribution 38% By Revenue 59% By Operating Profit(1) Positioning business for customer innovation and future growth, while maintaining targeted margin levels. Financial Snapshot Q3 2015 Q3 2014 Variance Sales $87.9 $89.3 -1.6% Operating profit (1) $22.2 $21.4 3.6% Operating profit margin (1) 25.2% 23.9% 130 bps
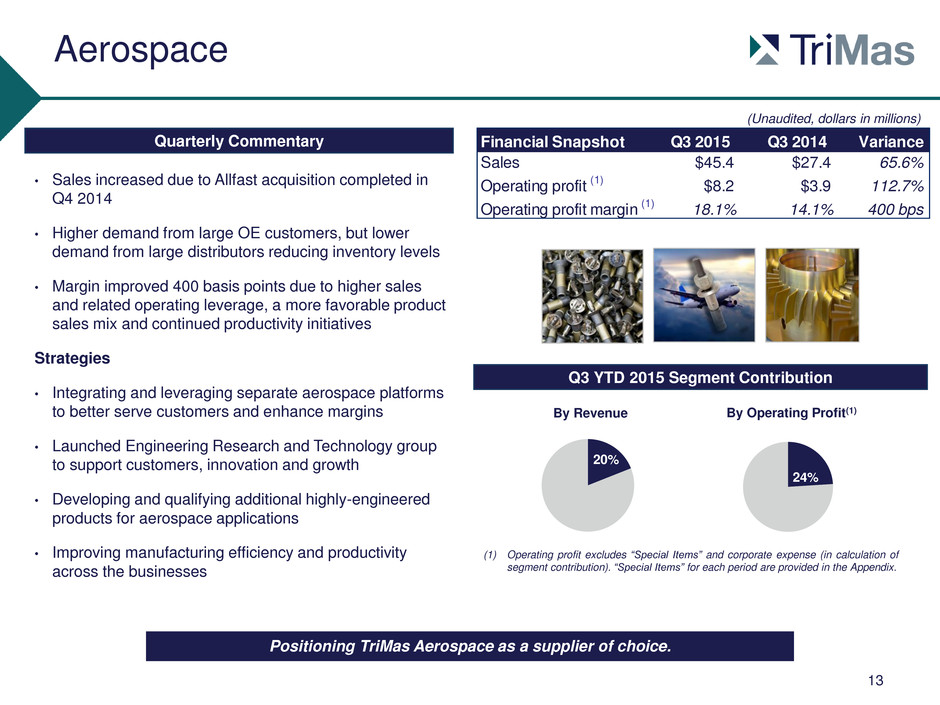
Aerospace 13 • Sales increased due to Allfast acquisition completed in Q4 2014 • Higher demand from large OE customers, but lower demand from large distributors reducing inventory levels • Margin improved 400 basis points due to higher sales and related operating leverage, a more favorable product sales mix and continued productivity initiatives Strategies • Integrating and leveraging separate aerospace platforms to better serve customers and enhance margins • Launched Engineering Research and Technology group to support customers, innovation and growth • Developing and qualifying additional highly-engineered products for aerospace applications • Improving manufacturing efficiency and productivity across the businesses (Unaudited, dollars in millions) Q3 YTD 2015 Segment Contribution 20% By Revenue 24% By Operating Profit(1) Quarterly Commentary Positioning TriMas Aerospace as a supplier of choice. (1) Operating profit excludes “Special Items” and corporate expense (in calculation of segment contribution). “Special Items” for each period are provided in the Appendix. Financial Snapshot Q3 2015 Q3 2014 Variance Sales $45.4 $27.4 65.6% Operating profit (1) $8.2 $3.9 112.7% Operating profit margin (1) 18.1% 14.1% 400 bps
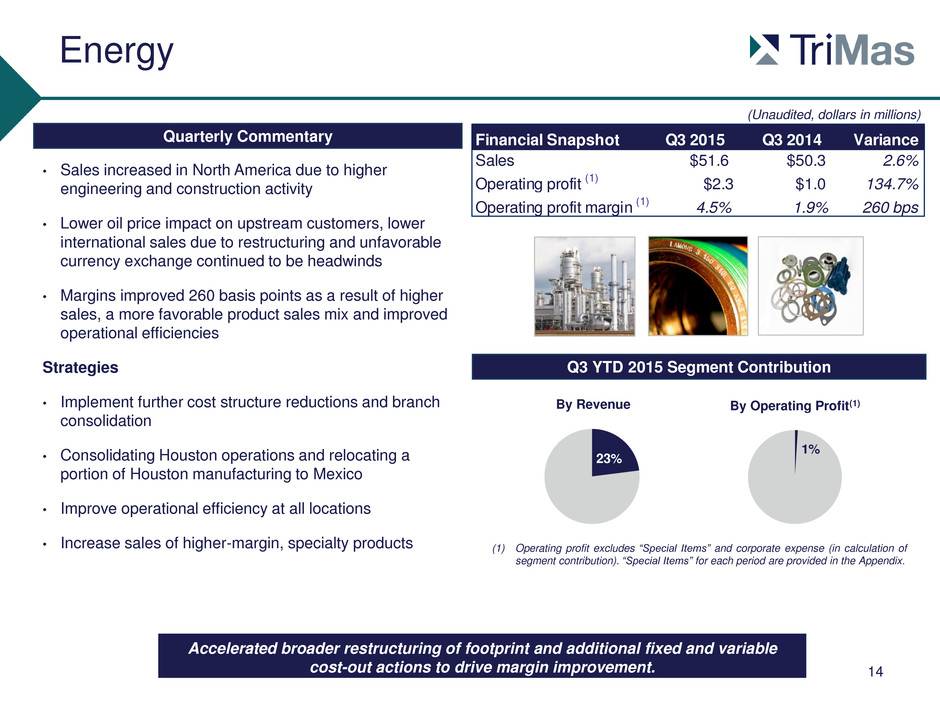
Energy 14 • Sales increased in North America due to higher engineering and construction activity • Lower oil price impact on upstream customers, lower international sales due to restructuring and unfavorable currency exchange continued to be headwinds • Margins improved 260 basis points as a result of higher sales, a more favorable product sales mix and improved operational efficiencies Strategies • Implement further cost structure reductions and branch consolidation • Consolidating Houston operations and relocating a portion of Houston manufacturing to Mexico • Improve operational efficiency at all locations • Increase sales of higher-margin, specialty products (Unaudited, dollars in millions) Q3 YTD 2015 Segment Contribution 23% By Revenue 1% By Operating Profit(1) Quarterly Commentary Accelerated broader restructuring of footprint and additional fixed and variable cost-out actions to drive margin improvement. (1) Operating profit excludes “Special Items” and corporate expense (in calculation of segment contribution). “Special Items” for each period are provided in the Appendix. Financial Snapshot Q3 2015 Q3 2014 Variance Sales $51.6 $50.3 2.6% Operating profit (1) $2.3 $1.0 134.7% Operating profit margin (1) 4.5% 1.9% 260 bps
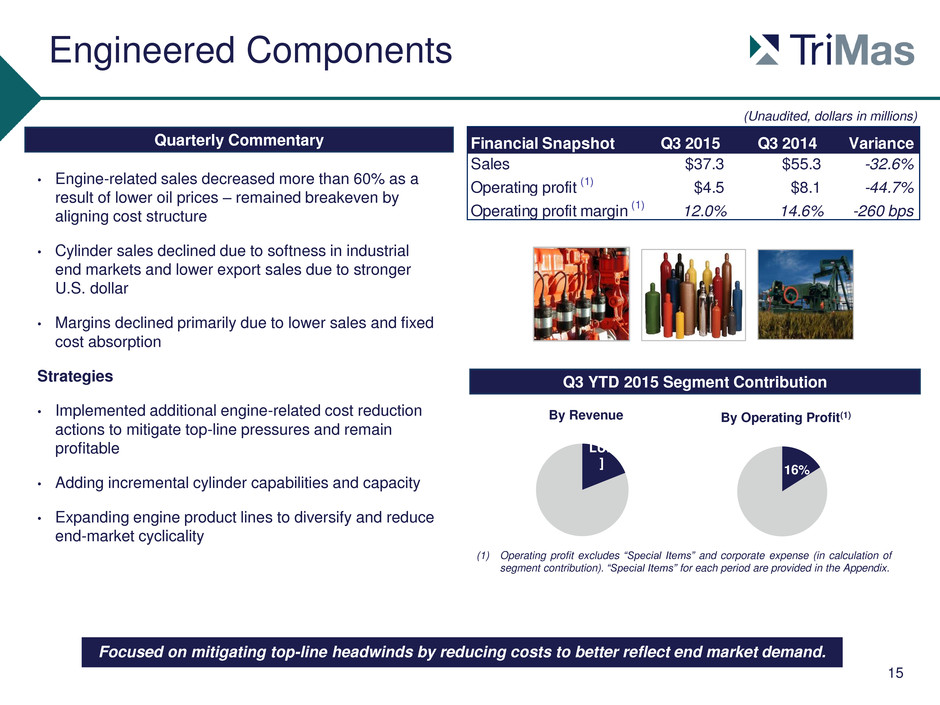
Engineered Components 15 • Engine-related sales decreased more than 60% as a result of lower oil prices – remained breakeven by aligning cost structure • Cylinder sales declined due to softness in industrial end markets and lower export sales due to stronger U.S. dollar • Margins declined primarily due to lower sales and fixed cost absorption Strategies • Implemented additional engine-related cost reduction actions to mitigate top-line pressures and remain profitable • Adding incremental cylinder capabilities and capacity • Expanding engine product lines to diversify and reduce end-market cyclicality (Unaudited, dollars in millions) Q3 YTD 2015 Segment Contribution [VA LUE ] By Revenue 16% By Operating Profit(1) Quarterly Commentary Focused on mitigating top-line headwinds by reducing costs to better reflect end market demand. (1) Operating profit excludes “Special Items” and corporate expense (in calculation of segment contribution). “Special Items” for each period are provided in the Appendix. Financial Snapshot Q3 2015 Q3 2014 Variance Sales $37.3 $55.3 -32.6% Operating profit (1) $4.5 $8.1 -44.7% Operating profit margin (1) 12.0% 14.6% -260 bps
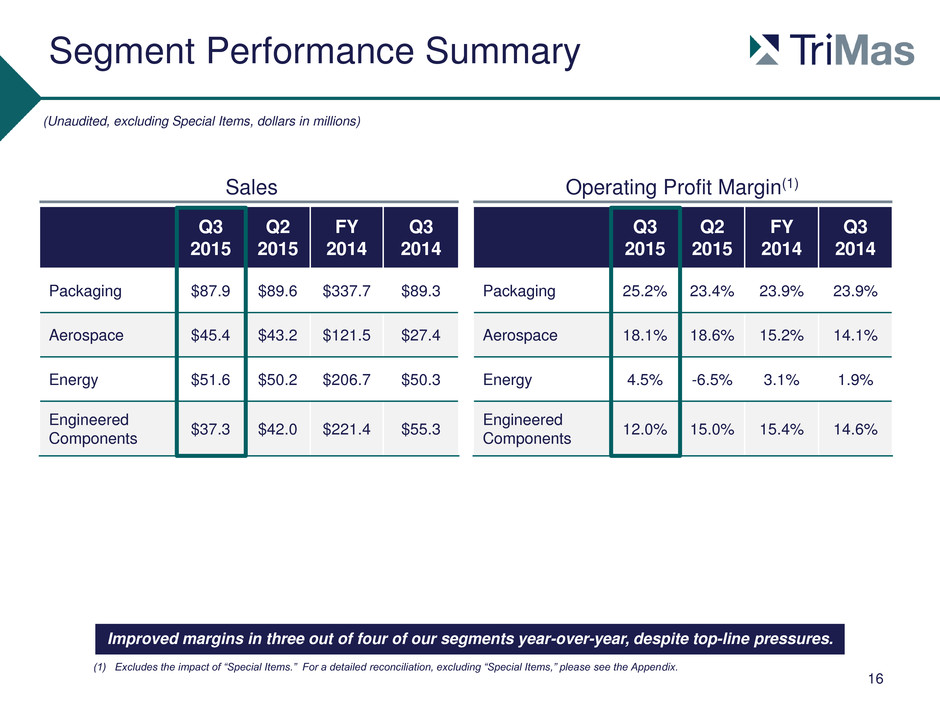
Segment Performance Summary 16 (Unaudited, excluding Special Items, dollars in millions) Sales Operating Profit Margin(1) (1) Excludes the impact of “Special Items.” For a detailed reconciliation, excluding “Special Items,” please see the Appendix. Q3 2015 Q2 2015 FY 2014 Q3 2014 Packaging $87.9 $89.6 $337.7 $89.3 Aerospace $45.4 $43.2 $121.5 $27.4 Energy $51.6 $50.2 $206.7 $50.3 Engineered Components $37.3 $42.0 $221.4 $55.3 Q3 2015 Q2 2015 FY 2014 Q3 2014 Packaging 25.2% 23.4% 23.9% 23.9% Aerospace 18.1% 18.6% 15.2% 14.1% Energy 4.5% -6.5% 3.1% 1.9% Engineered Components 12.0% 15.0% 15.4% 14.6% Improved margins in three out of four of our segments year-over-year, despite top-line pressures.
Outlook and Summary
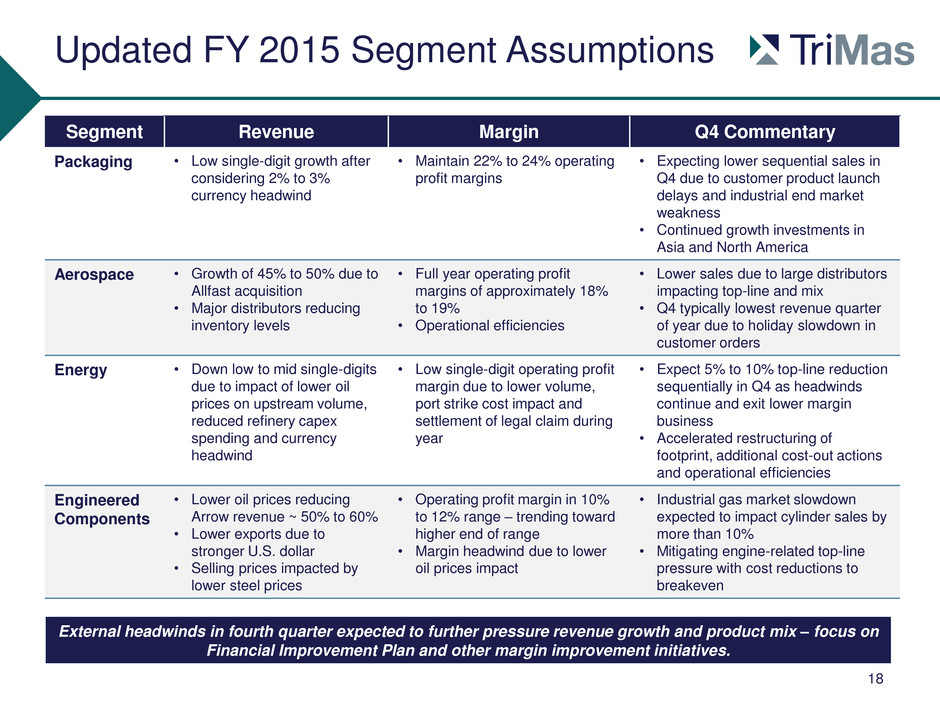
Updated FY 2015 Segment Assumptions 18 Segment Revenue Margin Q4 Commentary Packaging • Low single-digit growth after considering 2% to 3% currency headwind • Maintain 22% to 24% operating profit margins • Expecting lower sequential sales in Q4 due to customer product launch delays and industrial end market weakness • Continued growth investments in Asia and North America Aerospace • Growth of 45% to 50% due to Allfast acquisition • Major distributors reducing inventory levels • Full year operating profit margins of approximately 18% to 19% • Operational efficiencies • Lower sales due to large distributors impacting top-line and mix • Q4 typically lowest revenue quarter of year due to holiday slowdown in customer orders Energy • Down low to mid single-digits due to impact of lower oil prices on upstream volume, reduced refinery capex spending and currency headwind • Low single-digit operating profit margin due to lower volume, port strike cost impact and settlement of legal claim during year • Expect 5% to 10% top-line reduction sequentially in Q4 as headwinds continue and exit lower margin business • Accelerated restructuring of footprint, additional cost-out actions and operational efficiencies Engineered Components • Lower oil prices reducing Arrow revenue ~ 50% to 60% • Lower exports due to stronger U.S. dollar • Selling prices impacted by lower steel prices • Operating profit margin in 10% to 12% range – trending toward higher end of range • Margin headwind due to lower oil prices impact • Industrial gas market slowdown expected to impact cylinder sales by more than 10% • Mitigating engine-related top-line pressure with cost reductions to breakeven External headwinds in fourth quarter expected to further pressure revenue growth and product mix – focus on Financial Improvement Plan and other margin improvement initiatives.
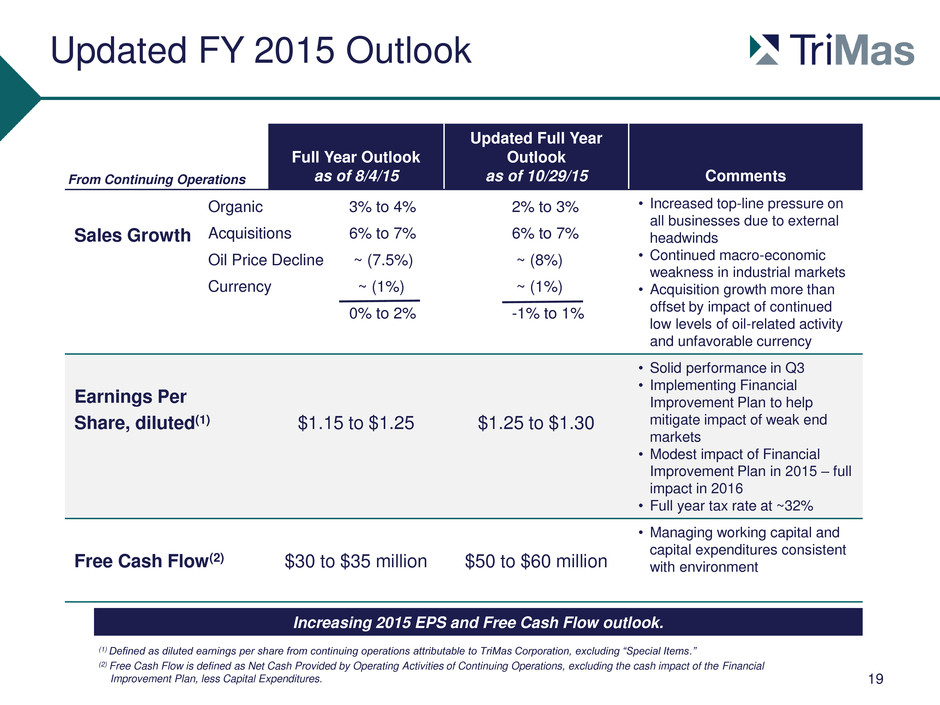
Updated FY 2015 Outlook Full Year Outlook as of 8/4/15 Updated Full Year Outlook as of 10/29/15 Comments Sales Growth • Increased top-line pressure on all businesses due to external headwinds • Continued macro-economic weakness in industrial markets • Acquisition growth more than offset by impact of continued low levels of oil-related activity and unfavorable currency Earnings Per Share, diluted(1) $1.15 to $1.25 $1.25 to $1.30 • Solid performance in Q3 • Implementing Financial Improvement Plan to help mitigate impact of weak end markets • Modest impact of Financial Improvement Plan in 2015 – full impact in 2016 • Full year tax rate at ~32% Free Cash Flow(2) $30 to $35 million $50 to $60 million • Managing working capital and capital expenditures consistent with environment (1) Defined as diluted earnings per share from continuing operations attributable to TriMas Corporation, excluding “Special Items.” (2) Free Cash Flow is defined as Net Cash Provided by Operating Activities of Continuing Operations, excluding the cash impact of the Financial Improvement Plan, less Capital Expenditures. 19 Organic 3% to 4% Acquisitions 6% to 7% Oil Price Decline ~ (7.5%) Currency ~ (1%) 0% to 2% Increasing 2015 EPS and Free Cash Flow outlook. From Continuing Operations 2% to 3% 6% to 7% ~ (8%) ~ (1%) -1% to 1%

2016 Preliminary Thoughts 20 Packaging Aerospace Energy Engineered Components Corporate Expense • Consumer-based specialty dispensing products ~75% of sales • Industrial closures impacted by end market weakness • ~25% to 30% of sales outside of North America – China slowing; India up mid- single digits; Europe flat • Organic growth from customer and product wins • Focus on innovation and globalization continues • Revenue split of ~45% for OE versus ~55% for distribution • Commercial backlogs remain high – solid build rates but new platforms slower • Distributors expect to continue to reduce inventory levels • Military sales down due to defense cuts • New qualifications at Airbus and additional collar certifications • Leverage separate aerospace platforms to drive growth and enhance margins • Majority of business is MRO-related • Lower oil prices and related activity continued to impact upstream volume and reduce refinery capex spending – no recovery assumed • Selectively exit certain lower margin business • Focus on fixed and variable cost reductions • Restructuring business for improved operational efficiency and margin • Cylinder products comprise majority of segment • No recovery assumed related to lower oil prices and activity • Low backlog entering the year • Cylinder sales impacted by overall industrial weakness • Exports continue to be challenged due to strong U.S. dollar • Continue to “right-size” business to reflect current market demand • Cash costs decreased 3% to 3.5% of sales • Tax rate relatively flat with 2015 • TSA with Horizon Global winds down • Overall low to mid- single digit sales growth expected • Operating at targeted margin levels • Overall low to mid- single digit sales growth expected • Continued margin expansion • Overall sales down low to mid-single digits • Continued margin expansion • Overall sales down mid to high-single digits • Engine business at breakeven at lower run rate • Cylinder business holds targeted margin range via productivity Earnings expansion in the face of top-line headwinds – focus on what we can control.
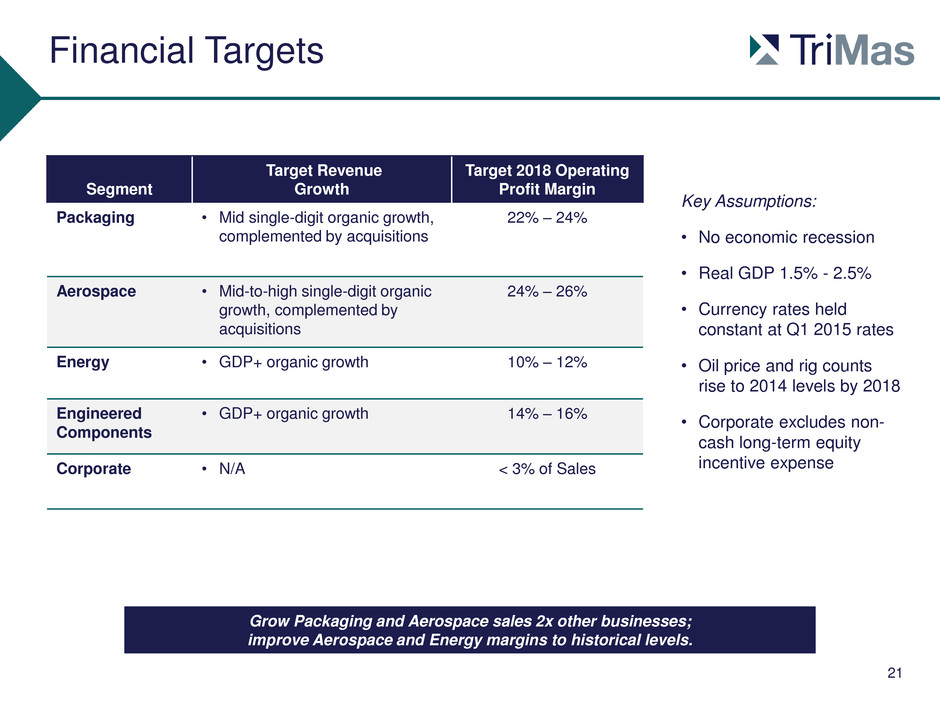
Financial Targets Grow Packaging and Aerospace sales 2x other businesses; improve Aerospace and Energy margins to historical levels. Segment Target Revenue Growth Target 2018 Operating Profit Margin Packaging • Mid single-digit organic growth, complemented by acquisitions 22% – 24% Aerospace • Mid-to-high single-digit organic growth, complemented by acquisitions 24% – 26% Energy • GDP+ organic growth 10% – 12% Engineered Components • GDP+ organic growth 14% – 16% Corporate • N/A < 3% of Sales Key Assumptions: • No economic recession • Real GDP 1.5% - 2.5% • Currency rates held constant at Q1 2015 rates • Oil price and rig counts rise to 2014 levels by 2018 • Corporate excludes non- cash long-term equity incentive expense 21
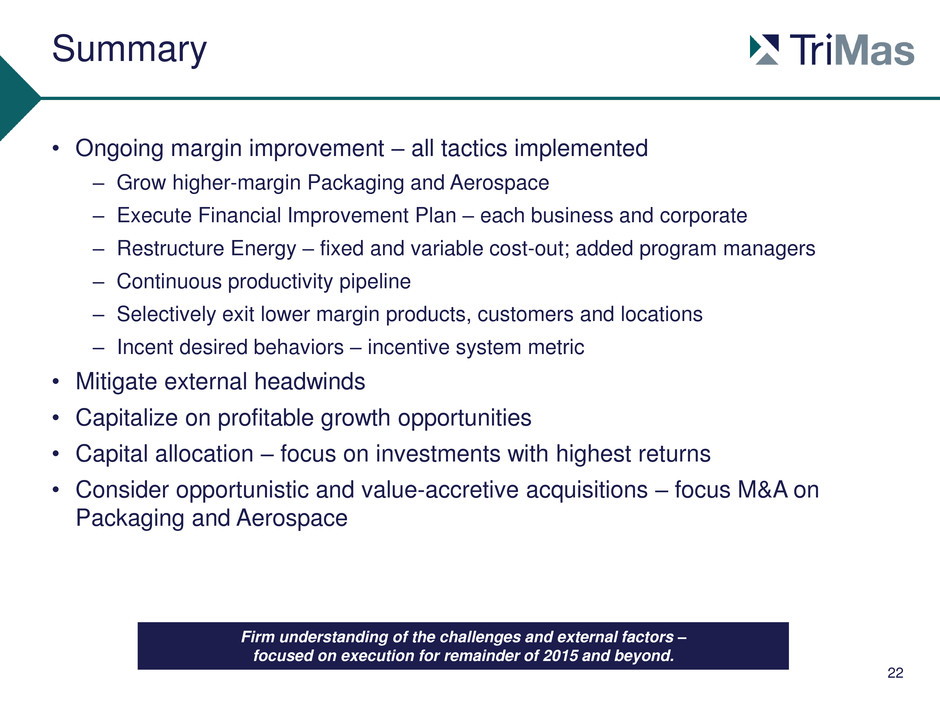
Summary • Ongoing margin improvement – all tactics implemented – Grow higher-margin Packaging and Aerospace – Execute Financial Improvement Plan – each business and corporate – Restructure Energy – fixed and variable cost-out; added program managers – Continuous productivity pipeline – Selectively exit lower margin products, customers and locations – Incent desired behaviors – incentive system metric • Mitigate external headwinds • Capitalize on profitable growth opportunities • Capital allocation – focus on investments with highest returns • Consider opportunistic and value-accretive acquisitions – focus M&A on Packaging and Aerospace 22 Firm understanding of the challenges and external factors – focused on execution for remainder of 2015 and beyond.
Questions and Answers

Appendix
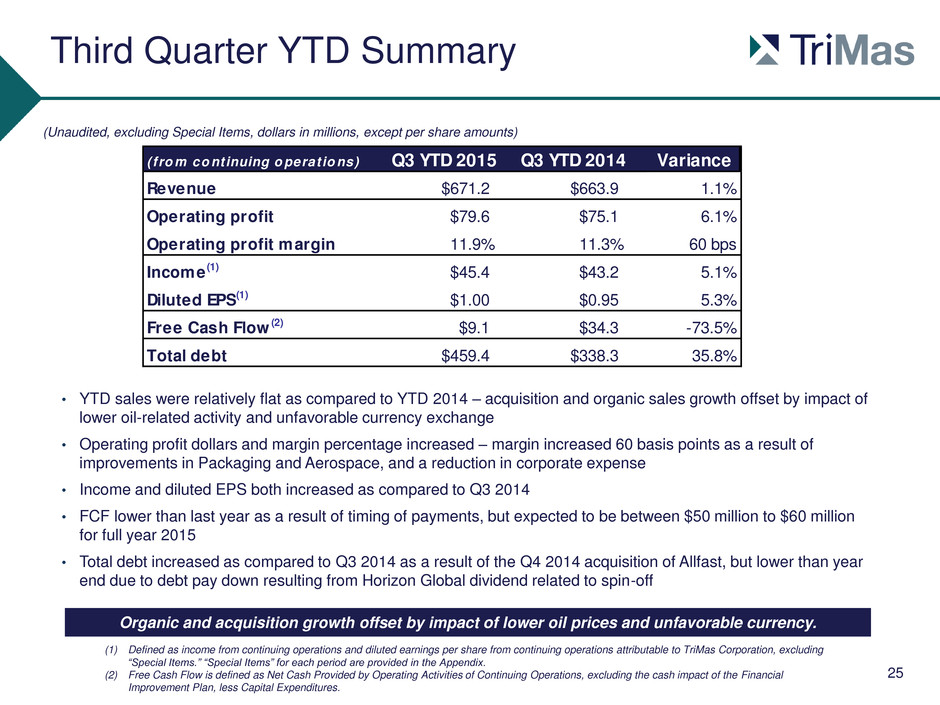
Third Quarter YTD Summary 25 (1) Defined as income from continuing operations and diluted earnings per share from continuing operations attributable to TriMas Corporation, excluding “Special Items.” “Special Items” for each period are provided in the Appendix. (2) Free Cash Flow is defined as Net Cash Provided by Operating Activities of Continuing Operations, excluding the cash impact of the Financial Improvement Plan, less Capital Expenditures. (Unaudited, excluding Special Items, dollars in millions, except per share amounts) Organic and acquisition growth offset by impact of lower oil prices and unfavorable currency. ( fro m co ntinuing o perat io ns) Q3 YTD 2015 Q3 YTD 2014 Variance Revenue $671.2 $663.9 1.1% Operating profit $79.6 $75.1 6.1% Operating profit margin 11.9% 11.3% 60 bps Income (1) $45.4 $43.2 5.1% Diluted EPS(1) $1.00 $0.95 5.3% Free Cash Flow (2) $9.1 $34.3 -73.5% Total debt $459.4 $338.3 35.8% • YTD sales were relatively flat as compared to YTD 2014 – acquisition and organic sales growth offset by impact of lower oil-related activity and unfavorable currency exchange • Operating profit dollars and margin percentage increased – margin increased 60 basis points as a result of improvements in Packaging and Aerospace, and a reduction in corporate expense • Income and diluted EPS both increased as compared to Q3 2014 • FCF lower than last year as a result of timing of payments, but expected to be between $50 million to $60 million for full year 2015 • Total debt increased as compared to Q3 2014 as a result of the Q4 2014 acquisition of Allfast, but lower than year end due to debt pay down resulting from Horizon Global dividend related to spin-off
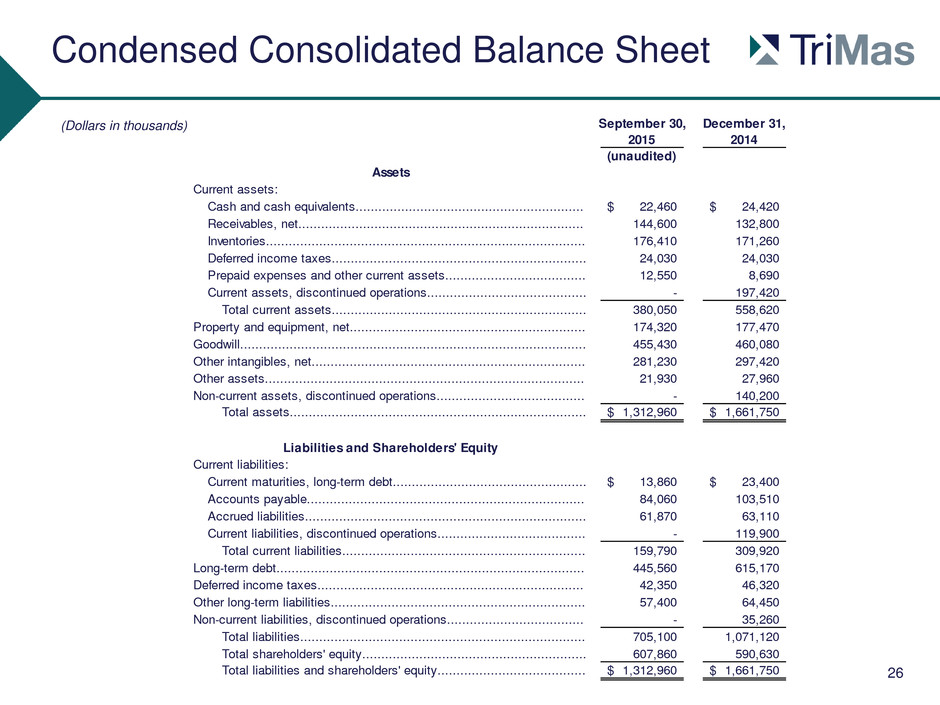
Condensed Consolidated Balance Sheet 26 September 30, December 31, 2015 2014 (unaudited) Assets Current assets: Cash and cash equivalents............................................................ 22,460$ 24,420$ Receivables, net........................................................................... 144,600 132,800 Inventories.................................................................................... 176,410 171,260 Deferred income taxes................................................................... 24,030 24,030 Prepaid expenses and other current assets..................................... 12,550 8,690 Current assets, discontinued operations.......................................... - 197,420 Total current assets................................................................... 380,050 558,620 Property and equipment, net.............................................................. 174,320 177,470 Goodwill........................................................................................... 455,430 460,080 Other intangibles, net........................................................................ 281,230 297,420 Other assets.................................................................................... 21,930 27,960 Non-current assets, discontinued operations....................................... - 140,200 Total assets.............................................................................. 1,312,960$ 1,661,750$ Liabilities and Shareholders' Equity Current liabilities: Current maturities, long-term debt................................................... 13,860$ 23,400$ Accounts payable......................................................................... 84,060 103,510 Accrued liabilities.......................................................................... 61,870 63,110 Current liabilities, discontinued operations....................................... - 119,900 Total current liabilities................................................................ 159,790 309,920 Long-term debt................................................................................. 445,560 615,170 Deferr d i come taxes...................................................................... 42,350 46,320 Other long-term liabilities................................................................... 57,400 64,450 Non-current liabilities, discontinued operations.................................... - 35,260 Total liabilities........................................................................... 705,100 1,071,120 Total shareholders' equity........................................................... 607,860 590,630 Total liabilities and shareholders' equity....................................... 1,312,960$ 1,661,750$ (Dollars in thousands)
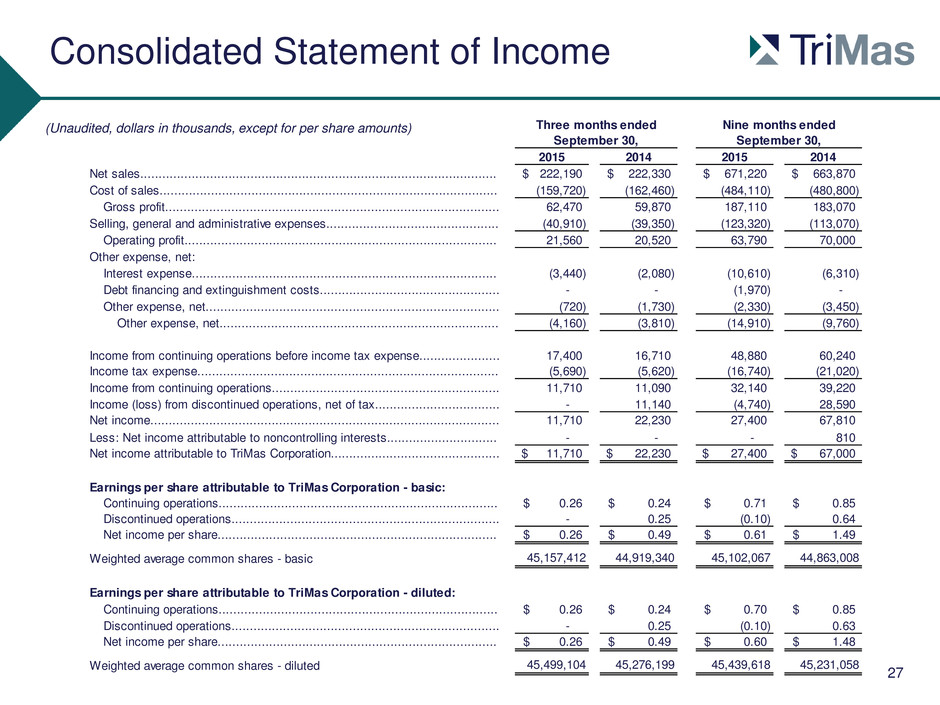
Consolidated Statement of Income 27 Three months ended Nine months ended 2015 2014 2015 2014 Net sales................................................................................................. 222,190$ 222,330$ 671,220$ 663,870$ Cost of sales............................................................................................ (159,720) (162,460) (484,110) (480,800) Gross profit........................................................................................... 62,470 59,870 187,110 183,070 Selling, general and administrative expenses............................................... (40,910) (39,350) (123,320) (113,070) Operating profit..................................................................................... 21,560 20,520 63,790 70,000 Other expense, net: Interest expense................................................................................... (3,440) (2,080) (10,610) (6,310) Debt financing and extinguishment costs................................................. - - (1,970) - Other expense, net................................................................................ (720) (1,730) (2,330) (3,450) Other expense, net............................................................................ (4,160) (3,810) (14,910) (9,760) Income from continuing operations before income tax expense...................... 17,400 16,710 48,880 60,240 Income tax expense.................................................................................. (5,690) (5,620) (16,740) (21,020) Income from continuing operations.............................................................. 11,710 11,090 32,140 39,220 Income (loss) from discontinued operations, net of tax.................................. - 11,140 (4,740) 28,590 Net income............................................................................................... 11,710 22,230 27,400 67,810 Less: Net income attributable to noncontrolling interests.............................. - - - 810 Net income attributable to TriMas Corporation.............................................. 11,710$ 22,230$ 27,400$ 67,000$ Earnings per share attributable to TriMas Corporation - basic: Continuing operations............................................................................ 0.26$ 0.24$ 0.71$ 0.85$ Discontinued operations......................................................................... - 0.25 (0.10) 0.64 Net income per share............................................................................ 0.26$ 0.49$ 0.61$ 1.49$ Weighted average common shares - basic 45,157,412 44,919,340 45,102,067 44,863,008 Earnings per share attributable to TriMas Corporation - diluted: Continuing operations............................................................................ 0.26$ 0.24$ 0.70$ 0.85$ Discontinued operations......................................................................... - 0.25 (0.10) 0.63 Net income per share............................................................................ 0.26$ 0.49$ 0.60$ 1.48$ Weighted average common shares - diluted 45,499,104 45,276,199 45,439,618 45,231,058 September 30, September 30, (Unaudited, dollars in thousands, except for per share amounts)
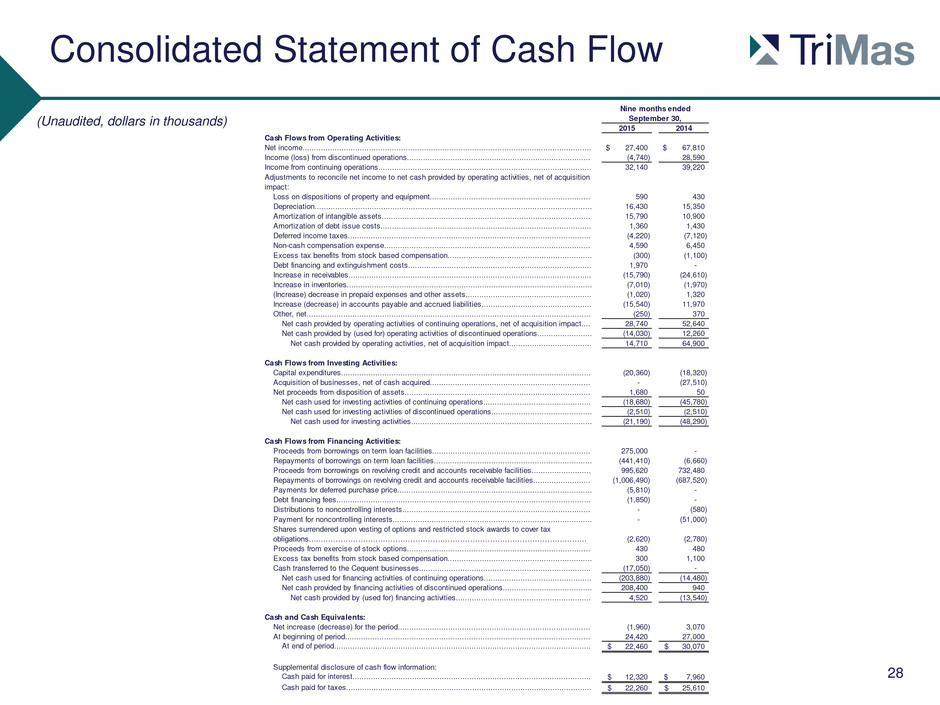
Consolidated Statement of Cash Flow (Unaudited, dollars in thousands) 28 2015 2014 Cash Flows from Operating Activities: Net income.............................................................................................................................. 27,400$ 67,810$ Income (loss) from discontinued operations................................................................................ (4,740) 28,590 Income from continuing operations............................................................................................. 32,140 39,220 Adjustments to reconcile net income to net cash provided by operating activities, net of acquisition impact: Loss on dispositions of property and equipment...................................................................... 590 430 Depreciation......................................................................................................................... 16,430 15,350 Amortization of intangible assets........................................................................................... 15,790 10,900 Amortization of debt issue costs............................................................................................ 1,360 1,430 Deferred income taxes.......................................................................................................... (4,220) (7,120) Non-cash compensation expense.......................................................................................... 4,590 6,450 Excess tax benefits from stock based compensation............................................................... (300) (1,100) Debt financing and extinguishment costs................................................................................ 1,970 - Increase in receivables.......................................................................................................... (15,790) (24,610) Increase in inventories........................................................................................................... (7,010) (1,970) (Increase) decrease in prepaid expenses and other assets....................................................... (1,020) 1,320 Increase (decrease) in accounts payable and accrued liabilities................................................ (15,540) 11,970 Other, net............................................................................................................................ (250) 370 Net cash provided by operating activities of continuing operations, net of acquisition impact.... 28,740 52,640 Net cash provided by (used for) operating activities of discontinued operations........................ (14,030) 12,260 Net cash provided by operating activities, net of acquisition impact.................................... 14,710 64,900 Cash Flows from Investing Activities: Capital expenditures............................................................................................................. (20,360) (18,320) Acquisition of businesses, net of cash acquired...................................................................... - (27,510) Net proceeds from disposition of assets................................................................................. 1,680 50 Net cash used for investing activities of continuing operations............................................... (18,680) (45,780) Net cash used for investing activities of discontinued operations............................................ (2,510) (2,510) Net cash used for investing activities............................................................................... (21,190) (48,290) Cash Flows from Financing Activities: Proceeds from borrowings on term loan facilities..................................................................... 275,000 - Repayments of borrowings on term loan facilities..................................................................... (441,410) (6,660) Proceeds from borrowings on revolving credit and accounts receivable facilities.......................... 995,620 732,480 Repayments of borrowings on revolving credit and accounts receivable facilities......................... (1,006,490) (687,520) Payments for deferred purchase price..................................................................................... (5,810) - Debt financing fees............................................................................................................... (1,850) - Distributions to noncontrolling interests.................................................................................. - (580) Payment for noncontrolling interests....................................................................................... - (51,000) Shares surrendered upon vesting of options and restricted stock awards to cover tax obligations…...…………………………………………………………………………………….……… (2,620) (2,780) Proceeds from exercise of stock options................................................................................ 430 480 Excess tax benefits from stock based compensation............................................................... 300 1,100 Cash transferred to the Cequent businesses........................................................................... (17,050) - Net cash used for financing activities of continuing operations............................................... (203,880) (14,480) Net cash provided by financing activities of discontinued operations....................................... 208,400 940 Net cash provided by (used for) financing activities........................................................... 4,520 (13,540) Cash and Cash Equivalents: Net increase (decrease) for the period.................................................................................... (1,960) 3,070 At beginning of period........................................................................................................... 24,420 27,000 At end of period................................................................................................................ 22,460$ 30,070$ Supplemental disclosure of cash flow information: Cash paid for interest........................................................................................................ 12,320$ 7,960$ Cash paid for taxes........................................................................................................... 22,260$ 25,610$ September 30, Nine months ended
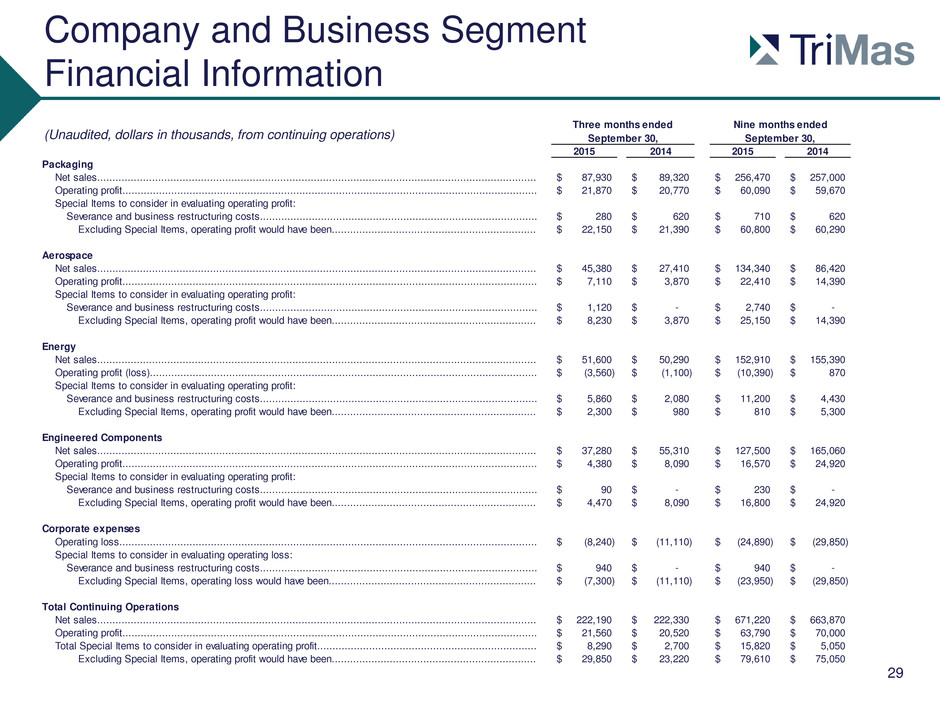
Company and Business Segment Financial Information 29 Three months ended 2015 2014 2015 2014 Packaging Net sales................................................................................................................................................ 87,930$ 89,320$ 256,470$ 257,000$ Operating profit........................................................................................................................................ 21,870$ 20,770$ 60,090$ 59,670$ Special Items to consider in evaluating operating profit: Severance and business restructuring costs........................................................................................... 280$ 620$ 710$ 620$ Excluding Special Items, operating profit would have been................................................................... 22,150$ 21,390$ 60,800$ 60,290$ Aerospace Net sales................................................................................................................................................ 45,380$ 27,410$ 134,340$ 86,420$ Operating profit........................................................................................................................................ 7,110$ 3,870$ 22,410$ 14,390$ Special Items to consider in evaluating operating profit: Severance and business restructuring costs........................................................................................... 1,120$ -$ 2,740$ -$ Excluding Special Items, operating profit would have been................................................................... 8,230$ 3,870$ 25,150$ 14,390$ Energy Net sales................................................................................................................................................ 51,600$ 50,290$ 152,910$ 155,390$ Operating profit (loss)............................................................................................................................... (3,560)$ (1,100)$ (10,390)$ 870$ Special Items to consider in evaluating operating profit: Severance and business restructuring costs........................................................................................... 5,860$ 2,080$ 11,200$ 4,430$ Excluding Special Items, operating profit would have been................................................................... 2,300$ 980$ 810$ 5,300$ Engineered Components Net sales................................................................................................................................................ 37,280$ 55,310$ 127,500$ 165,060$ Operating profit........................................................................................................................................ 4,380$ 8,090$ 16,570$ 24,920$ Special Items to consider in evaluating operating profit: Severance and business restructuring costs........................................................................................... 90$ -$ 230$ -$ Excluding Special Items, operating profit would have been................................................................... 4,470$ 8,090$ 16,800$ 24,920$ Corporate expenses Operating loss......................................................................................................................................... (8,240)$ (11,110)$ (24,890)$ (29,850)$ Special Items to consider in evaluating operating loss: Severance and business restructuring costs........................................................................................... 940$ -$ 940$ -$ Excluding Special Items, operating loss would have been.................................................................... (7,300)$ (11,110)$ (23,950)$ (29,850)$ Total Continuing Operations Net sales................................................................................................................................................ 222,190$ 222,330$ 671,220$ 663,870$ Operating profit........................................................................................................................................ 21,560$ 20,520$ 63,790$ 70,000$ Total Special Items to consider in evaluating operating profit........................................................................ 8,290$ 2,700$ 15,820$ 5,050$ Excluding Special Items, operating profit would have been................................................................... 29,850$ 23,220$ 79,610$ 75,050$ September 30, September 30, Nine months ended (Unaudited, dollars in thousands, from continuing operations)

Additional Information Regarding Special Items Impacting Reported GAAP Financial Measures 30 Three months ended Nine months ended September 30, September 30, 2015 2014 2015 2014 Income from continuing operations, as reported............................................................................................................................... 11,710$ 11,090$ 32,140$ 39,220$ Less: Net income attributable to noncontrolling interests.......................................................................................................................... - - - 810 Income from continuing operations attributable to TriMas Corporation........................................................................................................ 11,710 11,090 32,140 38,410 After-tax impact of Special Items to consider in evaluating quality of income from continuing operations: Severance and business restructuring costs....................................................................................................................................... 6,120 2,530 12,050 4,800 Debt extinguishment costs................................................................................................................................................................ - - 1,240 - Excluding Special Items, income from continuing operations attributable to TriMas Corporation would have been..................... 17,830$ 13,620$ 45,430$ 43,210$ Three months ended Nine months ended September 30, September 30, 2015 2014 2015 2014 Diluted earnings per share from continuing operations attributable to TriMas Corporation, as reported.......................................... 0.26$ 0.24$ 0.70$ 0.85$ After-tax impact of Special Items to consider in evaluating quality of EPS from continuing operations: Severance and business restructuring costs....................................................................................................................................... 0.13 0.05 0.27$ 0.10 Debt extinguishment costs................................................................................................................................................................ - - 0.03$ - Excluding Special Items, EPS from continuing operations would have been................................................................................ 0.39$ 0.29$ 1.00$ 0.95$ Weighted-average shares outstanding .......................................................................................................................................... 45,499,104 45,276,199 45,439,618 45,231,058 2015 2014 2015 2014 Operating profit from continuing operations (excluding Special Items)……………………….……….................................................... 29,850$ 23,220$ 79,610$ 75,050$ Corporate expenses (excluding Special Items)…………………………………………................................................................................ 7,300 11,110 23,950 29,850 Segment operating profit (excluding Special Items)…………………................................................................................................... 37,150$ 34,330$ 103,560$ 104,900$ Segment operating profit margin (excluding Special Items)…...……................................................................................................ 16.7% 15.4% 15.4% 15.8% 2015 2014 2015 2014 Net cash provided by Operating Activities of continuing operations............................................................................................................ 8,260$ 13,410$ 28,740$ 52,640$ Add: Cash impact of Financial Improvement Plan.................................................................................................................................... 730 - 730 - Cash Flows from operating activities excluding special items................................................................................................................... 8,990 13,410 29,470 52,640 Less: Capital expenditures of continuing operations................................................................................................................................. (7,470) (5,380) (20,360) (18,320) Free Cash Flow from continuing operations............................................................................................................................................. 1,520$ 8,030$ 9,110$ 34,320$ Three months ended September 30, Nine months ended September 30, September 30, September 30, Three months ended Nine months ended (Unaudited, dollars in thousands, except for per share amounts)
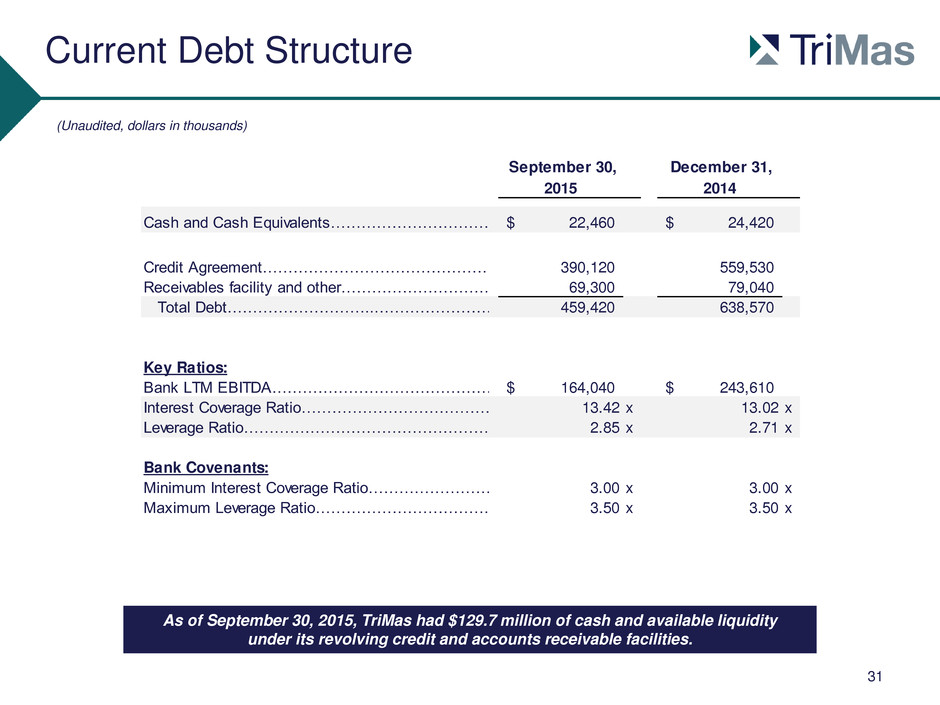
Current Debt Structure 31 (Unaudited, dollars in thousands) As of September 30, 2015, TriMas had $129.7 million of cash and available liquidity under its revolving credit and accounts receivable facilities. September 30, December 31, 2015 2014 Cash and Cash Equivalents……………………………..………………… 22,460$ 24,420$ Credit Agreement……………………………………….. 390,120 559,530 Receivables facility and other……………………………….. 69,300 79,040 Total Debt………………………...………………………...………………………… 459,420 638,570 Key Ratios: Bank LTM EBITDA……………………………………………………………………………….……………………………………… 164,040$ 243,610$ Interest Coverage Ratio………………………………………………………………… 13.42 x 13.02 x Leverage Ratio…………………………………………………………………... 2.85 x 2.71 x Bank Covenants: Minimum Interest Coverage Ratio………………………………………………………………… 3.00 x 3.00 x Maximum Leverage Ratio………………………………………………………………………………… 3.50 x 3.50 x
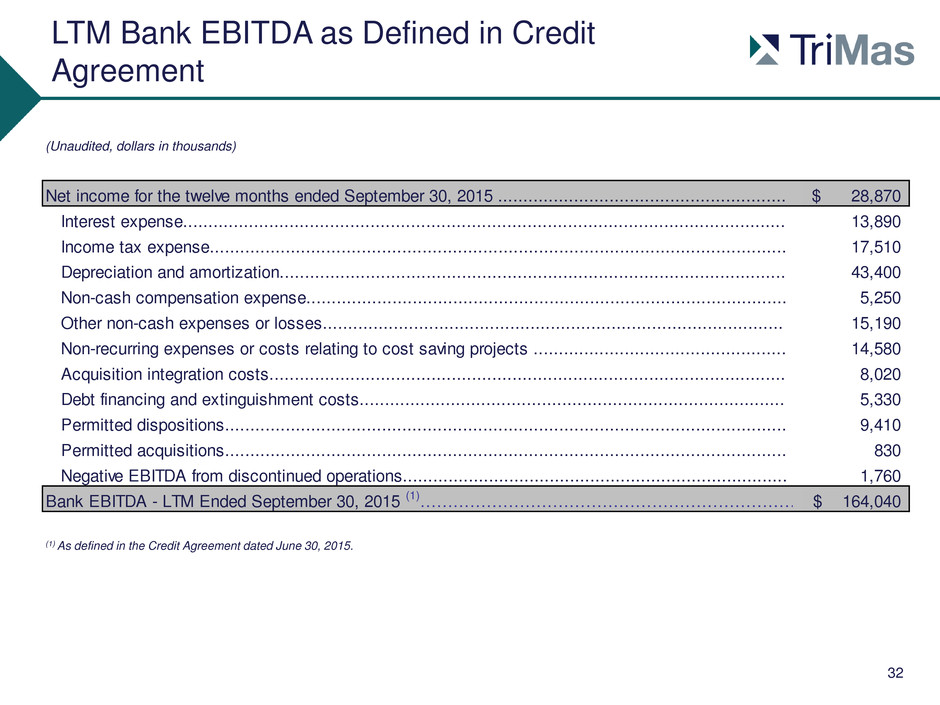
LTM Bank EBITDA as Defined in Credit Agreement 32 (Unaudited, dollars in thousands) (1) As defined in the Credit Agreement dated June 30, 2015. 28,870$ Interest expense....................................................................................................................... 13,890 Income tax expense.................................................................................................................. 17,510 Depreciation and amortization.................................................................................................... 43,400 Non-cash compensation expense............................................................................................... 5,250 Other non-cash expenses or losses........................................................................................... 15,190 Non-recurring expenses or costs relating to cost saving projects .................................................. 14,580 Acquisition integration costs...................................................................................................... 8,020 Debt financing and extinguishment costs.................................................................................... 5,330 Permitted dispositions............................................................................................................... 9,410 Permitted acquisitions............................................................................................................... 830 Negative EBITDA from discontinued operations............................................................................ 1,760 164,040$ Net income for the twelve months ended September 30, 2015 ......................................................... Bank EBITDA - LTM Ended September 30, 2015 (1)…………………………………………………………………
