Attached files
| file | filename |
|---|---|
| 8-K - 8-K - PINNACLE WEST CAPITAL CORP | a8-kfor9x30x15earnings.htm |
| EX-99.1 - EXHIBIT 99.1 - PINNACLE WEST CAPITAL CORP | exhibit9919-30x15.htm |
| EX-99.3 - EXHIBIT 99.3 - PINNACLE WEST CAPITAL CORP | exhibit993slidesfor93015.htm |

Last Updated 10/30/2015 Line 2015 2014 Incr (Decr) 2015 2014 Incr (Decr) EARNINGS CONTRIBUTION BY SUBSIDIARY (Dollars in Millions) 1 Arizona Public Service 266$ 255$ 11$ 420$ 427$ (7)$ 2 El Dorado - - - - (1) 1 3 Parent Company (4) (7) 3 (10) (12) 2 4 Net income 262 248 14 410 414 (4) 5 Less: Net Income Attributable to Noncontrolling Interests 5 4 1 14 22 (8) 6 Net Income Attributable to Common Shareholders 257$ 244$ 13$ 396$ 392$ 4$ EARNINGS PER SHARE BY SUBSIDIARY - DILUTED 7 Arizona Public Service 2.38$ 2.30$ 0.08$ 3.77$ 3.85$ (0.08)$ 8 El Dorado - - - - (0.01) 0.01 9 Parent Company (0.04) (0.06) 0.02 (0.09) (0.11) 0.02 10 Net income 2.34 2.24 0.10 3.68 3.73 (0.05) 11 Less: Net Income Attributable to Noncontrolling Interests 0.04 0.04 - 0.13 0.20 (0.07) 12 Net Income Attributable to Common Shareholders 2.30$ 2.20$ 0.10$ 3.55$ 3.53$ 0.02$ 13 BOOK VALUE PER SHARE 41.99$ 40.67$ 1.32$ 41.99$ 40.67$ 1.32$ COMMON SHARES OUTSTANDING (Thousands) 14 Average - Diluted 111,616 111,103 513 111,490 110,962 528 15 End of Period 110,847 110,447 400 110,847 110,447 400 Pinnacle West Capital Corporation Quarterly Consolidated Statistical Summary Periods Ended September 30, 2015 and 2014 3 Months Ended September 30, 9 Months Ended September 30, Page 1 of 4

Last Updated 10/30/2015 Line 2015 2014 Incr (Decr) 2015 2014 Incr (Decr) ELECTRIC OPERATING REVENUES (Dollars in Millions) Retail 16 Residential 657$ 619$ 38$ 1,375$ 1,329$ 46$ 17 Business 486 460 26 1,235 1,205 30 18 Total retail 1,143 1,079 64 2,610 2,534 76 Wholesale revenue on delivered electricity 19 Traditional contracts 3 16 (13) 9 40 (31) 20 Off-system sales 43 61 (18) 100 140 (40) 21 Native load hedge liquidation - - - - - - 22 Total wholesale 46 77 (31) 109 180 (71) 23 Transmission for others 12 7 5 27 23 4 24 Other miscellaneous services (3) 9 (12) 13 26 (13) 25 Total electric operating revenues 1,198$ 1,172$ 26$ 2,759$ 2,763$ (4)$ ELECTRIC SALES (GWH) Retail sales 26 Residential 4,834 4,665 169 10,393 10,252 141 27 Business 4,365 4,234 131 11,346 11,260 86 28 Total retail 9,199 8,899 300 21,739 21,512 227 Wholesale electricity delivered 29 Traditional contracts 38 186 (148) 150 560 (410) 30 Off-system sales 1,462 1,552 (90) 3,833 3,444 389 31 Retail load hedge management - - - - - - 32 Total wholesale 1,500 1,738 (238) 3,983 4,004 (21) 33 Total electric sales 10,699 10,637 62 25,722 25,516 206 Pinnacle West Capital Corporation Quarterly Consolidated Statistical Summary Periods Ended September 30, 2015 and 2014 3 Months Ended September 30, 9 Months Ended September 30, Page 2 of 4

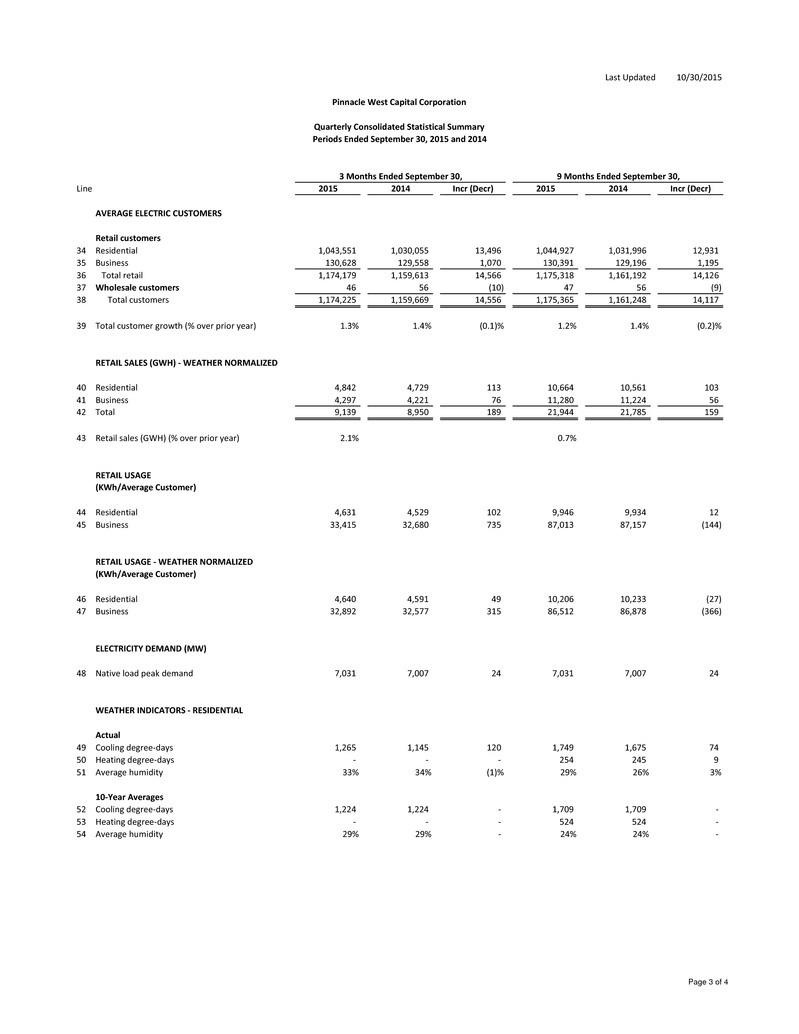
Last Updated 10/30/2015 Line 2015 2014 Incr (Decr) 2015 2014 Incr (Decr) AVERAGE ELECTRIC CUSTOMERS Retail customers 34 Residential 1,043,551 1,030,055 13,496 1,044,927 1,031,996 12,931 35 Business 130,628 129,558 1,070 130,391 129,196 1,195 36 Total retail 1,174,179 1,159,613 14,566 1,175,318 1,161,192 14,126 37 Wholesale customers 46 56 (10) 47 56 (9) 38 Total customers 1,174,225 1,159,669 14,556 1,175,365 1,161,248 14,117 39 Total customer growth (% over prior year) 1.3% 1.4% (0.1)% 1.2% 1.4% (0.2)% RETAIL SALES (GWH) - WEATHER NORMALIZED 40 Residential 4,842 4,729 113 10,664 10,561 103 41 Business 4,297 4,221 76 11,280 11,224 56 42 Total 9,139 8,950 189 21,944 21,785 159 43 Retail sales (GWH) (% over prior year) 2.1% 0.7% RETAIL USAGE (KWh/Average Customer) 44 Residential 4,631 4,529 102 9,946 9,934 12 45 Business 33,415 32,680 735 87,013 87,157 (144) RETAIL USAGE - WEATHER NORMALIZED (KWh/Average Customer) 46 Residential 4,640 4,591 49 10,206 10,233 (27) 47 Business 32,892 32,577 315 86,512 86,878 (366) ELECTRICITY DEMAND (MW) 48 Native load peak demand 7,031 7,007 24 7,031 7,007 24 WEATHER INDICATORS - RESIDENTIAL Actual 49 Cooling degree-days 1,265 1,145 120 1,749 1,675 74 50 Heating degree-days - - - 254 245 9 51 Average humidity 33% 34% (1)% 29% 26% 3% 10-Year Averages 52 Cooling degree-days 1,224 1,224 - 1,709 1,709 - 53 Heating degree-days - - - 524 524 - 54 Average humidity 29% 29% - 24% 24% - Periods Ended September 30, 2015 and 2014 3 Months Ended September 30, 9 Months Ended September 30, Quarterly Consolidated Statistical Summary Pinnacle West Capital Corporation Page 3 of 4

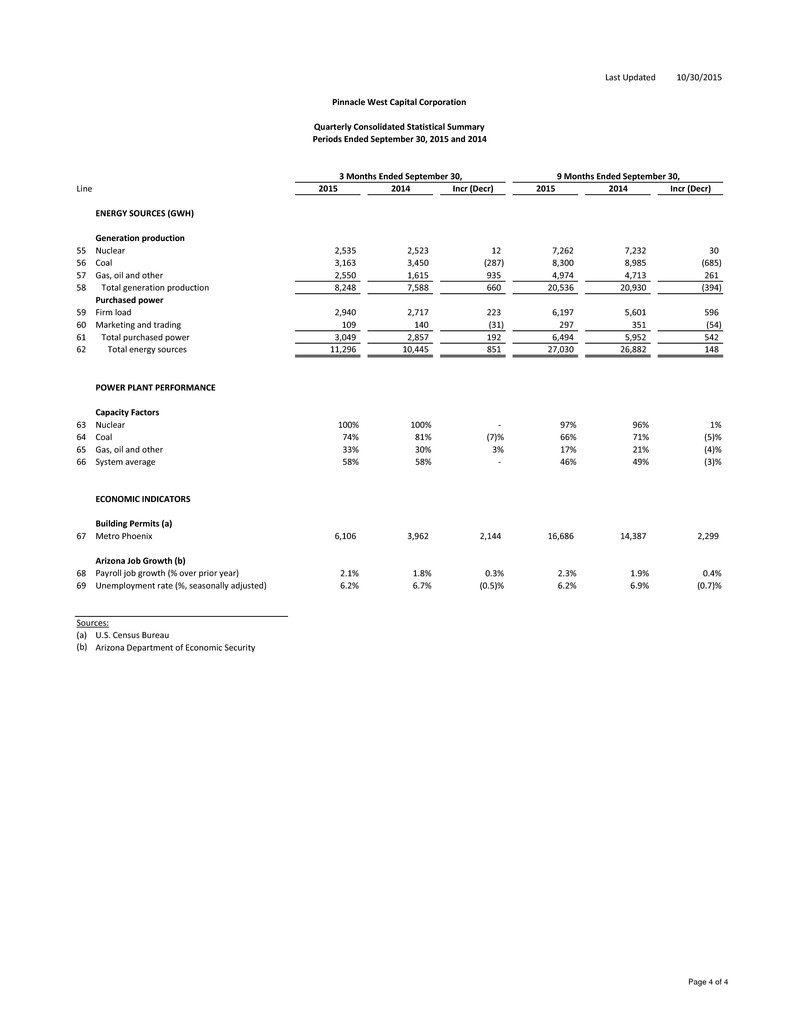
Last Updated 10/30/2015 Line 2015 2014 Incr (Decr) 2015 2014 Incr (Decr) ENERGY SOURCES (GWH) Generation production 55 Nuclear 2,535 2,523 12 7,262 7,232 30 56 Coal 3,163 3,450 (287) 8,300 8,985 (685) 57 Gas, oil and other 2,550 1,615 935 4,974 4,713 261 58 Total generation production 8,248 7,588 660 20,536 20,930 (394) Purchased power 59 Firm load 2,940 2,717 223 6,197 5,601 596 60 Marketing and trading 109 140 (31) 297 351 (54) 61 Total purchased power 3,049 2,857 192 6,494 5,952 542 62 Total energy sources 11,296 10,445 851 27,030 26,882 148 POWER PLANT PERFORMANCE Capacity Factors 63 Nuclear 100% 100% - 97% 96% 1% 64 Coal 74% 81% (7)% 66% 71% (5)% 65 Gas, oil and other 33% 30% 3% 17% 21% (4)% 66 System average 58% 58% - 46% 49% (3)% ECONOMIC INDICATORS Building Permits (a) 67 Metro Phoenix 6,106 3,962 2,144 16,686 14,387 2,299 Arizona Job Growth (b) 68 Payroll job growth (% over prior year) 2.1% 1.8% 0.3% 2.3% 1.9% 0.4% 69 Unemployment rate (%, seasonally adjusted) 6.2% 6.7% (0.5)% 6.2% 6.9% (0.7)% Sources: (a) U.S. Census Bureau (b) Arizona Department of Economic Security 3 Months Ended September 30, 9 Months Ended September 30, Pinnacle West Capital Corporation Quarterly Consolidated Statistical Summary Periods Ended September 30, 2015 and 2014 Page 4 of 4
