Attached files
| file | filename |
|---|---|
| 8-K - META FINANCIAL GROUP, INC 8-K 10-30-2015 - META FINANCIAL GROUP INC | form8k.htm |
| EX-99.1 - EXHIBIT 99.1 - META FINANCIAL GROUP INC | ex99_1.htm |
Exhibit 99.2
fourth QUARTER FY2015 Investor Update
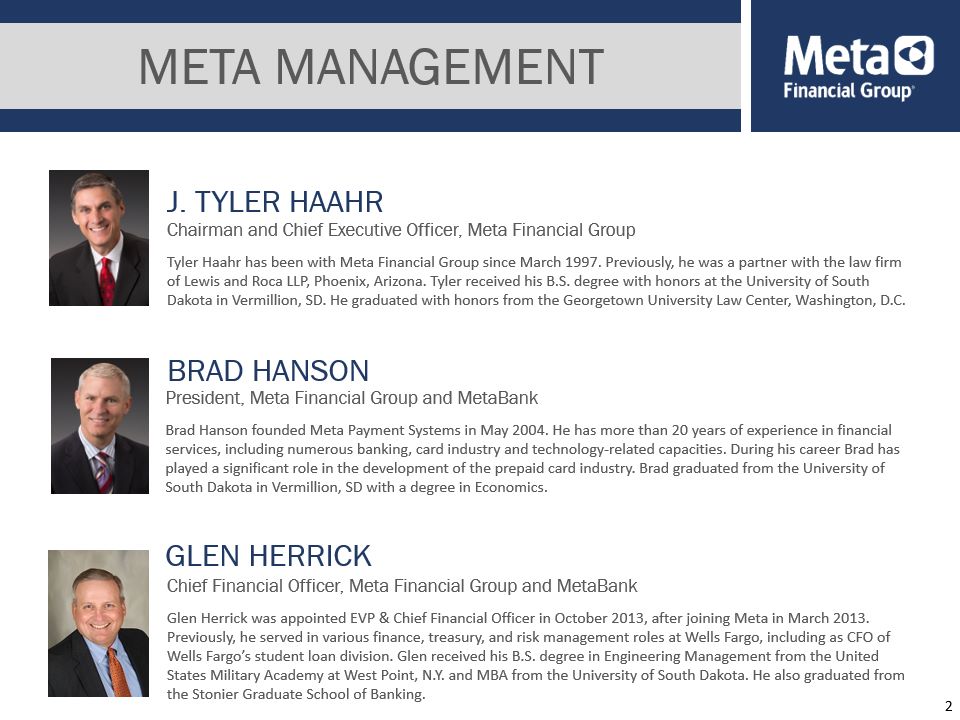
META Management Chairman and Chief Executive Officer, Meta Financial GroupTyler Haahr has been with Meta Financial Group since March 1997. Previously, he was a partner with the law firm of Lewis and Roca LLP, Phoenix, Arizona. Tyler received his B.S. degree with honors at the University of South Dakota in Vermillion, SD. He graduated with honors from the Georgetown University Law Center, Washington, D.C. President, Meta Financial Group and MetaBankBrad Hanson founded Meta Payment Systems in May 2004. He has more than 20 years of experience in financial services, including numerous banking, card industry and technology-related capacities. During his career Brad has played a significant role in the development of the prepaid card industry. Brad graduated from the University of South Dakota in Vermillion, SD with a degree in Economics. Chief Financial Officer, Meta Financial Group and MetaBank Glen Herrick was appointed EVP & Chief Financial Officer in October 2013, after joining Meta in March 2013. Previously, he served in various finance, treasury, and risk management roles at Wells Fargo, including as CFO of Wells Fargo’s student loan division. Glen received his B.S. degree in Engineering Management from the United States Military Academy at West Point, N.Y. and MBA from the University of South Dakota. He also graduated from the Stonier Graduate School of Banking. J. Tyler Haahr Brad Hanson Glen Herrick 2
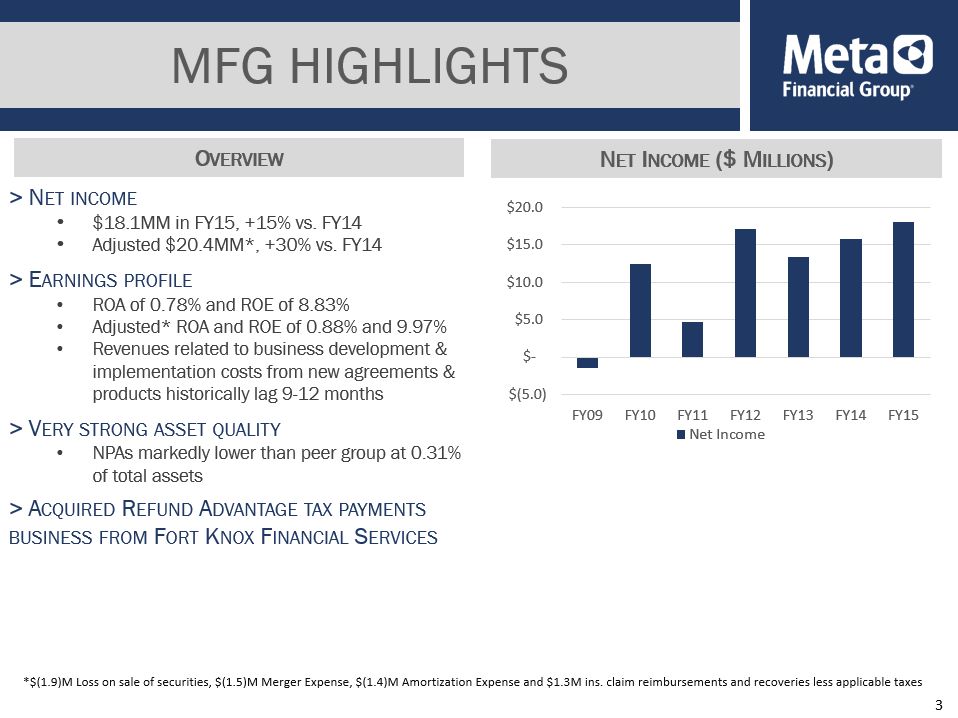
> Net income$18.1MM in FY15, +15% vs. FY14Adjusted $20.4MM*, +30% vs. FY14 > Earnings profileROA of 0.78% and ROE of 8.83%Adjusted* ROA and ROE of 0.88% and 9.97%Revenues related to business development & implementation costs from new agreements & products historically lag 9-12 months > Very strong asset qualityNPAs markedly lower than peer group at 0.31% of total assets> Acquired Refund Advantage tax payments business from Fort Knox Financial Services Mfg HIGHLIGHTS 3 *$(1.9)M Loss on sale of securities, $(1.5)M Merger Expense, $(1.4)M Amortization Expense and $1.3M ins. claim reimbursements and recoveries less applicable taxes Overview Net Income ($ Millions)
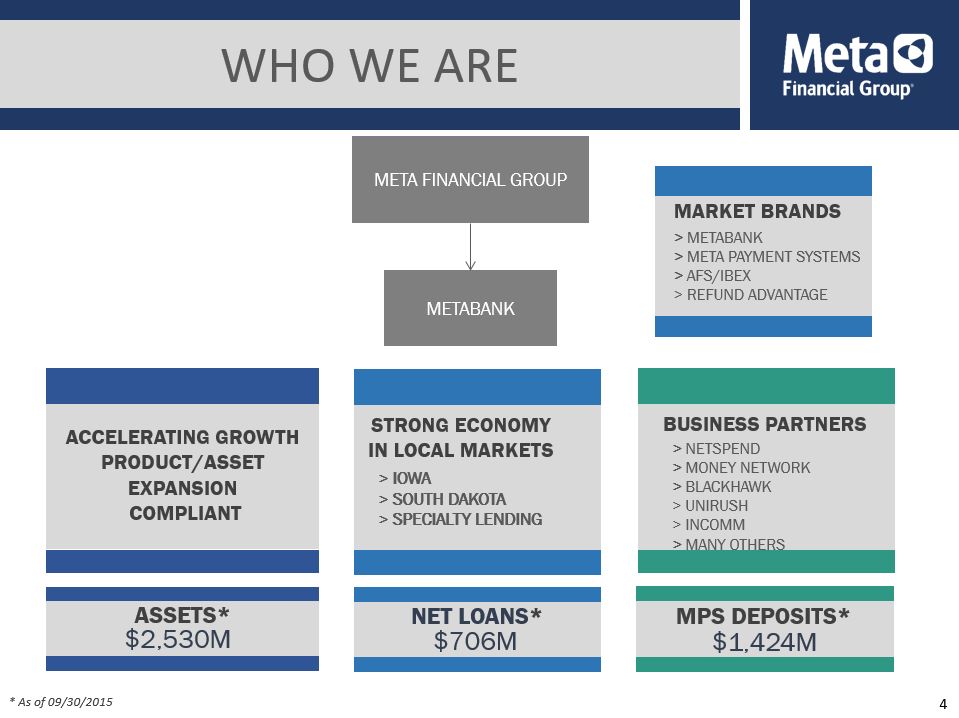
MetaBank Meta Financial Group Net LOANS* $706M MPS Deposits* $1,424M STRONG ECONOMY IN LOCAL MARKETS BUSINESS PARTNERS > NetSpend> Money Network> Blackhawk> Unirush> INCOMM> Many Others * As of 09/30/2015 WHO WE ARE 4 Accelerating Growth Product/asset Expansion Compliant Assets* $2,530M > IOWA> SOUTH DAKOTA> SPECIALTY LENDING WHO WE ARE MARKET BRANDS > METABANK> META PAYMENT SYSTEMS> AFS/IBEX> REFUND ADVANTAGE
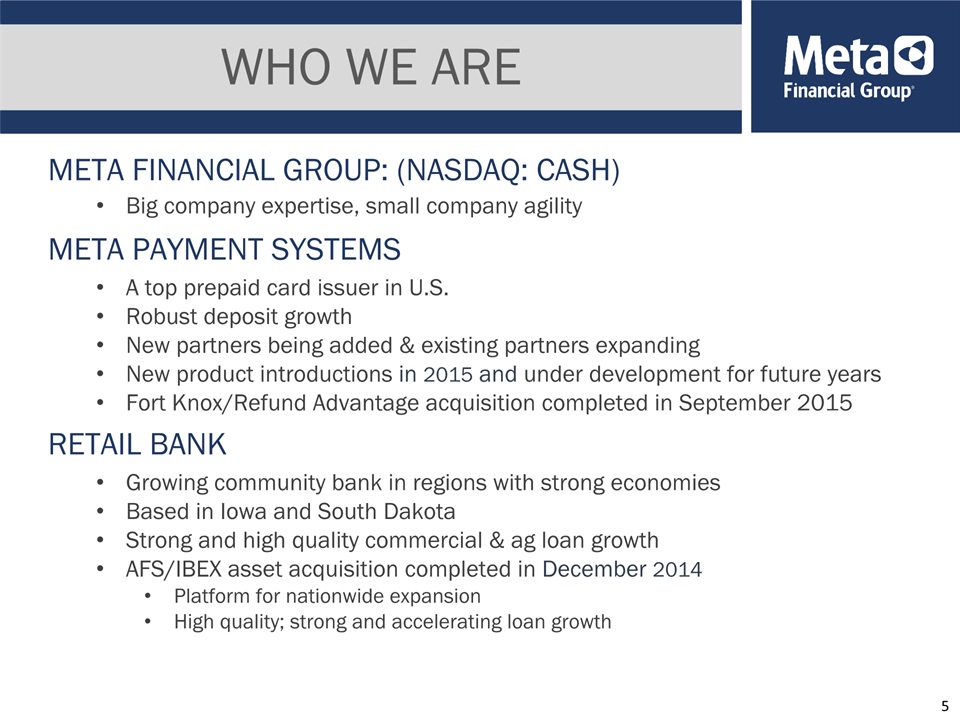
WHO WE ARE Growing community bank in regions with strong economiesBased in Iowa and South Dakota Strong and high quality commercial & ag loan growthAFS/IBEX asset acquisition completed in December 2014Platform for nationwide expansionHigh quality; strong and accelerating loan growth RETAIL BANK A top prepaid card issuer in U.S.Robust deposit growthNew partners being added & existing partners expandingNew product introductions in 2015 and under development for future yearsFort Knox/Refund Advantage acquisition completed in September 2015 META PAYMENT SYSTEMS 5 Meta financial group: (NASDAQ: CASH) Big company expertise, small company agility WHO WE ARE
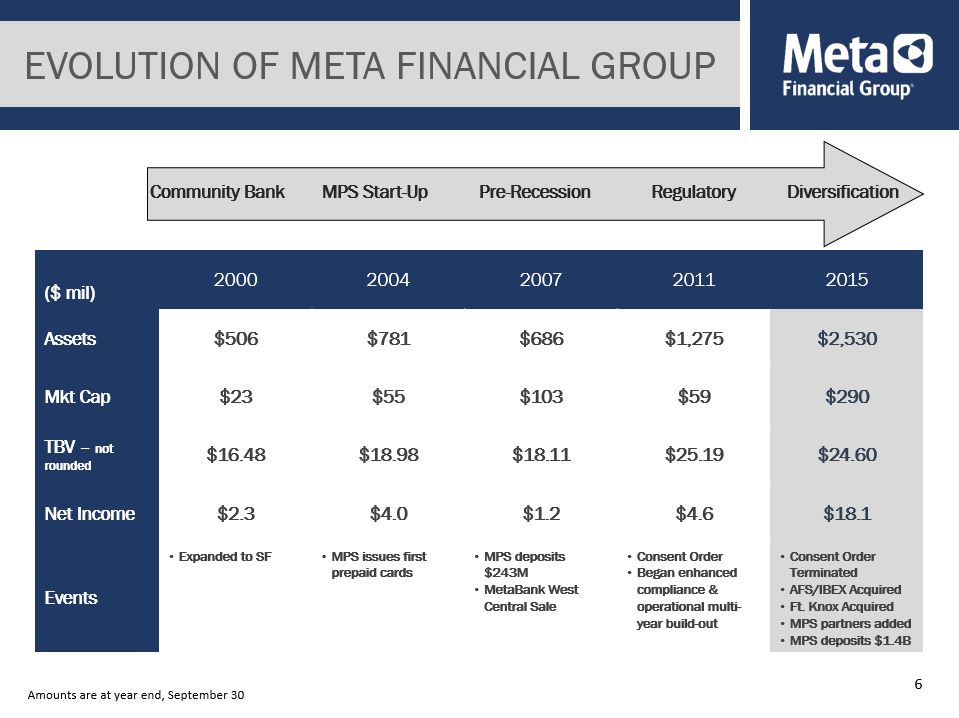
6 Evolution of Meta Financial Group Community Bank MPS Start-Up Pre-Recession Regulatory Diversification ($ mil) 2000 2004 2007 2011 2015 Assets $506 $781 $686 $1,275 $2,530 Mkt Cap $23 $55 $103 $59 $290 TBV – not rounded $16.48 $18.98 $18.11 $25.19 $24.60 Net Income $2.3 $4.0 $1.2 $4.6 $18.1 Events Expanded to SF MPS issues first prepaid cards MPS deposits $243MMetaBank West Central Sale Consent OrderBegan enhanced compliance & operational multi-year build-out Consent Order TerminatedAFS/IBEX AcquiredFt. Knox AcquiredMPS partners addedMPS deposits $1.4B Amounts are at year end, September 30
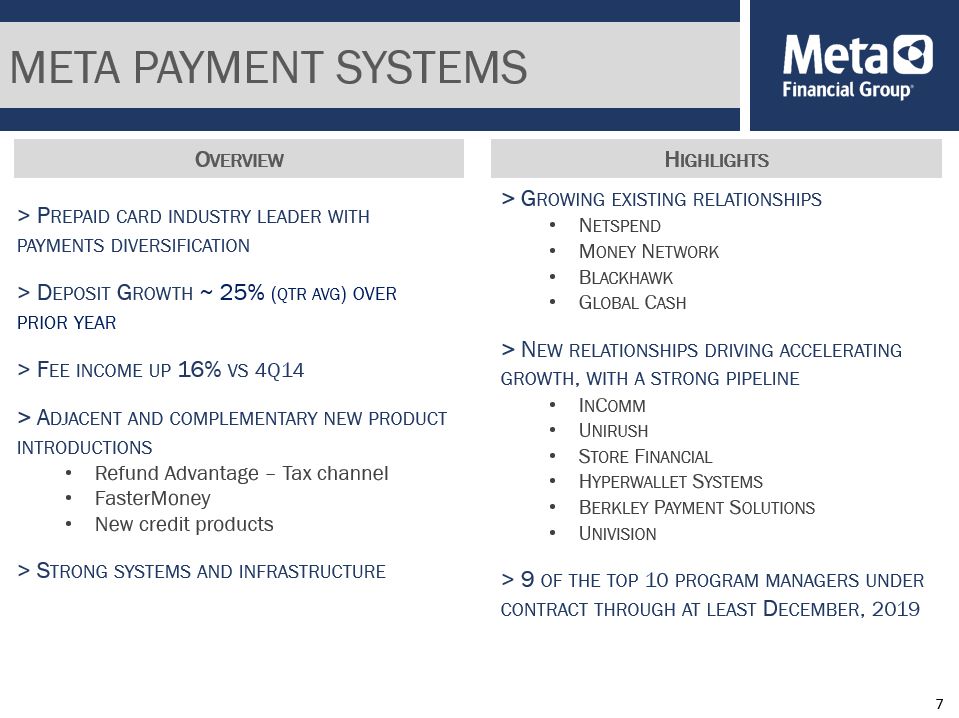
> Prepaid card industry leader with payments diversification> Deposit Growth ~ 25% (qtr avg) over prior year> Fee income up 16% vs 4Q14> Adjacent and complementary new product introductionsRefund Advantage – Tax channelFasterMoneyNew credit products> Strong systems and infrastructure Meta Payment Systems 7 > Growing existing relationshipsNetspendMoney NetworkBlackhawkGlobal Cash> New relationships driving accelerating growth, with a strong pipelineInComm UnirushStore FinancialHyperwallet Systems Berkley Payment SolutionsUnivision> 9 of the top 10 program managers under contract through at least December, 2019 Highlights Overview

> Regional Community Bank60+ years in business 10 locations in IA and SD Growing, profitable operationsAttractive combination of commercial, agricultural, retail and insurance premium finance lending> Net loan growth of 22% ($105MM) last 12 Months> Expect continued robust loan growth in the next year> Continued high credit standards resulting in low non-performing assets Retail bank 8 > South DakotaBrookingsSioux Falls Locations > IowaDes MoinesStorm Lake
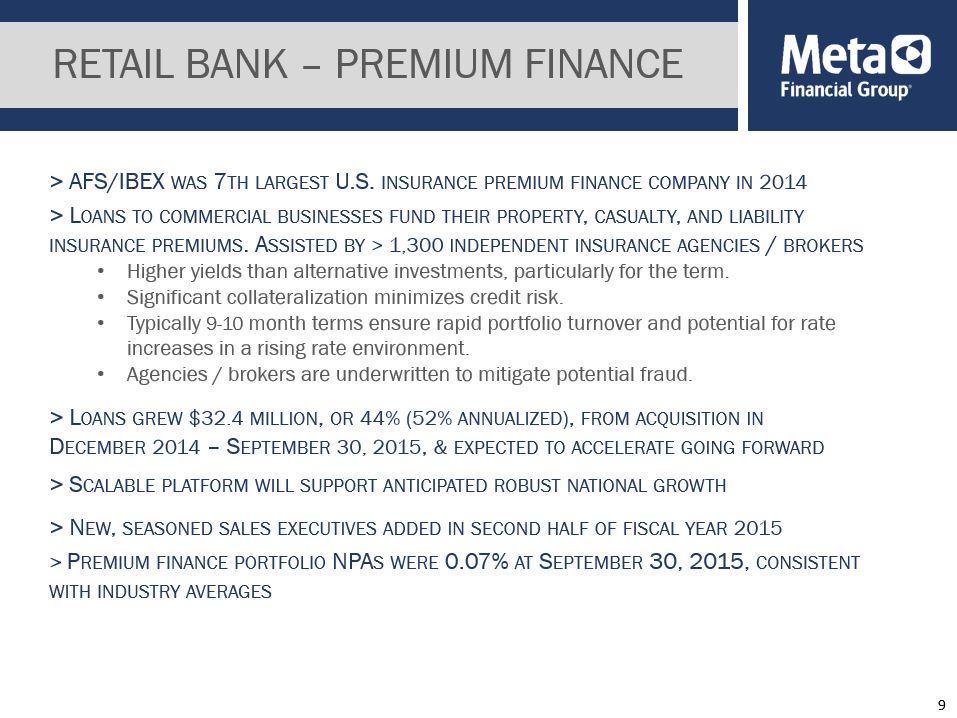
Retail bank – premium finance 9 > AFS/IBEX was 7th largest U.S. insurance premium finance company in 2014> Loans to commercial businesses fund their property, casualty, and liability insurance premiums. Assisted by > 1,300 independent insurance agencies / brokersHigher yields than alternative investments, particularly for the term.Significant collateralization minimizes credit risk.Typically 9-10 month terms ensure rapid portfolio turnover and potential for rate increases in a rising rate environment.Agencies / brokers are underwritten to mitigate potential fraud.> Loans grew $32.4 million, or 44% (52% annualized), from acquisition in December 2014 – September 30, 2015, & expected to accelerate going forward> Scalable platform will support anticipated robust national growth> New, seasoned sales executives added in second half of fiscal year 2015> Premium finance portfolio NPAs were 0.07% at September 30, 2015, consistent with industry averages
Industry RECOGNITION #44 in American Banker Magazine “More double-digit goodness” (June 2015) based on avg. roe over the past 3 years#48 in American Banker Magazine “Top 200 Community Banks and Thrifts” (June 2015) Top 1% based on 3 year ROETop 100 in ABA Banking Journal’s annual Performance Ranking for $1B-$10B banks (2014)Second largest Prepaid card issuer in the U.S. ranked by purchase volume – The Nilson Report (2015)Top 40 of ACH originators in 2014 (nacha 2015)Top 30 of ACH receivers in 2014 (nacha 2015)Added to Russell 2000 Index (RTY) in June 2013Added to NASDAQ’s ABA Community Bank Index (ABQI) in December 2013 Meta Financial Group 10
Strategic Goals Grow organically and by acquisition to achieve scaleDiversify business linesStrengthen balance sheet and grow revenueCreate a more strategic asset mixHire and develop the right people in the right rolesscalable operating infrastructureVertically integrate to gain more of the economic value chain 11
> Optimize synergies: retail bank and MPSStrong loan growth in local markets and AFS/IBEXLow cost deposits feed increasingly diverse asset mixRising rates expected to increase yields while funding costs remain lowMBS portfolio yields & related income expected to increase significantly if rates rise> Leverage MPS leadership in payments industryIncreasing market share organically and with new partnersEntered Tax Payments space via Refund Advantage acquisitionEmergent leader in “virtual cards” for electronic settlementsSponsors ~65% of U.S. “white label” ATMs42 patents with over a dozen pending> Retail bank Entrance into specialty lendingAFS/IBEX acquisition in December 2014Hired executive sales staff and other experienced producers for AFS/IBEX in 2h15Health care financing company partnership, with hospitals providing credit guarantee, will provide another loan portfolio of up to $100m in receivables over the next two years with limited credit risk & solid yields Growth drivers 12
> Early adopter of sophisticated compliance systems> OCC consent order removed in august 2014> Federal reserve bank consent order removed in may 2015> Investments in MPS program design, training and technologyImplemented enhanced BSA/AML technologyEnhanced infrastructure supports growthAdditional focus on business development opportunities> High competitive barriers to enter prepaid IndustryExpertise, Capital, ComplianceOperational infrastructureHigh start-up costs oversight and infrastructure 13
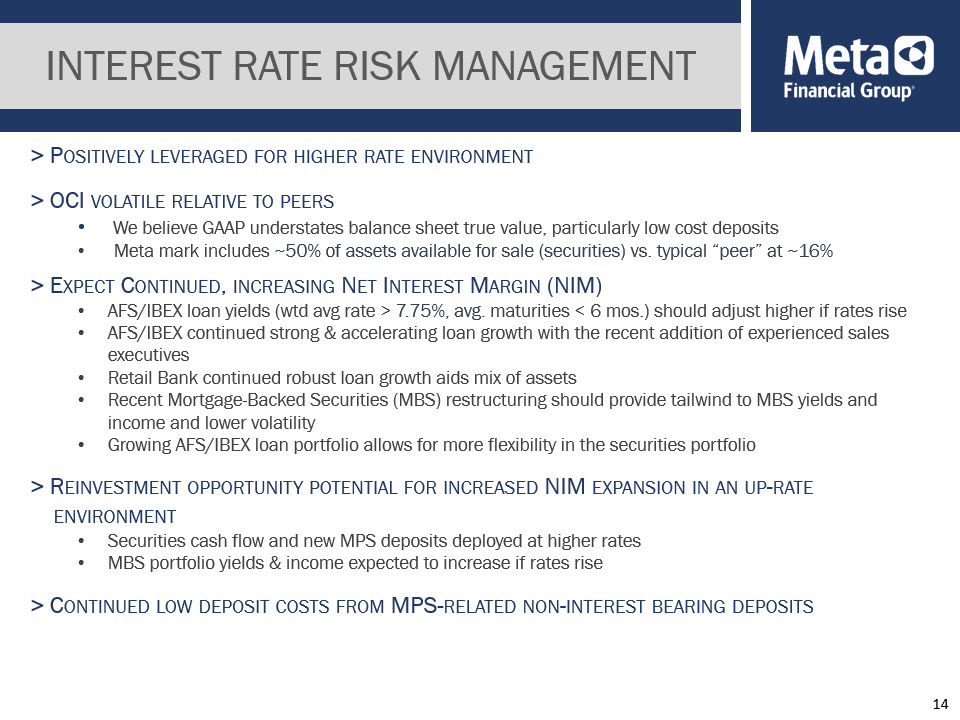
> Positively leveraged for higher rate environment> OCI volatile relative to peers We believe GAAP understates balance sheet true value, particularly low cost depositsMeta mark includes ~50% of assets available for sale (securities) vs. typical “peer” at ~16% > Expect Continued, increasing Net Interest Margin (NIM)AFS/IBEX loan yields (wtd avg rate > 7.75%, avg. maturities < 6 mos.) should adjust higher if rates riseAFS/IBEX continued strong & accelerating loan growth with the recent addition of experienced sales executivesRetail Bank continued robust loan growth aids mix of assetsRecent Mortgage-Backed Securities (MBS) restructuring should provide tailwind to MBS yields and income and lower volatilityGrowing AFS/IBEX loan portfolio allows for more flexibility in the securities portfolio> Reinvestment opportunity potential for increased NIM expansion in an up-rate environmentSecurities cash flow and new MPS deposits deployed at higher ratesMBS portfolio yields & income expected to increase if rates rise > Continued low deposit costs from MPS-related non-interest bearing deposits Interest Rate Risk Management 14

Interest Rate Sensitivity 15 > We believe static interest rate results do not accurately reflect true interest rate sensitivityDue to historically predictable weekly and monthly deposit volatility, IRR results can be significantly skewed based on which day of the week the model is implementedUtilizing quarterly average balances for deposits and borrowings, with cash as the offset, provides a truer picture of the Company’s IRR positionUnderstanding the predictable cyclicality of balance sheet on weekly, monthly, and yearly basis is necessary to interpret interest rate risk resultsMPS related non-interest bearing deposit value will be unlocked if interest rates rise
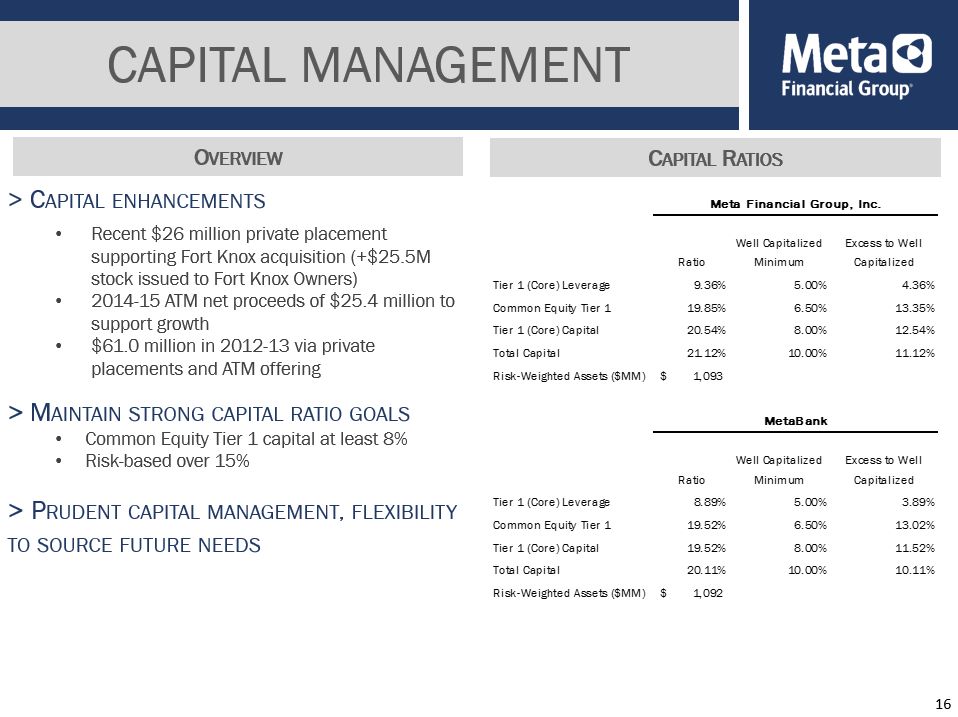
> Capital enhancementsRecent $26 million private placement supporting Fort Knox acquisition (+$25.5M stock issued to Fort Knox Owners)2014-15 ATM net proceeds of $25.4 million to support growth$61.0 million in 2012-13 via private placements and ATM offering> Maintain strong capital ratio goalsCommon Equity Tier 1 capital at least 8%Risk-based over 15%> Prudent capital management, flexibility to source future needs Capital Management 16 Capital Ratios Overview

Earnings power while growing equity 17
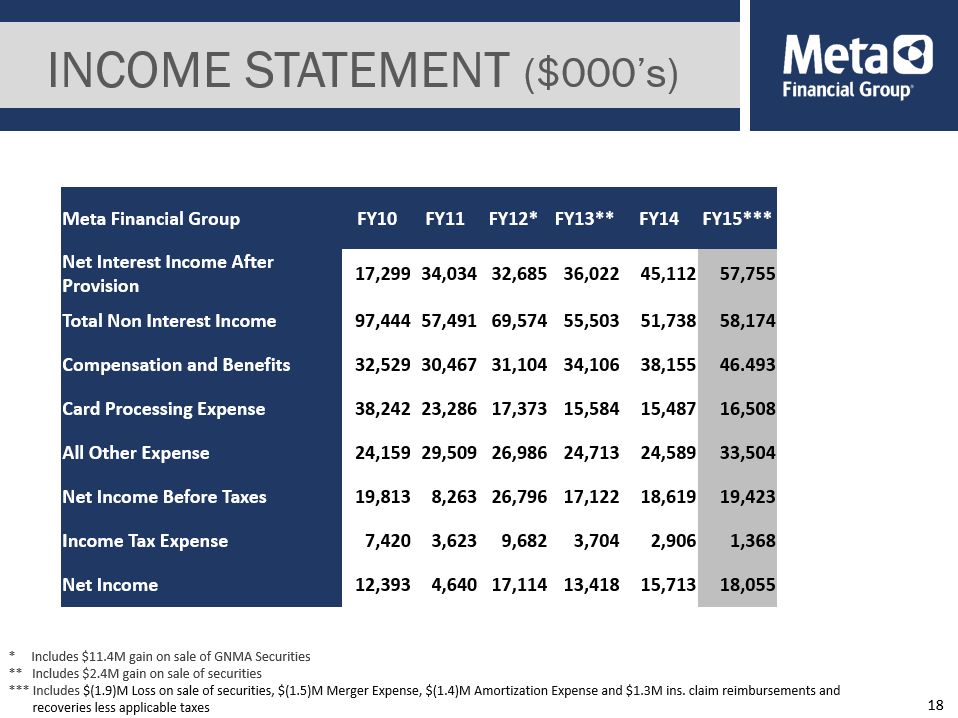
Income statement ($000’s) * Includes $11.4M gain on sale of GNMA Securities** Includes $2.4M gain on sale of securities*** Includes $(1.9)M Loss on sale of securities, $(1.5)M Merger Expense, $(1.4)M Amortization Expense and $1.3M ins. claim reimbursements and recoveries less applicable taxes Meta Financial Group FY10 FY11 FY12* FY13** FY14 FY15*** Net Interest Income After Provision 17,299 34,034 32,685 36,022 45,112 57,755 Total Non Interest Income 97,444 57,491 69,574 55,503 51,738 58,174 Compensation and Benefits 32,529 30,467 31,104 34,106 38,155 46.493 Card Processing Expense 38,242 23,286 17,373 15,584 15,487 16,508 All Other Expense 24,159 29,509 26,986 24,713 24,589 33,504 Net Income Before Taxes 19,813 8,263 26,796 17,122 18,619 19,423 Income Tax Expense 7,420 3,623 9,682 3,704 2,906 1,368 Net Income 12,393 4,640 17,114 13,418 15,713 18,055 18

Total revenue $ millions 19 * Includes $11.4M gain on sale of GNMA Securities** Includes $2.4M gain on sale of securities*** Includes $(1.9)M Loss on sale of securities and $1.3M ins. claim reimbursements
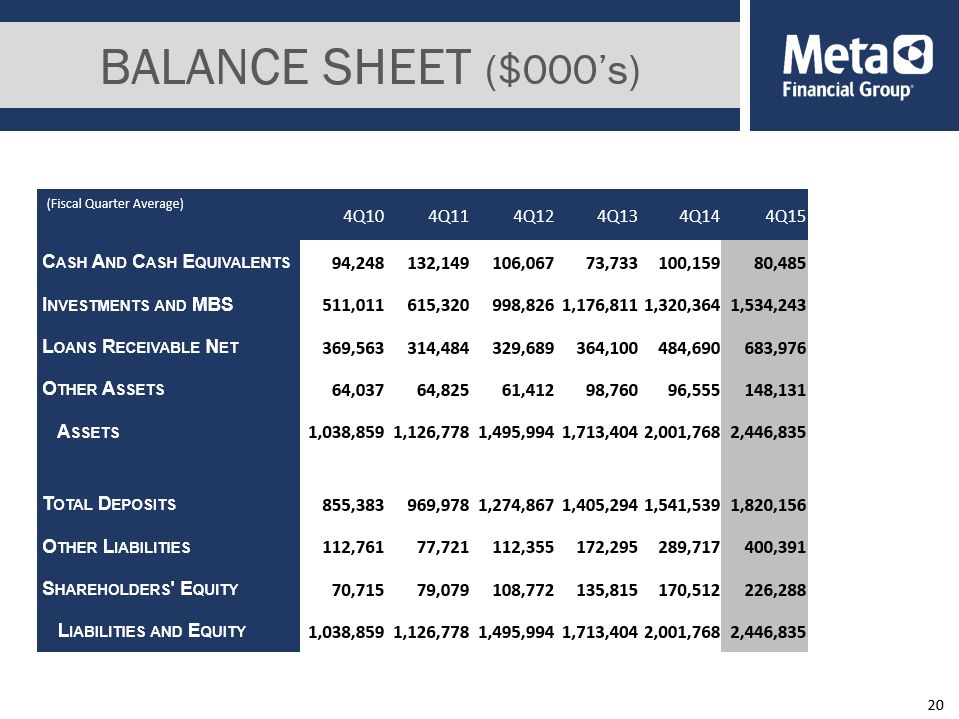
Balance sheet ($000’s) 4Q10 4Q11 4Q12 4Q13 4Q14 4Q15 Cash And Cash Equivalents 94,248 132,149 106,067 73,733 100,159 80,485 Investments and MBS 511,011 615,320 998,826 1,176,811 1,320,364 1,534,243 Loans Receivable Net 369,563 314,484 329,689 364,100 484,690 683,976 Other Assets 64,037 64,825 61,412 98,760 96,555 148,131 Assets 1,038,859 1,126,778 1,495,994 1,713,404 2,001,768 2,446,835 Total Deposits 855,383 969,978 1,274,867 1,405,294 1,541,539 1,820,156 Other Liabilities 112,761 77,721 112,355 172,295 289,717 400,391 Shareholders' Equity 70,715 79,079 108,772 135,815 170,512 226,288 Liabilities and Equity 1,038,859 1,126,778 1,495,994 1,713,404 2,001,768 2,446,835 (Fiscal Quarter Average) 20
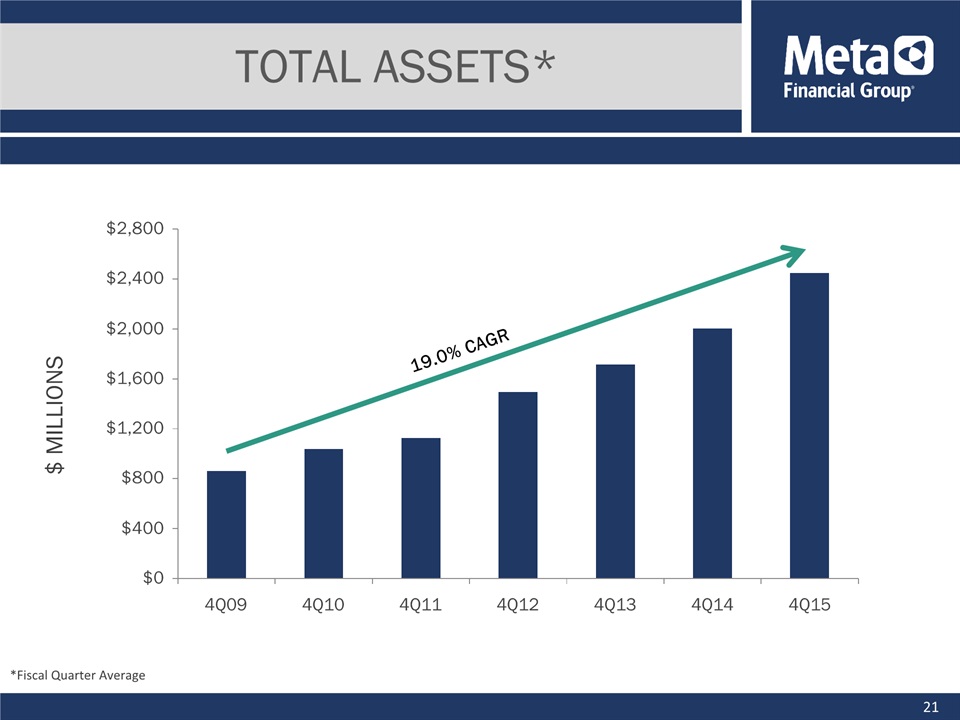
Total assets* 19.0% CAGR $ millions 21 *Fiscal Quarter Average
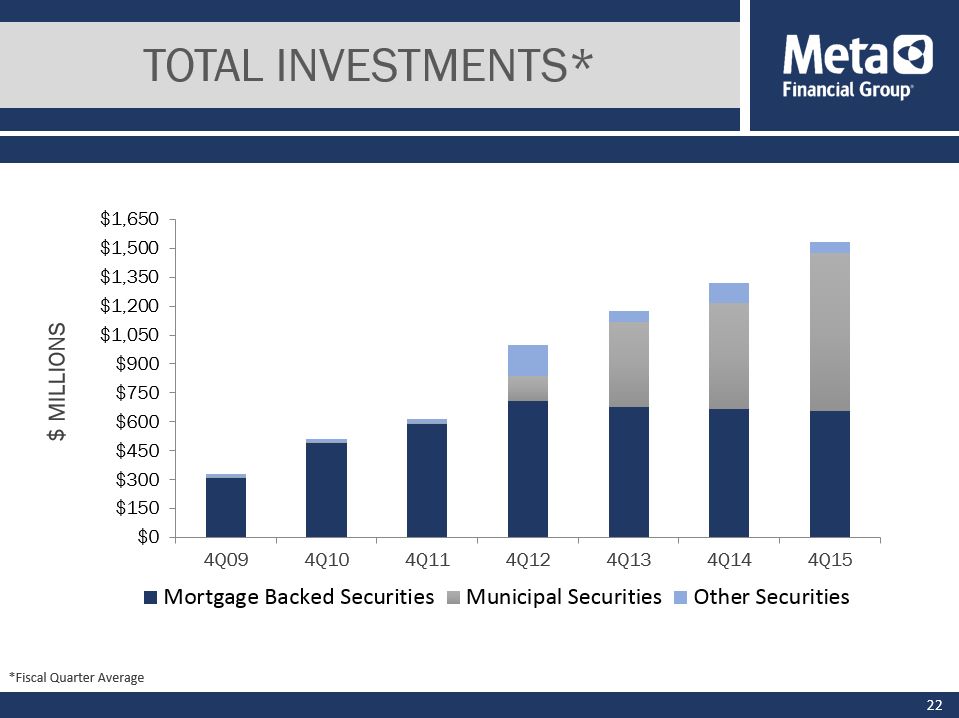
Total Investments* $ millions 22 *Fiscal Quarter Average
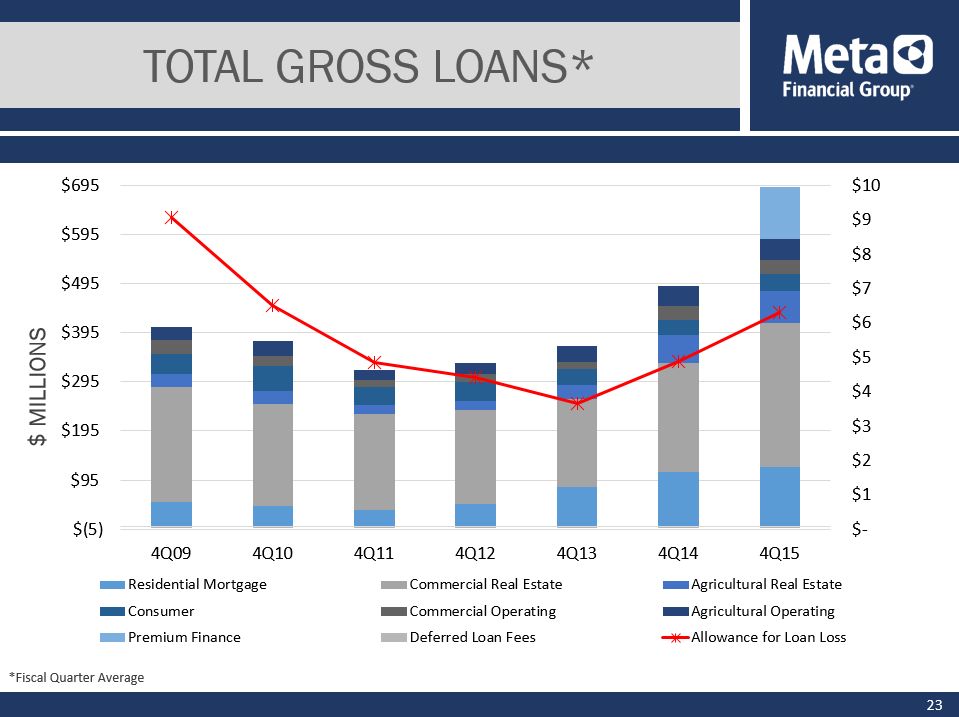
Total Gross loans* $ millions 23 *Fiscal Quarter Average
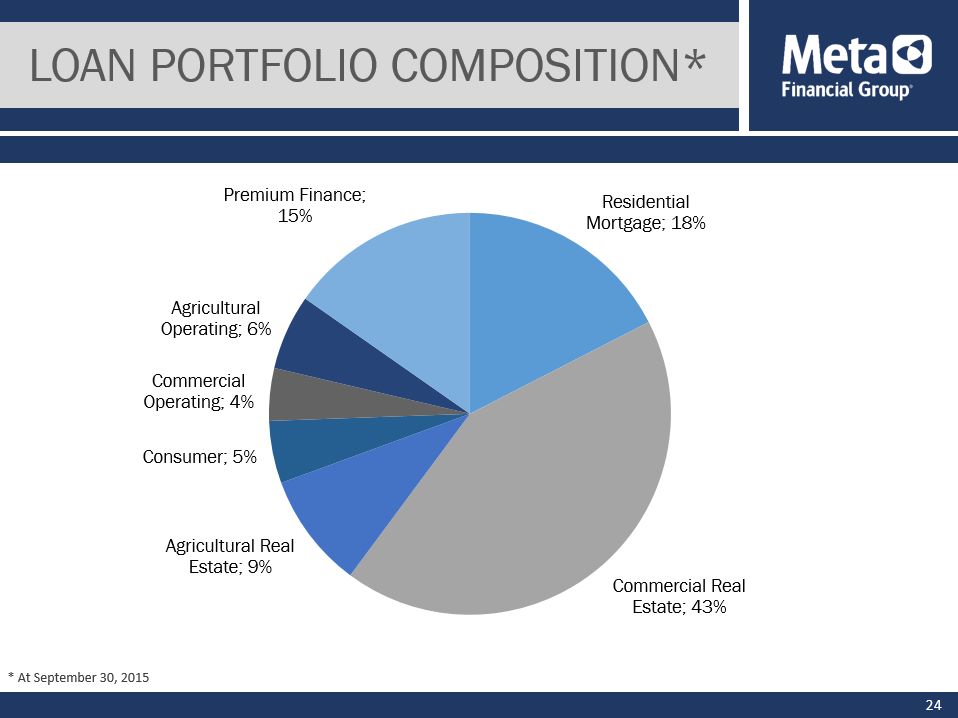
Loan Portfolio Composition* 24 * At September 30, 2015
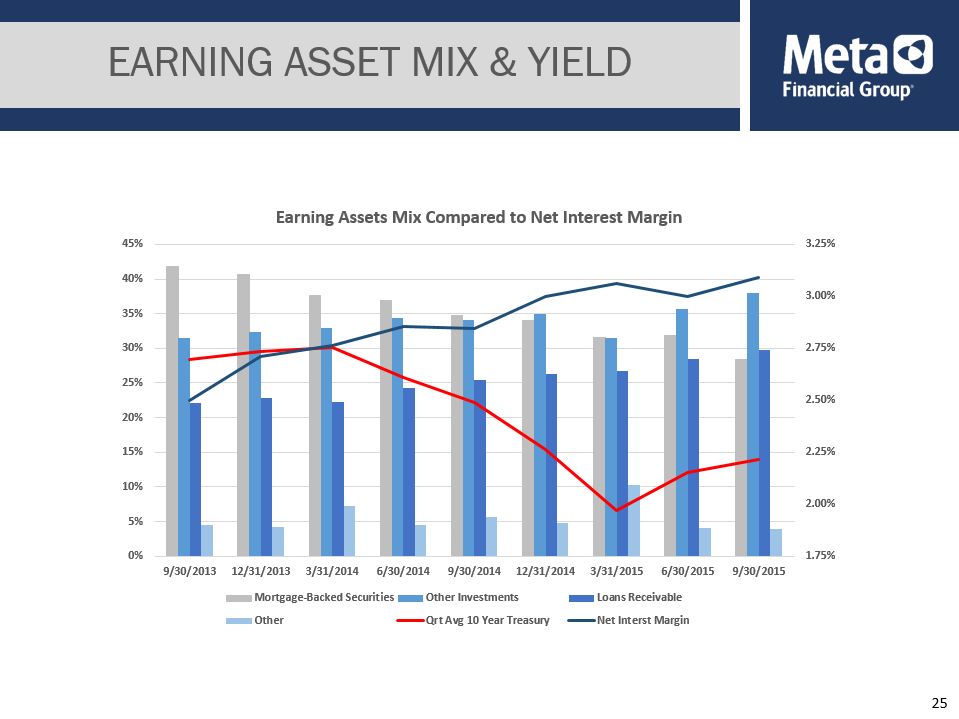
Earning asset mix & Yield 25
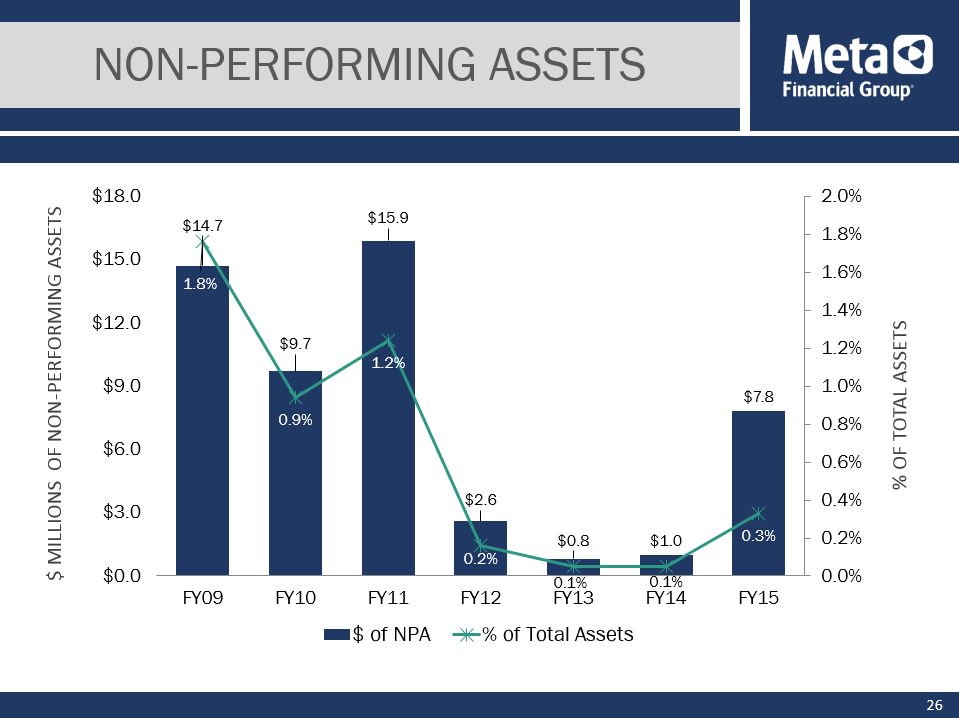
Non-performing assets $ millions of non-performing assets % of total assets 26
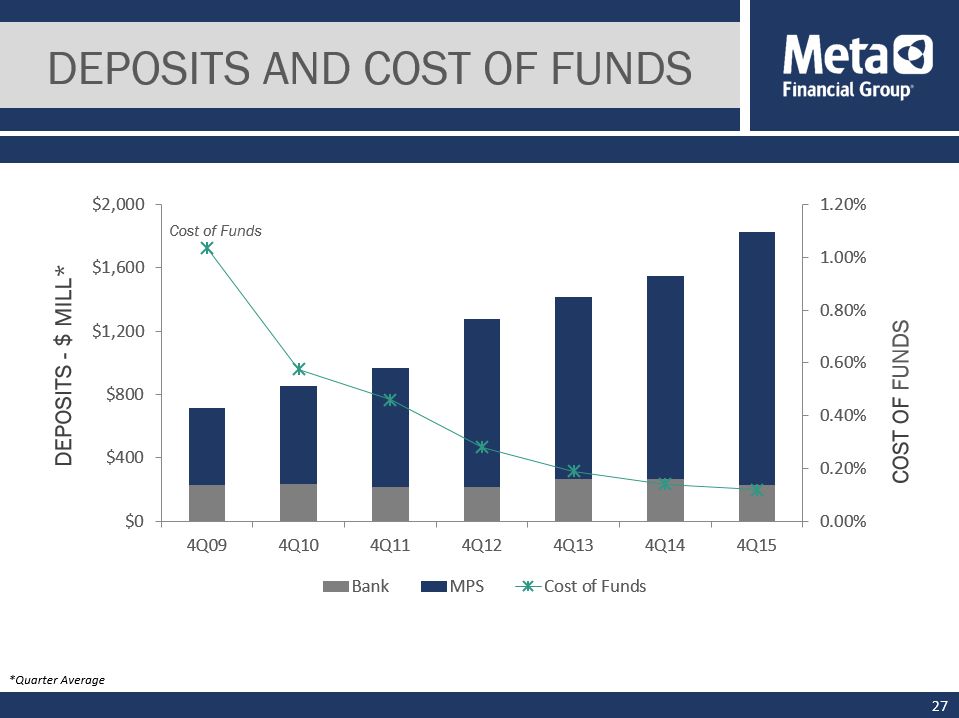
Deposits and cost of funds deposits - $ mill* Cost of Funds 27 *Quarter Average
> A leading issuer of prepaid debit cardsSpringboard into other products and services.Significant growth; current partners expanding & new partners added.> Strong capital positionEarnings and historical access to capital markets to fund our growth objectives. > Stable, low-cost funding advantage> Potential for upward trend in earningsHigher/Normalized interest rates. Asset diversification with higher yields.~90% of deposits are low cost & will remain so in rising rates.Loan & security yields well positioned to increase with rising rates. > Steady dividend policy META VALUE PROPOSITION 28

Forward Looking Statements Meta Financial Group, Inc.®, (“the Company”) and its wholly-owned subsidiary, MetaBank® (the “Bank” or “MetaBank”), may from time to time make written or oral “forward-looking statements,” including statements contained in this investor update, the Company’s filings with the Securities and Exchange Commission (“SEC”), the Company’s reports to stockholders and in other communications by the Company and the Bank, which are made in good faith by the Company pursuant to the “safe harbor” provisions of the Private Securities Litigation Reform Act of 1995.You can identify forward-looking statements by words such as “may,” “hope,” “will,” “should,” “expect,” “plan,” “anticipate,” “intend,” “believe,” “estimate,” “predict,” “potential,” “continue,” “could,” “future,” or the negative of those terms, or other words of similar meaning. You should carefully read statements that contain these words because they discuss our future expectations or state other “forward-looking” information. These forward-looking statements include statements with respect to the Company’s beliefs, expectations, estimates and intentions that are subject to significant risks and uncertainties, and are subject to change based on various factors, some of which are beyond the Company’s control. Such statements address, among others, the following subjects: statements about the terms, timing, completion, and effects of the Company’s proposed private placement transaction with BEP IV LLC and BEP Investors LLC; the potential benefits of the acquisition of Fort Knox Financial Services Corporation and its wholly-owned subsidiary, Tax Product Services LLC (collectively, “Fort Knox”); important components of the Company's balance sheet and statements of financial condition and operations; growth and expansion; new products and services, such as those offered by MetaBank or Meta Payment Systems® (“MPS”), a division of the Bank; credit quality and adequacy of reserves; technology; and the Company's employees. The following factors, among others, could cause the Company's financial performance and results of operations to differ materially from the expectations, estimates, and intentions expressed in such forward-looking statements: the businesses of the Bank and Fort Knox may not be combined successfully, or such combination may take longer, be more difficult, time-consuming or costly to accomplish than expected; the risk that sales of Fort Knox products by the Bank may not be as high as anticipated; the expected growth opportunities or cost savings from the acquisition may not be fully realized or may take longer to realize than expected; customer losses and business disruption following the acquisition, including adverse effects on relationships with former or current employees of Fort Knox, may be greater than expected; regulatory reception to the Fort Knox business may not be as anticipated and the Company may incur unanticipated or unknown losses or liabilities on a post-acquisition basis, including risks similar to those expressed above, especially given the Company’s entry into a new line of business; the risk that the Company may incur unanticipated or unknown losses or liabilities as a result of the completion of the transaction with Fort Knox; the strength of the United States' economy, in general, and the strength of the local economies in which the Company conducts operations; the effects of, and changes in, trade, monetary, and fiscal policies and laws, including interest rate policies of the Board of Governors of the Federal Reserve System (the “Federal Reserve”), as well as efforts of the United States Treasury in conjunction with bank regulatory agencies to stimulate the economy and protect the financial system; inflation, interest rate, market, and monetary fluctuations; the timely development of, and acceptance of new products and services, offered by the Company, as well as risks (including reputational and litigation) attendant thereto, and the perceived overall value of these products and services by users; the risks of dealing with or utilizing third parties; any actions which may be initiated by our regulators; the impact of changes in financial services laws and regulations, including, but not limited to, laws and regulations relating to the tax refund industry, our relationship with our primary regulators, the Office of the Comptroller of the Currency and the Federal Reserve, as well as the FDIC, which insures the Bank’s deposit accounts up to applicable limits; technological changes, including, but not limited to, the protection of electronic files or databases; acquisitions; litigation risk, in general, including, but not limited to, those risks involving the MPS division; the growth of the Company’s business, as well as expenses related thereto; continued maintenance by the Bank of its status as a well-capitalized institution, particularly in light of our deposit base, a substantial portion of which has been characterized as “brokered”; changes in consumer spending and saving habits; the success of the Company at managing and collecting assets of borrowers in default; and the Company not being able to complete the proposed private placement transaction with BEP IV LLC and BEP Investors LLC on the terms described above, other acceptable terms, or at all because of a number of factors, including the failure to satisfy closing conditions in the purchase agreement.The foregoing list of factors is not exclusive. Additional discussions of factors affecting the Company’s business and prospects are reflected under the headings “Risk Factors” and in other sections of the Company’s Annual Report on Form 10-K for the fiscal year ended September 30, 2014, and Quarterly Reports on Form 10-Q for the fiscal quarters ended December 31, 2014, March 31, 2015, and June 30, 2015, and other filings made with the SEC. The Company expressly disclaims any intent or obligation to update any forward-looking statement, whether written or oral, that may be made, from time to time, by or on behalf of the Company or its subsidiaries. 29

NASDAQ: CASH