Attached files
| file | filename |
|---|---|
| 8-K - 8-K - Mastercard Inc | ma10292015-8xk.htm |
| EX-99.1 - EXHIBIT 99.1 - Mastercard Inc | ma09302015-exx991xearnings.htm |

October 29, 2015 MasterCard Incorporated Third-Quarter 2015 Financial Results Conference Call

©2015 MasterCard. Proprietary Business Update Financial & Operational Overview Economic Update Business Highlights October 29, 20152

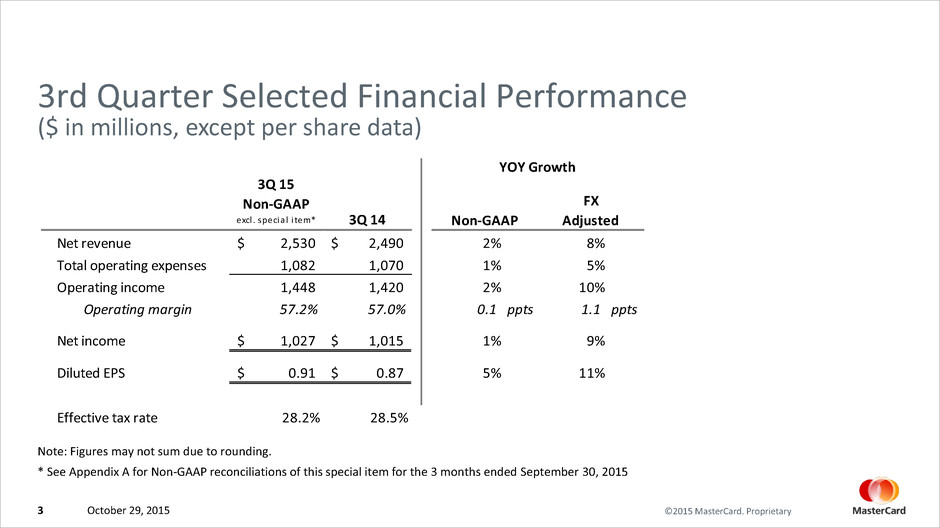
©2015 MasterCard. ProprietaryOctober 29, 20153 3rd Quarter Selected Financial Performance 3Q 15 Non-GAAP excl . specia l i tem* 3Q 14 Net revenue 2,530$ 2,490$ 2% 8% Total operating expenses 1,082 1,070 1% 5% Operating income 1,448 1,420 2% 10% Operating margin 57.2% 57.0% 0.1 ppts 1.1 ppts Net income 1,027$ 1,015$ 1% 9% Diluted EPS 0.91$ 0.87$ 5% 11% Effective tax rate 28.2% 28.5% FX Adjusted YOY Growth Non-GAAP ($ in millions, except per share data) Note: Figures may not sum due to rounding. * See Appendix A for Non-GAAP reconciliations of this special item for the 3 months ended September 30, 2015

©2015 MasterCard. Proprietary $637 $622 $161 $175 $476 $447 $522 $536 $178 $190 $344 $346 $0 $400 $800 $1,200 3Q 14 3Q 15 3Q 14 3Q 15 3Q 14 3Q 15 Credit Debit Worldwide 13% Growth ($ in billions) October 29, 20154 3rd Quarter Gross Dollar Volume (GDV) $1,159 $1,159 $339 $365 $820 $793 United States 8% Growth Rest of World 16% Growth Notes: 1. Growth rates are shown in local currency 2. Figures may not sum due to rounding

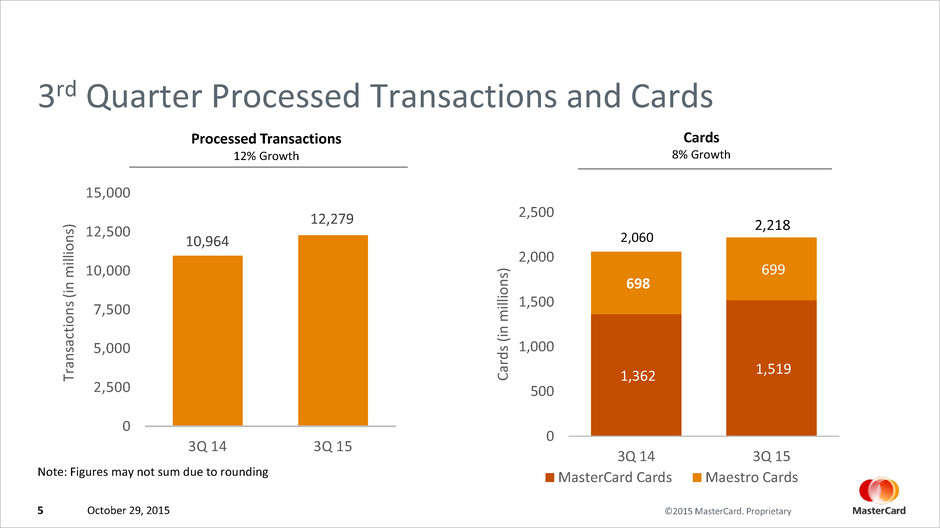
©2015 MasterCard. Proprietary 3rd Quarter Processed Transactions and Cards Cards 8% Growth 1,362 1,519 698 699 0 500 1,000 1,500 2,000 2,500 3Q 14 3Q 15 C ar d s (i n millio n s) MasterCard Cards Maestro Cards 2,06010,964 12,279 0 2,500 5,000 7,500 10,000 12,500 15,000 3Q 14 3Q 15 Tr an sa ct io n s (in milli o n s) Processed Transactions 12% Growth 2,218 October 29, 20155 Note: Figures may not sum due to rounding

©2015 MasterCard. ProprietaryOctober 29, 20156 3rd Quarter Revenue ($ in millions) $1,003 $835 $1,041 $460 ($849) $2,490 $1,028 $880 $1,140 $501 ($1,019) $2,530 Domestic Assessments Cross-Border Volume Fees Transaction Processing Fees Other Revenue Rebates and Incentives Total Net Revenue -$2,000 -$1,000 $0 $1,000 $2,000 $3,000 3Q 14 3Q 15 Note: Figures may not sum due to rounding. 3% 5% 9% 9% 20% 2%As-reported 8%27%15%16%11%FX-adjusted 9% Growth

©2015 MasterCard. Proprietary Note: Figures may not sum due to rounding * See Appendix A and B for Operating Expenses Growth Non-GAAP reconciliations October 29, 20157 3rd Quarter Operating Expenses ($ in millions) $784 $203 $83 $1,070 $804 $184 $94 $1,082 General & Administrative* Advertising & Marketing Depreciation & Amortization Total Operating Expenses* $0 $200 $400 $600 $800 $1,000 $1,200 3Q 14 3Q 15 6% (3)% 14% 5%Including Acquisitions 2% FX-adjusted Growth 3% (4)% 6%Excluding Acquisitions* 3%* (10)% 14% 1%*

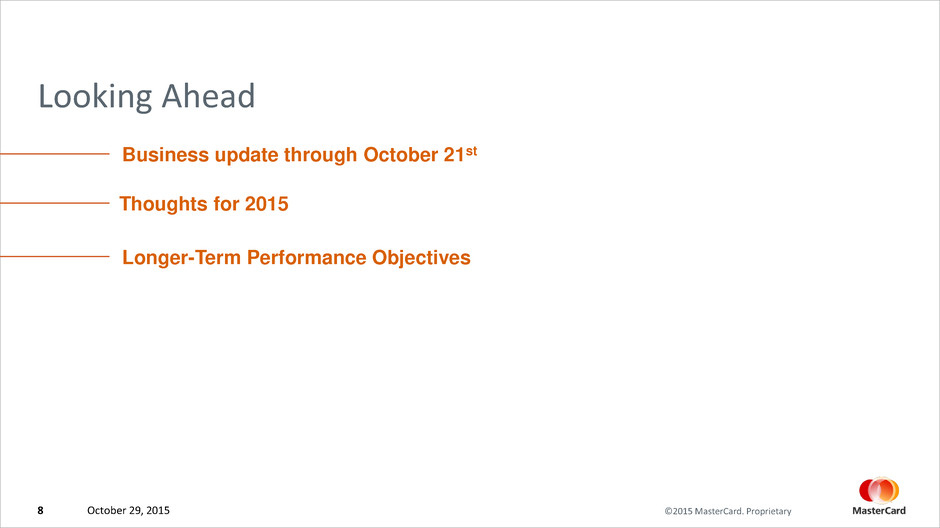
©2015 MasterCard. Proprietary Looking Ahead Business update through October 21st Thoughts for 2015 Longer-Term Performance Objectives October 29, 20158

Appendices

©2015 MasterCard. Proprietary APPENDIX A Non-GAAP Reconciliation Three Months Ended September 30, 2014 Actual Special Item1 Non-GAAP Actual Actual Special Item1 Non-GAAP General and adminstrative expenses 883$ (79)$ 804$ 784$ 13% 10% 3% Total operating expenses 1,161 (79) 1,082 1,070 9% 7% 1% Operating income 1,369 79 1,448 1,420 (4)% (6)% 2% Operating Margin 54.1% 57.2% 57.0% I come before income taxes 1,352 79 1,431 1,418 (5)% (6)% 1% Income tax expense 375 29 404 403 (7)% (7)% --% Effective Tax Rate 27.7% 28.2% 28.5% Net Income 977 50 1,027 1,015 (4)% (5)% 1% Diluted Earnings per Share 0.86$ 0.04$ 0.91$ 0.87$ (1)% (5)% 5% Three Months Ended September 30, 2015 Year-over-year % Growth ($ in millions, except per share data) 1 Represents the effect of termination of the U.S. employee pension plan Note: Figures may not sum due to rounding October 29, 201510

©2015 MasterCard. ProprietaryOctober 29, 201511 APPENDIX B Operating Expenses Growth Non-GAAP Reconciliation 1 Represents the effect of termination of the U.S. employee pension plan 2 Impact from our 2014 and 2015 acquisitions 3 Represents impact of foreign currency calculated by remeasuring the prior period’s results using the current period’s exchange rates Q3 2015 Growth Rate - Increase / (Decrease) As-Reported Special Item1 Acquisitions2 FX3 Excluding All Impacts General and administrative 13% 10% 4% (3)% 3% Advertising and marketing (10)% --% --% (6)% (4)% Depreciation and amortization 14% --% 9% (1)% 6% Total operating expenses 9% 7% 4% (4)% 2% Note: Figures may not sum due to rounding
