Attached files
| file | filename |
|---|---|
| 8-K - FORM 8-K - Kearny Financial Corp. | d14435d8k.htm |
| EX-99.1 - EX-99.1 - Kearny Financial Corp. | d14435dex991.htm |
 Annual
Meeting of Shareholders Nasdaq: KRNY
October 2015 Exhibit 99.2 |
 1 This presentation may include certain “forward-looking statements,” which are made in good faith by Kearny Financial Corp.
(the “Company”) pursuant to the “safe harbor”
provisions of the Private Securities Litigation Reform Act of 1995. These
forward-looking statements involve risks and uncertainties, such as statements of the Company’s plans, objectives, expectations, estimates and intentions that are subject to change based on various important factors (some of which are
beyond the Company’s control). In addition to the factors described under
Item 1A. Risk Factors in the Company’s Annual Report on Form
10-K, the following factors, among others, could cause the Company’s financial performance to differ materially from the plans, objectives, expectations, estimates and intentions expressed in such forward-looking statements:
• the strength of the United States economy in general and the strength of the local economy in which the Company
conducts operations,
• the effects of and changes in, trade, monetary and fiscal policies and laws, including interest rate policies of the
Board of Governors of the Federal Reserve System, inflation, interest rates, market
and monetary fluctuations, •
the impact of changes in financial services laws and regulations (including laws
concerning taxation, banking, securities and insurance),
• changes in accounting policies and practices, as may be adopted by regulatory agencies, the Financial Accounting
Standards Board (“FASB”) or the Public Company Accounting Oversight Board,
• technological changes. • competition among financial services providers and, • the success of the Company at managing the risks involved in the foregoing and managing its business.
The Company cautions that the foregoing list of important factors is not exclusive. The
Company does not undertake to update any forward-looking statement,
whether written or oral, that may be made from time to time by or on behalf of the Company. Forward Looking Statements |
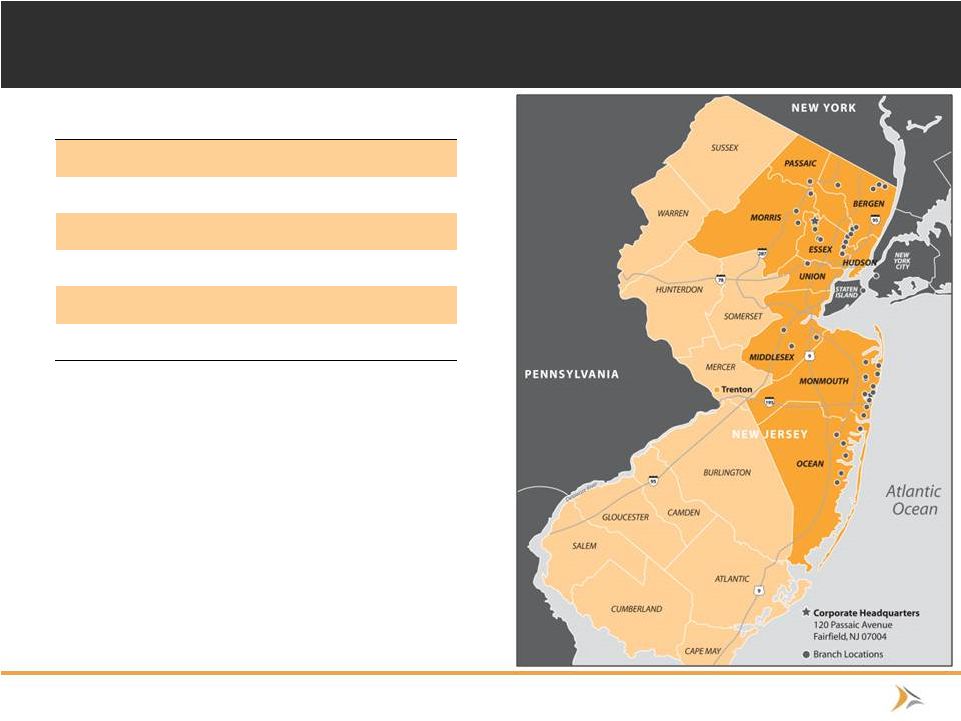 Overview
of Kearny Financial Corp (1)
As of October 15, 2015 (2) As of June 30, 2015 Source: SNL Financial, Company Filings (dollars in millions) as of June 30, 2015 Total Assets $4,237.2 Total Deposits $2,465.7 Total Loans $2,102.9 Corporate Headquarters Fairfield, NJ Branches 42 Market Capitalization¹ $1,112.0 • Founded in 1884 • 6 th Largest New Jersey based deposit franchise – 42 branch locations in 11 counties throughout Northern and Central New Jersey and Southern New York – Top 15 deposit market share in the counties of Bergen, Hudson, Ocean, and Monmouth, New Jersey² • Active acquirer – Completed 5 bank acquisitions since 1999 including most recently Brooklyn, NY based Atlas Bank in June, 2014 2 |
 3 Kearny Bank Mission Statement Kearny Bank is dedicated to providing professional service and sound financial advice to our client and shareholder base. This is successfully accomplished through deep-rooted guiding principles of strong values consisting of ethics and integrity, and by giving back to the communities we serve. Through our financial expertise, strong leadership, and loyal relationships, we help our clients achieve their financial goals both for today and for tomorrow. |
 Brand
Logo Flag The New Kearny Logo
People Our significant stakeholders, including employees, current and future customers, stockholders, and the communities we serve. Relationships Delivery of superior service, a keen understanding of clients’ needs, and
a welcoming environment has resulted in high levels of customer
satisfaction, loyalty, and strong long-lasting relationships.
Performance A strong resolve to remain true to sound, conservative practices, and superior customer service which has led to steady progress and growth throughout the years 4 |
 5 Kearny Value Creation Post-Conversion • Optimization of asset mix – Continue to increase commercial real estate lending – Continue to increase commercial business lending – Reinvest cashflows from the investment portfolio into loans while still maintaining a diverse composition and allocation to reduce exposure to long term interest rate risk
• Shift funding mix to focus more on core deposits: non-interest bearing and non-
maturity deposits • Implementing several strategies over the near term with the goal of controlling
non-interest expense and improving operating efficiency
• Significant opportunities to grow in market • Conservative lending policies and strong credit quality • Established and experienced acquirer and integrator |
 Attractive
Market Demographics Note Deposit numbers and growth estimates as od June
30, 2015 1)
Defined as the New York-Northern New Jersey-Long Island MSA
Source: SNL Financial • Attractive markets • Part of the largest MSA¹ in the U.S • Opportunities still exist for organic growth in existing branch footprint • Weighted average median household income in Kearny franchise counties was $74,231 vs. $55,551 median household income nationwide – Household income poised to grow 6 |
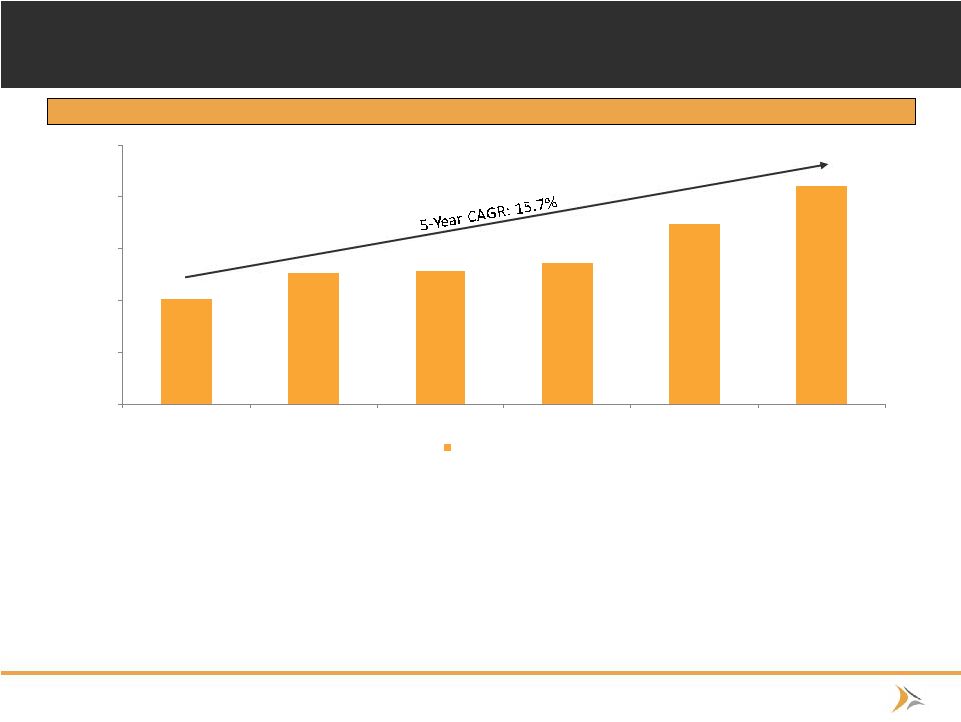 $1,014 $1,268 $1,284 $1,361 $1,741 $2,103 $0 $500 $1,000 $1,500 $2,000 $2,500 2010FY 2011FY 2012FY 2013FY 2014FY 2015FY Total Loans Loan Portfolio Growth Kearny Financial Corp. Historical Loan Growth (dollars in millions) • Loan growth focus: – Expand upon expertise in commercial real estate, C&I, multifamily, and SBA lending;
– Continue to hire additional commercial lenders and support personnel to increase market share;
– Business development officers continue to work collaboratively with the retail branch network to further
develop/strengthen small business deposit, loan, and merchant business
relationships •
Strong performance in the NYC market with over $200 million in CRE originations during
the 2015 fiscal year 7 |
 Loan
Portfolio Composition •
As of June 30, 2015 KRNY had $2.1 billion
in net loans, comprising 49.3% of total
assets • Kearny’s yield on loans was 4.14% for the 2015 fiscal year • Kearny continues to make progress towards its intended shift in loan mix • Maintaining strong underwriting quality of new loans MRQ Loan Portfolio 0% 20% 40% 60% 80% 100% 2013FQ4 2014FQ4 2015FQ4 1-4 Family Multifamily CRE C&D Consumer Commercial 8 1-4 Family - 28.17% Multifamily - 34.64% CRE - 27.62% C&D - 0.27% Consumer - 4.56% Commercial - 4.73% |
 Commercial Lending Success Continues
9 |
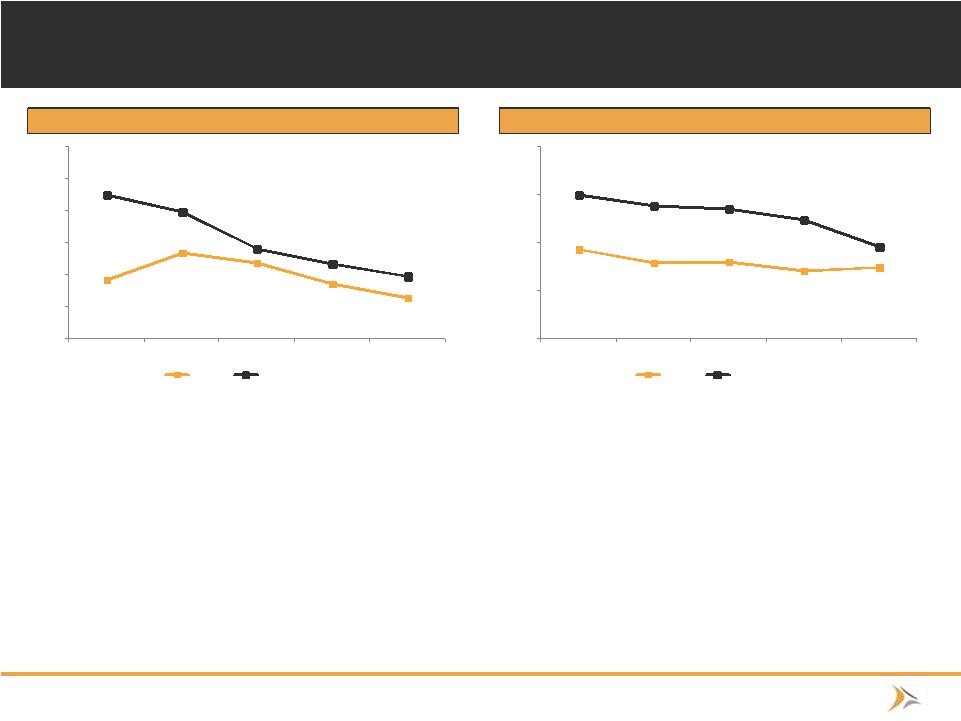 Asset
Quality & Reserves 1)
NPAs as defined by SNL to include nonaccrual loans and leases, renegotiated loans and
leases, and real estate owned 2)
Peer group defined in KRNY’s 2015 conversion offering prospectus and includes
companies with the following tickers: BKMU, CFFN, DCOM, NFBK, NWBI, OCFC, ORIT, PFS, TRST, UBNK, and WSFS Note: Peer comparison periods changed to conform to the same time periods as Kearny Financial Corp.’s fiscal periods (June 30 fiscal
year-end) Source: SNL Financial
NPAs / Assets¹ Loan Loss Reserves/ Gross Loans 0.92% 1.34% 1.18% 0.86% 0.64% 2.25% 1.98% 1.41% 1.18% 0.98% 0.0% 0.5% 1.0% 1.5% 2.0% 2.5% 3.0% 2011FY 2012FY 2013FY 2014FY 2015FY KRNY Peer Median² 0.93% 0.79% 0.80% 0.71% 0.74% 1.50% 1.38% 1.35% 1.24% 0.95% 0.0% 0.5% 1.0% 1.5% 2.0% 2011FY 2012FY 2013FY 2014FY 2015FY KRNY Peer Median² • Kearny has been successful in reducing its percent of nonperforming assets over the past
four calendar years – Reduced NPAs excluding restructured assets as a percent of total assets by about a third from 0.92%
at June 30, 2011 to 0.64% at June 30, 2015
– Kearny has historically, and continues to outperform peers in key asset quality metrics
• Kearny’s conservative underwriting standards and prompt attention to potential problem
loans supports consistently superior asset quality
– This consistency allows Kearny to hold loan loss reserves at slightly lower levels than peers
10 |
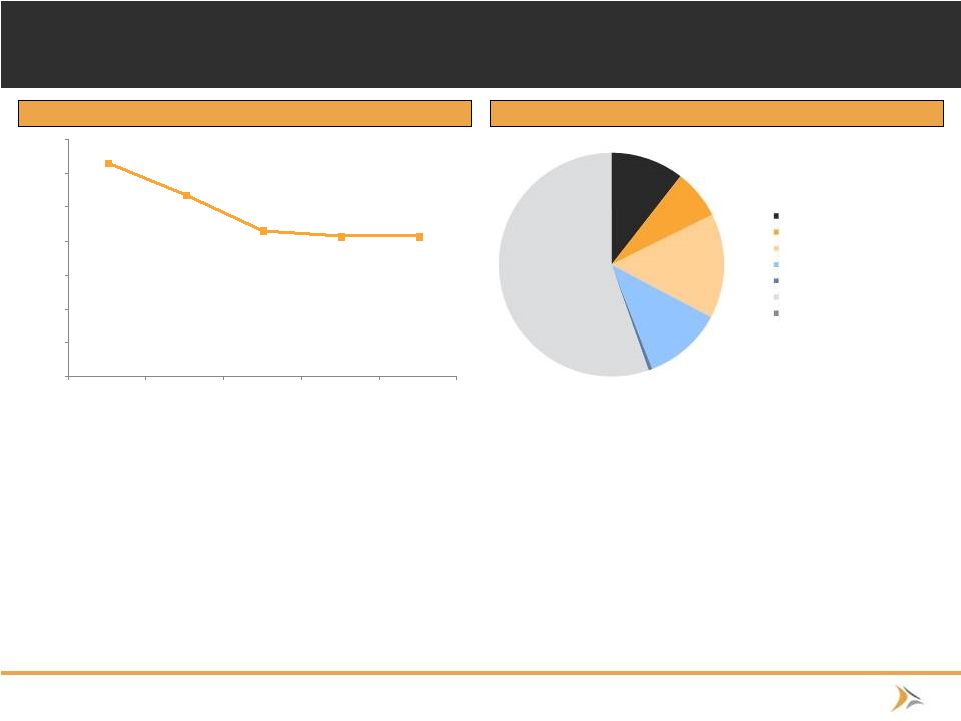 Securities Portfolio Source: SNL Financial, Company Filings • Kearny’s yield on securities was 2.08% for the 2015 fiscal year, the same as
during 2014 • Kearny is working to reduce the portion of securities as a percent of total assets
and improve the general make-up of the portfolio
– As of June 30, 2015, 34.4% of Kearny’s total assets were comprised of securities as
compared to 42.2% of total assets at June 30, 2011
MRQ Securities Portfolio Yield on Securities 3.15% 2.69% 2.16% 2.08% 2.08% 0.00% 0.50% 1.00% 1.50% 2.00% 2.50% 3.00% 3.50% 2011FY 2012FY 2013FY 2014FY 2015FY U.S. Agency Obligations - 10.50% Municipal Bonds - 7.14% CLO & ABS Securities - 15.11% Corporate Bonds - 11.36% TPS - 0.54% Agency MBS - 55.33% Non-Agency MBS - 0.01% 11 |
 Deposit
Composition Note: Deposit percentages via Kearny Bank regulatory
reports •
Kearny Financial Corp. had $2.47 billion in
deposits as of June 30, 2015
– The quarter ended June 30, 2015’s cost of total deposits was 0.67% down from 1.06% for the quarter ended June 30, 2011 • Kearny continues to shift its deposit mix to “stickier”, lower cost retail/non-maturity deposits • This shift in cost of funding has helped improve net income and profitability metrics over the past 5 years MRQ Deposit Portfolio Noninterest bearing deposits - 8.86% Interest bearing DDA - 29.38% Savings and clubs - 21.13% Certificates of deposit - 40.63% 0% 20% 40% 60% 80% 100% 2013FY 2014FY 2015FY Noninterest bearing deposits Interest bearing DDA Savings and clubs Certificates of deposit 12 |
 Improving
Performance Metrics Profitability
Efficiency Ratio Performance Metrics • Performance metrics are improving • Both efficiency ratio and ROAA have improved over the past three years $5,078 $6,506 $10,188 $5,629 0.18% 0.19% 0.32% 0.32% 0.10% 0.15% 0.20% 0.25% 0.30% 0.35% 0.40% $0 $2,000 $4,000 $6,000 $8,000 $10,000 $12,000 2012FY 2013FY 2014FY 2015FY Net Income Core ROAA 77.45% 83.02% 76.52% 75.83% 60.00% 65.00% 70.00% 75.00% 80.00% 85.00% 90.00% 2012FY 2013FY 2014FY 2015FH1 Efficiency Ratio $70,180 $66,257 $73,821 $80,608 7.18% 9.23% 8.46% 7.92% 2.65% 2.50% 2.44% 2.34% $60,000 $65,000 $70,000 $75,000 $80,000 $85,000 $90,000 0.00% 2.00% 4.00% 6.00% 8.00% 10.00% 2012FY 2013FY 2014FY 2015FH1 Net Interest Income Noninterest Inc/ Operating Rev Net Interest Margin 13 |
 Maintenance of Strong Capital Ratios
1) Peer group defined in KRNY’s prospectus and includes companies with the following tickers: BKMU, CFFN, DCOM, NFBK, NWBI, OCFC, ORIT, PFS,
TRST, UBNK, and WSFS 2)
Pro forma risk-based and leverage ratios via offering prospectus. TCE/TA
assumes midpoint offering with 68.5mm shares offered and $652mm in net proceeds post-foundation contribution Note: Peer group defined in KRNY’s 2015 conversion offering prospectus and includes companies with the following tickers: BKMU, CFFN, DCOM,
NFBK, NWBI, OCFC, ORIT, PFS, TRST, UBNK, and WSFS Source: SNL
Financial. Bank level financial numbers used where unavailable at the holding company Tangible Common Equity to Tangible Assets Tier 1 Leverage Ratio Tier 1 Risk Based Capital Ratio Risk-Based Capital Ratio 13.5% 13.5% 11.8% 25.6% 10.0% 9.9% 10.5% 9.9% 9.2% 5.0% 10.0% 15.0% 20.0% 25.0% 30.0% 2011FY 2012FY 2013FY 2014FY 2015FY KRNY Peer Median¹ 12.0% 12.1% 11.3% 10.8% 25.8% 9.4% 9.9% 10.4% 11.0% 10.5% 0.0% 5.0% 10.0% 15.0% 20.0% 25.0% 30.0% 2011FY 2012FY 2013FY 2014FY 2015FY KRNY Peer Median¹ 24.5% 24.6% 21.1% 19.8% 46.5% 16.0% 16.4% 16.5% 15.3% 14.3% 0.0% 10.0% 20.0% 30.0% 40.0% 50.0% 2011FY 2012FY 2013FY 2014FY 2015FY KRNY Peer Median¹ 25.3% 25.4% 21.8% 20.5% 47.2% 17.1% 17.9% 18.1% 16.8% 16.1% 0.0% 10.0% 20.0% 30.0% 40.0% 50.0% 2011FY 2012FY 2013FY 2014FY 2015FY KRNY Peer Median¹ 14 11.3% |
 15 M&A History and Strategy Source: SNL Financial, Company Filings Seller Completed Type Assets ($000) Branches 1 st Bergen Bancorp March 31, 1999 Thrift 300,755 4 Pulaski Bancorp, Inc. MHC October 18, 2002 Thrift 237,596 6 West Essex Bancorp July 1, 2003 Thrift 390,333 8 Central Jersey Bancorp November 30, 2010 Bank 571,295 13 Atlas Bank June 30, 2014 Thrift 110,480 2 • Kearny is an experienced acquirer and integrator, having successfully completed 5 bank
acquisitions over the past 15 years
• Kearny actively seeks out opportunities to deploy capital, including through mergers and
acquisitions with other financial institutions
– The greatest emphasis of future expansion opportunities will be on expanding within existing markets
or areas contiguous to current markets
– In addition to acquiring banks and their branches, the Company will also consider opportunities to
broaden the product and services offerings of the bank
– Management is sensitive to key merger metrics such as TBV dilution and earn-back periods |
 16 2015 Strategic Review: A Stronger Kearny Post-Conversion • Robust capital to support continued growth – The second step offering allows Kearny to pursue organic and strategic growth opportunities that will continue Kearny’s historically strong loan growth • Eliminated uncertainties associated with the mutual holding company structure under financial reform legislation • Transitioned Kearny to a more familiar and flexible organizational structure • Facilitates future mergers and acquisitions – Allows for increased flexibility to use common stock while bidding for potential strategic
targets – Potential to make Kearny a more attractive participant in the mergers and acquisitions
market, particularly in New Jersey
• A larger public float and more familiar structure create a more liquid and active
market for Kearny’s common stock |
 17 • Traditional Relationship Banking Focus – Growth/ Diversification of loan mix: CRE/Multifamily/C&I/SBA/Residential/Consumer
– Grow funding thru traditional deposit sources utilizing a technological focus: mobile banking/on-line
account opening /P2P/cash management/RDC
• New Opportunities – Launch mortgage banking platform/fee income generation – Expand governmental banking group • Expand customer wallet share – Extraordinary service – Innovative products for Millennials, Boomers, & Gen Xers – Digital marketing – On-boarding • Utilize Traditional Capital Market Strategies – Dividends – Buybacks (after one year regulatory limit) – M&A • Control operating expenses/utilizing technology • Continued focus on the Kearny Bank brand 2016 Strategic Focus |
 18 Comparative Stock Price Performance 1) Peer group defined in KRNY’s 2015 conversion offering prospectus and includes companies with the following tickers: BKMU, CFFN, DCOM, NFBK,
NWBI, OCFC, ORIT, PFS, TRST, UBNK, and WSFS
Source: SNL Financial Stock Price Performance since January 1, 2012 72.8% 30.8% 73.3% (20%) (10%) 0% 10% 20% 30% 40% 50% 60% 70% 80% 90% KRNY KRNY Peers NASDAQ Bank |
 19 Peer Group Valuation Comparison Note: Market Metrics as of October 16, 2015 Note: Peer group defined in KRNY’s prospectus and includes companies with the following tickers: BKMU, CFFN, DCOM, NFBK, NWBI, OCFC, ORIT,
PFS, TRST, UBNK, and WSFS Source: SNL Financial
($ in thousands) Total Price/ Peer Company Ticker Headquarters Assets TBV Capitol Federal Financial, Inc. CFFN Topeka, KS $9,131 122% Provident Financial Services, Inc. PFS Iselin, NJ 8,751 181% Northwest Bancshares, Inc. NWBI Warren, PA 7,865 140% United Financial Bancorp, Inc. UBNK Glastonbury, CT 5,681 136% WSFS Financial Corporation WSFS Wilmington, DE 5,077 184% TrustCo Bank Corp NY TRST Glenville, NY 4,741 142% Dime Community Bancshares, Inc. DCOM Brooklyn, NY 4,645 148% Oritani Financial Corp. ORIT Township of Washington, NJ 3,353 136% Northfield Bancorp, Inc. NFBK Woodbridge, NJ 3,147 131% OceanFirst Financial Corp. OCFC Toms River, NJ 2,395 138% Bank Mutual Corporation² BKMU Milwaukee, WI 2,467 122% Mean 5,205 144% Median 4,741 138% 105% 122% 138% 131% 136% 148% 142% 184% 136% 140% 181% 122% 50% 70% 90% 110% 130% 150% 170% 190% 210% KRNY¹ BKMU OCFC NFBK ORIT DCOM TRST WSFS UBNK NWBI PFS CFFN Peer Median P/TBV: 138% |