Attached files
| file | filename |
|---|---|
| 8-K/A - 8-K/A - CIMPRESS plc | q1fy16earnings8-ka.htm |
| EX-99.2 - EXHIBIT 99.2 EARNINGS SCRIPT - CIMPRESS plc | q1_fy16earningsscript.htm |

CIMPRESS N.V. Q1 Fiscal Year 2016 Earnings presentation, commentary & financial results supplement October 28, 2015 1
2 Safe Harbor Statement This presentation and the accompanying notes contain statements about our future expectations, plans, and prospects of our business that constitute forward-looking statements for purposes of the safe harbor provisions under the Private Securities Litigation Reform Act of 1995, including but not limited to our expectations for the growth and development of our business, the development and success of our mass customization platform, and our outlook described in the section of the presentation entitled “Looking Ahead.” Forward-looking projections and expectations are inherently uncertain, are based on assumptions and judgments by management, and may turn out to be wrong. Our actual results may differ materially from those indicated by these forward-looking statements as a result of various important factors, including but not limited to flaws in the assumptions and judgments upon which our forecasts are based; our failure to execute our strategy; our inability to make the investments in our business that we plan to make; our failure to develop our mass customization platform or to realize the anticipated benefits of such a platform; our failure to manage the growth and complexity of our business and expand our operations; the failure of the businesses we acquire or invest in to perform as expected; costs and disruptions caused by acquisitions and strategic investments; the willingness of purchasers of customized marketing services and products to shop online; unanticipated changes in our markets, customers, or business; competitive pressures; our failure to maintain compliance with the covenants in our senior secured revolving credit facility and senior unsecured notes or to pay our debts when due; changes in the laws and regulations that affect our business; general economic conditions; and other factors described in our Form 10-K for the fiscal year ended June 30, 2015 and the other documents we periodically file with the U.S. Securities and Exchange Commission.

3 Presentation Organization & Call Details • Q1 FY2016 Overview • Q1 FY2016 Operating and financial results • Looking ahead • Supplementary information • Reconciliation of GAAP to non-GAAP results Live Q&A Session: THURSDAY MORNING October 29, 2015, 7:30 a.m. ET Link from ir.cimpress.com Hosted by: Robert Keane President & CEO Sean Quinn CFO Ernst Teunissen Former CFO

4 Our Objectives • Strategic: To be the world leader in mass customization – Producing, with the reliability, quality and affordability of mass production, small individual orders where each and every one embodies the personal relevance inherent to customized physical products • Financial: To maximize intrinsic value per share – (a) the unlevered free cash flow per share that, in our best judgment, will occur between now and the long-term future, appropriately discounted to reflect our cost of capital, minus (b) net debt per share

5 Solid Q1 Performance • Continued progress against objectives • Good revenue growth year-over-year – Constant Currency • 11% excluding recent acquisitions • 8% Vistaprint business unit • 21% consolidated – Reported (USD) Growth • 13% consolidated revenue growth at reported currency rates • Adjusted NOPAT down versus last year due to planned investments 5 Consolidated
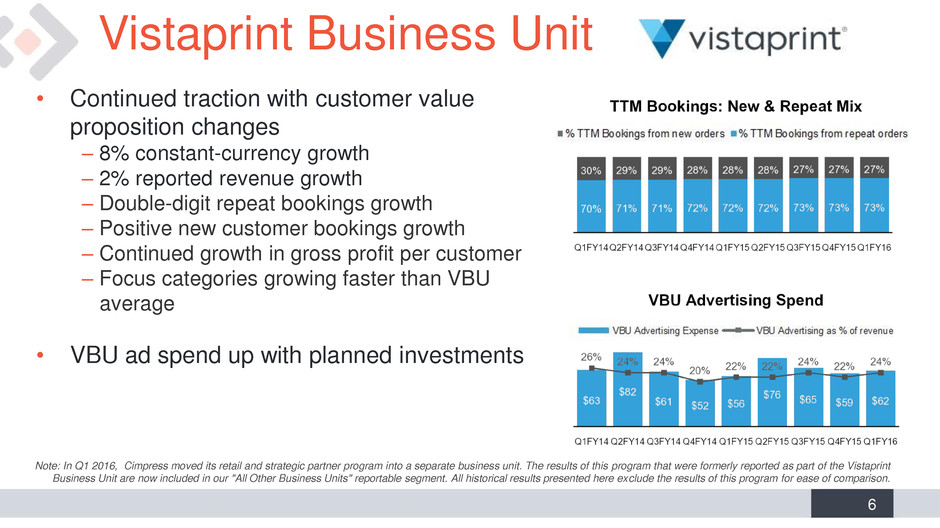
6 Vistaprint Business Unit • Continued traction with customer value proposition changes – 8% constant-currency growth – 2% reported revenue growth – Double-digit repeat bookings growth – Positive new customer bookings growth – Continued growth in gross profit per customer – Focus categories growing faster than VBU average • VBU ad spend up with planned investments 6 Note: In Q1 2016, Cimpress moved its retail and strategic partner program into a separate business unit. The results of this program that were formerly reported as part of the Vistaprint Business Unit are now included in our "All Other Business Units" reportable segment. All historical results presented here exclude the results of this program for ease of comparison.
7 • Upload and Print Y/Y growth: – 31% constant-currency growth excluding recent acquisitions – 118% constant-currency revenue growth – 98% reported revenue growth • Tradeprint acquisition closed July 31, 2015 • Integration activities progressing as expected across the portfolio Upload and Print Business Units 7 Note: In Q1 2016, Cimpress created a new reportable segment: Upload and Print Business Units, which includes the results of druck.at, Easyflyer, Exagroup, Pixartprinting, Printdeal and Tradeprint. These businesses were formerly included in our "All Other" reportable segment (with the exception of Tradeprint which was acquired during Q1 2016).

8 BU Key Brands Albumprinter Most of World Corporate Solutions Retail partners that sell our products (branded or white- labeled), franchise businesses, others • All Other Business Units Y/Y growth: – 6% constant-currency growth excluding recent acquisitions – 10% constant-currency revenue growth – (3)% reported revenue growth • New Corporate Solutions business unit – Focused on maximizing our strategic partnership relationships, moved out of VBU in Q1 FY16 – Wind-down of largest retail partner (Staples) ongoing – Testing new relationship with Amazon in US market • Other updates across segment: – Manufacturing plant in Japan live in Q1, producing majority of Japanese orders by end of quarter (MoW) – Columbus starting to ramp in India (MoW) – FotoKnudsen integration on track (Albumprinter) All Other Business Units 8 What businesses are in this reportable segment?
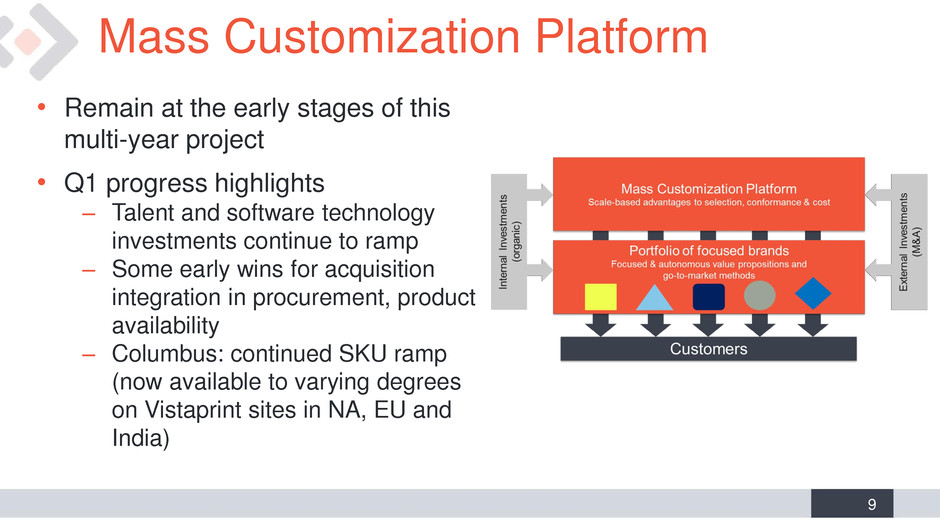
9 Mass Customization Platform 9 • Remain at the early stages of this multi-year project • Q1 progress highlights – Talent and software technology investments continue to ramp – Some early wins for acquisition integration in procurement, product availability – Columbus: continued SKU ramp (now available to varying degrees on Vistaprint sites in NA, EU and India)

10 Adjusted Net Operating Profit by Segment Quarterly, USD in millions In USD millions. Please see reconciliation of non-GAAP measures at the end of this presentation.

Q1 FY2016 Financial & Operating Metrics

12 Q1 FY2016: Revenue Growth Consolidated Revenue Growth (Constant Currency)

13 In USD millions. Please see reconciliation of non-GAAP measures at the end of this presentation. Q1 FY2016: Profit Metrics

14 Currency Impacts • Impact on both GAAP Net Income and Adjusted NOPAT: – Reduced our YoY revenue growth by 800 bps – More limited impact on bottom line due to natural offsets, and an active currency hedging program ($0.3M realized hedging gains) • Additional below-the-line currency impacts on GAAP Net Income but excluded from Adjusted NOPAT: – Unrealized net gains of $9.8M related to cash flow currency hedges, intercompany loan balances, and other balance sheet items – Net losses of $2.7M from revaluing working capital balances

15 Cash Flow and ROIC Highlights TTM Free Cash Flow¹ In USD millions except percentages. Please see reconciliation of non-GAAP measures at the end of this presentation. ¹ Free cash flow does not include the value of capital leases. Consolidated $69 $66 $66 $72 $71 $65 $68 $76 $84

16 Debt Related Metrics *Our borrowing ability under our senior secured credit facility can be limited by our debt covenants each quarter. These covenants may limit our borrowing capacity depending on our leverage, other indebtedness, such as notes, capital leases, letters of credit, and other debt, as well as other factors that are outlined in our credit agreement filed as an exhibit in our Form 8-Ks filed on February 13, 2013, January 22, 2014, and September 25, 2014. All Adjusted EBITDA and credit facility availability info in USD millions. Please see reconciliation of non-GAAP measures at the end of this presentation. Availability under our senior secured credit facility (In USD, millions)* 09/30/2015 Maximum aggregate available for borrowing $842.0 Outstanding borrowings of senior secured credit facilities ($378.3 ) Remaining amount $463.7 Limitations to borrowing due to debt covenants and other obligations* ($33.0 ) Amount available for borrowing as of September 30, 2015 $430.7 Consolidated

Looking Ahead

18 Constant-Currency Revenue Growth • Per investor letter of July 29, 2015, we will provide an annual update on our general view of organic constant currency growth rates in alignment with our segments • No update to overall outlook, but in light of Q1 2016 segment changes, our newly categorized general view is as follows: – Vistaprint Business Unit • Expect to continue to grow near term at single-digit constant-currency growth rate • Potential to return to growth rates above 10% over the coming years – Upload and Print Business Units • Currently growing at strong double-digit constant-currency growth rates • Expected to continue to grow faster than Vistaprint business unit for foreseeable future – All Other Business Units • Expect single-digit constant-currency growth rate in near future as Albumprinter and Corporate Solutions are winding down certain partner revenue and are much larger than fast-growing Most of World Business Unit. Could become double-digit grower over time.
19 Other Forward-Looking Commentary • No material changes to outlook commentary made at the beginning of the fiscal year • Note: accounting treatment of our new leased facility in the U.S. results in a portion of the lease payments flowing through our interest expense line (start date: September, 2015; full year cost included in interest expense instead of operating expense expected to be ~$6M)
20 Summary • Clear priorities – Strategic: to be the world leader in mass customization – Financial: to maximize intrinsic value per share • Good start to FY 2016 – Investments in technology for common mass customization platform – Continued traction of Vistaprint brand repositioning – Acquisitions and investments performing well • Remain confident in ability to meet our objectives
Q&A Session Please go to ir.cimpress.com for the live Q&A call at 7:30 am EDT on October 29, 2015

Q1 Fiscal Year 2016 Financial and Operating Results Supplement
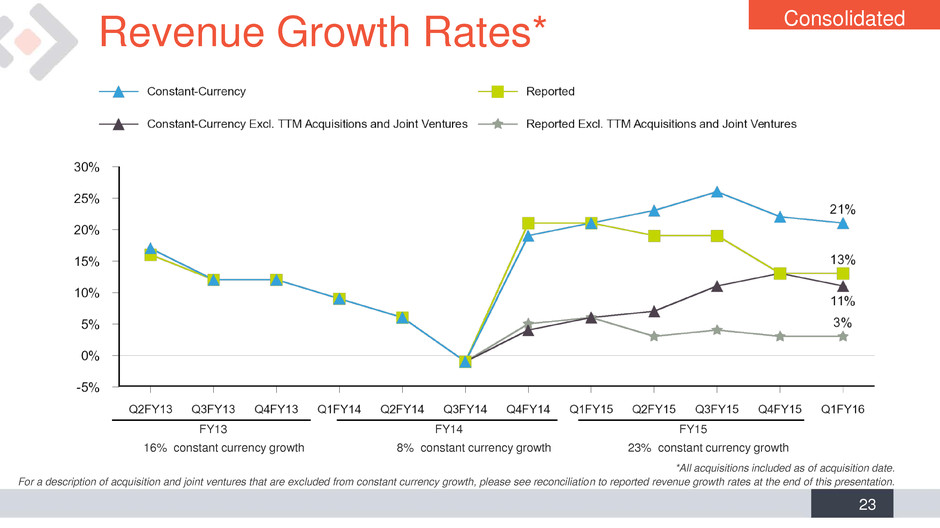
23 *All acquisitions included as of acquisition date. For a description of acquisition and joint ventures that are excluded from constant currency growth, please see reconciliation to reported revenue growth rates at the end of this presentation. Revenue Growth Rates* Consolidated FY13 FY14 FY15 16 % constant currency growth 8 % constant currency growth 23 % constant currency growth

24 Reported Revenue by Segment ¹For a description of acquisition and joint ventures that are excluded from constant currency growth, please see reconciliation to reported revenue growth rates at the end of this presentation. Quarterly, USD in millions Q1 FY2016 Vistaprint Business Unit 71 % of total revenue 2 % y/y growth 8 % y/y constant currency growth Upload and Print Business Units 20 % of total revenue 98 % y/y growth 118 % y/y constant currency growth 31 % y/y constant currency growth ex. acquisitions in the last 12 months¹ All Other Business Units 9 % of total revenue (3 )% y/y growth 10 % y/y constant currency growth 6 % y/y constant currency growth ex. acquisitions in the last 12 months¹
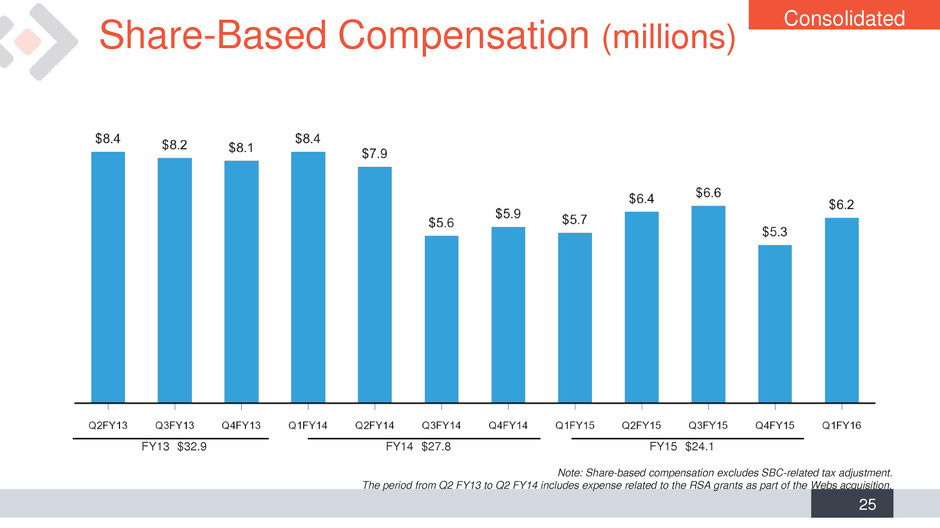
25 Share-Based Compensation (millions) Note: Share-based compensation excludes SBC-related tax adjustment. The period from Q2 FY13 to Q2 FY14 includes expense related to the RSA grants as part of the Webs acquisition. Consolidated FY13 $32.9 FY14 $27.8 FY15 $24.1

26 Balance Sheet Highlights Balance Sheet highlights, USD in millions, at period end 9/30/2015 6/30/2015 3/31/2015 12/31/2014 9/30/2014 Total assets $1,343.7 $1,299.8 $1,032.2 $1,022.9 $979.6 Cash and cash equivalents $93.8 $103.6 $134.2 $77.9 $60.9 Total current assets $217.4 $216.1 $220.6 $178.3 $143.2 Property, plant and equipment, net $495.1 $467.5 $391.8 $391.0 $357.3 Goodwill and intangible assets $564.2 $551.7 $364.1 $399.9 $426.7 Total liabilities $1,168.5 $992.6 $783.6 $755.6 $753.3 Current liabilities¹ $311.9 $305.7 $233.1 $295.1 $217.8 Long-term debt¹ $637.3 $493.0 $411.3 $377.6 $430.0 Shareholders’ Equity attributable to Cimpress NV $109.7 $248.9 $235.9 $256.2 $211.8 Treasury shares (in millions) 12.7 10.9 11.3 11.5 11.6 Consolidated ¹In Q1 FY16 we early adopted a new accounting standard to present our capitalized debt issuance costs asset net of the related debt obligation. Previously, these capitalized costs were classified as other current and long-term assets. We have applied this change retroactively for all periods presented.

Appendix Including a Reconciliation of GAAP to Non-GAAP Financial Measures

28 About Non-GAAP Financial Measures • To supplement Cimpress' consolidated financial statements presented in accordance with U.S. generally accepted accounting principles, or GAAP, Cimpress has used the following measures defined as non-GAAP financial measures by Securities and Exchange Commission, or SEC, rules: adjusted EBITDA, free cash flow, trailing twelve month return on invested capital, adjusted NOPAT, adjusted NOP by segment, constant-currency revenue growth and constant- currency revenue growth excluding revenue from acquisitions and joint ventures from the past twelve months. Please see the next two slides for definitions of these items. • The presentation of non-GAAP financial information is not intended to be considered in isolation or as a substitute for the financial information prepared and presented in accordance with GAAP. For more information on these non-GAAP financial measures, please see the tables captioned “Reconciliations of Non-GAAP Financial Measures” included at the end of this release. The tables have more details on the GAAP financial measures that are most directly comparable to non-GAAP financial measures and the related reconciliation between these financial measures. • Cimpress' management believes that these non-GAAP financial measures provide meaningful supplemental information in assessing our performance and liquidity by excluding certain items that may not be indicative of our recurring core business operating results, which could be non-cash charges or discrete cash charges that are infrequent in nature. These non-GAAP financial measures also have facilitated management’s internal comparisons to Cimpress' historical performance and our competitors’ operating results.
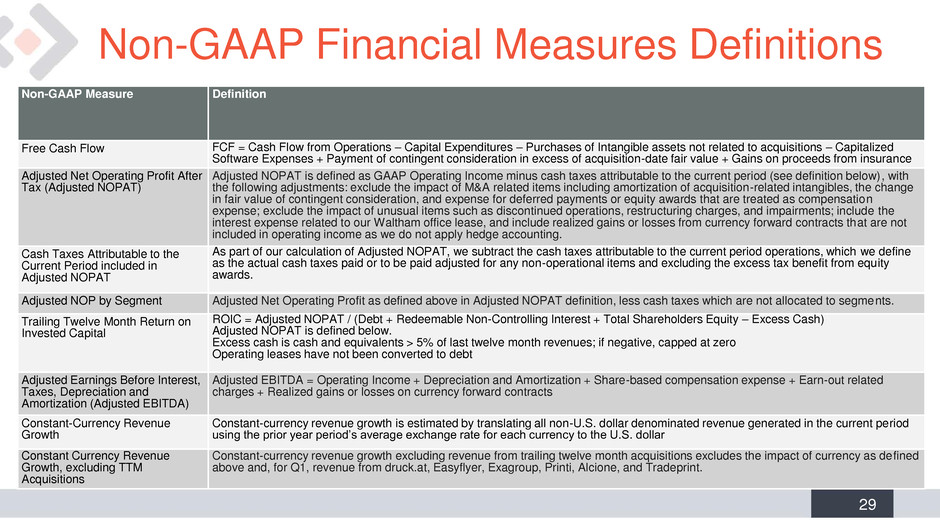
29 Non-GAAP Financial Measures Definitions Non-GAAP Measure Definition Free Cash Flow FCF = Cash Flow from Operations – Capital Expenditures – Purchases of Intangible assets not related to acquisitions – Capitalized Software Expenses + Payment of contingent consideration in excess of acquisition-date fair value + Gains on proceeds from insurance Adjusted Net Operating Profit After Tax (Adjusted NOPAT) Adjusted NOPAT is defined as GAAP Operating Income minus cash taxes attributable to the current period (see definition below), with the following adjustments: exclude the impact of M&A related items including amortization of acquisition-related intangibles, the change in fair value of contingent consideration, and expense for deferred payments or equity awards that are treated as compensation expense; exclude the impact of unusual items such as discontinued operations, restructuring charges, and impairments; include the interest expense related to our Waltham office lease, and include realized gains or losses from currency forward contracts that are not included in operating income as we do not apply hedge accounting. Cash Taxes Attributable to the Current Period included in Adjusted NOPAT As part of our calculation of Adjusted NOPAT, we subtract the cash taxes attributable to the current period operations, which we define as the actual cash taxes paid or to be paid adjusted for any non-operational items and excluding the excess tax benefit from equity awards. Adjusted NOP by Segment Adjusted Net Operating Profit as defined above in Adjusted NOPAT definition, less cash taxes which are not allocated to segments. Trailing Twelve Month Return on Invested Capital ROIC = Adjusted NOPAT / (Debt + Redeemable Non-Controlling Interest + Total Shareholders Equity – Excess Cash) Adjusted NOPAT is defined below. Excess cash is cash and equivalents > 5% of last twelve month revenues; if negative, capped at zero Operating leases have not been converted to debt Adjusted Earnings Before Interest, Taxes, Depreciation and Amortization (Adjusted EBITDA) Adjusted EBITDA = Operating Income + Depreciation and Amortization + Share-based compensation expense + Earn-out related charges + Realized gains or losses on currency forward contracts Constant-Currency Revenue Growth Constant-currency revenue growth is estimated by translating all non-U.S. dollar denominated revenue generated in the current period using the prior year period’s average exchange rate for each currency to the U.S. dollar Constant Currency Revenue Growth, excluding TTM Acquisitions Constant-currency revenue growth excluding revenue from trailing twelve month acquisitions excludes the impact of currency as defined above and, for Q1, revenue from druck.at, Easyflyer, Exagroup, Printi, Alcione, and Tradeprint.

30 Reconciliation: Free Cash Flow Q1 FY15 Q1 FY16 Net cash provided by operating activities $52,620 $25,717 Purchases of property, plant and equipment ($16,684 ) ($24,393 ) Purchases of intangible assets not related to acquisitions ($85 ) ($357 ) Capitalization of software and website development costs ($3,539 ) ($4,910 ) Proceeds from insurance $— $2,075 Free cash flow $32,312 ($1,868 ) Quarterly, In thousands Reference: Value of capital leases $3,201 $2,183

31 Reconciliation: Free Cash Flow TTM Q1 FY14 TTM Q2 FY14 TTM Q3 FY14 TTM Q4 FY14 TTM Q1 FY15 TTM Q2 FY15 TTM Q3 FY15 TTM Q4 FY15 TTM Q1 FY16 Net cash provided by operating activities $133,239 $139,733 $134,740 $148,580 $201,323 $244,520 $242,948 $228,876 $201,973 Purchases of property, plant and equipment ($68,817 ) ($65,800 ) ($66,475 ) ($72,122 ) ($71,229 ) ($64,905 ) ($68,228 ) ($75,813 ) ($83,522 ) Purchases of intangible assets not related to acquisitions ($816 ) ($499 ) ($500 ) ($253 ) ($263 ) ($279 ) ($252 ) ($250 ) ($522 ) Capitalization of software and website development costs ($8,180 ) ($8,946 ) ($9,427 ) ($9,749 ) ($11,474 ) ($12,779 ) ($14,927 ) ($17,323 ) ($18,694 ) Payment of contingent consideration in excess of acquisition-date fair value $— $— $— $— $— $— $1,249 $8,055 $8,055 Proceeds from insurance $— $— $— $— $— $— $— $— $2,075 Free cash flow $55,426 $64,488 $58,338 $66,456 $118,357 $166,557 $160,790 $143,545 $109,365 TTM, In thousands Reference: Value of capital leases $— $— $— $300 $3,501 $10,061 $10,061 $13,193 $12,175

32 Reconciliation: Adjusted NOPAT Quarterly, In thousands Cash taxes paid in the current period $2,683 $6,761 $3,216 $5,824 $5,296 $2,261 $3,089 $3,639 $4,709 Less: cash taxes related to prior periods ($1,716 ) ($1,473 ) ($44 ) ($3,288 ) ($2,860 ) ($588 ) ($1,103 ) ($925 ) $359 Plus: cash taxes attributable to the current period but not yet paid $2,860 $588 $1,103 $1,485 $936 $608 $1,420 $3,703 $921 Plus: cash impact of excess tax benefit on equity awards attributable to current period $2,321 $1,290 $1,864 $77 $2,796 $5,927 $2,115 $2,094 $1,709 Less: installment payment related to the transfer of IP in a prior year ($857 ) ($857 ) ($857 ) ($857 ) ($855 ) ($855 ) ($855 ) ($855 ) ($865 ) Cash taxes attributable to current period $5,291 $6,309 $5,282 $3,241 $5,313 $7,353 $4,666 $7,656 $6,833 ¹ Includes expense recognized for the change in fair value of contingent consideration and compensation expense related to cash-based earn-out mechanisms dependent upon continued employment. Q1 FY14 Q2 FY14 Q3 FY14 Q4 FY14 Q1 FY15 Q2 FY15 Q3 FY15 Q4 FY15 Q1 FY16 GAAP Operating Income $8,409 $52,522 $5,239 $19,744 $16,859 $59,888 $4,341 $15,236 $12,085 Less: Cash taxes attributable to current period (see below) ($5,291 ) ($6,309 ) ($5,282 ) ($3,241 ) ($5,313 ) ($7,353 ) ($4,666 ) ($7,656 ) ($6,833 ) Less: Interest expense associated with Waltham lease $— $— $— $— $— $— $— $— ($350 ) Exclude expense (benefit) impact of: Acquisition-related amortization and depreciation $2,304 $2,353 $2,228 $5,838 $6,908 $5,468 $4,514 $7,374 $9,782 Change in fair value of contingent consideration (earn-out related charges¹) $— $— $— $2,192 $3,677 $3,701 $7,512 $385 $289 Share-based compensation related to investment consideration $1,994 $1,929 $— $440 $497 $1,100 $1,499 $473 $802 Discontinued Operations $— $— $— $— $— $— $— $— $— Restructuring Costs $— $2,986 $128 $2,866 $— $154 $520 $2,528 $271 Certain Impairments $— $— $— $— $— $— $— $— $— Include: Realized gain (loss) on currency forward contracts not included in operating income ($5,209 ) $2,470 ($2,132 ) ($2,177 ) ($17 ) $4,178 $1,802 $1,487 $316 Adjusted NOPAT $2,207 $55,951 $181 $25,662 $22,611 $67,136 $15,522 $19,827 $16,362

33 TTM Q414 TTM Q115 TTM Q215 TTM Q315 TTM Q415 TTM Q116 GAAP Operating Income $85,914 $94,364 $101,730 $100,832 $96,324 $91,550 Less: Cash taxes attributable to current period (see below) ($20,123) ($20,145) ($21,189) ($20,573) ($24,988) ($26,508) Less: Interest expense associated with Waltham lease $0 $0 $0 $0 $0 ($350) Exclude expense (benefit) impact of: Acquisition-related amortization and depreciation $12,723 $17,327 $20,442 $22,728 $24,264 $27,138 Change in fair value of contingent consideration (earn-out related charges¹) $2,192 $5,869 $9,570 $17,082 $15,275 $11,887 Share-based compensation related to investment consideration $4,363 $2,866 $2,037 $3,536 $3,569 $3,874 Discontinued Operations $0 $0 $0 $0 $0 $0 Restructuring Costs $5,980 $5,980 $3,148 $3,540 $3,202 $3,473 Certain Impairments $0 $0 $0 $0 $0 $0 Include: Realized gain (loss) on currency forward contracts not included in operating income ($7,048) ($1,856) ($148) $3,786 $7,450 $7,783 Adjusted NOPAT $84,001 $104,405 $115,590 $130,931 $125,096 $118,847 Reconciliation: Adjusted NOPAT TTM, In thousands Cash taxes paid in the current period $18,484 $21,097 $16,597 $16,470 $14,285 $13,698 Less: cash taxes related to prior periods ($6,521) ($7,665) ($6,780) ($7,839) ($5,476) ($2,257) Plus: cash taxes attributable to the current period but not yet paid $6,036 $4,112 $4,132 $4,449 $6,667 $6,652 Plus: cash impact of excess tax benefit on equity awards attributable to current period $5,552 $6,027 $10,664 $10,915 $12,932 $11,845 Less: installment payment related to the transfer of IP in a prior year ($3,428) ($3,426) ($3,424) ($3,422) ($3,420) ($3,430) Cash taxes attributable to current period $20,123 $20,145 $21,189 $20,573 $24,988 $26,508 ¹ Includes expense recognized for the change in fair value of contingent consideration and compensation expense related to cash-based earn-out mechanisms dependent upon continued employment.

34 Reconciliation: Adjusted NOP by Segment Quarterly, In thousands Q1 FY15 Q1 FY16 Adjusted Net Operating Profit (NOP): Vistaprint Business Unit $70,077 $66,252 Upload and Print Business Units 4,520 10,887 All Other 2,192 359 Total 76,789 77,498 Corporate and global functions (48,848 ) (54,619 ) Acquisition-related amortization and depreciation (6,908 ) (9,782 ) Change in fair value of contingent consideration (earn-out related charges)¹ (3,677 ) — Share-based compensation related to investment consideration (497 ) (1,091 ) Restructuring charges — (271 ) Interest expense for Waltham lease — 350 Total income from operations $16,859 $12,085 Note: The following factors, among others, may limit the comparability of adjusted net operating profit by segment: • We do not allocate support costs across operating segments or corporate and global functions. • Some of our acquired business units in our Upload and Print Business Units and All Other Business Units segments are burdened by the costs of their local finance, HR, and other administrative support functions, whereas other business units leverage our global functions and do not receive an allocation for these services. • Our All Other Business Units reporting segment includes our Most of World business unit, which has Adjusted NOP losses as it is in its early stage of investment relative to the scale of the underlying business. Adjusted NOP by segment may be different than the major investment assessment that we publish via letter to investors at year end, where we do estimate and allocate some of the costs included in the “Corporate and Global Functions” expense category. ¹ Includes expense recognized for the change in fair value of contingent consideration and compensation expense related to cash-based earn-out mechanisms dependent upon continued employment.

35 Reconciliation: ROIC *In Q1 FY16 we early adopted a new accounting standard to present our capitalized debt issuance costs asset net of the related debt obligation. Previously, these capitalized costs were classified as other current and long- term assets. We have applied this change retroactively for all periods presented. ¹In Q1 FY15, we updated our definition of ROIC to include invested capital inclusive of redeemable non-controlling interests, which date back to Q4 FY14. ²Excess cash is cash and equivalents > 5% of last twelve month revenues; if negative, capped at zero. ³Average invested capital represents a four quarter average of total debt, redeemable non-controlling interests and total shareholder equity, less excess cash In Q3 FY15 we corrected an error where we had not properly excluded excess cash from the calculation of average invested capital. This resulted in adjustments to our previously reported Q2 FY15 and Q3 FY15 average invested capital and TTM ROIC results. TTM, In thousands except percentages Q1FY14 Q2FY14 Q3FY14 Q4FY14 Q1FY15 Q2FY15 Q3FY15 Q4FY15 Q1 FY16 Total Debt * $267,163 $201,826 $198,516 $444,569 $443,293 $391,761 $421,586 $514,095 $655,317 Redeemable Non-Controlling Interest ¹ $— $— $— $11,160 $10,109 $9,466 $12,698 $57,738 $65,120 Total Shareholders Equity $206,715 $260,288 $272,395 $232,457 $216,185 $257,835 $235,927 $249,419 $110,072 Excess Cash ² ($5,093 ) ($1,628 ) $— $— $— ($7,972 ) ($61,617 ) ($28,874 ) ($33,271 ) Invested Capital ³ $468,785 $460,486 $470,911 $688,186 $669,587 $651,090 $608,594 $792,378 $797,238 Average Invested Capital³ $— $— $— $522,092 $572,293 $619,944 $654,364 $680,412 $712,325 TTM Q1FY14 TTM Q2FY14 TTM Q3FY14 TTM Q4FY14 TTM Q1FY15 TTM Q2FY15 TTM Q3FY15 TTM Q4FY15 TTM Q1 FY16 TTM Adjusted NOPAT n/a n/a n/a $84,001 $104,405 $115,590 $130,931 $125,096 $118,847 Average Invested Capital³ (From above) $— $— $— $522,092 $572,293 $619,944 $654,364 $680,412 $712,325 TTM Adjusted ROIC n/a n/a n/a 16 % 18 % 19 % 20 % 18 % 17 %

36 Reconciliation: Adjusted EBITDA1,2 Quarterly, In thousands Q1FY14 Q2FY14 Q3FY14 Q4FY14 Q1FY15 Q2FY15 Q3FY15 Q4FY15 Q1FY16 Operating Income $8,409 $52,522 $5,239 $19,744 $16,860 $59,888 $4,341 $15,236 $12,085 Depreciation and amortization $15,625 $16,839 $16,881 $22,936 $24,459 $22,895 $22,325 $27,808 $30,226 Share-based compensation expense $8,385 $7,873 $5,591 $5,936 $5,742 $6,384 $6,638 $5,311 $6,190 Earn-out related charges $0 $0 $0 $2,192 $3,677 $3,701 $7,512 $386 $289 Realized gain/(loss) on currency forward contracts ($353) ($2,386) ($2,132) ($2,177) ($17) $4,178 $1,802 $1,487 $316 Adjusted EBITDA $32,066 $74,848 $25,579 $48,631 $50,721 $97,046 $42,618 $50,228 $49,106 Note: In Q1 FY16 we simplified the definition of adjusted EBITDA used in external reporting resulting in a slight change in historical adjusted EBITDA which have been restated for all periods shown in the reconciliation above. ¹This deck uses the definition of Adjusted EBITDA as outlined above and therefore does not include the pro forma impact of acquisitions; however, the senior unsecured notes' covenants allow for the inclusion of pro forma impacts to Adjusted EBITDA. ²Adjusted EBITDA includes 100% of the results of our consolidated subsidiaries and therefore does not give effect to adjusted EBITDA attributable to non-controlling interests. This is to most closely align to our debt covenant and cash flow reporting.
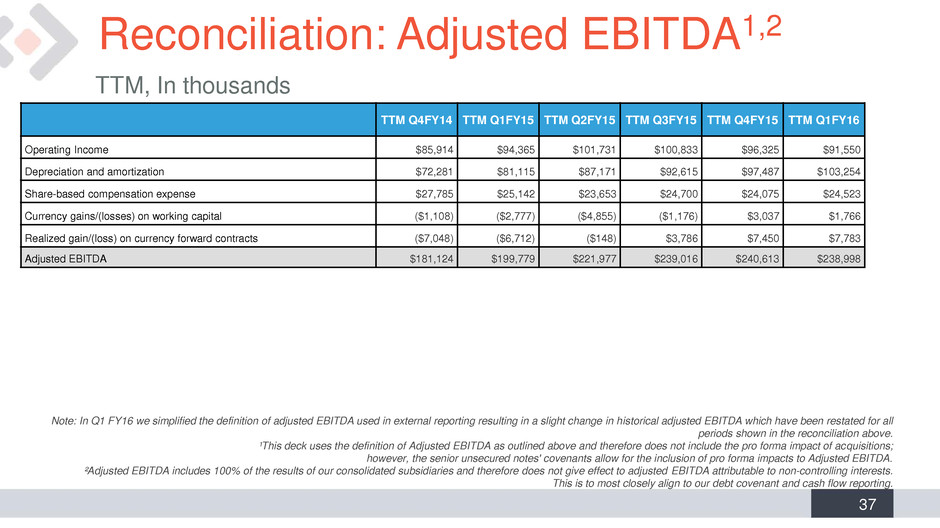
37 Reconciliation: Adjusted EBITDA1,2 TTM, In thousands TTM Q4FY14 TTM Q1FY15 TTM Q2FY15 TTM Q3FY15 TTM Q4FY15 TTM Q1FY16 Operating Income $85,914 $94,365 $101,731 $100,833 $96,325 $91,550 Depreciation and amortization $72,281 $81,115 $87,171 $92,615 $97,487 $103,254 Share-based compensation expense $27,785 $25,142 $23,653 $24,700 $24,075 $24,523 Currency gains/(losses) on working capital ($1,108) ($2,777) ($4,855) ($1,176) $3,037 $1,766 Realized gain/(loss) on currency forward contracts ($7,048) ($6,712) ($148) $3,786 $7,450 $7,783 Adjusted EBITDA $181,124 $199,779 $221,977 $239,016 $240,613 $238,998 Note: In Q1 FY16 we simplified the definition of adjusted EBITDA used in external reporting resulting in a slight change in historical adjusted EBITDA which have been restated for all periods shown in the reconciliation above. ¹This deck uses the definition of Adjusted EBITDA as outlined above and therefore does not include the pro forma impact of acquisitions; however, the senior unsecured notes' covenants allow for the inclusion of pro forma impacts to Adjusted EBITDA. ²Adjusted EBITDA includes 100% of the results of our consolidated subsidiaries and therefore does not give effect to adjusted EBITDA attributable to non-controlling interests. This is to most closely align to our debt covenant and cash flow reporting.

38 Reconciliation: Revenue Growth Rates Q1 FY2016 total company revenue growth in constant currency excluding TTM acquisitions and joint ventures excludes the impact of currency and revenue from druck.at, Easyflyer, Exagroup, Printi, Alcione and Tradeprint. Q1 FY16 Q1 FY15 % Change Currency impact (Favorable)/Unfa vorable Constant- currency revenue growth Impact of Acquisitions (Favorable)/Unfa vorable Constant-currency revenue growth ex. acquisitions in the last 12 months Vistaprint Business Unit $265,190 $260,057 2 % 6 % 8 % — % 8 % Upload and Print Business Units $76,538 $38,729 98 % 20 % 118 % (87 )% 31 % All Other Business Units $34,020 $35,146 (3 )% 13 % 10 % (4 )% 6 % Consolidated revenue $375,748 $333,932 13 % 8 % 21 % (10 )% 11 % Quarterly, In thousands except percentages
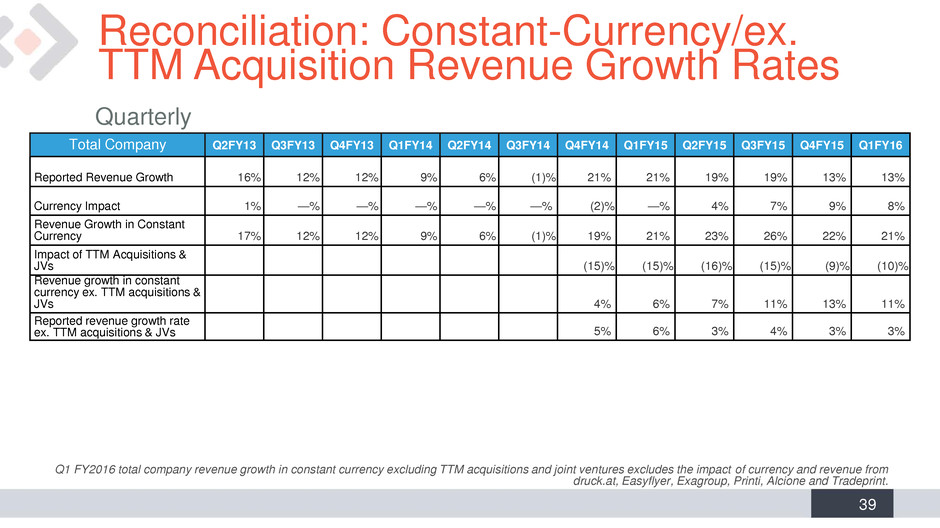
39 Total Company Q2FY13 Q3FY13 Q4FY13 Q1FY14 Q2FY14 Q3FY14 Q4FY14 Q1FY15 Q2FY15 Q3FY15 Q4FY15 Q1FY16 Reported Revenue Growth 16 % 12 % 12 % 9 % 6 % (1 )% 21 % 21 % 19 % 19 % 13 % 13 % Currency Impact 1 % — % — % — % — % — % (2 )% — % 4 % 7 % 9 % 8 % Revenue Growth in Constant Currency 17 % 12 % 12 % 9 % 6 % (1 )% 19 % 21 % 23 % 26 % 22 % 21 % Impact of TTM Acquisitions & JVs (15 )% (15 )% (16 )% (15 )% (9 )% (10 )% Revenue growth in constant currency ex. TTM acquisitions & JVs 4 % 6 % 7 % 11 % 13 % 11 % Reported revenue growth rate ex. TTM acquisitions & JVs 5 % 6 % 3 % 4 % 3 % 3 % Reconciliation: Constant-Currency/ex. TTM Acquisition Revenue Growth Rates Quarterly Q1 FY2016 total company revenue growth in constant currency excluding TTM acquisitions and joint ventures excludes the impact of currency and revenue from druck.at, Easyflyer, Exagroup, Printi, Alcione and Tradeprint.
