Attached files
| file | filename |
|---|---|
| 8-K - 8-K - Ally Financial Inc. | v423039_8k.htm |
| EX-99.3 - EXHIBIT 99.3 - Ally Financial Inc. | v423039_ex99-3.htm |
| EX-99.1 - EXHIBIT 99.1 - Ally Financial Inc. | v423039_ex99-1.htm |
Exhibit 99.2

Ally Financial Inc. 3 Q 2015 Earnings Review Contact Ally Investor Relations at (866) 710 - 4623 or investor.relations@ally.com October 29, 2015

2 3Q 2015 Preliminary Results Forward - Looking Statements and Additional Information The following should be read in conjunction with the financial statements, notes and other information contained in the Compa ny’ s Annual Reports on Form 10 - K, Quarterly Reports on Form 10 - Q, and Current Reports on Form 8 - K . This information is preliminary and based on company data available at the time of the presentation In the presentation that follows and related comments by Ally Financial Inc. (“Ally”) management, the use of the words “expec t,” “anticipate,” “estimate,” “forecast,” “initiative,” “objective,” “plan,” “goal,” “project,” “outlook,” “priorities,” “target,” “explore,” “ pos itions,” “intend,” “evaluate,” “pursue,” “seek,” “may,” “would, ” “could, ” “should, ” “believe, ” “potential, ” “continue,” or the negative of these words, or similar expressions is intended to identify forward - looking statements. All statements herein and in related management comments, other than statements of historical fact, including without limitation, statements about future events and financial performance, are forward - looking statements tha t involve certain risks and uncertainties. While these statements represent our current judgment on what the future may hold, and we believe th ese judgments are reasonable, these statements are not guarantees of any events or financial results, and Ally’s actual results may differ mate ria lly due to numerous important factors that are described in the most recent reports on SEC Forms 10 - K and 10 - Q for Ally, each of which may be revise d or supplemented in subsequent reports filed with the SEC. Such factors include, among others, the following: maintaining the mut ual ly beneficial relationship between Ally and General Motors, and Ally and Chrysler and our ability to further diversify our business; our ability to maintain relationships with automotive dealers; the significant regulation and restrictions that we are subject to as a bank holding company and financial holding company; the potential for deterioration in the residual value of off - lease vehicles; disruptions in the market in which we fund our operations, with resulting negative impact on our liquidity; changes in our accounting assumptions that may require or that r esu lt from changes in the accounting rules or their application, which could result in an impact on earnings; changes in our credit ratings; changes in economic conditions, currency exchange rates or political stability in the markets in which we operate; and changes in the existing or th e adoption of new laws, regulations, policies or other activities of governments, agencies and similar organizations (including as a result of the Dodd - Frank Act and Basel III). Investors are cautioned not to place undue reliance on forward - looking statements. Ally undertakes no obligation to update publi cly or otherwise revise any forward - looking statements, whether as a result of new information, future events or other such factors that affect t he subject of these statements, except where expressly required by law. Reconciliation of non - GAAP financial measures included within this presentat ion are provided in this presentation. Use of the term “loans” describes products associated with direct and indirect lending activities of Ally’s operations. The s pec ific products include retail installment sales contracts, lines of credit, leases or other financing products. The term “originate” refers to Ally’ s p urchase, acquisition or direct origination of various “loan” products.

3 3Q 2015 Preliminary Results Key Messages Diversifying our leading auto finance business Improving shareholder returns Expanding franchise to drive long - term growth • Originations expected to exceed target of high $30s billion for 2015 • Credit continues to perform within expectations • Diversified business is designed to provide consistent returns through cycles • Ally has drivers that are not dependent on auto cycle improvement • Expanding Ally Bank funding and efficiency • Capital management – p riority remains to address Series G • Internal initiatives underway to position company for the long term • “ One Ally” – create integrated customer experience and cross - sell opportunities • “ Ally 2.0” – building on existing foundation of 5.5 million customers and leading digital platform to expand products and services

4 3Q 2015 Preliminary Results Third Quarter Highlights • Net income of $268 million • Core pre - tax income ex. repositioning items (1) of $431 million and Adjusted EPS (2) of $0.51 – Core ROTCE (3) of 9.2% and Adjusted Efficiency Ratio (3) of 44% – Net Interest Margin (4) of 2.67%, up 9 bps QoQ • Auto originations of $11.1 billion in 3Q – Additionally, closed Mitsubishi consumer asset purchase of $607 million • Retail deposit growth of $1.8 billion in 3Q, with balances up 15% YoY – Surpassed the 1 million customer milestone, adding over 36 thousand deposit customers in 3Q (1) Represents a non - GAAP financial measure. As presented excludes the impact of repositioning items, OID amortization expense, income tax expense and discontinued operations. See slides 21 and 22 for details (2) See slide 5 for details (3) Represents a non - GAAP financial measure. Core ROTCE adjusts for certain items such as net DTA and OID. See slide 22 for details (4) Excludes OID +36% YoY 3Q 15 3Q 14 YoY Change Growth 3.5$ 2.4$ 46% Chrysler 2.7 1.9 38% GM Non Subvented 4.2 3.3 28% GM Subvented (Loan and Lease) 0.7 4.2 -83% Total 11.1$ 11.8$ -6% Consumer Auto Originations by Channel ($B)
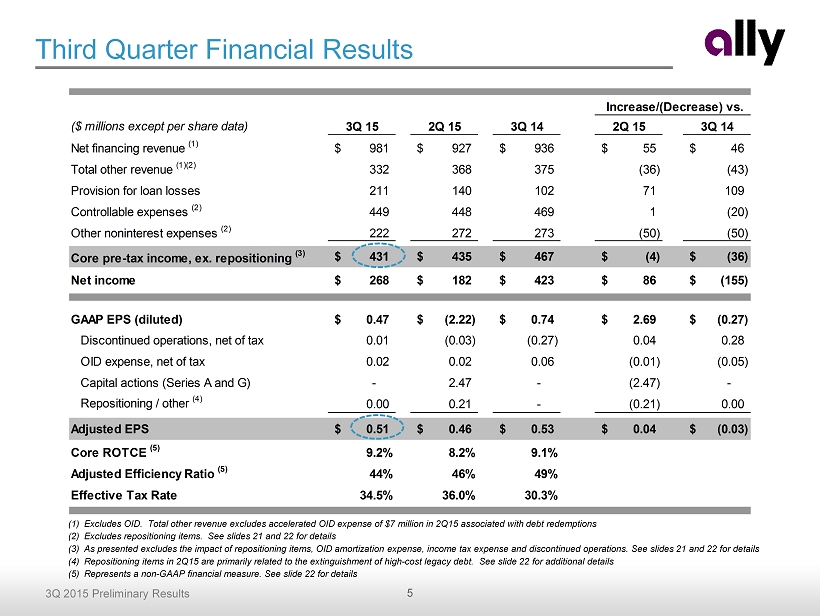
5 3Q 2015 Preliminary Results ($ millions except per share data) 3Q 15 2Q 15 3Q 14 2Q 15 3Q 14 Net financing revenue (1) 981$ 927$ 936$ 55$ 46$ Total other revenue (1)(2) 332 368 375 (36) (43) Provision for loan losses 211 140 102 71 109 Controllable expenses (2) 449 448 469 1 (20) Other noninterest expenses (2) 222 272 273 (50) (50) Core pre-tax income, ex. repositioning (3) 431$ 435$ 467$ (4)$ (36)$ Net income 268$ 182$ 423$ 86$ (155)$ GAAP EPS (diluted) 0.47$ (2.22)$ 0.74$ 2.69$ (0.27)$ Discontinued operations, net of tax 0.01 (0.03) (0.27) 0.04 0.28 OID expense, net of tax 0.02 0.02 0.06 (0.01) (0.05) Capital actions (Series A and G) - 2.47 - (2.47) - Repositioning / other (4) 0.00 0.21 - (0.21) 0.00 Adjusted EPS 0.51$ 0.46$ 0.53$ 0.04$ (0.03)$ Core ROTCE (5) 9.2% 8.2% 9.1% Adjusted Efficiency Ratio (5) 44% 46% 49% Effective Tax Rate 34.5% 36.0% 30.3% Increase/(Decrease) vs. Third Quarter Financial Results (1) Excludes OID. Total other revenue excludes accelerated OID expense of $7 million in 2Q15 associated with debt redemptions (2) Excludes repositioning items. See slides 21 and 22 for details (3) As presented excludes the impact of repositioning items, OID amortization expense, income tax expense and discontinued operation s. See slides 21 and 22 for details (4) Repositioning items in 2Q15 are primarily related to the extinguishment of high - cost legacy debt. See slide 22 for additional details (5) Represents a non - GAAP financial measure. See slide 22 for details

6 3Q 2015 Preliminary Results Pre-Tax Income ($ millions) 3Q 15 2Q 15 3Q 14 Automotive Finance 347$ (54)$ (68)$ Insurance 40 25 (20) Dealer Financial Services 387$ (29)$ (88)$ Mortgage (1) 7 (2) 10 Corporate and Other (1) 37 27 42 Core pre-tax income, ex. repositioning (2) 431$ (4)$ (36)$ Increase/(Decrease) vs. Results by Segment (1) Results exclude the impact of repositioning items. Corporate and other also excludes OID amortization expense. See slide 21 fo r details (2) Core pre - tax income is a non - GAAP financial measure and as presented excludes the impact of repositioning items, OID amortizatio n expense, income tax expense and discontinued operations. See slides 21 and 22 for details • Auto Finance results driven by continued strong originations – Retail loan growth and lower funding costs driving improved net financing revenue – Offset by higher provision expense due to strong loan growth and seasonality • Insurance results largely driven by lower weather - related losses offset by lower investment income • Mortgage results driven by portfolio growth and a $9 million gain on sale of legacy loans • Corporate and Other favorability driven by improved funding costs
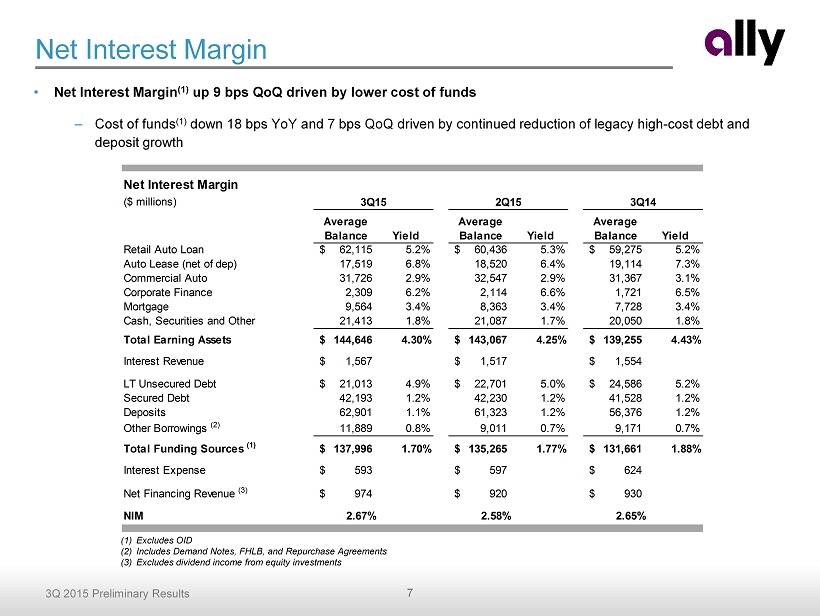
7 3Q 2015 Preliminary Results Net Interest Margin • Net Interest Margin (1) up 9 bps QoQ driven by lower cost of funds – Cost of funds (1) down 18 bps YoY and 7 bps QoQ driven by continued reduction of legacy high - cost debt and deposit growth (1) Excludes OID (2) Includes Demand Notes, FHLB, and Repurchase Agreements (3) Excludes dividend income from equity investments Net Interest Margin ($ millions) Average Balance Yield Average Balance Yield Average Balance Yield Retail Auto Loan 62,115$ 5.2% 60,436$ 5.3% 59,275$ 5.2% Auto Lease (net of dep) 17,519 6.8% 18,520 6.4% 19,114 7.3% Commercial Auto 31,726 2.9% 32,547 2.9% 31,367 3.1% Corporate Finance 2,309 6.2% 2,114 6.6% 1,721 6.5% Mortgage 9,564 3.4% 8,363 3.4% 7,728 3.4% Cash, Securities and Other 21,413 1.8% 21,087 1.7% 20,050 1.8% Total Earning Assets 144,646$ 4.30% 143,067$ 4.25% 139,255$ 4.43% Interest Revenue 1,567$ 1,517$ 1,554$ LT Unsecured Debt 21,013$ 4.9% 22,701$ 5.0% 24,586$ 5.2% Secured Debt 42,193 1.2% 42,230 1.2% 41,528 1.2% Deposits 62,901 1.1% 61,323 1.2% 56,376 1.2% Other Borrowings (2) 11,889 0.8% 9,011 0.7% 9,171 0.7% Total Funding Sources (1) 137,996$ 1.70% 135,265$ 1.77% 131,661$ 1.88% Interest Expense 593$ 597$ 624$ Net Financing Revenue (3) 974$ 920$ 930$ NIM 2.67% 2.58% 2.65% 3Q15 2Q15 3Q14

8 3Q 2015 Preliminary Results Interest Rate Sensitivity • Ally’s balance sheet primarily consists of short duration assets (~2 year weighted average life) funded primarily with deposits and securitizations • Ally’s interest rate sensitivity is dependent on the re - pricing assumptions of the deposit book in a rising rate environment – For modeling interest rate sensitivity, Ally uses assumptions on deposit pricing that currently result in ~80 % pass - through rate over time – Assuming a long - term deposit pricing pass - through rate of 50% would result in an asset sensitive position • Another material portion of interest rate exposure has historically been driven by rate floors on certain commercial auto loans – Ally has migrated a substantial portion of dealer floorplan loans from Prime to LIBOR indices – As of September 30th, over 9 0 % of floorplan loans will re - price directly with short - term interest rates (1) Net financing revenue impacts reflect a rolling 12 - month view (2) Results in ~80% pass - through rate over time. See slide 22 for additional details $ million Ally Modeled Scenario (2) 50% Deposit Pass-Through Ally Modeled Scenario (2) 50% Deposit Pass-Through +100 bp Instantaneous (50)$ 48$ (110)$ 1$ +100 bp Gradual (over 12 months) (7)$ 29$ (32)$ 8$ Stable rate environment 12$ (5)$ 39$ 5$ Net Financing Revenue Impact (1) vs. Forward Curve 3Q15 2Q15

9 3Q 2015 Preliminary Results Deposits • $1.8 billion of retail deposit growth in 3Q and $5.5 billion of YTD growth • Surpassed the 1 million customer milestone – Grew customer base 16% YoY • Continue to build strong franchise and brand – Introduced Apple Watch ATM and Cash locator app – Touch ID for mobile expected to pilot in 1Q16 – Ally Bank named “Best Online Bank” by MONEY® magazine for the 5 th straight year (2011 – 2015) Stable, consistent growth of retail deposits Deposit Mix Retail deposit customer growth Ally Bank Deposit Composition and Average Retail Portfolio Interest Rate 17% 17% 16% 16% 16% 41% 40% 38% 36% 34% 41% 43% 46% 48% 50% 1.16% 1.16% 1.17% 1.15% 1.14% 3Q 14 4Q 14 1Q 15 2Q 15 3Q 15 Brokered Retail CD MMA/OSA/Checking Average Retail Portfolio Interest Rate Ally Bank Retail Deposit Customers (thousands) 30.9 24.2 45.3 34.9 36.6 884.9 909.1 954.5 989.3 1,025.9 3Q 14 4Q 14 1Q 15 2Q 15 3Q 15 Net Retail Customer Growth Total Retail Customers Ally Bank Deposit Levels ($ billions) $46.7 $48.0 $50.6 $51.8 $53.5 $9.7 $9.9 $9.9 $9.9 $10.2 $56.4 $57.8 $60.5 $61.6 $63.7 3Q 14 4Q 14 1Q 15 2Q 15 3Q 15 Ally Bank Retail Ally Bank Brokered
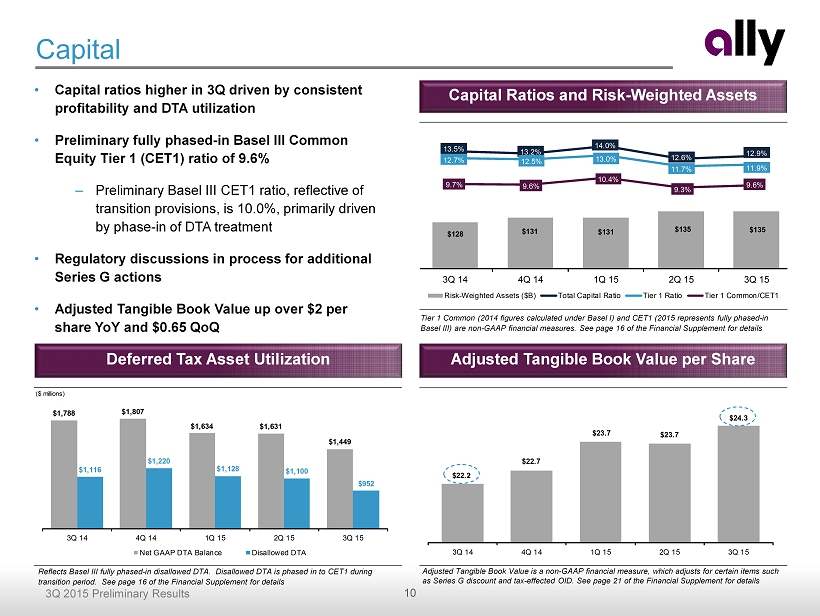
10 3Q 2015 Preliminary Results Capital • Capital ratios higher in 3Q driven by consistent profitability and DTA utilization • Preliminary fully phased - in Basel III Common Equity Tier 1 (CET1) ratio of 9.6% – Preliminary Basel III CET1 ratio, reflective of transition provisions, is 10.0%, primarily driven by phase - in of DTA treatment • Regulatory discussions in process for additional Series G actions • Adjusted Tangible Book Value up over $2 per share YoY and $0.65 QoQ Tier 1 Common (2014 figures calculated under Basel I) and CET1 (2015 represents fully phased - in Basel III) are non - GAAP financial measures. See page 16 of the Financial Supplement for details Capital Ratios and Risk - Weighted Assets Adjusted Tangible Book Value per Share Adjusted Tangible Book Value is a non - GAAP financial measure, which adjusts for certain items such as Series G discount and tax - effected OID . See page 21 of the Financial Supplement for details $22.2 $22.7 $23.7 $23.7 $24.3 3Q 14 4Q 14 1Q 15 2Q 15 3Q 15 Deferred Tax Asset Utilization Reflects Basel III fully phased - in disallowed DTA. Disallowed DTA is phased in to CET1 during transition period. See page 16 of the Financial Supplement for details $128 $131 $131 $135 $135 13.5% 13.2% 14.0% 12.6% 12.9% 12.7% 12.5% 13.0% 11.7% 11.9% 9.7% 9.6% 10.4% 9.3% 9.6% 3Q 14 4Q 14 1Q 15 2Q 15 3Q 15 Risk-Weighted Assets ($B) Total Capital Ratio Tier 1 Ratio Tier 1 Common/CET1 ($ millions) $1,788 $1,807 $1,634 $1,631 $1,449 $1,116 $1,220 $1,128 $1,100 $952 3Q 14 4Q 14 1Q 15 2Q 15 3Q 15 Net GAAP DTA Balance Disallowed DTA

11 3Q 2015 Preliminary Results $83 $137 $160 $132 $96 $156 0.58% 0.93% 1.10% 0.93% 0.65% 1.01% 2Q 14 3Q 14 4Q 14 1Q 15 2Q 15 3Q 15 Net Charge-Offs ($M) Annualized NCO Rate (30+ DPD) $1,174 $1,338 $1,543 $1,076 $1,389 $1,656 2.02% 2.28% 2.73% 1.87% 2.29% 2.60% 2Q 14 3Q 14 4Q 14 1Q 15 2Q 15 3Q 15 Delinquent Contracts ($M) Delinquency Rate ($ millions) Provision Expense 2Q 14 3Q 14 4Q 14 1Q 15 2Q 15 3Q 15 Retail Auto 97$ 112$ 168$ 158$ 152$ 200$ Commercial Auto 2 (3) 7 (31) (20) 1 Mortgage (25) (7) (14) (5) 3 6 Corp/Other (11) - (6) (6) 5 4 Total 63$ 102$ 155$ 116$ 140$ 211$ Retail Auto Coverage Ratio 1.25% 1.18% 1.21% 1.24% 1.26% 1.27% Retail Auto Loan Bal (EOP) 58,084$ 58,659$ 56,535$ 57,379$ 60,717$ 63,503$ 344% 187% 144% 155% 244% 158% 0.34% 0.60% 0.68% 0.61% 0.39% 0.61% 2Q 14 3Q 14 4Q 14 1Q 15 2Q 15 3Q 15 ALLL as % of Annualized NCOs Annualized NCO Rate $974 $933 $977 $1,113 $1,171 $ 1,018 ALLL Balance ($M) Consolidated Net Charge - Offs Provision Expense Asset Quality U.S. Retail Auto Net Charge - Offs U.S. Retail Auto Delinquencies Note: Above loans are classified as held - for - investment and recorded at historical cost. See slide 22 for details Note: Includes accruing contracts only

12 3Q 2015 Preliminary Results Key Financials ($ millions) 3Q 15 2Q 15 3Q 14 Net financing revenue 870$ 20$ 20$ Total other revenue 63 8 (6) Total net revenue 933 28 14 Provision for loan losses 201 69 92 Noninterest expense 385 13 (10) Pre-tax income from continuing ops 347$ (54)$ (68)$ U.S. auto earning assets 113,117$ 67$ 3,625 Net lease revenue Operating lease revenue 830$ (30)$ (69)$ Depreciation expense 633 (39) (21) Remarketing gains 105 (3) - Total depreciation expense 528 (35) (21) Net lease revenue 302$ 5$ (48)$ Increase/(Decrease) vs. • Auto Finance reported pre - tax income of $347 million in 3Q, down $68 million YoY and $54 million from the prior quarter – Net financing revenue higher driven primarily by strong originations and higher asset balances – Provision higher YoY driven primarily by loan growth (loan vs. lease originations) • Earning assets relatively flat QoQ despite approximately $2 billion of loan sales • Continue to strengthen leading auto finance platform – $11.1 billion of consumer auto originations in 3Q15, with 76% funded through Ally Bank ▪ Continue to see strong performance across all non - subvented channels ▪ Nonprime (<620 FICO) 13.5% of originations in 3Q15 vs. 13.7% in 2Q15 ▪ Record application volume driven by Growth channel initiatives • SmartAuction , Ally’s leading online auction platform, surpassed 5 million vehicles sold Auto Finance – Results Decisioned Applications (thousands) 679 700 824 906 856 356 399 374 438 542 412 619 844 1,101 1,430 1,447 1,718 2,042 2,444 2,829 3Q 11 3Q 12 3Q 13 3Q 14 3Q 15 GM Chrysler Growth

13 3Q 2015 Preliminary Results (EOP $ billions) $58.1 $58.7 $58.0 $58.9 $62.1 $63.5 $18.8 $19.3 $19.5 $19.0 $17.9 $17.3 $79.2 $81.3 $81.3 $82.1 $83.7 $85.7 2Q 14 3Q 14 4Q 14 1Q 15 2Q 15 3Q 15 On Balance Sheet Retail Off Balance Sheet Retail Lease ($ billions) $32.9 $31.4 $33.2 $32.4 $32.5 $31.7 2Q 14 3Q 14 4Q 14 1Q 15 2Q 15 3Q 15 ($ billions; % of $ originations) 63% 63% 60% 52% 45% 45% 17% 16% 18% 20% 24% 24% 20% 20% 22% 28% 32% 32% $10.9 $11.8 $9.0 $9.8 $10.8 $11.1 2Q 14 3Q 14 4Q 14 1Q 15 2Q 15 3Q 15 GM Chrysler Growth Auto Finance – Key Metrics See slide 22 for definitions Consumer Assets Commercial Assets Consumer Originations Origination Mix Note: Asset balances reflect the average daily balance for the quarter (% of $ originations) 8% 15% 5% 5% 6% 6% 27% 24% 30% 31% 36% 37% 8% 8% 8% 10% 12% 12% 29% 26% 27% 17% 9% 9% 28% 27% 30% 36% 37% 35% 2Q 14 3Q 14 4Q 14 1Q 15 2Q 15 3Q 15 GM Subvented New Standard New Growth Lease Used

14 3Q 2015 Preliminary Results Key Financials ($ millions) 3Q 15 2Q 15 3Q 14 Premiums, service revenue earned and other 240$ (1)$ (10)$ Losses and loss adjustment expenses 61 (61) (36) Acquisition and underwriting expenses 148 3 2 Total underwriting income 31 57 24 Investment income and other 9 (32) (44) Pre-tax income from continuing ops 40$ 25$ (20)$ Total assets 6,997$ (263)$ (181)$ Key Statistics 3Q 15 2Q 15 3Q 14 Insurance ratios Loss ratio 26% 51% 39% Underwriting expense ratio 62% 61% 59% Combined ratio 88% 112% 98% Increase/(Decrease) vs. Dealer Products & Services Written Premiums ($ millions) $267 $225 $244 $267 $265 $248 $239 $263 $254 3Q 13 4Q 13 1Q 14 2Q 14 3Q 14 4Q 14 1Q 15 2Q 15 3Q 15 Insurance • Pre - tax income of $40 million, down $20 million YoY and up $25 million from the prior quarter – W eather - related losses down both YoY and QoQ – Investment gains down both YoY and QoQ • Written premiums of $254 million in 3Q – Down both YoY and QoQ partially driven by higher dealer reinsurance participation • Continued nationwide rollout of Ally Premier Protection Note: Excludes Canadian Personal Lines business, which is in runoff Note: Excludes the benefit of weather - related loss reinsurance and Canadian Personal Lines losses Insurance Losses ($ millions) $51 $47 $42 $40 $42 $39 $124 $36 $5 $4 $67 $9 $190 $97 $60 $56 $123 $62 2Q 14 3Q 14 4Q 14 1Q 15 2Q 15 3Q 15 VSC Losses Weather Losses Other Losses
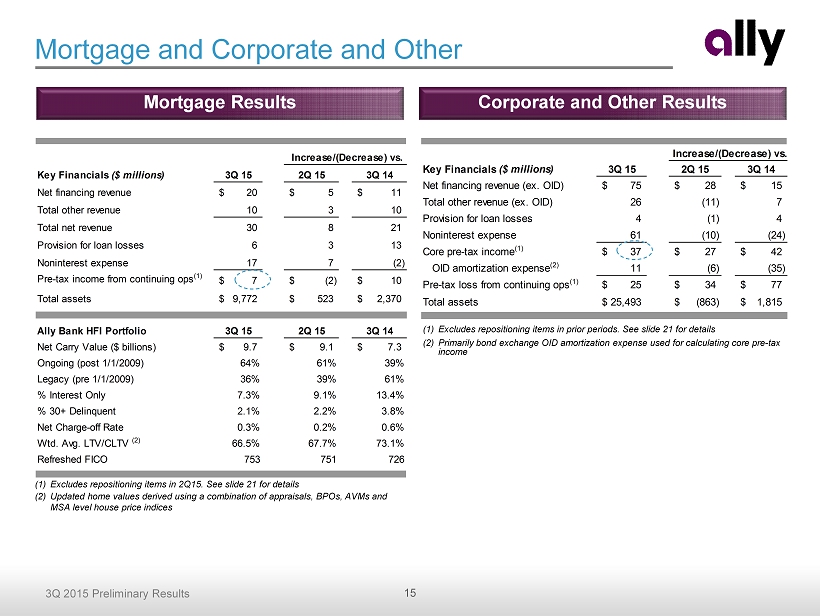
15 3Q 2015 Preliminary Results Key Financials ($ millions) 3Q 15 2Q 15 3Q 14 Net financing revenue 20$ 5$ 11$ Total other revenue 10 3 10 Total net revenue 30 8 21 Provision for loan losses 6 3 13 Noninterest expense 17 7 (2) Pre-tax income from continuing ops (1) 7$ (2)$ 10$ Total assets 9,772$ 523$ 2,370$ Ally Bank HFI Portfolio 3Q 15 2Q 15 3Q 14 Net Carry Value ($ billions) 9.7$ 9.1$ 7.3$ Ongoing (post 1/1/2009) 64% 61% 39% Legacy (pre 1/1/2009) 36% 39% 61% % Interest Only 7.3% 9.1% 13.4% % 30+ Delinquent 2.1% 2.2% 3.8% Net Charge-off Rate 0.3% 0.2% 0.6% Wtd. Avg. LTV/CLTV (2) 66.5% 67.7% 73.1% Refreshed FICO 753 751 726 Increase/(Decrease) vs. Key Financials ($ millions) 3Q 15 2Q 15 3Q 14 Net financing revenue (ex. OID) 75$ 28$ 15$ Total other revenue (ex. OID) 26 (11) 7 Provision for loan losses 4 (1) 4 Noninterest expense 61 (10) (24) Core pre-tax income (1) 37$ 27$ 42$ OID amortization expense (2) 11 (6) (35) Pre-tax loss from continuing ops (1) 25$ 34$ 77$ Total assets 25,493$ (863)$ 1,815$ Increase/(Decrease) vs. Mortgage and Corporate and Other (1) Excludes repositioning items in 2Q15. See slide 21 for details (2) Updated home values derived using a combination of appraisals, BPOs, AVMs and MSA level house price indices Mortgage Results (1) Excludes repositioning items in prior periods. See slide 21 for details (2) Primarily bond exchange OID amortization expense used for calculating core pre - tax income Corporate and Other Results
16 3Q 2015 Preliminary Results Conclusion • Positioned leading auto finance business for consistent long term results – Business is diversified across dealers, borrowers and geography – Not reliant on manufacturer subvention – Strong deposit base should provide advantage over non - bank competitors over time • Focused on future capital management – Addressing Series G remains first priority – Objective to initiate dividend and share buyback program in 2016 – Generating excess capital and incremental book value per share • Leverage company strengths and position for the long term – Successfully positioned Ally Bank as a “disruptor” in consumer banking – Innovative culture, strong consumer brand and leading digital capabilities – Expect to announce additional products in 2016 Building a better financial services company

Supplemental Charts
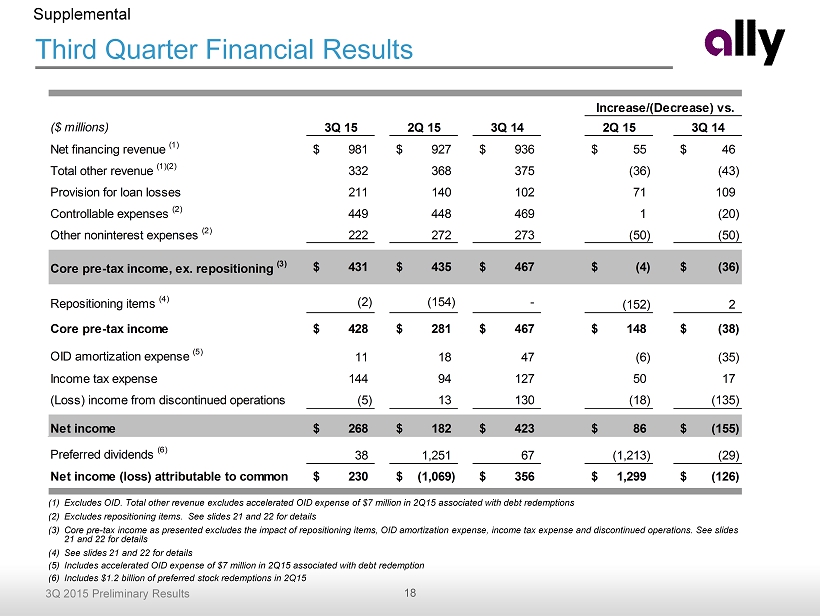
18 3Q 2015 Preliminary Results Third Quarter Financial Results (1) Excludes OID. Total other revenue excludes accelerated OID expense of $7 million in 2Q15 associated with debt redemptions (2) Excludes repositioning items. See slides 21 and 22 for details (3) Core pre - tax income as presented excludes the impact of repositioning items, OID amortization expense, income tax expense and di scontinued operations. See slides 21 and 22 for details (4) See slides 21 and 22 for details (5) Includes accelerated OID expense of $7 million in 2Q15 associated with debt redemption (6) Includes $1.2 billion of preferred stock redemptions in 2Q15 Supplemental ($ millions) 3Q 15 2Q 15 3Q 14 2Q 15 3Q 14 Net financing revenue (1) 981$ 927$ 936$ 55$ 46$ Total other revenue (1)(2) 332 368 375 (36) (43) Provision for loan losses 211 140 102 71 109 Controllable expenses (2) 449 448 469 1 (20) Other noninterest expenses (2) 222 272 273 (50) (50) Core pre-tax income, ex. repositioning (3) 431$ 435$ 467$ (4)$ (36)$ Repositioning items (4) (2) (154) - (152) 2 Core pre-tax income 428$ 281$ 467$ 148$ (38)$ OID amortization expense (5) 11 18 47 (6) (35) Income tax expense 144 94 127 50 17 (Loss) income from discontinued operations (5) 13 130 (18) (135) Net income 268$ 182$ 423$ 86$ (155)$ Preferred dividends (6) 38 1,251 67 (1,213) (29) Net income (loss) attributable to common 230$ (1,069)$ 356$ 1,299$ (126)$ Increase/(Decrease) vs.

19 3Q 2015 Preliminary Results ($ billions) 68% 69% 68% 68% 69% $149.2 $151.8 $153.5 $156.5 $156.1 3Q 14 4Q 14 1Q 15 2Q 15 3Q 15 Ally Bank Assets Non-Bank Assets • Diversified funding strategy with opportunities to lower cost of funds – 69% of total assets reside at Ally Bank – Deposits represent 47% of Ally’s funding • $2.6 billion of ABS transactions in 3Q, including a $1 billion full securitization • Whole loan sale of approximately $1 billion • Minimal unsecured maturities in 3Q Funding As of 9/30/15. Total maturities for 2020 and beyond equal $9.7 billion and do not exceed $3.0 billion in any given year. Current period does not include early debt redemptions. Total Asset Breakdown Unsecured Long - Term Debt Maturities Supplemental ($ billions) $2.0 $2.7 $0.0 $0.0 $1.9 $4.4 $3.0 $1.6 1Q 15 2Q 15 3Q 15 4Q 15 2016 2017 2018 2019 Matured Remaining

20 3Q 2015 Preliminary Results Deferred Tax Asset Supplemental (1) U.S. GAAP does not prescribe a method for calculating individual elements of deferred taxes for interim periods; therefore , these balances are estimated (2) Primarily book / tax timing differences Deferred Tax Asset 2Q 15 (1) ($ millions) Gross DTA/(DTL) Balance Valuation Allowance Net DTA/(DTL) Balance Net DTA/(DTL) Balance Net Operating Loss (Federal) 697$ -$ 697$ 873$ Tax Credit Carryforwards 1,935 (474) 1,461 1,444 State/Local Tax Carryforwards 201 (111) 90 101 Other Deferred Tax Liabilities, net (2) (799) - (799) (787) Net Deferred Tax Assets 2,034$ (585)$ 1,449$ 1,631$ 3Q 15 (1)

21 3Q 2015 Preliminary Results Notes on non - GAAP and other financial measures Supplemental (1) Represents core pre - tax income excluding repositioning items. See slide 22 for definitions $ millions GAAP OID & Repositioning Items Non-GAAP (1) GAAP OID & Repositioning Items Non-GAAP (1) GAAP OID & Repositioning Items Non-GAAP (1) Consolidated Ally Net financing revenue 970$ 11$ 981$ 916$ 11$ 927$ 889$ 47$ 936$ Total other revenue 332 - 332 211 157 368 375 - 375 Provision for loan losses 211 - 211 140 - 140 102 - 102 Controllable expenses 452 (2) 449 452 (4) 448 469 - 469 Other noninterest expenses 222 - 222 272 - 272 273 - 273 Pre-tax income from continuing ops 417$ 14$ 431$ 263$ 172$ 435$ 420$ 47$ 467$ Mortgage Operations Net financing revenue 20$ -$ 20$ 15$ -$ 15$ 9$ -$ 9$ Gain on sale of mortgage loans, net 9 - 9 4 - 4 - - - Other revenue (excluding gain on sale) 1 - 1 2 1 3 - - - Total net revenue 30 - 30 21 1 22 9 - 9 Provision for loan losses 6 - 6 3 - 3 (7) - (7) Noninterest expense 17 - 17 10 - 10 19 - 19 Pre-tax income (loss) from continuing ops 7$ -$ 7$ 8$ 1$ 9$ (3)$ -$ (3)$ Corporate / Other Net financing revenue 64$ 11$ 75$ 37$ 11$ 48$ 14$ 47$ 61$ Total other revenue (loss) 26 - 26 (118) 155 37 19 - 19 Provision for loan losses 4 - 4 5 - 5 - - - Noninterest expense 63 (2) 61 75 (4) 71 85 - 85 Pre-tax income (loss) from continuing ops 23$ 14$ 37$ (161)$ 170$ 9$ (52)$ 47$ (5)$ 3Q 15 2Q 15 3Q 14

22 3Q 2015 Preliminary Results Notes on non - GAAP and other financial measures Supplemental 1) Core pre - tax income (loss) is a non - GAAP financial measure. It is defined as income (loss) from continuing operations before income tax expense and primarily bond exchange original issue discount ("OID") amortization expense . 2) Repositioning items for 2Q15 are primarily related to the extinguishment of high - cost legacy debt. 3) Core ROTCE is equal to Operating Net Income Available to Common divided by Normalized Common Equity. See page 22 in the Financial Supple men t for full calculation. A. Operating Net Income Available to Common is calculated as (a) Pre - Tax Income from Continuing Operations minus (b) Income Tax Expense using a normalized 34% rate plus (c) expense associated with original issue bond discount amortization minus (d) preferred dividends associated with our Series A and Series G preferred stock plus (e) impact of any disclosed repositioning items . B. Normalized Common Equity is calculated as the two period average of (a) shareholder equity minus (b) the book value of preferred stock outstanding minus (c) goodwill and other intangibles minus (d) remaining original issue bond discount minus (e) remaining net deferred tax asset. 4) Adjusted Efficiency ratio is equal to (A) total noninterest expense less ( i ) Insurance operating segment related expenses, (ii) mortgage repurchase expense and (iii) expense related to repositioning items divided by ( B) total net revenue less ( i ) Insurance operating segment related revenue, (ii) OID amortization expense and (iii) any revenue related to repositioning items . See page 22 in the Financial Supplement for full calculation. 5) Corporate and Other primarily consists of Ally’s centralized treasury activities, the residual impacts of the company’s corporate funds transfer pri cing and asset liability management activities, and the amortization of the discount associated with debt issuances and bond exchanges . C orporate and Other also includes the Ally Corporate Finance business, certain equity investments and reclassifications, eliminations between the repo rta ble operating segments, and overhead previously allocated to operations that have since been sold or discontinued. 6) Controllable expenses include employee related costs, consulting and legal fees, marketing, information technology, facility, portfolio servicing a nd restructuring expenses. 7) U.S. consumer auto originations ▪ GM Subvented – subvented rate new vehicle loans from GM dealers ▪ New Standard – standard rate new vehicle loans from GM and Chrysler dealers ▪ Lease – new vehicle lease originations from all dealers ▪ Used – used vehicle loans from all dealers ▪ Growth – total originations from non - GM/Chrysler dealers (New Growth refers to new vehicle loan originations only) 8) Net charge - off ratios are calculated as annualized net charge - offs divided by average outstanding finance receivables and loans excluding loans measur ed at fair value and loans held - for - sale . 9) Interest rate risk modeling – Ally’s interest rate risk models use dynamic assumptions driven by a number of factors, including the overall level of interest rates and the spread between short - term and long - term interest rates to project changes in Ally’s retail deposit offered rates. Ally’s interest rate risk metrics currently assume a long - term retail deposit beta of greater than 80%. We believe our deposits may ultimately be less sensitive to interest rate changes, which will reduce our overall exposure to rising rates. Assuming a long - term retail deposit beta of 50% ( vs. current assumption of greater than 80%) would result in a consolidated interest rate risk position that is asset sensitive.