Attached files
| file | filename |
|---|---|
| 8-K - FORM 8-K - ARMSTRONG WORLD INDUSTRIES INC | d62176d8k.htm |
| EX-99.1 - EX-99.1 - ARMSTRONG WORLD INDUSTRIES INC | d62176dex991.htm |
 Earnings Call Presentation 3 rd Quarter 2015 October 29, 2015 Exhibit 99.2 |
 2 Our disclosures in this presentation, including without limitation, those relating to future financial results
guidance and the possible separation of our flooring business from our building
products business, and in our other public documents and comments contain
forward-looking statements within the meaning of the Private
Securities Litigation Reform Act. Those statements provide our future
expectations or forecasts and can be identified by our use of words such
as "anticipate," "estimate," "expect," "project," "intend," "plan," "believe," "outlook," "target," "predict," "may," "will," "would," "could," "should,"
"seek," and other words or phrases of similar meaning in
connection with any discussion of future operating or financial performance or the separation of our businesses. Forward-looking statements, by their nature, address matters that are uncertain and involve
risks because they relate to events and depend on circumstances that may or may not
occur in the future. As a result, our actual results may differ
materially from our expected results and from those expressed in our
forward-looking statements. A more detailed discussion of the risks and
uncertainties that may affect our ability to achieve the projected
performance is included in the “Risk Factors” and “Management’s Discussion and Analysis” sections of our reports on Forms 10-K and 10-Q filed with the SEC. Forward-looking statements speak
only as of the date they are made. We undertake no obligation to update any
forward-looking statements beyond what is required under applicable
securities law. In addition, we will be referring to non-GAAP
financial measures within the meaning of SEC Regulation G. A
reconciliation of the differences between these measures with the most directly
comparable financial measures calculated in accordance with GAAP are
included within this presentation and available on the Investor
Relations page of our website at www.armstrong.com.
The guidance in this presentation is only effective as of the date given, October 29,
2015, and will not be updated or affirmed unless and until we publicly
announce updated or affirmed guidance. Safe Harbor
Statement |
 3 All figures throughout the presentation are in $ millions unless otherwise noted. Figures may not add due to rounding.
• When reporting our financial results within this presentation, we make several adjustments.
Management uses the non-GAAP measures below in managing the business and believes
the adjustments provide meaningful comparisons of operating performance
between periods. As reported results will be footnoted throughout
the presentation. Basis of Presentation Explanation
• We report in comparable dollars to remove the effects of currency translation on the P&L. The budgeted exchange rate for 2015 is used for all currency translations in 2015 and prior years. Guidance is presented using the 2015 budgeted exchange rate for the year. • We remove the impact of discrete expenses and income. Examples include plant closures, restructuring actions, separation costs and other large unusual items. We also remove the non- cash impact of our U.S. Pension Plan. • Taxes for normalized Net Income and EPS are calculated using a constant 39% for 2015 guidance, and 2015 and 2014 results, which are based on the expected full year historical tax rate. What Items Are Adjusted Comparable Dollars Other Adjustments Net Sales Yes No Gross Profit Yes Yes SG&A Expense Yes Yes Equity Earnings Yes Yes Operating Income Yes Yes Net Income Yes Yes Cash Flow No No Return on Capital Yes Yes EBITDA Yes Yes |
 4 Key Metrics – Third Quarter 2015 2015 2014 Variance Net Sales (1) $679 $670 1.3% Operating Income (2) 98 93 5.3% % of Sales 14.5% 13.9% 60 bps EBITDA 128 122 5.2% % of Sales 18.9% 18.2% 70 bps Earnings Per Share (3) $0.80 $0.88 (8.8%) Free Cash Flow 64 60 7.6% Net Debt 764 902 (138) ROIC (4) 5.8% 8.4% (260 bps) (1) As reported Net Sales: $659 million in 2015 and $679 million in 2014 (2) As reported Operating Income: $80 million in 2015 and $86 million in 2014 (3) As reported EPS: $0.54 in 2015 and $0.84 in 2014 (4) Unadjusted |
 5 Third Quarter 2015 vs. PY– Adjusted EBITDA to Reported Net Income 2015 2014 V EBITDA– Adjusted $128 $122 $6 Depreciation and Amortization (30) (29) (1) Operating Income – Adjusted $98 $93 $5 Non-cash Impact of U.S. Pension 6 - 6 Separation Expenses 7 - 7 Cost Reduction Initiatives 1 6 (5) Foreign Exchange Movements 4 1 3 Operating Income – As Reported $80 $86 ($6) Interest/Other (Expense) (25) (13) (12) EBT $55 $73 ($18) Tax (Expense) (25) (26) 1 Net Income $30 $47 ($17) |
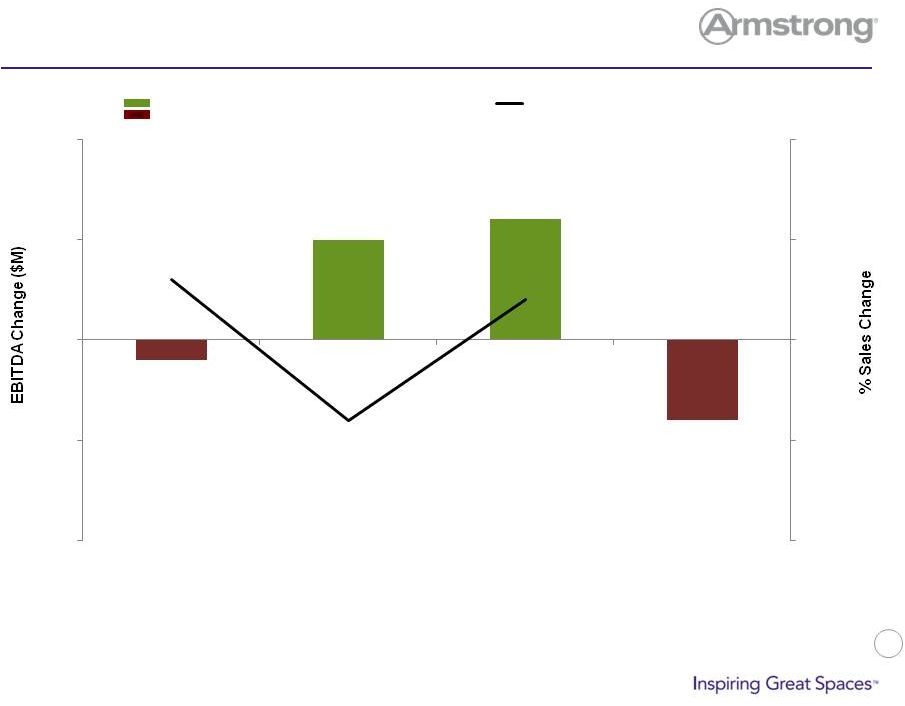 6 Third Quarter Sales and EBITDA by Segment – 2015 vs. Prior Year (1) 5 6 (4) 3% (4%) 2% (10%) (5%) 0% 5% 10% (10) (5) - 5 10 EBITDA Change (Left-hand scale) % Change in Sales (Right-hand scale) Resilient Flooring Wood Flooring Building Products Corporate |
 7 • On a comparable foreign exchange basis sales increased 2% as favorable price and mix performance offset volume declines primarily in emerging markets • Continued sales growth momentum in Architectural Specialties • Reflects impact of prior price increases • Driven by lower volumes, predominantly in EMEA • Reflects the benefit of lower freight and energy costs and productivity in the Americas • Reflects higher earnings from our WAVE joint venture Building Products Third Quarter Results Favorable price and mix performance and lower manufacturing and input costs drive over 100 bps of margin improvement in the Americas despite lower volumes $225 $219 $87 $87 $39 $37 Q3 2015 Q3 2014 Net Sales Americas EMEA Pacific Rim $351
$343 Key Highlights Q3 2014 Adjusted EBITDA $ 103M Price & Mix 5 Volume (4) Manufacturing & Input Costs 3 WAVE 1 D&A/Other 1 Q3 2015 Adjusted EBITDA $ 109M |
 8 • On a comparable foreign exchange basis sales increased 3% driven by volume growth in the Americas residential and commercial businesses as well as double digit improvement in the Pacific Rim; more than offsetting unfavorable price and mix. • Volume growth in the Americas was partially aided by favorable market share shifts as a result of competitive product availability issues and our service proposition relative to competition. • Broad based volume growth in the Americas residential and commercial businesses as well the Pacific Rim • Reflects the benefit of favorable input costs • Higher SG&A expense to support go-to-market initiatives Resilient Third Quarter Results Broad based volume growth and favorable input costs drive margin performance $171 $168 $25 $22 Q3 2015 Q3 2014 Net Sales Americas Pacific Rim $196
$190 Key Highlights Q3 2014 Adjusted EBITDA $ 25M Price & Mix (7) Volume 7 Manufacturing & Input Costs 7 SG&A (8) Q3 2015 Adjusted EBITDA $ 24M |
 9 • Despite improvements in mix sales declined driven by unfavorable price performance and lower volumes • Lower volumes were the result of engineered wood product availability challenges • Driven by unfavorable price, despite mix improvement • Due to engineered wood product availability challenges • Reflects the benefit of favorable input costs Wood Third Quarter Results Favorable input costs drive margin improvement $132 $137 Q3 2015 Q3 2014 Net Sales Americas $132
$137 Key Highlights Q3 2014 Adjusted EBITDA $ 9M Price & Mix (4) Volume (2) Manufacturing & Input Costs 12 SG&A (1) Q3 2015 Adjusted EBITDA $ 14M |
 10 $1 $27 $1 $1 $122 $0 $20 $40 $60 $80 $100 $120 $140 $160 2014 Price/Mix Volume Input Costs Mfg Cost SG&A WAVE Change in D&A 2015 ($6) $128 ($6) ($12) EBITDA Bridge – Third Quarter 2015 vs. Prior Year |
 11 $16 $8 $0 $0 $64 $60 $0 $20 $40 $60 $80 $100 2014 Cash Earnings Working Capital Capex Interest Expense WAVE Dividends Other 2015 ($14) ($6) Free Cash Flow – Third Quarter 2015 vs. Prior Year |
 12 Key Metrics – September YTD 2015 2015 2014 Variance Net Sales (1) $1,892 $1,905 (0.7%) Operating Income (2) 226 221 2.1% % of Sales 11.9% 11.6% 30 bps EBITDA 315 309 1.9% % of Sales 16.6% 16.2% 40 bps Earnings Per Share (3) $1.99 $1.97 0.7% Free Cash Flow 99 14 Favorable (1) As reported Net Sales: $1,843 million in 2015 and $1,928 million in 2014 (2) As reported Operating Income: $179 million in 2015 and $203 million in 2014 (3) As reported EPS: $1.14 in 2015 and $1.64 in 2014 (4) Unadjusted |
 13 September YTD Sales and EBITDA by Segment – 2015 vs. Prior Year (4) 2 7 1 2% (8%) 1% (15%) (10%) (5%) 0% 5% 10% (15) (10) (5) - 5 10 Resilient Flooring Wood Flooring Building Products Corporate EBITDA Change (Left-hand scale) % Change in Sales (Right-hand scale) |
 14 $315 $309 $200 $220 $240 $260 $280 $300 $320 $340 $360 $380 $400 2014 Price/Mix Volume Input Costs Mfg Cost SG&A WAVE Change in D&A 2015 $42 ($2) ($22) EBITDA Bridge – September YTD 2015 vs. Prior Year ($20) $10 ($3) $1 |
 15 ($27) $58 $54 $1 ($3) $2 $99 $14 ($40) ($20) $0 $20 $40 $60 $80 $100 $120 2014 Cash Earnings Working Capital Capex Interest Expense WAVE Dividends Other 2015 Free Cash Flow – September YTD 2015 vs. Prior Year |
 16 2015 Estimate Range (1) 2014 (2) Variance Net Sales (3) 2,400 to 2,450 2,515 (5%) to (3%) Operating Income (4) 250 to 270 271 (8%) to 0% EBITDA 370 to 390 389 (5%) to 0% Earnings Per Share (5) $2.15 to $2.35 $2.38 (10%) to (1%) (1) Guidance is presented using 2015 budgeted foreign exchange rates (2) 2014 results are presented using 2015 budgeted foreign exchange rates (3) 2015 and 2014 net sales include the impact of foreign exchange (4) As reported Operating Income: $180 - $200 million in 2015 and $239 million 2014 (5) As reported earnings per share: $0.85 - $1.00 in 2015 and $1.83 in 2014 Key Metrics – Guidance 2015 |
 17 2015 Financial Outlook Sales (1) $1,220-$1,250 million; EBITDA $335-$350 million Sales (1) $1,180-$1,200 million; EBITDA $100-$110 million EBITDA ($65) – ($70) $35 - $45 million; Adjusted long-term ETR of ~39% (2) $155 - $165 million $25 million, US pension expense, non-cash $20 - $35 million, transaction costs ABP Segment* AFP Segment* Cash Taxes/ETR Capital Spending* Exclusions from EBITDA (1) Net sales include foreign exchange impact (2) As reported ETR of 62% for 2015 * Changed from July Outlook Corporate Segment |
 18 $62 $39 $93 $0 $20 $40 $60 $80 $100 2014 Adjusted EBITDA D&A/Fx Adjustments to Operating Income 2014 As Reported Operating Income - 10K Corporate Allocations Other* 2014 As Reported Operating Income - Form 10 ($2) ($21) ($4) ($27) Form 10 Historical Earnings Bridge – Full Year 2014 Resilient Flooring Wood Flooring * Other consists of charges related to AFI not previously recorded at a consolidated level as they did not meet the prior materiality
threshold ($13)
($23) ($15) ($13) ($28) $21 ($40) ($20) $0 $20 $40 2014 Adjusted EBITDA D&A/Fx Adjustments to Operating Income 2014 As Reported Operating Income - 10K Corporate Allocations 2014 As Reported Operating Income - Form 10 |
 19 Appendix |
 20 September YTD 2015 vs. PY– Adjusted EBITDA to Reported Net Income 2015 2014 V EBITDA– Adjusted $315 $309 $6 Depreciation and Amortization (89) (88) (1) Operating Income – Adjusted $226 $221 $5 Non-cash Impact of U.S. Pension 19 1 18 Separation Expenses 17 - 17 Multilayered Wood Flooring Duty 4 - 4 Cost Reduction Initiatives (1) 10 (11) Impairment - 4 (4) Foreign Exchange Movements 8 3 5 Operating Income – As Reported $179 $203 ($24) Interest/Other (Expense) (45) (41) (4) EBT $134 $162 ($28) Tax (Expense) (70) (71) 1 Net Income $64 $91 ($27) |
 21 Consolidated Results Third Quarter 2015 Reported Comparability (1) Adjustments Fx (2) Adj 2015 Adjusted 2014 Reported Comparability (1) Adjustments Fx (2) Adj 2014 Adjusted Net Sales 659 - 20 679 679 - (9) 670 Operating Income 80 14 4 98 86 6 1 93 EPS $0.54 $0.21 $0.05 $0.80 $0.84 $0.02 $0.02 $0.88 (1) See earnings press release and 10-Q for additional detail on comparability adjustments
(2) Eliminates impact of foreign exchange movements September YTD 2015 Reported Comparability (1) Adjustments Fx (2) Adj 2015 Adjusted 2014 Reported Comparability (1) Adjustments Fx (2) Adj 2014 Adjusted Net Sales 1,843 - 49 1,892 1,928 - (23) 1,905 Operating Income 179 39 8 226 203 15 3 221 EPS $1.14 $0.76 $0.09 $1.99 $1.64 $0.30 $0.03 $1.97 |
 22 Segment Operating Income (Loss) Third Quarter 2015 Reported Comparability (1) Adjustments 2015 Adjusted 2014 Reported Comparability (1) Adjustments 2014 Adjusted Building Products 90 1 91 87 - 87 Resilient Flooring 14 3 17 15 2 17 Wood Flooring 10 1 11 2 4 6 Unallocated Corporate (Expense) Income (35) 14 (21) (18) 1 (17) September YTD 2015 Reported Comparability (1) Adjustments 2015 Adjusted 2014 Reported Comparability (1) Adjustments 2014 Adjusted Building Products 214 1 215 209 3 212 Resilient Flooring 43 4 47 46 5 51 Wood Flooring (2) 12 6 18 5 9 14 Unallocated Corporate (Expense) Income (90) 36 (54) (57) 1 (56) (1) Eliminates impact of foreign exchange movements and other discrete items; see earnings press release and 10-Q for additional
detail. (2)
Includes a $4 million charge recorded in the second quarter of 2015 resulting from new
duty rates assigned by the U.S. Department of Commerce on multilayered wood
importers and a $1 million gain recorded in the second quarter of 2014 related to a
refund of previously paid duties on imports of engineered wood flooring. |
 23 Cash Flow Third Quarter September YTD ($ millions) 2015 2014 2015 2014 Net cash from operations $85 $89 $144 $111 Net cash (used for) investing (21) (29) (45) (97) Free Cash Flow $64 $60 $99 $14 Cash flow includes cash flows attributable to the European flooring business |