Attached files
| file | filename |
|---|---|
| 8-K - FORM 8-K - WILLIS TOWERS WATSON PLC | d91563d8k.htm |
| EX-99.1 - EX-99.1 - WILLIS TOWERS WATSON PLC | d91563dex991.htm |
  THIRD QUARTER 2015 RESULTS Willis Group Holdings October 28, 2015 – Version 14 Exhibit 99.2 |
 Important
disclosures regarding forward-looking statements 1
This presentation contains certain “forward-looking statements” within the
meaning of Section 27A of the Securities Act of 1933, and Section 21E of the Securities Exchange Act of 1934, which are intended to be covered by the safe harbors created by those laws. These forward-looking statements include information about possible or assumed future
results of our operations. All statements, other than statements of historical facts, included in this document that
address activities, events or developments that we expect or anticipate may occur in the future, including such things as our outlook, potential cost savings and accelerated adjusted operating margin and adjusted earnings per share growth, future capital expenditures,
growth in commissions and fees, business strategies, competitive
strengths, goals, the benefits of new initiatives, growth of our business and operations, plans, and references to future successes are forward-looking statements. Also, when we use the words such
as ‘anticipate’, ‘believe’, ‘estimate’,
‘expect’, ‘intend’, ‘plan’, ‘probably’, or similar expressions, we are making forward-looking statements. There are important uncertainties, events and factors that could cause our actual results or performance to differ materially from those in the
forward-looking statements contained in this document, including the
following: the impact of any regional, national or global political, economic, business,
competitive, market, environmental or regulatory conditions on our global business operations; the impact of current global economic conditions on our results of operations and financial condition, including as a result of those associated with the Eurozone, any
insolvencies of or other difficulties experienced by our clients, insurance
companies or financial institutions; our ability to implement and fully realize
anticipated benefits of our growth strategy and revenue generating initiatives; our ability to implement and realize anticipated benefits of any cost-savings or operational improvement initiative, including our ability to achieve expected savings and other benefits from the
multi-year Operational Improvement Program as a result of unexpected
costs or delays and demand on managerial, operational and administrative resources
and/or macroeconomic factors affecting the program as well as the impact of the program on business processes and competitive dynamics; our ability to consummate transactions, including the proposed Towers Watson merger and the Gras Savoye acquisition; our
ability to obtain requisite approvals and satisfy other conditions to the
consummation of proposed transactions, including obtaining regulatory and shareholder approvals for the proposed Towers Watson transaction and regulatory approval for the Gras Savoye acquisition; our ability to successfully integrate our operations and employees with those of Towers Watson and any acquired business, including
Gras Savoye and Miller Insurance Services LLP; our ability to realize any
anticipated benefit of any acquisition or other transaction in which we may engage, including any revenue growth, operational efficiencies, synergies or cost savings; the potential impact of the
consummation of the proposed Towers Watson transaction on relationships, including with
employees, suppliers, customers and competitors; the diversion of management’s time and attention while the Towers Watson transaction or Gras Savoye acquisition is pending; the federal income tax consequences of the Towers Watson transaction and the enactment
of additional state, federal, and/or foreign regulatory and tax laws and
regulations; volatility or declines in insurance markets and premiums on which our commissions are based, but which we do not control; our ability to compete in our industry; material changes in
commercial property and casualty markets generally or the availability of insurance
products or changes in premiums resulting from a catastrophic event, such as a hurricane; our ability to retain key employees and clients and attract new business, including at a time when the Company is pursuing various strategic initiatives; our ability to develop new
products and services; the practical challenges and costs of complying
with a wide variety of foreign laws and regulations and any related changes, given the global scope of our operations and those of any acquired business and the associated risks of non-compliance
and regulatory enforcement action; our ability to develop and implement technology
solutions and invest in innovative product offerings in an efficient and effective manner; fluctuations in our earnings as a result of potential changes to our valuation allowance(s) on our deferred tax assets; changes in the tax or accounting treatment of our operations
and fluctuations in our tax rate; rating agency actions, including a
downgrade to our credit rating, that could inhibit our ability to borrow funds or the pricing thereof and in certain circumstances cause us to offer to buy back some of our debt; our inability to exercise full
management control over our associates; our ability to continue to manage our
significant indebtedness; the timing or ability to carry out share repurchases and redemptions which is based on many factors, including market conditions, the Company’s financial position, earnings, share price, capital requirements, and other investment
opportunities (including mergers and acquisitions and related financings); the timing or ability to carry out refinancing or take other steps to manage our capital and the limitations in our long-term debt agreements that
may restrict our ability to take these actions; any material fluctuations
in exchange and interest rates that could adversely affect expenses and revenue; a
significant decline in the value of investments that fund our pension plans or changes in our pension plan liabilities or funding obligations; our ability to receive dividends or other distributions in needed amounts from our subsidiaries; our involvement in and the results
of any regulatory investigations, legal proceedings and other
contingencies; our exposure to potential liabilities arising from errors and omissions
and other potential claims against us; underwriting, advisory or reputational risks associated with our business; the interruption or loss of our information processing systems, data security breaches or failure to maintain secure information systems; and
impairment of the goodwill in one of our reporting units, in which case we
may be required to record significant charges to earnings.
The foregoing list of factors is not exhaustive and new factors may emerge from time to time that could also affect actual performance and
results. For more detailed information about these and other factors
see also Part I, Item 1A “Risk Factors” included in Willis’ Form 10-K
for the year ended December 31, 2014, and our subsequent filings with the Securities and Exchange Commission. Copies are available online at http://www.sec.gov or on request from the Company. Although we believe that the assumptions underlying our forward-looking statements are reasonable, any of these assumptions, and therefore
also the forward-looking statements based on these assumptions, could
themselves prove to be inaccurate. In light of the significant uncertainties inherent in the forward-looking statements included in this presentation, our inclusion of this information is not a representation or
guarantee by us that our objectives and plans will be achieved. Our
forward-looking statements speak only as of the date made and we will not update these forward-looking statements unless the securities laws require us to do so. In light of these risks, uncertainties and assumptions, the forward-looking events discussed in this presentation
may not occur, and we caution you against unduly relying on these
forward-looking statements.
|
 Important
disclosures regarding non-GAAP measures 2
This presentation contains references to "non-GAAP financial measures" as
defined in Regulation G of SEC rules. We present these measures because we believe they are of interest to the investment community and they provide additional meaningful methods of evaluating certain aspects of the
Company’s operating performance from period to period on a basis that
may not be otherwise apparent on a generally accepted accounting principles
(GAAP) basis. These financial measures should be viewed in addition to, not in
lieu of, the Company’s condensed consolidated income statements and
balance sheet as of the relevant date. Consistent with Regulation G, a
description of such information is provided below and a reconciliation of certain of such items to GAAP information can be found in our periodic filings with the SEC. Our method of calculating these non-GAAP financial
measures may differ from other companies and therefore comparability may
be limited. Definitions of non-GAAP financial measures We believe that investors’ understanding of the Company’s performance is enhanced by our disclosure of the following non-GAAP
financial measures. Our method of calculating these measures may differ
from those used by other companies and therefore comparability may be limited. Organic commissions and fees growth
Organic commissions and fees growth excludes: (i) the impact of
foreign currency movements; (ii) the first twelve months of net commission and fee revenues generated from acquisitions; and (iii) the net commission and fee revenues related to operations disposed of in each period presented,
from reported commissions and fees growth. We believe organic growth in commissions and fees provides a measure that the investment community may find helpful in assessing the performance
of operations that were part of our business in both the current and
prior periods, and provides a measure against which our businesses may be assessed in the future.
Underlying commissions and fees, underlying revenues, underlying total expenses,
underlying salaries and benefits, underlying other operating expenses,
underlying operating income, underlying operating margin, underlying EBITDA, underlying
net income and underlying earnings per diluted share (“Underlying
measures”). Underlying measures are calculated by excluding restructuring costs related to the Operational Improvement Program, impact from the devaluation
of the Venezuelan Bolivar, gains and losses on disposal of operations,
and deferred tax valuation allowances, from the most directly comparable GAAP measures and from third quarter 2015 underlying measures also exclude M&A transaction related costs. Additionally, prior year GAAP measures
have been rebased to current period exchange rates to eliminate the year
over year impact of foreign currency movements. We believe that excluding such items provides a more complete and consistent comparative analysis of our results of operations. Organic revenues, organic total expenses, organic salaries and benefits, organic other operating expenses, organic operating income, organic
operating margin and organic EBITDA (“Organic measures”). Organic measures are calculated by excluding the twelve month impact from acquisitions and disposals (together with the impact of certain items,
including foreign currency movements noted above), from the most directly
comparable GAAP measures. We believe that excluding these items provides
a more complete and consistent comparative analysis of our results of operations. |
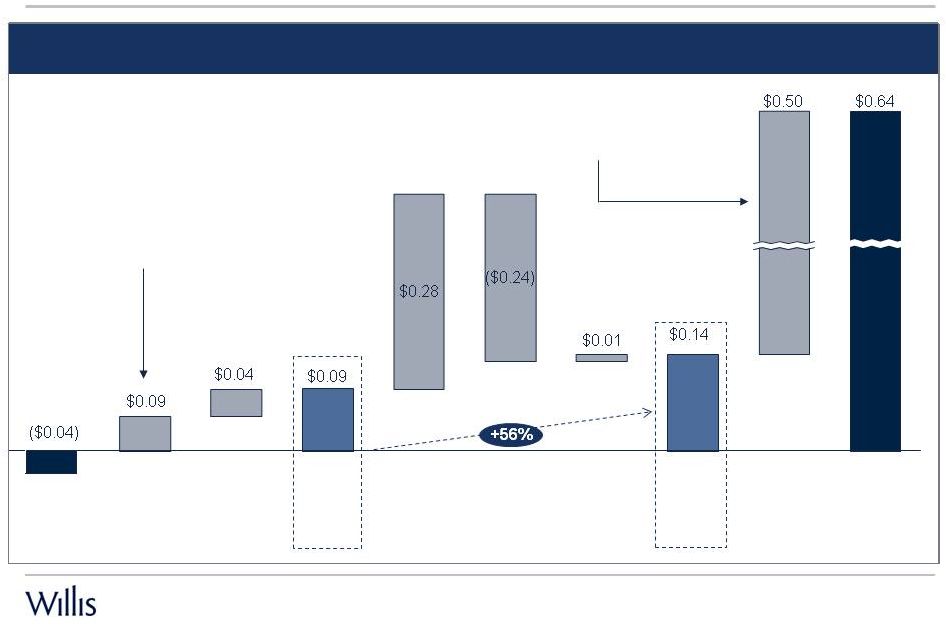 3Q
2015 Reported EPS
Adjusting Items 3Q 2015 Underlying EPS Other Total Operating Expenses Total Revenues 3Q 2014 Underlying EPS Foreign Currency Movements Adjusting Items 3Q 2014 Reported EPS 3Q 2015 EPS growth 3 See important disclosures regarding non-GAAP measures on page 2 and reconciliations starting on page 12
Underlying EPS growth YoY driven by a combination of overall top-line growth coupled with enhanced expense efficiency from the Operational Improvement Program as well as acquisitions
Adjusting items: Operational Improvement Program = ($0.09) Gain on Disposal = $0.07 Devaluation of Venezuelan Bolivar = ($0.01) M&A transaction-related costs = ($0.07) Deferred tax valuation allowance = $0.60 Adjusting items: Operational Improvement Program = $0.08 M&A transaction-related costs = $0.01 |
 3Q 2015
Commissions and fees growth 4
• Growth primarily driven by Willis Capital Markets & Advisory • Reinsurance had low single digit organic growth • Underlying growth primarily driven by Miller • Mid single-digit organic growth led by Willis International and CWR • Flat organic growth in Willis North America partially offset by modest decline in Willis GB • Organic decline in Midwest & West regions as a result of timing of certain businesses and headwind in energy • Construction generated 10% growth in the quarter • Solid growth seen in P&C and Financial Lines, however, this was offset by moderation in Retail and Transport • Reported growth impacted by unfavorable F/X: (5.4)% • Biggest driver: GBP Avg.: 3Q14 = 0.60 ; 3Q15 = 0.65 Diff (7.2)% 3.3% 10.5% 4.1% Group Willis GB Willis Capital, Wholesale and Reinsurance Willis North America Reported Organic Underlying Commentary Willis International • Strong organic growth from LatAm followed by W. Europe and Australasia • Reported growth impacted by unfavorable F/X: (21.2)% • Biggest driver: EUR Avg.: 3Q14 = 0.75; 3Q15 = 0.90 Diff (16.1)% (0.7)% (0.7)% (6.1)% 8.8% 32.6% 27.1% 0.0% (4.0)% (3.8)% 8.6% 29.4% 8.2% See important disclosures regarding non-GAAP measures on page 2 and reconciliations starting on page 12 |
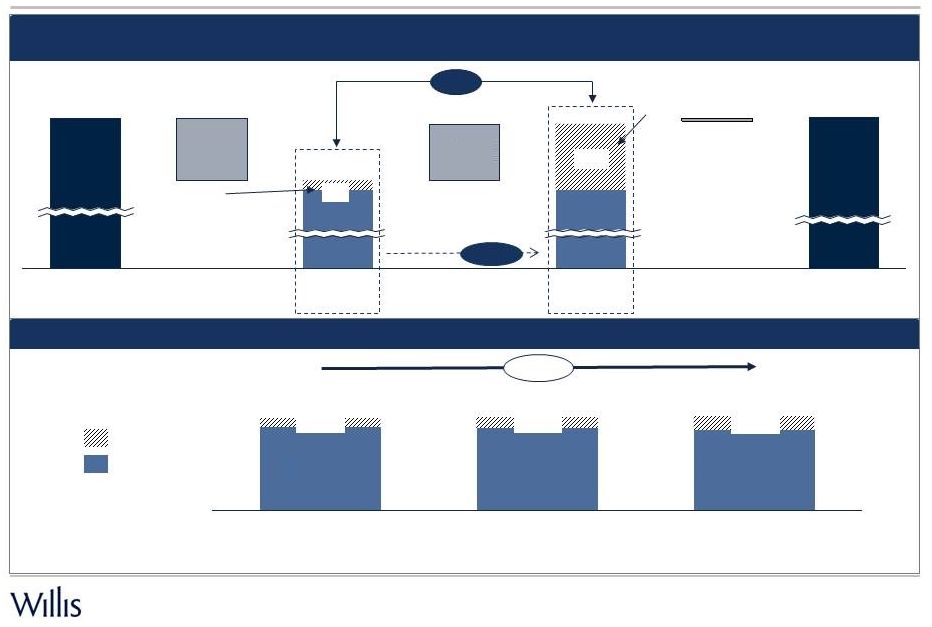
 ($71) $778 3Q 2014 Reported $707 $9 3Q 2014 Underlying Depreciation and Amortization $698 F/X & Adjusting Items 3Q 2015 Reported Other Operating Expenses $819 OIP and M&A Related Expenses $780 Salaries and Benefits 3Q 2015 Underlying $75 $705 $21 Achieved 230 bps of positive organic spread (20 bps of positive underlying spread) driven by
ongoing cost management initiatives
3Q 2015 Total operating expenses
5 $ millions Acquisition & Disposals Acquisitions & Disposals Note: Some percentage changes may differ due to rounding See important disclosures regarding non-GAAP measures on page 2 and reconciliations starting on page 12
1.0% Modest Organic Change $37 $15 $39 Oper. Improvement Program = $24m M&A Related Expenses = $15m F/X = ($52)m M&A = ($2)m Restructuring Charges = ($17)m 10.3% |
 3Q 2015
Salaries and benefits 6
Organic S&B was flat in 3Q15 driven by FTE management initiatives; Underlying S&B
growth driven by higher acquisitions and disposals impact
$569 $570 7.0% 3Q 2015 Underlying 3Q 2015 Reported $569 3Q 2014 Underlying $532 Salaries and Benefits $525 $44 $525 $7 Foreign Currency Movement ($37) 3Q 2014 Reported Acquisitions & Disposals Acquisitions & Disposals $ millions 0.0% Flat organic growth M&A Transaction Related Expense $1 Onshore/offshore FTE trends continue to help optimize cost structure +2.5% 3Q15 18,350 15,500 2,850 4Q14 17,700 15,750 1,950 3Q14 17,900 1,900 Onshore Offshore Total Organic FTEs Total FTEs (includes
acquisitions) 18,300
18,400 19,700 Note: Some percentage changes may differ due to rounding See important disclosures regarding non-GAAP measures on page 2 and reconciliations starting on page 12
$570 $37 16,000 |
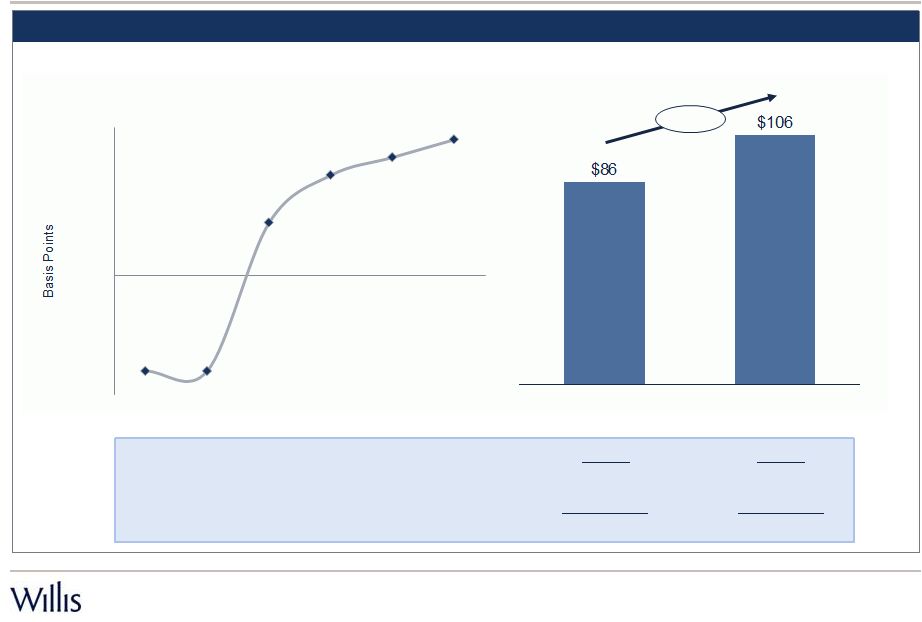 3Q 2015
Organic metrics Continued improvement in both organic spread and organic
EBITDA 7
$ millions 23.3% 3Q 2015 3Q 2014 9.3% Organic Operating Margin 6.9% 3Q15 3Q14 Note: Some percentage changes may differ due to rounding See important disclosures regarding non-GAAP measures on page 2 and reconciliations starting on page 12
Organic Spread Organic EBITDA 18.7% YTD3Q14 20.5% YTD3Q15 -160 -160 90 170 200 230 -200 -100 0 100 200 2Q14 3Q14 4Q14 1Q15 2Q15 3Q15 |
 Operational Improvement Program
8 Spend $36 $140 $140 $125 $440 Savings $11 $80 $150 $250 $490 $325 2Q15 Forecast 2014A 2015E 2016E 2017E Cumulative 2014-2017E Annualized 2018+E $ millions • Operational Improvement Program remains well ahead of initial targets and progress continues against
all stated program metrics
• New low-cost hubs being established in Dalian (China), Tampa (US), Sofia (Europe), and a second hub in
Mumbai (India) Annualized savings of at least $325 million remains on track; FY2015 savings of at least $80 million |
 APPENDICES |
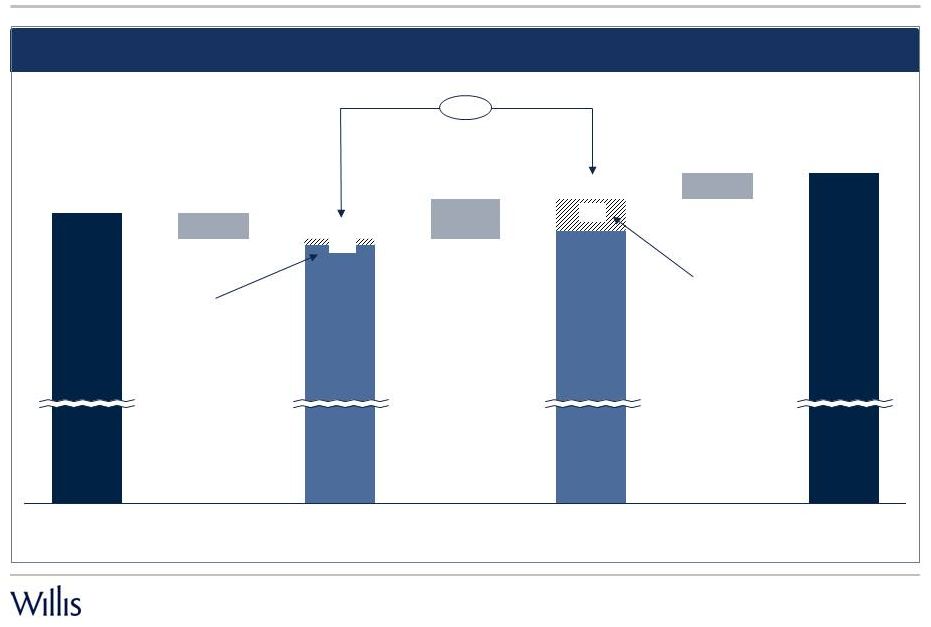 3Q 2015
Other operating expenses 10
Modest ongoing organic expense growth driven strategically by Operational Improvement
Program; Underlying growth driven by acquisitions and disposals
Other Operating Expenses 3Q 2015 Reported $177 14.8% 3Q 2015 Underlying $163 $146 $17 3Q 2014 Underlying $142 $139 $3 F/X and M&A Adjustments ($14) 3Q 2014 Reported $156 Acquisitions & Disposals Acquisitions & Disposals $ millions $14 M&A Transaction Related Expense $21 Note: Some percentage changes may differ due to rounding See important disclosures regarding non-GAAP measures on page 2 and reconciliations starting on page 12 |
 Segment
Structure 11
Willis Re Willis Capital Markets & Advisory Wholesale businesses (e.g., Miller) Willis Portfolio and Underwriting Services Segment structure from January 1, 2015 Willis GB Willis North America Willis International Willis Capital, Wholesale and Reinsurance Comprises Willis’s Great Britain-based Specialty and Retail businesses Focused on serving corporate clients, delivering full range of Willis expertise across Great Britain Focused on serving corporate clients, delivering full range of Willis expertise across the United States and Canada Focused on serving corporate clients, delivering full range of Willis expertise across Asia, CEMEA, Latin America and Western Europe Upon closing of transaction, 100% of Gras Savoye operations will be included |
 Important disclosures regarding non-GAAP measures
12 Reported commissions and fees growth to underlying and organic measures (1) Percentages may differ due to rounding. 2015 2014 Change (1) Foreign currency translation Underlying commissions and fees growth Acquisitions and disposals Organic commissions and fees growth ($ millions) % % % % % Three months ended September 30, 2015 Willis GB $139 $148 (6.1)% (5.4)% (0.7)% 0.0% (0.7)% Willis Capital, Wholesale and Reinsurance $183 144 27.1% (5.5)% 32.6% 23.8% 8.8% Willis North America $308 321 (4.0)% (0.2)% (3.8)% (3.8)% (0.0)% Willis International 211 195 8.2% (21.2)% 29.4% 20.8% 8.6% Total $841 $808 4.1% (6.4)% 10.5% 7.2% 3.3% |
 Important disclosures regarding non-GAAP measures
13 Operating income to underlying and organic operating income 2015 2014 (In millions) 3Q 3Q Total revenue $846 $812 excluding: Foreign currency movements - -48 Underlying revenue $846 $764 Net revenue from acquisitions and disposals (69) (14) Organic revenue $777 $750 Operating income $27 $34 excluding: Restructuring costs 24 17 M&A transaction related costs 15 2 Foreign currency movements - 4 Underlying operating income $66 $57 Net operating income from acquisitions and disposals 6 (5) Organic operating income $72 $52 Operating margin (operating income as a percentage of total revenue) 3.2% 4.2% Underlying operating margin (underlying operating income as a percentage of underlying total revenue) 7.8% 7.5% Organic operating margin (organic operating income as a percentage of organic total revenue) 9.3% 6.9% Note: In the second quarter 2015, the definition of underlying measures was modified to exclude the impact from M&A transaction-related
costs. Prior period results, which include $7 million of such expenses in
the first quarter of 2015 and $2 million of such expenses in the third quarter of 2014, have been restated. Full year results will be presented in line with the updated definition. |
 Important disclosures regarding non-GAAP measures
14 Net income (loss) to underlying net income 2015 2014 (In millions, except per share data) 3Q 3Q Net income $117 ($7) Excluding the following, net of tax: Operational improvement program 17 14 M&A transaction related expenses 13 2 Loss (Gain) on disposal of operations (14) - Venezuelan currency devaluation 2 - Deferred tax valuation allowance (110) - Foreign currency movements - 7 Underlying net income $25 $16 Diluted shares outstanding 182 178 Net income per diluted share $0.64 ($0.04) Underlying net income per diluted share $0.14 $0.09 Note: In the second quarter 2015, the definition of underlying measures was modified to exclude the impact from M&A transaction-related
costs. Prior period results, which include $7 million of such expenses in
the first quarter of 2015 and $2 million of such expenses in the third quarter of 2014, have been restated. Full year results will be presented in line with the updated definition. |
 Important disclosures regarding non-GAAP measures
15 Net income to underlying and organic EBITDA 2015 2014 3Q 3Q Net income attributable to Willis Group Holdings $117 ($7) Excluding: Net income attributable to noncontrolling interests (1) (1) Interest in earnings (losses) of associates, net of tax (3) (3) Income taxes (112) 2 Interest expense 35 34 Other expense (income), net (9) 9 Depreciation 25 23 Amortization 23 13 EBITDA $75 $70 Excluding: Restructuring costs 24 17 M&A transaction related costs 15 2 Foreign currency movements - 1 Underlying EBITDA $114 $90 Net EBITDA from acquisitions and disposals (8) (4) Organic EBITDA $106 $86 Note: In the second quarter 2015, the definition of underlying measures was modified to exclude the impact from M&A transaction-related
costs. Prior period results, which include $7 million of such expenses in
the first quarter of 2015 and $2 million of such expenses in the third quarter of 2014, have been restated. Full year results will be presented in line with the updated definition. |
 Important disclosures regarding non-GAAP measures
16 Reported total expenses, salaries and benefits and other operating expenses to underlying and
organic measures 2015 2014 (In millions) 3Q 3Q Reported total expenses $819 $778 Excluding: Restructuring costs (24) (17) M&A transaction related expenses (15) (2) Foreign currency movements - (52) Underlying total expenses $780 $707 Net expenses from acquisitions and disposals (75) (9) Organic total expenses $705 $698 Reported salaries and benefits $570 $569 Excluding: M&A transaction related expenses (1) - Foreign currency movements - (37) Underlying salaries and benefits $569 $532 Net expenses from acquisitions and disposals (44) (7) Organic Salaries and benefits $525 $525 Reported other operating expenses $177 $156 Excluding: M&A transaction related expenses (14) (2) Foreign currency movements - (12) Underlying other operating expenses $163 $142 Net expenses from acquisitions and disposals (17) (3) Organic other operating expenses $146 $139 Note: In the second quarter 2015, the definition of underlying measures was modified to exclude the impact from M&A transaction-related
costs. Prior period results, which include $7 million of such expenses in
the first quarter of 2015 and $2 million of such expenses in the third quarter of 2014, have been restated. Full year results will be presented in line with the updated definition. |
 IR
Contacts
Media Contact Matt Rohrmann
Tel: +1 212 915-8180
Email: matt.rohrmann@willis.com
17 Juliet Massey Tel: +44 7984 156 739 Email: juliet.massey@willis.com |