Attached files
| file | filename |
|---|---|
| EX-99.1 - EXHIBIT 99.1 - CIRRUS LOGIC, INC. | a51211074ex99_1.htm |
| 8-K - CIRRUS LOGIC, INC. 8-K - CIRRUS LOGIC, INC. | a51211074.htm |
Exhibit 99.2
1 October 28, 2015 Letter to Shareholders Q2 FY16 FY13 CIRRUS LOGIC, INC. 800 WEST SIXTH STREET, AUSTIN, TEXAS 78701
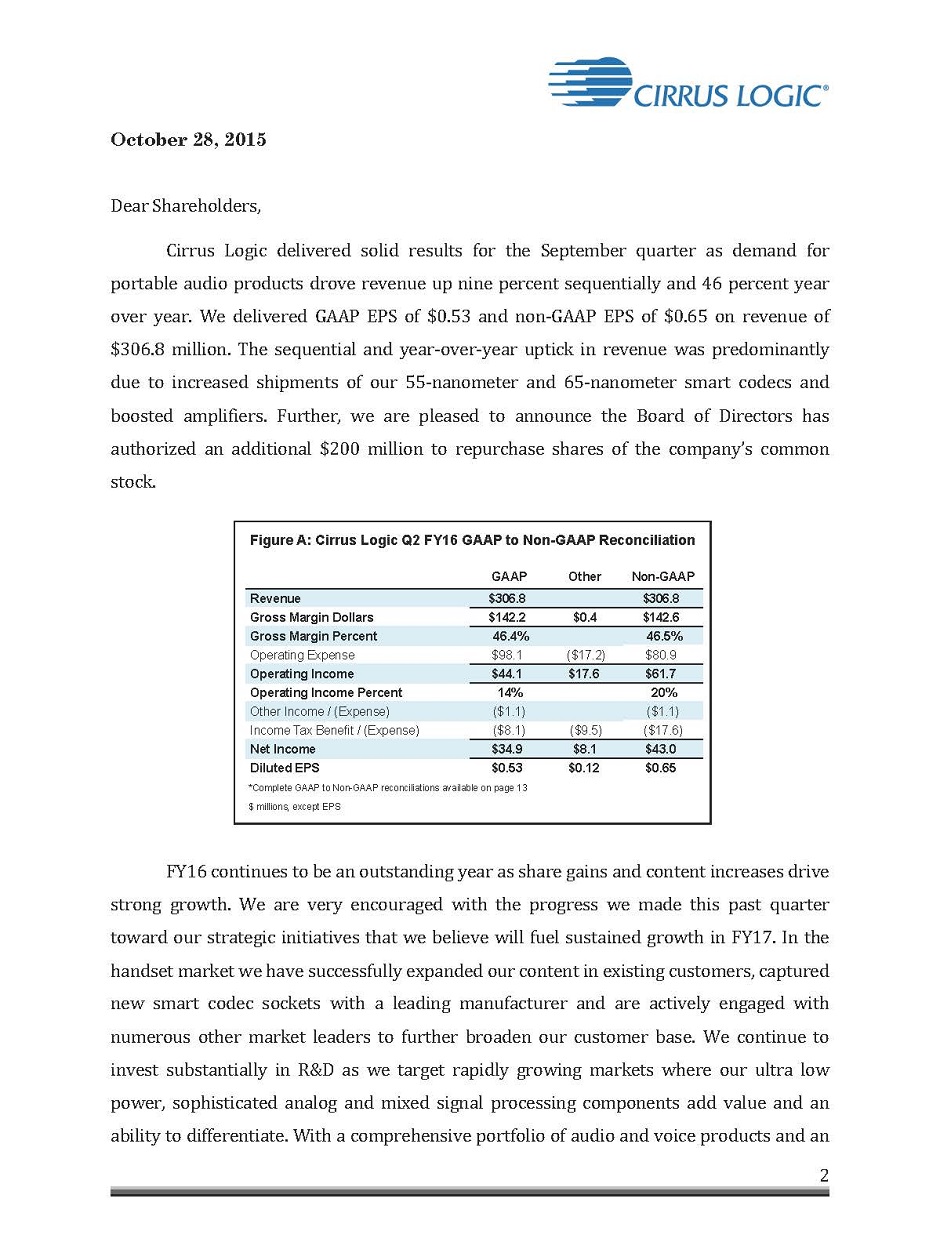
2 October 28, 2015 Dear Shareholders, Cirrus Logic delivered solid results for the September quarter as demand for portable audio products drove revenue up nine percent sequentially and 46 percent year over year. We delivered GAAP EPS of $0.53 and non--‐GAAP EPS of $0.65 on revenue of $306.8 million. The sequential and year--‐over--‐year uptick in revenue was predominantly due to increased shipments of our 55--‐nanometer and 65--‐nanometer smart codecs and boosted amplifiers. Further, we are pleased to announce the Board of Directors has authorized an additional $200 million to repurchase shares of the company’s common stock. FY16 continues to be an outstanding year as share gains and content increases drive strong growth. We are very encouraged with the progress we made this past quarter toward our strategic initiatives that we believe will fuel sustained growth in FY17. In the handset market we have successfully expanded our content in existing customers, captured new smart codec sockets with a leading manufacturer and are actively engaged with numerous other market leaders to further broaden our customer base. We continue to invest substantially in R&D as we target rapidly growing markets where our ultra low power, sophisticated analog and mixed signal processing components add value and an ability to differentiate. With a comprehensive portfolio of audio and voice products and an Figure A: Cirrus Logic Q2 FY16 GAAP to Non-GAAP Reconciliation GAAP Other Non-GAAP Revenue $306.8 $306.8 Gross Margin Dollars $142.2 $0.4 $142.6 Gross Margin Percent 46.4% 46.5% Operating Expense $98.1 ($17.2) $80.9 Operating Income $44.1 $17.6 $61.7 Operating Income Percent 14% 20% Other Income / (Expense) ($1.1) ($1.1) Income Tax Benefit / (Expense) ($8.1) ($9.5) ($17.6) Net Income $34.9 $8.1 $43.0 Diluted EPS $0.53 $0.12 $0.65 *Complete GAAP to Non-GAAP reconciliations available on page 12 $ millions, except EPS
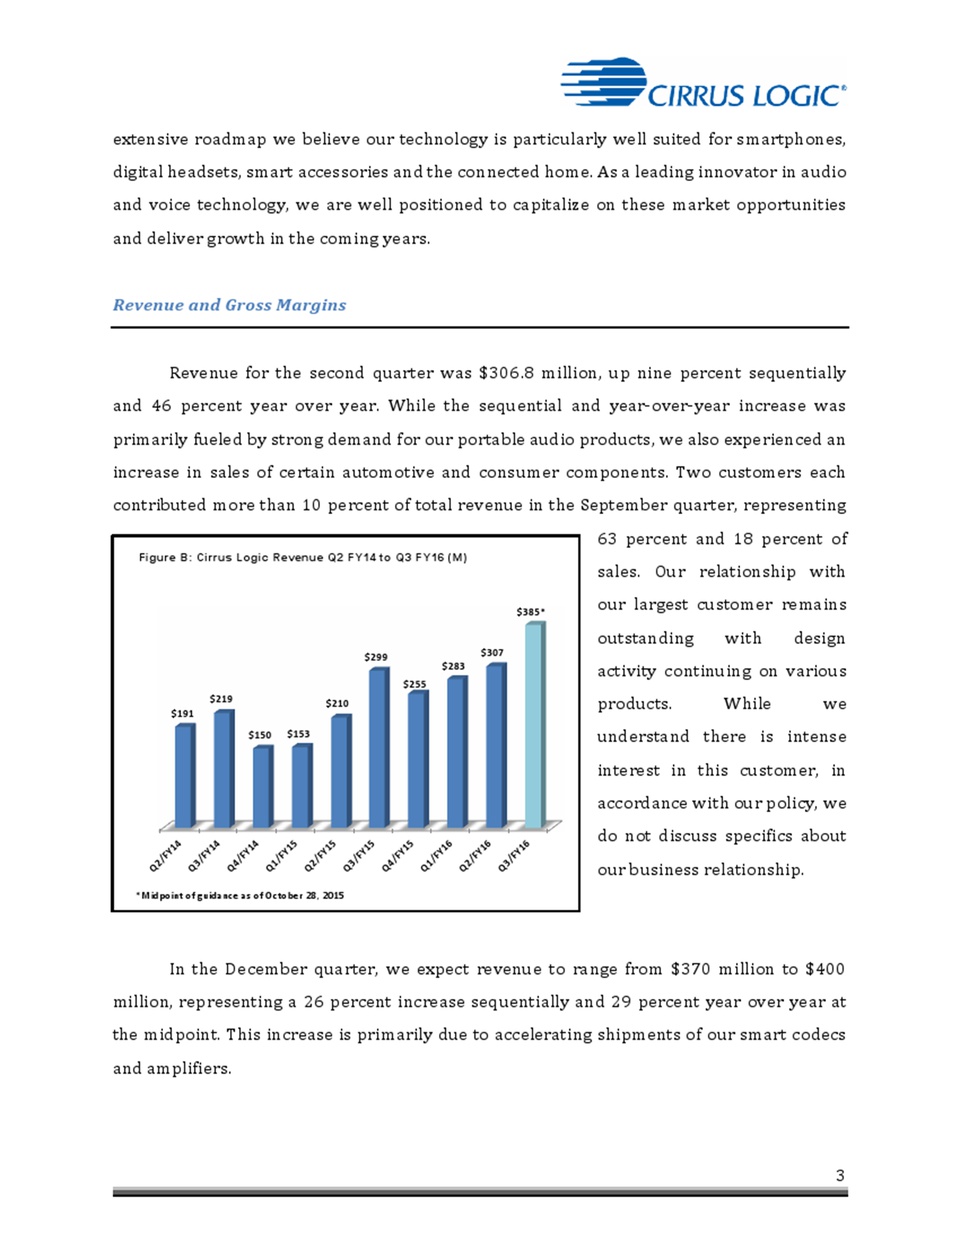
3 extensive roadmap we believe our technology is particularly well suited for smartphones, digital headsets, smart accessories and the connected home. As a leading innovator in audio and voice technology, we are well positioned to capitalize on these market opportunities and deliver growth in the coming years. Revenue and Gross Margins Revenue for the second quarter was $306.8 million, up nine percent sequentially and 46 percent year over year. While the sequential and year--‐over--‐year increase was primarily fueled by strong demand for our portable audio products, we also experienced an increase in sales of certain automotive and consumer components. Two customers each contributed more than 10 percent of total revenue in the September quarter, representing 63 percent and 18 percent of sales. Our relationship with our largest customer remains outstanding with design activity continuing on various products. While we understand there is intense interest in this customer, in accordance with our policy, we do not discuss specifics about our business relationship. In the December quarter, we expect revenue to range from $370 million to $400 million, representing a 26 percent increase sequentially and 29 percent year over year at the midpoint. This increase is primarily due to accelerating shipments of our smart codecs and amplifiers. Q2/FY14 Q3/FY14 Q4/FY14 Q1/FY15 Q2/FY15 Q3/FY15 Q4/FY15 Q1/FY16 Q2/FY16 Q3/FY16 $191 $219 $150 $153 $210 $299 $255 $283 $307 $385* *Midpoint of guidance as of October 28, 2015 Figure B: Cirrus Logic Revenue Q2 FY14 to Q3 FY16 (M)
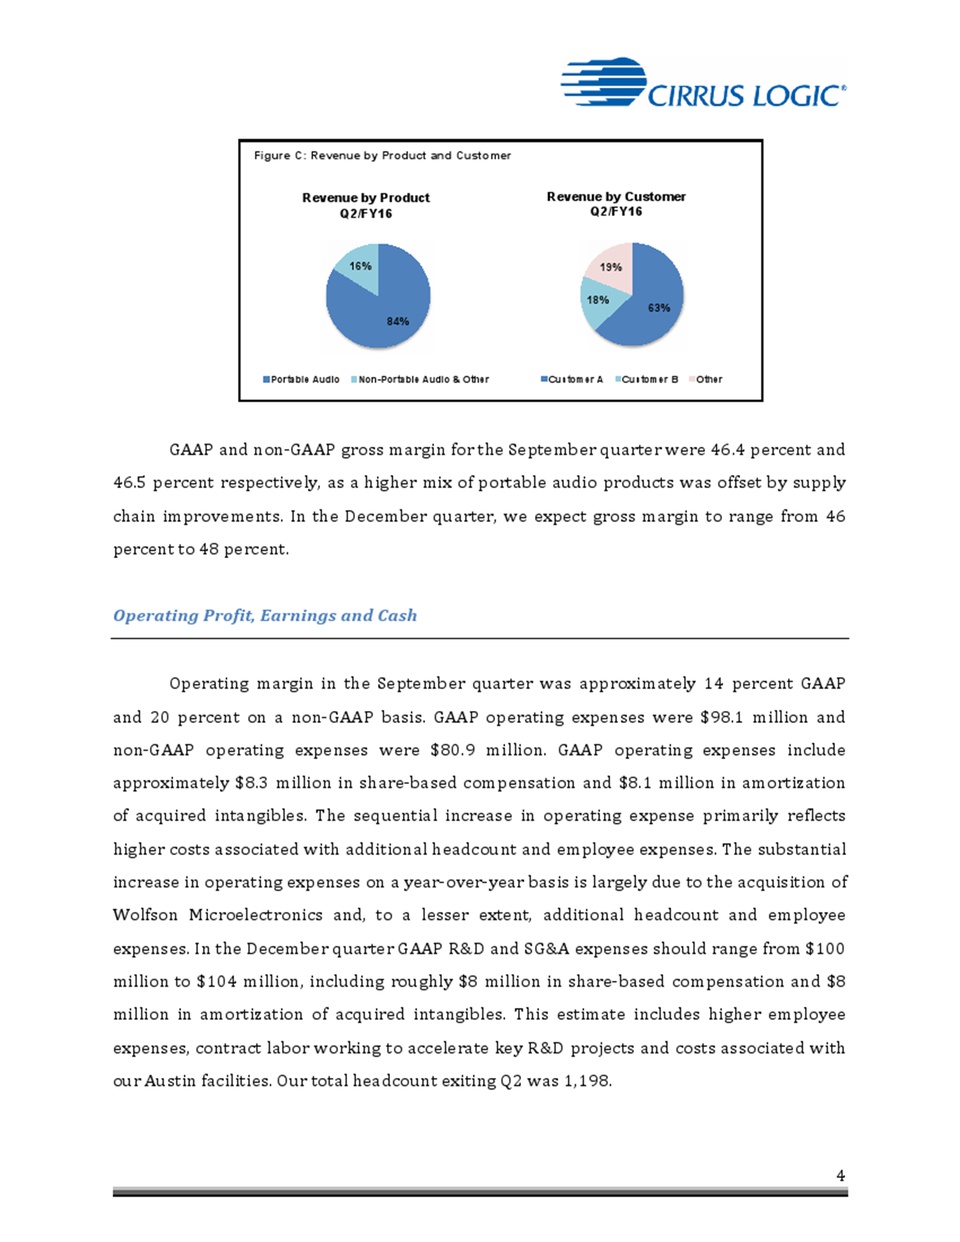
4 GAAP and non--‐GAAP gross margin for the September quarter were 46.4 percent and 46.5 percent respectively, as a higher mix of portable audio products was offset by supply chain improvements. In the December quarter, we expect gross margin to range from 46 percent to 48 percent. Operating Profit, Earnings and Cash Operating margin in the September quarter was approximately 14 percent GAAP and 20 percent on a non--‐GAAP basis. GAAP operating expenses were $98.1 million and non--‐GAAP operating expenses were $80.9 million. GAAP operating expenses include approximately $8.3 million in share--‐based compensation and $8.1 million in amortization of acquired intangibles. The sequential increase in operating expense primarily reflects higher costs associated with additional headcount and employee expenses. The substantial increase in operating expenses on a year--‐over--‐year basis is largely due to the acquisition of Wolfson Microelectronics and, to a lesser extent, additional headcount and employee expenses. In the December quarter GAAP R&D and SG&A expenses should range from $100 million to $104 million, including roughly $8 million in share--‐based compensation and $8 million in amortization of acquired intangibles. This estimate includes higher employee expenses, contract labor working to accelerate key R&D projects and costs associated with our Austin facilities. Our total headcount exiting Q2 was 1,198. Figure C: Revenue by Product and Customer 63% 18% 19% Revenue by Customer Q2/FY16 Customer A Customer B Other 84% 16% Revenue by Product Q2/FY16 Portable Audio Non-Portable Audio & Other
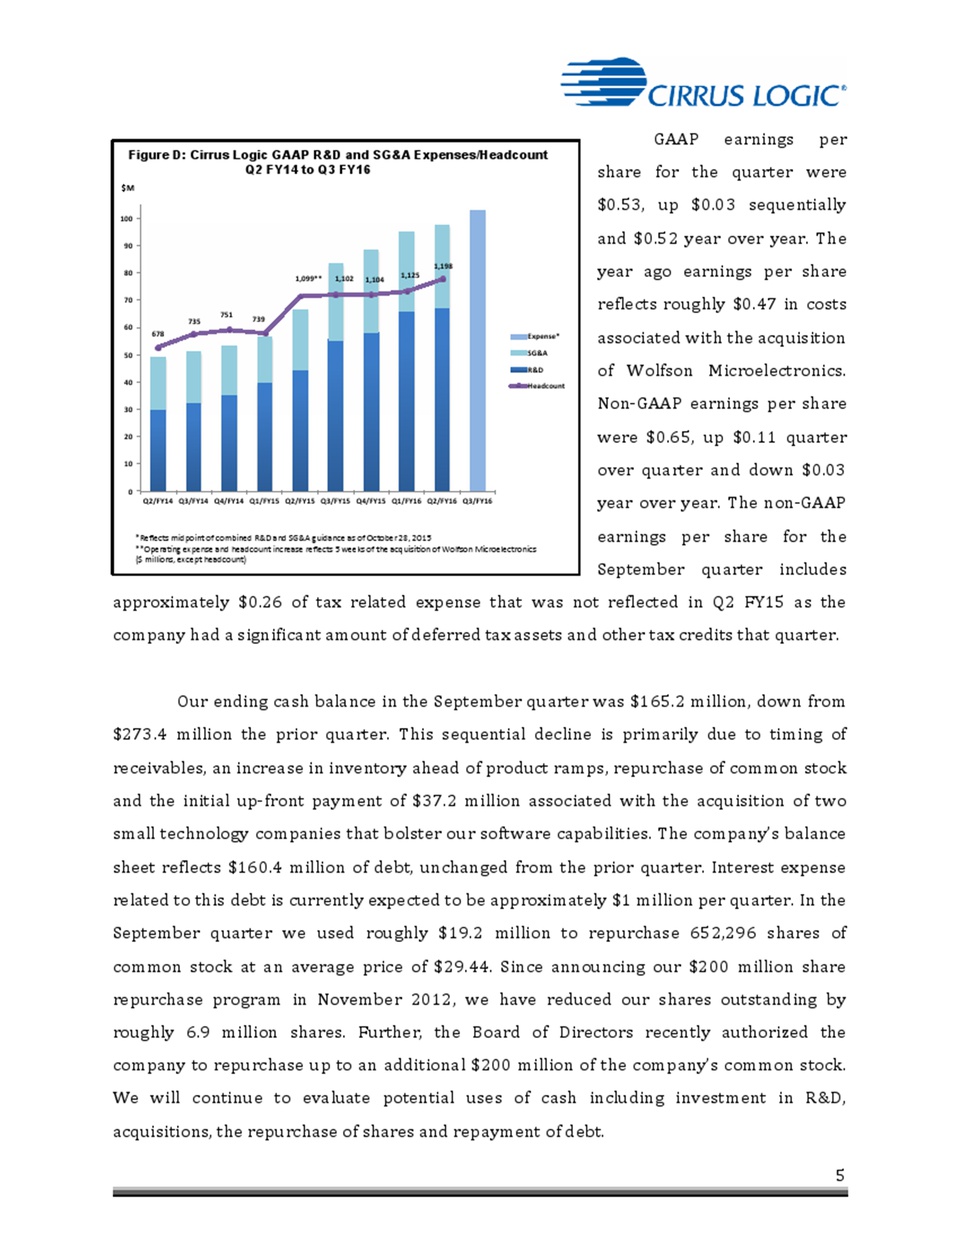
5 GAAP earnings per share for the quarter were $0.53, up $0.03 sequentially and $0.52 year over year. The year ago earnings per share reflects roughly $0.47 in costs associated with the acquisition of Wolfson Microelectronics. Non--‐GAAP earnings per share were $0.65, up $0.11 quarter over quarter and down $0.03 year over year. The non--‐GAAP earnings per share for the September quarter includes approximately $0.26 of tax related expense that was not reflected in Q2 FY15 as the company had a significant amount of deferred tax assets and other tax credits that quarter. Our ending cash balance in the September quarter was $165.2 million, down from $273.4 million the prior quarter. This sequential decline is primarily due to timing of receivables, an increase in inventory ahead of product ramps, repurchase of common stock and the initial up--‐front payment of $37.2 million associated with the acquisition of two small technology companies that bolster our software capabilities. The company’s balance sheet reflects $160.4 million of debt, unchanged from the prior quarter. Interest expense related to this debt is currently expected to be approximately $1 million per quarter. In the September quarter we used roughly $19.2 million to repurchase 652,296 shares of common stock at an average price of $29.44. Since announcing our $200 million share repurchase program in November 2012, we have reduced our shares outstanding by roughly 6.9 million shares. Further, the Board of Directors recently authorized the Company to repurchase up to an additional $200 million of the company’s common stock. We will continue to evaluate potential uses of cash including investment in R&D, acquisitions, the repurchase of shares and repayment of debt. Figure D: Cirrus Logic GAAP R&D and SG&A Expenses/Headcount Q2 FY14 to Q3 FY16 678 735 751 739 1,099** 1,102 1,104 1,125 1,198$ 0 10 20 30 40 50 60 70 80 90 100 $M Q2/FY14 Q3/FY14 Q4/FY14 Q1/FY15 Q2/FY15 Q3/FY15 Q4/FY15 Q1/FY16 Q2/FY16 Q3/FY16 Expense* SG&A R&D Headcount *Reflects midpoint of combined R&D and SG&A guidance as of October 28, 2015 **Operating expense and headcount increase reflects acquisition of Wolfson Microelectronics ($ millions, except headcount) 5 weeks of the
6 Taxes and Inventory Our GAAP tax expense for the September quarter was $8.1 million. The non--‐GAAP tax expense was $17.6 million, which excludes a $4.6 million benefit associated with adjustments to deferred federal taxes related to R&D credits and includes $4.9M related to the tax effect of higher non--‐GAAP income in various jurisdictions. We anticipate a worldwide GAAP and non--‐GAAP effective tax rate of approximately 30 percent for FY16. Moving forward, we expect a growing portion of our revenue and income will be generated offshore; accordingly, our worldwide effective tax rate has the potential to be reduced in FY17 and beyond. Q2 ending inventory was $143.9 million, up $17.7 million from $126.2 million in Q1. Inventory in the December quarter is expected to decline as we fulfill accelerated product demand. Company Strategy Cirrus Logic is leveraging our relationships with many industry leaders to increase content and cross--‐sell additional components including smart codecs, amplifiers and MEMS microphones. We are pleased with the progress that we made in the September quarter as we continued to execute on strategic initiatives that are contributing to growth in FY16 and are expected to drive further growth in FY17. During the quarter, we increased our content with several existing customers as we successfully ramped our new 55--‐nanometer smart codecs and began volume shipments of a 65--‐nanometer smart codec and MEMS microphones into multiple new Android handsets. With a wide range of products and a robust roadmap the company is laser--‐focused on growing content at our top three smartphone customers while expanding share with other market leaders. We remain actively engaged with leading OEMs and are encouraged by their desire to provide compelling audio and voice solutions across a variety of flagship and mid--‐tier platforms. Longer term, as features such as noise cancellation and always--‐on voice move beyond
7 smartphones, we believe there is significant potential for our disruptive smart codec technology in the digital headset and smart accessory markets. In today’s connected world consumers expect OEMs to continuously deliver products with new innovative features and a high--‐quality, consistent user experience, across various platforms and form factors. Demand for our components has grown as customers strive to differentiate their products with audio and voice features beyond the capability of what is enabled with standard reference designs for applications processors and wireless chipsets. During the quarter, we ramped a general market smart codec and microphones in multiple handsets that are based on a range of third party applications processors. The adoption of our components in these handsets highlights the importance customers are placing on the power, performance and value of the solutions we provide. We were also delighted to see early adoption of features previously found in high--‐end handsets being deployed in mobile phones using mid--‐tier applications processors. We continue to view the proliferation of audio and voice features across flagship and mid--‐tier smartphones as a meaningful growth driver in the coming years. Further, customers are increasingly asking for components with more processing capability (MIPS) and memory at even lower power levels, particularly in the Android ecosystem where OEMs rely heavily on software algorithms to differentiate. Recognizing this fundamental need, the company continues to invest in solutions that improve features such as audio playback in headphones and speakers, always--‐on voice and voice command. When combined with a well--‐established ecosystem of third--‐party partners who have ported their algorithms to our platform, we offer our customers a wide range of audio and voice features that are difficult to replicate. This approach has been very well received and we are actively engaged with numerous OEMs on next generation smart codec designs. Market demand for louder, high--‐quality sound from smartphone speakers is driving a substantial growth opportunity for Cirrus Logic’s boosted amplifiers. As OEMs push toward thinner industrial designs, the hardware and software complexity associated with delivering this experience to consumers is rising, placing more pressure on design engineers as less physical space is available and the acoustic environment is much more
8 challenging. Although the amplifier market is very competitive with many incumbent suppliers, we believe our technology is differentiated by our highly power--‐efficient hardware that enables compact board designs and includes sophisticated software to control and protect the speaker while enhancing the sound quality for the user. Further, we believe our ability to co--‐design our boosted amplifiers and smart codecs as a system is a great advantage in terms of delivering a highly optimized solution. We are making a significant investment in this technology, as we believe amplifiers will continue to play a crucial role in the audio signal chain for many years. To support our efforts, in the September quarter we acquired a small company that bolsters our speaker protection and linearization software capabilities. We are optimistic about our opportunities going forward and expect continued growth in amplifiers over the next year as we gradually gain traction in this thriving market. As smartphones have become more sophisticated, the need for innovative smart accessories such as digital headsets and other wearables has grown. While this market is still in its infancy we have experienced a notable trend in our customers’ desire to move from basic headsets to smarter, more capable accessories, which can dramatically improve the user experience with high--‐fidelity audio playback and advanced features such as active noise cancellation. Addressing this emerging market, our solution integrates a low--‐power DSP and an advanced mixed--‐signal codec that provides high performance audio/voice and a new adaptive active noise cancelation system. This system adapts in real--‐time to both external conditions and the user’s ears to deliver a world--‐class experience regardless of headset form factor and fit. We believe this technology will enable OEMs to provide a compelling consumer experience at price points well below the leading solutions on the market today. We are excited about our opportunity in digital headsets and are very encouraged by our discussions with many of the leading mobile and headset OEMs. We are currently in the qualification process and expect to gain momentum in this market over the next 12 to 18 months. Longer--‐term, the company is positioned to leverage the technology we have developed for mobile into adjacent markets including wearables and the connected home,
9 where voice will likely be a primary interface. While these markets are relatively undeveloped today with regard to advanced audio and voice functionality, we have a variety of customers actively targeting innovative products and applications. In fact, we are shipping a new smart codec designed specifically for wearables in a recently introduced watch. As a leader in ultra low power, high performance analog and digital signal processing our expansion into wearables and the connected home is one of many layers of our growth strategy. FY16 is shaping up to be an outstanding year as the company increases share and content with existing customers. As we move beyond FY16, with a broad range of products and a robust roadmap, Cirrus Logic is poised to capitalize on the rapidly expanding opportunities in flagship and mid--‐tier smartphones, digital headsets, and ultimately wearables and the connected home. We are extremely pleased to have been named one of the top 10 employers in the United States on the 2015 annual Best Small and Medium Workplaces list by the Great Place to Work® Institute. Cirrus Logic has been recognized for the past five years and was ranked number 8 on this year’s annual list, which was published in FORTUNE® magazine and distinguishes companies that have exceptional workplace cultures. It is vital for the success of our business that we attract and retain talented employees. With this in mind we have developed a corporate culture that encourages innovation, creativity and timely execution, while fostering integrity, trust and camaraderie. Summary and Guidance For the December quarter we expect the following results: • Revenue to range between $370 million and $400 million; • GAAP gross margin to be between 46 percent and 48 percent; and
10 • Combined GAAP R&D and SG&A expenses to range between $100 million and $104 million, including approximately $8 million in share--‐based compensation expense and $8 million in amortization of acquired intangibles. In summary, we are very pleased with our financial results for the second quarter as sales of our 55--‐nanometer and 65--‐nanometer smart codecs and boosted amplifiers accelerated. Cirrus Logic’s substantial investment in R&D, diverse product portfolio spanning the entire audio signal chain and innovative strategic roadmap have positioned the company as an industry leader. We continue to be very excited about our outlook for growth in FY16 and FY17 as demand for our audio and voice products continues to gain momentum. Sincerely, Jason Rhode Thurman Case President and Chief Executive Officer Chief Financial Officer Conference Call Q&A Session Cirrus Logic will host a live Q&A session at 5 p.m. EDT today to answer questions related to its financial results and business outlook. Participants may listen to the conference call on the Cirrus Logic website. Participants who would like to submit a question to be addressed during the call are requested to email investor.relations@cirrus.com.
11 A replay of the webcast can be accessed on the Cirrus Logic website approximately two hours following its completion, or by calling (404) 537--‐3406, or toll--‐free at (855) 859--‐ 2056 (Access Code: 75505782). Use of Non--‐GAAP Financial Information To supplement Cirrus Logic's financial statements presented on a GAAP basis, Cirrus has provided non--‐ GAAP financial information, including gross margins, operating expenses, net income, operating profit and income, tax expenses, effective tax rate and diluted earnings per share. A reconciliation of the adjustments to GAAP results is included in the tables below. Non--‐GAAP financial information is not meant as a substitute for GAAP results, but is included because management believes such information is useful to our investors for informational and comparative purposes. In addition, certain non--‐GAAP financial information is used internally by management to evaluate and manage the company. The non--‐GAAP financial information used by Cirrus Logic may differ from that used by other companies. These non--‐GAAP measures should be considered in addition to, and not as a substitute for, the results prepared in accordance with GAAP. Safe Harbor Statement Except for historical information contained herein, the matters set forth in this news release contain forward--‐looking statements, including expectations for growth and product ramps in the third quarter and fiscal year 2017 and beyond, and our estimates of third quarter fiscal year 2016 revenue, gross margin, combined research and development and selling, general and administrative expense levels, share--‐based compensation expense and amortization of acquired intangibles. In some cases, forward--‐ looking statements are identified by words such as “expect,” “anticipate,” “target,” “project,” “believe,” “goals,” “opportunity,” “estimates,” “intend,” and variations of these types of words and similar expressions. In addition, any statements that refer to our plans, expectations, strategies or other characterizations of future events or circumstances are forward--‐looking statements. These forward--‐ looking statements are based on our current expectations, estimates and assumptions and are subject to certain risks and uncertainties that could cause actual results to differ materially. These risks and uncertainties include, but are not limited to, the following: the level of orders and shipments during the third quarter of fiscal year 2016, as well as customer cancellations of orders, or the failure to place orders consistent with forecasts; and the risk factors listed in our Form 10--‐K for the year ended March 28, 2015, and in our other filings with the Securities and Exchange Commission, which are available at www.sec.gov. The foregoing information concerning our business outlook represents our outlook as of the date of this news release, and we undertake no obligation to update or revise any forward--‐looking statements, whether as a result of new developments or otherwise. Summary financial data follows:
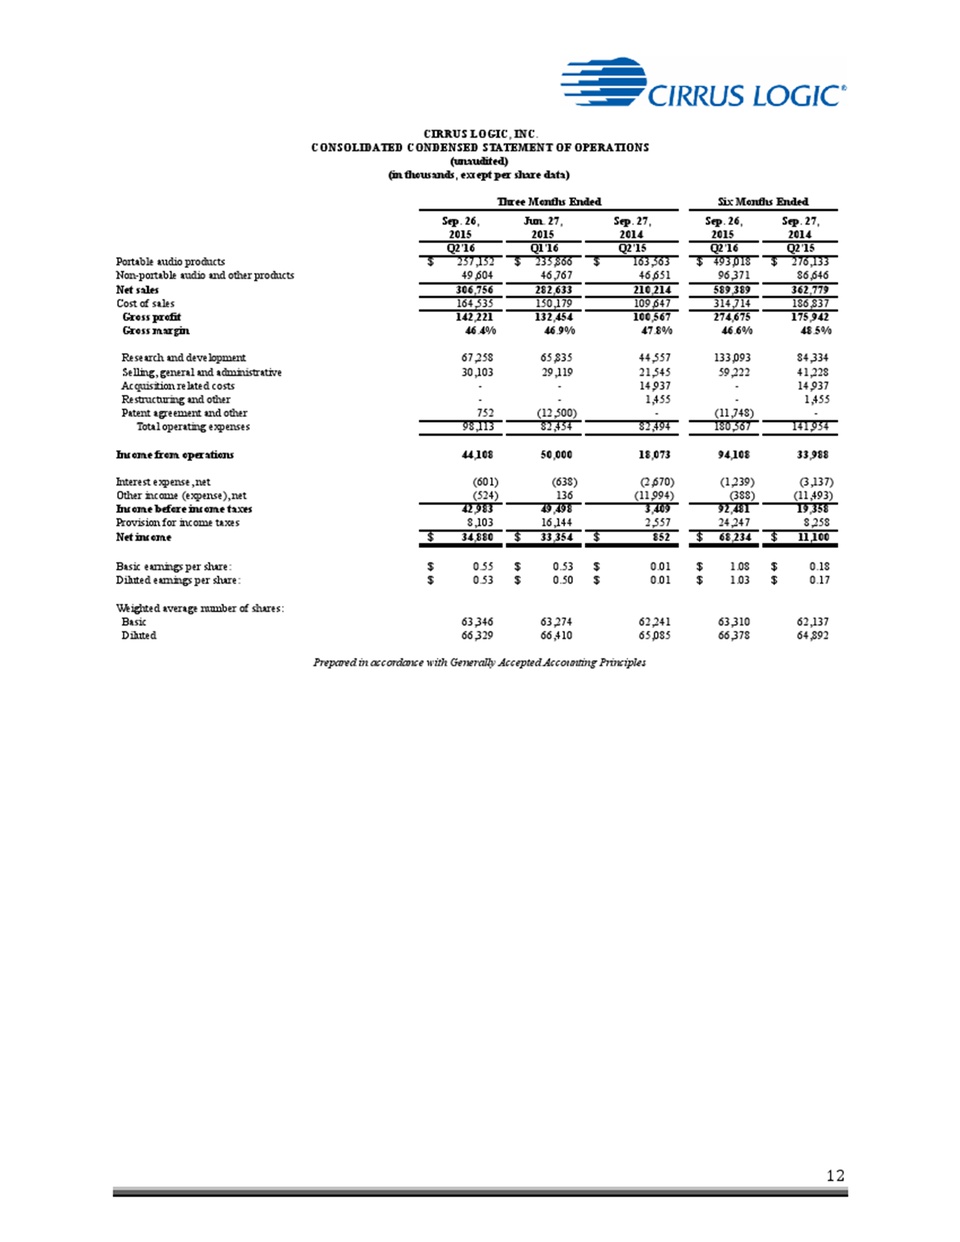
12 CIRRUS LOGIC, INC. CONSOLIDATED CONDENSED STATEMENT OF OPERATIONS (unaudited) (in thousands, except per share data) Three Months Ended Six Months Ended Sep. 26, Jun. 27, Sep. 27, Sep. 26, Sep. 27, 2015 2015 2014 2015 2014 Q2'16 Q1'16 Q2'15 Q2'16 Q2'15 Portable audio products $ 257,152 $ 235,866 $ 163,563 $ 4 93,018 $ 276,133 Non-portable audio and other products 49,604 46,767 46,651 96,371 86,646 Net sales 306,756 282,633 210,214 5 89,389 362,779 Cost of sales 164,535 150,179 109,647 3 14,714 186,837 Gross profit 142,221 132,454 100,567 2 74,675 175,942 Gross margin 46.4% 46.9% 47.8% 46.6% 48.5% Research and development 67,258 65,835 44,557 1 33,093 84,334 Selling, general and administrative 30,103 29,119 21,545 59,222 41,228 Acquisition related costs - - 14,937 - 14,937 Restructuring and other - - 1,455 - 1,455 Patent agreement and other 752 ( 12,500) - (11,748) - Total operating expenses 98,113 82,454 82,494 1 80,567 141,954 Income from operations 44,108 50,000 18,073 94,108 33,988 Interest expense, net (601) (638) (2,670) (1,239) (3,137) Other income (expense), net (524) 136 (11,994) (388) ( 11,493) Income before income taxes 42,983 49,498 3,409 92,481 19,358 Provision for income taxes 8,103 16,144 2,557 24,247 8,258 Net income $ 34,880 $ 33,354 $ 852 $ 6 8,234 $ 11,100 Basic earnings per share: $ 0.55 $ 0.53 $ 0.01 $ 1.08 $ 0.18 Diluted earnings per share: $ 0.53 $ 0.50 $ 0.01 $ 1.03 $ 0.17 Weighted average number of shares: Basic 63,346 63,274 62,241 63,310 62,137 Diluted 66,329 66,410 65,085 66,378 64,892 Prepared in accordance with Generally Accepted Accounting Principles
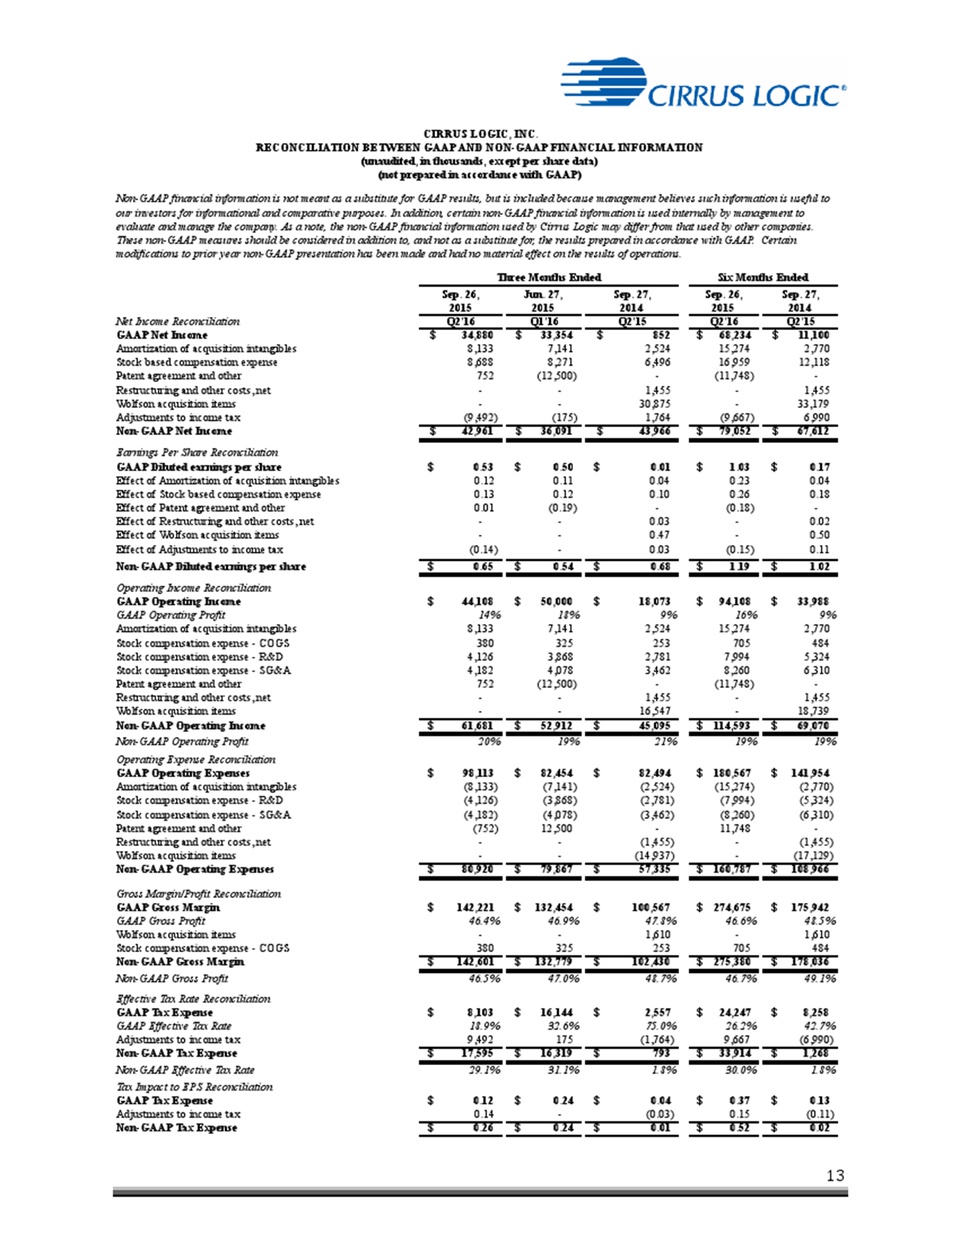
13 CIRRUS LOGIC, INC. RECONCILIATION BETWEEN GAAP AND NON-GAAP FINANCIAL INFORMATION (unaudited, in thousands, except per share data) (not prepared in accordance with GAAP) Non-GAAP financial information is not meant as a substitute for GAAP results, but is included because management believes such information is useful to our investors for informational and comparative purposes. In addition, certain non-GAAP financial information is used internally by management to evaluate and manage the company. As a note, the non-GAAP financial information used by Cirrus Logic may differ from that used by other companies. These non-GAAP measures should be considered in addition to, and not as a substitute for, the results prepared in accordance with GAAP. Certain modifications to prior year non-GAAP presentation has been made and had no material effect on the results of operations. Three Months Ended Six Months Ended Sep. 26, Jun. 27, Sep. 27, Sep. 26, Sep. 27, 2015 2015 2014 2015 2014 Net Income Reconciliation Q2'16 Q1'16 Q2'15 Q2'16 Q2'15 GAAP Net Income $ 34,880 $ 33,354 $ 852 $ 6 8,234 $ 11,100 Amortization of acquisition intangibles 8,133 7,141 2,524 15,274 2,770 Stock based compensation expense 8,688 8,271 6,496 16,959 12,118 Patent agreement and other 752 ( 12,500) - (11,748) - Restructuring and other costs, net - - 1,455 - 1,455 Wolfson acquisition items - - 30,875 - 33,179 Adjustments to income tax (9,492) (175) 1,764 (9,667) 6,990 Non-GAAP Net Income $ 42,961 $ 36,091 $ 43,966 $ 7 9,052 $ 67,612 Earnings Per Share Reconciliation GAAP Diluted earnings per share $ 0.53 $ 0.50 $ 0.01 $ 1.03 $ 0.17 Effect of Amortization of acquisition intangibles 0.12 0.11 0.04 0.23 0.04 Effect of Stock based compensation expense 0.13 0.12 0.10 0.26 0.18 Effect of Patent agreement and other 0.01 (0.19) - (0.18) - Effect of Restructuring and other costs, net - - 0.03 - 0.02 Effect of Wolfson acquisition items - - 0.47 - 0.50 Effect of Adjustments to income tax (0.14) - 0.03 (0.15) 0.11 Non-GAAP Diluted earnings per share $ 0.65 $ 0.54 $ 0.68 $ 1.19 $ 1.02 Operating Income Reconciliation GAAP Operating Income $ 44,108 $ 50,000 $ 18,073 $ 9 4,108 $ 33,988 GAAP Operating Profit 14% 18% 9% 16% 9% Amortization of acquisition intangibles 8,133 7,141 2,524 15,274 2,770 Stock compensation expense - COGS 380 325 253 705 484 Stock compensation expense - R&D 4,126 3,868 2,781 7,994 5,324 Stock compensation expense - SG&A 4,182 4,078 3,462 8,260 6,310 Patent agreement and other 752 ( 12,500) - (11,748) - Restructuring and other costs, net - - 1,455 - 1,455 Wolfson acquisition items - - 16,547 - 18,739 Non-GAAP Operating Income $ 61,681 $ 52,912 $ 45,095 $ 1 14,593 $ 69,070 Non-GAAP Operating Profit 20% 19% 21% 19% 19% Operating Expense Reconciliation GAAP Operating Expenses $ 98,113 $ 82,454 $ 82,494 $ 1 80,567 $ 141,954 Amortization of acquisition intangibles (8,133) (7,141) (2,524) (15,274) (2,770) Stock compensation expense - R&D (4,126) (3,868) (2,781) (7,994) (5,324) Stock compensation expense - SG&A (4,182) (4,078) (3,462) (8,260) (6,310) Patent agreement and other (752) 12,500 - 11,748 - Restructuring and other costs, net - - (1,455) - (1,455) Wolfson acquisition items - - (14,937) - ( 17,129) Non-GAAP Operating Expenses $ 80,920 $ 79,867 $ 57,335 $ 1 60,787 $ 108,966 Gross Margin/Profit Reconciliation GAAP Gross Margin $ 142,221 $ 132,454 $ 100,567 $ 2 74,675 $ 175,942 GAAP Gross Profit 46.4% 46.9% 47.8% 46.6% 48.5% Wolfson acquisition items - - 1,610 - 1,610 Stock compensation expense - COGS 380 325 253 705 484 Non-GAAP Gross Margin $ 142,601 $ 132,779 $ 102,430 $ 2 75,380 $ 178,036 Non-GAAP Gross Profit 46.5% 47.0% 48.7% 46.7% 49.1% Effective Tax Rate Reconciliation GAAP Tax Expense $ 8,103 $ 16,144 $ 2,557 $ 2 4,247 $ 8,258 GAAP Effective Tax Rate 18.9% 32.6% 75.0% 26.2% 42.7% Adjustments to income tax 9,492 175 (1,764) 9,667 (6,990) Non-GAAP Tax Expense $ 17,595 $ 16,319 $ 793 $ 3 3,914 $ 1,268 Non-GAAP Effective Tax Rate 29.1% 31.1% 1.8% 30.0% 1.8% Tax Impact to EPS Reconciliation GAAP Tax Expense $ 0.12 $ 0.24 $ 0.04 $ 0.37 $ 0.13 Adjustments to income tax 0.14 - (0.03) 0.15 (0.11) Non-GAAP Tax Expense $ 0.26 $ 0.24 $ 0.01 $ 0.52 $ 0.02
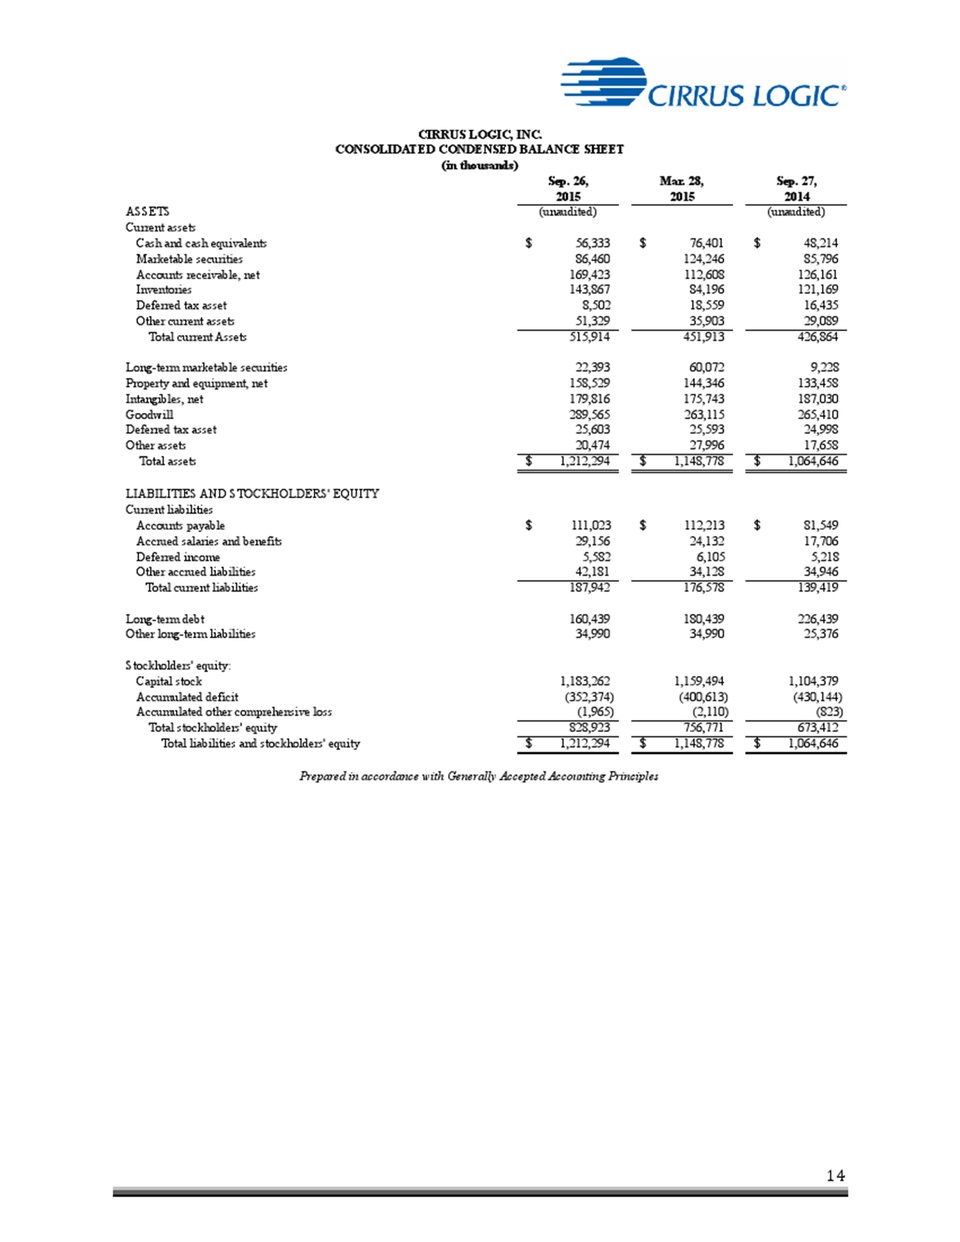
14 CIRRUS LOGIC, INC. CONSOLIDATED CONDENSED BALANCE SHEET (in thousands) Sep. 26, 2015 Mar. 28, 2015 Sep. 27, 2014 ASSETS (unaudited) (unaudited) Current assets Cash and cash equivalents $ 56,333 $ 76,401 $ 48,214 Marketable securities 86,460 124,246 85,796 Accounts receivable, net 169,423 112,608 126,161 Inventories 143,867 84,196 121,169 Deferred tax asset 8,502 18,559 16,435 Other current assets 51,329 35,903 29,089 Total current Assets 515,914 451,913 426,864 Long-term marketable securities 22,393 60,072 9,228 Property and equipment, net 158,529 144,346 133,458 Intangibles, net 179,816 175,743 187,030 Goodwill 289,565 263,115 265,410 Deferred tax asset 25,603 25,593 24,998 Other assets 20,474 27,996 17,658 Total assets $ 1,212,294 $ 1,148,778 $ 1,064,646 LIABILITIES AND STOCKHOLDERS' EQUITY Current liabilities Accounts payable $ 111,023 $ 112,213 $ 81,549 Accrued salaries and benefits 29,156 24,132 17,706 Deferred income 5,582 6,105 5,218 Other accrued liabilities 42,181 34,128 34,946 Total current liabilities 187,942 176,578 139,419 Long-term debt 160,439 180,439 226,439 Other long-term liabilities 34,990 34,990 25,376 Stockholders' equity: Capital stock 1,183,262 1,159,494 1,104,379 Accumulated deficit (352,374) (400,613) (430,144) Accumulated other comprehensive loss (1,965) (2,110) (823) Total stockholders' equity 828,923 756,771 673,412 Total liabilities and stockholders' equity $ 1,212,294 $ 1,148,778 $ 1,064,646 Prepared in accordance with Generally Accepted Accounting Principles