Attached files
| file | filename |
|---|---|
| 8-K - TMUS FORM 8-K - T-Mobile US, Inc. | tmus09302015form8-k.htm |
| EX-99.1 - TMUS EXHIBIT 99.1 - T-Mobile US, Inc. | tmus09302015ex991.htm |
EXHIBIT 99.2

1
CUSTOMER METRICS
Branded Postpaid Customers
▪ | Branded postpaid net customer additions were 1,085,000 in the third quarter of 2015 compared to 1,008,000 in the second quarter of 2015 and 1,379,000 in the third quarter of 2014. This marked the fifth consecutive quarter in which branded postpaid net customer additions were greater than one million, a clear indicator of the continued success of the Un-carrier initiatives and strong uptake of promotional activities. |
▪ | T-Mobile is expected to again lead the industry in branded postpaid phone net customer additions with 843,000 in the third quarter of 2015, compared to 760,000 in the second quarter of 2015 and 1,175,000 in the third quarter of 2014. Branded postpaid phone gross additions in the third quarter of 2015 increased by 14% on a sequential basis, but were down 16% year-over-year. T-Mobile is expected to lead the industry in branded postpaid phone net additions for the 7th consecutive quarter. |
▪ | Branded postpaid mobile broadband net customer additions were 242,000 in the third quarter of 2015, compared to 248,000 in the second quarter of 2015 and 204,000 in the third quarter of 2014. |
▪ | Branded postpaid phone churn was 1.46% in the third quarter of 2015, down 18 basis points compared to 1.64% in the third quarter of 2014 and up 14 basis points compared to 1.32% in the second quarter of 2015. The 18 basis year-over-year reduction represents a slight improvement compared to the second quarter of 2015 when churn decreased 16 basis points year-over-year. The year-over-year improvement reflects ongoing improvements in the Company’s network, customer service, and the overall value of its offerings in the marketplace, resulting in increased customer satisfaction and loyalty. The sequential increase in churn was primarily due to seasonal factors. |


2
Branded Prepaid Customers
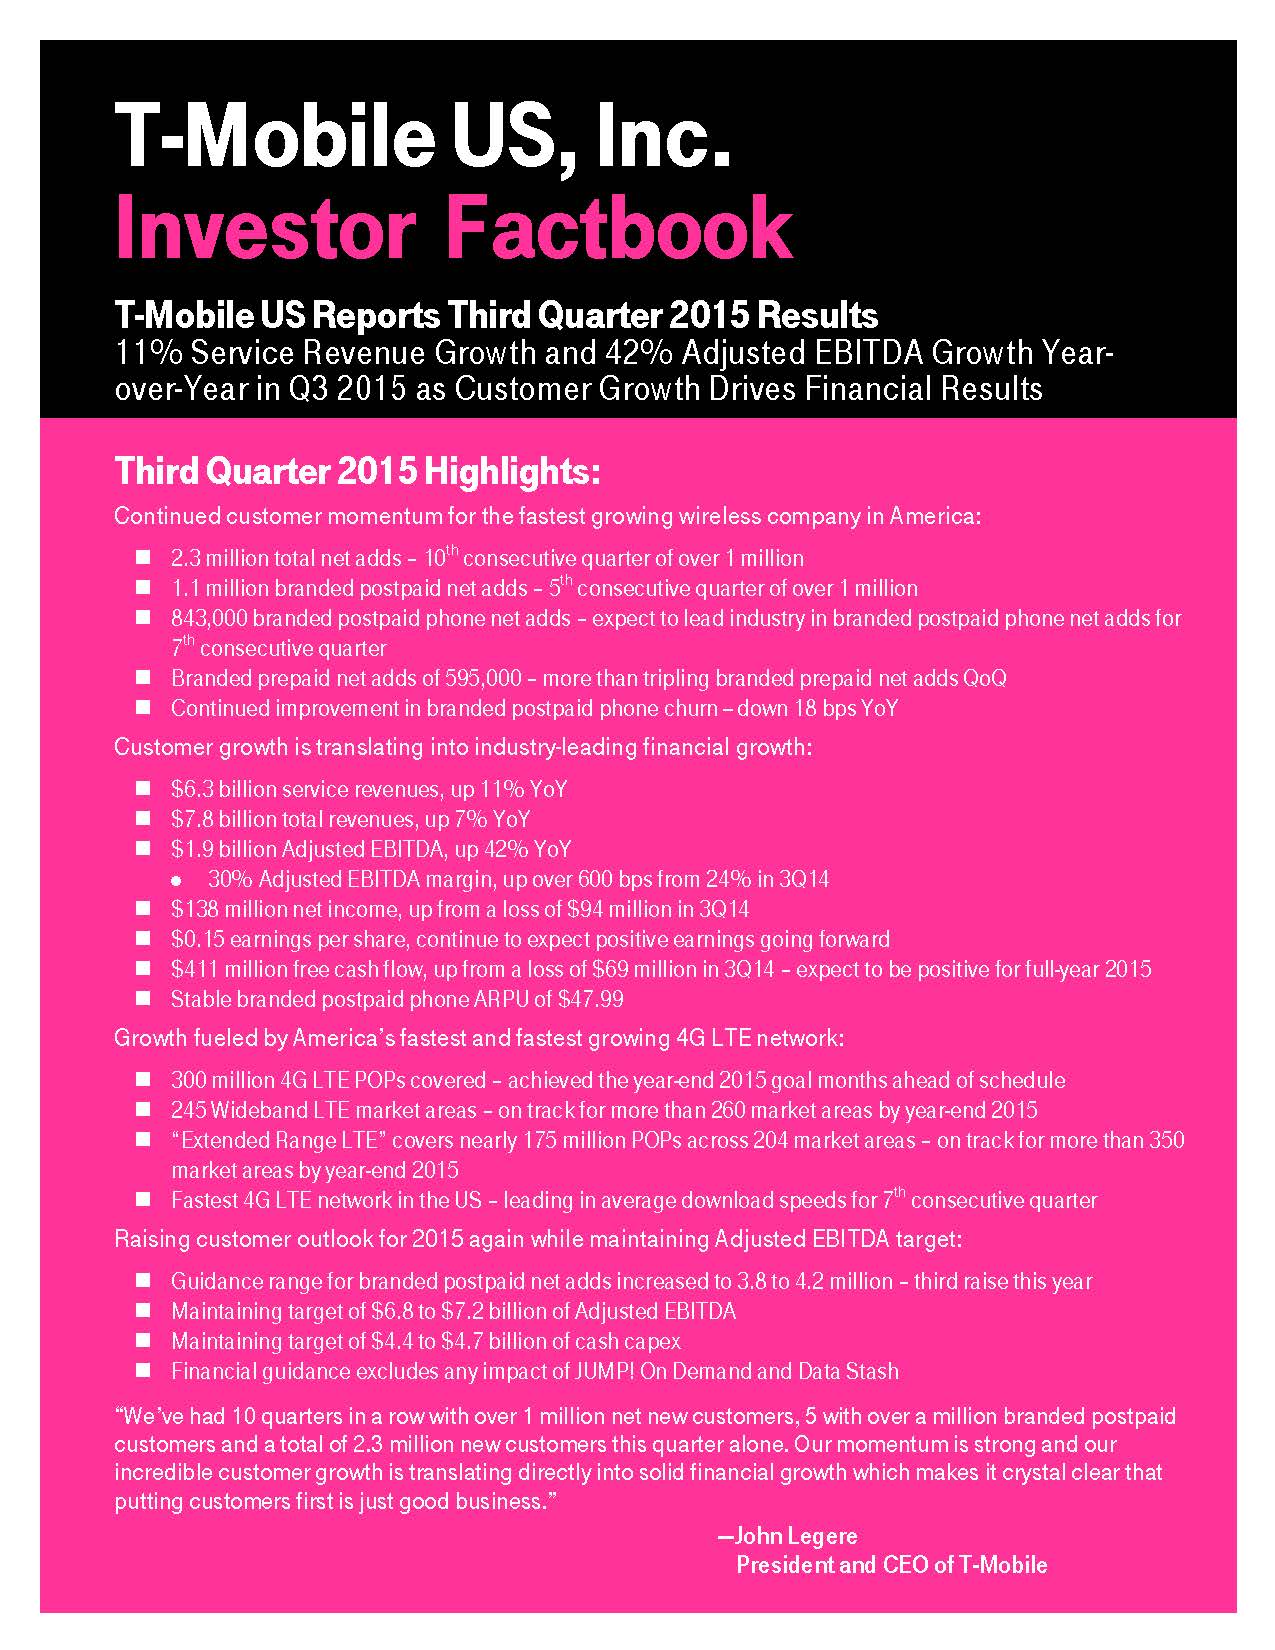
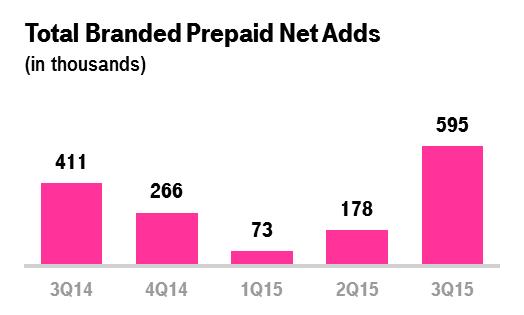
▪ | Branded prepaid net customer additions were 595,000 in the third quarter of 2015, compared to 178,000 in the second quarter of 2015 and 411,000 in the third quarter of 2014. This was the best quarterly performance in prepaid net additions since combining with MetroPCS in the second quarter of 2013. The higher level of branded prepaid net additions in the third quarter of 2015 was driven by successful promotional activities, particularly at MetroPCS. |
▪ | Migrations to branded postpaid plans reduced branded prepaid net customer additions in the third quarter of 2015 by approximately 185,000, up slightly from approximately 175,000 in the second quarter of 2015 and up from approximately 110,000 in the third quarter of 2014. |
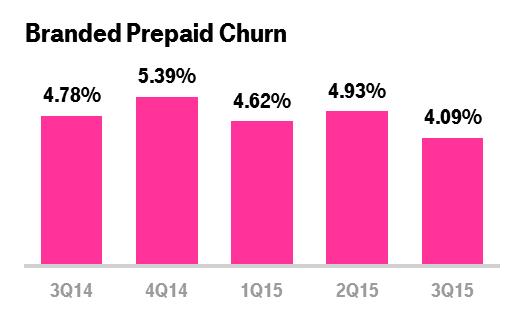
▪ | Branded prepaid churn was 4.09% in the third quarter of 2015 using a revised methodology for measuring branded prepaid customer activity, compared to 4.93% in the second quarter of 2015 and 4.78% in the third quarter of 2014 using the previous methodology. Restatement of prior periods was not practicable because certain historical data was no longer available. This method change had no impact on T-Mobile’s reported branded prepaid ending customers or net customer additions, but resulted in computationally lower gross customer additions and lower deactivations. |
Total Branded Customers
▪ | Total branded net customer additions were 1,680,000 in the third quarter of 2015 compared to 1,186,000 in the second quarter of 2015 and 1,790,000 in the third quarter of 2014. This was the seventh consecutive quarter in which branded net customer additions surpassed the one million milestone. |

3
Wholesale Customers
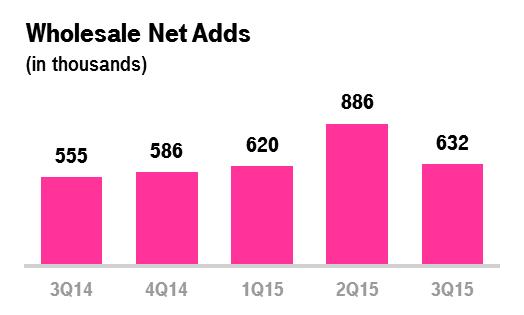
▪ | Beginning in the third quarter of 2015, T-Mobile will cease reporting Mobile Virtual Network Operator (MVNO) and Machine-to-Machine (M2M) ending customers and net customer additions separately, and will report one combined Wholesale customer category. This change brings T-Mobile in alignment with industry practice. |
▪ | Wholesale net customer additions were 632,000 in the third quarter of 2015 compared to 886,000 in the second quarter of 2015 and 555,000 in the third quarter of 2014. |
Total Customers
▪ | Total net customer additions were 2,312,000 in the third quarter of 2015 compared to 2,072,000 in the second quarter of 2015 and 2,345,000 in the third quarter of 2014. This was the tenth consecutive quarter in which total net customer additions exceeded one million. It was also the fifth time in the last seven quarters in which total net customer additions exceeded two million. |
▪ | Since the launch of its first Un-carrier initiative ten quarters ago, T-Mobile has added more than 18 million total customers. |
▪ | T-Mobile ended the third quarter of 2015 with more than 61.2 million total customers, up 42% on a pro forma combined basis from the end of the first quarter of 2013, when the Un-carrier initiative launched. |

4
NETWORK
Network Modernization Update
▪ | T-Mobile’s 4G LTE network now covers 300 million people, up from 290 million at the end of the second quarter of 2015 and 250 million at the end of the third quarter of 2014. |
▪ | The Company has already achieved its stated year-end 2015 goal of a total 4G LTE population coverage of 300 million people. T-Mobile expects to continue to add to its 4G LTE coverage footprint during the remainder of 2015. |
▪ | Wideband LTE is currently available in 245 market areas and is now expected to be available in more than 260 market areas by year-end 2015. |

Network Speed
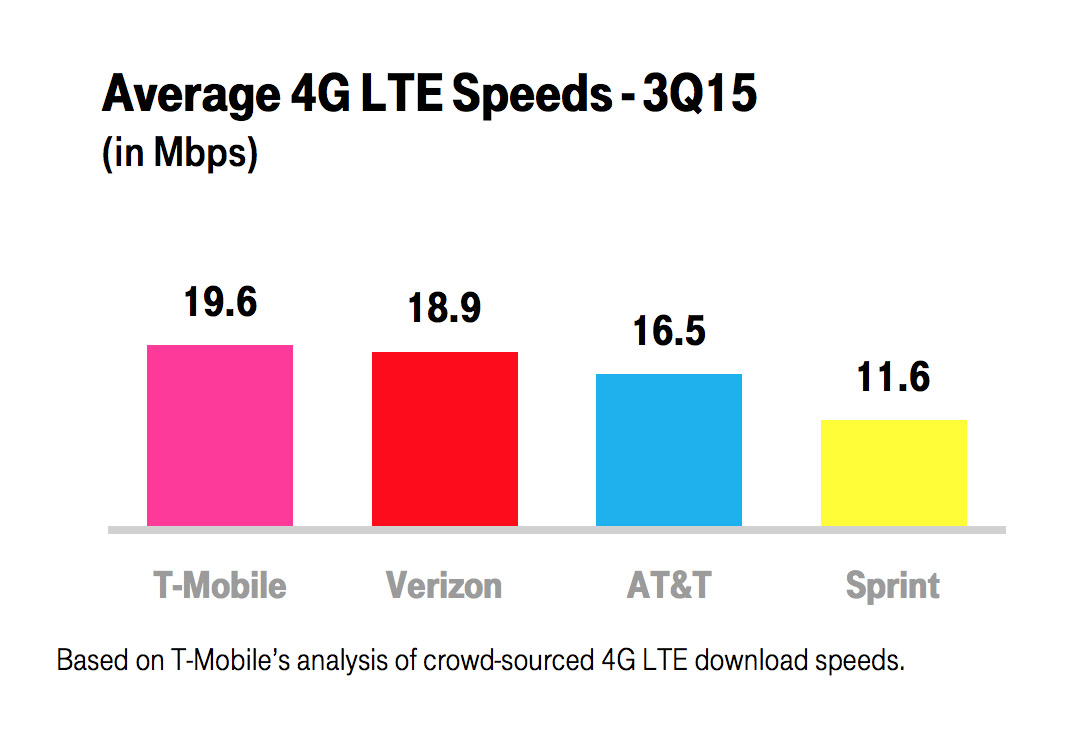
▪ | T-Mobile has the fastest nationwide 4G LTE network in the U.S. based on download speeds from millions of user-generated tests. This is the seventh consecutive quarter that T-Mobile has led the industry in average download speeds. |
▪ | In the third quarter of 2015, T-Mobile’s average 4G LTE download speed was 19.6 Mbps compared to Verizon at 18.9 Mbps, AT&T at 16.5 Mbps, and Sprint at 11.6 Mbps. |
5
Spectrum
▪ | At the end of the third quarter of 2015, T-Mobile owned an average of 84 MHz of spectrum across the top 25 markets in the U.S. The spectrum is comprised of an average of 10 MHz in the 700 MHz band, 30 MHz in the 1900 MHz PCS band, and 44 MHz in the AWS band. |
▪ | The Company expects to participate in future FCC spectrum auctions including the broadcast incentive auction. |

6
A-Block Update
▪ | T-Mobile owns 700 MHz A-Block spectrum covering 190 million people or approximately 60% of the U.S. population and more than 70% of the Company’s existing customer base. The spectrum covers 9 of the top 10 market areas and 24 of the top 30 market areas in the U.S. |
▪ | Approximately 98% of the population covered by the Company’s A-Block spectrum is free and clear and ready to be deployed or will be ready for deployment in 2015. That is up from approximately 50% at the time of the original A-Block purchase from Verizon in the first quarter of 2014. |
▪ | T-Mobile has deployed its 700 MHz A-Block spectrum in 204 market areas covering nearly 175 million people under the brand name “Extended Range LTE.” Extended Range LTE travels up to twice as far as mid-band spectrum and works up to four times better in buildings. New market launches in the third quarter of 2015 included the cities of Los Angeles, Atlanta, Sacramento, Cincinnati, and Indianapolis. The Company expects to continue to aggressively roll-out new 700 MHz sites in 2015 and is targeting more than 350 market areas by year-end. |

7
METROPCS
▪ | On July 1, 2015, T-Mobile officially completed the shutdown of the MetroPCS CDMA network with the decommissioning of the CDMA portion of the MetroPCS networks in Dallas, New York, Miami, Jacksonville, Orlando, and Tampa. |
▪ | 100% of the MetroPCS spectrum has now been re-farmed and integrated into the T-Mobile network. |
▪ | Total decommissioning costs for CDMA network shutdowns were $193 million in the third quarter of 2015, compared to $34 million in the second quarter of 2015. The sequential increase in total decommissioning costs was primarily due to the timing of the CDMA network shutdowns. Typically, there is a lag of approximately 3 to 6 months between network shutdown and the recognition of decommissioning costs when the cell site assets are removed and thus the realization of synergies. |
▪ | The Company expects to incur additional network decommissioning costs in the range of $125 to $225 million, a majority of which are expected to be recognized through the rest of 2015. Network decommissioning costs primarily relate to the acceleration of lease costs for decommissioned cell sites and are excluded from Adjusted EBITDA. |
UN-CARRIER INITIATIVES
▪ | At the end of the third quarter of 2015, 93% of the branded postpaid customer base was on a Simple Choice plan, flat compared to 93% at the end of the second quarter of 2015 and up from 84% at the end of the third quarter of 2014. |
▪ | At the end of the third quarter of 2015, 12.2 million customers were enrolled in T-Mobile's JUMP! programs, up from 11.3 million at the end of the second quarter of 2015 and 8.0 million at the end of the third quarter of 2014. This includes customers enrolled in the JUMP! and the JUMP! On Demand programs. |


8
Un-carrier Updates
▪ | Mobile without Borders: This program, launched on July 15, 2015, expands the benefits of T-Mobile’s Simple Choice plan by extending coverage and calling across the U.S, Canada, and Mexico at no extra charge. |
▪ | 10Gigs4All: On July 15, 2015, T-Mobile updated its Family Plan program to enable qualifying family plan customers to get 10 GB of 4G LTE data at a great rate. Plans start at $100 per month for two lines each with 10 GB of 4G LTE data and each additional line is $20 per month. For a limited time, the fourth line is free. |
▪ | Amped Simple Global: On September 17, 2015, T-Mobile added 20 more countries and destinations to Simple Global, bringing unlimited data and texting at no extra cost to a total of 145 countries and destinations worldwide. Simple Global now covers more than 90% of the trips Americans take abroad each year. |
▪ | Un-carrier Pricing for New iPhones: In advance of the new iPhone launch on September 25, 2015, T-Mobile introduced promotional plans to enable qualifying customers to get a new iPhone 6s for $5 per month with JUMP! On Demand and trade-in of an iPhone 6 or comparable device. |
DEVICES
▪ | Total devices sold or leased were 8.9 million units in the third quarter of 2015 compared to 8.3 million units in the second quarter of 2015 and 7.7 million units in the third quarter of 2014. |
▪ | Total smartphone sold or leased were 8.1 million units in the third quarter of 2015 compared to 7.4 million units in the second quarter of 2015 and 6.9 million units in the third quarter of 2014. |
▪ | The upgrade rate for branded postpaid customers was approximately 9% in the third quarter of 2015, consistent with the second quarter of 2015 and the third quarter of 2014. |

9
DEVICE FINANCING
▪ | T-Mobile financed $1.107 billion of equipment sales on EIP in the third quarter of 2015, down 34.8% from $1.697 billion in the second quarter of 2015 and down 15.9% from $1.317 billion in the third quarter of 2014. The sequential and year-over-year decrease was primarily due to a mix shift to the JUMP! On Demand program, which was introduced on June 28, 2015, for a select number of eligible high-end devices. This resulted in a lower number of devices sold on EIP and a lower average revenue per device sold on EIP. |
▪ | Customers on Simple Choice plans had associated EIP billings and lease revenues of $1.439 billion in the third quarter of 2015, up 3.3% from $1.393 billion in the second quarter of 2015 and up 48.8% from $967 million in the third quarter of 2014. |
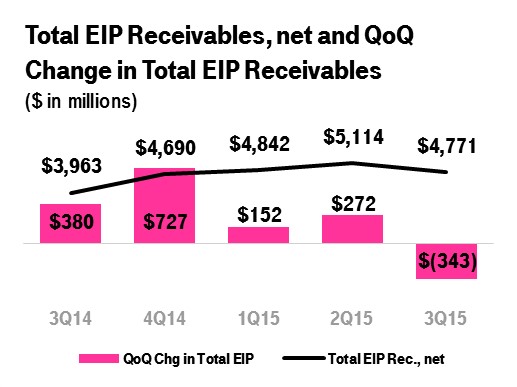
▪ | Total EIP receivables, net of imputed discount and allowances for credit losses, were $4.771 billion at the end of the third quarter of 2015 compared to $5.114 billion at the end of the second quarter of 2015 and $3.963 billion at the end of the third quarter of 2014. The third quarter of 2015 marked the first time in the EIP program’s history that the total EIP receivables, net declined on a sequential basis, decreasing $343 million. |
▪ | Due in part to the mix shift towards JUMP! On Demand, the Company expects that the growth in total EIP receivables, net will continue to moderate significantly in 2015 compared to 2014. |
▪ | Leased devices transferred from inventory to property and equipment, net was $822 million in the third quarter of 2015. Leased devices included in property and equipment, net were $764 million at the end of the third quarter of 2015. Depreciation expense related to leased devices was $58 million in the third quarter of 2015. |
10
CUSTOMER QUALITY
▪ | EIP receivables classified as Prime were 52% of total EIP receivables at the end of the third quarter of 2015, flat compared to the prior quarter and down one percentage point compared to the end of the third quarter of 2014. |
▪ | Total bad debt expense and losses from the factoring arrangement was $198 million in the third quarter of 2015 compared to $156 million in the second quarter of 2015 and $152 million in the third quarter of 2014. Sequentially, the increase was primarily due to higher EIP bad debt expense resulting from seasonal factors and growth of the EIP program in prior quarters. Year-over-year, the increase was primarily due to higher EIP bad debt expense related to growth of the EIP program. |

11
REVENUE METRICS
Branded Postpaid Phone ARPU
▪ | Branded postpaid phone ARPU was $47.99 in the third quarter of 2015, down 0.4% from $48.19 in the second quarter of 2015 and down 3.7% from $49.84 in the third quarter of 2014. Sequentially, branded postpaid phone ARPU was generally stable as growth in family plans and the impact of promotional activity was largely offset by increased data attach rates. Year-over-year, the decrease was primarily due to dilution from continued growth of customers on Simple Choice plans and promotions targeting multiple phone lines. |

Branded Postpaid ABPU
▪ | Branded postpaid ABPU was $62.96 in the third quarter of 2015, down 0.5% from $63.29 in the second quarter of 2015 and up 2.2% from $61.59 in the third quarter of 2014. Sequentially, the slight decrease in branded postpaid ABPU was primarily due to lower branded postpaid phone ARPU and a decline in EIP billings and lease revenues on a per user basis. Year-over-year, the increase was primarily due to growth in EIP billings and lease revenues on a per user basis, offset in part by lower branded postpaid phone ARPU. |

12
Branded Postpaid Customers per Account
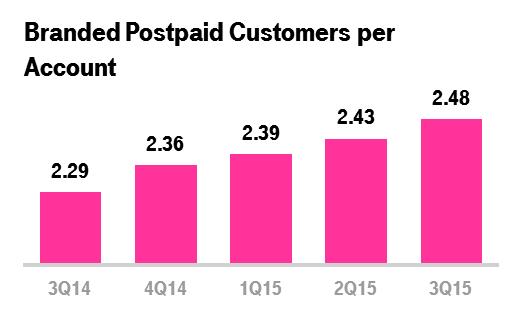
▪ | Branded postpaid customers per account were 2.48 at the end of the third quarter of 2015, compared to 2.43 at the end of the second quarter of 2015 and 2.29 at the end of the third quarter of 2014. The sequential and year-over-year increase was primarily due to continued growth in the number of branded postpaid phone customers per account as a result of service promotions targeting multiple phone lines and increased penetration of mobile broadband devices. |
Branded Postpaid ARPA
▪ | Branded postpaid ARPA was $115.10 in the third quarter of 2015, up 1.4% from $113.50 in the second quarter of 2015 and up 4.8% from $109.80 in the third quarter of 2014. Sequentially, the increase in branded postpaid ARPA was primarily due to continued growth in the number of branded postpaid customers per account. Year-over-year, the increase was primarily due to continued growth in the number of branded postpaid customers per account and an increase in regulatory program revenues, partially offset by dilution from continued growth of customers on promotions targeting families. |

13
Branded Postpaid ABPA
▪ | Branded postpaid ABPA was a record $154.56 in the third quarter of 2015, up 1.5% from $152.31 in the second quarter of 2015 and up 11.4% from $138.73 in the third quarter of 2014. Sequentially and year-over-year, the increase in branded postpaid ABPA was primarily due to growth in EIP billings and lease revenues and an increase in branded postpaid ARPA. |

Branded Prepaid ARPU
▪ | Branded prepaid ARPU was $37.46 in the third quarter of 2015, down 1.0% from $37.83 in the second quarter of 2015 and down 0.3% from $37.59 in the third quarter of 2014. Sequentially and year-over-year, the decrease in branded prepaid ARPU was primarily due to rate plan promotions in the marketplace during the third quarter of 2015. The year-over-year decrease was partially offset by branded prepaid customers choosing plans with more data. |

14
REVENUES
Service Revenues
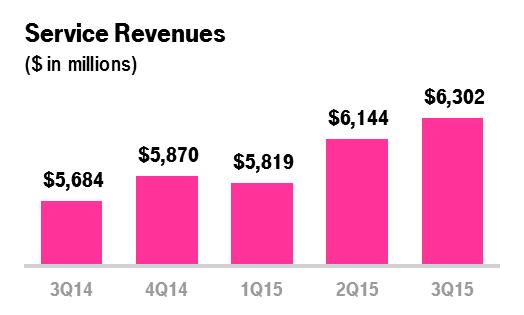
▪ | T-Mobile is expected to again lead the industry in year-over-year service revenue growth in the third quarter of 2015. This would mark the sixth consecutive quarter that T-Mobile has led the industry in year-over-year service revenue growth. |
▪ | Service revenues were $6.302 billion in the third quarter of 2015, up 2.6% from $6.144 billion in the second quarter of 2015 and up 10.9% from $5.684 billion in the third quarter of 2014. |
▪ | Sequentially, the increase in service revenues was primarily due to growth in the Company’s customer base from the continued success of T-Mobile’s Un-carrier initiatives and strong customer response to promotional activities. |
▪ | Year-over-year, the increase in service revenues was primarily due to growth in the Company’s customer base from the continued success of T-Mobile’s Un-carrier initiatives and strong customer response to promotional activities as well as the success of the Company’s prepaid brands, partially offset by lower branded postpaid phone ARPU. |

15
Equipment Revenues
▪ | Equipment revenues were $1.416 billion in the third quarter of 2015, down 26.1% from $1.915 billion in the second quarter of 2015 and down 9.3% from $1.561 billion in the third quarter of 2014. |
▪ | The sequential and year-over-year decrease was primarily due to a mix shift to the JUMP! On Demand program. Under the JUMP! On Demand program, equipment revenues associated with leased devices are recognized over the term of the lease rather than at the time the device is delivered to the customer, resulting in lower equipment revenues for the quarter. In addition, customers leased a greater number of devices as well as a greater proportion of high-end devices under the JUMP! On Demand program in the third quarter of 2015, resulting in a lower number of devices sold and a lower average revenue per device sold in equipment revenues in the quarter. |

Total Revenues
▪ | T-Mobile is expected to again lead the industry in year-over-year total revenue growth in the third quarter of 2015. |
▪ | Total revenues were $7.849 billion in the third quarter of 2015, down 4.0% from $8.179 billion in the second quarter of 2015 and up 6.8% from $7.350 billion in the third quarter of 2014. |
▪ | Sequentially, the decrease in total revenues was primarily due to lower equipment revenues, partially offset by an increase in service revenues. |
▪ | Year-over-year, the increase in total revenues was primarily due to an increase in service revenues, partially offset by lower equipment revenues. |

16
OPERATING EXPENSES
Cost of Services
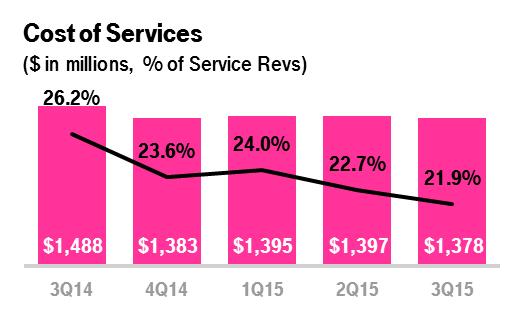
▪ | Cost of services was $1.378 billion in the third quarter of 2015, down 1.4% from $1.397 billion in the second quarter of 2015 and down 7.4% from $1.488 billion in the third quarter of 2014. |
▪ | Sequentially, the decrease was primarily due to lower backhaul expense related to changes in contractual arrangements with key vendors and decreased long distance costs, partially offset by increases in cost of services related to the network expansion and 700 MHz A-Block build out. Year-over-year, the decrease was primarily due to network synergies realized from the decommissioning of the MetroPCS CDMA network and lower regulatory program costs. |
Cost of Equipment Sales
▪ | Cost of equipment sales was $1.985 billion in the third quarter of 2015, down 25.4% from $2.661 billion in the second quarter of 2015 and down 14.0% from $2.308 billion in the third quarter of 2014. |
▪ | The sequential and year-over-year decrease was primarily due to a mix shift to JUMP! ON Demand. Under the JUMP! On Demand program, the cost of the leased device is recognized as depreciation expense over the term of the lease rather than recognized as cost of equipment sales at the time the device is delivered to the customer, resulting in lower cost of equipment sales for the quarter. In addition, customers leased a greater number of devices as well as a greater proportion of high-end devices under the JUMP! On Demand program in the third quarter of 2015, resulting in a lower number of devices sold and a lower average cost per device sold in cost of equipment sales. |

17
Selling, General and Admin. (SG&A) Expenses
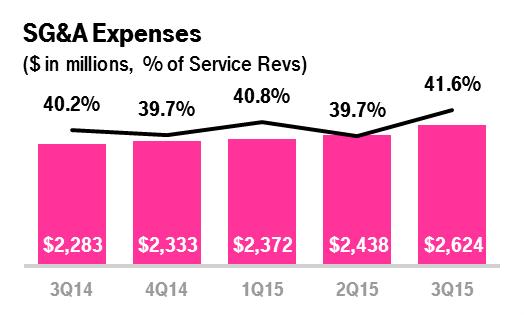
▪ | SG&A expenses were $2.624 billion in the third quarter of 2015, up 7.6% from $2.438 billion in the second quarter of 2015 and up 14.9% from $2.283 billion in the third quarter of 2014. |
▪ | Sequentially and year-over-year, the increase was primarily due to higher commissions as well as an increase in promotional costs. Additionally, higher employee-related expenses associated with increases in the number of retail, administrative, and customer support employees to support the growing customer base contributed to the year-over-year increase. |
Depreciation and Amortization (D&A)
▪ | D&A was $1.157 billion in the third quarter of 2015, up 7.6% from $1.075 billion in the second quarter of 2015 and up 1.7% from $1.138 billion in the third quarter of 2014. |
▪ | The sequential and year-over-year increase was primarily due to the build-out of T-Mobile’s LTE network and the mix shift to the JUMP! On Demand program. Under the JUMP! On Demand program, the cost of the leased device is recognized as depreciation expense over the term of the lease rather than recognized as cost of equipment sales when the device is delivered to the customer. Customers leased a greater number of devices as well as a greater proportion of high-end devices under the JUMP! On Demand program in the third quarter of 2015, resulting in higher depreciation expense. The year-over-year increase was offset in part by accelerated depreciation in 2014 related to T-Mobile’s modernization of the network. |

18
ADJUSTED EBITDA
▪ | T-Mobile is expected to again lead the industry in year-over-year Adjusted EBITDA growth in the third quarter of 2015. |
▪ | Adjusted EBITDA was $1.908 billion in the third quarter of 2015, up 5.0% from $1.817 billion in the second quarter of 2015 and up 41.8% from $1.346 billion in the third quarter of 2014. |
▪ | Sequentially and year-over-year, the increases in Adjusted EBITDA were primarily due to higher service revenues from growth in the customer base, strong cost control, especially in cost of services, and decreased losses on equipment sales, partially offset by higher SG&A expenses due to customer growth. |
▪ | Adjusted EBITDA margin was 30% in the third quarter of 2015, in line with 30% in the second quarter of 2015 and up from 24% in the third quarter of 2014. |
▪ | The aggregate impact from JUMP! On Demand and Data Stash on Adjusted EBITDA in the third quarter of 2015 was immaterial. |

19
NET INCOME AND EARNINGS PER SHARE
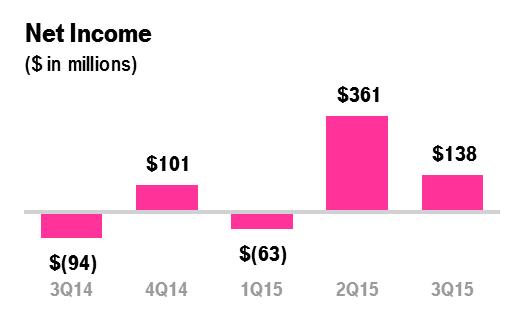
▪ | Net income was $138 million in the third quarter of 2015 compared to $361 million in the second quarter of 2015 and a net loss of $94 million in the third quarter of 2014. The sequential decrease in net income was primarily due to lower operating income, including higher decommissioning costs associated with MetroPCS CDMA network shutdowns, and higher income tax expense compared to the second quarter of 2015, which included the recognition of income tax benefits for discrete items. The year-over-year increase was primarily due to higher operating income, partially offset by higher income tax expense. |
▪ | Earnings per share was $0.15 in the third quarter of 2015 compared to earnings per share of $0.42 in the second quarter of 2015 and a loss per share of $(0.12) in the third quarter of 2014. |
▪ | T-Mobile expects to report positive earnings per share in the fourth quarter of 2015 and for the full-year 2015. |
CAPITAL EXPENDITURES
▪ | Cash capital expenditures for property and equipment were $1.120 billion in the third quarter of 2015 compared to $1.191 billion in the second quarter of 2015 and $1.131 billion in the third quarter of 2014. The sequential and year-over-year decrease was primarily due to the timing of network spend in connection with T-Mobile’s modernization program and the build out of 4G LTE on the 700 MHz A-Block and 1900 MHz PCS spectrum. |

20
FREE CASH FLOW
▪ | Net cash provided by operating activities was $1.531 billion in the third quarter of 2015, compared to $1.161 billion in the second quarter of 2015 and $1.062 billion in the third quarter of 2014. |
▪ | Free Cash Flow was $411 million in the third quarter of 2015, compared to a loss of $30 million in the second quarter of 2015 and a loss of $69 million in the third quarter of 2014. Sequentially and year-over-year, the improvement in Free Cash Flow was due to higher net cash provided by operating activities and lower cash capital expenditures. |
▪ | Adjusted Free Cash Flow was $487 million in the third quarter of 2015, compared to Adjusted Free Cash Flow of $73 million in the second quarter of 2015 and a loss of $54 million in the third quarter of 2014. Adjusted Free Cash Flow excludes decommissioning payments related to the one-time shutdown of the CDMA portion of the MetroPCS network from Free Cash Flow. Decommissioning payments in the third quarter of 2015 were $76 million, compared to $103 million in the second quarter of 2015 and $15 million in the third quarter of 2014. |
▪ | The Company expects Free Cash Flow will be positive for the full-year 2015. |


21
CAPITAL STRUCTURE
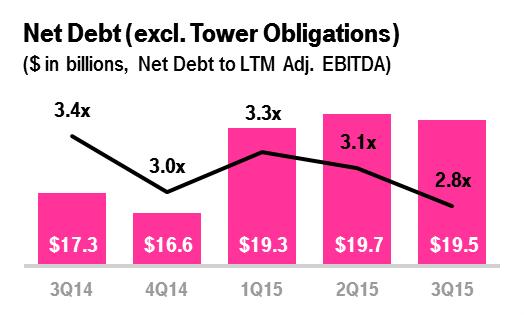
▪ | Net debt, excluding tower obligations, at the end of the third quarter of 2015 was $19.5 billion. |
▪ | Total debt, excluding tower obligations, at the end of the third quarter of 2015 was $22.2 billion and was comprised of short-term debt of $0.1 billion, long-term debt to affiliates of $5.6 billion, and long-term debt of $16.5 billion. |
▪ | The ratio of net debt, excluding tower obligations, to Adjusted EBITDA for the trailing last twelve month (“LTM”) period was 2.8x at the end of the third quarter of 2015 compared to 3.1x at the end of the second quarter of 2015 and 3.4x at the end of the third quarter of 2014. |
▪ | The Company’s cash position remains strong with $2.6 billion in cash at the end of the third quarter of 2015. The cash balance remained stable in the third quarter of 2015 compared to the second quarter of 2015. |
22
GUIDANCE
▪ | T-Mobile expects to drive further customer momentum while delivering strong growth in Adjusted EBITDA. |
▪ | With the success of T-Mobile's Simple Choice plan and the continued evolution of the Un-carrier strategy, branded postpaid net customer additions for full-year 2015 are now expected to be between 3.8 and 4.2 million, an increase from the previous guidance of 3.4 to 3.9 million. This is the third time in 2015 that T-Mobile has raised its full-year 2015 guidance for branded postpaid net customer additions. |
▪ | For full-year 2015, T-Mobile expects Adjusted EBITDA to be in the range of $6.8 to $7.2 billion, which is unchanged from previous guidance despite the increase in branded postpaid net customer additions guidance. |
▪ | Cash capital expenditures for full-year 2015 are expected to be in the range of $4.4 to $4.7 billion, which is unchanged from previous guidance. |
▪ | T-Mobile’s financial guidance for full-year 2015 excludes any impact from JUMP! On Demand and Data Stash. The Company will continue to disclose the aggregate impact from JUMP! On Demand and the non-cash impact from Data Stash in future quarters. |

UPCOMING EVENTS (All dates and attendance tentative)
▪ | Wells Fargo Technology, Media and Telecom Conference, November 11-12, 2015, New York, NY |
▪ | Morgan Stanley Annual Technology, Media and Telecom Conference, November 11-13, 2015, Barcelona, Spain |
▪ | UBS 42nd Annual Global Media and Communications Conference, December 7-9, 2015, New York, NY |
▪ | Citi’s 26th Annual Global Internet, Media and Telecom Conference, January 6-7, 2016, Las Vegas, NV |
▪ | T-Mobile US, Inc. Q4 2015 Earnings Report, February 9, 2016 |
23
CONTACT INFORMATION
Press:
Media Relations
T-Mobile US, Inc.
mediarelations@t-mobile.com
http://newsroom.t-mobile.com
Investor Relations:
Nils Paellmann, nils.paellmann@t-mobile.com
Ben Barrett, ben.barrett@t-mobile.com
Cristal Dunkin, cristal.dunkin@t-mobile.com
877-281-TMUS or 212-358-3210
investor.relations@t-mobile.com
http://investor.t-mobile.com
24
T-Mobile US, Inc.
Condensed Consolidated Balance Sheets
(Unaudited)
(in millions, except share and per share amounts) | September 30, 2015 | December 31, 2014 | |||||
Assets | |||||||
Current assets | |||||||
Cash and cash equivalents | $ | 2,633 | $ | 5,315 | |||
Accounts receivable, net of allowances of $101 and $83 | 1,810 | 1,865 | |||||
Equipment installment plan receivables, net | 3,397 | 3,062 | |||||
Accounts receivable from affiliates | 32 | 76 | |||||
Inventories | 1,236 | 1,085 | |||||
Deferred tax assets, net | 1,658 | 988 | |||||
Other current assets | 1,890 | 1,593 | |||||
Total current assets | 12,656 | 13,984 | |||||
Property and equipment, net | 18,101 | 16,245 | |||||
Goodwill | 1,683 | 1,683 | |||||
Spectrum licenses | 23,646 | 21,955 | |||||
Other intangible assets, net | 662 | 870 | |||||
Equipment installment plan receivables due after one year, net | 1,374 | 1,628 | |||||
Other assets | 351 | 288 | |||||
Total assets | $ | 58,473 | $ | 56,653 | |||
Liabilities and Stockholders' Equity | |||||||
Current liabilities | |||||||
Accounts payable and accrued liabilities | $ | 7,474 | $ | 7,364 | |||
Current payables to affiliates | 196 | 231 | |||||
Short-term debt | 114 | 87 | |||||
Deferred revenue | 649 | 459 | |||||
Other current liabilities | 410 | 635 | |||||
Total current liabilities | 8,843 | 8,776 | |||||
Long-term debt | 16,442 | 16,273 | |||||
Long-term debt to affiliates | 5,600 | 5,600 | |||||
Long-term financial obligation | 2,528 | 2,521 | |||||
Deferred tax liabilities | 5,566 | 4,873 | |||||
Deferred rents | 2,447 | 2,331 | |||||
Other long-term liabilities | 795 | 616 | |||||
Total long-term liabilities | 33,378 | 32,214 | |||||
Commitments and contingencies | |||||||
Stockholders' equity | |||||||
5.50% Mandatory Convertible Preferred Stock Series A, par value $0.00001 per share, 100,000,000 shares authorized; 20,000,000 and 20,000,000 shares issued and outstanding; $1,000 and $1,000 aggregate liquidation value | — | — | |||||
Common Stock, par value $0.00001 per share, 1,000,000,000 shares authorized; 817,406,151 and 808,851,108 shares issued, 816,023,646 and 807,468,603 shares outstanding | — | — | |||||
Additional paid-in capital | 38,658 | 38,503 | |||||
Treasury stock, at cost, 1,382,505 and 1,382,505 shares issued | — | — | |||||
Accumulated other comprehensive income (loss) | (1 | ) | 1 | ||||
Accumulated deficit | (22,405 | ) | (22,841 | ) | |||
Total stockholders' equity | 16,252 | 15,663 | |||||
Total liabilities and stockholders' equity | $ | 58,473 | $ | 56,653 | |||
25
T-Mobile US, Inc.
Condensed Consolidated Statements of Comprehensive Income (Loss)
(Unaudited)
Three Months Ended | Nine Months Ended September 30, | ||||||||||||||||||
(in millions, except shares and per share amounts) | September 30, 2015 | June 30, 2015 | September 30, 2014 | 2015 | 2014 | ||||||||||||||
Revenues | |||||||||||||||||||
Branded postpaid revenues | $ | 4,197 | $ | 4,075 | $ | 3,670 | $ | 12,046 | $ | 10,628 | |||||||||
Branded prepaid revenues | 1,894 | 1,861 | 1,790 | 5,597 | 5,174 | ||||||||||||||
Wholesale revenues | 170 | 164 | 171 | 492 | 517 | ||||||||||||||
Roaming and other service revenues | 41 | 44 | 53 | 130 | 186 | ||||||||||||||
Total service revenues | 6,302 | 6,144 | 5,684 | 18,265 | 16,505 | ||||||||||||||
Equipment revenues | 1,416 | 1,915 | 1,561 | 5,182 | 4,609 | ||||||||||||||
Other revenues | 131 | 120 | 105 | 359 | 296 | ||||||||||||||
Total revenues | 7,849 | 8,179 | 7,350 | 23,806 | 21,410 | ||||||||||||||
Operating expenses | |||||||||||||||||||
Cost of services, exclusive of depreciation and amortization shown separately below | 1,378 | 1,397 | 1,488 | 4,170 | 4,405 | ||||||||||||||
Cost of equipment sales | 1,985 | 2,661 | 2,308 | 7,325 | 6,809 | ||||||||||||||
Selling, general and administrative | 2,624 | 2,438 | 2,283 | 7,434 | 6,530 | ||||||||||||||
Depreciation and amortization | 1,157 | 1,075 | 1,138 | 3,319 | 3,322 | ||||||||||||||
Cost of MetroPCS business combination | 193 | 34 | 97 | 355 | 131 | ||||||||||||||
Gains on disposal of spectrum licenses | (1 | ) | (23 | ) | (13 | ) | (24 | ) | (770 | ) | |||||||||
Total operating expenses | 7,336 | 7,582 | 7,301 | 22,579 | 20,427 | ||||||||||||||
Operating income | 513 | 597 | 49 | 1,227 | 983 | ||||||||||||||
Other income (expense) | |||||||||||||||||||
Interest expense to affiliates | (121 | ) | (92 | ) | (83 | ) | (277 | ) | (186 | ) | |||||||||
Interest expense | (262 | ) | (257 | ) | (260 | ) | (780 | ) | (807 | ) | |||||||||
Interest income | 109 | 114 | 97 | 335 | 255 | ||||||||||||||
Other income (expense), net | (1 | ) | 1 | (14 | ) | (8 | ) | (32 | ) | ||||||||||
Total other expense, net | (275 | ) | (234 | ) | (260 | ) | (730 | ) | (770 | ) | |||||||||
Income (loss) before income taxes | 238 | 363 | (211 | ) | 497 | 213 | |||||||||||||
Income tax expense (benefit) | 100 | 2 | (117 | ) | 61 | 67 | |||||||||||||
Net income (loss) | 138 | 361 | (94 | ) | 436 | 146 | |||||||||||||
Dividends on preferred stock | (13 | ) | (14 | ) | — | (41 | ) | — | |||||||||||
Net income (loss) attributable to common stockholders | $ | 125 | $ | 347 | $ | (94 | ) | $ | 395 | $ | 146 | ||||||||
Other comprehensive income (loss), net of tax | |||||||||||||||||||
Unrealized gain (loss) on available-for-sale securities, net of tax effect of ($1), $0, $0, ($2) and ($1) | (2 | ) | — | 1 | (2 | ) | (2 | ) | |||||||||||
Other comprehensive income (loss), net of tax | (2 | ) | — | 1 | (2 | ) | (2 | ) | |||||||||||
Total comprehensive income (loss) | $ | 136 | $ | 361 | $ | (93 | ) | $ | 434 | $ | 144 | ||||||||
Earnings (loss) per share | |||||||||||||||||||
Basic | $ | 0.15 | $ | 0.43 | $ | (0.12 | ) | $ | 0.49 | $ | 0.18 | ||||||||
Diluted | $ | 0.15 | $ | 0.42 | $ | (0.12 | ) | $ | 0.48 | $ | 0.18 | ||||||||
Weighted average shares outstanding | |||||||||||||||||||
Basic | 815,069,272 | 811,605,031 | 807,221,761 | 811,783,620 | 804,572,685 | ||||||||||||||
Diluted | 822,017,220 | 821,122,537 | 807,221,761 | 820,514,748 | 813,507,827 | ||||||||||||||
26
T-Mobile US, Inc.
Condensed Consolidated Statements of Cash Flows
(Unaudited)
Nine Months Ended September 30, | |||||||
(in millions) | 2015 | 2014 | |||||
Operating activities | |||||||
Net cash provided by operating activities | $ | 3,181 | $ | 2,791 | |||
Investing activities | |||||||
Purchases of property and equipment | (3,293 | ) | (3,018 | ) | |||
Purchases of spectrum licenses and other intangible assets | (1,938 | ) | (2,390 | ) | |||
Other, net | (7 | ) | (32 | ) | |||
Net cash used in investing activities | (5,238 | ) | (5,440 | ) | |||
Financing activities | |||||||
Proceeds from issuance of long-term debt | — | 2,993 | |||||
Repayments of short-term debt for purchases of inventory, property and equipment, net | (563 | ) | (414 | ) | |||
Other, net | (62 | ) | (34 | ) | |||
Net cash provided by (used in) financing activities | (625 | ) | 2,545 | ||||
Change in cash and cash equivalents | (2,682 | ) | (104 | ) | |||
Cash and cash equivalents | |||||||
Beginning of period | 5,315 | 5,891 | |||||
End of period | $ | 2,633 | $ | 5,787 | |||
27
T-Mobile US, Inc. Supplementary Operating and Financial Data
Quarter | Nine Months Ended September 30, | |||||||||||||||||||||||||
(in thousands) | Q1 2014 | Q2 2014 | Q3 2014 | Q4 2014 | Q1 2015 | Q2 2015 | Q3 2015 | 2014 | 2015 | |||||||||||||||||
Customers, end of period | ||||||||||||||||||||||||||
Branded postpaid phone customers | 23,054 | 23,633 | 24,807 | 25,844 | 26,835 | 27,595 | 28,438 | 24,807 | 28,438 | |||||||||||||||||
Branded postpaid mobile broadband customers | 568 | 897 | 1,102 | 1,341 | 1,475 | 1,723 | 1,965 | 1,102 | 1,965 | |||||||||||||||||
Total branded postpaid customers | 23,622 | 24,530 | 25,909 | 27,185 | 28,310 | 29,318 | 30,403 | 25,909 | 30,403 | |||||||||||||||||
Branded prepaid customers | 15,537 | 15,639 | 16,050 | 16,316 | 16,389 | 16,567 | 17,162 | 16,050 | 17,162 | |||||||||||||||||
Total branded customers | 39,159 | 40,169 | 41,959 | 43,501 | 44,699 | 45,885 | 47,565 | 41,959 | 47,565 | |||||||||||||||||
Wholesale customers | 9,916 | 10,376 | 10,931 | 11,517 | 12,137 | 13,023 | 13,655 | 10,931 | 13,655 | |||||||||||||||||
Total customers, end of period | 49,075 | 50,545 | 52,890 | 55,018 | 56,836 | 58,908 | 61,220 | 52,890 | 61,220 | |||||||||||||||||
Quarter | Nine Months Ended September 30, | |||||||||||||||||||||||||
(in thousands) | Q1 2014 | Q2 2014 | Q3 2014 | Q4 2014 | Q1 2015 | Q2 2015 | Q3 2015 | 2014 | 2015 | |||||||||||||||||
Net customer additions | ||||||||||||||||||||||||||
Branded postpaid phone customers | 1,256 | 579 | 1,175 | 1,037 | 991 | 760 | 843 | 3,010 | 2,594 | |||||||||||||||||
Branded postpaid mobile broadband customers | 67 | 329 | 204 | 239 | 134 | 248 | 242 | 600 | 624 | |||||||||||||||||
Total branded postpaid customers | 1,323 | 908 | 1,379 | 1,276 | 1,125 | 1,008 | 1,085 | 3,610 | 3,218 | |||||||||||||||||
Branded prepaid customers | 465 | 102 | 411 | 266 | 73 | 178 | 595 | 978 | 846 | |||||||||||||||||
Total branded customers | 1,788 | 1,010 | 1,790 | 1,542 | 1,198 | 1,186 | 1,680 | 4,588 | 4,064 | |||||||||||||||||
Wholesale customers | 603 | 460 | 555 | 586 | 620 | 886 | 632 | 1,618 | 2,138 | |||||||||||||||||
Total net customer additions | 2,391 | 1,470 | 2,345 | 2,128 | 1,818 | 2,072 | 2,312 | 6,206 | 6,202 | |||||||||||||||||
Note: Certain customer numbers may not add due to rounding.
Quarter | Nine Months Ended September 30, | |||||||||||||||||||||||||
Q1 2014 | Q2 2014 | Q3 2014 | Q4 2014 | Q1 2015 | Q2 2015 | Q3 2015 | 2014 | 2015 | ||||||||||||||||||
Branded postpaid phone churn | 1.47 | % | 1.48 | % | 1.64 | % | 1.73 | % | 1.30 | % | 1.32 | % | 1.46 | % | 1.53 | % | 1.36 | % | ||||||||
Branded prepaid churn | 4.34 | % | 4.50 | % | 4.78 | % | 5.39 | % | 4.62 | % | 4.93 | % | 4.09 | % | 4.54 | % | 4.54 | % | ||||||||
28
T-Mobile US, Inc. Supplementary Operating and Financial Data (continued)
Quarter | Nine Months Ended September 30, | ||||||||||||||||
Q1 2014 | Q2 2014 | Q3 2014 | Q4 2014 | Q1 2015 | Q2 2015 | Q3 2015 | 2014 | 2015 | |||||||||
Financial Metrics | |||||||||||||||||
Service revenues (in millions) | $5,337 | $5,484 | $5,684 | $5,870 | $5,819 | $6,144 | $6,302 | $16,505 | $18,265 | ||||||||
Total revenues (in millions) | $6,875 | $7,185 | $7,350 | $8,154 | $7,778 | $8,179 | $7,849 | $21,410 | $23,806 | ||||||||
Adjusted EBITDA (in millions) | $1,088 | $1,451 | $1,346 | $1,751 | $1,388 | $1,817 | $1,908 | $3,885 | $5,113 | ||||||||
Adjusted EBITDA margin | 20% | 26% | 24% | 30% | 24% | 30% | 30% | 24% | 28% | ||||||||
Net income (loss) (in millions) | $(151) | $391 | $(94) | $101 | $(63) | $361 | $138 | $146 | $436 | ||||||||
Cash capex - Property & Equipment (in millions) | $947 | $940 | $1,131 | $1,299 | $982 | $1,191 | $1,120 | $3,018 | $3,293 | ||||||||
Revenue Metrics | |||||||||||||||||
Branded postpaid ARPA | $108.97 | $107.11 | $109.80 | $109.87 | $108.04 | $113.50 | $115.10 | $108.63 | $112.27 | ||||||||
Branded postpaid ABPA | $129.74 | $131.81 | $138.73 | $143.79 | $145.03 | $152.31 | $154.56 | $133.50 | $150.70 | ||||||||
Branded postpaid accounts, end of period | 10,812 | 11,017 | 11,297 | 11,506 | 11,831 | 12,061 | 12,250 | 11,297 | 12,250 | ||||||||
Branded postpaid customers per account | 2.18 | 2.23 | 2.29 | 2.36 | 2.39 | 2.43 | 2.48 | 2.29 | 2.48 | ||||||||
Branded postpaid phone ARPU | $50.48 | $49.32 | $49.84 | $48.26 | $46.43 | $48.19 | $47.99 | $49.87 | $47.55 | ||||||||
Branded postpaid ABPU | $59.54 | $59.79 | $61.59 | $61.80 | $60.94 | $63.29 | $62.96 | $60.34 | $62.42 | ||||||||
Branded prepaid ARPU | $36.09 | $37.16 | $37.59 | $37.51 | $37.81 | $37.83 | $37.46 | $36.96 | $37.70 | ||||||||
Device Sales and Leased Devices | |||||||||||||||||
Smartphone units (in millions) | 6.9 | 6.2 | 6.9 | 8.0 | 8.0 | 7.4 | 8.1 | 20.0 | 23.5 | ||||||||
Branded postpaid handset upgrade rate | 7% | 8% | 9% | 11% | 8% | 9% | 9% | 24% | 26% | ||||||||
Device Financing | |||||||||||||||||
EIP financed (in millions) | $1,249 | $1,342 | $1,317 | $1,902 | $1,483 | $1,697 | $1,107 | $3,908 | $4,287 | ||||||||
EIP billings and lease revenues (in millions) | $657 | $810 | $967 | $1,162 | $1,292 | $1,393 | $1,439 | $2,434 | $4,124 | ||||||||
EIP receivables, net (in millions) | $3,086 | $3,583 | $3,963 | $4,690 | $4,842 | $5,114 | $4,771 | $3,963 | $4,771 | ||||||||
Lease devices transferred from inventory to property and equipment, net (in millions) | $— | $— | $— | $— | $— | $— | $822 | $— | $822 | ||||||||
Customer Quality | |||||||||||||||||
EIP receivables classified as prime | 53% | 53% | 53% | 54% | 52% | 52% | 52% | 53% | 52% | ||||||||
Total bad debt expense and losses from factoring arrangement (in millions) | $157 | $164 | $152 | $150 | $169 | $156 | $198 | $473 | $523 | ||||||||
29
T-Mobile US, Inc.
Reconciliation of Non-GAAP Financial Measures to GAAP Financial Measures
(Unaudited)
This Investor Factbook includes non-GAAP financial measures. The non-GAAP financial measures should be considered in addition to, but not as a substitute for, the information provided in accordance with GAAP. Reconciliations for the non-GAAP financial measures to the most directly comparable GAAP financial measures are provided below.
Adjusted EBITDA is reconciled to net income (loss) as follows:
Quarter | Nine Months Ended September 30, | ||||||||||||||||||||||||||||||||||
(in millions) | Q1 2014 | Q2 2014 | Q3 2014 | Q4 2014 | Q1 2015 | Q2 2015 | Q3 2015 | 2014 | 2015 | ||||||||||||||||||||||||||
Net income (loss) | $ | (151 | ) | $ | 391 | $ | (94 | ) | $ | 101 | $ | (63 | ) | $ | 361 | $ | 138 | $ | 146 | $ | 436 | ||||||||||||||
Adjustments: | |||||||||||||||||||||||||||||||||||
Interest expense to affiliates | 18 | 85 | 83 | 92 | 64 | 92 | 121 | 186 | 277 | ||||||||||||||||||||||||||
Interest expense | 276 | 271 | 260 | 266 | 261 | 257 | 262 | 807 | 780 | ||||||||||||||||||||||||||
Interest income | (75 | ) | (83 | ) | (97 | ) | (104 | ) | (112 | ) | (114 | ) | (109 | ) | (255 | ) | (335 | ) | |||||||||||||||||
Other expense (income), net | 6 | 12 | 14 | (21 | ) | 8 | (1 | ) | 1 | 32 | 8 | ||||||||||||||||||||||||
Income tax expense (benefit) | (102 | ) | 286 | (117 | ) | 99 | (41 | ) | 2 | 100 | 67 | 61 | |||||||||||||||||||||||
Operating income (loss) | (28 | ) | 962 | 49 | 433 | 117 | 597 | 513 | 983 | 1,227 | |||||||||||||||||||||||||
Depreciation and amortization | 1,055 | 1,129 | 1,138 | 1,090 | 1,087 | 1,075 | 1,157 | 3,322 | 3,319 | ||||||||||||||||||||||||||
Cost of MetroPCS business combination | 12 | 22 | 97 | 168 | 128 | 34 | 193 | 131 | 355 | ||||||||||||||||||||||||||
Stock based compensation | 49 | 63 | 45 | 54 | 56 | 71 | 43 | 157 | 170 | ||||||||||||||||||||||||||
Gains on disposal of spectrum licenses (1) | — | (731 | ) | 11 | — | — | — | — | (720 | ) | — | ||||||||||||||||||||||||
Other, net | — | 6 | 6 | 6 | — | 40 | 2 | 12 | 42 | ||||||||||||||||||||||||||
Adjusted EBITDA | $ | 1,088 | $ | 1,451 | $ | 1,346 | $ | 1,751 | $ | 1,388 | $ | 1,817 | $ | 1,908 | $ | 3,885 | $ | 5,113 | |||||||||||||||||
(1) | Gains on disposal of spectrum licenses may not agree to the Condensed Consolidated Statements of Comprehensive Income (Loss) primarily due to certain routine operating activities, such as insignificant or routine spectrum license exchanges that would be expected to reoccur, and are therefore included in Adjusted EBITDA. |
30
T-Mobile US, Inc.
Reconciliation of Non-GAAP Financial Measures to GAAP Financial Measures (continued)
(Unaudited)
The following tables illustrate the calculation of ARPA and ABPA and reconcile these measures to the related service revenues, which we consider to be the most directly comparable GAAP financial measure to ARPA and ABPA:
Quarter | Nine Months Ended September 30, | ||||||||||||||||||||||||||||||||||
(in millions, except average number of accounts, ARPA and ABPA) | Q1 2014 | Q2 2014 | Q3 2014 | Q4 2014 | Q1 2015 | Q2 2015 | Q3 2015 | 2014 | 2015 | ||||||||||||||||||||||||||
Calculation of Branded Postpaid ARPA | |||||||||||||||||||||||||||||||||||
Branded postpaid service revenues | $ | 3,447 | $ | 3,511 | $ | 3,670 | $ | 3,764 | $ | 3,774 | $ | 4,075 | $ | 4,197 | $ | 10,628 | $ | 12,046 | |||||||||||||||||
Divided by: Average number of branded postpaid accounts (in thousands) and number of months in period | 10,543 | 10,928 | 11,141 | 11,421 | 11,645 | 11,966 | 12,154 | 10,871 | 11,922 | ||||||||||||||||||||||||||
Branded postpaid ARPA | $ | 108.97 | $ | 107.11 | $ | 109.80 | $ | 109.87 | $ | 108.04 | $ | 113.50 | $ | 115.10 | $ | 108.63 | $ | 112.27 | |||||||||||||||||
Calculation of Branded Postpaid ABPA | |||||||||||||||||||||||||||||||||||
Branded postpaid service revenues | $ | 3,447 | $ | 3,511 | $ | 3,670 | $ | 3,764 | $ | 3,774 | $ | 4,075 | $ | 4,197 | $ | 10,628 | $ | 12,046 | |||||||||||||||||
Add: EIP billings and lease revenues | 657 | 810 | 967 | 1,162 | 1,292 | 1,393 | 1,439 | 2,434 | 4,124 | ||||||||||||||||||||||||||
Total billings for branded postpaid customers | $ | 4,104 | $ | 4,321 | $ | 4,637 | $ | 4,926 | $ | 5,066 | $ | 5,468 | $ | 5,636 | $ | 13,062 | $ | 16,170 | |||||||||||||||||
Divided by: Average number of branded postpaid accounts (in thousands) and number of months in period | 10,543 | 10,928 | 11,141 | 11,421 | 11,645 | 11,966 | 12,154 | 10,871 | 11,922 | ||||||||||||||||||||||||||
Branded postpaid ABPA | $ | 129.74 | $ | 131.81 | $ | 138.73 | $ | 143.79 | $ | 145.03 | $ | 152.31 | $ | 154.56 | $ | 133.50 | $ | 150.70 | |||||||||||||||||
31
T-Mobile US, Inc.
Reconciliation of Non-GAAP Financial Measures to GAAP Financial Measures (continued)
(Unaudited)
The following tables illustrate the calculation of ARPU and ABPU and reconcile these measures to the related service revenues, which we consider to be the most directly comparable GAAP financial measure to ARPU and ABPU:
Quarter | Nine Months Ended September 30, | ||||||||||||||||||||||||||||||||||
(in millions, except average number of customers, ARPU and ABPU) | Q1 2014 | Q2 2014 | Q3 2014 | Q4 2014 | Q1 2015 | Q2 2015 | Q3 2015 | 2014 | 2015 | ||||||||||||||||||||||||||
Calculation of Branded Postpaid Phone ARPU | |||||||||||||||||||||||||||||||||||
Branded postpaid service revenues | $ | 3,447 | $ | 3,511 | $ | 3,670 | $ | 3,764 | $ | 3,774 | $ | 4,075 | $ | 4,197 | $ | 10,628 | $ | 12,046 | |||||||||||||||||
Less: Branded postpaid mobile broadband revenues | (47 | ) | (54 | ) | (68 | ) | (92 | ) | (109 | ) | (135 | ) | (165 | ) | (169 | ) | (409 | ) | |||||||||||||||||
Branded postpaid phone service revenues | $ | 3,400 | $ | 3,457 | $ | 3,602 | $ | 3,672 | $ | 3,665 | $ | 3,940 | $ | 4,032 | $ | 10,459 | $ | 11,637 | |||||||||||||||||
Divided by: Average number of branded postpaid phone customers (in thousands) and number of months in period | 22,447 | 23,368 | 24,091 | 25,359 | 26,313 | 27,250 | 28,003 | 23,302 | 27,189 | ||||||||||||||||||||||||||
Branded postpaid phone ARPU | $ | 50.48 | $ | 49.32 | $ | 49.84 | $ | 48.26 | $ | 46.43 | $ | 48.19 | $ | 47.99 | $ | 49.87 | $ | 47.55 | |||||||||||||||||
Calculation of Branded Postpaid ABPU | |||||||||||||||||||||||||||||||||||
Branded postpaid service revenues | $ | 3,447 | $ | 3,511 | $ | 3,670 | $ | 3,764 | $ | 3,774 | $ | 4,075 | $ | 4,197 | $ | 10,628 | $ | 12,046 | |||||||||||||||||
Add: EIP billings and lease revenues | 657 | 810 | 967 | 1,162 | 1,292 | 1,393 | 1,439 | 2,434 | 4,124 | ||||||||||||||||||||||||||
Total billings for branded postpaid customers | $ | 4,104 | $ | 4,321 | $ | 4,637 | $ | 4,926 | $ | 5,066 | $ | 5,468 | $ | 5,636 | $ | 13,062 | $ | 16,170 | |||||||||||||||||
Divided by: Average number of branded postpaid customers (in thousands) and number of months in period | 22,975 | 24,092 | 25,095 | 26,572 | 27,717 | 28,797 | 29,838 | 24,054 | 28,784 | ||||||||||||||||||||||||||
Branded postpaid ABPU | $ | 59.54 | $ | 59.79 | $ | 61.59 | $ | 61.80 | $ | 60.94 | $ | 63.29 | $ | 62.96 | $ | 60.34 | $ | 62.42 | |||||||||||||||||
Calculation of Branded Prepaid ARPU | |||||||||||||||||||||||||||||||||||
Branded prepaid service revenues | $ | 1,648 | $ | 1,736 | $ | 1,790 | $ | 1,812 | $ | 1,842 | $ | 1,861 | $ | 1,894 | $ | 5,174 | $ | 5,597 | |||||||||||||||||
Divided by: Average number of branded prepaid customers (in thousands) and number of months in period | 15,221 | 15,569 | 15,875 | 16,097 | 16,238 | 16,396 | 16,853 | 15,555 | 16,496 | ||||||||||||||||||||||||||
Branded prepaid ARPU | $ | 36.09 | $ | 37.16 | $ | 37.59 | $ | 37.51 | $ | 37.81 | $ | 37.83 | $ | 37.46 | $ | 36.96 | $ | 37.70 | |||||||||||||||||
32
T-Mobile US, Inc.
Reconciliation of Non-GAAP Financial Measures to GAAP Financial Measures (continued)
(Unaudited)
Net debt (excluding Tower Obligations) to last twelve months adjusted EBITDA ratio is calculated as follows:
Three Months Ended | |||||||||||||||||||||||||||
(in millions, except net debt ratio) | Mar 31, 2014 | Jun 30, 2014 | Sep 30, 2014 | Dec 31, 2014 | Mar 31, 2015 | Jun 30, 2015 | Sep 30, 2015 | ||||||||||||||||||||
Short-term debt | $ | 151 | $ | 272 | $ | 1,168 | $ | 87 | $ | 467 | $ | 386 | $ | 114 | |||||||||||||
Long-term debt to affiliates | 5,600 | 5,600 | 5,600 | 5,600 | 5,600 | 5,600 | 5,600 | ||||||||||||||||||||
Long-term debt | 14,331 | 14,369 | 16,284 | 16,273 | 16,261 | 16,386 | 16,442 | ||||||||||||||||||||
Less: Cash and cash equivalents | (5,471 | ) | (3,080 | ) | (5,787 | ) | (5,315 | ) | (3,032 | ) | (2,642 | ) | (2,633 | ) | |||||||||||||
Net Debt (excluding Tower Obligations) | $ | 14,611 | $ | 17,161 | $ | 17,265 | $ | 16,645 | $ | 19,296 | $ | 19,730 | $ | 19,523 | |||||||||||||
Divided by: Last twelve months Adjusted EBITDA (1) | $ | 4,936 | $ | 5,122 | $ | 5,124 | $ | 5,636 | $ | 5,936 | $ | 6,302 | $ | 6,864 | |||||||||||||
Net Debt (excluding Tower Obligations) to Last Twelve Months Adjusted EBITDA Ratio | 3.0 | 3.4 | 3.4 | 3.0 | 3.3 | 3.1 | 2.8 | ||||||||||||||||||||
(1) | March 31, 2014 Adjusted EBITDA for the last twelve months includes Pro Forma combined results from Q2 2013 to reflect the results of MetroPCS prior to the business combination. |
Free cash flow and adjusted free cash flow are calculated as follows:
Quarter | Nine Months Ended September 30, | ||||||||||||||||||||||||||||||||||
(in millions) | Q1 2014 | Q2 2014 | Q3 2014 | Q4 2014 | Q1 2015 | Q2 2015 | Q3 2015 | 2014 | 2015 | ||||||||||||||||||||||||||
Net cash provided by operating activities | $ | 759 | $ | 970 | $ | 1,062 | $ | 1,355 | $ | 489 | $ | 1,161 | $ | 1,531 | $ | 2,791 | $ | 3,181 | |||||||||||||||||
Cash purchases of property and equipment | (947 | ) | (940 | ) | (1,131 | ) | (1,299 | ) | (982 | ) | (1,191 | ) | (1,120 | ) | (3,018 | ) | (3,293 | ) | |||||||||||||||||
Free Cash Flow | (188 | ) | 30 | (69 | ) | 56 | (493 | ) | (30 | ) | 411 | (227 | ) | (112 | ) | ||||||||||||||||||||
MetroPCS CDMA network decommissioning payments | 9 | 5 | 15 | 52 | 71 | 103 | 76 | 29 | 250 | ||||||||||||||||||||||||||
Adjusted Free Cash Flow | $ | (179 | ) | $ | 35 | $ | (54 | ) | $ | 108 | $ | (422 | ) | $ | 73 | $ | 487 | $ | (198 | ) | $ | 138 | |||||||||||||
33
Definitions of Terms
Operating and financial measures are utilized by T-Mobile's management to evaluate its operating performance and, in certain cases, its ability to meet liquidity requirements. Although companies in the wireless industry may not define measures in precisely the same way, T-Mobile believes the measures facilitate key operating performance comparisons with other companies in the wireless industry to provide management, investors, and analysts with useful information to assess and evaluate past performance and assist in forecasting future performance.
1. | Customer - SIM card with a unique T-Mobile mobile identity number which generates revenue. Branded customers generally include customers that are qualified either for postpaid service, where they generally pay after incurring service, or prepaid service, where they generally pay in advance. Wholesale customers include Machine-to-Machine (M2M) and Mobile Virtual Network Operator (MVNO) customers that operate on T-Mobile's network, but are managed by wholesale partners. |
2. | Churn - Number of customers whose service was discontinued as a percentage of the average number of customers during the specified period. |
3. | Customers per account - The number of branded postpaid customers as of the end of the period divided by the number of branded postpaid accounts as of the end of the period. An account may include branded postpaid phone and mobile broadband customers. |
4. | Average Revenue Per Account (ARPA) - Average monthly branded postpaid service revenue earned per account. Branded postpaid service revenues for the specified period divided by the average number of branded postpaid accounts during the period, further divided by the number of months in the period. T-Mobile considers branded postpaid ARPA to be indicative of its revenue growth potential given the increase in the average number of branded postpaid phone customers per account and increased penetration of mobile broadband devices. |
Average Billings Per Account (ABPA) - Average monthly branded postpaid service revenue earned from customers plus equipment installment plan (EIP) billings and lease revenues divided by the average number of branded postpaid accounts during the period, further divided by the number of months in the period. T-Mobile believes average branded postpaid customer billings per account is indicative of estimated cash collections, including device financing payments, from T-Mobile's customers each month on a per account basis.
Average Revenue Per User (ARPU) - Average monthly service revenue earned from customers. Service revenues for the specified period divided by the average customers during the period, further divided by the number of months in the period.
Branded postpaid phone ARPU excludes mobile broadband customers and related revenues.
Average Billings per User (ABPU) - Average monthly branded postpaid service revenue earned from customers plus EIP billings and lease revenues divided by the average branded postpaid customers during the period, further divided by the number of months in the period. T-Mobile believes branded postpaid ABPU is indicative of estimated cash collections, including device financing payments, from T-Mobile's customers each month.
Service revenues - Branded postpaid, including handset insurance, branded prepaid, wholesale, and roaming and other service revenues.
5. | Cost of services - Costs directly attributable to providing wireless service through the operation of T-Mobile's network, including direct switch and cell site costs, such as rent, network access and transport costs, utilities, maintenance, associated labor costs, long distance costs, regulatory program costs, roaming fees paid to other carriers and data content costs. |
Cost of equipment sales - Costs of devices and accessories sold to customers and dealers, device costs to fulfill insurance and warranty claims, write-downs of inventory related to shrinkage and obsolescence, and shipping and handling costs.
Selling, general and administrative expenses - Costs not directly attributable to providing wireless service for the operation of sales, customer care and corporate activities. These include commissions paid to dealers and retail employees for activations and upgrades, labor and facilities costs associated with retail sales force and administrative space, marketing and promotional costs, customer support and billing, bad debt expense and administrative support activities.
6. | Adjusted EBITDA - Earnings before interest expense (net of interest income), tax, depreciation, amortization, stock-based compensation and expenses not reflective of T-Mobile's ongoing operating performance. Adjusted EBITDA margin represents Adjusted EBITDA divided by service revenues. Adjusted EBITDA is a non-GAAP financial measure utilized by T-Mobile's management to monitor the financial performance of its operations. T-Mobile uses Adjusted EBITDA internally as a metric to evaluate and compensate its personnel and management for their performance, and as a benchmark to evaluate T-Mobile's operating performance in comparison to its competitors. Management believes analysts and investors use Adjusted EBITDA as a supplemental measure to evaluate overall operating performance and facilitate comparisons with other wireless communications companies. Adjusted EBITDA has limitations as an analytical tool and should not be considered in isolation or as a substitute for income from operations, net income, or any other measure of financial performance reported in accordance with GAAP. The reconciliation of Adjusted EBITDA to net income (loss) is detailed in the Reconciliation of Non-GAAP Financial Measures to GAAP Financial Measures schedule. |
7. | Cash capital expenditures - Amounts paid for construction and the purchase of property and equipment. |
8. | Smartphones - UMTS/HSPA/HSPA+ 21/HSPA+ 42/4G LTE enabled converged devices, which integrate voice and data services. |
9. | Free Cash Flow - Net cash provided by operating activities less cash capital expenditures for property and equipment. Free Cash Flow is utilized by T-Mobile's management, investors, and analysts to evaluate cash available to pay debt and provide further investment in the business. The reconciliation of Free Cash Flow to net cash provided by operating activities is detailed in the Reconciliation of Non-GAAP Financial Measures to GAAP Financial Measures schedule. |
34
Definitions of Terms (continued)
10. | Adjusted Free Cash Flow - Free Cash Flow excluding decommissioning payments related to the shutdown of the CDMA portion of the MetroPCS network. |
11. | Net debt - Short-term debt, long-term debt to affiliates, and long-term debt (excluding tower obligations), less cash and cash equivalents. |
35
Forward-Looking Statements
This Investor Factbook includes "forward-looking statements" within the meaning of the U.S. federal securities laws. Any statements made herein that are not statements of historical fact, including statements about T-Mobile US, Inc.'s plans, outlook, beliefs, opinion, projections, guidance, strategy, integration of MetroPCS, expected network modernization and other advancements, are forward-looking statements. Generally, forward-looking statements may be identified by words such as "anticipate," "expect," "suggests," "plan," “project,” "believe," "intend," "estimates," "targets," "views," "may," "will," "forecast," and other similar expressions. The forward-looking statements speak only as of the date made, are based on current assumptions and expectations, and involve a number of risks and uncertainties. Important factors that could affect future results and cause those results to differ materially from those expressed in the forward-looking statements include, among others, the following: our ability to compete in the highly competitive U.S. wireless telecommunications industry; adverse conditions in the U.S. and international economies and markets; significant capital commitments and the capital expenditures required to effect our business plan; our ability to adapt to future changes in technology, enhance existing offerings, and introduce new offerings to address customers' changing demands; changes in legal and regulatory requirements, including any change or increase in restrictions on our ability to operate our network; our ability to successfully maintain and improve our network, and the possibility of incurring additional costs in doing so; major equipment failures; severe weather conditions or other force majeure events; and other risks described in our filings with the Securities and Exchange Commission, including those described in our most recently filed Annual Report on Form 10-K and Quarterly Report on Form 10-Q. You should not place undue reliance on these forward-looking statements. We do not undertake to update forward-looking statements, whether as a result of new information, future events or otherwise, except as required by law.
About T-Mobile US, Inc.
As America's Un-carrier, T-Mobile US, Inc. (NASDAQ: TMUS) is redefining the way consumers and businesses buy wireless services through leading product and service innovation. The Company's advanced nationwide 4G LTE network delivers outstanding wireless experiences to more than 61 million customers who are unwilling to compromise on quality and value. Based in Bellevue, Washington, T-Mobile US provides services through its subsidiaries and operates its flagship brands, T-Mobile and MetroPCS. For more information, please visit http://www.T-Mobile.com or join the conversation on Twitter using $TMUS.
36