Attached files
| file | filename |
|---|---|
| 8-K - FORM 8-K - Federal Home Loan Bank of New York | d16789d8k.htm |
 ©
2015 FEDERAL HOME LOAN BANK OF NEW YORK • 101 PARK AVENUE • NEW YORK, NY 10178 • WWW.FHLBNY.COM FHLBNY: Strong Performance for Customers and Shareholders Stockholders Meeting October 26, 2015 Exhibit 99.1 |
 FHLBNY » “Advances Bank” strategy » Strong performance record for customers and shareholders » Conservatively positioned balance sheet » FHLBank System’s financial results have improved since the financial crisis Key Messages 2 |
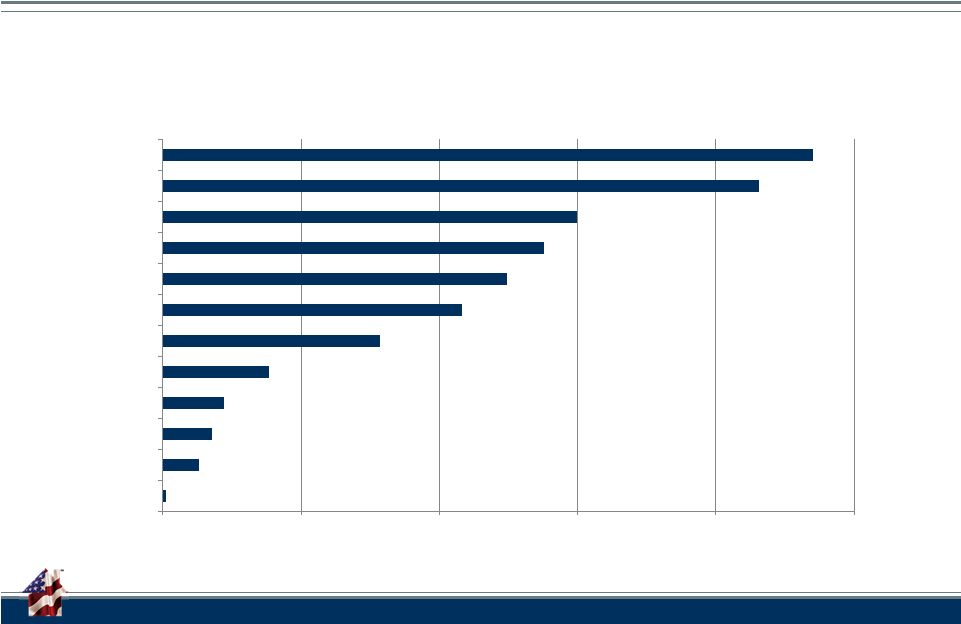
 FHLBNY FHLBNY is the 2 nd Largest Home Loan Bank as Measured by Advances and by Asset Balances Total Advances ($ Billions) Change in Advances: 2Q07 vs 2Q15 Note: As of June 30, 2015 3 -100% -50% 0% 50% 100% 150% 200% DAL TOP IND BOS CHI SFR DSM CIN PIT NYK ATL $0 $20 $40 $60 $80 $100 DAL TOP IND BOS CHI SFR DSM CIN PIT NYK ATL |
 FHLBNY 0% 10% 20% 30% 40% 50% 60% 70% 80% 90% 100% NYK PIT ATL CIN BOS SFR DSM IND TOP DAL CHI Advances MPF/MPP MBS Other Investments Cash and Other We Have Consistently Maintained a High Percentage of Advances Relative to Assets HLBanks Balance Sheet Mix 4 Note: As of June 30, 2015 4 |
 FHLBNY 5 FHLBNY’s Member Base is Diverse Total Advances (Par) = $89.1 B Top Borrowers Member Type Note: As of September 30, 2015 |
 FHLBNY 6 The Bank’s Financial Performance Has Been Strong FHLBNY - Financial Results Highlights September 30, 2015 December 31, 2014 December 31, 2013 December 31, 2012 Period End Balances Advances $90,745 $98,797 $90,765 $75,888 MBS Investments 13,850 13,552 13,373 12,620 Mortgage Loans 2,462 2,129 1,928 1,843 Total Assets 122,947 132,825 128,333 102,989 Consolidated Obligations 114,899 123,580 119,146 94,564 Retained Earnings 1,156 1,083 999 894 Capital Stock 5,286 5,580 5,571 4,797 Results Net Interest Income $335 $444 $421 $467 Operating Expenses 68 86 83 83 Net Income 246 315 305 361 Notes: All $ millions. 6 |
 FHLBNY FHLBNY’s Expense Management Has Been Prudent 7 0.00% 0.02% 0.04% 0.06% 0.08% 0.10% 0.12% 0.14% 0.16% 0.18% 0.20% CIN PIT NYK ATL TOP BOS DSM IND SFR DAL CHI FHLBanks: Operating Expenses as a % of Average Total Assets 1 st Half 2015 |
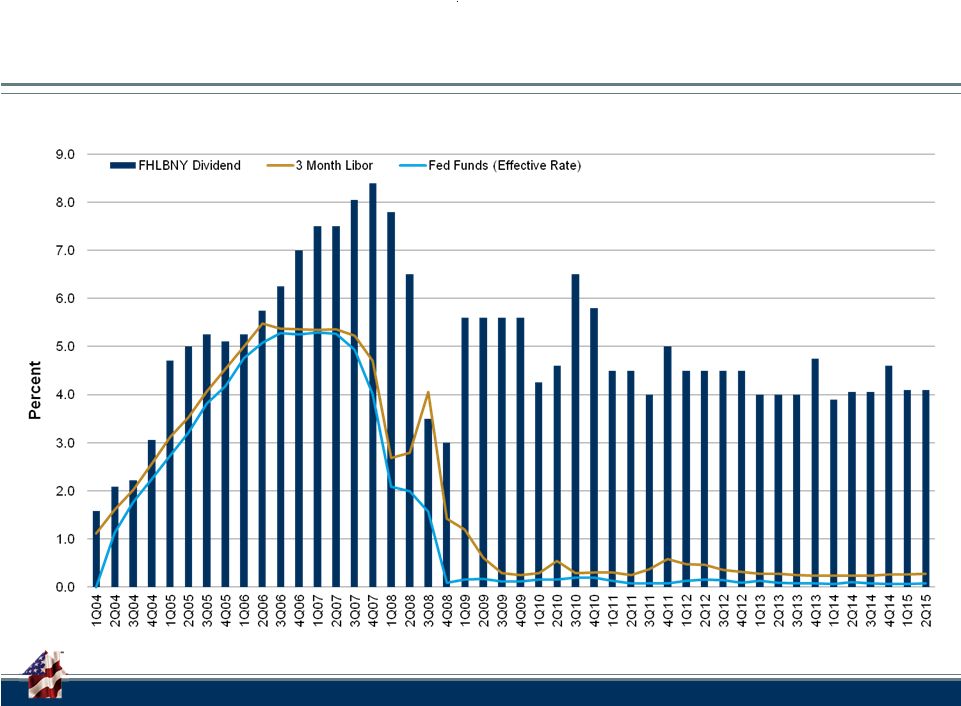 FHLBNY 8 Our Dividends Have Been Reliable and Exceeded Market Reference Rates FHLBNY Dividend History |
 FHLBNY 9 FHLBNY Dividend Returns Have Exceeded Those of Other FHLBanks 0% 1% 2% 3% 4% 5% SEA CHI DAL BOS PIT ATL SFR DSM TOP IND CIN NYK Average HLB Dividend Rates 2009-2014 9 |
 FHLBNY FHLBank Balance Sheets Are Scalable to Meet Member Liquidity Needs 10 |
 FHLBNY System Advances Increased During the First Half of 2015 After Strong Growth in 2013 and 2014 11 HLB System Change in Advance Balances 3.4% 36.6% 6.1% -32.0% -24.2% -12.6% 1.8% 17.1% 14.5% 3.8% -40% -30% -20% -10% 0% 10% 20% 30% 40% 50% 2006 2007 2008 2009 2010 2011 2012 2013 2014 1H2015 |
 FHLBNY System Financial Performance Has Improved Considerably Since the Financial Crisis FHLBank System Net Income: 2001-1 st Half 2015 ($Millions) 12 FHLBank System ROE: 2001-1 st Half 2015 12 Note: The calculation of ROE and Net Income in the charts excluded $623 mm the gains PLMBS on litigation settlements in the 1 st half 2015 0.00% 1.00% 2.00% 3.00% 4.00% 5.00% 6.00% 7.00% 2001 2002 2003 2004 2005 2006 2007 2008 2009 2010 2011 2012 2013 2014 1H2015 $0 $500 $1,000 $1,500 $2,000 $2,500 $3,000 2001 2002 2003 2004 2005 2006 2007 2008 2009 2010 2011 2012 2013 2014 1H2015 |
 FHLBNY Retained Earnings Grew Four-fold Since the End of 2008 While System Assets Declined 32% HLBank System: Retained Earnings Growth 13 Notes: URE = Unrestricted Retained Earnings. RRE = Restricted Retained Earnings.
Retained earnings and capital stock are defined on a regulatory basis.
0% 5% 10% 15% 20% 25% 30% 35% 40% 45% 50% $- $2 $4 $6 $8 $10 $12 $14 2003 2004 2005 2006 2007 2008 2009 2010 2011 2012 2013 2014 1Q 15 2Q 15 $Billion URE (LHS) RRE (LHS) %RE/Capital Stock (RHS) |
 FHLBNY 0.00% 1.00% 2.00% 3.00% 4.00% 5.00% 6.00% 7.00% SFR BOS CHI NYK CIN DAL ATL IND PIT TOP DSM GAAP Regulatory All FHLBanks Exceed Minimum Regulatory Capital Requirements FHLBanks Capital-to-Assets Ratio Note: As of June 30, 2015 14 |
 101
PARK AVENUE • NEW YORK, NY 10178 • WWW.FHLBNY.COM Advancing
Housing and Community Growth The
information provided by the Federal Home Loan Bank of New York (FHLBNY) in this communications is set forth for informational purposes only. The information should not be construed as an opinion, recommendation or solicitation regarding the use of any financial strategy and/or the purchase or sale of any financial instrument. All customers are advised to conduct their own independent due diligence before making any financial decisions. Please note that the past performance of any FHLBNY service or product should not be viewed as a guarantee of future results. Also, the information presented here and/or the services or products provided by the FHLBNY may change at any time without notice. Questions? |
 © 2015 FEDERAL HOME LOAN BANK OF NEW YORK • 101 PARK AVENUE • NEW YORK, NY 10178 •
WWW.FHLBNY.COM Stockholders’ Meeting
October 26, 2015
FHLBNY Business Update
(Membership, Advances and Debt Issuance)
|
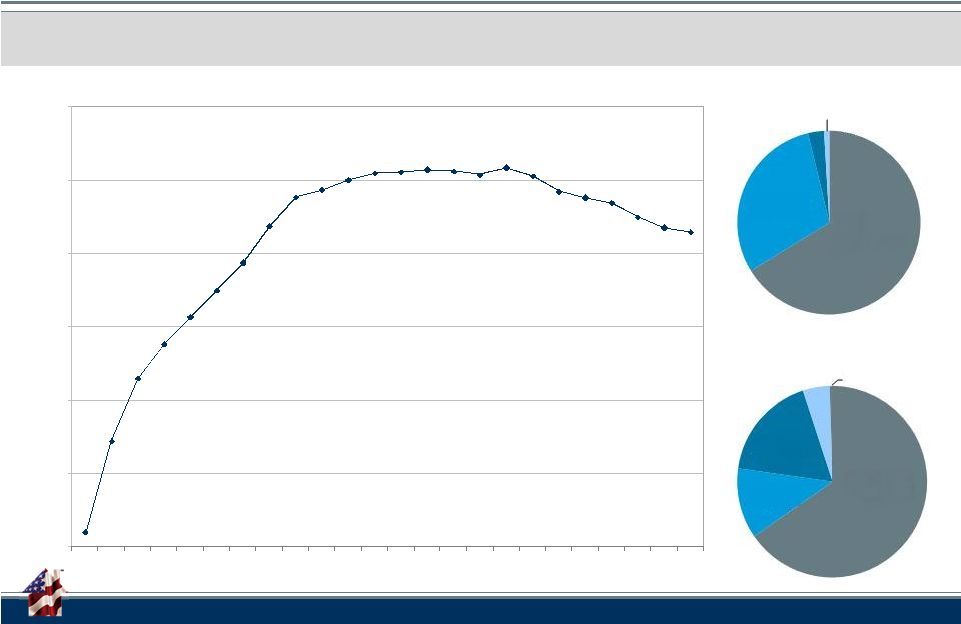 FHLBNY FHLBanks Number of Members 2 1997 2Q2015 FHLBank System Membership 3,217 4,453 5,306 5,775 6,146 6,504 6,884 7,383 7,777 7,877 8,011 8,101 8,121 8,149 8,125 8,079 8,176 8,066 7,849 7,768 7,699 7,504 7,359 7,299 3,000 4,000 5,000 6,000 7,000 8,000 9,000 1989 1993 1994 1995 1996 1997 1998 1999 2000 2001 2002 2003 2004 2005 2006 2007 2008 2009 2010 2011 2012 2013 2014 2Q15 Commercial Banks, 4,072 Thrifts, 1,844 Credit Unions, 172 Insurance Companies, 58 Commercial Banks, 4,769 Thrifts, 868 Credit Unions, 1,296 Insurance Companies, 330 CDFI, 37 The number of Members in the System accelerated post FIRREA,
plateaued
and
has
begun
to
decline. |
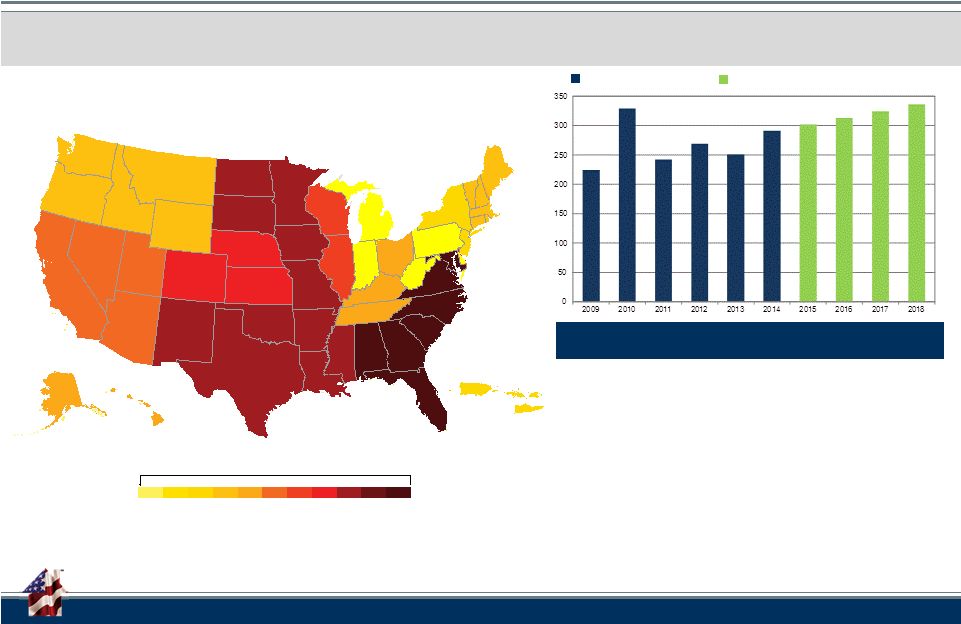 FHLBNY M&A Snapshot 1. Increased regulatory pressure 2. Rising operating expenses (technology, regulatory, human resources, etc) and shrinking net interest margins 3. Limited access to capital 4. Lack of growth opportunities due to intense competition 5. Lack of diversified income streams 6. Strategic Alliances: expansion into new businesses & new markets 7. Favorable trading multiples 8. Heavy insider ownership and private equity interest 9. Fear of accounting change 10.Board dynamics (fatigue, liability, retiring CEO) LOW # of Transactions HIGH # of Transactions M&A Deals 2009 -2014 M&A Deals Forecasted Drivers for financial institutions to sell 3 The number of banks selling in the country has been steadily increasing and is expected to continue.
INDIANAPOLIS
NEW YORK
63
PITTSBURGH
55
BOSTON
77
SEATTLE
78
CINCINNATI
79
SAN FRANCISCO
141
CHICAGO
152
TOPEKA
DES MOINES
180 DALLAS ATLANTA 170 181 349 Number of Institutions Selling History by FHLBank Territory (2009-2014) 48 |
 FHLBNY (350) (300) (250) (200) (150) (100) (50) - 50 ATL DSM SFR TOP DAL CHI CIN IND BOS PIT NYK System Membership Changes 4 Net Membership Change by District from 4Q2008 to 2Q2015 Source: FHFA Membership Tables |
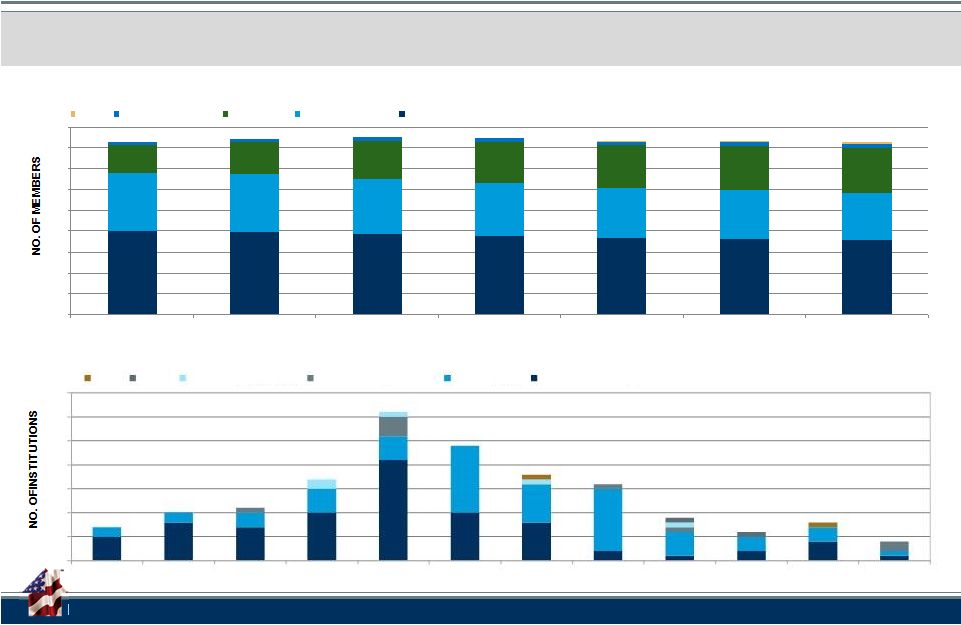 FHLBNY 160 159 154 151 147 145 143 112 110 106 101 96 94 91 54 62 74 79 81 84 85 5 5 6 7 7 7 9 1 2 2 2 0 40 80 120 160 200 240 280 320 360 2009 2010 2011 2012 2013 2014 9/30/15 CDFI Insurance Companies Credit Union Savings Bank/Thrifts Commercial Banks Membership and Demographic Trends Membership by Type (Excludes HFAs) New Member by Institution Type (2004 – 2015) Membership concentration has been with Commercial Banks in New York State.
5 0 5 10 15 20 25 30 35 2004 2005 2006 2007 2008 2009 2010 2011 2012 2013 2014 9/30/15 HFA CDFI Savings Bank/Thrifts Insurance Companies Credit Union Commercial Banks |
 FHLBNY Federal Home Loan Bank of New York (FHLBNY) Mission 6 To advance housing opportunity and local community development by
maximizing the capacity of community-based member-lenders
to serve their markets. FHLBNY Lines of
Business Advance Characteristics:
TENOR:
» Overnight to 30 years TERM: » Fixed Rate, Floating Rate, Callable, Putable, Forward Starting, or Amortizing PURPOSE: » Liquidity management » Asset/liability management Transactional micro hedges Balance sheet macro hedges » Minimizing liability costs » Wholesale leveraging » Funding retail loan growth » Prefunding branches The four business lines help meet Members’
needs & achieve the FHLBNY Mission.
|
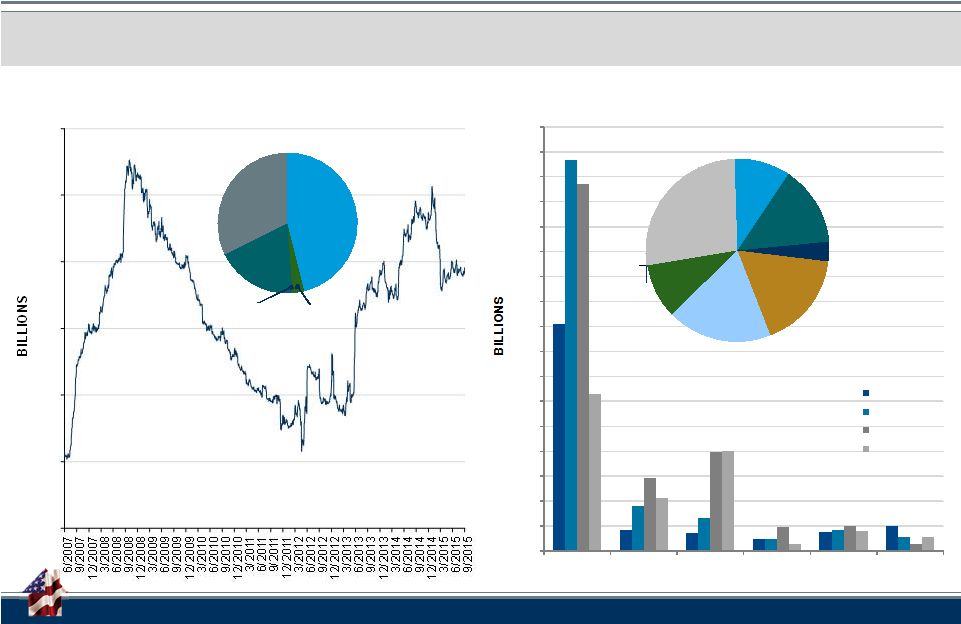
 FHLBNY Funding Gap Analysis: 2001- 2Q2015 Top 35 Borrowers & All Other Borrowers 7 Funding Gap: All Members $100 $150 $200 $250 $300 $350 $400 $450 $500 $550 $600 $650 $700 $750 2001 2002 2003 2004 2005 2006 2007 2008 2009 2010 2011 2012 2013 2014 2015 Assets Retail Deposits + Capital Market Share All members except Citibank, HSBC Bank USA, Goldman Sachs Bank, Morgan Stanley Private Bank N.A, Insurance Companies,
CDFIs,10-Bs/HFAs, and non-members
|
 FHLBNY Advance Rates, Trends and Offerings 8 The growth in member balance sheets and the increased focus on interest rate risk
are the main drivers behind member funding
preferences. Member Advances Outstanding
ALL MEMBERS:
Thrifts
32%,68
Insurance
Company
19%, 6
Credit Unions
3%, 29
Commercial
Banks
46%, 99
102Bs
0.01%,
ADVANCES OUTSTANDING BY ADVANCE TYPE
AS OF 3Q2015
FHLBNY
Advances
Issued
&
Still
Outstanding
$50 $60 $70 $80 $90 $100 $110 $18 $2 $1 $1 $2 $2 $31 $4 $3 $1 $2 $1 $29 $6 $8 $2 $2 $0.6 $13 $4 $8 $0.60 $1.6 $1.1 $0 $2 $4 $6 $8 $10 $12 $14 $16 $18 $20 $22 $24 $26 $28 $30 $32 $34 Due in 1 Year or Less 1 to 2 Years 2 to 3 Years 3 to 4 Years 4 to 5 Years 5 Years & Over 2012 2013 2014 Thru 9/30/15 62% 4% 4% 3% 2% 6% 70% 6% 2.1% 8% 6% 17% 76% 9% 6% 1% 12% 6% 4% 4% 45% 15% 28% 4% Callable 0.01% FIXCAP 0.20% Floating Rate 27% LT Fixed 10% MT Fixed 14% Overnight 4% Putable 17% Repo 19% ST Fixed 9% |
 FHLBNY Community Development Programs 9 The popularity of the CI program has been growing, particularly in the New York region as of late,
as Members have placed an emphasis on investing in their
communities. Project specific uses of CIP, UDA &
RDA Funds »
Equipment Purchase for
Small Business Expansion
» Debt Refinancing for Small Businesses » Debt Consolidation for Small Businesses » Handicapped-Accessible Vans » Fire Stations and Trucks » Grocery Stores » Retail Stores » Educational Facilities » Healthcare Facilities » Office Buildings » Daycare Centers » Origination of single-family mortgages Commercial/Economic Development Housing » Refinancing of single-family mortgages » Financing of housing projects: – Property acquisition – Construction – Permanent financing – Re-financing – Renovation/Rehabilitation – Home Improvement TOTAL CI ADVANCES (DAILY AVERAGE)
COMMUNITY LENDING PROGRAMS
11/8/12
–FHLBNY initiates Disaster Relief Funding program (DRF), designed for Members to assist in rebuilding communities affected by SuperstormSandy. FHLBNY allocates $1B in low-cost funding. Program closed 12/31/13. |
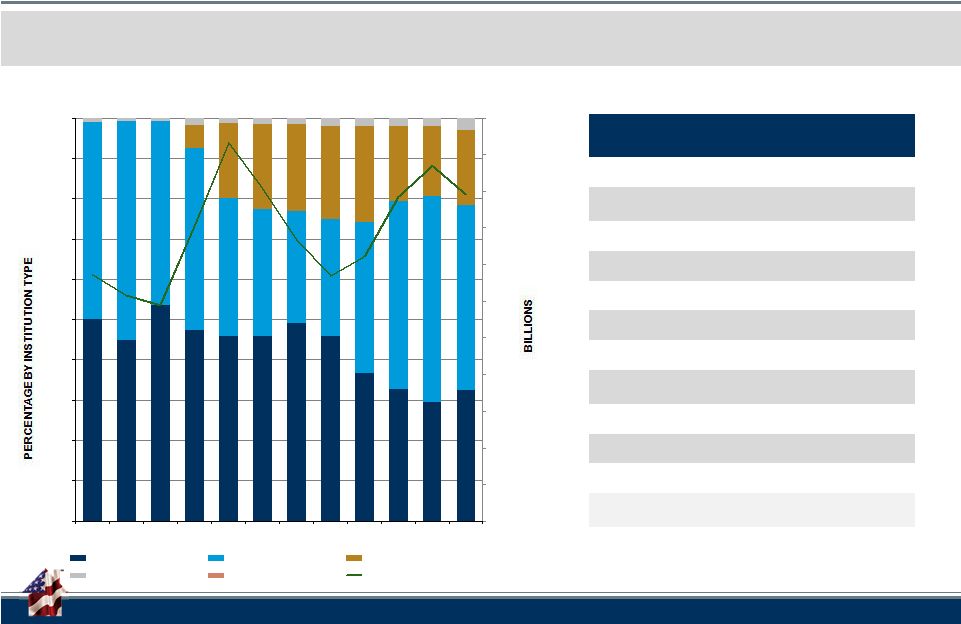 FHLBNY Advances Outstanding by Institution Type 10 The types of borrowing Members is becoming more diverse. $0 $10 $20 $30 $40 $50 $60 $70 $80 $90 $100 $110 0% 10% 20% 30% 40% 50% 60% 70% 80% 90% 100% Dec-04 Dec-05 Dec-06 Dec-07 Dec-08 Dec-09 Dec-10 Dec-11 Dec-12 Dec-13 Dec-14 Sep-15 Savings Bank/Thrifts Commercial Banks Insurance Companies Credit Unions 10bs Total Advances Outstanding Customer Name Advances 3Q2015 Citibank, N.A. $14.250 Metropolitan Life Insurance Co. $12.570 New York Community Bank $9.456 Hudson City Savings Bank, FSB $6.025 HSBC Bank USA $5.600 First Niagara Bank $4.694 Investors Bank $3.220 Astoria Bank $2.127 Prudential Insurance $1.975 Valley National Bank $1.899 Total of Top 10 Borrowers $61.817 Total Advances Outstanding $89.144 Top 10 as a % of Total Advances 70% 2004-YTD15 Top 10 Borrowers ($Billions) |
 FHLBNY Strong Presence in Capital Markets 11 GSE Debt Outstanding $855 $415 $429 $0 $100 $200 $300 $400 $500 $600 $700 $800 $900 $1,000 $1,100 $1,200 $1,300 FHLBanks Freddie Mac Fannie Mae* YE03 YE04 YE05 YE06 YE07 YE08 YE09 YE10 YE11 YE12 YE13 YE14 09/15 Treasury Debt $0 $2 $4 $6 $8 $10 $12 $14 $16 $18 $20 YE03 YE04 YE05 YE06 YE07 YE08 YE09 YE10 YE11 YE12 YE13 YE14 9/30/15 |
 FHLBNY 479 418 426 499 571 592* 0 100 200 300 400 500 600 700 800 900 1,000 2010 2011 2012 2013 2014 2015 Globals Bullets/TAPs Floating Rate Notes Callable/Structured Discount Notes 857 692 688 767 847 797 Total Debt Outstanding 12 YTD Net Change: ($ in billions) Debt Outstanding ---------------------------
Advances Outstanding -135 ------------ -152 -105 ------------ -61 -4 ------------ 8 79 ------------ 73 80 ------------ 72 8 ------------ 21 Total debt outstanding reflects advance demand from Members.
Source:
FHLBanks
Office
of
Finance
– by settlement date – as of 9/30/15. *As of June 30, 2015 |
 FHLBNY 13 Global Bond Investor Distribution By Investor Type Asia US Europe Other/ Unknown 0% 10% 20% 30% 40% 50% 60% 70% 80% 90% 100% 2004 2005 2006 2007 2008 2009 2010 2011 2012 2013 2014 2015 Central Banks Fund Managers Banks Pension/Ins State/Local Other/ Unknown 0% 10% 20% 30% 40% 50% 60% 70% 80% 90% 100% 2004 2005 2006 2007 2008 2009 2010 2011 2012 2013 2014 2015 By Geographic Region FHLBank Bond Issuance Investor appetite for FHLBank Bonds remain strong both domestically and abroad. |
 FHLBNY 14 History of Consolidated Obligations against LIBOR 5Y FHLB Cost of Debt vs. 5Y Treasury -100 -60 -20 20 60 100 1 Month 3 Month 1 Year 2 Year 3 Year 5 Year 7 Year 10 Year 6/29/07 COF Curve 3/31/09 COF Curve 3/30/12 COF Curve 9/30/2015 COF Curve 140 0.00 0.50 1.00 1.50 2.00 2.50 0.00 1.00 2.00 3.00 4.00 5.00 9/30/06 9/30/07 9/30/08 9/30/09 9/30/10 9/30/11 9/30/12 9/30/13 9/30/14 9/30/15 5Y Spread (Right-Axis) 5Y Treasury 5Y FHLB Debt Linear (5Y FHLB Debt) 6.00 FHLBank Debt spreads to LIBOR continue to improve and spreads to treasury are historically tight. FHLBank Bond Issuance |
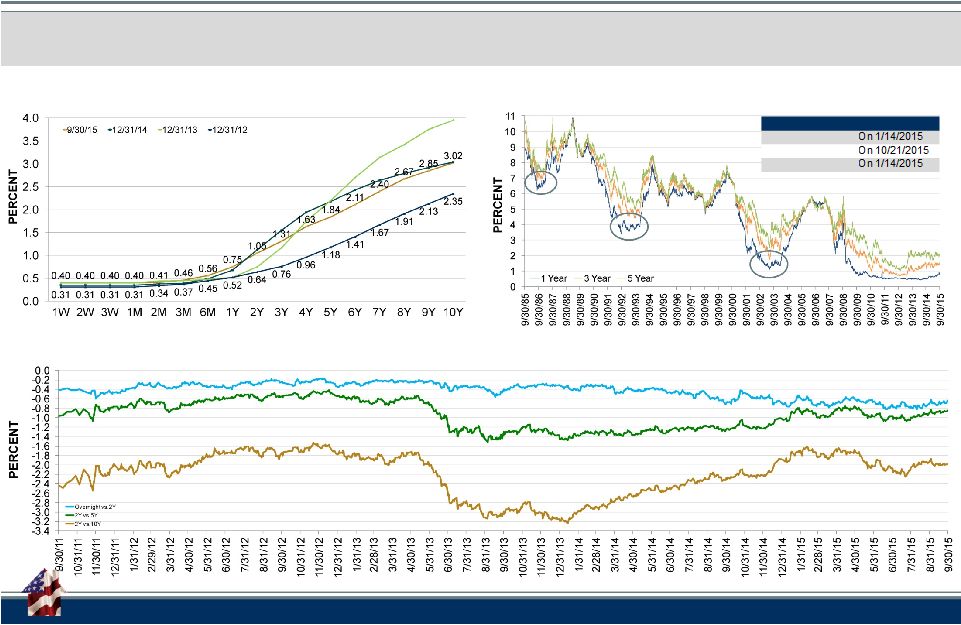 FHLBNY Advance Rates, Trends and Offerings 15 Advance rates are at historic lows and the shape of the Advance Curve is surfacing opportunities.
New YTD Lows
1Y Adv:
0.58
3Y Adv:
1.19
5Y Adv:
1.69
FHLBNY Advance Curve
Fixed-Rate Advances are at Historic Lows
The Cost to Extend has Decreased
FHLBNY |
 FHLBNY Continuous Educational Outreach Initiatives 16 We provide relevant education, emerging topics, and trends to our Members.
FHLBNY Resource Center — Created to Help You Maximize Your Membership Gain access to educational information and various tools to help address your institution’s unique set of
challenges, such as:
»
Managing interest rate risk
»
Increasing profitability
»
Increasing Net Interest Margin
»
Locking in spreads to preserve margins
Through the FHLBNY Resource Center you can also request a Member-Director Education Session This program is specifically created for our Members’ Board of Directors and managers, and is customized to
address their specific needs and concerns, as well as a wide range of issues
commonly faced by most community lenders.
Examples of the materials you can find:
»
Strategy articles
»
Presentations, Tutorials and Webinars
»
Workshops and Tools
»
Fact Sheets and Other Information
Take advantage of this readily available center by
visiting:
www.fhlbny.com/members/resource-center
»
Mitigating Net Interest Income at Risk and Economic Value of Equity
at Risk »
Achieving asset/liability management goals without increasing the
size of the balance sheet |
 Adam Goldstein SVP, Head of Sales & Marketing 212-441-6703 goldstein@fhlbny.com The information provided by the Federal Home Loan Bank of New York (FHLBNY) in this communications is set forth for informational purposes only. The information should not be construed as an opinion, recommendation or solicitation regarding the use of any financial strategy and/or the purchase or sale of any financial instrument. All customers are advised to conduct their own independent due diligence before making any financial decisions. Please note that the past performance of any FHLBNY service or product should not be viewed as a guarantee of future results. Also, the information presented here and/or the services or products provided by the FHLBNY may change at any time without notice. Advancing Housing and Community Growth 101 PARK AVENUE • NEW YORK, NY 10178 • WWW.FHLBNY.COM |