Attached files
| file | filename |
|---|---|
| 8-K - FORM 8-K - FIRST BANCORP /PR/ | d18970d8k.htm |
| EX-99.1 - EX-99.1 - FIRST BANCORP /PR/ | d18970dex991.htm |
 Financial Results 3Q 2015 Exhibit 99.2 |
 2 This presentation contains “forward-looking statements” concerning First BanCorp’s (the “Corporation”) future economic performance. The words or phrases “would be,” “will allow,” “intends to,” “will likely result,” “are expected to,” “expect,” “anticipate,” “look forward,” “should,” “believes” and similar expressions are meant to identify “forward-looking statements” within the meaning of Section 27A of the Private Securities Litigation Reform Act of 1995, and are subject to the safe harbor created by such section. The Corporation wishes to caution readers not to place undue reliance on any such “forward-looking statements,” which speak only as of the date made, and to advise readers that various factors, including, but not limited to, uncertainty about whether the Corporation and FirstBank Puerto Rico (“FirstBank” or “the Bank”) will be able to fully comply with the written agreement dated June 3, 2010 that the Corporation entered into with the Federal Reserve Bank of New York (the “FED”) and the order dated June 2, 2010 (the “Order”)that FirstBank entered into with the FDIC and the Office of the Commissioner of Financial Institutions of Puerto Rico that, among other things, require FirstBank to maintain certain capital levels and reduce its special mention, classified, delinquent and non-performing assets; the risk of being subject to possible additional regulatory actions; uncertainty as to the availability of certain funding sources, such as retail brokered CDs; the Corporation’s reliance on brokered CDs and its ability to obtain, on a periodic basis, approval from the FDIC to issue brokered CDs to fund operations and provide liquidity in accordance with the terms of the Order; the risk of not being able to fulfill the Corporation’s cash obligations or resume paying dividends to the Corporation’s stockholders in the future due to the Corporation’s inability to receive approval from the FED to receive dividends from FirstBank or FirstBank’s failure to generate sufficient cash flow to make a dividend payment to the Corporation; the strength or weakness of the real estate markets and of the consumer and commercial credit sectors and their impact on the credit quality of the Corporation’s loans and other assets, including the Corporation’s construction and commercial real estate loan portfolios, which have contributed and may continue to contribute to, among other things, the high levels of non-performing assets, charge-offs and the provision expense and may subject the Corporation to further risk from loan defaults and foreclosures; adverse changes in general economic conditions in the United States and in Puerto Rico, including the interest rate scenario, market liquidity, housing absorption rates, real estate prices and disruptions in the U.S. capital markets, which may reduce interest margins, impact funding sources and affect demand for all of the Corporation’s products and services and the value of the Corporation’s assets; an adverse change in the Corporation’s ability to attract new clients and retain existing ones; a decrease in demand for the Corporation’s products and services and lower revenues and earnings because of the continued recession in Puerto Rico and the current fiscal problems and budget deficit of the Puerto Rico government; uncertainty about regulatory and legislative changes for financial services companies in Puerto Rico, the United States and the U.S. and British Virgin Islands, which could affect the Corporation’s financial performance and could cause the Corporation’s actual results for future periods to differ materially from prior results and anticipated or projected results; uncertainty about the effectiveness of the various actions undertaken to stimulate the United States economy and stabilize the United States’ financial markets, and the impact such actions may have on the Corporation’s business, financial condition and results of operations; changes in the fiscal and monetary policies and regulations of the federal government, including those determined by the Federal Reserve System, the FDIC, government-sponsored housing agencies and regulators in Puerto Rico and the U.S. and British Virgin Islands; the risk of possible failure or circumvention of controls and procedures and the risk that the Corporation’s risk management policies may not be adequate; the risk that the FDIC may further increase the deposit insurance premium and/or require special assessments to replenish its insurance fund, causing an additional increase in the Corporation’s non-interest expense; risks of not being able to recover the assets pledged to Lehman Brothers Special Financing, Inc.; the impact on the Corporation’s results of operations and financial condition associated with acquisitions and dispositions; a need to recognize additional impairments on financial instruments or goodwill relating to acquisitions; risks that downgrades in the credit ratings of the Corporation’s long-term senior debt will adversely affect the Corporation’s ability to access necessary external funds; the impact of the Dodd-Frank Wall Street Reform and Consumer Protection Act on the Corporation’s businesses, business practices and cost of operations; and general competitive factors and industry consolidation. The Corporation does not undertake, and specifically disclaims any obligation, to update any “forward-looking statements” to reflect occurrences or unanticipated events or circumstances after the date of such statements except as required by the federal securities laws. Investors should refer to the Corporation’s Annual Report on Form 10-K for the year ended December 31, 2013 for a discussion of such factors and certain risks and uncertainties to which the Corporation is subject. Forward-Looking Statements |
 Agenda Third Quarter 2015 Highlights Aurelio Alemán, President & Chief Executive Officer Third Quarter 2015 Results of Operations Orlando Berges, Executive Vice President & Chief Financial Officer
Questions & Answers
3 |
 Key Highlights 4 Third Quarter Results |
 5 Profitability Net income of $14.8 million, or $0.07 per diluted share. Pre-tax income for 3Q 2015 was $19.2 million compared to adjusted pre-tax income of $20.2 million
for 2Q 2015, excluding the bulk sale, OTTI adjustments and some interim
servicing costs from the Doral transaction.
During 3Q 2015 net interest margin increased 1 basis point to
4.19%. Adjusted pre-tax, pre-provision income of
$50.5 million, compared to $47.7 million for 2Q 2015. Asset
Quality
Total NPAs declined by $27.3 million, or 4%; NPAs/assets 4.81% as of
September 30, 2015. Inflows to nonperforming of $50.8
million compared to $44.9 million in 2Q 2015. Provision
for loan and lease losses of $31.2 million. Excluding the 2Q 2015 charge related to the bulk sale, the provision increased $3.9 million. Core Deposits Deposits, net of government and brokered, increased by $26.4 million to $6.7 billion.
Total cost of deposits, net of brokered, remained at
0.61%. Brokered certificates of deposit (CDs) decreased by
$62.7 million in 3Q 2015. Capital
3Q 2015 capital position:
– Total Risk Based Capital Ratio of 19.7%; – Tier 1 Ratio Risk Based Capital Ratio of 16.6%; and – Leverage Ratio of 12.4%. Book value per common share of $7.74 compared to $7.60 in 2Q 2015.
Tangible book value per common share of $7.50 compared to $7.35 in 2Q
2015. Third Quarter 2015 Highlights
|
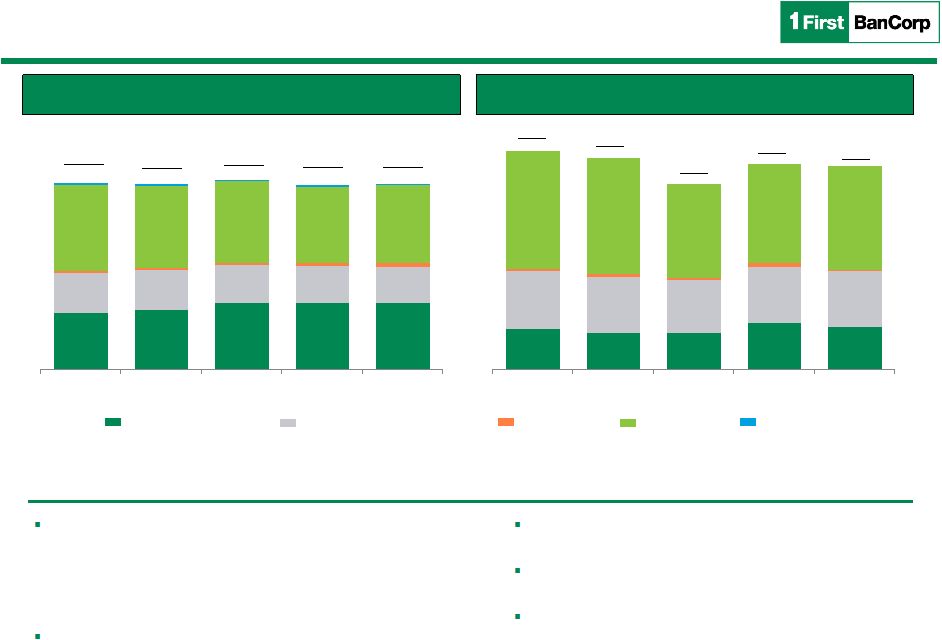 6 Loan Originations* ($ millions) Loan Portfolio ($ millions) 2,820 3,011 3,332 3,328 3,330 2,027 1,983 1,937 1,899 1,862 142 123 124 121 164 4,327 4,145 4,092 3,870 3,946 80 77 82 80 35 3Q 2014 4Q 2014 1Q 2015 2Q 2015 3Q 2015 $9,396 $9,339 $9,567 169 154 153 197 179 245 235 221 235 234 7 12 9 14 4 496 490 398 420 394 3Q 2014 4Q 2014 1Q 2015 2Q 2015 3Q 2015 $917 $891 $777 Residential Mortgage Consumer & Finance Leases Construction Commercial Loans HFS Growth in commercial portfolio supported by Florida and the Eastern Caribbean. – Florida and the Eastern Caribbean contributed approximately $100 million in commercial origination volume in 3Q 2015. Focus remains on growth opportunities within our markets. Origination and renewal activity continues to sustain our loan portfolio levels. Increased distribution channels are supporting our origination volume. The commercial new business pipelines for Puerto Rico remains stable while Florida is improving. Despite a challenging market environment, we continue to achieve results through our regional diversification:
* Including refinancing and draws from existing revolving and
non-revolving commitments. Third
Quarter 2015 Highlights: LOAN PORTFOLIO $9,298 $866 $9,337 $854 |
 7 Total Deposit Composition (%) Core Deposits* ($ millions) 2,814 2,841 3,203 3,139 3,079 1,246 1,263 1,390 1,346 1,438 2,111 2,092 2,225 2,194 2,189 469 401 451 495 743 3Q 2014 4Q 2014 1Q 2015 2Q 2015 3Q 2015 * Core deposits are total deposits excluding brokered CDs. $6,640 $6,597 $7,269 Interest Bearing 63% Non- Interest Bearing 14% Brokered CDs 23% Non-brokered deposits, excluding government deposits, increased $26.4 million in 3Q 2015 and $509 million YTD
2015. Total cost of deposits, net of brokered, remained at
0.61%. Government deposits increased $248.2 million in 3Q
2015, a significant portion of this increase is considered temporary. Continue to reduce reliance on brokered deposits which declined $62.7 million compared to 2Q 2015 and $619 million YTD
2015.
Core deposits stable; continue reducing reliance on brokered deposits
Third
Quarter 2015 Highlights: DEPOSIT MIX Retail Commercial CDs & IRAs Public Funds $7,174 $7,449 |
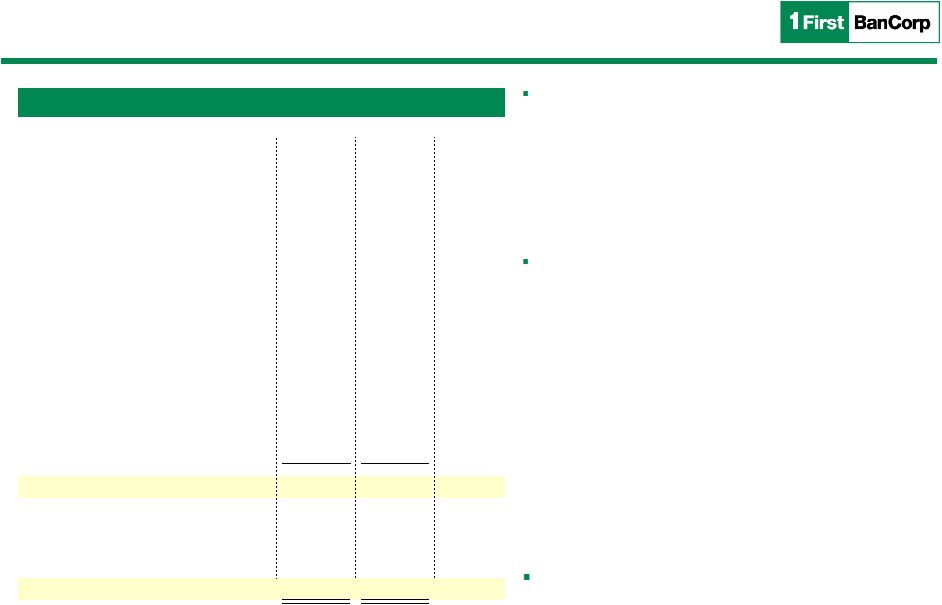
 8 Third Quarter 2015 Highlights: PR GOVERNMENT EXPOSURE Total outstanding exposure to the Puerto Rico Government was $402 million with a book value of $371 million as of September 30, 2015, down from $378 million as of June 30, 2015. — Investment portfolio outstanding principal of $65.6 million, being carried on books at $34.1 million. — Loan exposure is diversified among all sectors with the largest public company exposure to PREPA on nonaccrual status. PREPA UPB of $75.0 million. — Largest government exposure to municipalities supported by assigned tax revenues. In addition, there is $130 million of indirect exposure to the Tourism Development Fund supporting hotel projects. — Any inability of the TDF to honor its payment guaranty, for which it has been making payments since 2012, may result in an adverse impact to asset quality metrics. — Government tax revenues generated on these projects continue to substantially exceed payments made by the TDF. Total Government Deposits as of September 30, 2015 were $524.5 million. ($ in millions) Government Unit Time Deposits Transaction Accounts Total Municipalities 19.1 $
138.1
$
157.2
$
Municipal Agency
-
183.5
183.5
Public Agencies
30.7 151.6
182.3
Public Corporations
-
1.5
1.5
Total Deposits
49.8 $ 474.7 $ 524.5 $ Investment Portfolio 52.7 $ Central Government: 21.0 $ 2 loans 14.0 7.0 Public Corporations: 97.9 $ 3 loans 72.6 CRE - Operating Revenues 21.5 3.8 Municipalities: 199.5 $ 10 loans 199.5 Total Direct Government Exposure 371.1 $ Property Tax Revenues Commonwealth Appropriations CRE & Commonwealth Appropriations PREPA Fuel Line Rental Income Government Unit Source of Repayment Total Outstanding |
 9 Results of Operations Third Quarter Results |
 10 Results of Operations: THIRD QUARTER FINANCIAL HIGHLIGHTS ($ in thousands, except per share data) Select Financial Information 3Q 2015 2Q 2015 Variance 3Q 2014 Interest income 149,812 $ 151,632 $ (1,820) $ 156,662 $ Interest expense 24,883 25,155 (272) 28,968 Net interest income 124,929 126,477 (1,548) 127,694 Provision for loan and lease losses 31,176 74,266 (43,090) 26,999 Non-interest income 18,989 19,767 (778) 16,419 Loss on investments & impairments (231) (13,097)
12,866
(245)
Bargain purchase gain
-
-
-
-
Total non-interest income
18,758
6,670
12,088
16,174
Personnel expense
37,284
37,841
(557)
33,877
Occupancy and equipment expense
15,248
15,059
189 14,727
Insurance and supervisory fees
6,590
6,796
(206)
9,493
REO expense
4,345
4,874
(529)
4,326
Other operating expenses
29,810
38,229
(8,419)
31,181
Total non-interest expense
93,277
102,799
(9,522)
93,604
Pre-tax income (loss)
19,234
(43,918)
63,152
23,265
Income tax (expense) benefit
(4,476)
9,844
(14,320)
(64) Net income (loss)
14,758 $ (34,074) $ 48,832 $ 23,201 $ Select Financial Information Adjusted Pre-tax, pre-provision income 50,497 $ 47,727 $ 2,770 $ 50,750 $ Fully diluted EPS 0.07 $ (0.16) $ 0.23 $ 0.11 $ Book value per share 7.74 $ 7.60 $ 0.14 $ 6.05 $ Tangible book value per share 7.50 $ 7.35 $ 0.15 $ 5.81 $ Common stock price 3.56 $ 4.82 $ (1.26) $ 4.75 $ Net Interest Margin (GAAP) 4.19% 4.18% 0.01% 4.14% Efficiency ratio 64.9% 77.2% (12.3%) 65.1% |
 11 Key Highlights Net Interest Income ($ millions) $127.7 $129.2 $125.6 $126.5 $124.9 4.14% 4.18% 4.18% 4.18% 4.19% 3Q 2014 4Q 2014 1Q 2015 2Q 2015 3Q 2015 Net Interest Income ($) Net Interest Margin (GAAP %) Net interest income decreased $1.6 million in 3Q 2015. This decrease was mainly due to: o A $0.8 million decrease in interest income on commercial and construction loans; o A $0.5 million decline in interest income on consumer loans (primarily auto) driven by lower volumes; o A $0.3 million decrease in interest income on securities due to lower volume; and o A $0.3 million decrease in interest income on residential mortgage loans. This decrease was partially offset by: o A $0.3 million decrease in interest expense primarily driven by the full quarter impact of interest income earned on a reverse repurchase agreement entered into in mid-April 2015. GAAP NIM increased 1 basis point to 4.19%. Results of Operations: NET INTEREST INCOME |
 12 Key Highlights Cost of Deposits (%) 0.83% 0.81% 0.77% 0.73% 0.74% 0.72% 0.70% 0.66% 0.61% 0.61% 0.50% 0.60% 0.70% 0.80% 0.90% 3Q 2014 4Q 2014 1Q 2015 2Q 2015 3Q 2015 Interest Bearing Deposits (%) Total Deposits (%) Cost of total deposits, excluding brokered CDs, remained flat at 0.61%. The average rate paid on non-brokered interest-bearing deposits increased by 1 basis point to 0.74% during the third quarter. Brokered CDs declined by $62.7 million during 3Q 2015. Results of Operations: COST OF FUNDS |
 13 Key Highlights Non-Interest Income* ($ millions) * Non interest income excludes equity losses of unconsolidated entities, OTTI, HFS bulk sale impact and bargain purchase
gain. Excluding the $12.9 million OTTI charge on
Puerto Rico Government debt securities and
the $0.6 million pre-tax loss on a commercial
loan HFS and sold in the bulk sale in 2Q 2015,
adjusted non-interest income decreased $1.3
million, due to:
o A $0.5 million decrease in revenues on mortgage banking; o A $0.3 million decrease in insurance commissions; and o A $0.3 million decline due to a gain on the exchange of trust preferred securities in 2Q 2015. $16.2 $17.9 $19.3 Results of Operations: NON-INTEREST
INCOME
$20.1 $18.8 |
 14 Results of Operations: OPERATING EXPENSES Non-interest expenses decreased by $9.5 million in 3Q 2015 to $93.3 million. 2Q 2015 expenses included: - $2.6 million acquisition and conversion costs related to the Doral transaction; and - $1.2 million of expenses and losses directly associated with the bulk sale transaction. Excluding these items, non-interest expense declined $5.8 million due to: - A $1.8 million decrease in credit related expenses due to lower legal, appraisal and OREO operating expenses; - A $0.6 million decrease in adjusted employees’ compensation and benefit expenses mainly due to a decrease in payroll taxes and incentive compensation; - $1.3 million in consulting and legal fees during 2Q for special projects as well as strategic, stress testing, and capital planning; and - $1.6 million of excess interim servicing costs in 2Q 2015 on Doral accounts over internal processing costs This reduction was partially offset by higher business promotion expenses and credit & debit card processing related to post- conversion costs on accounts acquired from Doral. ($ in millions) 3Q 2015 2Q 2015 % Change Credit related expenses 6.6 $ 8.4 $ -21% Compensation & benefits 37.3 37.8 -1% Occupancy & equipment 15.2 15.1 1% Credit & debit card processing expenses 4.3 3.9 9% Taxes other than income 3.1 3.1 -2% Deposit insurance prem & supervisory 6.6 6.8 -3% Other professional fees 3.9 6.0 -35% Excess interim servicing costs - Doral - 1.6 Business promotion 4.1 3.7 12% All other expenses 12.2 12.7 -4% Non-GAAP operating expenses 93.3 $ 99.1 $ -6% Doral acquisition & conversion - 2.6 Bulk sale of assets & related loss on OREO - 1.2 Total operating expenses, as reported 93.3 $ 102.8 $ -9% |
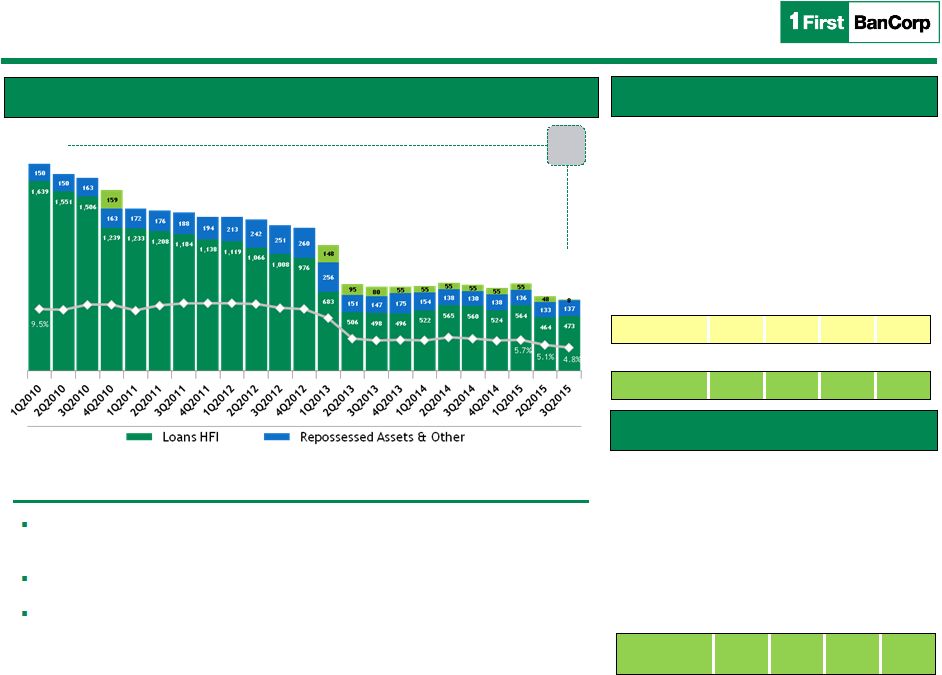           15 Non-Performing Assets ($ millions) $1,790 $754 - 66% Total non-performing loans, including non-performing loans held for
sale, decreased by $30.9 million, or 6%.
NPAs declined $27.3 million in 3Q 2015.
New non-performing loan inflows amounted to $50.8 million compared
to inflows of $44.9 million in 2Q 2015.
NPAs decreased by $27.3 million to $617 million or 4.8% of
assets: Results
of Operations: ASSET QUALITY Q-o-Q Change in NPAs Migration Trend ($ millions) $644 $617 Loan 3Q 2Q $ % Portfolio 2015 2015 Change Change Residential $175 $175 ($0) (0%) Consumer $31 $33 ($2) (6%) C&I and CRE $211 $239 ($28) (12%) Construction $56 $16 $40 247% Loans HFS $8 $48 ($40) (83%) Total NPLs $481 $512 ($31) (6%) REO & Repo $137 $133 $4 3% Total NPAs $617 $644 ($27) (4%) Loan 3Q 2Q $ % Portfolio 2015 2015 Change Change Residential $27 $25 $2 9% Consumer $13 $13 ($0) (0%) $10 $7 $4 53% $51 $45 $6 13% Commercial & Construction Total Migration |
  16 Key Highlights Net Charge-Offs ($ millions) 6 7 5 3 5 18 19 16 11 14 15 2 8 62 5 3 2 3Q 2014 4Q 2014 1Q 2015 2Q 2015 3Q 2015 Residential Consumer Commercial Construction Total net charge-offs for 3Q 2015 were $24 million, or 1.02% of average loans, compared to $79 million in 2Q 2015. Excluding the impact of charge-offs related to the bulk sale ($61.4 million), total net charge-offs were $6.4 million higher in 3Q 2015. Allowance coverage ratio of 2.46% as of September 30, 2015 compared to 2.40% as of June 30, 2015. The ratio of the allowance to NPLs held for investment was 48.44% as of September 30, 2015 compared to 47.79% as of June 30, 2015. $43 $27 $29 Commercial NPLs (Includes HFS) *Net Carrying Amount = % of unpaid principal balance net of reserves and accumulated charge-offs.
Results of Operations: NET CHARGE-OFFS
$79 $24 Product Book Value Accum. Charge-offs Reserves Net Carrying Amount * C&I $141.9 $33.4 $16.3 71.6% Const. 63.8 89.6 2.1 40.2%
CRE 69.2 21.8 5.4 70.1%
Total $274.8 $144.8 $23.9 59.8% |
 17 Results of Operations: CAPITAL
POSITION
Total stockholders’ equity amounted to $1.7 billion as of September
30, 2015, an increase of $32.7 million from June 30, 2015,
mainly driven by net income of $14.8 million and an increase of $16.7 million in other comprehensive income due to the fair value of U.S. agency MBS and U.S. agency
debt obligations.
Capital Ratios (%) |
 18 Third Quarter Results Q & A |
 19 Third Quarter Results Exhibits |
 20 Results of Operations: KEY MARGIN DRIVERS Q3 vs. Q2 Change in Average Interest Earning Assets & Interest Bearing Liabilities
* On a tax equivalent basis and excluding valuations
$ in % in Average Average Volume Rate Average total investments (174,829) $ 0.06% (315) $ Average loans & leases: Residential mortgage loans (4,751) (0.09%) (321) Construction loans 67 0.14% 79 C&I and commercial mortgage loans (108,879) (0.05%) (1,214) Finance leases (837) 0.07% 75 Consumer loans (35,273) (0.02%) (540) Total average loans (149,673) (0.05%) (1,921) Average total interest-earning assets (324,502) 0.01% (2,236) Interest-bearing liabilities: Brokered CDs (157,628) 0.04% 96 Other interest-bearing deposits (152,153) 0.01% 33 Other borrowed funds (44,702) 0.04% 154 Average total interest-bearing liabilities (354,483) 0.02% 272 Increase (decrease) in net interest income * (1,964) $ Net Interest Income Changes |
   21 NPLS HELD FOR INVESTMENT - MIGRATION Residential Mortgage Commercial Mortgage Commercial & Industrial Construction Consumer Total Beginning balance 175,035 $ 95,088 $ 143,935 $ 16,118 $ 33,397 $ 463,573 $ Plus: Additions to non-performing
27,392
4,530
5,756
57
13,055
50,790
Less:
Non-performing loans
transferred to OREO (10,833)
(866)
(2,531)
(102)
-
(14,332)
Non-performing loans
charged-off (2,790)
(3,522)
(805)
(70)
(11,759)
(18,946)
Loans returned to accrual
status / collections (14,249)
(26,123)
(4,324)
(37)
(3,418)
(48,151)
Transfer from Loans Held for
Sale -
-
-
40,005
-
40,005
Non-performing loans sold -
(128)
(176)
-
-
(304)
Ending balance
174,555
$
68,979 $ 141,855 $ 55,971 $ 31,275 $ 472,635 $ Residential Mortgage Commercial Mortgage Commercial & Industrial Construction Consumer Total Beginning balance 172,583 $ 142,385 $ 186,500 $ 27,163 $ 34,913 $ 563,544 $ Plus: Additions to non-performing
25,058
3,902
2,576
280
13,070
44,886
Less:
Non-performing loans
transferred to OREO (5,630)
(6,826)
(513)
(120)
(556)
(13,644)
Non-performing loans
charged-off (2,388)
(2,777)
(647)
-
(8,759)
(14,571)
Loans returned to accrual
status / collections (14,588)
(7,253)
(4,061)
(151)
(5,271)
(31,324)
Bulk sale
transaction -
(34,343)
(39,921)
(11,054)
-
(85,318)
Ending balance
175,035
$
95,088 $ 143,935 $ 16,118 $ 33,397 $ 463,573 $ June 30, 2015 September 30, 2015 |
 22 Use of Non-GAAP Financial Measures Basis of Presentation Use of Non-GAAP Financial Measures This presentation may contain non-GAAP financial measures. Non-GAAP financial measures are set forth when management
believes they will be helpful to an understanding of
the Corporation’s results of operations or financial position. Where non-GAAP financial measures are used, the comparable GAAP financial measure, as well as the reconciliation to the comparable GAAP financial measure, can be found in the text or in the attached
tables to the earnings release. Tangible Common
Equity Ratio and Tangible Book Value per Common Share
The tangible common equity ratio and tangible book value per common
share are non-GAAP financial measures generally used by the financial community to evaluate capital adequacy. Tangible common equity is total equity less preferred equity, goodwill, core deposit intangibles, and other intangibles, such as the purchased credit card relationship intangible. Tangible assets are total assets less goodwill, core deposit intangibles, and
other intangibles, such as the purchased credit
card
relationship
intangible.
Management
and
many
stock
analysts
use
the
tangible
common
equity
ratio
and
tangible
book
value
per
common
share
in
conjunction
with more traditional bank capital ratios to compare the capital
adequacy of banking organizations with significant amounts of goodwill or other intangible assets, typically stemming from the use of the purchase method of accounting for mergers and acquisitions. Neither tangible common
equity nor tangible assets, or the related measures
should be considered in isolation or as a substitute for stockholders’ equity, total assets, or any other measure calculated in accordance with GAAP. Moreover, the manner in which the Corporation calculates its tangible common equity, tangible assets, and any other related
measures may differ from that of other companies
reporting measures with similar names. |
 23 Use of Non-GAAP Financial Measures Basis of Presentation Use of Non-GAAP Financial Measures This presentation may contain non-GAAP financial measures. Non-GAAP financial measures are set forth when management
believes they will be helpful to an understanding of
the Corporation’s results of operations or financial position. Where non-GAAP financial measures are used, the comparable GAAP financial measure, as well as the reconciliation to the comparable GAAP financial measure, can be found in the text or in the attached
tables to the earnings release. Adjusted Pre-Tax,
Pre-Provision Income Adjusted pre-tax,
pre-provision income is a non-GAAP performance metric that management believes is useful in analyzing underlying performance trends, particularly in times of economic stress. Adjusted pre-tax, pre-provision income, as defined by management,
represents net income (loss) excluding income tax
expense (benefit), the provision for loan and lease losses, gains on
sale and OTTI of investment securities, fair value adjustments on derivatives, equity in earnings or loss of unconsolidated entity up until the second quarter of 2014 when the value of the investment became zero as well as
certain items identified as unusual, non-recurring
or non-operating. In addition, from time to time,
adjusted pre-tax, pre-provision income will reflect the omission of revenue or expense items that management judges to be outside of ordinary banking activities or of items that, while they may be associated with ordinary banking activities, are so unusually large that management believes that a complete analysis of the Corporation’s performance requires consideration also of adjusted pre-tax,
pre-provision income that excludes such amounts. |