Attached files
| file | filename |
|---|---|
| EX-23.1 - EX-23.1 - PSAV, Inc. | d98571dex231.htm |
Table of Contents
As filed with the Securities and Exchange Commission on October 23, 2015
Registration No. 333-206856
UNITED STATES
SECURITIES AND EXCHANGE COMMISSION
Washington, D.C. 20549
Amendment No. 1
to
FORM S-1
REGISTRATION STATEMENT
UNDER
THE SECURITIES ACT OF 1933
PSAV, Inc.
(Exact name of Registrant as specified in its charter)
| Delaware | 7389 | 47-4766950 | ||
| (State or Other Jurisdiction of Incorporation or Organization) |
(Primary Standard Industrial Classification Code Number) |
(I.R.S. Employer Identification Number) |
5100 N. River Road, Suite 300
Schiller Park, IL 60176
(847) 222-9800
(Address, Including Zip Code, and Telephone Number, Including Area Code, of Registrant’s Principal Executive Offices)
J. Whitney Markowitz
Chief Legal Officer and Secretary
5100 N. River Road, Suite 300
Schiller Park, IL 60176
(847) 222-9800
(Name, Address, Including Zip Code, and Telephone Number, Including Area Code, of Agent For Service)
Copies to:
| Alexander D. Lynch, Esq. Weil, Gotshal & Manges LLP 767 Fifth Avenue New York, New York 10153 (212) 310-8000 (Phone) (212) 310-8007 (Fax) |
Richard Aftanas, Esq. Kirkland & Ellis LLP 601 Lexington Avenue New York, NY 10022 (212) 446-4800 (Phone) (212) 446-4900 (Fax) |
Approximate date of commencement of proposed sale to the public: As soon as practicable after the effective date of this Registration Statement.
If any of the securities being registered on this Form are to be offered on a delayed or continuous basis pursuant to Rule 415 under the Securities Act of 1933, check the following box. ¨
If this Form is filed to register additional securities for an offering pursuant to Rule 462(b) under the Securities Act, please check the following box and list the Securities Act registration statement number of the earlier effective registration statement for the same offering. ¨
If this Form is a post-effective amendment filed pursuant to Rule 462(c) under the Securities Act, check the following box and list the Securities Act registration statement number of the earlier effective registration statement for the same offering. ¨
If this Form is a post-effective amendment filed pursuant to Rule 462(d) under the Securities Act, check the following box and list the Securities Act registration statement number of the earlier effective registration statement for the same offering. ¨
Indicate by check mark whether the registrant is a large accelerated filer, an accelerated filer, a non-accelerated filer or a smaller reporting company. See the definitions of “large accelerated filer,” “accelerated filer” and “smaller reporting company” in Rule 12b-2 of the Exchange Act.
| Large accelerated filer | ¨ | Accelerated filer | ¨ | |||
| Non-accelerated filer | x | Smaller reporting company | ¨ |
The Registrant hereby amends this Registration Statement on such date or dates as may be necessary to delay its effective date until the Registrant shall file a further amendment which specifically states that this Registration Statement shall thereafter become effective in accordance with Section 8(a) of the Securities Act or until the Registration Statement shall become effective on such date as the Commission, acting pursuant to said Section 8(a), may determine.
Table of Contents
The information in this preliminary prospectus is not complete and may be changed. These securities may not be sold until the registration statement filed with the Securities and Exchange Commission is effective. This preliminary prospectus is not an offer to sell nor does it seek an offer to buy these securities in any jurisdiction where the offer or sale is not permitted.
Subject to Completion. Dated October 23, 2015.

Shares
PSAV, Inc.
Common Stock
This is an initial public offering of shares of common stock of PSAV, Inc. PSAV, Inc. is offering shares to be sold in this offering. The selling stockholders identified in this prospectus are offering an additional shares. PSAV, Inc. will not receive any of the proceeds from the sale of the shares being sold by the selling stockholders.
Prior to this offering, there has been no public market for the common stock. It is currently estimated that the initial public offering price per share will be between $ and $ . PSAV, Inc. intends to apply to list the common stock on the New York Stock Exchange under the symbol “PSAV.”
After the completion of this offering, we expect to be a “controlled company” within the meaning of the corporate governance standards of the New York Stock Exchange. See “Principal and Selling Stockholders.”
Investing in our common stock involves a high degree of risk. See “Risk Factors” beginning on page 20 to read about factors you should consider before buying shares of the common stock.
Neither the Securities and Exchange Commission nor any other regulatory body has approved or disapproved of these securities or passed upon the accuracy or adequacy of this prospectus. Any representation to the contrary is a criminal offense.
| Per Share | Total | |||||||
| Initial public offering price |
$ | $ | ||||||
| Underwriting discount(1) |
$ | $ | ||||||
| Proceeds, before expenses, to PSAV, Inc. |
$ | $ | ||||||
| Proceeds, before expenses, to the selling stockholders |
$ | $ | ||||||
| (1) | See “Underwriting (Conflicts of Interest and Other Relationships)” for a description of the compensation payable to the underwriters. |
To the extent that the underwriters sell more than shares of common stock, the underwriters have the option to purchase up to an additional shares from the selling stockholders at the initial price to public less the underwriting discount.
The underwriters expect to deliver the shares against payment in New York, New York on , 2015.
| Goldman, Sachs & Co. | Morgan Stanley | |||
| Barclays | Credit Suisse | |||
| Macquarie Capital | Piper Jaffray | William Blair |
Prospectus dated , 2015.
Table of Contents
| Page | ||||
| 1 | ||||
| 20 | ||||
| 39 | ||||
| 41 | ||||
| 43 | ||||
| 44 | ||||
| 45 | ||||
| 46 | ||||
| Unaudited Pro Forma Condensed Consolidated Financial Statements |
47 | |||
| 54 | ||||
| Management’s Discussion and Analysis of Financial Condition and Results of Operations |
58 | |||
| 95 | ||||
| 112 | ||||
| 119 | ||||
| 131 | ||||
| 134 | ||||
| 138 | ||||
| 144 | ||||
| 150 | ||||
| Material U.S. Federal Income Tax Considerations for Non-U.S. Holders |
152 | |||
| Underwriting (Conflicts of Interest and Other Relationships) |
156 | |||
| 162 | ||||
| 162 | ||||
| 162 | ||||
| F-1 | ||||
Neither we (or any of our affiliates), the selling stockholders (or any of their affiliates), nor the underwriters (or any of their affiliates) have authorized anyone to provide any information other than that contained in this prospectus or in any free writing prospectus prepared by or on behalf of us or to which we have referred you. Neither we, the selling stockholders nor the underwriters take any responsibility for, and can provide no assurance as to the reliability of, any other information that others may give you. We are not, the selling stockholders are not and the underwriters are not, making an offer to sell these securities in any jurisdiction where the offer or sale is not permitted. The information appearing in this prospectus and any free writing prospectus is only accurate as of its date. Our business, financial condition, results of operations and prospects may have changed since that date.
i
Table of Contents
BASIS OF PRESENTATION OF FINANCIAL INFORMATION
Prior to this offering, we conducted our business through PSAV Holdings LLC, a Delaware limited liability company, and its subsidiaries. Prior to the consummation of this offering, PSAV Holdings LLC will enter into a corporate reorganization, whereby holders of equity interests of PSAV Holdings LLC will become stockholders of PSAV, Inc., a Delaware corporation and the Registrant. See “Organizational Structure.” Except as disclosed in this prospectus, the consolidated financial statements, selected historical consolidated financial data and other financial information included in this prospectus are those of PSAV Holdings LLC and its consolidated subsidiaries, or its predecessor, AVSC Holding Corp., and do not give effect to the corporate reorganization that will be effected in connection with the offering contemplated by this prospectus. Shares of common stock of PSAV, Inc. are being offered by this prospectus. Prior to the corporate reorganization and this offering, PSAV, Inc. held no material assets and did not engage in any operations. Following the corporate reorganization, the historical financial information of PSAV Holdings LLC or AVSC Holding Corp., as applicable, will be the historical financial information for PSAV, Inc.
TRADEMARKS, SERVICE MARKS AND TRADE NAMES
We own or have the rights to use various trademarks, service marks and trade names referred to in this prospectus. Solely for convenience, we refer to trademarks, service marks and trade names in this prospectus without the ™, SM and ® symbols. Such references are not intended to indicate, in any way, that we will not assert, to the fullest extent permitted by law, our rights to our trademarks, service marks and trade names. Other trademarks, trade names or service marks appearing in this prospectus are the property of their respective owners.
MARKET AND INDUSTRY DATA
Unless otherwise indicated, market position, market opportunity, market size and addressable market information used throughout this prospectus are estimated based on management’s experience and knowledge of the industry and the good faith estimates of management. Management utilized industry surveys, publications and other publicly available information prepared by a number of sources, including STR Inc. (“STR”), PKF Hospitality Research, a division of CBRE (“PKF”), PricewaterhouseCoopers LLP (“PwC”), the Content Marketing Institute, MarketingProfs and TravelClick by Passkey to estimate their market position, market opportunity, market size and addressable market information. The Boston Consulting Group also provided related consulting services to us with respect to the event technology services industry and the relevant market. All such market data presented in this prospectus was compiled as of June 2015. All of the market data used in this prospectus involves a number of assumptions and limitations, and you are cautioned not to give undue weight to such estimates. While we believe the estimated market position, market opportunity and market size information included in this prospectus is generally reliable, such information is inherently uncertain and imprecise. Projections, assumptions and estimates of our future performance and the future performance of the industry in which we operate are necessarily subject to a high degree of uncertainty and risk due to a variety of factors, including those described in “Risk Factors,” “Forward-Looking Statements” and elsewhere in this prospectus. These and other factors could cause results to differ materially from those expressed in the estimates prepared by independent parties and by us.
ii
Table of Contents
The items in the following summary are described in more detail later in this prospectus. This summary provides an overview of selected information and does not contain all of the information you should consider. Therefore, you should also read the more detailed information set out in this prospectus, including the risk factors, the consolidated financial statements and related notes thereto and the other documents to which this prospectus refers before making an investment decision. Unless otherwise stated in this prospectus, or as the context otherwise requires, references to “PSAV,” “we,” “us” or “our company” refer to (i) PSAV Holdings LLC and its subsidiaries or AVSC Holding Corp. prior to the corporate reorganization and (ii) PSAV, Inc. and its subsidiaries after giving effect to the corporate reorganization. Prior to the corporate reorganization and this offering, PSAV, Inc. held no material assets and did not engage in any operations. See “Organizational Structure.”
Overview
PSAV is a leading provider of audiovisual and event technology services in North America. Our highly-trained technical staff delivers innovative solutions in support of events ranging from small meetings in single conference rooms to global multi-media conference events with thousands of attendees. As our customers look to deliver more dynamic and impactful events, the event technology services we provide are a critical need and continue to grow in importance.
We are the event technology provider of choice at leading hotels, resorts and convention centers (“venues” or “venue partners”). Our business model is based on long-term partnerships with these venues, which establish us as the exclusive on-site provider of event technology services. Our customers, including corporations, event organizers, trade associations and meeting planners, hire us primarily through our on-site presence at venues to plan and execute their events. We have built a premier brand based on our comprehensive service offerings, strong track record of customer service, broad geographic footprint and on-site employee service model. Our largest market is the United States where we hold the number one position and serve approximately ten times the total venues of our closest competitor. In addition, we have a leading position in three of the nine countries we serve internationally.
Our market-leading position and scale is evidenced by the following:
| • | We support over 1.5 million meetings per year and are hired by over 1,100 meeting planners and event organizers on average each day. |
| • | We are the exclusive on-site event technology provider to over 1,300 venues globally, including venues representing 46% of the meeting and event space across all luxury and upper upscale hotel properties within the United States. |
| • | More than 95% of our over 7,500 employees are customer-facing, working alongside our venue partners’ sales teams and hospitality staff. |
| • | We operate in nine international markets with leading positions in Canada, Mexico and the United Kingdom. |
| • | We have averaged 98% venue retention rates and organic growth of 46 new venue openings per year since 2010. |
1
Table of Contents
We offer a compelling value proposition to both our venue partners and our customers. For our venue partners, meetings and events are an important source of revenue and profit. Through our services, these venues are able to generate significant incremental revenue with limited investment on their part. For our customers, meetings and events are critical marketing and communication vehicles to reach clients, employees and other stakeholders. Our event technology services enhance the delivery of the customer’s message to its audience and increase the overall impact of the event.
Our premier brand, scale and differentiated capabilities allow us to partner with some of the most iconic, marquee venues in the world, for whom we are the exclusive on-site provider of event technology services. Our venue partners consist primarily of luxury and upper upscale hotel properties, including properties operating under all 10 of the largest hotel chains as measured by meeting space in the United States, high-profile convention centers and other meeting spaces. Our long-term contracts with venues help align our mutual interests to maximize revenue and profitability from the customer events hosted at the venues. Our on-site staff interacts with the customer directly and is entrusted with maintaining the brand equity and professional standards of that particular venue.
We offer our customers a comprehensive set of event technology solutions to address the entire scope of their events from planning to execution. The rising technological complexity and growing importance of meetings and events enhances the importance of the relationship between the customers holding an event and the venues and service providers executing the event. Leveraging our technical expertise, our sales and production teams work with customers directly to identify key messages and goals for an event and develop ways to convey those messages in a creative and compelling fashion. During the event, our technicians work to ensure the services are effectively, professionally and reliably delivered.
2
Table of Contents
Our suite of services capitalizes on the industry’s growing demand for greater technological sophistication. We believe we have the broadest suite of services and solutions to meet the varied needs of venues and to capture the majority of their customers’ event planning spend. The following graphic illustrates some of our visible, and less visible, services:
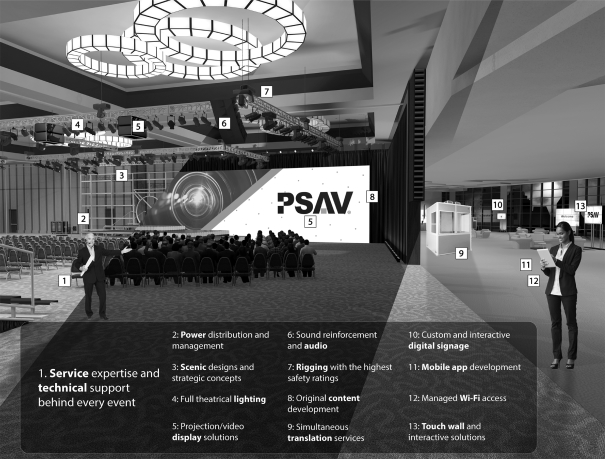
We have experienced rapid growth as a result of our market-leading position, our contractual relationships with venues, our broad service offering and our strategic acquisitions. We have increased the number of contracted venues by approximately 60% since 2010 and averaged an annual same venue revenue growth of 11.1% over the same period through June 2015. In addition to our strong organic growth, our strategic acquisitions have enhanced our capabilities, increased our density in local markets and expanded our scale.
Internationally, our broad, established and highly scalable platform allows us to capitalize on increasing customer spending on overseas events, and the global trend towards event technology outsourcing. We are taking advantage of this opportunity by entering new markets, expanding within the international markets of our leading hotel chain partners, building relationships with new international venue partners and making strategic acquisitions. By extending our international footprint, we will further solidify our existing venue relationships. Our annual international revenue has grown 35% since 2010.
3
Table of Contents
Between 2010 and 2014, our revenue increased from $573 million to $1,264 million, Adjusted EBITDA increased from $38 million to $157 million and net income (loss) improved from $(35.4) million to $(1.4) million. For the year ended December 31, 2014, our revenue of $1,264 million grew 15% versus the prior year. In this same period, our Adjusted EBITDA of $157 million represented 12% of revenue and 20% growth over the prior year. The 2014 amounts reflect the combined predecessor period from January 1, 2014 through January 24, 2014 and successor period from January 25, 2014 through December 31, 2014 adjusted to give effect to the Sponsors Acquisition (as defined under “—Our Principal Stockholders”) (the “2014 Pro Forma Combined Period”). See “Unaudited Pro Forma Condensed Consolidated Financial Statements” and “Management’s Discussion and Analysis of Financial Condition and Results of Operations—Results of Operations.” Adjusted EBITDA is a non-GAAP measure. For a reconciliation of Adjusted EBITDA to net income (loss), see “Selected Historical Consolidated Financial Data.”
Our History
Through our focus on innovation and customer service, we have evolved from a small, regionally-based provider of audiovisual services to a leading global event technology services provider. Initially focused on U.S. hotel venues, we started developing relationships with venues at a time when most properties still chose to provide their own, in-house audiovisual services to their customers. By the 1990s, as events and the associated technology needs grew increasingly complex, we observed that more U.S. hotels began outsourcing event technology services, bringing third-party providers on-site to work with guests directly regarding their needs for specialized technological expertise. Over the last decade, this trend has accelerated and broadened to include other venues such as convention centers, conference centers and sports stadiums. We anticipated this outsourcing trend and began establishing relationships with leading hotel chains at the corporate level. These relationships served as an endorsement of our brand and provided us access to the venues’ customers which helped fuel our growth.
In addition to our core growth, we have continued to grow our business through strategic acquisitions and through geographic expansion. Our largest acquisition was Swank Holdings, Inc. (“Swank”) in November 2012. Swank was the second largest outsourced provider of event technology services for hotels, resorts and conference centers throughout the United States and brought to us additional talent and complementary venue relationships. Additionally, we have completed three more acquisitions since 2013 that have broadened our portfolio of services and increased our density in key markets. More recently, we have focused on building our geographic footprint internationally. We continue to leverage our strong relationships with our leading international hotel chain partners in Canada, Mexico, Europe and the Middle East.
4
Table of Contents
Industry Background
Our Addressable Market
We believe we have an approximately $42 billion total addressable market. Our primary addressable market is an estimated $23 billion global audiovisual and event technology services industry. In addition, we selectively participate in the just under $20 billion estimated market for the design and construction of permanent audiovisual installations.
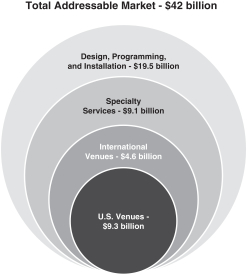
The market for core event technology services focuses on equipment, staging and production, which we estimate to be $9.3 billion across U.S. hotels, conference and convention centers and non-traditional venues (e.g., museums, sports stadiums and wedding halls). Today, we provide event technology services primarily in hotels, with the substantial majority in the luxury and upper upscale segments. Our 2014 Pro Forma Combined Period domestic segment revenue was $1,158 million.
We estimate the market for core event technology services internationally is $4.6 billion. Outside the United States, the geographies with the largest event technology spending include China, Western Europe, Southeast Asia, Japan and Canada. We expect demand for event technology services to grow faster in many regions internationally than in the United States, driven by higher economic growth rates, the trend toward more complex U.S.-style event production and the transition to outsourced event technology services. We currently operate in nine countries outside the United States, including the United Kingdom, France and Germany, and generated international segment revenue of $106 million for the 2014 Pro Forma Combined Period.
We also participate in what we estimate to be the $9.1 billion global market for specialty services in venues, including high-speed internet, power distribution and rigging. We believe rigging constitutes nearly half of that market and has been an area of growth for us since 2010. We believe the need for these services will continue to grow in importance for events. The proportion of our venue revenue generated by specialty services has increased from 8.4% in 2010 to 14.1% in the six months ended June 30, 2015. Our ability to provide these complementary services enhances our value proposition to our customers and allows us to capture a greater portion of the spend on each event.
5
Table of Contents
Meeting and Event Activity Historically Correlated with RevPAR
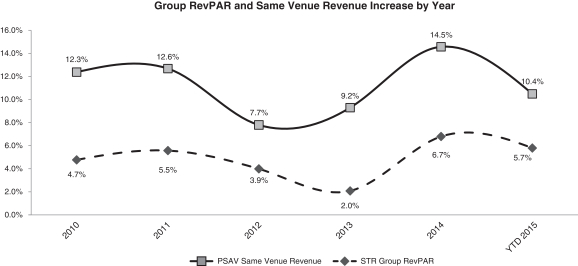
In the United States, meeting and event activity historically has been highly correlated with the hospitality industry metric Revenue per Available Room (“RevPAR”) and Group Revenue per Available Room (“Group RevPAR”), which are calculated by STR and PKF. STR is an independent, third-party service that collects and compiles the data used to calculate RevPAR and Group RevPAR, and PKF is an independent, third-party service that collects and compiles historical data used to calculate RevPAR. Whereas RevPAR is a total industry metric, Group RevPAR measures total guest hotel room revenue generated by group bookings (blocks of guest hotel rooms sold simultaneously in a group of 10 or more rooms), divided by total number of available guest hotel rooms. Because meetings and events generally require lodging for their participants, event activity typically correlates with Group RevPAR at nearby hotels, regardless of whether the events themselves are held on-site at hotels or at other nearby venues. As we provide event technology services primarily in hotels in the luxury and upper upscale segments, we refer to Group RevPAR for hotels in these segments as they more closely align with our business.
Within the United States, RevPAR has grown on average by 5.1% annually since 1970 according to PKF. Group RevPAR is a newer industry metric and represents a segment of the RevPAR performance, but tracks closely to overall RevPAR. Since 1970, RevPAR has only decreased in times of significant downturns in travel such as after September 11, 2001 and during the global financial crisis that began in 2008. More recently, both RevPAR and Group RevPAR have demonstrated strong growth in the rebound from the financial crisis, with overall RevPAR growing at a compound annual growth rate of 5.3% since 2010. Looking ahead, RevPAR for luxury and upper upscale hotels is predicted to grow at 6.3% in 2015 and 6.1% in 2016, according to PwC based on STR data. Our revenue historically has been correlated with Group RevPAR and our same venue revenue growth has exceeded Group RevPAR growth for each of the past six years as we have increased average revenue per event and expanded the services we offer through our venues.
Industry Trends
Continued Importance of Meetings and Events. In-person meetings and events continue to be rated as the single most effective marketing and communication vehicle. Companies recognize that face-to-face interactions are highly impactful and continue to support in-person events, despite the ubiquity of technology-based solutions such as video conferencing, social media, company websites, articles and webinars. In most cases, these technologies are used to supplement rather than replace in-person meetings. Meetings and events were estimated to contribute $280 billion of total spending in the United States in 2012, according to PwC, as companies and other organizations continued to deploy marketing budgets towards in-person meetings.
Venues are Focused on Increasing Group Revenue. Revenues generated by group bookings (“Group Revenue”) were estimated to contribute approximately $40 billion in hotel revenue in the United States and approximately $100 billion globally as of 2013 according to research consolidated by Travel Click by Passkey. Group Revenue often constitutes a hotel’s most profitable segment because of the increased associated spend on meeting space, banquet catering and event technology services. Luxury hotels in particular have focused on expanding Group Revenue by growing aggregate meeting space at a 10% compounded annual growth rate (“CAGR”) from 2009 to 2015. As hotels and other venues focus on this large and profitable segment of their business, they seek expanded service offerings to support meetings and events, including event technology services.
Rising Complexity in Event Technology. The rise in consumer technology has led to an increased demand for technological sophistication at meetings and events. These heightened expectations drive meeting and event planners to deliver a more interactive and engaging audience
6
Table of Contents
experience than they have in the past. For example, our customers are frequently requesting Wi-Fi access in all meeting spaces and seeking to use video, sound and staging to create branding and special effects for audience impact. The demands of tech-savvy audiences require more complex event technology solutions and trusted providers who can implement those solutions. This development has led to an increase in our average revenue per event across our domestic venues from $2,051 in 2010 to $3,124 in 2014.
Venues are Increasingly Outsourcing Event Technology Services. Given the rising complexity in event technology services and associated capital expenditure requirements, venues are increasingly looking to partner with outsourced providers such as us. Venues and customers benefit from high-quality customer service, broad service offerings and deep domain knowledge. At the corporate level, hotel chains benefit from a consistent standard of service across their venues. In addition, outsourced providers are often able to increase venues’ event technology revenue beyond what venues could achieve on their own because of event technology providers’ expanded offerings and specific focus on meetings and events. Since 2010, we have contracted to provide event technology services at 46 venues that were previously in-sourcing these services.
Internationally, Event Technology Opportunity Continues to Grow. We forecast that spending on event technology services at international venues will grow from an estimated $4.6 billion in 2015 to $5.4 billion in 2020, with many individual markets growing more quickly. We believe this growth is driven primarily by outsized economic growth in developing economies, increased globalization driving more meetings and events and U.S. hotel chains seeking to expand their international footprints. We expect international venues to increasingly adopt outsourcing of event technology services to realize the benefits of the on-site model that has proven successful in the United States.
Competitive Strengths
We believe our competitive strengths are as follows:
Highly Skilled Workforce with a Focus on Customer Service. We believe our ability to deliver high-quality, comprehensive event technology solutions is a direct result of our ability to hire, train and retain the best event technology services staff in the industry. More than 95% of our over 7,500 employees are in customer-facing roles. We provide numerous education and training programs to develop our personnel, focusing on hospitality and customer service as well as technical expertise. Our venue managers have an average tenure of nearly nine years and our regional vice presidents have an average tenure of approximately 15 years. Our employees’ technical expertise and familiarity with the specific venues in which they are based enable them to deliver seamless event execution to our customers.
Long-Term Relationships with High-Profile Venues and Hotel Chains. We have a long track record of delivering high-quality, comprehensive event technology solutions at the venues with whom we partner, including luxury and upper upscale hotel chains who have high expectations for customer service and execution. In addition, hotel chains value our ability to provide a consistent level of service across their venues. We have long-term master service agreements (“MSAs”) signed with four of the five largest domestic hotel chains naming us as a preferred provider of event technology services at their hotels. Individual venues in the chain may then choose to contract with us as the exclusive on-site provider pursuant to the terms established in the MSA. The MSAs typically provide us with a powerful endorsement as the only chain-endorsed event technology services provider and position us well to establish new contracts with additional hotels in the chain. For the individual venues where we provide on-site service, our integration with their operations and knowledge of their customers’ event technology needs provides them with strong incentives to renew their contracts with us, resulting in our average 98% annual venue retention rate since 2010.
7
Table of Contents
U.S. Market Leader with Broad Reach, Expansive Scale and Breadth of Service Offerings. We are the audiovisual and event technology services market leader in the United States with significantly greater market share than any of our competitors. We have venue contracts representing 46% of the meeting and event space in all of the luxury and upper upscale hotel properties in the United States. Our deep and broad platform includes over 7,500 employees, over 1,300 worldwide on-site event technology venues and 44 global branch warehouse locations. Our scale and reach offers several advantages. First, it enables us to offer the broadest range of event technology services and solutions, from core audiovisual services to specialty services such as rigging and power. Second, our network density enables us to leverage our people and our specialized equipment efficiently, driving higher margins and allowing us to provide our services at a wider range of venues cost effectively. Finally, our scale provides a barrier to entry to smaller, regional providers who we believe are unable to provide comparable expertise and capabilities.
Strong Historical Same Venue Revenue Growth. In the United States, our historical same venue revenue growth has exceeded Group RevPAR by an average of 640 basis points since 2010 as shown in the table below. We have been able to achieve this revenue growth due to our track record of outstanding customer service, increasing suite of services and sales team effectiveness. Our comprehensive solution set has enabled us to benefit from the industry-wide increase in technology spend per event as our customers migrate to more advanced technologies and purchase more of our services to support their events. For example, the proportion of our venue revenue generated by specialty services has increased from 8.4% in 2010 to 14.1% in the six months ended June 30, 2015. As these underlying trends continue, we expect our differentiated capabilities will allow for continued growth in same venue revenue.
Strong and Growing International Presence. We have a leading market position in Canada, Mexico and the United Kingdom with a presence in France, Monaco, Germany, United Arab Emirates, Dominican Republic and Singapore. We have strong relationships internationally with both venues and customers, and we currently provide a broad range of services at nearly 300 on-site properties outside the United States. Our contractual relationships with leading hotel chains and strong market position provide us with a competitive advantage over small, local providers who lack our scale and technological expertise.
8
Table of Contents
Compelling Financial Model with Multiple Levers to Drive Profitability and Manage Free Cash Flow. Our strong free cash flow allows us to continue to invest in our business, our people and our equipment. Furthermore, we have a flexible cost structure that allows resiliency in varied market conditions. Our overall cost of revenue is approximately 75% variable, driven by the variable nature of venue commissions, which is our primary expense. Our part-time labor force and strategic network of branch locations allow us to manage peak demand and sustain margins. Furthermore, most of our capital investment is success-based, with most significant capital investments tied to new or renewed venue contracts which are evaluated against our return requirements. The resulting flexibility in our cost structure and capital requirements allows us to deliver high-quality service to our customers while maintaining profitability and strong free cash flow.
Proven Management Team with Deep Industry Expertise. Our management team combines deep industry expertise with specific functional experience. They have presided over significant growth in the past several years and have led our transformation into a global event technology service provider. At the same time, they have instilled a collaborative company culture focusing on innovation and customer service, which has resulted in significant growth, high levels of satisfaction across customers and venue partners and a best-in-class team. Our senior operational team has an average of 18 years of industry experience and has operated across a variety of economic conditions and geographies.
Growth Strategies
We intend to pursue the following growth strategies in order to enhance our market leading position:
Capture More Events at Existing Venues. We believe significant opportunity exists to capture incremental events at our venues. We estimate that we currently service approximately 70% of the event technology spend in our existing venues with the remaining 30% spent by customers on other event service providers without an on-site venue presence.
Win New Venue Partners. We intend to expand our revenue by pursuing new venue partners. We estimate we have contracts with approximately 40% of the luxury and upper upscale U.S. hotel venues, and we believe that the remaining 60% provides a significant target market in which to win new venues. In addition, with less than 10% of our revenues generated from events at non-hotel venues, we believe we have a significant opportunity in the $6.2 billion non-hotel venue market including convention centers, sports stadiums, theaters, museums and other cultural centers, as we have on-site contracts at select non-hotel venues and additionally provide services to existing customers at non-hotel venues where we are not currently the preferred on-site provider of event technology services.
Win More Customers Independent of Venue. We manage approximately 250 customers as national accounts because their event technology needs require highly customized solutions or because they seek a consistent solution across a range of venues or geographies. This market represents a significant revenue opportunity as a large portion of the domestic marketplace continues to be serviced by event technology providers who are not on-site at a particular venue. We plan to leverage our broad branch network and specialized sales teams to continue to capture incremental share in this market.
Develop and Market Adjacent Services to Increase Revenue per Event. The trend towards increased technology spend per event is creating substantial opportunities to increase our event technology revenue across our suite of services. In the near term, we believe this trend will allow us to
9
Table of Contents
further penetrate the $9.1 billion specialty services market. Our event technology services that are considered part of the specialty services market include rigging, power, Wi-Fi services and creative services and contributed $36 million of revenue in 2010, which has grown to $138 million of revenue in the 2014 Pro Forma Combined Period. We will continue to focus on expanding our suite of services to grow our event technology revenue.
Continue to Expand Margins Through Operational Efficiencies. We have proven our ability to leverage operational efficiencies in driving profitability as our Adjusted EBITDA margin has expanded by approximately 580 basis points between 2010 and the 2014 Pro Forma Combined Period. We have several initiatives in process to continue to increase margins, focused primarily on labor and equipment utilization. For example, we are improving our labor utilization by standardizing our planning and forecasting of our hourly workforce to optimize staffing levels and introducing new initiatives on equipment sharing between venues and our branch network.
Expand International Revenue. The $4.6 billion international event technology services market represents a compelling growth opportunity. The four largest U.S.-based hotel chains with whom we have strong domestic relationships represent approximately 25% of total hotels in key addressable international markets. We are already working with these partners to add new venues across our existing international footprint. In addition, we intend to enter new markets as we have recently done in Singapore.
Selectively Pursue Acquisitions. We intend to pursue acquisitions to enter new markets and accelerate growth in existing markets. Over the past few years we have acquired and integrated four event technology service providers and have demonstrated a track record of achieving forecasted synergies. We maintain a pipeline of acquisitions which we evaluate based on established investment criteria including alignment with our culture and customer focus.
Our Principal Stockholders
On January 24, 2014, affiliates of The Goldman Sachs Group, Inc. (“Goldman Sachs”) and Olympus Partners (together with Goldman Sachs, the “Sponsors”), together with certain management investors and other investors formed PSAV Holdings LLC, which in turn acquired 100% of the voting equity interests in AVSC Holding Corp., which became an indirect wholly-owned subsidiary of PSAV Holdings LLC. We refer to the foregoing acquisition as the “Sponsors Acquisition.” Olympus Partners and Goldman Sachs currently each own approximately 45.53% of our equity.
In connection with the Sponsors Acquisition, one of our subsidiaries entered into a management advisory services agreement with Goldman, Sachs & Co., and Olympus Advisors LLC, affiliates of our Sponsors, to provide business and organizational strategy, financial and advisory services to us. We pay an annual advisory fee of $1.5 million apportioned equally between the Sponsors on January 24th of each year. We also paid a one-time fee of $6.0 million to Olympus Advisors LLC and $8.0 million to Goldman, Sachs & Co. under the agreement at the time of the Sponsors Acquisition. The management advisory services agreement will terminate in connection with this offering, and we believe the Sponsors currently intend to waive any amounts due to them pursuant to such termination. We expect the total amount of fees paid under the agreement to be $9.5 million to Goldman, Sachs & Co. and $7.5 million to Olympus Advisors LLC. For further information regarding the management advisory services agreement, see “Certain Relationships and Related Person Transactions—The Sponsors Acquisition—Management Advisory Services Agreement. In addition, in May 2015, we paid a distribution of $149.1 million in the aggregate to the members of PSAV Holdings LLC, of which $67.9 million was paid to each of the Sponsors.
10
Table of Contents
Following this offering, our Sponsors will continue to control our board of directors and corporate decisions. Our Sponsors may acquire or hold interests that compete directly with us, or may pursue acquisition opportunities that are complementary to our business, making such an acquisition unavailable to us. Our amended and restated certificate of incorporation will contain provisions renouncing any interest or expectancy held by our directors affiliated with our Sponsors in certain corporate opportunities. For further information, see “Management—Composition of Our Board of Directors” and “Risk Factors—Risks Related to This Offering and Ownership of Our Common Stock—Our Sponsors can significantly influence our business and affairs and may have conflicts of interest with us in the future.”
Controlled Company
Following the consummation of this offering, approximately % of our outstanding common stock will be beneficially owned by affiliates of Goldman Sachs and Olympus Partners. In particular, affiliates of Goldman Sachs collectively will beneficially own approximately % of our common stock (or approximately % if the underwriters exercise their option to purchase additional shares in full) and Olympus Partners will beneficially own approximately % of our common stock (or approximately % if the underwriters exercise their option to purchase additional shares in full). As a result, we will be a “controlled company” within the meaning of the New York Stock Exchange’s corporate governance rules. For a discussion of the applicable limitations and risks that may result from our status as a controlled company, see “Risk Factors—Risks Related to This Offering and Ownership of Our Common Stock—We are a ‘controlled company’ within the meaning of the New York Stock Exchange rules and, as a result, we will qualify for, and intend to rely on, exemptions from certain corporate governance requirements. You will not have the same protections afforded to stockholders of companies that are subject to such requirements.”
11
Table of Contents
Corporate Reorganization
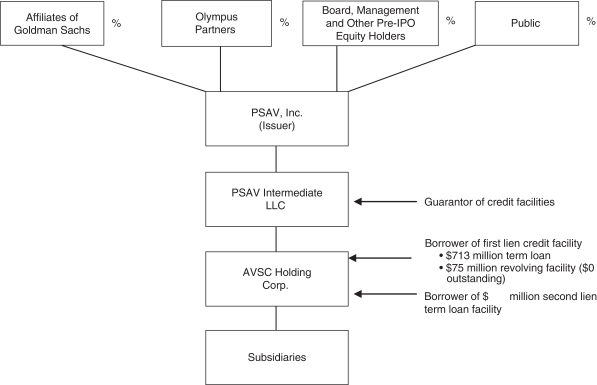
Prior to this offering, PSAV Holdings LLC and its subsidiaries conducted our business. Prior to the completion of this offering, a series of transactions will occur pursuant to which holders of equity interests in PSAV Holdings LLC will become holders of common stock in PSAV, Inc., the issuer of shares in this offering. For a more detailed description, see “Organizational Structure.”
The diagram below reflects our organizational structure following the corporate reorganization, this offering and the use of the net proceeds therefrom as if each occurred on June 30, 2015:
Risk Factors
An investment in our common stock involves a high degree of risk. Our ability to execute on our strategy also is subject to certain risks. Some of the more significant challenges and risks include the following:
| • | Unfavorable economic conditions have adversely affected, and in the future could adversely affect, our business, financial condition and results of operations. |
| • | Our failure to retain current venue partners and hotel chains or renew existing venue partner contracts and hotel chain MSAs would have a material adverse effect on our business, financial condition and results of operations. |
| • | Our failure to increase the number of quality of properties covered by our venue partner contracts, increase the number of hotel chains for which we are the preferred provider could have a material adverse effect on our business. |
12
Table of Contents
| • | The widespread adoption of more effective teleconference and virtual meeting technologies could reduce the number of events held at our venue partners, the size and scope of such events, including reduced demand for our services at events, or the attendance at such events, which could adversely affect our business results of operations or financial condition. |
| • | Potential venue partners may be reluctant to switch to a new preferred provider of event technology services, which may adversely affect our growth. |
| • | If venues reduce their outsourcing or use of preferred providers, it could have a material adverse effect on our business, financial condition and results of operations. |
| • | We have substantial indebtedness and we may incur additional indebtedness in the future, which may require us to use a substantial portion of our cash flow to service debt and limit our financial and operating flexibility. |
| • | We are a “controlled company” within the meaning of the New York Stock Exchange rules and, as a result, we will qualify for, and intend to rely on, exemptions from certain corporate governance requirements. Accordingly, stockholders will not have the same protections as stockholders of companies that are subject to such requirements. |
The above list is not exhaustive. Before you invest in our common stock, you should carefully consider all of the information in this prospectus, including matters set forth under the heading “Risk Factors” immediately following this summary.
Corporate Information
PSAV, Inc. was incorporated in Delaware on August 11, 2015. Our principal executive offices are located at 5100 N. River Road, Suite 300, Schiller Park, Illinois 60176, and our telephone number is (847) 222-9800. Our website is www.psav.com. Our website and the information contained on, or that can be accessed through, the website is not deemed to be incorporated by reference in, and is not considered part of, this prospectus. You should not rely on any such information in making your decision whether to purchase our common stock.
13
Table of Contents
The Offering
| Issuer |
PSAV, Inc. |
| Common Stock Offered by Us |
shares of common stock. |
| Common Stock Offered by the Selling Stockholders |
shares of common stock. |
| Common Stock to be Outstanding After This Offering |
shares of common stock. |
| Option to Purchase Additional Shares of Common Stock |
The underwriters have an option to purchase a maximum of additional shares of common stock from the selling stockholders named in this prospectus. The underwriters can exercise this option at any time within 30 days from the date of this prospectus. |
| Use of Proceeds |
We estimate that the net proceeds from the sale of our common stock in this offering, after deducting the underwriting discount and estimated offering expenses payable by us, will be approximately $ million based on an assumed initial public offering price of $ per share (the midpoint of the estimated public offering price range set forth on the cover page of this prospectus). We intend to use the net proceeds from this offering to repay borrowings under our second lien credit facility. See “Use of Proceeds.” We will not receive any of the proceeds from the sale of the shares being sold by the selling stockholders. |
| Conflicts of Interest |
Because Goldman, Sachs & Co. is an underwriter and its affiliates own in excess of 10% of our issued and outstanding common stock, Goldman, Sachs & Co. is deemed to have a “conflict of interest” under FINRA Rule 5121. Accordingly, this offering will be made in compliance with the applicable provisions of Rule 5121. Rule 5121 requires that a “qualified independent underwriter” meeting certain standards participate in the preparation of the registration statement and prospectus and exercise the usual standards of due diligence in respect thereto, subject to certain exceptions which are not applicable here. Morgan Stanley & Co. LLC will serve as a qualified independent |
14
Table of Contents
| underwriter within the meaning of Rule 5121 in connection with this offering. For more information, see “Underwriting (Conflicts of Interest and Other Relationships)—Conflicts of Interest and Other Relationships.” |
| Dividend Policy |
We do not intend to pay dividends on our common stock. However, we may change this policy in the future. See “Dividend Policy.” |
| Listing |
We intend to apply to have our common stock listed on the New York Stock Exchange under the symbol “PSAV.” |
| Risk Factors |
Investing in our common stock involves a high degree of risk. See the “Risk Factors” section of this prospectus for a discussion of factors you should carefully consider before deciding to purchase shares of our common stock. |
Except as otherwise indicated, all information in this prospectus:
| • | excludes shares of unrestricted common stock and shares of restricted common stock issued under our 2015 PSAV, Inc. Equity Incentive Plan, or the 2015 Equity Plan, to holders of Class B Units outstanding under the PSAV Holdings LLC 2014 Management Incentive Plan and Phantom Units outstanding under the PSAV Holdings LLC Phantom Unit Appreciation Plan; |
| • | excludes an aggregate of additional shares of common stock that will be available for future awards pursuant to the 2015 Equity Plan; |
| • | gives effect to our amended and restated certificate of incorporation, which will be in effect prior to the consummation of this offering; and |
| • | assumes an initial public offering price of $ per share (the midpoint of the estimated public offering price range set forth on the cover page of this prospectus). |
15
Table of Contents
SUMMARY HISTORICAL CONSOLIDATED FINANCIAL AND OTHER DATA
The following table sets forth our summary historical consolidated financial and other data for the periods and as of the dates indicated. The periods prior to and including January 24, 2014, the date of the Sponsors Acquisition, are referred to in the following table as “Predecessor,” and all periods after such date are referred to in the following table as “Successor.” The consolidated financial statements for all Successor periods are not comparable to those of the Predecessor periods.
We derived the summary consolidated statement of operations and other data for the period from January 25, 2014 through June 30, 2014 and the six months ended June 30, 2015 and the balance sheet data as of June 30, 2015 from our unaudited condensed consolidated financial statements contained elsewhere in this prospectus. We derived the summary consolidated statement of operations and other data for the years ended December 31, 2012 and 2013, the period from January 1, 2014 through January 24, 2014 and the period from January 25, 2014 through December 31, 2014 from our audited consolidated financial statements contained elsewhere in this prospectus. We have prepared the unaudited condensed consolidated financial statements on the same basis as our audited consolidated financial statements and have included all adjustments, consisting of only normal recurring adjustments, that we consider necessary for the fair presentation of our financial position and operating results for such periods. The interim results are not necessarily indicative of results for the year ending December 31, 2015 or for any other period.
Our historical results are not necessarily indicative of future operating results. You should read the information set forth below in conjunction with “Selected Historical Consolidated Financial Data,” “Unaudited Pro Forma Condensed Consolidated Financial Statements,” “Management’s Discussion and Analysis of Financial Condition and Results of Operations” and our consolidated financial statements and the related notes thereto contained elsewhere in this prospectus.
16
Table of Contents
| Twelve Months Ended December 31, 2014 |
Six Months Ended June 30, 2014 |
|||||||||||||||||||||||||||||||
| Predecessor | Predecessor | Successor | Predecessor | Successor | Successor | |||||||||||||||||||||||||||
| Year Ended December 31, |
January 1, through January 24, 2014 |
January 25, through December 31, 2014 |
January 1, through January 24, 2014 |
January 25, through June 30, 2014 |
Six Months Ended June 30, 2015 |
|||||||||||||||||||||||||||
| 2012 | 2013 | |||||||||||||||||||||||||||||||
| (dollars in thousands) | ||||||||||||||||||||||||||||||||
| Consolidated Statement of Operations Data: |
||||||||||||||||||||||||||||||||
| Revenue |
$ | 724,848 | $ | 1,096,374 | $ | 75,622 | $ | 1,188,283 | $ | 75,622 | $ | 599,543 | $ | 791,988 | ||||||||||||||||||
| Income (loss) from operations |
18,507 | 53,998 | (33,960 | ) | 33,755 | (33,960 | ) | 28,925 | 50,980 | |||||||||||||||||||||||
| Income (loss) before income taxes |
(196 | ) | 14,576 | (36,424 | ) | (10,673 | ) | (36,424 | ) | 9,421 | 25,538 | |||||||||||||||||||||
| Net income (loss) |
9,703 | 17,596 | (25,921 | ) | (10,566 | ) | (25,921 | ) | 865 | 15,133 | ||||||||||||||||||||||
| Consolidated Statement of Cash Flows Data: |
||||||||||||||||||||||||||||||||
| Net cash provided by (used in): |
||||||||||||||||||||||||||||||||
| Operating activities |
$ | 57,431 | $ | 51,330 | $ | (2,018 | ) | $ | 46,271 | $ | (2,018 | ) | $ | 3,221 | $ | 27,969 | ||||||||||||||||
| Investing activities |
(304,596 | ) | (77,219 | ) | (4,268 | ) | (911,732 | ) | (4,268 | ) | (888,849 | ) | (72,480 | ) | ||||||||||||||||||
| Financing activities |
232,693 | 35,750 | — | 935,071 | — | 927,171 | 45,809 | |||||||||||||||||||||||||
| Other Financial Data: |
||||||||||||||||||||||||||||||||
| Capital expenditures |
$ | 29,354 | $ | 36,506 | $ | 4,268 | $ | 34,130 | $ | 4,268 | $ | 11,247 | $ | 28,587 | ||||||||||||||||||
| Adjusted EBITDA(1) |
72,467 | 130,381 | 7,892 | 149,047 | 7,892 | 92,464 | 113,318 | |||||||||||||||||||||||||
| Adjusted EBITDA margin(1) |
10.0 | % | 11.9 | % | 10.4 | % | 12.5 | % | 10.4 | % | 15.4 | % | 14.3 | % | ||||||||||||||||||
| Operating Data: |
||||||||||||||||||||||||||||||||
| Domestic: |
||||||||||||||||||||||||||||||||
| Revenue |
$ | 631,105 | $ | 991,682 | $ | 70,240 | $ | 1,087,737 | $ | 70,240 | $ | 549,635 | $ | 731,524 | ||||||||||||||||||
| Adjusted EBITDA(1) |
62,933 | 118,618 | 7,280 | 138,594 | 7,280 | 86,344 | 106,435 | |||||||||||||||||||||||||
| International: |
||||||||||||||||||||||||||||||||
| Revenue |
93,743 | 104,692 | 5,382 | 100,546 | 5,382 | 49,908 | 60,464 | |||||||||||||||||||||||||
| Adjusted EBITDA(1) |
9,534 | 11,763 | 612 | 10,453 | 612 | 6,120 | 6,883 | |||||||||||||||||||||||||
| As of June 30, 2015 |
||||
| (in thousands) | ||||
| Consolidated Balance Sheet Data: |
||||
| Cash and cash equivalents |
$ | 69,184 | ||
| Total assets |
1,300,908 | |||
| Long-term debt (including current portion) |
864,906 | |||
| Total liabilities |
1,175,672 | |||
| Total members’ equity |
125,236 | |||
| (1) | Adjusted EBITDA represents net income before interest expense, income taxes, depreciation, amortization of intangibles, transaction-related expenses, long-term incentive plan payments, gain or loss on disposal of assets, gains or losses on foreign currency transactions, changes in the fair value of our interest rate caps, amortization of venue incentives including the expense impact of certain venue incentive payments for which deferred expense recognition was not applicable under U.S. GAAP, management fees paid to our Sponsors, equity-based compensation expense, executive severance and certain consulting and professional costs. We define Adjusted EBITDA margin as Adjusted EBITDA as a percentage of revenue. Management believes Adjusted EBITDA and Adjusted EBITDA margin are useful because they allow management to more effectively evaluate our operating performance and compare the results of our operations from period to period without regard to our financing methods or capital structure |
17
Table of Contents
| or other items that we believe are not indicative of our ongoing operating performance. In addition, the determination of Adjusted EBITDA is consistent with the definition of a similar measure in our credit agreements other than pro forma adjustments for acquisitions and certain forward-looking adjustments permitted by the credit agreements but not considered by management in evaluating our performance using Adjusted EBITDA. |
Adjusted EBITDA is a “non-GAAP financial measure” as defined under the rules of the SEC. Our presentation of Adjusted EBITDA is intended as a supplemental measure of our performance that is not required by, or presented in accordance with, U.S. GAAP. Adjusted EBITDA should not be considered as an alternative to income (loss) from operations, net income (loss), earnings per share or any other performance measures derived in accordance with U.S. GAAP as measures of operating performance or operating cash flows or as measures of liquidity. Our presentation of Adjusted EBITDA should not be construed to imply that our future results will be unaffected by these items. Adjusted EBITDA is included in this prospectus because it is a key metric used by management to assess our operating performance.
Management believes the inclusion of Adjusted EBITDA is meaningful to our investors to enhance their understanding of our financial performance. Although Adjusted EBITDA is not necessarily a measure of liquidity or our ability to fund our operations, we understand that it is frequently used by securities analysts, investors and other interested parties as a supplemental measure of financial performance.
Adjusted EBITDA has important limitations as an analytical tool and you should not consider it in isolation or as a substitute for analysis of our results as reported under U.S. GAAP. Some of these limitations are:
Adjusted EBITDA:
| • | does not reflect our cash expenditures, or future requirements, for capital expenditures or contractual commitments; |
| • | does not reflect our cash expenditures for venue incentives or the amortization of those venue incentive payments; |
| • | although depreciation and amortization of intangibles are non-cash charges, the assets being depreciated and amortized will often have to be replaced in the future, and Adjusted EBITDA does not reflect any cash requirements for such replacements; |
| • | does not reflect the costs of acquisitions of businesses or other capital market transactions; |
| • | does not reflect the significant interest expense, or the cash requirements necessary to service interest or principal payments on our debt; |
| • | does not reflect our income tax expense or the cash requirements to pay our income taxes; |
| • | does not reflect changes in, or cash requirements for, our working capital needs; |
| • | does not reflect the cash requirements for other excluded items; |
| • | does not reflect the impact of equity-based compensation upon our operations; and |
| • | may not be consistent with how other companies in our industry calculate Adjusted EBITDA. |
18
Table of Contents
In evaluating Adjusted EBITDA, you should be aware that in the future we may incur expenses similar to those eliminated in this presentation.
The following table reconciles net income (loss) to Adjusted EBITDA for the periods presented:
| Twelve Months Ended December 31, 2014 |
Six Months Ended June 30, 2014 |
|||||||||||||||||||||||||||||||
| Predecessor | Predecessor | Successor | Predecessor | Successor | Successor | |||||||||||||||||||||||||||
| Year Ended December 31, |
January 1, through January 24, 2014 |
January 25, through December 31, 2014 |
January 1, through January 24, 2014 |
January 25, through June 30, 2014 |
Six Months Ended June 30, 2015 |
|||||||||||||||||||||||||||
| 2012 | 2013 | |||||||||||||||||||||||||||||||
| (in thousands) | ||||||||||||||||||||||||||||||||
| Net income (loss) |
$ | 9,703 | $ | 17,596 | $ | (25,921 | ) | $ | (10,566 | ) | $ | (25,921 | ) | $ | 865 | $ | 15,133 | |||||||||||||||
| Income tax (benefit) expense |
(9,899 | ) | (3,020 | ) | (10,503 | ) | (107 | ) | (10,503 | ) | 8,556 | 10,405 | ||||||||||||||||||||
| Interest expense, net |
20,011 | 40,700 | 2,830 | 40,536 | 2,830 | 18,737 | 23,569 | |||||||||||||||||||||||||
| Depreciation and amortization of intangibles |
30,174 | 47,502 | 3,222 | 71,950 | 3,222 | 33,066 | 42,419 | |||||||||||||||||||||||||
| Transaction-related expenses(a) |
4,004 | 12,004 | 14,243 | 20,410 | 14,243 | 19,057 | 2,757 | |||||||||||||||||||||||||
| Long-term incentive plan payments(b) |
6,850 | — | 18,021 | 42 | 18,021 | 42 | — | |||||||||||||||||||||||||
| (Gain)/loss on disposal of assets |
1,695 | 2,051 | 127 | 2,918 | 127 | 1,141 | 1,608 | |||||||||||||||||||||||||
| Foreign Currency transactions (gain)/loss(c) |
(1,308 | ) | (1,278 | ) | (366 | ) | 2,075 | (366 | ) | (381 | ) | 763 | ||||||||||||||||||||
| Changes in fair value of interest rate caps(d) |
— | — | — | 1,817 | — | 1,148 | 973 | |||||||||||||||||||||||||
| Amortization of venue incentives(e) |
8,623 | 9,318 | 705 | 8,306 | 705 | 5,489 | 3,456 | |||||||||||||||||||||||||
| Management fee(f) |
— | — | — | 1,405 | — | 649 | 786 | |||||||||||||||||||||||||
| Equity-based compensation expense(g) |
— | — | 5,365 | 299 | 5,365 | 136 | 163 | |||||||||||||||||||||||||
| Severance expense(h) |
978 | 2,334 | 163 | 798 | 163 | 758 | 1,982 | |||||||||||||||||||||||||
| Consulting fees and other(i) |
1,636 | 3,174 | 6 | 9,164 | 6 | 3,201 | 9,304 | |||||||||||||||||||||||||
|
|
|
|
|
|
|
|
|
|
|
|
|
|
|
|||||||||||||||||||
| Adjusted EBITDA |
$ | 72,467 | $ | 130,381 | $ | 7,892 | $ | 149,047 | $ | 7,892 | $ | 92,464 | $ | 113,318 | ||||||||||||||||||
|
|
|
|
|
|
|
|
|
|
|
|
|
|
|
|||||||||||||||||||
| (a) | Expenses incurred in connection with acquisitions, including the Sponsors Acquisition, such as pre-acquisition professional fees and costs to integrate these businesses. |
| (b) | Expenses associated with our long-term incentive plans for certain members of management paid in connection with the acquisition of Swank in 2012 and the Sponsors Acquisition in 2014. |
| (c) | Gains and losses on transactions settled in foreign currencies. |
| (d) | Refer to Note 12 and Note 13 to our audited consolidated financial statements included elsewhere in this prospectus for further information on our interest rate caps. |
| (e) | Amortization of signing incentive payments made to venues over the term of related agreements, including the expense impact of $4.1 million in 2014 and $0.3 million in 2015 in venue incentive payments for which deferred expense recognition was not applicable under U.S. GAAP. |
| (f) | Annual management fee and related expenses paid to our Sponsors. |
| (g) | For the period from January 1, 2014 through January 24, 2014, relates to grants of equity in connection with the Sponsors Acquisition. |
| (h) | Severance expense related to employees terminated subsequent to acquisitions. |
| (i) | Professional services expenses related to interim management and strategic initiatives. In 2012 through 2014, includes costs related to an insurance policy purchased by the Predecessor. |
19
Table of Contents
Investing in our common stock involves a high degree of risk. You should carefully consider the following risk factors and all other information contained in this prospectus before purchasing our common stock. If any of the following risks occur, our business, financial condition or results of operations could be materially and adversely affected. In that case, the trading price of our common stock could decline and you may lose some or all of your investment.
Risks Related to Our Business and Industry
Unfavorable economic conditions have adversely affected, and in the future could adversely affect, our business, financial condition and results of operations.
A national or international economic downturn has reduced, and in the future could reduce, demand for our services, which may result in the loss of business or increased pressure to negotiate new contracts or renewals on less favorable terms than our generally preferred terms. Economic hardship among our venue partners and customers can also adversely affect our business. For example, we provide services in hotels and convention centers that are sensitive to an economic downturn, as expenditures to hold or attend conventions or other events requiring our event technology services are funded to a partial or total extent by discretionary income. The last economic downturn negatively affected the number of events held at our venue partners and the amount of spending on such events. Further, because our exposure to customers of our event technology services is limited in large part by our dependence on our venue partners to attract those customers to hold their events at their properties, our ability to respond to such a reduction in events, and therefore our revenue, is limited. There are many other factors that could reduce the numbers of events at a venue or attendance at any such events, including acts of terrorism, particularly acts that impact hotels or the travel industry, and the national and global military, diplomatic and financial response to such acts or other threats or natural disasters, including hurricanes and earthquakes, and global calamities, such as an Ebola outbreak or a flu pandemic, which could adversely affect our business, financial condition and results of operations.
Our failure to retain our current venue partners and hotel chains or renew our existing venue partner contracts and hotel chain MSAs would have a material adverse effect on our business, financial condition and results of operations.
Our business depends on our ability to retain our current venue partners and hotel chains and renew our existing venue partner contracts and hotel chain MSAs. We may not be able to renew existing venue partner contracts and hotel chain MSAs on the same or more favorable terms. Our current venue partners may work with our competitors, cease operations, elect to provide event technology services in-house, diversify their preferred providers, reduce their cooperation with our sales representatives or terminate contracts with us.
In addition, while we enter into MSAs with major hotel chains, individual hotel properties typically make separate decisions as to their event technology services providers. Therefore, our inability to renew hotel chain MSAs will not automatically terminate our relationships with the individual hotel properties. However, the corporate offices of major hotel chains may influence the decisions of their individual properties. For example, if the hotel chain discontinues its relationship with us in favor of another service provider or an in-house solution, our relationship with the properties under that brand may suffer even though, in nearly all cases, we negotiate with each property individually. This may lead to significant lost revenue or result in additional costs to complete sales of our event technology services, any of which would adversely affect our results of operations.
20
Table of Contents
The failure to renew a significant number of our existing contracts or MSAs would have a material adverse effect on our business, financial condition and results of operations.
Our failure to increase the number or quality of properties covered by our venue partner contracts, increase the number of hotel chains for which we are the preferred provider could have a material adverse effect on our business, financial condition and results of operations.
Our business and revenue growth depends on our ability to increase the services for which we are the preferred provider at our venue partners and obtain new venue partners. While our contracts with our venue partners and hotel chain MSAs generally allow us to be the exclusive on-site provider of services, customers can bring in their own technologies or use other parties that are not located on-site at these locations. In addition, such contracts do not generally provide any minimum revenue or event commitments. Accordingly, our ability to generate or increase revenue at these venues depends on a variety of factors, including:
| • | our ability to obtain and retain attractive venues for which we serve as preferred provider; |
| • | our ability to obtain leads for events from our venue partners; |
| • | the quality, price and appeal of our event technology services; |
| • | our ability to integrate new technologies into our event technology services to avoid obsolescence and provide scalability and meet evolving customer preferences; and |
| • | our ability to market our services effectively and differentiate ourselves from our competitors or the venue’s in-house solutions. |
This risk is heightened by the concentrated nature of the hospitality industry, which is dominated by a relatively small number of major hotel chains that are focused on hosting large business-oriented events. If we are unable to maintain and grow our network of hotel chains and venues, we may be unable to satisfy our customers’ needs, lose market share or incur additional costs to support our customers, all of which could have a material adverse effect on our business, results of operations or financial condition.
The widespread adoption of more effective teleconference and virtual meeting technologies could reduce the number of events held at our venue partners, the size and scope of such events, including reduced demand for our services at events, or the attendance at such events, which could adversely affect our business, financial condition and results of operations.
Our business and growth strategies rely in part upon our customers’ continued need for in-person meetings and conferences. Should more effective teleconference and virtual meeting technologies be developed, customers could choose to substitute these technologies for part or all of their in-person meetings and conferences. The emergence of more effective teleconference or virtual meeting technologies, the widespread adoption of teleconference and virtual meeting technologies or changes in preferences of our customers could adversely affect our business, financial condition and results of operations.
In addition, existing or potential venue partners and customers may elect to use self-operated solutions, eliminating business opportunities for us. As technology advances, demand for our services at events at venue partners could be reduced as customers become more able to substitute readily available products for our services. If it becomes easier and more cost-effective for customers to host events without the type of services we provide, our business, financial condition and results of operations could be adversely affected.
21
Table of Contents
Potential venue partners may be reluctant to switch to a new preferred provider of event technology services, which may adversely affect our growth.
Many large hotel chains, convention centers and other venues have existing relationships with event technology services providers and may be reluctant to switch to a new preferred provider due to a variety of factors, including service disruptions associated with a change of providers and potential impact on revenue during the transition period. If we are unable to overcome these concerns, we may not be able to attract new venue partners, which could have a material adverse effect on our growth.
If venues reduce their outsourcing or use of preferred providers, it could have a material adverse effect on our business, financial condition and results of operations.
Our business and growth strategies depend in part on the continuation of a current trend toward outsourcing services in general and event technology services in particular. Venues will outsource if they perceive that outsourcing allows them to provide quality services at a lower cost, generates incremental revenue for them and permits them to focus on their core business activities. Potential venue partners may seek to provide event technology services in-house in order to maintain control over the quality of the event technology services provided at their venues, enhance their customer relationships and increase their revenue. If the trend to outsource does not continue or our venue partners elect to perform these event technology services in-house, it could have a material adverse effect on our business, financial condition and results of operations.
Furthermore, some of our large hotel chain partners have retained a limited number of preferred partners to provide all or a large part of their required services across their portfolio of hotels. If we are not selected and retained as a preferred partner to provide event technology services, it could limit our ability to pursue and enter into venue contracts and have a material adverse effect on our business, financial condition and results of operations.
Our success depends on our ability to maintain the value and reputation of our brand.
Our success depends on the value and reputation of the PSAV brand. Brand and name recognition is an important differentiator in the event technology services business as prospective venue partners may only outsource to well-known and established event technology service providers. The PSAV name is integral to our business as well as to the implementation of our strategies for expanding our business. Maintaining, promoting and positioning our brand will depend largely on the success of venue partner and customer relationships and our ability to provide consistent, high quality and innovative services. Our brand could be adversely affected if we fail to achieve these objectives or if our public image or reputation were to be tarnished by negative publicity, which could have a material adverse effect on our business, financial condition and results of operations.
Competition in our industry could adversely affect our results of operations.
There is competition in the event technology services business from local, regional, national and international companies, of varying sizes, many of which have substantial technical capabilities, venue relationships or financial resources. We compete with such providers for preferred provider contracts with venue partners and hotel chains as well as for event contracts with our customers. Our ability to successfully compete for venue partners and hotel chains depends on our ability to provide the event technology services demanded by their customers at a competitive price, our experience and expertise, the availability of adequately trained personnel, access to equipment and our ability to generate revenue opportunities. Certain of our competitors have been and may in the future be willing to underbid us or accept a lower profit margin or expend more capital in order to obtain or retain venue
22
Table of Contents
or customer relationships. Also, certain regional and local service providers may be better established than we are within a specific geographic region. In addition, existing or potential venue partners and customers may elect to use self-operated solutions, eliminating business opportunities for us. While we have a significant U.S. presence, certain of our competitors may offer a broader range of services or have more established presences in certain international markets than we do. Therefore, we may be placed at a competitive disadvantage for venue partners and customers who require services in multiple international markets. While most venue partners and customers focus primarily on quality of service, venue partners and customers are also price-sensitive. If existing or future competitors seek to gain venue partners, customers or accounts by reducing prices, we may be required to lower prices, which could reduce our revenue and profits, which, in turn, could have a material adverse effect on our business, financial condition and results of operations.
Any acquisition that we make or strategic relationship that we enter into could disrupt our business and have a material adverse effect on our business, financial condition and results of operations.
In recent years, we have expanded our business through acquisitions. We may seek to acquire companies or interests in companies or enter into strategic relationships in the future that complement our business, and our inability to complete acquisitions, integrate acquired companies successfully or enter into strategic relationships may render us less competitive. We may not realize the anticipated benefits from our recent or future acquisitions or strategic relationships. Likewise, we may not be able to obtain necessary financing for acquisitions on commercially reasonable terms, or at all. In addition, our ability to control the planning and operations of our strategic relationships and other less than majority-owned affiliates may be subject to numerous restrictions imposed by the applicable agreements and majority stockholders. The parties to any strategic relationships that we may enter into may also have interests which differ from ours, which could adversely impact the success of any such strategic relationship.
The process of integrating acquired operations into our existing operations may result in operating and contract difficulties, such as the failure to retain venue partners, customers or management and technical personnel and problems coordinating services, personnel and technology. Also, in connection with any acquisition, we could fail to discover liabilities of the acquired company for which we may be responsible as a successor owner or operator in spite of any investigation we make prior to the acquisition. In addition, labor laws in certain countries may require us to retain more employees than would otherwise be optimal from entities we acquire. Such difficulties may divert significant financial, operational and managerial resources from our existing operations and make it more difficult to achieve our operating and strategic objectives. The diversion of management attention, particularly in a difficult operating environment, may affect our revenue and our business. Similarly, our business depends on effective information technology systems, and implementation delays or poor execution of the integration of different information technology systems could disrupt our operations and increase costs. Possible future acquisitions could result in the incurrence of additional debt and related interest expense or contingent liabilities and amortization expenses related to intangible assets, which could have a material adverse effect on our financial condition, results of operations and cash flow. In addition, goodwill resulting from business combinations represents a significant portion of our assets. If the goodwill were deemed to be impaired, we would need to take a charge to earnings to write down the goodwill to its fair value, which would adversely affect our results of operations. To the extent we pay for any acquisitions using cash, it would reduce our cash reserves, and to the extent the purchase price is paid in stock, it could be dilutive to our then existing stockholders. We cannot ensure that any acquisition or strategic relationship that we enter into will not have a material adverse effect on our business, financial condition and results of operations.
23
Table of Contents
We often face a long cycle to secure new agreements with venues and hotel chains as well as long implementation periods that require significant resource commitments, which result in a long lead time before we generate revenue from new relationships.
We often face a long cycle to secure a new contract with a venue or a hotel chain, and when we first execute an MSA with a new hotel chain, it may take 30 days to six months or longer before we can enter into agreements with individual venues. If we are successful in obtaining a new venue partner, that is generally followed by a long implementation period in which the services are planned in detail and we obtain the requisite equipment and personnel. During this time, a venue contract is also negotiated and agreed. As a result, there is an extended period before we commence providing the related services and receiving related revenue. We typically incur significant business development expenses during this period with both venues and hotel chains. Furthermore, even if we succeed in developing a relationship with a potential new venue partner or hotel chain and begin to plan the services in detail, a potential venue partner may choose a competitor or decide to perform the event technology services in-house prior to the time a final contract is signed. If we enter into an MSA with a new hotel chain, we still need to enter into new contracts with venues within the hotel chain before we can generate revenue. If we enter into a contract with a venue partner, we will not generate any revenue until we are successful in selling our services to the customers holding events at the venue partner’s property, which can be 30 days to six months once the contract is signed. Our venue partners may also experience delays in obtaining internal approvals or delays associated with technology or system implementations, further lengthening the implementation cycle. Once a contract is signed, we generally incur upfront costs and prepayments at the outset of the contract, hire new employees and obtain new equipment in order to provide services to a new venue partner. We may face significant difficulties in hiring such employees and incur significant costs before we generate corresponding revenue. If we are not successful in obtaining contractual commitments, in maintaining contractual commitments after the implementation cycle or in reducing the duration of unprofitable initial periods in our contracts, it could have a material adverse effect on our business, financial condition and results of operations.
Our business may suffer if we are unable to hire and retain sufficient qualified personnel or if labor costs increase.
We are dependent on a large and skilled workforce to implement our services at our venue locations. Our success depends in part upon our ability to attract, train and retain a sufficient number of employees who understand and appreciate our culture and are able to represent our brand effectively and establish credibility with our venue partners and customers. If we are unable to hire and retain employees capable of meeting our business needs and expectations, our business and brand image may be impaired. Any failure to meet our staffing needs or any material increase in turnover rates of our employees may adversely affect our business, financial condition and results of operations. From time to time, we have had difficulty in hiring and retaining qualified technical and sales personnel. We will continue to have significant requirements to hire such personnel. In the past, at times when the United States or other geographic regions have periodically experienced reduced levels of unemployment, there has been a shortage of qualified workers at all levels. Given that our workforce requires large numbers of skilled workers and managers, low levels of unemployment when such conditions exist or mismatches between the labor markets and our skill requirements can compromise our ability in certain areas of our businesses to continue to provide quality service or compete for new business. We also regularly hire a large number of part-time and seasonal workers. Any difficulty we may encounter in hiring such workers could result in significant increases in labor costs, which could have a material adverse effect on our business, financial condition and results of operations. Competition for labor has at times resulted in wage increases in the past and competition could substantially increase our labor costs in the future.
24
Table of Contents
We rely on third-party equipment suppliers.
Some of the equipment we utilize in providing our services consists of equipment that we rent from various suppliers. To the extent our suppliers cannot supply us with equipment or necessary replacement parts in a timely manner or significantly increase their prices or provide us with faulty equipment, our equipment costs may increase and we may be unable to provide our services in a timely manner or may be liable for our inability to provide the contracted services. This could result in a material adverse effect on our business, financial condition and results of operations.
We rely on our venue partners for billing and collection for event technology services provided at their venues, which exposes us to certain risks.
Under the majority of our venue partner contracts, the venue partners are responsible for billing and payment collection for the event technology services that we provide at their venues. The venues’ commissions are typically not dependent on such collections. As a result, if our venue partners do not bill and collect on a timely basis, do not vigorously pursue such billing and collection activities, do not pay us on a timely basis after collection, do not pay us at all or experience financial difficulty, our receipt of revenue for the services that we have provided may be delayed or may not occur. In addition, such billing and collection activities could adversely impact our relationships with our customers in the event of billing or collection disputes. We also retain the risk that our customers may default on the payment for our services. As a result, these billing and collection activities could have a material adverse effect on our business, financial condition and results of operations.
If we fail to comply with requirements imposed by applicable law or other governmental regulations, we could become subject to lawsuits, investigations and other liabilities and restrictions on our operations that could significantly and adversely affect our business.
We are subject to governmental regulation at the federal, state, international, national, provincial and local levels in many areas of our business, such as employment laws, wage and hour laws, discrimination laws, immigration laws, human health and safety laws, import and export controls and customs laws, environmental laws, false claims or whistleblower statutes, minority, women and disadvantaged business enterprise statutes, tax codes, antitrust and competition laws, consumer protection statutes, procurement regulations, intellectual property laws, the Foreign Corrupt Practices Act, the U.K. Bribery Act, other anti-corruption laws, lobbying laws and data privacy laws.
From time to time, governmental agencies have conducted reviews and audits of certain of our practices as part of routine investigations of providers of services under government contracts, or otherwise. We also receive requests for information from government agencies in connection with these reviews and audits. While we attempt to comply with all applicable laws and regulations, we may not be in full compliance with all applicable laws and regulations or interpretations of these laws and regulations at all times or we may not be able to comply with any future laws, regulations or interpretations of these laws and regulations.
If we fail to comply with applicable laws and regulations, including those referred to above, we may be subject to investigations, criminal sanctions or civil remedies, including fines, penalties, damages, reimbursement, injunctions, seizures, disgorgements or debarments from government contracts. The cost of compliance or the consequences of non-compliance, including debarments, could have a material adverse effect on our business, financial condition and results of operations. In addition, government agencies may make changes in the regulatory frameworks within which we operate that may require either the corporation as a whole or individual businesses to incur substantial increases in costs in order to comply with such laws and regulations.
25
Table of Contents
We conduct a portion of our business in foreign countries, and we expect to expand our operations into additional foreign countries where we may be impacted by operational and political risks that are greater than in the United States.
We have international operations and are further expanding our business internationally. Conducting and expanding our international operations subjects us to other risks that we do not generally face in the United States. These include:
| • | difficulties in managing the staffing of our international operations, including hiring and retaining qualified employees; |
| • | difficulties in establishing our services at new venues and hotel chains and developing brand recognition in new jurisdictions; |
| • | difficulties and increased expense introducing corporate policies and controls in our international operations; |
| • | increased expense related to localization of our services, including language translation and the creation of localized agreements; |
| • | potentially adverse tax consequences, including the complexities of foreign value added tax systems, restrictions on the repatriation of earnings and changes in tax rates; |
| • | exchange rate fluctuations; |
| • | increased expense to comply with foreign laws and legal standards, including laws that regulate pricing and promotion activities, and the import and export of information technology, which can be difficult to monitor and are often subject to change; |
| • | increased expense to comply with U.S. laws that apply to foreign operations, including the Foreign Corrupt Practices Act and Office of Foreign Assets Control regulations; |
| • | increased expense to comply with U.K. laws that apply to foreign operations, including the U.K. Bribery Act; |
| • | longer accounts receivable payment cycles and difficulties in collecting accounts receivable; |
| • | increased financial accounting and reporting burdens and complexities; |
| • | political, social and economic instability; |
| • | terrorist attacks and security concerns in general; and |
| • | reduced or varied protection for intellectual property rights. |
The occurrence of one or more of these events could negatively affect our international operations and, consequently, have a material adverse effect on our business, financial condition and results of operations. Further, operating in international markets requires significant management attention and financial resources. Due to the additional uncertainties and risks of doing business in foreign jurisdictions, international acquisitions tend to entail risks and require additional oversight and management attention that are typically not attendant to acquisitions made within the United States. In addition, the rate of usage of event technology services in international markets and the pricing of such services may be significantly lower than in the United States. We cannot be certain that the investment and additional resources required to establish, acquire or integrate operations in other countries will produce desired levels of revenue or profitability.
26
Table of Contents
Continued or further unionization of our workforce may increase our costs and work stoppages could damage our business.
Employees in the United States representing 8% of our total hourly wage expense are represented by unions and covered by collective bargaining agreements. The continued or further unionization of a significantly greater portion of our workforce could increase our overall costs at the affected locations and adversely impact our flexibility to run our business in the most efficient manner to remain competitive or acquire new business. In addition, any significant increase in the number of work stoppages at our various operations could adversely affect our business, financial condition and results of operations.
We may incur significant liability as a result of our participation in multiemployer defined benefit pension plans.
Under some of the collective bargaining agreements to which we are a party, we are obligated to contribute to multiemployer defined benefit pension plans. As a contributing employer to such plans, should we trigger either a “complete” or a “partial withdrawal,” we would be subject to withdrawal liability (or partial withdrawal liability) for our proportionate share of any unfunded vested benefits. In addition, if a multiemployer defined benefit pension plan fails to satisfy the minimum funding standards, we could be liable to increase our contributions to meet minimum funding standards. Also, if a participating employer withdraws from the plan or experiences financial difficulty, including bankruptcy, our obligation could increase. In addition, we have received notices from some of the plans pursuant to which we are a contributing employer that such plans are in critical status. Should we withdraw from these plans or any others in critical status, it would subject us to withdrawal liability, which is discussed in Note 17 to our audited consolidated financial statements included elsewhere in the prospectus. In addition, any increased funding obligations for underfunded multiemployer defined benefit pension plans could have a material adverse effect on our financial condition and results of operations.
Healthcare reform legislation could have an impact on our business.
During 2010, the Patient Protection and Affordable Care Act and the Health Care and Education Reconciliation Act of 2010 were signed into law in the United States. Certain of the provisions that have increased our healthcare costs include the removal of annual plan limits and the mandate that health plans provide 100% coverage on expanded preventative care. In addition, our healthcare costs could increase as the new legislation and accompanying regulations require us to apply new eligibility rules, which could potentially cover more variable hour employees than we do currently or pay penalty amounts in the event that employees do not elect our offered coverage. While much of the cost of the recent healthcare legislation enacted will occur after 2015 due to provisions of the legislation being delayed and phased in over time, changes to our healthcare cost structure could have a material adverse effect on our business, financial condition and results of operations.
We may be subject to periodic litigation and regulatory proceedings, including Fair Labor Standards Act and state wage and hour class action lawsuits, which may adversely affect our business and financial performance.
From time to time, we may be involved in lawsuits and regulatory actions, including class action lawsuits that are brought or threatened against us for alleged violations of the Fair Labor Standards Act and state wage and hour laws. We have been a party to such actions in the past, and an adverse outcome of any such claim in the future could have a material effect on our business, financial condition or results of operations.
27
Table of Contents
Changes in accounting standards, subjective assumptions and estimates used by management related to complex accounting matters could have a material adverse effect on our business, financial condition and results of operations.
U.S. GAAP and related accounting pronouncements, implementation guidance and interpretations with regard to a wide range of matters, such as stock-based compensation, asset impairments, valuation reserves, income taxes and fair value accounting, are highly complex and involve many subjective assumptions, estimates and judgments made by management. Changes in these rules or their interpretations or changes in underlying assumptions, estimates or judgments made by management could have a material adverse effect on our business, financial condition and results of operations. We will also be affected by changes to U.S. GAAP as a result of the convergence with International Financial Reporting Standards.
Our business is contract intensive and may lead to disputes with venue partners or customers.
Our business is contract intensive, and we are party to many contracts with venue partners, hotel chains and customers in the U.S. and international markets. Venue partners generally have the right to audit our contracts, and we periodically review our compliance with contract terms and provisions. If venue partners or customers were to dispute our contract determinations, the resolution of such disputes in a manner adverse to our interests could negatively affect sales and operating results. While we do not believe any reviews, audits or other such matters should result in material adjustments, if a large number of our venue partner or customer arrangements were modified in response to any such matter, it could have a material adverse effect on our business, financial condition or results of operations.
Our business is subject to seasonal and cyclical fluctuations, which may contribute to variation in our financial condition and results of operations.
The event and convention industries are seasonal in nature. The periods during which our venue partners experience higher volumes of events vary from property to property, depending principally upon location and the customer base that they serve. We generally expect our revenue to be lower in the third quarter of each year due to the slower summer meeting season than the other quarters with the second quarter generally being the highest. In addition, the hospitality industry is cyclical and demand generally follows the general economy on a lagged basis. The seasonality and cyclicality of our business and our ability to effectively manage these trends may contribute to fluctuations in our financial condition and results of operations.
Our operations and reputation may be adversely affected by disruptions to or breaches of our information security systems or if our customer data is otherwise compromised, and we identified a material weakness related to the general controls over information systems in the recent audit of our consolidated financial statements.
We are increasingly utilizing information technology systems to enhance the efficiency of our business. We maintain confidential, proprietary and personal information about our potential, current and former customers, employees and other third parties in these systems. Our systems are subject to damage or interruption from power outages, computer or telecommunication failures, computer viruses and catastrophic events. Our systems are also vulnerable to an increasing threat of rapidly evolving cyber-based attacks, including malicious software, attempts to gain unauthorized access to data and other electronic security breaches. The development and maintenance of these systems is costly and requires ongoing monitoring and updating as technologies change and efforts to overcome security measures become more sophisticated. In addition, we provide confidential, proprietary and personal information to third parties when it is necessary to pursue business objectives. While we obtain assurances that these third parties will protect this information, there is also risk the confidentiality of
28
Table of Contents
data held by third parties may be compromised. In addition, data and security breaches can also occur as the result of non-technical issues, including intentional or inadvertent breach by our employees or others with whom we have a relationship. In the recent audit of our consolidated financial statements, we identified a material weakness related to the general controls over information systems, including access security controls over financial applications. Any damage to, or compromise or breach of, our systems compromising our, customer or other data could impair our ability to conduct our business and result in a violation of applicable privacy and other laws, significant legal and financial exposure, including litigation and other potential liability, and a loss of confidence in our security measures, which could have a material adverse effect on our business, financial condition and results of operations and our reputation as a brand, business partner or an employer.
Our success will depend on our ability to protect our intellectual property rights.
We rely on a combination of contractual provisions, confidentiality procedures and patent copyright, trademark, service mark and trade secret laws to protect the proprietary aspects of our brands, technology and data. These legal measures afford only limited protection, and competitors or others may gain access to or use our intellectual property and proprietary information. Our success will depend, in part, on preserving our trade secrets and maintaining the security of our data and know-how. Our trade secrets, data and know-how could be subject to unauthorized use, misappropriation, or disclosure to unauthorized parties, despite our efforts to enter into confidentiality agreements with our employees, consultants, venue partners, customers and collaborators who have access to such information. Our trademarks could be challenged, forcing us to re-brand services, resulting in loss of brand recognition and requiring us to devote resources to advertising and marketing new brands. Failure to protect, monitor and control the use of our intellectual property rights could negatively impact our ability to compete and cause us to incur significant expenses. The intellectual property laws and other statutory and contractual arrangements we currently depend upon may not provide sufficient protection in the future to prevent the infringement, use or misappropriation of our trademarks, data, technology and other services, and may not provide an adequate remedy if our intellectual property rights are infringed, misappropriated or otherwise violated. In addition, the growing need for product integration and global data, along with increased competition and technological advances, puts increasing pressure on us to share our intellectual property with others, including venue partners and customers who wish to integrate our services with their systems. Policing unauthorized use of intellectual property rights can be difficult and expensive, and adequate remedies may not be available. Litigation may be necessary to enforce our intellectual property rights, to protect our trade secrets and to determine the validity and scope of our proprietary rights. Any future litigation, regardless of outcome, could result in substantial expense and diversion of resources and management attention and we may not prevail in any such litigation, which could have a material adverse effect on our business, financial condition and results of operations.
We could incur costs as a result of any claim of infringement of another party’s intellectual property rights.
In recent years, there has been significant litigation in the United States involving patents and other intellectual property rights. Companies are increasingly bringing and becoming subject to suits alleging infringement of proprietary rights, particularly patent rights, and third parties may hold patents or have pending patent applications, which could be related to the use of equipment, related software or content in our events. These risks have been amplified by the increase in third parties, which we refer to as non-practicing entities, whose sole primary business is to assert such claims. From time to time, intellectual property suits alleged against us will involve us at the outset of such litigation. Regardless of the merits of any such intellectual property litigation, we may be required to expend management time and financial resources on the defense of such claims, and any adverse outcome of any such claim or the above referenced review could have a material adverse effect on our business, financial condition or results of operations.
29
Table of Contents
Changes in, new interpretations of or changes in the enforcement of the governmental regulatory framework may affect our contracts and contract terms and may reduce our revenue or profits.
A portion of our revenue is derived from business with U.S. federal, state and local governments and agencies. Changes or new interpretations in, or changes in the enforcement of, the statutory or regulatory framework applicable to services provided under government contracts or bidding procedures, including an adverse change in government spending policies or appropriations, budget priorities or revenue levels, could result in fewer new contracts or contract renewals, modifications to the methods we apply to price government contracts, or in contract terms of shorter duration than we have historically experienced. Any of these changes could result in lower revenue or profits than we have historically achieved, which could have an adverse effect on our business, financial condition and results of operations.
Our senior leadership team is critical to our continued success, and the loss of such personnel could have a material adverse effect on our business, financial condition and results of operations.
Our future success substantially depends on the continued service and performance of the members of our senior leadership team. These personnel possess business and technical capabilities that are difficult to replace. If we lose key members of our senior management team, we may not be able to effectively manage our current operations or meet ongoing and future business challenges, and this could have a material adverse effect on our business, financial condition and results of operations.
Risks Related to Our Indebtedness
We have substantial indebtedness and we may incur additional indebtedness in the future, which may require us to use a substantial portion of our cash flow to service debt and limit our financial and operating flexibility.
We have substantial indebtedness and we may incur additional indebtedness in the future. As of June 30, 2015, after giving effect to this offering and the application of our estimated net proceeds therefrom, we would have had $ million of debt outstanding under our senior secured credit facilities. Our existing and future indebtedness will require interest payments and need to be repaid or refinanced, could require us to divert funds identified for other purposes to service our debt, could result in cash demands and impair our liquidity position and could result in financial risk for us. Diverting funds identified for other purposes for debt service may adversely affect our growth prospects. If we cannot generate sufficient cash flow from operations to service our debt, we may need to refinance our debt, dispose of assets or issue equity to obtain necessary funds. We do not know whether we would be able to take any of these actions on a timely basis, on terms satisfactory to us, or at all.
Our level of indebtedness has important consequences to you and your investment in our common stock. For example, our level of indebtedness might:
| • | increase our vulnerability to adverse economic, industry or competitive developments; |
| • | require us to use a substantial portion of our cash flow from operations to pay interest and principal on our debt, which would reduce the funds available to us for working capital, capital expenditures and other general corporate purposes; |
| • | expose us to the risk of increased interest rates because certain of our borrowings, including and most significantly borrowings under our senior secured credit facilities, are at variable rates of interest; |
30
Table of Contents
| • | limit our ability to pay future dividends; |
| • | limit our ability to obtain additional financing for working capital, capital expenditures, acquisitions, expansion plans and other investments, which may limit our ability to implement our business strategy; |
| • | prevent us from taking advantage of business opportunities as they arise or successfully carrying out our plans to expand our business; and |
| • | limit our ability to adjust to changing market conditions and placing us at a competitive disadvantage compared to competitors that are less leveraged. |
Our business may not generate sufficient cash flow from operations or future borrowings may be unavailable to us in amounts sufficient to enable us to make payments on our indebtedness or to fund our operations. If we are unable to service our debt or repay or refinance our indebtedness when due, it could have a material adverse effect on our business, financial condition and results of operations.
The terms of our existing senior secured credit facilities do, and the terms of any additional debt financing may, restrict our current and future operations, and our debt may be downgraded, which could adversely affect our ability to manage our operations and respond to changes in our business.
Our existing senior secured credit facilities contain, and any additional debt financing we may incur would likely contain, covenants that restrict our operations, including limitations on our ability to grant liens, incur additional debt, pay dividends, redeem our common stock, make certain investments and engage in certain merger, consolidation or asset sale transactions. A failure by us to comply with the covenants or financial ratios contained in our existing senior secured credit facilities or any additional debt financing we may incur could result in an event of default, which could have a material adverse effect on our business, financial condition and results of operations. Upon the occurrence of an event of default, the lenders could elect to declare all amounts outstanding to be due and payable and exercise other remedies. If the indebtedness under our existing senior secured credit facilities or any additional debt financing we may incur were to be accelerated, it could have a material adverse effect on our business, financial condition and results of operations.
A decrease in the ratings that rating agencies assign to our short and long-term debt may negatively impact our access to the debt capital markets and increase our cost of borrowing, which could have a material adverse effect on our business, financial condition and results of operations.
Despite our high indebtedness level, we still may be able to incur significant additional amounts of debt, which could further exacerbate the risks associated with our substantial indebtedness.
We and our subsidiaries may be able to incur substantial additional indebtedness in the future. Although our existing senior secured credit facilities contain restrictions on the incurrence of additional indebtedness, these restrictions are subject to a number of significant qualifications and exceptions, and under certain circumstances, the amount of indebtedness that could be incurred in compliance with these restrictions could be substantial. For example, pursuant to an incremental facility under our existing senior secured credit facilities, we may incur (i) up to $150.0 million of additional debt and (ii) unlimited additional debt, subject to compliance with certain leverage ratios, as described in the credit agreements governing the senior secured credit facilities. If new debt is added to our outstanding debt levels, the risks related to our indebtedness that we will face would increase.
31
Table of Contents
We are a holding company with no operations of our own and depend on our subsidiaries for cash.
As a holding company, most of our assets are held by our direct and indirect subsidiaries and we will primarily rely on dividends and other payments or distributions from our subsidiaries to meet our debt service and other obligations and to enable us to pay dividends, if any. The ability of our subsidiaries to pay dividends or make other payments or distributions to us will depend on their respective operating results and may be restricted by, among other things, the laws of their jurisdiction of organization (which may limit the amount of funds available for the payment of dividends or other payments), agreements of those subsidiaries and the terms of any indebtedness we or our subsidiaries have incurred or may incur in the future.
Risks Related to This Offering and Ownership of Our Common Stock
There may not be an active, liquid trading market for our common stock.
Prior to this offering, there has been no public market for shares of our common stock. We cannot predict the extent to which investor interest in our company will lead to the development of a trading market on the New York Stock Exchange or how liquid that market may become. If an active trading market does not develop, you may have difficulty selling any of our common stock that you purchase. The initial public offering price of shares of our common stock will be determined by negotiation between us and the underwriters and may not be indicative of market prices of our common stock that will prevail following the completion of this offering. The market price of shares of our common stock may decline below the initial public offering price, and you may not be able to resell your shares of our common stock at or above the initial offering price.
Our share price may change significantly following the offering, and you could lose all or part of your investment as a result.
The trading price of our common stock could be highly volatile and could fluctuate due to a number of factors such as those listed in “—Risks Related to Our Business and Industry” and the following, some of which are beyond our control:
| • | quarterly variations in our results of operations; |
| • | results of operations that vary from the expectations of securities analysts and investors; |
| • | results of operations that vary from those of our competitors; |
| • | changes in expectations as to our future financial performance, including financial estimates by securities analysts and investors; |
| • | announcements by us, our competitors or our venues of significant contracts, acquisitions, joint marketing relationships, joint ventures or capital commitments; |
| • | announcements by third parties of significant claims or proceedings against us; |
| • | future sales of our common stock; |
| • | general domestic and international economic conditions; and |
| • | unexpected and sudden changes in senior management. |
Furthermore, the stock market has experienced extreme volatility that, in some cases, has been unrelated or disproportionate to the operating performance of particular companies. These broad market and industry fluctuations may adversely affect the market price of our common stock, regardless of our actual operating performance.
32
Table of Contents
In the past, following periods of market volatility, stockholders have instituted securities class action litigation. If we are involved in any securities litigation, it could have a substantial cost and divert resources and the attention of executive management from our business regardless of the outcome of such litigation.
If we are unable to implement and maintain the effectiveness of our internal control over financial reporting or if we are unable to remediate the material weakness identified in the recent audit of our consolidated financial statements, our investors may lose confidence in the accuracy and completeness of our financial reports, which could adversely affect our stock price.
Pursuant to Section 404 of the Sarbanes-Oxley Act of 2002 and the related rules adopted by the SEC and the PCAOB, starting with the second annual report that we file with the SEC after the consummation of this offering, our management will be required to report on the effectiveness of our internal control over financial reporting. We may encounter problems or delays in completing the implementation of any changes necessary to our internal control over financial reporting to conclude such controls are effective. In the recent audit of our consolidated financial statements, we identified a material weakness related to the adequacy of the technical accounting knowledge and resources to complete a timely and accurate financial close as well as the existing internal control processes around the review and reconciliation of certain accounts. We have taken steps to remediate the material weakness, but cannot guarantee that these steps have been sufficient or that we will not have additional material weaknesses in the future. If we have not remediated or cannot remediate this material weakness, if we identify additional material weaknesses in our internal control over financial reporting, if we are unable to comply with the requirements of Section 404 in a timely manner or assert that our internal control over financial reporting is effective, or if our independent registered public accounting firm is unable to express an opinion as to the effectiveness of our internal control over financial reporting, investor confidence and our stock price could decline.
Matters impacting our internal controls may cause us to be unable to report our financial information on a timely basis and thereby subject us to adverse regulatory consequences, including sanctions by the SEC or violations of New York Stock Exchange rules, and result in a breach of the covenants under our financing arrangements. There also could be a negative reaction in the financial markets due to a loss of investor confidence in us and the reliability of our financial statements. Confidence in the reliability of our financial statements also could suffer if we were to report a material weakness in our internal controls over financial reporting. This could materially adversely affect the price of our common stock.
If a substantial number of shares become available for sale and are sold in a short period of time, the market price of our common stock could decline.
After the completion of this offering, we will have shares of common stock outstanding. This number includes shares of common stock that are being sold in this offering, which may be resold immediately in the public market. If our Sponsors sell substantial amounts of our common stock in the public market following this offering, the market price of our common stock could decrease significantly. The perception in the public market that our Sponsors might sell shares of common stock could also depress the market price of our common stock. Our directors, executive officers, Sponsors and substantially all of our other stockholders will be subject to the lock-up agreements described in the “Underwriting” section and are subject to the Rule 144 holding period requirements described in “Shares Eligible for Future Sale—Rule 144.” After these lock-up agreements have expired and holding periods have elapsed, additional shares will be eligible for sale in the public market. The Sponsors (and certain permitted transferees thereof) will have registration rights with respect to common stock they hold. See “Shares Eligible for Future Sale—Registration Rights.” We also intend to file a registration statement on Form S-8 under the Securities Act of 1933, as amended, or the Securities Act, covering all of the
33
Table of Contents
common stock to be awarded under our 2015 Equity Incentive Plan. Once we register these shares, they can be freely sold in the public market upon issuance and vesting, subject to the lock-up agreements described in the “Underwriting” section of this prospectus and contained in the terms of such plans, or unless they are held by “affiliates,” as that term is defined in Rule 144 of the Securities Act.
The market price of shares of our common stock may drop significantly when the restrictions on resale by our existing investors lapse as a result of sales by our stockholders in the market or the perception that such sales could or will occur. Any decline in the price of shares of our common stock could impede our ability to raise capital through the issuance of additional shares of our common stock or other equity securities.
Our Sponsors can significantly influence our business and affairs and may have conflicts of interest with us in the future.
Following the completion of this offering, our Sponsors will collectively own approximately % of our common stock (or approximately % if the underwriters exercise their option to purchase additional shares in full). As a result, the Sponsors have the ability to prevent any transaction that requires the approval of stockholders, including the election of directors, mergers and takeover offers, regardless of whether others believe that approval of those matters is in our best interests. In addition, under the Stockholders Agreement that we will adopt in connection with this offering, each of the Sponsors will be entitled to designate between one to three members of our board of directors depending upon their ownership percentage at such time. See “Management—Composition of Our Board of Directors.”
In addition, the Sponsors are in the business of making investments in companies and may from time to time acquire and hold interests in businesses that compete directly or indirectly with us. One or more of the Sponsors may also pursue acquisition opportunities that may be complementary to our business and, as a result, those acquisition opportunities may not be available to us. So long as the Sponsors, or funds controlled by or associated with the Sponsors, continue to own a significant amount of the outstanding shares of our common stock, even if such amount is less than 50%, the Sponsors will continue to be able to strongly influence us. Our amended and restated certificate of incorporation provides that none of the Sponsors or any of their affiliates will have any duty to refrain from (i) engaging in a corporate opportunity in the same or similar lines of business in which we or our affiliates now engage or propose to engage or (ii) otherwise competing with us or our affiliates. See “Description of Capital Stock—Corporate Opportunities.”
Anti-takeover provisions in our amended and restated certificate of incorporation and bylaws and under Delaware law could make an acquisition of us more difficult, limit attempts by our stockholders to replace or remove our current management and limit the market price of our common stock.
Provisions in our amended and restated certificate of incorporation and amended and restated bylaws may have the effect of delaying or preventing a change of control or changes in our management. Our amended and restated certificate of incorporation and amended and restated bylaws will include provisions that:
| • | authorize our board of directors to issue, without further action by the stockholders, up to shares of undesignated preferred stock; |
| • | subject to certain exceptions, require that any action to be taken by our stockholders be effected at a duly called annual or special meeting and not by written consent; |
| • | specify that special meetings of our stockholders can be called only by a majority of our board of directors or the chairman of the board of directors; |
34
Table of Contents
| • | establish an advance notice procedure for stockholder proposals to be brought before an annual meeting, including proposed nominations of persons for election to our board of directors; |
| • | establish that our board of directors is divided into three classes, with each class serving three-year staggered terms; |
| • | prohibit cumulative voting in the election of directors; |
| • | provide that vacancies on our board of directors may be filled only by a majority of directors then in office, even though less than a quorum; |
| • | allow for the removal of directors only for cause and upon the affirmative vote of the holders of at least 66 2⁄3% in voting power of all the then-outstanding common stock entitled to vote thereon, voting together as a single class, if the Sponsors and their affiliates beneficially own, in the aggregate, more than 50% in voting power of our common stock entitled to vote generally in the election of directors; and |
| • | certain provisions may be amended only by the affirmative vote of the holders of at least 66 2⁄3% in voting power of all the then-outstanding common stock of the Company entitled to vote thereon, voting together as a single class, if the Sponsors and their affiliates beneficially own, in the aggregate, more than 50% in voting power of our common stock entitled to vote generally in the election of directors. |
These provisions may frustrate or prevent any attempts by our stockholders to replace or remove our current management by making it more difficult for stockholders to replace members of our board of directors, which is responsible for appointing the members of our management.
In addition, because we are incorporated in Delaware, we have opted out of the provisions of Section 203 of the Delaware General Corporation Law (the “DGCL”), which generally prohibits a Delaware corporation from engaging in any of a broad range of business combinations with any “interested” stockholder (any stockholder with 15% or more of our capital stock) for a period of three years following the date on which the stockholder became an “interested” stockholder. However, our amended and restated certificate of incorporation will contain a provision that provides us with protections similar to Section 203 of the DGCL and will prevent us from engaging in a business combination with a person who acquires at least 15% of our common stock for a period of three years from the date such person acquired such common stock unless board or stockholder approval is obtained prior to the acquisition, except that it will provide that the Sponsors, or any successor to all or substantially all of the Sponsor’s assets, or any affiliates thereof, or any person or entity to which any of the foregoing stockholders transfers shares of our voting stock (subject to specified exceptions), in each case regardless of the total percentage of our voting stock owned by such stockholder or such person or entity, shall not be deemed an “interested stockholder” for purposes of this provision of our amended and restated certificate of incorporation and therefore not subject to the restrictions set forth in this provision.
Our amended and restated certificate of incorporation designates the Court of Chancery of the State of Delaware as the sole and exclusive forum for certain types of actions and proceedings that may be initiated by our stockholders, which could limit our stockholders’ ability to obtain a favorable judicial forum for disputes with us or our directors, officers or other employees.
Our amended and restated certificate of incorporation provides that, with certain limited exceptions, unless we consent in writing to the selection of an alternative forum, the Court of Chancery of the State of Delaware will be the sole and exclusive forum for any stockholder (including any beneficial owner) to bring (i) any derivative action or proceeding brought on our behalf, (ii) any action asserting a claim of breach of fiduciary duty owed by any director or officer owed to us or our stockholders, creditors or other constituents, (iii) any action asserting a claim against us or any of our
35
Table of Contents
directors or officers arising pursuant to any provision of the DGCL or our amended and restated certificate of incorporation or our amended and restated bylaws, or (iv) any action asserting a claim against us or any of our directors or officers governed by the internal affairs doctrine. Any person or entity purchasing or otherwise acquiring any interest in shares of our capital stock is deemed to have received notice of and consented to the foregoing provisions. This choice of forum provision may limit a stockholder’s ability to bring a claim in a judicial forum that it finds favorable for disputes with us or our directors, officers or other employees, which may discourage such lawsuits against us and our directors, officers and employees. Alternatively, if a court were to find this choice of forum provision inapplicable to, or unenforceable in respect of, one or more of the specified types of actions or proceedings, we may incur additional costs associated with resolving such matters in other jurisdictions, which could adversely affect our business, financial condition or results of operations.
We are a “controlled company” within the meaning of the New York Stock Exchange rules and, as a result, we will qualify for, and intend to rely on, exemptions from certain corporate governance requirements. You will not have the same protections afforded to stockholders of companies that are subject to such requirements.
After completion of this offering, the Sponsors will continue to control a majority of the voting power of all outstanding shares of our common stock. Under New York Stock Exchange corporate governance standards, a company of which more than 50% of the voting power is held by an individual, group or another company is a “controlled company” and may elect not to comply with certain corporate governance requirements, including:
| • | the requirement that a majority of the board of directors consist of independent directors as defined under the rules of the New York Stock Exchange; |
| • | the requirement that we have a nominating and corporate governance committee that is composed entirely of independent directors with a written charter addressing the committee’s purpose and responsibilities; |
| • | the requirement that we have a compensation committee that is composed entirely of independent directors with a written charter addressing the committee’s purpose and responsibilities; and |
| • | the requirement for an annual performance evaluation of the nominating and corporate governance and compensation committees. |
Following this offering, we intend to utilize these exemptions. As a result, we may not have a majority of independent directors, our nominating and corporate governance committee and compensation committee may not consist entirely of independent directors and such committees may not be subject to annual performance evaluations. Accordingly, you will not have the same protections afforded to stockholders of companies that are subject to all of the corporate governance requirements of the New York Stock Exchange.
We will incur increased costs and our management will face increased demands as a result of operating as a listed company.
As a listed company, we will incur significant legal, accounting and other expenses that we did not incur as a private company. In addition, our administrative staff will be required to perform additional tasks. For example, in anticipation of becoming a listed company, we will need to adopt additional internal controls and disclosure controls and procedures and bear all of the internal and external costs of preparing and distributing periodic public reports in compliance with our obligations under applicable securities laws. We will be required to ensure that we have the ability to prepare consolidated financial statements that comply with SEC reporting requirements on a timely basis. We
36
Table of Contents
will also be subject to other reporting and corporate governance requirements, including the applicable stock exchange listing standards and certain provisions of the Sarbanes-Oxley Act and the regulations promulgated thereunder, which impose significant compliance obligations upon us.
As a public company, we will be required to commit significant resources and management time and attention to these requirements, which will cause us to incur significant costs and which may place a strain on our systems and resources. As a result, our management’s attention might be diverted from other business concerns. In addition, we might not be successful in implementing these requirements. In addition, changing laws, regulations and standards relating to corporate governance and public disclosure, including the Sarbanes-Oxley Act, the Dodd-Frank Act and related regulations implemented by the SEC, and the stock exchanges are creating uncertainty for public companies, increasing legal and financial compliance costs and making some activities more time-consuming. We are currently evaluating and monitoring developments with respect to new and proposed rules and cannot predict or estimate the amount of additional costs we may incur or the timing of such costs.
We intend to invest resources to comply with evolving laws, regulations and standards, and this investment may result in increased general and administrative expenses and a diversion of management’s time and attention from revenue-generating activities to compliance activities. If our efforts to comply with new laws, regulations and standards differ from the activities intended by regulatory or governing bodies due to ambiguities related to practice, regulatory authorities may initiate legal proceedings against us and our business may be harmed. We also expect that being a listed company and these new rules and regulations will make it more expensive for us to obtain director and officer liability insurance, and we may be required to accept reduced coverage or incur substantially higher costs to obtain coverage. These factors could also make it more difficult for us to attract and retain qualified members of our board of directors, particularly to serve on our audit committee and compensation committee, and attract and retain qualified executive officers.
The increased costs associated with operating as a listed company may decrease our net income, and may cause us to reduce costs in other areas of our business or increase the prices of our services to offset the effect of such increased costs. Additionally, if these requirements divert our management’s attention from other business concerns, they could have a material adverse effect on our business, financial condition and results of operations.
Our management team currently manages a private company and the transition to managing a public company will present new challenges.
Following the completion of this offering, we will be subject to various regulatory requirements, including those of the SEC and the New York Stock Exchange. These requirements include record keeping, financial reporting and corporate governance rules and regulations. Our management team has limited experience managing a public company and we may be unable to hire, train or retain necessary staff and may be reliant on engaging outside consultants or professionals to overcome our lack of experience or employees. If we are unable to engage outside consultants or are otherwise unable to fulfill our public company obligations, it could have a material adverse effect on our business, financial condition and results of operations.
If securities or industry research analysts do not publish or cease publishing research or reports about our business or if they issue unfavorable commentary or downgrade our common stock, our share price and trading volume could decline.
The trading market for our common stock will rely in part on the research and reports that securities and industry research analysts publish about us, our industry, our competitors and our business. We do not have any control over these analysts. Our share price and trading volumes could
37
Table of Contents
decline if one or more securities or industry analysts downgrade our common stock, issue unfavorable commentary about us, our industry or our business, cease to cover our company or fail to regularly publish reports about us, our industry or our business.
We do not expect to pay any cash dividends for the foreseeable future.
Because we do not expect to pay any cash dividends for the foreseeable future, investors may be forced to sell their shares in order to realize a return on their investment, if any. Any payment of cash dividends will be at the discretion of our board of directors and will depend on our and our subsidiaries’ financial condition, capital requirements, legal requirements, contractual limitations, earnings and other factors. Our ability to pay dividends is restricted by the terms of our senior secured credit facilities and might be restricted by the terms of any indebtedness that we incur in the future. Consequently, you should not rely on dividends in order to receive a return on your investment. See “Dividend Policy.”
If you purchase shares of common stock sold in this offering, you will incur immediate and substantial dilution.
The initial public offering price per share is substantially higher than the pro forma net tangible book value per share immediately after this offering. As a result, you will pay a price per share that substantially exceeds the book value of our assets after subtracting the book value of our liabilities. Based on our pro forma net tangible book value as of June 30, 2015 and assuming an offering price of $ per share, the midpoint of the range set forth on the cover page of this prospectus, you will incur immediate and substantial dilution in the amount of $ per share. See “Dilution.”
38
Table of Contents
This prospectus contains “forward-looking statements.” Forward-looking statements can be identified by words such as “anticipates,” “intends,” “plans,” “seeks,” “believes,” “estimates,” “expects” and similar references to future periods, or by the inclusion of forecasts or projections. Examples of forward-looking statements include, but are not limited to, statements we make regarding the outlook for our future business and financial performance, such as those contained in the section entitled “Management’s Discussion and Analysis of Financial Condition and Results of Operations.”
Forward-looking statements are based on our current expectations and assumptions regarding our business, the economy and other future conditions. Because forward-looking statements relate to the future, by their nature, they are subject to inherent uncertainties, risks and changes in circumstances that are difficult to predict. As a result, our actual results may differ materially from those contemplated by the forward-looking statements. Important factors that could cause actual results to differ materially from those in the forward-looking statements include regional, national or global political, economic, business, competitive, market and regulatory conditions and the following:
| • | our failure to retain current venue partners and hotel chains or renew our existing venue partner contracts and hotel chain MSAs; |
| • | our failure to increase the number of quality of properties covered by our venue partner contracts and the number of hotel chains for which we are the preferred event technology services provider; |
| • | reduced demand for our services at events or reduced attendance at such events due to the widespread adoption of more effective teleconference and virtual meeting technologies; |
| • | reluctance by potential venue partners to switch to a new preferred provider of event technology services; |
| • | reduced outsourcing of event technology services or use of preferred providers by venues; |
| • | damage to our reputation or brand; |
| • | competition in the event technology services market; |
| • | risks related to potential acquisitions; |
| • | risks related to our long cycle to secure new agreements with venues and hotel chains as well as long implementation periods that require significant resource commitments; |
| • | our inability to hire and retain sufficient qualified personnel; |
| • | our reliance on third-party equipment suppliers; |
| • | our reliance on venue partners for billing and collection for event technology services we provide at their venues; |
| • | our failure to comply with laws and regulations; |
| • | risks related to our business in foreign countries; |
| • | contract disputes with venue partners and customers; |
| • | disruptions to or breaches of our information security systems; |
| • | our substantial indebtedness; |
| • | our failure to service our debt or inability to comply with agreements contained in our credit agreements; |
| • | volatility and weakness in the capital markets; and |
| • | the other factors described in “Risk Factors.” |
39
Table of Contents
See “Risk Factors” for a further description of these and other factors. For the reasons described above, we caution you against relying on any forward-looking statements, which should also be read in conjunction with the other cautionary statements that are included elsewhere in this prospectus. Any forward-looking statement made by us in this prospectus speaks only as of the date on which we make it. Factors or events that could cause our actual results to differ may emerge from time to time, and it is not possible for us to predict all of them. We undertake no obligation to publicly update or revise any forward-looking statement, whether as a result of new information, future developments or otherwise, except as may be required by law. If we do update one or more forward-looking statements, no inference should be drawn that we will make additional updates with respect thereto or with respect to other forward-looking statements.
40
Table of Contents
Prior to this offering, PSAV Holdings LLC and its subsidiaries conducted our business. The diagram below reflects our organizational structure prior to the transactions described below and this offering as of June 30, 2015.
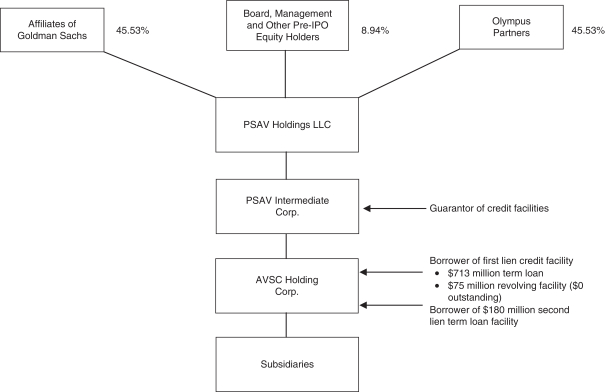
Prior to the completion of this offering, we intend to complete an internal restructuring, which we refer to as the corporate reorganization. Pursuant to the corporate reorganization, the holders of equity interests in PSAV Holdings LLC will become stockholders of PSAV, Inc., the issuer of shares in this offering, which is currently a wholly-owned subsidiary of PSAV Holdings LLC and was incorporated in Delaware on August 11, 2015. PSAV, Inc. has not engaged in any business or other activities except in connection with its formation and in preparation for this offering. In connection with the corporate reorganization, the following steps will occur:
| • | PSAV, Inc. will form a new limited liability company, PSAV Intermediate LLC, as a wholly-owned subsidiary; |
| • | PSAV Intermediate Corp., a wholly-owned subsidiary of PSAV Holdings LLC, will merge with and into PSAV Intermediate LLC, with PSAV Intermediate LLC surviving, and in the merger shares of PSAV Intermediate Corp. will be cancelled with PSAV Intermediate LLC becoming an indirect wholly-owned subsidiary of PSAV Holdings LLC; and |
| • | PSAV Holdings LLC will liquidate and distribute shares of PSAV, Inc. common stock to holders of Class A Units in PSAV Holdings LLC. |
In connection with the corporate reorganization and this offering, we will adopt the 2015 Equity Plan, and holders of Class B Units will receive shares of our common stock, some of which will be subject to vesting, in exchange for their Class B Units in PSAV Holdings LLC.
41
Table of Contents
The corporate reorganization will not materially affect our operations, which we will continue to conduct through our operating subsidiaries.
The diagram below reflects our organizational structure following the corporate reorganization, this offering and the use of net proceeds therefrom as if each occurred on June 30, 2015.
42
Table of Contents
We estimate that the net proceeds to us from our sale of shares of common stock in this offering will be approximately $ million after deducting underwriting discounts and commissions and estimated expenses payable by us in connection with this offering. This assumes an initial public offering price of $ per share (the midpoint of the estimated public offering price range set forth on the cover page of this prospectus).
We intend to use the net proceeds from this offering to repay borrowings under our second lien credit facility. Our second lien credit facility matures on January 24, 2022. As of June 30, 2015, we had $180.0 million of borrowings outstanding under our second lien credit facility with a current interest rate of 9.25%.
Each $1.00 increase (decrease) in the public offering price per share would increase (decrease) our net proceeds, after deducting estimated underwriting discounts and commissions and estimated offering expenses payable by us, by $ million (assuming no exercise of the underwriters’ option to purchase additional shares).
We will not receive any proceeds from the sale of shares by the selling stockholders.
43
Table of Contents
After this offering, we intend to retain all available funds and any future earnings to reduce debt and fund the development and growth of our business, and we do not anticipate paying any dividends on our common stock. However, in the future, subject to the factors described below and our future liquidity and capitalization, we may change this policy and choose to pay dividends. We are a holding company that does not conduct any business operations of our own. As a result, our ability to pay cash dividends on our common stock, if any, will be dependent upon cash dividends and distributions and other transfers from our subsidiaries. The amounts available to us to pay cash dividends are restricted by our credit facilities and may be further restricted by any future indebtedness we incur. The declaration and payment of dividends also is subject to the discretion of our board of directors and depends on various factors, including our net income, financial condition, cash requirements, future prospects and other factors deemed relevant by our board of directors.
In addition, under Delaware law, our board of directors may declare dividends only to the extent of our surplus (which is defined as total assets at fair market value minus total liabilities, minus statutory capital) or, if there is no surplus, out of our net profits for the then current and/or immediately preceding fiscal year.
Any future determination to pay dividends will be at the discretion of our board of directors and will take into account:
| • | restrictions in our credit facilities; |
| • | general economic and business conditions; |
| • | our financial condition and results of operations; |
| • | our capital requirements; |
| • | the ability of our operating subsidiaries to pay dividends and make distributions to us; and |
| • | such other factors as our board of directors may deem relevant. |
In May 2015, we used the proceeds from incremental loans under our first lien credit facility to pay a distribution of $149.1 million in the aggregate to the members of PSAV Holdings LLC, of which $2.3 million was a tax distribution to holders of Class B Units.
44
Table of Contents
The following table sets forth our cash and cash equivalents and our capitalization as of June 30, 2015:
| • | on an actual basis; and |
| • | on a pro forma basis to give effect to the corporate reorganization as more fully described in “Organizational Structure” and the sale of shares of our common stock in this offering, based upon the assumed initial public offering price of $ per share, which is the midpoint of the estimated offering price range set forth on the cover of this prospectus after deducting the estimated underwriting discounts and commissions and estimated offering expenses payable by us and the application of the net proceeds received by us from this offering as described under “Use of Proceeds.” |
This table should be read in conjunction with “Organizational Structure,” “Use of Proceeds,” “Selected Historical Consolidated Financial Data,” “Unaudited Pro Forma Condensed Consolidated Financial Statements,” “Management’s Discussion and Analysis of Financial Condition and Results of Operations,” “Description of Capital Stock” and the consolidated financial statements and notes thereto appearing elsewhere in this prospectus.
| As of June 30, 2015 | ||||||||
| Actual | Pro Forma | |||||||
| (unaudited; in thousands, except share and per share data) |
||||||||
| Cash and cash equivalents |
$ | 69,184 | $ | |||||
|
|
|
|
|
|||||
| Debt: |
||||||||
| Total long-term debt, including current portion, net of unamortized loan discount and deferred financing costs of $28,240 |
$ | 864,906 | $ | |||||
|
|
|
|
|
|||||
| Members’ equity: |
||||||||
| Class A Units, 270,159 units issued and outstanding, actual; no units issued and outstanding, pro forma |
128,819 | |||||||
| Class B Units, 15,371 units issued and outstanding; no units issued and outstanding, pro forma |
(1,717) | |||||||
| Accumulated other comprehensive loss |
(1,866) | |||||||
|
|
|
|
|
|||||
| Total members’ equity |
125,236 | |||||||
| Stockholders’ equity: |
||||||||
| Common stock, $0.01 par value per share, no shares authorized, issued and outstanding, actual; shares authorized and shares issued and outstanding, pro forma |
— | |||||||
| Preferred stock, $0.01 part value per share, no shares authorized, issued and outstanding, actual and pro forma |
— | |||||||
| Additional paid-in capital |
— | |||||||
| Retained earnings |
— | |||||||
| Accumulated other comprehensive loss |
— | |||||||
|
|
|
|
|
|||||
| Total stockholders’ equity |
— | |||||||
|
|
|
|
|
|||||
| Total capitalization |
$ | 990,142 | ||||||
|
|
|
|
|
|||||
45
Table of Contents
If you invest in our common stock, your interest will be diluted to the extent of the difference between the initial public offering price per share of our common stock and the pro forma net tangible book value per share of our common stock after the corporate reorganization described in “Organizational Structure” and this offering. Dilution results from the fact that the per share offering price of the common stock is substantially in excess of the book value per share attributable to our existing investors.
Our pro forma net tangible book value as of June 30, 2015 would have been approximately $ , or $ per share of our common stock. Pro forma net tangible book value represents the amount of total tangible assets less total liabilities, and pro forma net tangible book value per share represents pro forma net tangible book value divided by the number of shares of common stock outstanding, in each case, after giving effect to the corporate reorganization but not this offering.
After giving effect to (i) the completion of the corporate reorganization more fully described in “Organizational Structure,” (ii) the sale of shares of common stock in this offering at the assumed initial public offering price of $ per share (the midpoint of the estimated public offering price range set forth on the cover page of this prospectus) and (iii) the application of the net proceeds from this offering, our pro forma net tangible book value would have been $ , or $ per share. This represents an immediate increase in pro forma net tangible book value of $ per share to our existing investors and an immediate dilution in pro forma net tangible book value of $ per share to new investors.
The following table illustrates this dilution on a per share of common stock basis:
| Assumed initial public offering price per share |
$ | |||||||
| Pro forma net tangible book value per share as of June 30, 2015 |
$ | |||||||
| Increase in pro forma net tangible book value per share attributable to new investors |
||||||||
|
|
|
|||||||
| Pro forma net tangible book value per share after this offering |
||||||||
|
|
|
|||||||
| Dilution in pro forma net tangible book value per share to new investors |
$ | |||||||
|
|
|
The following table summarizes, on a pro forma basis as of June 30, 2015, after giving effect to the corporate reorganization and this offering, the total number of shares of common stock purchased from us, the total cash consideration paid to us and the average price per share paid by our existing investors and by new investors purchasing shares in this offering.
| Shares Purchased | Total Consideration | Average Price Per Share |
||||||||||||||||
| Number | Percent | Amount | Percent | |||||||||||||||
| Existing stockholders |
% | $ | % | $ | ||||||||||||||
| New investors |
$ | |||||||||||||||||
|
|
|
|
|
|
|
|
||||||||||||
| Total |
100.0 | % | $ | 100.0 | % | |||||||||||||
|
|
|
|
|
|
|
|
||||||||||||
If the underwriters were to fully exercise their option to purchase additional shares of our common stock, the percentage of shares of our common stock held by existing investors would be %, and the percentage of shares of our common stock held by new investors would be %.
The above discussion and tables are based on the number of shares outstanding at June 30, 2015 on a pro forma basis. In addition, we may choose to raise additional capital due to market conditions or strategic considerations even if we believe we have sufficient funds for our current or future operating plans. To the extent that additional capital is raised through the sale of equity or convertible debt securities, the issuance of such securities could result in further dilution to our stockholders.
46
Table of Contents
UNAUDITED PRO FORMA CONDENSED CONSOLIDATED FINANCIAL STATEMENTS
The following unaudited pro forma condensed consolidated financial statements of PSAV, Inc. reflect the historical financial statements of PSAV Holdings LLC on a pro forma basis to give effect to the Sponsors Acquisition, the corporate reorganization, the Distribution (as defined below), this offering and the use of proceeds therefrom as described under “Use of Proceeds.”
Sponsors Acquisition
On January 24, 2014, PSAV Holdings LLC acquired 100% of the voting equity interests in AVSC Holding Corp. PSAV Holdings LLC is owned by affiliates of The Goldman Sachs Group, Inc. and Olympus Partners, members of management and other investors. We refer to the affiliates of The Goldman Sachs Group, Inc. and Olympus Partners collectively as our “Sponsors” and the foregoing acquisition as the “Sponsors Acquisition.” All of the then outstanding debt of AVSC Holding Corp. was repaid in connection with the Sponsors Acquisition, and we entered into a first lien credit agreement and second lien credit agreement to fund a portion of the purchase price.
Corporate Reorganization
Prior to the completion of this offering, a series of transactions will occur pursuant to which holders of equity interests in PSAV Holdings LLC will become holders of common stock in PSAV, Inc., the issuer of shares in this offering. See “Organizational Structure.”
Distribution
In May 2015, we used a portion of the proceeds from $180.0 million of incremental borrowings under our first lien credit agreement to make a $149.1 million distribution (the “Distribution”) to the members of PSAV Holdings LLC, with $2.3 million distributed to holders of Class B Units as a tax distribution and $146.8 million distributed to holders of Class A Units. The $2.3 million distributed to holders of Class B Units is treated as an advance against future distributions to Class B Units that exceed the distribution threshold for those units.
The Offering
For purposes of the unaudited pro forma condensed consolidated financial statements, the “Offering” is defined as the issuance and sale to the public of common stock of PSAV, Inc. based upon the assumed initial public offering price of $ per share, which is the midpoint of the estimated offering price range set forth on the cover of this prospectus after deducting the estimated underwriting discounts and commissions and estimated offering expenses payable by us and the application of the net proceeds from such issuance as described in “Use of Proceeds.”
The pro forma adjustments and the assumptions underlying the pro forma adjustments are described in the accompanying notes, which should be read in conjunction with the unaudited pro forma condensed consolidated financial statements.
The unaudited pro forma condensed consolidated balance sheet of PSAV, Inc. is based on the unaudited historical condensed consolidated balance sheet of PSAV Holdings LLC as of June 30, 2015 and includes pro forma adjustments to give effect to the corporate reorganization, the Distribution and the Offering as if they occurred on June 30, 2015.
47
Table of Contents
The unaudited pro forma condensed consolidated and combined statement of operations of PSAV, Inc. for the year ended December 31, 2014 is based on the historical consolidated statement of operations of AVSC Holding Corp. as Predecessor for the period from January 1, 2014 through January 24, 2014 and the historical consolidated statement of operations of PSAV Holdings LLC as Successor for the period from January 25, 2014 through December 31, 2014 and includes pro forma adjustments to give effect to the Sponsors Acquisition, the corporate reorganization, the Distribution and the Offering as if they occurred on January 1, 2014.
The unaudited pro forma condensed consolidated statement of operations of PSAV, Inc. for the six months ended June 30, 2015 is based on the unaudited historical condensed consolidated statements of operations of PSAV Holdings LLC for the six months ended June 30, 2015 and includes pro forma adjustments to give effect to the corporate reorganization, the Distribution and the Offering as if they occurred on January 1, 2014.
The pro forma adjustments to the audited and unaudited historical consolidated financial statements are based on currently available information and certain estimates and assumptions and should not be relied upon as being indicative of our results of operations had the Sponsors Acquisition, the corporate reorganization, the Distribution or the Offering occurred on January 1, 2014 or June 30, 2015, as applicable. Management believes that the assumptions used to prepare the pro forma adjustments provide a reasonable basis for presenting the significant effects of the corporate reorganization and the Offering as currently contemplated and that the unaudited pro forma adjustments are factually supportable, give appropriate effect to the expected impact of events that are directly attributable to the corporate reorganization and the Offering, and reflect those items expected to have a continuing impact on PSAV, Inc.
The unaudited pro forma consolidated financial statements should be read in conjunction with “Organizational Structure,” “Use of Proceeds,” “Selected Historical Consolidated Financial Data,” “Management’s Discussion and Analysis of Financial Condition and Results of Operations,” “Capitalization” and the financial statements and notes thereto appearing elsewhere in this prospectus.
48
Table of Contents
PSAV, Inc.
Unaudited Pro Forma Condensed Consolidated Balance Sheet
June 30, 2015
| PSAV Holdings LLC June 30, 2015 |
Corporate Reorganization and Offering Adjustments |
PSAV, Inc. Pro Forma June 30, 2015 | ||||||||
| (in thousands, except unit, share and per share amounts) | ||||||||||
| Assets |
||||||||||
| Current assets: |
||||||||||
| Cash and cash equivalents |
$ | 69,184 | ||||||||
| Trade accounts receivable, net of allowance for doubtful accounts of $486 at June 30, 2015 |
125,837 | |||||||||
| Deferred tax assets |
13,161 | |||||||||
| Prepaid expenses |
19,146 | |||||||||
| Other current assets |
1,613 | |||||||||
|
|
|
|
|
| ||||||
| Total current assets |
228,941 | |||||||||
| Property and equipment, net |
119,085 | |||||||||
| Goodwill |
395,044 | |||||||||
| Trade name |
160,919 | |||||||||
| Customer relationships, net |
57,198 | |||||||||
| Venue contracts, net |
305,683 | |||||||||
| Other contractual relationships, net |
3,251 | |||||||||
| Venue incentives |
29,233 | |||||||||
| Other assets |
1,554 | |||||||||
|
|
|
|
|
| ||||||
| Total assets |
$ | 1,300,908 | ||||||||
|
|
|
|
|
| ||||||
| Liabilities and members’/stockholders’ equity |
||||||||||
| Current liabilities: |
||||||||||
| Current portion of long-term debt |
$ | 7,218 | (a) | |||||||
| Trade accounts payable |
34,600 | |||||||||
| Accrued expenses |
94,836 | |||||||||
|
|
|
|
|
| ||||||
| Total current liabilities |
136,654 | |||||||||
| Long-term debt |
857,688 | (a) | ||||||||
| Deferred tax liabilities |
170,350 | |||||||||
| Other liabilities |
10,980 | |||||||||
|
|
|
|
|
| ||||||
| Total liabilities |
1,175,672 | |||||||||
| Members’ equity: |
||||||||||
| Class A Units, 270,159 units issued and outstanding at June 30, 2015 |
128,819 | (b) | ||||||||
| Class B Units, 15,371 units issued and outstanding at June 30, 2015 |
(1,717 | ) | (b) | |||||||
| Accumulated other comprehensive loss |
(1,866 | ) | (b) | |||||||
|
|
|
|
|
| ||||||
| Total members’ equity |
125,236 | |||||||||
| Stockholders’ equity: |
||||||||||
| Common stock, $0.01 par value per share, no shares authorized issued and outstanding, actual; shares issued and outstanding, pro forma |
— | (a)(b) | ||||||||
| Preferred stock, $0.01 par value per share, no shares authorized issued and outstanding, actual, pro forma |
||||||||||
| Additional paid-in capital |
— | (b) | ||||||||
| Retained earnings |
— | — | (b) | |||||||
| Accumulated other comprehensive income (loss) |
||||||||||
|
|
|
|
|
| ||||||
| Total stockholders’ equity |
— | |||||||||
|
|
|
|
|
| ||||||
| Total liabilities and members’/stockholders’ equity |
$ | 1,300,908 | ||||||||
|
|
|
|
|
| ||||||
49
Table of Contents
PSAV, Inc.
Notes to Unaudited Pro Forma Condensed Consolidated Balance Sheet
| (a) | Represents the sale of shares of our common stock in this offering, based upon the assumed initial public offering price of $ per share, which is the midpoint of the estimated offering price range set forth on the cover of this prospectus after deducting the estimated underwriting discounts and commissions and estimated offering expenses payable by us and the application of the net proceeds to repay long-term debt. See “Use of Proceeds.” |
| (b) | Represents the change in equity accounts to reflect the corporate reorganization, including the liquidation of PSAV Holdings LLC and the distribution of the shares of common stock of PSAV, Inc. to holders of Class A Units of PSAV Holdings LLC. |
50
Table of Contents
PSAV, Inc.
Unaudited Pro Forma Condensed Consolidated and Combined Statement of Operations
Year Ended December 31, 2014
| PSAV Holdings LLC | ||||||||||||||||||||||||||
| January 1, through January 24, 2014 |
January 25, through December 31, 2014 |
Sponsors Acquisition Adjustments |
2014 Pro Forma Combined Period |
Corporate Reorganization, Distribution and Offering Adjustments |
PSAV, Inc. Pro Forma Year Ended December 31, 2014 |
|||||||||||||||||||||
| (Predecessor) | (Successor) | |||||||||||||||||||||||||
| (in thousands, except share and per share amounts) | ||||||||||||||||||||||||||
| Revenue |
$ | 75,622 | $ | 1,188,283 | $ | — | $ | 1,263,905 | $ | $ | ||||||||||||||||
| Cost of revenue |
(63,684 | ) | (1,012,548 | ) | (1,186 | )(a) | (1,077,418 | ) | ||||||||||||||||||
|
|
|
|
|
|
|
|
|
|
|
|
|
|||||||||||||||
| Gross profit |
11,938 | 175,735 | (1,186 | ) | 186,487 | |||||||||||||||||||||
| Selling, general, and administrative expenses |
30,448 | 96,657 | (23,428 | )(b) | 103,677 | |||||||||||||||||||||
| Acquisition-related expenses |
14,160 | 18,977 | (31,911 | )(c) | 1,226 | |||||||||||||||||||||
| Depreciation |
340 | 3,740 | — | 4,080 | ||||||||||||||||||||||
| Amortization of intangibles |
950 | 22,606 | 661 | (d) | 24,217 | |||||||||||||||||||||
|
|
|
|
|
|
|
|
|
|
|
|
|
|||||||||||||||
| Total operating expenses |
45,898 | 141,980 | (54,678 | ) | 133,200 | |||||||||||||||||||||
|
|
|
|
|
|
|
|
|
|
|
|
|
|||||||||||||||
| Income (loss) from operations |
(33,960 | ) | 33,755 | 53,492 | 53,287 | |||||||||||||||||||||
| Other income (expense), net |
366 | (3,892 | ) | — | (3,526 | ) | ||||||||||||||||||||
| Interest expense, net |
(2,830 | ) | (40,536 | ) | 472 | (e) | (42,894 | ) | (f) | |||||||||||||||||
|
|
|
|
|
|
|
|
|
|
|
|
|
|||||||||||||||
| Income (loss) before tax (expense) benefit |
(36,424 | ) | (10,673 | ) | 53,964 | 6,867 | ||||||||||||||||||||
| Income tax (expense) benefit |
10,503 | 107 | (18,887 | )(g) | (8,277 | ) | (g) | |||||||||||||||||||
|
|
|
|
|
|
|
|
|
|
|
|
|
|||||||||||||||
| Net (loss) income |
$ | (25,921 | ) | $ | (10,566 | ) | $ | 35,077 | $ | (1,410 | ) | |||||||||||||||
|
|
|
|
|
|
|
|
|
|
|
|
|
|||||||||||||||
| Pro forma basic net income (loss) per share(i) |
||||||||||||||||||||||||||
| Pro forma diluted net income (loss) per share(i) |
||||||||||||||||||||||||||
| Pro forma weighted average shares outstanding – basic(i) |
||||||||||||||||||||||||||
| Pro forma weighted average shares outstanding – diluted(i) |
||||||||||||||||||||||||||
51
Table of Contents
PSAV, Inc.
Unaudited Pro Forma Condensed Consolidated Statement of Operations
Six Months Ended June 30, 2015
| PSAV Holdings LLC Six Months Ended June 30, 2015 |
Distribution, Corporate Reorganization and Offering Adjustments |
PSAV, Inc. Pro Forma |
||||||||||
| (in thousands, except share and per share amounts) |
||||||||||||
| Statement of Operations Data: |
||||||||||||
| Revenue |
$ | 791,988 | $ | $ | ||||||||
| Cost of revenue |
(657,031 | ) | ||||||||||
|
|
|
|
|
|
|
|||||||
| Gross profit |
134,957 | |||||||||||
| Operating expenses: |
||||||||||||
| Selling, general, and administrative expenses |
67,291 | |||||||||||
| Acquisition-related expenses |
1,049 | |||||||||||
| Depreciation |
2,449 | |||||||||||
| Amortization of intangibles |
13,188 | |||||||||||
|
|
|
|
|
|
|
|||||||
| Total operating expenses |
83,977 | |||||||||||
|
|
|
|
|
|
|
|||||||
| Income from operations |
50,980 | |||||||||||
| Other income (expense), net |
(1,873 | ) | ||||||||||
| Interest expense, net |
(23,569 | ) | (h) | |||||||||
|
|
|
|
|
|
|
|||||||
| Income before tax expense |
25,538 | |||||||||||
| Income tax expense |
(10,405 | ) | (g) | |||||||||
|
|
|
|
|
|
|
|||||||
| Net income |
$ | 15,133 | ||||||||||
|
|
|
|
|
|
|
|||||||
| Pro forma basic net income per share(i) |
||||||||||||
| Pro forma diluted net income per share(i) |
||||||||||||
| Pro forma weighted average shares outstanding – basic(i) |
||||||||||||
| Pro forma weighted average shares outstanding – diluted(i) |
||||||||||||
52
Table of Contents
PSAV, Inc.
Notes to Unaudited Pro Forma Condensed Consolidated and Combined Statements of Operations
| (a) | Increase in cost of revenue represents additional depreciation for the period from January 1, 2014 through January 24, 2014, resulting from increased basis of property and equipment recorded in connection with the accounting for the Sponsors Acquisition. |
| (b) | Removal of $18 million of expense related to an executive long-term incentive bonus plan that was settled and eliminated in connection with the Sponsors Acquisition and $5.4 million of expense related to Predecessor override units that was recognized in connection with the Sponsors Acquisition. |
| (c) | Removal of $14.2 million and $17.8 million of non-recurring acquisition expenses related to the Sponsors Acquisition from the period from January 1, 2014 through January 24, 2014 and period from January 25, 2014 through December 31, 2014, respectively. |
| (d) | Additional amortization of intangibles for the period from January 1, 2014 through January 24, 2014, resulting from the step-up of the intangible assets to fair value which was recorded in connection with the accounting for the Sponsors Acquisition. |
| (e) | Reduction of interest expense for the period from January 1, 2014 through January 24, 2014 is the result of a decrease in the interest rate on the debt issued in connection with the Sponsors Acquisition. |
| (f) | Additional interest expense for the year ended December 31, 2014 related to the debt issued in connection with the Distribution on May 18, 2015 as if the Distribution and related debt issuance had occurred on January 1, 2014, offset by elimination of interest expense on $ of % bank debt to be repaid from the proceeds of the Offering. |
| (g) | Reduction of federal income taxes related to foregoing adjustments based upon the statutory rate of 35%. The corporate reorganization does not result in pro forma adjustments to income taxes. Although PSAV Holdings LLC was organized as a limited liability company, which is a pass-through entity for federal and state income tax purposes, we conduct our business through subsidiaries that are subject to income taxes in both the United States and numerous foreign jurisdictions. |
| (h) | Additional interest expense for the period from January 1, 2015 through May 17, 2015, related to the debt issued in connection with the Distribution on May 18, 2015, offset by the elimination of interest expense on $ of % bank debt to be repaid from the proceeds of the Offering. |
| (i) | Unaudited proforma net income per share and weighted average shares information gives effect to the corporate reorganization and the Offering. |
53
Table of Contents
SELECTED HISTORICAL CONSOLIDATED FINANCIAL DATA
The following table sets forth our selected historical financial data for the periods and as of the dates indicated. The periods prior to and including January 24, 2014, the date of the Sponsors Acquisition, are referred to in the following table as “Predecessor,” and all periods after such date are referred to in the following table as “Successor.” The consolidated financial statements for all Successor periods are not comparable to those of the Predecessor periods.
We derived the consolidated statement of operations and other data for the period from January 25, 2014 through June 30, 2014 and the six months ended June 30, 2015 and the balance sheet data as of June 30, 2015 from our unaudited condensed consolidated financial statements contained elsewhere in this prospectus. We derived the consolidated statement of operations and other data for the years ended December 31, 2012 and 2013, the period from January 1, 2014 through January 24, 2014 and the period from January 25, 2014 through December 31, 2014 and the balance sheet data as of December 31, 2013 and 2014 from our audited consolidated financial statements contained elsewhere in this prospectus. We derived the consolidated statement of operations data for the years ended December 31, 2010 and 2011 and the consolidated balance sheet data as of December 31, 2010, 2011 and 2012 from our unaudited consolidated financial statements that are not included in this prospectus.
We have prepared the unaudited condensed consolidated financial statements on the same basis as our audited consolidated financial statements and have included all adjustments, consisting of only normal recurring adjustments, that we consider necessary for the fair presentation of our financial position and operating results for such periods. The interim results are not necessarily indicative of results for the year ending December 31, 2015 or for any other period.
Our historical results are not necessarily indicative of future operating results. You should read the information set forth below in conjunction with “Unaudited Pro Forma Condensed Consolidated Financial Statements,” “Management’s Discussion and Analysis of Financial Condition and Results of Operations” and our financial statements and the related notes thereto contained elsewhere in this prospectus.
54
Table of Contents
| Twelve Months Ended December 31, 2014 |
Six Months Ended June 30, 2014 |
|||||||||||||||||||||||||||||||||||||||
| Predecessor | Predecessor | Successor | Predecessor | Successor | Successor | |||||||||||||||||||||||||||||||||||
| Year Ended December 31, | January 1, through January 24, 2014 |
January 25, through December 31, 2014 |
January 1, through January 24, 2014 |
January 25, through June 30, 2014 |
Six Months Ended June 30, 2015 |
|||||||||||||||||||||||||||||||||||
| 2010 | 2011 | 2012 | 2013 | |||||||||||||||||||||||||||||||||||||
| (dollars in thousands) | ||||||||||||||||||||||||||||||||||||||||
| Statement of Operations Data: |
||||||||||||||||||||||||||||||||||||||||
| Revenue |
$ | 573,160 | $ | 645,469 | $ | 724,848 | $ | 1,096,374 | $ | 75,622 | $ | 1,188,283 | $ | 75,622 | $ | 599,543 | $ | 791,988 | ||||||||||||||||||||||
| Income (loss) from operations |
(15,442 | ) | (3,758 | ) | 18,507 | 53,998 | (33,960 | ) | 33,755 | (33,960 | ) | 28,925 | 50,980 | |||||||||||||||||||||||||||
| Income (loss) before income taxes |
(33,876 | ) | (18,164 | ) | (196 | ) | 14,576 | (36,424 | ) | (10,673 | ) | (36,424 | ) | 9,421 | 25,538 | |||||||||||||||||||||||||
| Net income (loss) |
(35,431 | ) | (19,025 | ) | 9,703 | 17,596 | (25,921 | ) | (10,566 | ) | (25,921 | ) | 865 | 15,133 | ||||||||||||||||||||||||||
| Statement of Cash Flows Data: |
||||||||||||||||||||||||||||||||||||||||
| Net cash provided by (used in): |
||||||||||||||||||||||||||||||||||||||||
| Operating activities |
$ | 12,214 | $ | 27,373 | $ | 57,431 | $ | 51,330 | $ | (2,018 | ) | $ | 46,271 | $ | (2,018 | ) | $ | 3,221 | $ | 27,969 | ||||||||||||||||||||
| Investing activities |
(21,184 | ) | (28,910 | ) | (304,596 | ) | (77,219 | ) | (4,268 | ) | (911,732 | ) | (4,268 | ) | (888,849 | ) | (72,480 | ) | ||||||||||||||||||||||
| Financing activities |
(10,977 | ) | (2,250 | ) | 232,693 | 35,750 | — | 935,071 | — | 927,171 | 45,809 | |||||||||||||||||||||||||||||
| Other Financial Data: |
||||||||||||||||||||||||||||||||||||||||
| Capital expenditures |
$ | 21,229 | $ | 29,105 | $ | 29,354 | $ | 36,506 | $ | 4,268 | $ | 34,130 | $ | 4,268 | $ | 11,247 | $ | 28,587 | ||||||||||||||||||||||
| Adjusted EBITDA(1) |
37,731 | 53,386 | 72,467 | 130,381 | 7,892 | 149,047 | 7,892 | 92,464 | 113,318 | |||||||||||||||||||||||||||||||
| Adjusted EBITDA margin(1) |
6.6 | % | 8.3 | % | 10.0 | % | 11.9 | % | 10.4 | % | 12.5 | % | 10.4 | % | 15.4 | % | 14.3 | % | ||||||||||||||||||||||
| Operating Data: |
||||||||||||||||||||||||||||||||||||||||
| Domestic: |
||||||||||||||||||||||||||||||||||||||||
| Revenue |
494,807 | 558,270 | 631,105 | 991,682 | 70,240 | 1,087,737 | 70,240 | 549,635 | 731,524 | |||||||||||||||||||||||||||||||
| Adjusted EBITDA(1) |
30,886 | 45,664 | 62,933 | 118,618 | 7,280 | 138,594 | 7,280 | 86,344 | 106,435 | |||||||||||||||||||||||||||||||
| Venue count |
586 | 574 | 947 | 1,010 | 1,012 | 995 | 1,012 | 1,003 | 1,050 | |||||||||||||||||||||||||||||||
| International: |
||||||||||||||||||||||||||||||||||||||||
| Revenue |
78,353 | 87,199 | 93,743 | 104,692 | 5,382 | 100,546 | 5,382 | 49,908 | 60,464 | |||||||||||||||||||||||||||||||
| Adjusted EBITDA(1) |
6,845 | 7,722 | 9,534 | 11,763 | 612 | 10,453 | 612 | 6,120 | 6,883 | |||||||||||||||||||||||||||||||
| Venue count |
255 | 241 | 234 | 233 | 231 | 221 | 231 | 221 | 268 | |||||||||||||||||||||||||||||||
| Predecessor | Successor | |||||||||||||||||||||||||
| December 31, |
|
December 31, 2014 |
June 30, 2015 |
|||||||||||||||||||||||
| 2010 | 2011 | 2012 | 2013 | |||||||||||||||||||||||
| (in thousands) | ||||||||||||||||||||||||||
| Balance Sheet Data: |
||||||||||||||||||||||||||
| Cash and cash equivalents |
$ | 32,284 | $ | 28,316 | $ | 14,027 | $ | 23,733 | $ | 68,818 | $ | 69,184 | ||||||||||||||
| Total assets |
312,672 | 292,788 | 571,847 | 642,283 | 1,195,857 | 1,300,908 | ||||||||||||||||||||
| Long-term debt (including current portion) |
295,210 | 293,976 | 429,064 | 468,842 | 668,267 | 864,906 | ||||||||||||||||||||
| Total liabilities |
370,465 | 368,741 | 535,730 | 590,774 | 937,089 | 1,175,672 | ||||||||||||||||||||
| Total equity (deficit) |
(57,793 | ) | (75,953 | ) | 36,117 | 51,509 | 258,768 | 125,236 | ||||||||||||||||||
| (1) | Adjusted EBITDA represents net income before interest expense, income taxes, depreciation, amortization of intangibles, transaction-related expenses, long-term incentive plan payments, gain or loss on disposal of assets, gains or losses on foreign currency transactions, changes in the fair value of our interest rate caps, amortization of venue incentives, including the expense impact of certain venue incentive payments for which deferred expense recognition was not applicable under U.S. GAAP, management fees paid to our Sponsors, equity-based compensation expense, executive severance and certain consulting and professional costs. We define Adjusted EBITDA margin as Adjusted EBITDA as a percentage of revenue. Management believes Adjusted EBITDA and Adjusted EBITDA margin are useful because they allow management to more effectively evaluate our operating performance and compare the results of |
55
Table of Contents
| our operations from period to period without regard to our financing methods or capital structure or other items that we believe are not indicative of our ongoing operating performance. In addition, the determination of Adjusted EBITDA is consistent with the definition of a similar measure in our credit agreements other than pro forma adjustments for acquisitions and certain forward-looking adjustments permitted by the credit agreements but not considered by management in evaluating our performance using Adjusted EBITDA. |
Adjusted EBITDA is a “non-GAAP financial measure” as defined under the rules of the SEC. Our presentation of Adjusted EBITDA is intended as a supplemental measure of our performance that is not required by, or presented in accordance with, U.S. GAAP. Adjusted EBITDA should not be considered as an alternative to income (loss) from operations, net income (loss), earnings per share or any other performance measures derived in accordance with U.S. GAAP as measures of operating performance or operating cash flows or as measures of liquidity. Our presentation of Adjusted EBITDA should not be construed to imply that our future results will be unaffected by these items. Adjusted EBITDA is included in this prospectus because it is a key metric used by management to assess our operating performance.
Management believes the inclusion of Adjusted EBITDA is meaningful to our investors to enhance their understanding of our financial performance. Although Adjusted EBITDA is not necessarily a measure of liquidity or our ability to fund our operations, we understand that it is frequently used by securities analysts, investors and other interested parties as a supplemental measure of financial performance.
Adjusted EBITDA has important limitations as an analytical tool and you should not consider it in isolation or as a substitute for analysis of our results as reported under U.S. GAAP. Some of these limitations are:
Adjusted EBITDA:
| • | does not reflect our cash expenditures, or future requirements, for capital expenditures or contractual commitments; |
| • | does not reflect our cash expenditures for venue incentives or the amortization of those incentive payments; |
| • | although depreciation and amortization of intangibles are non-cash charges, the assets being depreciated and amortized will often have to be replaced in the future, and Adjusted EBITDA does not reflect any cash requirements for such replacements; |
| • | does not reflect the costs of acquisitions of businesses or other capital market transactions; |
| • | does not reflect the significant interest expense, or the cash requirements necessary to service interest or principal payments on our debt; |
| • | does not reflect our income tax expense or the cash requirements to pay our income taxes; |
| • | does not reflect changes in, or cash requirements for, our working capital needs; |
| • | does not reflect the cash requirements for other excluded items; |
| • | does not reflect the impact of equity-based compensation upon our operations; and |
| • | may not be consistent with how other companies in our industry calculate Adjusted EBITDA. |
In evaluating Adjusted EBITDA, you should be aware that in the future we may incur expenses similar to those eliminated in this presentation.
56
Table of Contents
The following table reconciles net (loss) income to Adjusted EBITDA for the periods presented:
| Twelve Months Ended December 31, 2014 |
Six Months Ended June 30, 2014 |
|||||||||||||||||||||||||||||||||||||||
| Predecessor | Predecessor | Successor | Predecessor | Successor | Successor | |||||||||||||||||||||||||||||||||||
| Year Ended December 31, | January 1, through January 24, 2014 |
January 25, through December 31, 2014 |
January 1, through January 24, 2014 |
January 25, through June 30, 2014 |
Six Months Ended June 30, 2015 |
|||||||||||||||||||||||||||||||||||
| 2010 | 2011 | 2012 | 2013 | |||||||||||||||||||||||||||||||||||||
| (in thousands) | ||||||||||||||||||||||||||||||||||||||||
| Net (loss) income |
$ | (35,431 | ) | $ | (19,025 | ) | $ | 9,703 | $ | 17,596 | $ | (25,921 | ) | $ | (10,566 | ) | $ | (25,921 | ) | $ | 865 | $ | 15,133 | |||||||||||||||||
| Income tax (benefit) expense |
1,555 | 862 | (9,899 | ) | (3,020 | ) | (10,503 | ) | (107 | ) | (10,503 | ) | 8,556 | 10,405 | ||||||||||||||||||||||||||
| Interest expense, net |
18,439 | 13,453 | 20,011 | 40,700 | 2,830 | 40,536 | 2,830 | 18,737 | 23,569 | |||||||||||||||||||||||||||||||
| Depreciation and amortization of intangibles |
42,253 | 39,971 | 30,174 | 47,502 | 3,222 | 71,950 | 3,222 | 33,066 | 42,419 | |||||||||||||||||||||||||||||||
| Transaction-related expenses(a) |
— | — | 4,004 | 12,004 | 14,243 | 20,410 | 14,243 | 19,057 | 2,757 | |||||||||||||||||||||||||||||||
| Long-term incentive plan payments(b) |
— | — | 6,850 | — | 18,021 | 42 | 18,021 | 42 | — | |||||||||||||||||||||||||||||||
| (Gain)/loss on disposal of assets |
815 | 455 | 1,695 | 2,051 | 127 | 2,918 | 127 | 1,141 | 1,608 | |||||||||||||||||||||||||||||||
| Foreign currency transactions (gain)/loss(c) |
(5 | ) | 954 | (1,308 | ) | (1,278 | ) | (366 | ) | 2,075 | (366 | ) | (381 | ) | 763 | |||||||||||||||||||||||||
| Changes in fair value of interest rate caps(d) |
— | — | — | — | — | 1,817 | — | 1,148 | 973 | |||||||||||||||||||||||||||||||
| Amortization of venue incentives(e) |
6,297 | 8,366 | 8,623 | 9,318 | 705 | 8,306 | 705 | 5,489 | 3,456 | |||||||||||||||||||||||||||||||
| Management fee(f) |
— | — | — | — | — | 1,405 | — | 649 | 786 | |||||||||||||||||||||||||||||||
| Equity-based compensation expense(g) |
— | — | — | — | 5,365 | 299 | 5,365 | 136 | 163 | |||||||||||||||||||||||||||||||
| Severance expense(h) |
551 | 5,934 | 978 | 2,334 | 163 | 798 | 163 | 758 | 1,982 | |||||||||||||||||||||||||||||||
| Consulting fees and other(i) |
3,257 | 2,416 | 1,636 | 3,174 | 6 | 9,164 | 6 | 3,201 | 9,304 | |||||||||||||||||||||||||||||||
|
|
|
|
|
|
|
|
|
|
|
|
|
|
|
|
|
|
|
|||||||||||||||||||||||
| Adjusted EBITDA |
$ | 37,731 | $ | 53,386 | $ | 72,467 | $ | 130,381 | $ | 7,892 | $ | 149,047 | $ | 7,892 | $ | 92,464 | $ | 113,318 | ||||||||||||||||||||||
|
|
|
|
|
|
|
|
|
|
|
|
|
|
|
|
|
|
|
|||||||||||||||||||||||
| (a) | Expenses incurred in connection with acquisitions, including the Sponsors Acquisition, such as pre-acquisition professional fees and costs to integrate these businesses. |
| (b) | Expenses associated with our long-term incentive plans for certain members of management paid in connection with the acquisition of Swank in 2012 and the Sponsors Acquisition in 2014. |
| (c) | Gains and losses on transactions settled in foreign currencies. |
| (d) | Refer to Note 12 and Note 13 to our audited consolidated financial statements included elsewhere in this prospectus for further information on our interest rate caps. |
| (e) | Amortization of incentive payments made to venues over the term of related agreements, including the expense impact of $4.1 million in 2014 and $0.3 million in 2015 in venue incentive payments for which deferred expense recognition was not applicable under U.S. GAAP. |
| (f) | Annual management fee and related expenses paid to our Sponsors. |
| (g) | For the period from January 1, 2014 through January 24, 2014, relates to grants of equity in connection with the Sponsors Acquisition. |
| (h) | Severance expense related to employees terminated subsequent to acquisitions. |
| (i) | Professional services expenses related to interim management and strategic initiatives. In 2010 through 2014, includes costs related to an insurance policy purchased by the Predecessor. |
57
Table of Contents
MANAGEMENT’S DISCUSSION AND ANALYSIS OF FINANCIAL CONDITION AND RESULTS OF OPERATIONS
We conduct business through PSAV Holdings LLC and its subsidiaries and, except as indicated, this discussion and analysis does not give effect to the corporate reorganization. See “Organizational Structure.” Prior to January 25, 2014, we conducted business through AVSC Holding Corp. See “—Basis of Presentation.” As a result of both of the foregoing changes, our historical results of operations may not be comparable and may not be indicative of our future results of operations. In addition, this discussion and analysis contains forward-looking statements regarding the industry outlook, our expectations for the performance of our business, our liquidity and capital resources and the other non-historical statements. These forward-looking statements are subject to numerous risks and uncertainties, including but not limited to the risks and uncertainties described in “Risk Factors” and “Forward-Looking Statements.” Our actual results may differ materially from those contained in or implied by these forward-looking statements as a result of various factors, including those set forth under “Risk Factors,” “Forward-Looking Statements” and elsewhere in this prospectus. You should read the following discussion and analysis of our financial condition and results of operations together with the sections entitled “Summary—Summary Historical Consolidated Financial and Other Data,” “Risk Factors,” “Forward-Looking Statements,” “Selected Historical Consolidated Financial Data,” “Unaudited Pro Forma Condensed Consolidated Financial Statements” and our consolidated financial statements and related notes thereto included elsewhere in this prospectus.
Business Overview
We are the event technology provider of choice at leading hotels, resorts and convention centers. Our business model is based on long-term partnerships with these venues, which establish us as the exclusive on-site provider of event technology services. Our customers, including corporations, event organizers, trade associations and meeting planners, hire us primarily through our on-site presence at venues to plan and execute their events. We have built a premier brand based on our comprehensive service offerings, strong track record of customer service, broad geographic footprint and on-site employee service model. We are the exclusive on-site provider to over 1,300 venues and support approximately 1.5 million meetings each year. (Note that a meeting represents individual rooms or event spaces where we provide event technology services. A single customer event may have multiple rooms and thus consist of multiple meetings.)
We offer our customers a comprehensive set of event technology solutions to address the entire scope of their events from planning to execution. The rising technological complexity and growing importance of meetings and events enhances the importance of the relationships between the customers holding an event and the venues and service providers executing the event. Our sales and production teams work with customers directly to identify key messages and goals for an event and develop ways to convey those messages in a creative and compelling fashion, leveraging our technical expertise. During the event, our technicians ensure the services are effectively, professionally and reliably delivered.
We have experienced significant growth from the year ended December 31, 2010 to the 2014 Pro Forma Combined Period. See “Unaudited Pro Forma Condensed Consolidated Financial Statements,” “—Basis of Presentation” and “—Results of Operations.”
| • | Revenue increased from $573.2 million to $1,263.9 million, a CAGR of 21.9%, and our same venue revenue increased by an average of 11.3% annually over the same period; |
| • | Adjusted EBITDA increased from $37.7 million to $156.9 million, a CAGR of 42.8%, and Adjusted EBITDA Margin increased from 6.6% to 12.4%; |
| • | Net loss improved from $(35.4) million to $(1.4) million; and |
| • | Venue count increased from 828 as of December 31, 2010 to 1,216 as of December 31, 2014. |
58
Table of Contents
Our History
Through our focus on innovation and customer service, we have evolved from a small, regionally-based provider of audiovisual services to a leading global event technology services provider. Initially focused on U.S. hotel venues, we started developing relationships with venues at a time when most properties still chose to provide their own, in-house audiovisual services to their customers. By the 1990s, as events and the associated technology needs grew increasingly complex, we observed that more U.S. hotels began outsourcing event technology services, bringing third-party providers on-site to work with guests directly regarding their need for specialized technological expertise. Over the last decade, this trend has accelerated and broadened to include other venues such as convention centers, conference centers and sports stadiums. We anticipated this outsourcing trend and began establishing relationships with leading hotel chains at the corporate level. These relationships served as an endorsement of our brand and provided us access to their venues which helped fuel our growth.
In addition to our core growth, we have continued to grow our business through strategic acquisitions and through geographic expansion. Our largest acquisition was Swank in November 2012, and we have completed three more acquisitions since 2013 that have broadened our portfolio of services and increased our density in key markets. See “—Our Recent Acquisitions.” More recently, we have focused on building our geographic footprint internationally. We continue to leverage our strong relationships with our leading international hotel chain partners in Canada, Mexico, Europe and the Middle East.
On January 24, 2014, affiliates of The Goldman Sachs Group, Inc. and Olympus Partners, members of management and other investors formed PSAV Holdings LLC, which in turn acquired 100% of the voting equity interests in our wholly-owned subsidiary AVSC Holding Corp. for $877.6 million. We refer to the affiliates of The Goldman Sachs Group, Inc. and Olympus Partners collectively as our “Sponsors” and the foregoing acquisition as the “Sponsors Acquisition.” The Sponsors Acquisition was financed in part by $269.4 million of equity investments from the Sponsors, management and other investors. We also entered into debt agreements totaling $685.0 million and repaid AVSC Holding Corp.’s outstanding debt of $492.1 million.
Factors Affecting Our Business
Hotel Group RevPAR Performance
In the United States, meeting and event activity historically has been highly correlated with the hospitality industry metric Revenue per Available Room (“RevPAR”) and Group Revenue per Available Room (“Group RevPAR”), which are calculated by STR and PKF. STR is an independent, third-party service that collects and compiles the data used to calculate RevPAR and Group RevPAR and PKF is an independent, third-party service that collects and compiles historical data used to calculate RevPAR. Whereas RevPAR is a total industry metric, Group RevPAR measures total guest hotel room revenue generated by group bookings (blocks of guest hotel rooms sold simultaneously in a group of ten or more rooms), divided by total number of available guest hotel rooms. Because meetings and events generally require lodging for their participants, event activity typically correlates with Group RevPAR at nearby hotels, regardless of whether the events themselves are held on-site at hotels or at other nearby venues. As we provide event technology services primarily in hotels in the luxury and upper upscale segments, we refer to Group RevPAR for hotels in these segments as they more closely align with our business.
Within the United States, RevPAR has grown on average by 5.1% annually since 1970 according to PKF. Group RevPAR is a newer industry metric and represents a segment of the RevPAR performance, but tracks closely to overall RevPAR. Since 1970, RevPAR has only decreased in times of significant downturns in travel such as after September 11, 2001 and during the global financial crisis that began in 2008. More recently, both RevPAR and Group RevPAR have demonstrated strong growth in the rebound from the financial crisis, with overall RevPAR growing at a CAGR of 5.3% since
59
Table of Contents
2010. Looking ahead, RevPAR for luxury and upper upscale hotels is predicted to grow at 6.3% in 2015 and 6.1% in 2016, according to PwC based on STR data. Our revenue historically has been correlated with Group RevPAR and our same venue revenue growth has exceeded Group RevPAR growth for each of the past six years as we have increased average revenue per event and expanded the services we offer through our venues.
Master Service and Venue Agreements
We enter into MSAs with hotel chain owners, operators or franchises, which provide the framework (including commission rates, incentives and other key terms) for individual property level agreements with owned, managed and franchised venues. During 2014, we renewed MSAs with four of our largest hotel chain partners and corresponding agreements with their related venues. Due in large part to these renewals, approximately 48% of 2014 domestic revenue was generated in venues with contracts that have expirations in 2019 or later.
We may pay incentives to venues in connection with the execution of new contracts or renewals. The incentives typically represent up-front cash payments, costs for capital equipment or installation services provided to venues which generally provide us with the right to be the exclusive on-site provider of event technology services and are deferred and amortized over the life of the contract. Incentives paid in connection with executing these and other agreements were $16.5 million for the six months ended June 30, 2015 compared to $4.4 million for the period from January 25, 2014 through June 30, 2014, and $0.1 million during the period from January 1, 2014 through January 24, 2014. Incentives paid in the period from January 25, 2014 through December 31, 2014, the year ended December 31, 2013 and the year ended December 31, 2012 were $15.5 million, $6.4 million and $4.6 million, respectively. The level of incentives track with our five to six year MSA renewal cycle, which peaked in 2014 and the first half of 2015, as contracts representing approximately 48% of our 2014 domestic revenue were entered into or renewed. As such, we expect our levels of incentives over the next several years to return to historic levels as a percentage of our revenue. See “—Basis of Presentation” below.
General Economic Conditions
Because a significant portion of our revenue is derived from corporate meetings and events, our business may also be more generally impacted by global economic conditions, particularly economic conditions in the United States, that impact these corporations. While we believe our diverse customer base limits our exposure to any particular industry or geography, global economic conditions may impact overall levels of corporate spending, which can directly affect our results of operations.
Unemployment
Employment levels can impact our ability to recruit the necessary talent to staff our venues. When the employment market is strong, with unemployment at low levels, corporations may raise wages and expand the geographic scope of their recruitment efforts resulting in higher labor costs.
Globalization
Our ability to grow our business globally is impacted by both our venue partners’ continued expansion into new markets as well as the international continuation of the trends towards outsourcing event technology services that started in the United States.
Outsourcing
The ability to grow our business is impacted by our continued ability to enter into contracts with new venue partners, which is partially impacted by the continued trend of venues electing to outsource event technology services and bring third-party providers on-site to manage event technology services directly with customers.
60
Table of Contents
Our Segments
We operate our business through two segments: Domestic and International. They are organized based on the geographic location of the operations and both segments provide event technology services.
| • | Domestic: Operates in the United States and Puerto Rico and is the preferred provider of event technology services to customers at over 1,000 venues in the geographies. |
| • | International: Operates in Canada, Mexico, the Caribbean, Europe and the Middle East, in addition to providing non-venue based services in Asia, where we are the preferred provider of event technology services to customers in nearly 300 venues. |
These segments are based on the geographic markets we serve, our management structure and the financial information that is reviewed by the chief operating decision maker in deciding how to allocate resources and assess performance.
| Twelve Months Ended December 31, 2014 |
Six Months Ended June 30, 2014 |
|||||||||||||||||||||||||||||||
| Predecessor | Predecessor | Successor | Predecessor | Successor | Successor | |||||||||||||||||||||||||||
| Year Ended December 31, |
January 1, through January 24, 2014 |
January 25, through December 31, 2014 |
January 1, through January 24, 2014 |
January 25, through June 30, 2014 |
Six Months Ended June 30, 2015 |
|||||||||||||||||||||||||||
| 2012 | 2013 | |||||||||||||||||||||||||||||||
| (in thousands) | ||||||||||||||||||||||||||||||||
| Domestic: |
||||||||||||||||||||||||||||||||
| Revenue |
$ | 631,105 | $ | 991,682 | $ | 70,240 | $ | 1,087,737 | $ | 70,240 | $ | 549,635 | $ | 731,524 | ||||||||||||||||||
| Adjusted EBITDA |
62,933 | 118,618 | 7,280 | 138,594 | 7,280 | 86,344 | 106,435 | |||||||||||||||||||||||||
| International: |
||||||||||||||||||||||||||||||||
| Revenue |
93,743 | 104,692 | 5,382 | 100,546 | 5,382 | 49,908 | 60,464 | |||||||||||||||||||||||||
| Adjusted EBITDA |
9,534 | 11,763 | 612 | 10,453 | 612 | 6,120 | 6,883 | |||||||||||||||||||||||||
How We Evaluate Our Business
In addition to revenue, our management uses a variety of financial and operational metrics to analyze our performance.
We evaluate the performance of each segment and the performance of our business as a whole based on revenue, same venue revenue growth, gross profit and gross profit margin, Adjusted EBITDA and Adjusted EBITDA Margin and venue count. We view these metrics as important factors in evaluating our profitability and growth, and we review these measurements frequently to analyze trends and make decisions.
Same Venue Revenue Growth
We calculate the revenue of our venues on a comparable basis versus the prior period in order to help measure our performance excluding the impact of new venues and acquisitions as well as to help benchmark our performance against Group RevPAR growth. We define same venues as locations where we have been the exclusive on-site provider for at least 13 months. A new location or a location from an acquisition is not included in same venue revenue until the 13th month post-opening or acquisition. Locations that are closed (either permanently due to the venue closing or loss of the contract or for three or more months for renovations) are removed from same venue revenue from the month of closure (and the corresponding period of the prior year). Revenue from non-venue based services is not included in this metric.
61
Table of Contents
Gross Profit and Gross Profit Margin
Gross profit (revenue less cost of revenue) and gross profit margin (gross profit as a percentage of revenue) are impacted by a number of factors, including those noted below for revenue and cost of revenue as well as mix of services provided during the period.
Adjusted EBITDA and Adjusted EBITDA Margin
We define EBITDA as net income (loss) before interest expense, income tax expense, depreciation and amortization. We define Adjusted EBITDA as net income (loss) before interest expense, income taxes, depreciation, amortization of intangibles, transaction-related expenses, long-term incentive plan payments, gain or loss on disposal of assets, gains or losses on foreign currency transactions, changes in the fair value of our interest rate caps, amortization of venue incentives, including the one-time expense impact of certain venue incentive payments for which deferred expense recognition is not applicable under U.S. GAAP, management fees paid to our Sponsors, equity-based compensation expense, executive severance and other one-time or non-recurring costs. We define Adjusted EBITDA Margin as Adjusted EBITDA as a percentage of revenue. Management believes Adjusted EBITDA and Adjusted EBITDA Margin are useful because they allow management to more effectively evaluate our operating performance and compare the results of our operations from period to period without regard to our financing methods or capital structure. For a reconciliation of Adjusted EBITDA to net income (loss), the most directly comparable GAAP measure, see “Summary—Summary Consolidated Historical Financial and Other Data” and “Selected Historical Consolidated Financial Data.”
Venue Count
We define venues as locations where we are contracted to provide event technology services (including locations where the contract has lapsed but we continue to provide services). Management believes venue count is a useful measure of our ability to maintain our existing revenue base and continue to grow our revenue by expanding the venues at which we provide event technology services to our customers.
Our Recent Acquisitions
Acquisition of Swank
On November 9, 2012, we acquired 100% of the stock of Swank for an aggregate purchase price of $275.4 million. Swank was a premier provider of event technology services, primarily through exclusive on-site venues in the United States. The Swank acquisition allowed us to enhance our market leadership position, strengthen and broaden our strategic relationships with leading venue clients while realizing significant synergies from the consolidation of operations.
Acquisition of Visual Aids Electronics Corp. (“VAE”)
On November 7, 2013, we acquired 100% of the stock of VAE for $40.9 million. VAE was a provider of event technology services, including communication systems, primarily through exclusive on-site venues in the United States. The acquisition of VAE added to our portfolio of operating locations and enabled us to provide greater service coverage for venue partners and customers. VAE was headquartered in Germantown, Maryland, with operations in 24 states.
62
Table of Contents
Acquisition of American Audio Visual Center Inc. (“AAVC”)
On January 14, 2015, we acquired 100% of the stock of AAVC for $30.7 million comprised of cash and contingent consideration. AAVC is a premier provider of event technology services, primarily at exclusive on-site venues in the United States, with a small presence in the Caribbean and Canada, and is based in Scottsdale, Arizona.
Acquisition of AVC Live Limited (“AVC Live”)
On April 14, 2015, we acquired 100% of the stock of AVC Live for $20.6 million comprised of cash, Class A Units of PSAV Holdings LLC valued at $1.5 million and contingent consideration. AVC Live is based near London, England and is a premier provider of event technology services at 38 venues in the United Kingdom and to customers executing events outside of those venues. AVC Live also provides off-site client direct presentation services. The acquisition increased our property portfolio in the United Kingdom.
Basis of Presentation
The Sponsors Acquisition was accounted for as a business combination in accordance with Financial Accounting Standards Board (“FASB”) Accounting Standards Codification (“ASC”) Topic 805, Business Combinations.
The accompanying consolidated financial statements are presented as “Predecessor” or “Successor” to indicate whether they are related to the period preceding the Sponsors Acquisition or the period succeeding the Sponsors Acquisition, respectively. The periods from January 1, 2012 through January 24, 2014 represent the financial statements of AVSC Holding Corp., and are referred to as the “Predecessor Periods.” The periods from January 25, 2014, the date of the Sponsors Acquisition, through June 30, 2015 represent the financial statements of PSAV Holdings LLC and are referred to as the “Successor Periods.” The period from January 1, 2014 through January 24, 2014 is referred to as the “2014 Predecessor Period”; the period from January 25, 2014 through December 31, 2014 is referred to as the “2014 Successor Period”; and the period from January 25, 2014 through June 30, 2014 is referred to as the “2014 Interim Successor Period.”
We conduct our business through PSAV Holdings LLC, a Delaware limited liability company, and its subsidiaries. Immediately prior to the consummation of this offering, the following corporate reorganization steps will occur:
| • | PSAV, Inc., our wholly-owned subsidiary formed to be the issuer in this offering, will form a new limited liability company, PSAV Intermediate LLC, as a wholly-owned subsidiary; |
| • | PSAV Intermediate Corp. will merge with and into PSAV Intermediate LLC, with PSAV Intermediate LLC surviving, and in the merger shares of PSAV Intermediate Corp. will be cancelled and PSAV Holdings LLC will receive 100% of the stock of PSAV, Inc.; and |
| • | PSAV Holdings LLC will liquidate and distribute shares of PSAV, Inc. common stock to holders of Class A Units in PSAV Holdings LLC. |
The corporate reorganization will not materially affect our operations, which we will continue to conduct through our operating subsidiaries, and will not materially change the basis of presentation of our financial results.
63
Table of Contents
Factors Affecting the Comparability of Our Results of Operations
As a result of a number of factors, our results of operations for the Predecessor Periods are not comparable to the Successor Periods, the results of our operations within each of the Predecessor and Successor Periods may not be comparable from period to period, and our historical results of operations may not be comparable to our results of operations in future periods. Set forth below is a brief discussion of the key factors impacting the comparability of our results of operations.
Historical Acquisitions
| • | Our historical results do not reflect all of our acquisitions – Our results of operations only include the results of operations from our acquisitions from the date of such acquisition. Accordingly, the timing of acquisitions impacts our results of operations for such periods. |
| • | Acquisition-related costs – In connection with each of the historical acquisitions, we incurred acquisition-related expenses necessary to close the transaction, principally professional fees for legal and financial diligence work, investment banking fees, and sponsor fees. We incurred $1.0 million of acquisition-related expenses as part of the acquisition of AVC Live, which are included in our results in the six months ended June 30, 2015. We incurred $1.2 million of acquisition-related expenses as part of the acquisition of AAVC, which are included in our results for the 2014 Successor Period. Acquisition-related costs of $3.1 million, $14.2 million and $17.8 million related to the Sponsors Acquisition are included in our results of operations in the year ended December 31, 2013, the 2014 Predecessor Period and the 2014 Successor Period, respectively. Acquisition-related expenses related to the acquisition of VAE of $0.3 million are included in our results of operations in the year ended December 31, 2013. Acquisition-related expenses related to the acquisition of Swank of $1.7 million are included in our results of operations in the year ended December 31, 2012. |
| • | Other transaction and integration costs – In addition to the costs to close each of our historical acquisitions, there have been additional costs related to integrating those acquisitions into our business, including system integration, training, severance, relocation, consulting, facility closure and other integration costs as well as other costs triggered by certain acquisitions such as incentive compensation costs and use of outside experts for purchase accounting valuations. In the year ended December 31, 2012 and in the 2014 Pro Forma Combined Period (as defined under “—Results of Operations”), we incurred $6.9 million and $18.1 million related to long-term incentive plan payments triggered by the Swank acquisition and Sponsors Acquisition, respectively. |
| • | Increased interest expense – We financed the Sponsors Acquisition as well as the acquisitions of AAVC and Swank partially with new debt. Additionally, in May 2015 we used the proceeds from incremental borrowings under our credit facilities to pay a distribution to unitholders of PSAV Holdings LLC. Our interest expense has increased as a result of the additional indebtedness. |
| • | Increased depreciation and amortization expense – Each of the historical acquisitions was accounted for as a business combination, whereby the acquired assets and assumed liabilities were measured and reported in the consolidated financial statements at fair value. As a result, we significantly increased the recorded value of property and equipment and intangible assets, which has significantly increased our depreciation and amortization expense. |
| • | Income taxes – In connection with each of the historical transactions, significant book and tax differences were accounted for in deferred taxes. |
64
Table of Contents
Seasonality
Our business is subject to seasonal fluctuations. Historically, operating results have been strongest in the second quarter (approximately 28% of full year revenue) and lowest during the third quarter (approximately 21% of full year revenue) due to the slower summer meeting seasons, with the balance of revenue split equally between the first and fourth quarters. A significant portion of the expenses we incur, such as venue commissions, sub-rental and some of our labor costs, are directly related to the number of events that occur in a given period and therefore vary with revenue. However, certain of our other expenses, such as interest payments, facilities costs and certain personnel-related costs, are fixed and cannot be easily reduced during a seasonal slowdown. Consequently, our net income is generally higher in the second quarter of each year than in other quarters, and we typically operate at a net loss during the third quarter.
Interest Rate Fluctuations
Our indebtedness contains variable interest rate provisions. As a result, our interest expense may vary from period to period due to variations in prevailing interest rates. Since April 2014, we have maintained two interest rate caps covering a portion of our interest rate exposure. The caps are not designated as hedges and as a result changes in the fair value of the interest rate caps flow through other income/expense creating additional variability.
Foreign Currency Fluctuations
As a result of our global operations, we generate a portion of our revenue and incur a portion of our expenses in currencies other than the U.S. dollar. As a result, our revenue, cost of revenue, operating expenses and certain assets, liabilities and commitments fluctuate as the value of such currencies fluctuate in relation to the U.S. dollar and changes in currency exchange rates may impact our results of operations. In addition, the results of operations of some of our operating entities are reported in currencies other than the U.S. dollar and then translated into U.S. dollars at the applicable exchange rate for inclusion in our financial statements. As a result, appreciation of the U.S. dollar against these other currencies generally will have a negative impact on our reported revenue and profits while depreciation of the U.S. dollar against these other currencies will generally have a positive effect on reported revenue and profits. We do not enter into foreign currency exchange contracts to mitigate this risk. Unless otherwise indicated the effect of foreign currency translation on the period to period comparisons presented below are not material.
Equity-Based Compensation
The PSAV Holdings LLC 2014 Management Incentive Plan and the PSAV Holdings LLC Phantom Unit Appreciation Plan provide management with an incentive to contribute to and participate in our success. Under these plans, we are authorized to issue, in the aggregate, 29,938 profits interests in the form of Class B Units and Phantom Units. We have issued Class B Service Units, Class B Performance Units, Phantom Service Units and Phantom Performance Units. Generally, Class B Service Units vest ratably over five years. Class B Performance Units will vest upon a distribution event exceeding certain threshold amounts and the achievement of a targeted multiple of invested capital. We account for the Class B Units as equity-based awards and the Phantom Units as a contingent bonus; therefore, the Phantom Units are not within the scope of ASC Topic 718.
65
Table of Contents
How We Generate Revenue
We generate revenue primarily by providing event technology services, which can include audiovisual services, audiovisual equipment rental, staging and meeting services and event related communications systems as well as related technical support, to our customers. We primarily provide these services in venues, including hotels and convention centers, which we have contracted with to be the exclusive on-site provider of event technology services. Our customers, including corporations, event organizers, trade associations and meeting planners, hire us primarily through our on-site presence at those venues to plan and execute their events. We also provide event technology services to certain customers at other locations where we do not have a contractual relationship. Our revenue is impacted by the mix of event technology services (i.e., number or types of pieces of equipment and level of technical support) demanded by our customers.
We enter into long-term contracts (typically three to six years) with venues to be the exclusive on-site provider of audiovisual and event technology services. We also sign MSAs with top hotel chains (including four of the five largest U.S. hotel companies) naming us as a preferred event technology services provider for each of the venues in a given hotel chain. Each local venue then executes an individual contract if it elects to partner with us.
As the exclusive on-site provider, we provide staff (including a director of event technology, audiovisual equipment technicians and sales staff) and equipment located on-site at the venue. Our employees meet with guests that are holding events at the venue to determine the scope of services required for the event and provide a quote for the agreed upon scope. We execute written agreements with the event organizer based on the agreed upon scope of services for their event. Our employees set up all equipment and provide services throughout the course of the event.
The Costs of Conducting Our Business
Cost of Revenue
Cost of revenue principally includes commissions paid to venues, direct labor costs, the cost of equipment sub-rentals, depreciation of equipment, amortization of venue incentives, as well as other costs such as supplies, freight, travel and other overhead from our venue and customer facing operations and any losses on equipment disposal. For the 2014 Successor Period, venue commissions, direct labor costs, cost of equipment sub-rentals, depreciation of operating equipment and amortization of venue incentives were 38.8%, 30.8%, 4.5%, 3.8% and 0.7%, respectively, as a percent of revenue.
We pay commissions to our venue partners from revenue generated from our customers within the respective venue. The commission is typically based on a percentage of revenue that is established in our contract with the venue. Commission rates typically vary by the different types of venues and event technology services, and our overall commission expense is impacted accordingly. We may reduce the commission rates upon mutual agreement or set formulas to reflect discounts we give to a particular customer. Under certain contracts with our venue partners, minimum commission rates or amounts may apply. We are generally the only event technology provider that is permitted to pay a commission to that venue. We believe this commission aligns the incentives of our venue partners with our own as we both seek to maximize revenue.
Our direct labor costs are comprised of the wages of our workforce that is directly associated with providing services to our customers. Approximately 40% of our labor costs are for fixed salaries with the balance for variable expenses, including hourly employees and outside labor. Direct labor costs
66
Table of Contents
also include associated benefits, payroll taxes and workers compensation insurance. Less than 10% of our direct labor costs are associated with unionized labor. Labor costs are impacted by our ability to efficiently staff events, market wage conditions, our union agreements and by the costs of benefits and insurance.
Equipment sub-rental includes our cost to rent equipment required to deliver services to our customers. While we own most of the equipment used to provide our services, we rent equipment in situations where we either do not own the required equipment (usually more specialized equipment) or where our owned equipment is being used for other events. Our equipment sub-rental costs are impacted by our ability to maximize the utilization of owned equipment as well as the pricing we are able to obtain from providers of rental equipment. We maintain a network of 44 branch warehouses in key markets to help maximize our equipment utilization.
Depreciation included in cost of revenue includes the depreciation on equipment used in providing services to our customers. We depreciate our equipment on a straight-line basis over the useful life of the equipment, which ranges from three to five years.
We defer certain up-front incentive payments, and the estimated costs of capital equipment provided to venues and/or installation services obligations incurred in connection with signing or renewing venue contracts (collectively referred to as venue incentives), which generally provide us with the right to be the exclusive on-site provider of event technology services at the venue. The venue incentive payments are deferred on our financial statements. The venue incentive payments are amortized over the life of the contract, typically three to six years. The venue incentives are refundable to us, on a pro rata basis, in the rare event the venue cancels the exclusivity arrangement before the end of the contract period.
Other cost of revenue includes supplies, freight, travel and other overhead from our venue and customer facing operations such as rent, utilities, telecom, repairs and maintenance, property taxes and credit card processing fees.
Selling, General and Administrative Expenses
Selling, general and administrative (“SG&A”) expenses consist of salary and benefits of our sales, marketing, management and administrative personnel, travel costs for the same personnel, professional fees, corporate level rent and other occupancy costs, equity-based compensation expense and certain insurance costs. After the consummation of this offering, we expect to incur significant additional expenses in connection with being a public company that we have previously not incurred, including compliance with the Sarbanes-Oxley Act and the Securities Exchange Act of 1934, as amended (the “Exchange Act”), increased investor relations functions, stock exchange fees, registrar and transfer agent fees, incremental audit fees, incremental director and officer liability insurance costs and director and officer compensation. In conjunction with this offering and in future periods, we expect to issue long-term equity incentive awards in the form of restricted stock or stock options to our directors, officers, key employees and consultants. The result will be an increase in our selling, general and administrative expenses in future periods as the grant-date value of the awards are recognized as an expense over the vesting term of the awards.
Acquisition-Related Expenses
Acquisition-related expenses consist of direct expenses necessary to close the transaction, principally professional fees for legal and financial diligence work, investment banking fees and sponsor fees. The acquisition-related expenses include costs related to both completed acquisitions and acquisitions that we did not consummate but do not include costs incurred post-closing related to integration and related activity.
67
Table of Contents
Other Expense, Net
Other expense, net primarily consists of foreign currency translation gains and losses and gains and losses attributable to the changes in fair value of our interest rate caps.
Interest Expense, Net
Interest expense, net primarily consists of interest on borrowings and the amortization of costs incurred to obtain long-term financing. Our interest income has been de minimis.
Income Tax Expense (Benefit)
We are currently organized as a limited liability company, which is a pass-through entity for federal and state income tax purposes. However, we conduct our business through subsidiaries that are subject to income taxes. Income tax expense (benefit) consists of federal, state and local taxes based on income in multiple jurisdictions. Our income tax expense is impacted by the pre-tax earnings in jurisdictions with varying tax rates. Our current and future provision for income taxes will vary from statutory rates due to the impact of valuation allowances in certain countries, income and certain non-deductible expenses. Furthermore, as a result of the Sponsors Acquisition and other acquisitions, we have significant book and tax accounting differences that impact the amount of deferred taxes.
68
Table of Contents
Results of Operations
The following table sets forth our results of operations for the periods presented. Our consolidated financial statements will not be directly comparable to the consolidated financial statements of the Predecessor due to the effects of the Sponsors Acquisition in January 2014. For purposes of the revenue, SG&A expenses and Adjusted EBITDA discussions, we compared the year ended December 31, 2013 to the combined Predecessor period from January 1, 2014 through January 24, 2014 and Successor period from January 25, 2014 through December 31, 2014 adjusted to give effect to the Sponsors Acquisition (“2014 Pro Forma Combined Period”). We also compared the six months ended June 30, 2015 to the combined Predecessor period from January 1, 2014 through January 24, 2014 and Successor period from January 25, 2014 through June 30, 2014 adjusted to give effect to the adjustments in the “Sponsors Acquisition Adjustments” column in the Unaudited Pro Forma Condensed Consolidated Financial Statements” (“2014 Interim Pro Forma Combined Period”). We believe this comparison assists readers in understanding and assessing the trends and significant changes in our results of operations and provides a more meaningful method of comparison in those categories. See “Unaudited Pro Forma Condensed Consolidated Financial Statements.” We compare the other categories within results of operations separately for the Predecessor and Successor periods, as these categories are not comparable for the periods before and after the Sponsors Acquisition due to changes in depreciation, amortization and incentive amortization caused by the change in the carrying value of our assets resulting from the Sponsors Acquisition.
| Twelve Months Ended December 31, 2014 |
Six Months Ended June 30, 2014 |
|||||||||||||||||||||||||||||||||||||||
| Predecessor | Successor | Predecessor | Successor | Successor | ||||||||||||||||||||||||||||||||||||
| Year Ended December 31, |
January 1, through January 24, 2014 |
January 25, through December 31, 2014 |
Twelve Months Ended December 31, 2014 Pro Forma |
January 1, through January 24, 2014 |
January 25, through June 30, 2014 |
Six Months Ended June 30, 2014 Pro Forma |
Six Months Ended June 30, 2015 |
|||||||||||||||||||||||||||||||||
| 2012 | 2013 | |||||||||||||||||||||||||||||||||||||||
| 2014 Predecessor Period |
2014 Successor Period |
2014 Pro Forma Combined Period (unaudited) |
2014 Predecessor Period |
2014 Interim Successor Period (unaudited) |
2014 Interim Pro Forma Combined Period (unaudited) |
(unaudited) | ||||||||||||||||||||||||||||||||||
| (dollars in thousands) | ||||||||||||||||||||||||||||||||||||||||
| Statement of Operations Data: |
||||||||||||||||||||||||||||||||||||||||
| Revenue |
$ | 724,848 | $ | 1,096,374 | $ | 75,622 | $ | 1,188,283 | $ | 1,263,905 | $ | 75,622 | $ | 599,543 | $ | 675,165 | $ | 791,988 | ||||||||||||||||||||||
| Cost of revenue |
(625,535 | ) | (929,871 | ) | (63,684 | ) | (1,012,548 | ) | (1,077,418 | ) | (63,684 | ) | (495,341 | ) | (560,211 | ) | (657,031 | ) | ||||||||||||||||||||||
|
|
|
|
|
|
|
|
|
|
|
|
|
|
|
|
|
|
|
|||||||||||||||||||||||
| Gross profit |
99,313 | 166,503 | 11,938 | 175,735 | 186,487 | 11,938 | 104,202 | 114,954 | 134,957 | |||||||||||||||||||||||||||||||
| Gross profit margin |
13.7 | % | 15.2 | % | 15.8 | % | 14.8 | % | 14.8 | % | 15.8 | % | 17.4 | % | 17.0 | % | 17.0 | % | ||||||||||||||||||||||
| Operating expenses: |
||||||||||||||||||||||||||||||||||||||||
| Selling, general, and administrative expenses |
71,300 | 92,781 | 30,448 | 96,657 | 103,677 | 30,448 | 45,286 | 52,306 | 67,291 | |||||||||||||||||||||||||||||||
| Acquisition-related expenses |
1,668 | 3,316 | 14,160 | 18,977 | 1,226 | 14,160 | 17,774 | 23 | 1,049 | |||||||||||||||||||||||||||||||
| Depreciation |
2,767 | 3,917 | 340 | 3,740 | 4,080 | 340 | 1,703 | 2,043 | 2,449 | |||||||||||||||||||||||||||||||
| Amortization of intangibles |
5,071 | 12,491 | 950 | 22,606 | 24,217 | 950 | 10,514 | 12,125 | 13,188 | |||||||||||||||||||||||||||||||
|
|
|
|
|
|
|
|
|
|
|
|
|
|
|
|
|
|
|
|||||||||||||||||||||||
| Total operating expenses |
80,806 | 112,505 | 45,898 | 141,980 | 133,200 | 45,898 | 75,277 | 66,498 | 83,977 | |||||||||||||||||||||||||||||||
|
|
|
|
|
|
|
|
|
|
|
|
|
|
|
|
|
|
|
|||||||||||||||||||||||
| Income (loss) from operations |
18,507 | 53,998 | (33,960 | ) | 33,755 | 53,287 | (33,960 | ) | 28,925 | 48,457 | 50,980 | |||||||||||||||||||||||||||||
| Other income (expense), net |
1,308 | 1,278 | 366 | (3,892 | ) | (3,526 | ) | 366 | (767 | ) | (401 | ) | (1,873 | ) | ||||||||||||||||||||||||||
| Interest expense, net |
(20,011 | ) | (40,700 | ) | (2,830 | ) | (40,536 | ) | (42,894 | ) | (2,830 | ) | (18,737 | ) | (21,095 | ) | (23,569 | ) | ||||||||||||||||||||||
|
|
|
|
|
|
|
|
|
|
|
|
|
|
|
|
|
|
|
|||||||||||||||||||||||
| Income (loss) before tax (expense) benefit |
(196 | ) | 14,576 | (36,424 | ) | (10,673 | ) | 6,867 | (36,424 | ) | 9,421 | 26,961 | 25,538 | |||||||||||||||||||||||||||
| Income tax (expense) benefit |
9,899 | 3,020 | 10,503 | 107 | (8,277 | ) | 10,503 | (8,556 | ) | (16,940 | ) | (10,405 | ) | |||||||||||||||||||||||||||
|
|
|
|
|
|
|
|
|
|
|
|
|
|
|
|
|
|
|
|||||||||||||||||||||||
| Net income |
$ | 9,703 | $ | 17,596 | $ | (25,921 | ) | $ | (10,566 | ) | $ | (1,410 | ) | $ | (25,921 | ) | $ | 865 | $ | 10,020 | $ | 15,133 | ||||||||||||||||||
|
|
|
|
|
|
|
|
|
|
|
|
|
|
|
|
|
|
|
|||||||||||||||||||||||
| Other Financial Data (unaudited): |
||||||||||||||||||||||||||||||||||||||||
| Adjusted EBITDA |
$ | 72,467 | $ | 130,381 | $ | 7,892 | $ | 149,047 | $ | 156,939 | $ | 7,892 | $ | 92,464 | $ | 100,356 | $ | 113,318 | ||||||||||||||||||||||
| Adjusted EBITDA margin |
10.0 | % | 11.9 | % | 10.4 | % | 12.5 | % | 12.4 | % | 10.4 | % | 15.4 | % | 14.9 | % | 14.3 | % | ||||||||||||||||||||||
| Venue count |
1,181 | 1,243 | 1,243 | 1,216 | 1,216 | 1,243 | 1,224 | 1,224 | 1,318 | |||||||||||||||||||||||||||||||
69
Table of Contents
Six Months Ended June 30, 2015 Compared to Six Months Ended June 30, 2014
As noted above, we make use of 2014 Interim Pro Forma Combined Period financial statements in comparing our results to the six months ended June 30, 2015. The following key points highlight our results on a pro forma basis:
| • | 17.3% increase in revenue from the 2014 Interim Pro Forma Combined Period to the six months ended June 30, 2015, driven approximately 53% by organic growth, including 10.4% Domestic same venue revenue growth, with 47% coming from the acquisitions of AAVC and AVC Live in 2015; |
| • | 12.9% increase in Adjusted EBITDA from $100.4 million in the 2014 Interim Pro Forma Combined Period to $113.3 million in the six months ended June 30, 2015, with Adjusted EBITDA margin declining slightly from 14.9% to 14.3%, respectively, on strong revenue growth partially offset by higher commissions on significant venue contract renewals; |
| • | Net income increased from $10.1 million to $15.1 million due to same factors as noted for Adjusted EBITDA; and |
| • | Venue count increased by 7.7% from 1,224 to 1,318, largely driven by the acquisitions of AAVC and AVC Live. |
Revenue
Revenue increased $116.8 million, or 17.3%, from $675.2 million for the 2014 Interim Pro Forma Combined Period to $792.0 million for the six months ended June 30, 2015. Of the increase, $111.7 million was from the Domestic segment, which grew 18.0% from $619.9 million for the 2014 Interim Pro Forma Combined Period to $731.5 million for the six months ended June 30, 2015. The increase in the Domestic segment was due to $56.6 million (10.4%) same venue revenue growth, $49.8 million in growth at venues from the acquisition of AAVC in January 2015, $8.4 million of growth from net new venues ($17.1 million in revenue from new venues less $8.6 million in lost revenue from closed venues) and a $3.2 million decline in other revenue primarily from declines in events executed outside of our venues. The growth in same venue revenue was driven by an increase in revenue per event with a slight decline in the number of events. The increase in revenue per event was driven by customers holding more complex events requiring more event technology services, the mix of event technology services provided and our ability to charge more for our services. The 10.4% same venue revenue growth was favorable compared to an increase of 5.7% in Group RevPAR, which is consistent with our historical outperformance of Group RevPAR over the last six years. The outperformance to Group RevPAR was driven by our continued ability to grow average spend per event and capture more revenue through the growth of specialty services. The remaining $5.2 million revenue increase resulted from 9.4% growth in our International segment from $55.3 million to $60.5 million. $5.5 million of the growth relates to the impact of the AAVC and AVC Live acquisitions with the offsetting $0.3 million decline coming from existing operations with growth in Mexico offset by declines in Canada and Europe largely due to strengthening of the U.S. dollar versus the Canadian dollar and the euro.
70
Table of Contents
Cost of Revenue and Gross Profit Margin
| Six Months Ended June 30, 2014 |
||||||||||||||
| Predecessor |
|
Successor | Successor | |||||||||||
| January 1, through January 24, 2014 |
|
January 25, through June 30, 2014 |
Six Months Ended June 30, 2015 |
|||||||||||
| (dollars in thousands) | ||||||||||||||
| Revenue |
$ | 75,622 | $ | 599,543 | $ | 791,988 | ||||||||
| Cost of revenue |
||||||||||||||
| Commissions |
(29,756 | ) | (230,919 | ) | (314,573 | ) | ||||||||
| Labor |
(25,111 | ) | (173,214 | ) | (228,751 | ) | ||||||||
| Equipment sub-rental |
(2,318 | ) | (27,322 | ) | (37,866 | ) | ||||||||
| Depreciation |
(1,932 | ) | (20,849 | ) | (26,782 | ) | ||||||||
| Amortization of incentive payments |
(705 | ) | (5,489 | ) | (3,449 | ) | ||||||||
| Other |
(3,862 | ) | (37,548 | ) | (45,610 | ) | ||||||||
|
|
|
|
|
|
|
|
||||||||
| Total cost of revenue |
(63,684 | ) | (495,341 | ) | (657,031 | ) | ||||||||
|
|
|
|
|
|
|
|
||||||||
| Gross profit |
$ | 11,938 | $ | 104,202 | $ | 134,957 | ||||||||
|
|
|
|
|
|
|
|
||||||||
| Gross profit margin |
15.8 | % | 17.4 | % | 17.0 | % | ||||||||
The gross profit margin percentage increased from 15.8% for the 2014 Predecessor Period to 17.4% for the 2014 Interim Successor Period. As previously noted, the 24 day period in January 2014 is not comparable to the remainder of the year due to seasonal fluctuations.
The gross profit margin percentage decreased from 17.4% for the 2014 Interim Successor Period to 17.0% for six months ended June 30, 2015, due to an increase in venue commission costs from new contract renewals and a slight increase in equipment sub-rental costs, partially offset by declines in labor and other costs of revenue, all as a percentage of revenue.
The gross profit margin for our Domestic segment decreased from 17.6% for the 2014 Interim Successor Period to 17.1% for the six months ended June 30, 2015, on similar factors as noted for the consolidated results. The gross profit margin for our International segment increased from 14.7% to 15.7% over the same period, primarily driven by declines in commission expense due to business mix, partially offset by increases in labor and sub-rental costs, all as a percentage of revenue.
Selling, General and Administrative Expenses
SG&A expenses were $52.3 million, or 7.7% of revenue, for the 2014 Interim Pro Forma Combined Period and $67.3 million, or 8.5% of revenue, for the six months ended June 30, 2015. SG&A expenses for the Domestic segment increased from $46.2 million to $60.4 million while SG&A expenses for the International segment increased from $6.1 million to $6.9 million. The absolute increase in SG&A expenses for the Domestic segment is the result of the increase in revenue and some non-recurring costs associated with implementing various strategic initiatives and filling certain management positions on an interim basis for a period of time after the Sponsors Acquisition, with the increase in SG&A expenses for the International segment in line with the growth of the business.
Acquisition-Related Expenses
Acquisition-related expenses were $14.2 million, $17.8 million and $1.1 million for the 2014 Predecessor Period, the 2014 Interim Successor Period and the six months ended June 30, 2015, respectively. Acquisition-related costs for the 2014 Predecessor Period primarily related to seller
71
Table of Contents
expenses related to the Sponsors Acquisition. Acquisition-related costs for the 2014 Interim Successor Period primarily related to buyer expenses related to the Sponsors Acquisition. Acquisition-related costs for the six months ended June 30, 2015 related to the acquisition of AVC Live.
Depreciation
Depreciation (excluding depreciation reported in Cost of Revenue), as a percentage of revenue was consistent at 0.4%, 0.3% and 0.3% for the 2014 Predecessor Period, the 2014 Interim Successor Period and the six months ended June 30, 2015, respectively.
Amortization of Intangibles
Amortization of intangibles was $1.0 million, $10.5 million and $13.2 million for the 2014 Predecessor Period, the 2014 Interim Successor Period and the six months ended June 30, 2015, respectively. The increase from $1.0 million for the 2014 Predecessor Period to $10.5 million for the 2014 Interim Successor Period beyond that to be expected as a result of a longer period of time covered was primarily the result of the write-up of the value of intangible assets as part of the accounting for the Sponsors Acquisition. The increase in amortization of intangibles in the six months ended June 30, 2015 is a result of new intangible assets arising from the acquisition of AAVC and AVC Live.
Interest Expense
Interest expense was $2.8 million, $18.7 million and $23.6 million for the 2014 Predecessor Period, the 2014 Interim Successor Period and the six months ended June 30, 2015, respectively, and reflects the new debt structure put into place on January 24, 2014 in connection with the Sponsors Acquisition. The increase in interest expense during the six months ended June 30, 2015 is a result of additional debt added in January 2015 and May 2015 of $35 million and $180 million, respectively ($208.0 million combined, net of original issue discount and deferred financing fees), as described in “—Factors Affecting the Comparability of Our Results of Operations” above.
Income Taxes
Our income tax benefit was $10.5 million for the 2014 Predecessor Period. Our income tax expense was $8.6 million and $10.4 million for the 2014 Interim Successor Period and the six months ended June 30, 2015. Our effective income tax rate was 28.8%, 90.8% and 40.7% for the 2014 Predecessor Period, the 2014 Interim Successor Period and the six months ended June 30, 2015. The rates differ from the U.S. federal statutory rate due to state income taxes (net of federal benefit), the impact of non-deductible expenses (including disallowed transaction costs and meals and entertainment expenses) and the increase of valuation allowance for foreign net operating losses (“NOLs”). The 90.8% effective tax rate in the 2014 Interim Successor Period was largely driven by discrete items related to the Sponsors Acquisition in this period.
Net Income
Net income was a loss of $(25.9) million for the 2014 Predecessor Period, $0.9 million for the 2014 Interim Successor Period, and $15.1 million for the six months ended June 30, 2015, primarily due to the factors discussed above.
Adjusted EBITDA and Adjusted EBITDA Margin
For purposes of the discussion of Adjusted EBITDA, we compared the Adjusted EBITDA for the six months ended June 30, 2015 to the Adjusted EBITDA for the 2014 Interim Pro Forma Combined
72
Table of Contents
Period. When considering the effects of the Sponsors Acquisition, the Adjusted EBITDA for the 2014 Interim Pro Forma Combined Period is equal to the sum of the Adjusted EBITDA for the 2014 Predecessor Period and the 2014 Interim Successor Period. We believe the comparison to Adjusted EBITDA assists readers in understanding and assessing the trends and significant changes in our Adjusted EBITDA and provides a more meaningful method of comparison. See “Unaudited Pro Forma Condensed Consolidated Financial Statements.”
Adjusted EBITDA increased $12.9 million from $100.4 million for the 2014 Interim Successor Period to $113.3 million for the six months ended June 30, 2015, with Adjusted EBITDA margin declining from 14.9% to 14.3%, respectively. Within our segments, Adjusted EBITDA in the Domestic segment increased $12.8 million, or 13.7%, from $93.6 million for the 2014 Interim Pro Forma Period to $106.4 million for the six months ended June 30, 2015, with Adjusted EBITDA margin decreasing from 15.1% to 14.6%, respectively. Of the increase in Adjusted EBITDA, $16.9 million was due to higher revenue offset by $4.1 million decline resulted from margin pressure from higher commission costs and higher SG&A driven by investment in infrastructure, partially offset by declines in labor costs from continued efficiencies in handling higher revenue, all as a percentage of revenue.
Adjusted EBITDA in the International segment increased $0.2 million, or 2.2%, from $6.7 million for the 2014 Interim Pro Forma Combined Period to $6.9 million for the six months ended June 30, 2015, with Adjusted EBITDA margin decreasing from 12.2% to 11.4%, respectively. Of the increase in Adjusted EBITDA, $0.6 million was due to higher revenue offset by $0.5 million from a decline in gross profit margin and increase in SG&A.
Year Ended December 31, 2014 Compared to Year Ended December 31, 2013 (Predecessor)
As noted above, we make use of the 2014 Pro Forma Combined Period financial statements in comparing our results to the year ended December 31, 2013. The following key points highlight our results on a pro forma basis:
| • | 15.3% increase in revenue from 2013 to the 2014 Pro Forma Combined Period is driven primarily by 11.9% organic growth, including 14.5% Domestic same venue revenue growth, with 3.4% coming from the acquisition of VAE; |
| • | 20.4% increase in Adjusted EBITDA from $130.4 million in 2013 to $156.9 million in the 2014 Pro Forma Combined Period with Adjusted EBITDA margin increasing from 11.9% to 12.4%, respectively, on strong revenue growth and improvements in labor and sub-rental costs as a percentage of revenue; |
| • | Net income declined from $17.6 million to a loss of $(1.4) million due to in large part to the increase in amortization expense from the intangible assets arising from the Sponsors Acquisition; and |
| • | Venue count declined by 2.2% from 1,243 to 1,216 as we exited some smaller or lower profit venues following the Swank and VAE acquisitions. |
Revenue
Revenue increased $167.5 million, or 15.3%, from $1,096.4 million for the year ended December 31, 2013 to $1,263.9 million for the 2014 Pro Forma Combined Period. Of this increase, $166.3 million was from the Domestic segment, which grew 16.8% from $991.7 million in 2013 to $1,158.0 million in 2014. The increase in the Domestic segment was due to $123.2 million, or 14.5%, in same venue revenue growth, $37.5 million in growth from venues from the acquisition of VAE in November 2013, $7.7 million of growth from net new venues ($24.3 million in revenue from new venues less $16.6 million in lost revenue from closed venues) and $2.1 million decline in other revenue, largely driven by shedding lower profit margin clients executed outside of our partner venues,
73
Table of Contents
partially offset by added outside communication services revenue from the VAE acquisition. The growth in same venue revenue was driven in large part by an increase in revenue per event with modest growth in the number of events. The increase in revenue per event was driven by customers holding more complex events requiring more event technology services, the mix of event technology services provided and our ability charge more for our services. The 14.5% same venue revenue growth was favorable compared to an increase of 6.7% in Group RevPAR. The excess of our same venue revenue growth versus Group RevPAR was slightly above our average outperformance since 2010 as we were able to continue to drive additional growth from specialty services, upsell our core audiovisual services and capture a greater share of the audiovisual spend in our venues.
The remaining $1.2 million revenue increase resulted from 1.2% growth in our International segment from $104.7 million in 2013 to $105.9 million in 2014. Growth of 8.5% in Mexico and 5.3% in Europe and the Middle East, both largely driven by same venue revenue growth, were offset by a 3.6% decline in revenue in Canada, driven primarily by the loss of a nine hotel ownership group in March 2014 and the decline of the Canadian dollar in 2014 compared to 2013.
Cost of Revenue and Gross Profit Margin
| Twelve Months Ended December 31, 2014 |
||||||||||||||||
| Predecessor | Successor | |||||||||||||||
| Year Ended December 31, 2013 |
January 1, through January 24, 2014 |
January 25, through December 31, 2014 |
||||||||||||||
| (dollars in thousands) | ||||||||||||||||
| Revenue |
$ | 1,096,374 | $ | 75,622 | $ | 1,188,283 | ||||||||||
| Cost of revenue |
||||||||||||||||
| Commissions |
(412,763 | ) | (29,756 | ) | (461,310 | ) | ||||||||||
| Labor |
(350,717 | ) | (25,111 | ) | (366,516 | ) | ||||||||||
| Equipment sub-rental |
(53,504 | ) | (2,318 | ) | (53,542 | ) | ||||||||||
| Depreciation |
(31,095 | ) | (1,932 | ) | (45,604 | ) | ||||||||||
| Amortization of incentive payments |
(9,318 | ) | (705 | ) | (8,332 | ) | ||||||||||
| Other |
(72,474 | ) | (3,862 | ) | (77,244 | ) | ||||||||||
|
|
|
|
|
|
|
|||||||||||
| Total cost of revenue |
(929,871 | ) | (63,684 | ) | (1,012,548 | ) | ||||||||||
|
|
|
|
|
|
|
|||||||||||
| Gross profit |
$ | 166,503 | $ | 11,938 | $ | 175,735 | ||||||||||
|
|
|
|
|
|
|
|||||||||||
| Gross profit margin |
15.2 | % | 15.8 | % | 14.8 | % | ||||||||||
The gross profit margin percentage increased from 15.2% for the year ended December 31, 2013 to 15.8% for the 2014 Predecessor Period. This increase is primarily the result of seasonal dynamics that make comparing a single 24-day period to a full year not relevant.
The gross profit margin percentage decreased by 0.4% as a percentage of revenue from 15.2 % for the year ended December 31, 2013 to 14.8% for the 2014 Successor Period. This decrease is the result of a 1.2% increase in venue commissions as a percentage of revenue due to certain contract renewals occurring during 2014 at higher commission rates than the prior contracts, as well as a 1.0% increase in depreciation as a percentage of revenue due to the step-up in basis of the our fixed assets as a result of purchase accounting from the Sponsors Acquisition. The increases in commissions and depreciation were offset by a 1.1% decline in labor related costs as a percentage of revenue resulting from our ability to leverage fixed salaries on increased revenue while controlling variable hourly labor. Additionally, equipment sub-rental costs decreased 0.4% as a percentage of revenue as we continued efforts to maximize utilization of our owned equipment through better internal equipment sharing and as targeted equipment purchases reduced rental requirements.
74
Table of Contents
The gross profit margin for our Domestic segment declined from 15.3% for the year ended December 31, 2013 to 15.0% for the 2014 Successor Period on similar factors as noted for the consolidated results. The gross profit margin for our International segment declined from 13.9% to 12.8% over the same period, primarily driven by increasing labor and depreciation costs as well as the unfavorable impact of foreign exchange.
Selling, General and Administrative Expenses
SG&A expenses were $92.8 million, or 8.5% of revenue for the year ended December 31, 2013 and $103.7 million, or 8.2% of revenue, in the 2014 Pro Forma Combined Period. SG&A expenses for the Domestic segment increased from $81.7 million to $91.8 million while SG&A expenses for the International segment increased from $11.1 million to $11.9 million. The absolute increase in SG&A expenses for both segments is the result of investment in administrative infrastructure to support the continued growth of the business as well as some non-recurring costs associated with implementing various strategic initiatives and filling certain management positions on an interim basis for a period of time after the Sponsors Acquisition.
Acquisition-Related Expenses
Acquisition-related expenses were $3.3 million, $14.2 million and $19.0 million for the year ended December 31, 2013, the 2014 Predecessor Period and the 2014 Successor Period, respectively. Acquisition-related costs for the 2014 Predecessor Period primarily related to seller expenses related to the Sponsors Acquisition. Acquisition-related costs for the 2014 Successor Period primarily related to buyer expenses related to the Sponsors Acquisition as well as expenses associated with the acquisition of AAVC in January 2015.
Depreciation
Depreciation (excluding depreciation reported in cost of revenue), as a percentage of revenue was consistent at 0.4%, 0.4% and 0.3% for the year ended December 31, 2013, the 2014 Predecessor Period and the 2014 Successor Period, respectively. The decrease from 0.4% for the 2014 Predecessor Period to 0.3% for the 2014 Successor Period is the result of increased revenue.
Amortization of Intangibles
Amortization of intangibles was $12.5 million, $1.0 million and $22.6 million for the year ended December 31, 2013, the 2014 Predecessor Period and the 2014 Successor Period. The increase from $12.5 million for the year ended December 31, 2013 to $22.6 million for the 2014 Successor Period was primarily the result of the write-up of the value of intangible assets as part of the purchase accounting for the Sponsors Acquisition.
Interest Expense
Interest expense was $40.7 million, $2.8 million and $40.5 million for the year ended December 31, 2013, the 2014 Predecessor Period and the 2014 Successor Period, respectively, and reflects the new debt structure put into place on January 25, 2014 as a result of the Sponsors Acquisition, which resulted in incremental debt of $192.9 million, partially offset by a reduction in interest rate.
Income Taxes
Our income tax benefit was $3.0 million, $10.5 million and $0.1 million for the year ended December 31, 2013, the 2014 Predecessor Period and the 2014 Successor Period, respectively. Our
75
Table of Contents
effective income tax rate was (21%), 29% and 1% for the year ended December 31, 2013, the 2014 Predecessor Period and the 2014 Successor Period, respectively. The rates differ from the U.S. federal statutory rate due to state income taxes (net of federal benefit), the impact of non-deductible expenses (including disallowed transaction costs and meals and entertainment expenses) and the increase of valuation allowance for foreign NOLs. The 1% effective tax rate in the 2014 Successor Period was significantly lower than the other two periods as a result of permanent book to tax differences related to transaction costs from the Sponsors Acquisition and the AAVC acquisition.
Net Income
Net income decreased $54.1 million from net income of $17.6 million for the year ended December 31, 2013 to net loss of $(25.9) million for the 2014 Predecessor Period and a net loss of $(10.6) million for the 2014 Successor Period. The loss in the 2014 Predecessor Period was driven by $14.2 million in acquisition-related costs and $23.4 million of long-term incentive and stock compensation costs triggered by the Sponsors Acquisition. The loss in the 2014 Successor Period was driven by $19.0 million in acquisition-related costs, the significant increase in depreciation and amortization triggered by the Sponsors Acquisition as well as the other factors discussed above.
Adjusted EBITDA and Adjusted EBITDA Margin
For purposes of the discussion of Adjusted EBITDA, we compared the Adjusted EBITDA of the Predecessor for the fiscal year ended December 31, 2013 to the 2014 Pro Forma Combined Period. When considering the effects of the Sponsors Acquisition, the Adjusted EBITDA for the 2014 Pro Forma Combined Period is equal to the sum of the Adjusted EBITDA for the 2014 Predecessor Period and the 2014 Successor Period. We believe the comparison to Adjusted EBITDA assists readers in understanding and assessing the trends and significant changes in our Adjusted EBITDA and provides a more meaningful method of comparison.
Adjusted EBITDA increased $26.6 million from $130.4 million for the year ended December 31, 2013 to $156.9 million for the 2014 Pro Forma Combined Period and Adjusted EBITDA margin increasing from 11.9% to 12.4%, respectively. Within our segments, Adjusted EBITDA in the Domestic segment increased $27.3 million, or 23.0%, from $118.6 million for the year ended December 31, 2013 to $145.9 million for the 2014 Pro Forma Combined Period, with Adjusted EBITDA margin increasing from 12.0% to 12.6%, respectively. Of the increase in Adjusted EBITDA, $19.9 million was due to higher revenue while $7.4 million resulted from improvements in gross profit margin, prior to depreciation, largely driven by improvements in labor and equipment sub-rental costs partially offset by increased commission expense as discussed above.
Adjusted EBITDA in the International segment decreased $0.7 million, or 5.9%, from $11.8 million for the year ended December 31, 2013 to $11.1 million for the 2014 Pro Forma Combined Period, with Adjusted EBITDA margin decreasing from 11.2% to 10.4%, respectively. Of the decrease in Adjusted EBITDA, $0.8 million was due to higher SG&A offset by $0.1 million in EBITDA growth from higher revenue.
Year Ended December 31, 2012 (Predecessor) Compared to Year Ended December 31, 2013 (Predecessor)
As noted above, our 2013 performance is significantly impacted by the acquisition of Swank in November 2012:
| • | Over 70% of the 51.3% increase in revenue from 2012 to 2013 was driven by the acquisition of Swank in November 2012; |
| • | 79.9% increase in Adjusted EBITDA from $72.5 million in 2012 to $130.4 million in 2013 with Adjusted EBITDA margin increasing from 10.0% to 11.9%, respectively; |
76
Table of Contents
| • | Net income increased from $9.7 million to $17.6 million due to the same factors noted for Adjusted EBITDA offset by higher interest costs due to the financing for the Swank acquisition; and |
| • | Venue count increased by 5.2% from 1,181 to 1,243, largely driven by the VAE acquisition. |
Revenue
Revenue increased $371.5 million, or 51.3%, from $724.8 million for the year ended December 31, 2012 to $1,096.4 million for the year ended December 31, 2013. Revenue for the Domestic segment increased $360.6 million, or 57.1%, from $631.1 million for the year ended December 31, 2012 to $991.7 million for the year ended December 31, 2013. The increase in the Domestic segment was primarily due to $264.4 million from venues that were part of the acquisition of Swank in November 2012, $47.2 million (9.2%) growth in same venue revenue, $19.0 million of growth from net new venues ($27.9 million in revenue from new venues less $8.9 million in lost revenue from closed venues) and $30.0 million in other growth due to expanded client direct services outside of our venues arising in part for the acquisition of Swank. The growth in same venue revenue was principally driven by an increase in revenue per event with limited growth in the number of events. The increase in revenue per event was driven by customers holding more complex events requiring more event technology services, the mix of event technology services provided and our ability to charge more for our services. The 9.2% same venue revenue growth was favorable compared to an increase in Group RevPAR of 2.0%. The excess of our same venue revenue growth versus Group RevPAR was slightly above our average outperformance since 2010 as we were able to continue to drive additional growth from specialty services, upsell our core audiovisual services and capture a greater share of the audiovisual spend in our venues. In addition, revenue for the International segment increased $10.9 million, or 11.7%, from $93.7 million for the year ended December 31, 2012 to $104.7 million for the year ended December 31, 2013, due to in large part to the impact of operations in Canada and the Middle East.
Cost of Revenue and Gross Profit Margin
| Year Ended December 31, | ||||||||
| 2012 | 2013 | |||||||
| (dollars in thousands) | ||||||||
| Revenue |
$ | 724,848 | $ | 1,096,374 | ||||
| Cost of revenue |
||||||||
| Commissions |
(260,951 | ) | (412,763 | ) | ||||
| Labor |
(239,581 | ) | (350,717 | ) | ||||
| Equipment sub-rental |
(39,921 | ) | (53,504 | ) | ||||
| Depreciation |
(22,225 | ) | (31,095 | ) | ||||
| Amortization of incentive payments |
(8,339 | ) | (9,318 | ) | ||||
| Other |
(54,518 | ) | (72,474 | ) | ||||
|
|
|
|
|
|||||
| Total cost of revenue |
(625,535 | ) | (929,871 | ) | ||||
|
|
|
|
|
|||||
| Gross profit |
$ | 99,313 | $ | 166,503 | ||||
|
|
|
|
|
|||||
| Gross profit margin |
13.7 | % | 15.2 | % | ||||
The gross profit margin percentage increased from 13.7% for the year ended December 31, 2012 to 15.2% for the year ended December 31, 2013. This increase is the result of increases in average venue commission rates being offset by declines in all other major components of cost of revenue as a percentage of revenue. In particular labor costs declined by 1.1% of revenue and equipment sub-rental declined by 0.6% of revenue driven by a combination of controlling costs with increases in revenue and synergies from the acquisition of Swank.
77
Table of Contents
The gross profit margin for our Domestic segment increased from 13.8% for the year ended December 31, 2012 to 15.3% for the year ended December 31, 2013 on similar factors as noted for the consolidated results. The gross profit margin for our International segment increased from 12.9% to 13.9% over the same period, primarily driven by declines in commission expense due to business mix.
Selling, General and Administrative Expenses
SG&A expenses increased from $71.3 million for the year ended December 31, 2012 to $92.8 million for the year ended December 31, 2013, while declining as a percentage of revenue from 9.8% to 8.5%, respectively. SG&A expenses for the Domestic segment increased from $60.4 million to $81.7 million while SG&A expenses for the International segment increased from $10.9 million to $11.1 million. The increase in SG&A expenses for both segments was driven by higher salary and related costs stemming from our growth and the integration costs associated with the Swank acquisition only partially offset by the elimination of certain non-recurring compensation costs triggered by the Swank acquisition in 2012; however, SG&A declined as a percentage of revenue as we were able to leverage fixed SG&A expenses as revenue increased.
Acquisition-Related Expenses
Acquisition-related costs increased from $1.7 million for the year ended December 31, 2012 to $3.3 million for the year ended December 31, 2013. Acquisition-related costs for the year ended December 31, 2012 primarily related to the acquisition of Swank in November 2012, while the acquisition-related costs for the year ended December 31, 2013 primarily related to the acquisition of VAE in November 2013 and the Sponsors Acquisition in January 2014.
Depreciation
Depreciation (excluding depreciation related to operating assets which is included in Cost of Revenue) as a percentage of revenue was consistent at 0.4% for the year ended December 31, 2012 and for the year ended December 31, 2013.
Amortization of Intangibles
Amortization of intangibles increased $7.4 million, or 146.3%, from $5.1 million for the year ended December 31, 2012 to $12.5 million for the year ended December 31, 2013, primarily due to the addition of intangible assets as part of the acquisition of Swank in November 2012.
Interest Expense
Interest expense increased $20.7 million, or 103.4%, from $20.0 million for the year ended December 31, 2012 to $40.7 million for the year ended December 31, 2013, primarily due to the addition of $176.6 million of incremental new debt used to finance the acquisition of Swank in November 2012.
Income Taxes
Our income tax benefit was $9.9 million and $3.0 million for the year ended December 31, 2012 and the year ended December 31, 2013, respectively. Our effective income tax rate was (21%) for the year ended December 31, 2013. In the year ended December 31, 2012, we released approximately $11 million of our deferred tax valuation allowance, which resulted in a significant tax benefit in a period where we did not generate a significant loss. As a result, our calculated effective tax rate for the year ended December 31, 2012 is not meaningful.
78
Table of Contents
Net Income
Net income increased $7.9 million, or 81.3%, from $9.7 million for the year ended December 31, 2012 to $17.6 million for the year ended December 31, 2013, primarily due to the factors discussed above.
Adjusted EBITDA and Adjusted EBITDA Margin
Adjusted EBITDA increased $57.9 million, or 79.9%, from $72.5 million for the year ended December 31, 2012 to $130.4 million for the year ended December 31, 2013, with Adjusted EBITDA margin increasing from 10.0% to 11.9%, respectively. Within our segments, Adjusted EBITDA in the Domestic segment increased $55.7 million, or 88.5%, from $62.9 million for the year ended December 31, 2012 to $118.6 million for the year ended December 31, 2013, with Adjusted EBITDA margin increasing from 10.0% to 12.0%, respectively. Of the increase in Adjusted EBITDA, $36.0 million was due to higher revenue while $19.7 million resulted from improvements in gross profit margin, largely driven by labor and equipment sub-rental costs as discussed above, and the decline in SG&A expense as a percentage of revenue.
Adjusted EBITDA in the International segment increased $2.2 million, or 23.4%, from $9.5 million for the year ended December 31, 2012 to $11.8 million for the year ended December 31, 2013, with Adjusted EBITDA margin increasing from 10.2% to 11.2%, respectively. Of the increase in Adjusted EBITDA, $1.1 million was due to higher revenue while $1.1 million resulted from improvements in gross profit margin.
Liquidity and Capital Resources
Overview
Our principal liquidity requirements historically have been to service our debt, to meet our working capital, venue incentives and capital expenditure needs and to finance acquisitions. Our principal sources of liquidity are cash generated from operating activities, funds from borrowings and existing cash on hand. As of June 30, 2015, we had $69.2 million of cash and cash equivalents and approximately $66.6 million of available borrowing capacity under our $75 million revolving facility (with no draws and $8.4 million of letters of credit outstanding).
Our liquidity is also favorably impacted by our U.S. NOL carryforward. We had $91.5 million of gross NOL carryforwards as of December 31, 2014. The cash benefits associated with those NOLs is $32.0 million. These NOLs are generally limited under Section 382 of the Internal Revenue Code, and we anticipate being able to use $28.6 million ($10.0 million cash benefit) each year.
We believe that cash generated through operations and our financing arrangements will be sufficient to meet working capital requirements, anticipated venue incentives, capital expenditures and scheduled debt payments for at least the next 12 months. We anticipate that to the extent that we require additional liquidity it will be funded through the incurrence of other indebtedness, equity financings or a combination thereof. We cannot assure you that we will be able to obtain this additional liquidity on reasonable terms, or at all. Additionally, our liquidity and our ability to meet our obligations and fund our capital requirements are also dependent on our future financial performance, which is subject to general economic, financial and other factors that are beyond our control. Accordingly, we cannot assure you that our business will generate sufficient cash flow from operations or that future borrowings will be available under our credit facilities or otherwise to meet our liquidity needs. Although we have no specific current plans to do so, if we decide to pursue one or more significant acquisitions, we may incur additional debt or sell additional equity to finance such acquisitions.
79
Table of Contents
Working Capital
Working capital is the amount by which current assets exceed current liabilities and is a measure of our ability to pay our liabilities as they become due. Our working capital was $33.4 million at December 31, 2013, $66.2 million at December 31, 2014 and $92.3 million at June 30, 2015. The following table presents the components of our working capital as of December 31, 2013 and 2014 and June 30, 2015:
| Predecessor | Successor | |||||||||||||
| December 31, 2013 |
December 31, 2014 |
June 30, 2015 |
||||||||||||
| (in thousands) | ||||||||||||||
| Current assets |
||||||||||||||
| Cash and cash equivalents |
$ | 23,733 | $ | 68,818 | $ | 69,184 | ||||||||
| Trade accounts receivable, net |
77,319 | 76,946 | 125,837 | |||||||||||
| Deferred tax assets |
10,597 | 13,471 | 13,161 | |||||||||||
| Prepaid expenses and other assets |
11,655 | 15,487 | 19,146 | |||||||||||
| Other current assets |
264 | 6,840 | 1,613 | |||||||||||
|
|
|
|
|
|
|
|||||||||
| Total current assets |
123,568 | 181,562 | 228,941 | |||||||||||
|
|
|
|
|
|
|
|||||||||
| Current liabilities |
||||||||||||||
| Current portion of long-term debt |
3,400 | 15,050 | 7,218 | |||||||||||
| Trade accounts payable |
26,183 | 29,921 | 34,600 | |||||||||||
| Accrued expenses |
60,599 | 70,411 | 94,836 | |||||||||||
|
|
|
|
|
|
|
|||||||||
| Total current liabilities |
90,182 | 115,382 | 136,654 | |||||||||||
|
|
|
|
|
|
|
|||||||||
| Working capital |
$ | 33,386 | $ | 66,180 | $ | 92,287 | ||||||||
|
|
|
|
|
|
|
|||||||||
The increase of $58.9 million in working capital from $33.4 million at December 31, 2013 to $92.3 million at June 30, 2015 primarily reflects a combination of improved cash position of $45.5 million and net growth in other short term assets and liabilities of $17.3 million as well as an increase in the current portion of long-term debt of $3.8 million. The changes in other short term assets and liabilities reflect a combination of growth in the business, including the acquisitions of AAVC and AVC Live during 2015, as well as seasonal growth in accounts receivable between December and June.
Trade Accounts Receivable
Trade accounts receivable decreased $0.4 million from $77.3 million at December 31, 2013 to $76.9 million at December 31, 2014, primarily due to a focused effort to reduce days sales outstanding (“DSO”) in both the Domestic and International segments, which offset the impact of growth in revenue. Trade accounts receivable increased $48.9 million from $76.9 million at December 31, 2014 to $125.8 million at June 30, 2015 in line with growth in revenue with DSO declining slightly from December 2014.
Trade Accounts Payable
Trade accounts payable increased $3.7 million from $26.2 million at December 31, 2013 to $29.9 million at December 31, 2014 in line with the growth in cost of revenue. Trade accounts payable increased $4.7 million from $29.9 million at December 31, 2014 to $34.6 million at June 30, 2015, outpacing the growth of cost of revenue primarily due to the acquisition of AAVC and AVC Live and timing of capital expenditures.
80
Table of Contents
Accrued Expenses
Accrued expenses increased $9.8 million from $60.6 million at December 31, 2013 to $70.4 million at December 31, 2014, primarily due to increased accrued interest expense due to timing of our interest rate elections which impacts timing of payment and higher accrued payroll and related cost due to timing of the pay period versus the prior period end. Accrued expenses increased $24.4 million from $70.4 million at December 31, 2014 to $94.8 million at June 30, 2015, primarily due to moving from an income tax receivable to an income tax payable position, timing of payroll cycles, the acquisition of AAVC and AVC Live and general growth of the business.
Cash Flow Analysis
| Twelve Months Ended December 31, 2014 |
Six Months Ended June 30, 2014 |
|||||||||||||||||||||||||||||||
| Predecessor | Successor | Predecessor | Successor | Successor | ||||||||||||||||||||||||||||
| Year Ended December 31, | January 1, through January 24, 2014 |
January 25, through December 31, 2014 |
January 1, through January 24, 2014 |
January 25, through June 30, 2014 |
Six Months Ended June 30, 2015 |
|||||||||||||||||||||||||||
| 2012 | 2013 | |||||||||||||||||||||||||||||||
| (in thousands) | ||||||||||||||||||||||||||||||||
| Net cash provided by (used in): |
||||||||||||||||||||||||||||||||
| Operating activities |
$ | 57,431 | $ | 51,330 | $ | (2,018 | ) | $ | 46,271 | $ | (2,018 | ) | $ | 3,221 | $ | 27,969 | ||||||||||||||||
| Investing activities |
(304,596 | ) | (77,219 | ) | (4,268 | ) | (911,732 | ) | (4,268 | ) | (888,849 | ) | (72,480 | ) | ||||||||||||||||||
| Financing activities |
232,693 | 35,750 | — | 935,071 | — | 927,171 | 45,809 | |||||||||||||||||||||||||
Net Cash Provided By (Used In) Operating Activities
Net cash provided by operating activities consist primarily of net income adjusted for non-cash items, including depreciation and amortization, cash outflows for venue incentives and the effect of working capital changes. The variability in net cash provided by operating activities, other than the overall growth of the business, is primarily driven by the level of venue incentives, which peaked in 2014 and 2015 due to the concentration of contract renewals that occurs every five to six years, and acquisition-related costs which are unique to each period based on the occurrence of an acquisition.
Net cash provided by operating activities for the six months ended June 30, 2015 was $28.0 million. This principally reflects the results of operations exclusive of non-cash income and expenses, primarily depreciation and amortization, less $16.5 million in venue signing incentives, the change in deferred income taxes and the increase in working capital.
Net cash provided by operating activities for the 2014 Interim Successor Period was $3.2 million. This principally reflects the results of operations exclusive of non-cash income and expenses, primarily depreciation and amortization, less $4.4 million in cash paid for venue signing incentives, the change in deferred income taxes and the increase in working capital.
Net cash provided by operating activities for the 2014 Successor Period was $46.3 million. This principally reflects the results of operations exclusive of non-cash income and expenses, primarily depreciation and amortization, less $15.5 million in venue signing incentives, the change in deferred income taxes and the increase in working capital. The cash provided by operating activities is offset by $19.0 million of acquisition-related expenses, primarily related to the Sponsors Acquisition.
81
Table of Contents
Net cash used in operating activities for the 2014 Predecessor Period was $2.0 million. This principally reflects the results of operations, burdened by significant acquisition-related expenses, exclusive of non-cash income and expenses, primarily depreciation, amortization and stock-based compensation expense, less $0.1 million in venue signing incentives and the change in deferred income taxes, partially offset by a decrease in working capital. The cash provided by operating activities is offset by $14.2 million of acquisition-related expenses related to the Sponsors Acquisition.
Net cash provided by operating activities for the year ended December 31, 2013 was $51.3 million. This principally reflects the results of operations exclusive of non-cash income and expenses, primarily depreciation and amortization, less $6.4 million in venue signing incentives, the change in deferred income taxes and the increase in working capital.
Net cash provided by operating activities for the year ended December 31, 2012 was $57.4 million. This principally reflects the results of operations exclusive of non-cash income and expenses, primarily depreciation and amortization, less $4.6 million in venue signing incentives and the change in deferred income taxes, partially offset by a decrease in working capital.
Net Cash Used in Investing Activities
Investing activities consist primarily of capital expenditures for growth and maintenance, and in certain periods, acquisitions of other businesses. Growth capital expenditures generally are for purchase of equipment for new venues and other new facilities. Maintenance capital expenditures generally are for replacement of existing equipment at the end of its useful life, equipment upgrades and service expansion at existing venues as well as corporate systems and related infrastructure.
We anticipate that our capital expenditures for the year ending December 31, 2015 will be $59 million. This includes $12.2 million related to the build out of our new headquarters facility in Schiller Park, Illinois, of which $7.2 million is funded through lease incentives which will be reflected as an operating cash inflow. The balance of the capital expenditures relate to equipment for new venues, upgrading and replacement of existing equipment, including equipment for expanded service offerings at existing venues, such as additional services, and information technology infrastructure and software.
We believe that cash flows from operations will be sufficient to fund our anticipated capital expenditures, but additional borrowings may be required to fund future acquisitions.
Net cash used in investing activities for the six months ended June 30, 2015 was $72.5 million. This is principally due to $28.6 million of capital expenditures, $26.9 million used for the acquisition of AAVC and $17.0 million used for the acquisition of AVC Live. The $28.6 million of capital expenditures includes $3.3 million for the build-out of the new corporate office, which was paid for by the landlord as part of a tenant improvement allowance resulting in an offsetting operating cash inflow.
Net cash used in investing activities for the 2014 Interim Successor Period was $888.8 million. This was principally due to $877.6 million used for the Sponsors Acquisition and $11.2 million of capital expenditures. Capital expenditures for the six months ended June 30, 2015 increase by $13.1 million over the aggregate of the 2014 Interim Successor and Predecessor Periods, rising from 2.3% to 3.6% of revenue. The increase was driven by a combination of timing, additional costs related to the build out of our new headquarters facility discussed above and additional equipment needs to support a higher level of acquisitions and new venues.
Net cash used in investing activities for the 2014 Successor Period was $911.7 million. This was principally due to $877.6 million used for the Sponsors Acquisition and $34.1 million in capital expenditures.
82
Table of Contents
Net cash used in investing activities for the 2014 Predecessor Period was $4.3 million, all for capital expenditures, primarily for equipment for new and existing venues. In aggregate for both the Successor and Predecessor Periods, capital expenditures increased $1.9 million over 2013 driven by the growth of the business, while declining as a percentage of revenue from 3.3% to 3.0% on continued improvements in equipment utilization.
Net cash used in investing activities for the year ended December 31, 2013 was $77.2 million. This was principally due to $40.9 million used for the acquisition of VAE and $36.5 million of capital expenditures. Capital expenditures increased $7.1 million over 2012 driven by the growth of the business, while declining as a percentage of revenue from 4.0% to 3.3% on improvements in equipment utilization.
Net cash used in investing activities for the year ended December 31, 2012 was $304.6 million. This was principally due to $275.4 million used for the acquisition of Swank and capital expenditures of $29.4 million.
Net Cash Provided by Financing Activities
Financing activities consist primarily of borrowings and repayments under our first lien and second lien credit facilities and our revolving facility. Outside of mandatory principal payments on our first lien credit facilities, our financing activities relate to the financing of specific transactions as discussed below.
Net cash provided by financing activities for the six months ended June 30, 2015 was $45.8 million. This was principally due to two incremental first lien term loan borrowings of $35.0 million and $180.0 million, respectively ($208.0 million combined, net of original issue discount and debt issuance costs), and a distribution of $149.1 million, all described in “—Factors Affecting the Comparability of Our Results of Operations” above. In addition, we repaid $10.0 million of borrowings under our revolving facility and made $3.1 million of mandatory principal payments under our first lien credit facility. We also issued $1.5 million of Class A Units as part of the acquisition of AVC Live.
Net cash provided by financing activities for the 2014 Interim Successor Period was $927.2 million. This is principally due to the initial borrowing under our new $505.0 million first lien credit facility and $180.0 million second lien credit facility ($679.8 million net of $5.2 million of original issue discount) and a $269.4 million capital contribution from our Sponsors as part of the Sponsors Acquisition. These amounts were reduced by $20.6 million of transaction costs associated with the new loans under our credit facilities, $1.3 million of mandatory principal payments under our first lien credit facility and other minor returns of equity to outgoing management.
Net cash provided by financing activities for the 2014 Successor Period was $935.1 million. This was principally due to the initial borrowing under our new $505.0 million first lien credit facility and $180 million second lien credit facility ($679.8 million net of $5.2 million of original issue discount), a $269.4 million capital contribution from our Sponsors as part of the Sponsors Acquisition, and borrowings of $10.0 million on our revolving facility. In addition, there were $20.6 million of debt issuance associated with the new loans under our credit facilities and $3.8 million of mandatory principal payments under our first lien credit facility.
There were no financing activities for the 2014 Predecessor Period.
Net cash provided by financing activities for the year ended December 31, 2013 was $35.8 million. This is principally due to $40.0 million of net borrowings under the revolving facility offset by $4.3 million of principal payments on long-term debt.
83
Table of Contents
Net cash provided by financing activities for the year ended December 31, 2012 was $232.7 million. This is principally due to activities related to financing the acquisition of Swank and the contemporaneous refinancing of our prior debt facilities, which was treated as a debt modification. In connection with the Swank acquisition, our Predecessor’s parent issued $42.2 million in common units and our Predecessor issued $65.0 million in preferred stock. In addition, we issued $455.0 million in new first and second lien debt, net of $28.5 million of original issue discount and debt issuance costs, and repaid our prior credit facilities of $278.4 million. In addition, we paid offering costs of $3.9 million related to the above preferred stock issuance, as well as paying down the revolver and making scheduled principal payments throughout the year.
Credit Facilities
Successor Borrowing Arrangements
On January 24, 2014, we entered into (i) a First Lien Credit Agreement (the “First Lien Credit Agreement”) and (ii) a Second Lien Credit Agreement (the “Second Lien Credit Agreement,” and together with the First Lien Credit Agreement the “Credit Agreements”) with the lenders party thereto (the “Lenders”), including Barclay’s Bank PLC, as administrative and collateral agent, and Goldman Sachs Lending Partners LLC, Barclays Bank PLC, Macquarie Capital (USA) Inc. and Morgan Stanley Senior Funding, Inc., as joint bookrunners and joint lead arrangers, in connection with the Sponsors Acquisition. The Lenders also extended credit in the form of a revolving facility (the “Revolving Facility”) with aggregate commitments of $60.0 million as part of the First Lien Credit Agreement.
Pursuant to the terms of the Credit Agreements, the Lenders provided us with term loan facilities in an aggregate principal amount of $685.0 million, consisting of a $505.0 million first lien term loan (“First Lien Loan”) and a $180.0 million second-lien term loan (“Second Lien Loan”). Net proceeds from the First Lien Loan and the Second Lien Loan were $659.2 million ($685.0 million aggregate principal amount less $5.2 million stated discount and $20.6 million in debt issuance costs). The proceeds were used to finance the Sponsors Acquisition and to pay off the Predecessor Borrowing Arrangements.
On January 16, 2015, we amended our First Lien Loan to obtain additional first lien term loans in an aggregate principal amount of $35.0 million for purposes of financing our acquisition of AAVC as well as fees and expenses associated with the borrowings and general corporate purposes.
On May 18, 2015, we amended our First Lien Loan to obtain additional first lien term loans in an aggregate principal amount of $180.0 million for purposes of funding a distribution to our equity holders as well as the fees and expenses associated with the borrowing and related transactions. The amendment also increased the maximum borrowing capacity under the Revolving Facility by $15.0 million to a maximum of $75.0 million and increased the sublimit on capacity of letters of credit by $10.0 million to a sublimit of $25.0 million.
First Lien Loan
The First Lien Loan bears interest at either, at our election, (a) the Alternate Base Rate plus 2.5% or (b) the Eurocurrency Rate plus 3.5%. The Alternate Base Rate is defined as the highest of (1) Federal Funds Effective Rate plus 0.5%, (2) LIBOR plus 1%, (3) Prime Rate (as defined in the First Lien Credit Agreement) or (4) 2%. The Eurocurrency Rate is defined as adjusted LIBOR (at a period of one, two, three, six or 12 months at our election) subject to a floor of 1%. Interest is due either monthly, for one month elections, every two months, for two month elections, or every three months for all other elections. The maturity of the First Lien Loan is January 24, 2021.
Depending on the Senior Secured Leverage Ratio as defined in the First Lien Term Agreement, we are required to make mandatory prepayments on the outstanding First Lien Loan in an aggregate
84
Table of Contents
principal amount equal to 50% of excess cash flow, as defined in the First Lien Credit Agreement, less any principal prepayments made for the year then ended and less any prepayment made pursuant to the Second Lien Credit Agreement, subject to certain other exceptions and deductions. The percentage is reduced to 25% of excess cash flow if the Senior Secured Leverage Ratio is less than or equal to 4.00 to 1.00, but greater than 3.25 to 1.00, and it is reduced to 0% if the Senior Secured Leverage Ratio is less than or equal to 3.25 to 1.00. Subject to certain exceptions and reinvestment rights, the First Lien Credit Agreement also requires 100% of the net cash proceeds from certain asset sales, insurance recoveries and debt issuances be used to pay down outstanding borrowings. No mandatory prepayments were made during the 2014 Successor Period or the six months ended June 30, 2015.
We must make mandatory quarterly amortization payments on the First Lien Loan in an amount of $1.8 million. We made $3.8 million and $3.1 million of amortization payments on the First Lien Loan during the 2014 Successor Period and the six months ended June 30, 2015, respectively.
If we refinance any portion of the First Lien Loan with loans having reduced interest rates or reprice any portion of the First Lien Loan on or prior to November 18, 2015, subject to certain exceptions, we are required to pay a premium equal to 1.00% of the aggregate amount of the First Lien Loan repaid or repriced.
Second Lien Loan
The Second Lien Loan bears interest at either, at our election, (a) the Alternate Base Rate plus 7.25% or (b) the Eurocurrency Rate plus 8.25%. The Alternate Base Rate is defined as the highest of (1) Federal Funds Effective Rate plus 0.5%, (2) LIBOR plus 1%, (3) Prime Rate (as defined in the Second Lien Credit Agreement) or (4) 2%. The Eurocurrency Rate is defined as adjusted LIBOR (at a period of one, two, three, six or 12 months at our election) subject to a floor of 1%. Interest is due either monthly, for one month elections, every two months, for two month elections, or every three months for all other elections. The maturity of the Second Lien Loan is January 24, 2022.
The mandatory prepayment requirements under the Second Lien Loan are substantially the same as under the First Lien Loan, except that no mandatory prepayment is required to be made under the Second Lien Loan until the First Lien Loan has been repaid in full, unless such amounts are declined by the Lenders under the First Lien Loan.
If we prepay or reprice any portion of the Second Lien Loan on or prior to January 24, 2017, we are required to pay a premium equal to: (i) 2.00% of the aggregate principal amount of the Second Lien Loan voluntarily prepaid or repriced after January 24, 2015 but before January 24, 2016 or (ii) 1.00% of the aggregate principal amount of the Second Lien Loan voluntarily prepaid or repriced after January 24, 2016 but before January 24, 2017.
We did not make any prepayments on the Second Lien Loan during the 2014 Successor Period or the six months ended June 30, 2015. We intend to use the proceeds from this offering to repay borrowings under our Second Lien Loan. See “Use of Proceeds.”
Revolving Facility
The Revolving Facility, which has a maximum borrowing limit of $75.0 million, was established on January 24, 2014 pursuant to the terms included in the First Lien Credit Agreement. The Revolving Facility bears interest at either, at our election (a) the Alternate Base Rate plus 2.5% or (b) the Eurocurrency Rate plus 3.5%. The Alternate Base Rate is defined as the highest of (1) Federal Funds Effective Rate plus 0.5% or (2) Prime Rate (as defined in the First Lien Credit Agreement). The
85
Table of Contents
Eurocurrency Rate is defined as adjusted LIBOR (at a period of one, two, three, six or 12 months at our election). The interest rate spread on the Revolving Facility is reduced if we meet certain leverage ratios. The Revolving Facility also includes an option to borrow funds under the terms of a swingline loan subfacility, subject to a sublimit of $10.0 million. We had $10.0 million in borrowings under the Revolving Facility as of December 31, 2014 and no borrowings outstanding under the Revolving Facility as of June 30, 2015.
The Revolving Facility also includes capacity for $15.0 million of letters of credit, which was increased to $25.0 million in May 2015. As of June 30, 2015, we had issued letters of credit with an aggregate face value of $8.4 million. These letters of credit were issued to support various insurance programs, the security deposit on our new office lease and to support our obligations related to a major customer event.
As of June 30, 2015, there was $66.6 million available for borrowing on the Revolving Facility, which matures on January 24, 2019.
The Revolving Facility is subject to a commitment fee that varies based on our Senior Secured Leverage Ratio, as defined in the First Lien Credit Agreement, of which we paid $0.3 million during the period ended December 31, 2014.
Financial Covenants and Terms
The Senior Secured Leverage Ratio may not exceed 6.75 to 1.00 if more than 25% of Revolving Facility is utilized (borrowings plus the amount of outstanding letters of credit in excess of $17.5 million). We utilized less than 25% of the Revolving Facility as of December 31, 2014 and June 30, 2015. The Senior Secured Leverage Ratio is calculated as Consolidated Senior Secured Debt to Consolidated Adjusted EBITDA, as each term is defined in the First Lien Credit Agreement, for the trailing 12 months.
Obligations under the Credit Agreements are secured by a first and second lien, respectively, on substantially all of our assets, including the capital stock of our subsidiaries, subject to customary exceptions and carve outs.
The Credit Agreements contain customary affirmative and negative covenants, including limitations on our ability to incur indebtedness, create liens, dispose of assets, make restricted payments and make investments or acquisitions, among other things. Events of default under the Credit Agreements include, among other things and subject to customary grace periods, failure to make applicable principal or interest payments when they are due, cross defaults, breach of certain covenants and representations or change in control. At the occurrence of such an event, the administrative agent, at the request of the Lenders, may terminate the commitments and declare the outstanding principal and accrued interest thereon and all fees and other obligations to be due and payable and exercise other rights and remedies provided for in the Credit Agreements. We were in compliance with the Credit Agreements at June 30, 2015.
Predecessor Borrowing Arrangements
In November 2012, our Predecessor entered into two credit agreements with Barclays Bank PLC, as Administrative Agent and Collateral Agent, as part of the Swank acquisition that occurred on November 9, 2012. The agreements consisted of a $340.0 million First Lien Term Loan Facility (the “Predecessor First Lien Loan”), a $115.0 million Second Lien Term Loan Facility (the “Predecessor Second Lien Loan”) and a $40.0 million Revolving Credit Facility (the “Predecessor Revolving Facility” and collectively with the Predecessor First Lien Loan and the Predecessor Second Lien Loan, the
86
Table of Contents
“Predecessor Borrowing Arrangements”). Our Predecessor paid closing costs totaling $28.4 million associated with this financing, which included a debt discount of $24.4 million. This financing was treated as a debt modification, resulting in $4.1 million of the closing costs recorded to expense in 2012. This financing was used in part to pay off existing debt. Our Predecessor had pledged substantially all of its assets as collateral for the facilities. The agreements contained restrictive covenants providing for quarterly and annual measures of financial condition and also limited the payment of dividends, permitted acquisitions financed by the agreement, the sale of certain assets and other loans, advances and indebtedness. The agreements also contained maximum leverage and interest coverage ratio covenants, which became effective for the first quarter of 2013. The maximum leverage ratio was scheduled to be 4.5x trailing 12 months EBITDA at the end of each quarter in 2014. The leverage ratio was scheduled to decrease annually. The interest coverage ratio was not to be less than 3.0 at the end of each quarter in 2014. The interest coverage ratio increased annually. We were in compliance with all applicable financial covenants through the date the Predecessor Borrowing Arrangements were extinguished.
In connection with the Sponsors Acquisition, all outstanding obligations under the Predecessor Borrowing Arrangements were fulfilled with proceeds from the Successor Borrowing Arrangements.
Predecessor First Lien Loan
The Predecessor First Lien Loan dated November 9, 2012, was scheduled to mature in November 2018. Amounts borrowed under the First Lien Loan bore interest at an annual rate equal to, at our Predecessor’s option, LIBOR plus 5.5% with a LIBOR floor of 1.25% or the Base Rate plus 4.5% with a 2.25% Base Rate floor. At December 31, 2013 and 2012, the effective interest rate on the First Lien Term Loan Facility was 7.75%. Interest was paid in arrears for each rate maturity period elected. Principal repayments in $0.9 million quarterly installments were due commencing December 31, 2012.
Predecessor Second Lien Loan
The Predecessor Second Lien Loan dated November 9, 2012, was scheduled to mature in May 2018. Amounts borrowed under the Second Lien Loan bore interest at an annual rate equal to, at our Predecessor’s option, LIBOR plus 9.5% with a 1.25% LIBOR floor or the Base Rate plus 8.5% with a 2.25% Base Rate floor. At December 31, 2013 and 2012, the effective interest rate on the Second Lien Loan was 10.75%. Interest was paid in arrears for each rate maturity period elected. No principal repayments were required prior to maturity.
Predecessor Revolving Facility
The Predecessor Revolving Facility dated November 9, 2012, was scheduled to mature in November 2017. There were $40.0 million and $0 of outstanding borrowings on the revolving credit facility at December 31, 2013 and 2012, respectively. At December 31, 2013 and 2012, the effective interest rate on the Predecessor Revolving Facility was 5.67% and 7.75%, respectively. Interest was paid in arrears for each rate maturity period elected. Our Predecessor was subject to a commitment fee of 0.50% per annum on the average daily amount of the available revolving commitment during the period.
87
Table of Contents
Contractual Obligations
The following table summarizes our contractual obligations and commitments as of December 31, 2014:
| Payments Due by Period | ||||||||||||||||||||
| (in thousands) | ||||||||||||||||||||
| Contractual Obligations |
Total | Less than 1 year |
1 - 3 years |
3 - 5 years |
More than 5 years |
|||||||||||||||
| Long-term debt(1) |
$ | 681,212 | $ | 5,050 | $ | 10,100 | $ | 10,100 | $ | 655,962 | ||||||||||
| Estimated interest payments(2) |
273,127 | 39,720 | 82,244 | 81,262 | 69,901 | |||||||||||||||
| Operating lease obligations |
22,767 | 6,227 | 7,922 | 5,199 | 3,419 | |||||||||||||||
| Venue contracts(3) |
11,105 | 3,425 | 6,198 | 1,159 | 323 | |||||||||||||||
|
|
|
|
|
|
|
|
|
|
|
|||||||||||
| $ | 988,211 | $ | 54,422 | $ | 106,464 | $ | 97,720 | $ | 729,605 | |||||||||||
|
|
|
|
|
|
|
|
|
|
|
|||||||||||
| (1) | Payments are based on debt balances outstanding at December 31, 2014. Subsequent to December 31, 2014, we issued $35.0 million of long-term debt in part to finance the AAVC acquisition and $180.0 million of long-term debt in conjunction with a distribution. Such debt matures in 2021. Payments related to this additional debt are not reflected in the table. We expect to use proceeds from this offering to repay $ of principal on our Second Lien Loan, which is scheduled to mature in 2022. |
| (2) | Estimated interest payments are based on debt balances outstanding at December 31, 2014 and the interest rate in effect at that time. The estimated interest payments do not include interest related to the debt issued in conjunction with the distribution. We expect to use proceeds from this offering to repay $ of principal on our Second Lien Loan which will reduce future interest payments. |
| (3) | Venue contracts include fixed annual incentives, fixed minimum guarantees and other incentives that are paid over time. |
We have excluded our liability for uncertain tax positions from the table above because we are unable to make a reasonably reliable estimate of the timing of payments.
The above table does not reflect estimated contractual obligations under the multi-employer pension plans in which our union employees participate. We are party to various collective bargaining agreements that require us to provide to the employees subject to these agreements specified wages and benefits, as well as to make contributions to multi-employer pension plans. Our multi-employer pension plan contribution rates generally are specified in the collective bargaining agreements (usually on an annual basis), and contributions are made to the plans on a “pay-as-you-go” basis based on our union employee payrolls. Our obligations for contributions to multi-employer pension plans cannot be determined for future periods because the location and number of union employees that we have employed at any given time and the plans in which they may participate vary depending on the need for union resources.
Off-Balance Sheet Arrangements
We have no off-balance sheet arrangements that have or are likely to have a current or future material effect on our financial condition, changes in financial condition, revenue, expenses, results of operations, liquidity, capital expenditures or capital resources.
88
Table of Contents
Critical Accounting Policies and Estimates
Our discussion and analysis of our financial condition and results of operations are based upon our consolidated financial statements, which have been prepared in accordance with accounting principles generally accepted in the United States of America (“GAAP”). The preparation of our consolidated financial statements requires us to make estimates and assumptions that affect the reported amounts of assets and liabilities and the disclosure of contingent assets and liabilities at the dates of the consolidated financial statements and the reported revenues and expenses during the reporting periods. We evaluate these estimates and assumptions on an ongoing basis and base our estimates on historical experience, current conditions and various other assumptions that are believed to be reasonable under the circumstances. The results of these estimates form the basis for making judgments about the carrying values of assets and liabilities as well as identifying and assessing the accounting treatment with respect to commitments and contingencies. Our actual results may materially differ from these estimates.
Listed below are the accounting policies that we believe are critical to our financial statements due to the degree of uncertainty regarding the estimates or assumptions involved and are critical to the understanding of our operations.
Revenue Recognition
We generate revenue by providing event technology services, such as audiovisual services, audiovisual equipment rental, staging and meeting services and event related communication systems as well as related technical support, to our customers in various venues, including hotels and convention centers. We recognize revenue when persuasive evidence of an arrangement exists, services have been rendered, the fee is fixed and determinable and collectability is reasonably assured. Revenue is recognized in the period in which services are provided pursuant to the terms of the contractual arrangements with our customers. Revenue related to multi-day events is recognized using the proportional performance model as services are provided over the course of the event. Revenue related to contracts for rigging, power and network installations is recognized when the installation is complete.
We also evaluate whether it is appropriate to present as revenue the gross amount that our customers pay for our services as revenue, and the related commissions paid to the venue as cost of revenue, or to recognize the net amount (gross revenue less the related commissions paid to the venue) as revenue. In our standard arrangement, we contract directly with the customers, and we are responsible for the delivery of the services, including providing the necessary labor and equipment to perform the services. We are subject to inventory risk, have latitude in establishing prices and selecting suppliers and, while in many cases the venue bills the end customer on our behalf, we bear the risk of collection from the customer. The venues’ commissions are not dependent on collections. As a result, our revenue is primarily reported on a gross basis.
Venue Incentives
We enter into long-term contracts with venue operators for the right to be the exclusive on-site provider of audiovisual and event technology services and to receive customer referrals from the venue operator over the contract period. We defer certain up-front cash payments and the estimated cost of capital equipment and/or installation services obligations incurred in connection with signing new venue contracts or renewing existing venue contracts. In the event the contract is early terminated by the venue operator, the venue operator must repay a ratable portion of the cash payment and the value of the capital equipment and/or installation services obligations based on the remaining contract period. Venue incentives are amortized into cost of revenue over the life of the contract with the venue
89
Table of Contents
operator, which typically range from three to six years. We review our venue incentives for impairment whenever events or changes in circumstances indicate the carrying amount of the venue incentives may not be recoverable.
Acquisitions
The recording of an acquisition entails the allocation of the purchase price of an acquired business to its identifiable assets and liabilities based on the fair value of those assets and liabilities on the acquisition date. Any excess amount of the purchase price over the fair value is recognized as goodwill.
Determination of identifiable assets and liabilities and the respective fair values requires us to make significant judgments and estimates. We estimate the fair value of assets and liabilities using widely accepted valuation techniques, including discounted cash flows and market multiple analyses. Other estimates used in determining fair value include, but are not limited to, future cash flows or income related to intangibles, market rate assumptions and appropriate discount rates. These estimates and assumptions are subject to a considerable degree of uncertainty.
The following table presents the valuation techniques that we typically use to value assets acquired as part of business combinations:
| Asset Class |
Valuation Technique | |
| Tangible personal property | Replacement cost, reproduction cost and market approach | |
| Venue contracts | Discounted cash flow | |
| Customer relationships | Discounted cash flow | |
| Trade name | Relief from royalty |
Impairment of Goodwill and Other Indefinite-Lived Intangible Assets
We evaluate goodwill and other indefinite lived assets for impairment annually or more often if a triggering even occurs between annual tests. The annual tests are performed as of October 1.
We evaluate goodwill for impairment at the reporting unit level. A reporting unit is an operating segment or one level below the operating segment if discrete financial information is prepared and regularly reviewed by segment management. Each of our segments, Domestic and International, is made up of a single reporting unit. We assess goodwill for possible impairment using a two-step method. The first step of the goodwill impairment test compares the fair value of each reporting unit with its carrying value, including goodwill. If the carrying amount of a reporting unit exceeds its fair value, an indication of impairment exists. The second step of the goodwill impairment test is performed to measure the amount of the impairment loss, if any. If the carrying value of goodwill exceeds its implied fair value, an impairment loss is recognized equal to the excess. The implied fair value of goodwill is determined by allocating the fair value of each reporting unit in a manner similar to a purchase price allocation. The residual fair value after this allocation is the implied fair value of the reporting unit goodwill. We use combination of discounted cash flows and market multiples to estimate the fair value of each reporting unit.
We are also permitted to make a qualitative assessment of whether it is more likely than not that the fair value of a reporting unit is less than its carrying value prior to applying the quantitative assessment. If based on our qualitative assessment it is not more likely than not that the carrying value of the reporting unit is less than its fair value, then a quantitative assessment is not required. Our Predecessor performed a qualitative assessment for the annual impairment tests in the years ended December 31, 2012 and 2013. We did not use the qualitative assessment to assess goodwill for impairment at our annual test in 2014.
90
Table of Contents
Determination of our reporting units, impairment indicators and fair value measurements require us to make significant judgments and estimates, including the extent and timing of future cash flows. As part of the determination of future cash flows, we make assumptions relating to the following:
| • | future general economic conditions; |
| • | industry specific economic conditions; |
| • | business projections; |
| • | growth rates; and |
| • | discount rates. |
These assumptions are subject to a considerable degree of uncertainty and different assumptions could materially affect our conclusions. No impairment charges were recorded in the years ended December 31, 2012 and December 31, 2013, the 2014 Predecessor Period, the 2014 Successor Period or the six months ended June 30, 2015. In our most recent annual impairment test of goodwill performed as of the fourth quarter of 2014, the estimated fair value of our domestic and international reporting units exceeded the carrying values of those reporting units by 13% and 12%, respectively. A 1% increase in the discount rate assumption would have resulted in a 10% and 8% decrease in the estimated fair values of the domestic and international reporting units, respectively. A 1% decrease in the long-term growth rate assumption would have resulted in a 7% and 6% decrease in the estimated fair values of the domestic and international reporting units, respectively.
Intangible assets have been acquired through various business acquisitions and include contractual relationships, customer relationships and trade names. Intangible assets with indefinite useful lives are not amortized but are tested for impairment at least annually. We test intangible assets with indefinite useful lives for impairment by comparing the fair value of the intangible asset with the carrying value. If the carrying value exceeds the fair value, an impairment loss is recognized equal to the excess. We test intangible assets with indefinite useful lives for impairment each year. The impairment test would be conducted more frequently if an event or circumstances indicate that an impairment loss has been incurred. Conditions that would trigger an impairment assessment include, but are not limited to, a significant adverse change in legal factors or business climate that could affect the fair value of an asset. No such conditions occurred during 2012, 2013 or 2014.
Impairment of Long-Lived Assets
We periodically evaluate whether current events or circumstances indicate that the carrying value of our property, plant and equipment and definite-lived intangible assets may not be recoverable. If circumstances indicate that the carrying value may not be recoverable, we estimate future undiscounted net cash flows using estimates of related revenue and operating costs. If the undiscounted cash flows are less than the carrying value of the assets, we recognize an impairment loss equal to the amount by which the carrying value exceeds the fair value of the assets.
Our estimates of future cash flows are subject to certain risks and uncertainties which may affect the recoverability of our long lived assets. Although we have made our best estimate of these factors based on current conditions, it is reasonably possible that changes could occur, which could adversely affect our estimate of the net cash flows expected to be generated from our operating assets. No impairment charges were recorded during the years ended December 31, 2012 and December 31, 2013, the 2014 Predecessor Period, the 2014 Successor Period or the six months ended June 30, 2015.
91
Table of Contents
Income Taxes
We are currently organized as a limited liability company, which is a pass-through entity for federal and state income tax purposes. However, we conduct our business through subsidiaries that are subject to income taxes in both the United States and numerous foreign jurisdictions. Significant judgment is required in determining provision for income taxes and income tax assets and liabilities, including evaluating uncertainties with the application of accounting principles and corporate laws.
We record a provision for income taxes for the anticipated tax results of operations using the asset and liability method. Under this method, we recognize deferred tax assets and liabilities for the expected future tax consequences of temporary differences between the financial reporting and tax bases of assets and liabilities as well as for operating loss and tax credit carryforwards. Deferred tax assets and liabilities measured using the tax rates that are expected to apply to taxable income for the years in which those tax assets and liabilities are expected to be realized or settled. We record a valuation allowance to reduce our deferred tax assets to the net amount that we believe is more likely than not to be realized.
We evaluate the realizability of our deferred tax assets quarterly by assessing the need for a valuation allowance and by adjusting the amount of such allowance, if necessary. We consider the four sources of taxable income used in determining whether a valuation allowance is required and are able to rely on a single source of taxable income to determine if a valuation allowance is required. Because our deferred tax liability provides for existing taxable temporary differences greater than our deductible temporary differences and loss carryforwards and the general reversal patterns are such that offset would be expected under the tax law, a valuation allowance is not necessary.
We recognize a tax benefit associated with an uncertain tax position when, in our judgment, it is more likely than not that the position will be sustained upon examination by a taxing authority based on the technical merits of the position. For a tax position that meets the more-likely-than-not recognition threshold, we initially and subsequently measure the tax benefit as the largest amount that we judge to have a greater than 50% likelihood of being realized upon ultimate settlement with a taxing authority. The liability associated with unrecognized tax benefits is adjusted periodically due to changing circumstances, such as the progress of tax audits, case law developments and new or emerging legislation. Such adjustments are recognized entirely in the period in which they are identified. To the extent that the final tax outcome of these matters is different than the amounts recorded, it could have a material impact on our operating results. In addition, we operate within multiple taxing jurisdictions and are subject to audit in these jurisdictions. These audits can involve complex issues, which may require an extended time to resolve. We believe that adequate provisions for income taxes have been made for all years.
Equity-Based Compensation
The PSAV Holdings LLC 2014 Management Incentive Plan and the PSAV Holdings LLC Phantom Unit Appreciation Plan provide management with an incentive to contribute to and participate in our success. Under these plans, we are authorized to issue, in the aggregate, 29,938 profits interests in the form of Class B Units and Phantom Units. We have issued Class B Service Units, Class B Performance Units, Phantom Service Units and Phantom Performance Units. Generally, Class B Service Units vest ratably over five years. Class B Performance Units will vest upon a distribution event exceeding certain threshold amounts and the achievement of a targeted multiple of invested capital.
Equity-based compensation expense related to the Class B Service Units is recorded based upon the fair value of the award at grant date. Such costs are recognized as expense over the corresponding requisite service period. The fair value of the awards granted in connection with the Sponsors Acquisition of $212 per share was calculated utilizing a Black-Scholes Option Pricing Model
92
Table of Contents
(OPM). The application of the OPM involves inputs and assumptions that are judgmental and highly sensitive in the valuation of incentive awards and affects compensation expense related to these awards. These inputs and assumptions for the awards granted in connection with the Sponsors Acquisition include the following:
Value of PSAV Holdings LLC equity – The value of PSAV Holdings LLC equity was determined based on the total fair value of equity derived from the Sponsors Acquisition.
Exercise price – The exercise price input considers the distribution threshold assigned to the Class B units and the multiples of invested capital that must be achieved with respect to the performance units.
Expected volatility—In estimating the expected volatility applicable to the Class B Units, we considered (a) the historical volatility of comparable, publicly traded companies share prices; (b) implied volatility of comparable, publicly traded companies share prices determined from the longest dated publicly traded call options; and (c) relevered volatilities that adjust the public companies levered volatilities to be more consistent with our expected leverage over the expected term. A volatility factor of 45.0% was selected for application in our OPM.
Risk free interest rate—We utilized the five-year U.S. Treasury bond yield consistent with the expected term described below to estimate a risk-free rate of return of 1.6%.
Expected term—Our equity interests do not have a contractual term and rather represent economic interests in a privately held company without an active market for its equity which will benefit from a liquidation event. Since we are controlled by private equity affiliates of Goldman Sachs and Olympus Partners, the expected term utilized in our analysis is estimated to be five years which is based on the typical period private equity firms hold their investments.
Dividend yield—We have no current plans to declare a dividend that would require a dividend yield assumption other than zero.
Incorporating each of these inputs into the Black-Scholes Model yields a call option value for the publicly traded equivalent value of our equity as of the grant date. We calculated the incremental option value between the concluded call option values at each of the exercise prices. These incremental option values were then allocated amongst our Class A and Class B Units. A discount for lack of marketability was applied which yielded the fair value of the Class B Units.
We will continue to use judgment in evaluating the inputs and assumptions into our OPM on a prospective basis. However, once our shares are publicly traded, we will use the actual market price and will no longer need to estimate the value of our common stock.
As of June 30, 2015, we have determined that a distribution event relating to Class B Performance Units was not probable, and accordingly, no compensation cost has been recognized.
The Phantom Units act as an incentive for holders that are employed as of a distribution date to receive a cash payment. We are accounting for the Phantom Units as a contingent bonus; therefore, the Phantom Units are not within the scope of ASC Topic 718. Accordingly, related expense will be recognized only when payments become probable to Phantom Unit holders.
New Accounting Standard Updates
See Note 4 to our audited consolidated financials included in this prospectus for a full description of recent accounting standard updates, including the expected dates of adoption.
93
Table of Contents
Quantitative and Qualitative Disclosure About Market Risk
We are exposed to changes in interest rates and foreign currency exchange rates because we finance certain operations through variable rate debt instruments and denominate our transactions in a variety of foreign currencies. Changes in these interest rates and foreign currency exchange rates may have an impact on future cash flow and earnings.
We manage these risks through normal operating and financing activities and, when deemed appropriate, through the use of derivative financial instruments. By their nature, all such instruments involve risk, including the possibility that a loss may occur from the failure of another party to perform according to the terms of a contract (credit risk) or the possibility that future changes in market price may make a financial instrument less valuable or more onerous (market risk). As is customary for these types of instruments, we do not require collateral or other security from other parties to these instruments. In management’s opinion, there is no significant risk of loss in the event of nonperformance of the counterparties to these financial instruments. We do not use derivative financial instruments for trading or speculative purposes.
Interest Rate Risk
We are subject to market risks from fluctuation in interest rates on our variable-rate term loan borrowings. Our risk management philosophy is to limit our exposure to rising interest rates and minimize the negative impact on its earnings and cash flows. We currently use deferred premium interest rate caps agreements to limit this exposure. The fair value of the interest rate caps, which are not designated as hedging instruments, are included in other liabilities in the consolidated balance sheet as of December 31, 2014 and June 30, 2015 (net liabilities of $1.7 million and $2.2 million, respectively). The two caps limit our exposure to fluctuations in the U.S. dollar LIBOR rate above 3% through April 2018 on $342.5 million of debt. As we did not designate these as hedge instruments, the impact of changes in the fair values the interest rate caps is included in other income (expense).
A hypothetical increase in interest rates of 1% would have increased our interest expense in the 2014 Successor Period by $1.4 million (with no impact to our interest rate caps which are set at a higher level). A hypothetical decrease in interest rates of 1% would have had no impact on our interest costs as our borrowings are at LIBOR plus a set spread and the LIBOR rate is subject to a floor of 1%. LIBOR was below 1% for the entire period.
Foreign Currency Risk
As a result of our global operations, we generate approximately 8.5% of our sales and incur a similar portion of our expenses in currencies other than the U.S. dollar. As a result, our revenue, cost of sales, operating expenses and certain assets and liabilities fluctuate as the value of such currencies fluctuate in relation to the U.S. dollar. In addition, the results of operations of some of our operating entities are reported in currencies other than the U.S. dollar and then translated into U.S. dollars at the applicable exchange rate for inclusion in our financial statements. As a result, appreciation of the U.S. dollar against these other currencies generally will have a negative impact on our reported sales and profits while depreciation of the U.S. dollar against these other currencies will generally have a positive effect on reported sales and profits. We do not currently hedge our foreign currency exposure. Our exposure is primarily related to the Canadian dollar, Mexican peso, Dominican peso, British pound, euro, Emirati dirham and Singapore dollar.
During the years ended December 31, 2012 and 2013, the 2014 Predecessor Period, the 2014 Successor Period and the six months ended June 30, 2015, exchange rate changes did not have a material impact when translating our financial statements.
94
Table of Contents
Overview
PSAV is a leading provider of audiovisual and event technology services in North America. Our highly-trained technical staff delivers innovative solutions in support of events ranging from small meetings in single conference rooms to global multi-media conference events with thousands of attendees. As our customers look to deliver more dynamic and impactful events, the event technology services we provide are a critical need and continue to grow in importance.
We are the event technology provider of choice at leading hotels, resorts and convention centers (“venues” or “venue partners”). Our business model is based on long-term partnerships with these venues, which establish us as the exclusive on-site provider of event technology services. Our customers, including corporations, event organizers, trade associations and meeting planners, hire us primarily through our on-site presence at venues to plan and execute their events. We have built a premier brand based on our comprehensive service offerings, strong track record of customer service, broad geographic footprint and on-site employee service model. Our largest market is the United States where we hold the number one position and serve approximately ten times the total venues of our closest competitor. In addition, we have a leading position in three of the nine countries we serve internationally.
Our market-leading position and scale is evidenced by the following:
| • | We support over 1.5 million meetings per year and are hired by over 1,100 meeting planners and event organizers on average each day. |
| • | We are the exclusive on-site event technology provider to over 1,300 venues globally, including venues representing 46% of the meeting and event space across all luxury and upper upscale hotel properties within the United States. |
| • | More than 95% of our over 7,500 employees are customer-facing, working alongside our venue partners’ sales teams and hospitality staff. |
| • | We operate in nine international markets with leading positions in Canada, Mexico and the United Kingdom. |
| • | We have averaged 98% venue retention rates and organic growth of 46 new venue openings per year since 2010. |
We offer a compelling value proposition to both our venue partners and our customers. For our venue partners, meetings and events are an important source of revenue and profit. Through our services, these venues are able to generate significant incremental revenue with limited investment on their part. For our customers, meetings and events are critical marketing and communication vehicles to reach clients, employees and other stakeholders. Our event technology services enhance the delivery of the customer’s message to its audience and increase the overall impact of the event.
Our premier brand, scale and differentiated capabilities allow us to partner with some of the most iconic, marquee venues in the world, for whom we are the exclusive on-site provider of event technology services. Our venue partners consist primarily of luxury and upper upscale hotel properties, including properties operating under all 10 of the largest hotel chains as measured by meeting space in the United States, high-profile convention centers and other meeting spaces. Our long-term contracts with venues help align our mutual interests to maximize revenue and profitability from the customer events hosted at the venues. Our on-site staff interacts with the customer directly and is entrusted with maintaining the brand equity and professional standards of that particular venue.
95
Table of Contents
We offer our customers a comprehensive set of event technology solutions to address the entire scope of their events from planning to execution. The rising technological complexity and growing importance of meetings and events enhances the importance of the relationship between the customers holding an event and the venues and service providers executing the event. Leveraging our technical expertise, our sales and production teams work with customers directly to identify key messages and goals for an event and develop ways to convey those messages in a creative and compelling fashion. During the event, our technicians work to ensure the services are effectively, professionally and reliably delivered.
Our suite of services capitalizes on the industry’s growing demand for greater technological sophistication. We believe we have the broadest suite of services and solutions to meet the varied needs of venues and to capture the majority of their customers’ event planning spend. The following graphic illustrates some of our visible, and less visible, services:
We have experienced rapid growth as a result of our market-leading position, our contractual relationships with venues, our broad service offering and our strategic acquisitions. We have increased the number of contracted venues by approximately 60% since 2010 and averaged an annual same venue revenue growth of 11.1% over the same period through June 2015. In addition to our strong organic growth, our strategic acquisitions have enhanced our capabilities, increased our density in local markets and expanded our scale.
96
Table of Contents
Internationally, our broad, established and highly scalable platform allows us to capitalize on increasing customer spending on overseas events, and the global trend towards event technology outsourcing. We are taking advantage of this opportunity by entering new markets, expanding within the international markets of our leading hotel chain partners, building relationships with new international venue partners and making strategic acquisitions. By extending our international footprint, we will further solidify our existing venue relationships. Our annual international revenue has grown 35% since 2010.
Between 2010 and the 2014 Pro Forma Combined Period, our revenue increased from $573 million to $1,264 million, Adjusted EBITDA increased from $38 million to $157 million and net income (loss) improved from $(35.4) million to $(1.4) million. For the 2014 Pro Forma Combined Period, our revenue of $1,264 million grew 15% versus the prior year. In this same period, our Adjusted EBITDA of $157 million represented 12% of revenue and 20% growth over the prior year. Adjusted EBITDA is a non-GAAP measure. For a reconciliation of Adjusted EBITDA to net income (loss), see “Selected Historical Consolidated Financial Data.”
Our History
Through our focus on innovation and customer service, we have evolved from a small, regionally-based provider of audiovisual services to a leading global event technology services provider. Initially focused on U.S. hotel venues, we started developing relationships with venues at a time when most properties still chose to provide their own, in-house audiovisual services to their customers. By the 1990s, as events and the associated technology needs grew increasingly complex, we observed that more U.S. hotels began outsourcing event technology services given the need for specialized technical expertise and equipment. Over the last decade, this trend has accelerated. Hotels and other venues (such as convention centers, conference centers and sports stadiums) have increasingly outsourced a broader suite of event technology services to third parties in order to focus on their own core services. The majority of luxury and upper upscale U.S. hotels now outsource event technology services.
We anticipated this outsourcing trend and began establishing relationships with leading hotel chains at the corporate level, providing them with high quality and consistent services across multiple locations. These relationships served as an endorsement of our brand and provided access to their venues which helped fuel our growth. Over time, we have enhanced our original audiovisual services with more technically complex capabilities to meet our venue partners’ and customers’ evolving demands. The expansion of our service offering has increased the revenues for both us and our venue partners and has further solidified our long-standing relationships.
In addition to our core growth, we have continued to expand our business through strategic acquisitions. Our largest acquisition was Swank in November 2012. Swank was the second largest outsourced provider of event technology services for hotels, resorts and conference centers throughout the United States and brought to us additional talent and complementary venue relationships. Additionally, we acquired VAE in 2013, which broadened our portfolio of services, and we acquired AAVC in 2015, which increased our density in key U.S. markets. Each of these businesses has been fully integrated and allows us to offer our expanded suite of services across all venues.
More recently, we have focused on building our geographic footprint internationally. We continue to leverage our strong relationships with our leading international hotel chain partners in Canada, Mexico, Europe and the Middle East. In addition, we recently entered the Asian market by opening a location in Singapore. In April 2015, we acquired AVC Live to increase our venue footprint and customer relationships in the United Kingdom. We intend to continue to selectively pursue international acquisitions to further our growth.
97
Table of Contents
Industry Background
Our Addressable Market
We believe we have an approximately $42 billion total addressable market. Our primary addressable market is an estimated $23 billion global audiovisual and event technology services industry. In addition, we selectively participate in the just under $20 billion estimated market for the design and construction of permanent audiovisual installations.
The market for core event technology services focuses on equipment, staging and production, which we estimate to be $9.3 billion across U.S. hotels, conference and convention centers and non-traditional venues (e.g., museums, sports stadiums and wedding halls). Today, we provide event technology services primarily in hotels, with the substantial majority in the luxury and upper upscale segments. These segments comprise more than half of the hotel meeting space in the United States and tend to be a location of choice for business meetings and conferences which typically have more significant event technology requirements. Our 2014 Pro Forma Combined Period domestic segment revenue was $1,158 million.
We estimate the market for core event technology services internationally is $4.6 billion. Outside the United States, the geographies with the largest event technology spending include China, Western Europe, Southeast Asia, Japan and Canada. We expect demand for event technology services to grow faster in many regions internationally than in the United States, driven by higher economic growth rates, the trend toward more complex U.S.-style event production and the transition to outsourced event technology services. We currently operate in nine countries outside the United States, including the United Kingdom, France and Germany, and generated international segment revenue of $106 million for the 2014 Pro Forma Combined Period.
We also participate in what we estimate to be the $9.1 billion global market for specialty services in venues, including high-speed internet, power distribution and rigging. We believe rigging constitutes nearly half of that market and has been an area of growth for us since 2010. We believe the need for these services will continue to grow in importance for events. The proportion of our venue revenue generated by specialty services has increased from 8.4% in 2010 to 14.1% in the six months ended June 30, 2015. Our ability to provide these complementary services enhances our value proposition to our customers and allows us to capture a greater portion of the spend on each event.
98
Table of Contents
Meeting and Event Activity Historically Correlated with RevPAR
In the United States, meeting and event activity historically has been highly correlated with the hospitality industry metric Revenue per Available Room (“RevPAR”) and Group Revenue per Available Room (“Group RevPAR”), which are calculated by STR and PKF. STR is an independent, third-party service that collects and compiles the data used to calculate RevPar and Group RevPar, and PKF is an independent, third-party service that collects and compiles historical data used to calculate RevPAR. Whereas RevPAR is a total industry metric, Group RevPAR measures total guest hotel room revenue generated by group bookings (blocks of guest hotel rooms sold simultaneously in a group of ten or more rooms), divided by total number of available guest hotel rooms. Because meetings and events generally require lodging for their participants, event activity typically correlates with Group RevPAR at nearby hotels, regardless of whether the events themselves are held on-site at hotels or at other nearby venues. As we provide event technology services primarily in hotels in the luxury and upper upscale segments, we refer to Group RevPAR for hotels in these segments as they more closely align with our business.
Within the United States, RevPAR has grown on average by 5.1% annually since 1970 according to PKF. Group RevPAR is a newer industry metric and represents a segment of the RevPAR performance, but tracks closely to overall RevPAR. Since 1970, RevPAR has only decreased in times of significant downturns in travel such as after September 11, 2001 and during the global financial crisis that began in 2008. More recently, both RevPAR and Group RevPAR have demonstrated strong growth in the rebound from the financial crisis, with overall RevPAR growing at a CAGR of 5.3% since 2010. Looking ahead, RevPAR for luxury and upper upscale hotels is predicted to grow at 6.3% in 2015 and 6.1% in 2016, according to PwC based on STR data. Our revenue historically has been correlated with Group RevPAR and our same venue revenue growth has exceeded Group RevPAR growth for each of the past six years as we have increased average revenue per event and expanded the services we offer through our venues.
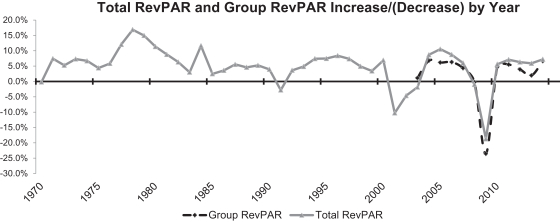
Industry Trends
Continued Importance of Meetings and Events. In-person meetings and events continue to be rated as the single most effective marketing and communication vehicle. Companies recognize that face-to-face interactions are highly impactful and continue to support in-person events, despite the ubiquity of technology-based solutions such as video conferencing, social media, company websites, articles and webinars. In most cases these technologies are used to supplement rather than replace in-person meetings. Meetings and events were estimated to contribute $280 billion of total spending in the United States in 2012, according to PwC, as companies and other organizations continue to deploy marketing budgets towards in-person meetings.
99
Table of Contents
Venues are Focused on Increasing Group Revenue. Revenues generated by group bookings (“Group Revenue”) were estimated to contribute approximately $40 billion in hotel revenue in the United States and approximately $100 billion globally as of 2013 according to research consolidated by Travel Click by Passkey. Group Revenue often constitutes a hotel’s most profitable segment because of the increased associated spend on meeting space, banquet catering and event technology services. Luxury hotels in particular have focused on expanding Group Revenue by growing aggregate meeting space at a 10% CAGR from 2009 to 2015. As hotels and other venues focus on this large and profitable segment of their business, they seek expanded service offerings to support meetings and events, including event technology services.
Rising Complexity in Event Technology. The rise in consumer technology has led to an increased demand for technological sophistication at meetings and events. These heightened expectations drive meeting and event planners to deliver a more interactive and engaging audience experience than they have in the past. For example, our customers are frequently requesting Wi-Fi access in all meeting spaces and seeking to use video, sound and staging to create branding and special effects for audience impact. The demands of tech-savvy audiences require more complex event technology solutions and trusted providers who can implement those solutions. This development has led to an increase in our average revenue per event across our domestic venues from $2,051 in 2010 to $3,124 in 2014.
Venues are Increasingly Outsourcing Event Technology Services. Given the rising complexity in event technology services and associated capital expenditure requirements, venues are increasingly looking to partner with outsourced providers such as us. Venues and customers benefit from high-quality customer service, broad service offerings and deep domain knowledge. At the corporate level, hotel chains benefit from a consistent standard of service across their venues. In addition, outsourced providers are often able to increase venues’ event technology revenue beyond what venues could achieve on their own because of event technology providers’ expanded offerings and specific focus on meetings and events. Since 2010, we have contracted to provide event technology services at 46 venues that were previously in-sourcing these services.
Internationally, Event Technology Opportunity Continues to Grow. We forecast that spending on event technology services at international venues will grow from an estimated $4.6 billion in 2015 to $5.4 billion in 2020, with many individual markets growing more quickly. We believe this growth is driven primarily by outsized economic growth in developing economies, increased globalization driving more meetings and events and U.S. hotel chains seeking to expand their international footprints. We expect international venues to increasingly adopt outsourcing of event technology services to realize the benefits of the on-site model that has proven successful in the United States.
Competitive Strengths
We believe our competitive strengths are as follows:
Highly Skilled Workforce with a Focus on Customer Service. We believe our ability to deliver high-quality, comprehensive event technology solutions is a direct result of our ability to hire, train and retain the best event technology services staff in the industry. More than 95% of our over 7,500 employees are in customer-facing roles. We provide numerous education and training programs to develop our personnel, focusing on hospitality and customer service as well as technical expertise. Our venue managers have an average tenure of nearly nine years and our regional vice presidents have an average tenure of approximately 15 years. Our employees’ technical expertise and familiarity with the specific venues in which they are based enable them to deliver seamless event execution to our customers.
100
Table of Contents
Long-Term Relationships with High-Profile Venues and Hotel Chains. We have a long track record of delivering high-quality, comprehensive event technology solutions at the venues with whom we partner, including luxury and upper upscale hotel chains who have high expectations for customer service and execution. In addition, hotel chains value our ability to provide a consistent level of service across their venues. We have long-term master service agreements (“MSAs”) signed with four of the five largest domestic hotel chains naming us as a preferred provider of event technology services at their hotels. Individual venues in the chain may then choose to contract with us as the exclusive on-site provider pursuant to the terms established in the MSA. The MSAs typically provide us with a powerful endorsement as the only chain-endorsed event technology services provider and position us well to establish new contracts with additional hotels in the chain. Our average relationship with our largest 20 venues is more than 11 years. For the individual venues where we provide on-site service, our integration with their operations and knowledge of their customers’ event technology needs provides them with strong incentives to renew their contracts with us, resulting in our average 98% annual venue retention rate since 2010.
U.S. Market Leader with Broad Reach, Expansive Scale and Breadth of Service Offerings. We are the audiovisual and event technology services market leader in the United States with significantly greater market share than any of our competitors. We have venue contracts representing 46% of the meeting and event space in all of the luxury and upper upscale hotel properties in the United States. Our deep and broad platform includes over 7,500 employees, over 1,300 worldwide on-site event technology venues and 44 global branch warehouse locations. Our scale and reach offers several advantages. First, it enables us to offer the broadest range of event technology services and solutions, from core audiovisual services to specialty services such as rigging and power. Second, our network density enables us to leverage our people and our specialized equipment efficiently, driving higher margins and allowing us to provide our services at a wider range of venues cost effectively. Finally, our scale provides a barrier to entry to smaller, regional providers who we believe are unable to provide comparable expertise and capabilities.
101
Table of Contents
Strong Historical Same Venue Revenue Growth. In the United States, our historical same venue revenue growth has exceeded Group RevPAR by an average of 640 basis points since 2010 as shown in the table below. We have been able to achieve this revenue growth due to our track record of outstanding customer service, increasing suite of services and sales team effectiveness. Our comprehensive solution set has enabled us to benefit from the industry-wide increase in technology spend per event as our customers migrate to more advanced technologies and purchase more of our services to support their events. For example, the proportion of our venue revenue generated by specialty services has increased from 8.4% in 2010 to 14.1% in the six months ended June 30, 2015. As these underlying trends continue, we expect our differentiated capabilities will allow for continued growth in same venue revenue.
Strong and Growing International Presence. We have a leading market position in Canada, Mexico and the United Kingdom with a presence in France, Monaco, Germany, United Arab Emirates, Dominican Republic and Singapore. We have strong relationships internationally with both venues and customers, and we currently provide a broad range of services at nearly 300 on-site properties outside the United States. Our contractual relationships with leading hotel chains and strong market position provide us with a competitive advantage over small, local providers who lack our scale and technological expertise.
Compelling Financial Model with Multiple Levers to Drive Profitability and Manage Free Cash Flow. Our strong free cash flow allows us to continue to invest in our business, our people and our equipment. Furthermore, we have a flexible cost structure that allows resiliency in varied market conditions. Our overall cost of revenue is approximately 75% variable, driven by the variable nature of hotel commissions, which is our primary expense. Our part-time labor force and strategic network of branch locations allow us to manage peak demand and sustain margins. Furthermore, most of our capital investment is success-based, with most significant capital investments tied to new or renewed venue contracts which are evaluated against our return requirements. The resulting flexibility in our cost structure and capital requirements allows us to deliver high-quality service to our customers while maintaining profitability and strong free cash flow.
Proven Management Team with Deep Industry Expertise. Our management team combines deep industry expertise with specific functional experience. They have presided over significant growth in the past several years and have led our transformation into a global event technology service provider. At the same time, they have instilled a collaborative company culture focusing on innovation
102
Table of Contents
and customer service, which has resulted in significant growth, high levels of satisfaction across customers and venue partners and a best-in-class team. Our senior operational team has an average of 18 years of industry experience and has operated across a variety of economic conditions and geographies.
Growth Strategies
We intend to pursue the following growth strategies in order to enhance our market leading position:
Capture More Events at Existing Venues. We believe significant opportunity exists to capture incremental events at our venues. We estimate that we currently service approximately 70% of the event technology spend in our existing venues with the remaining 30% spent by customers on other event service providers without an on-site venue presence. In particular, capturing a greater percentage of large events (i.e., those with more than 500 attendees) represents a significant opportunity as we believe our current capture rate for these events is just over 50%. We are developing a number of initiatives with our on-site sales teams and our venue partners to increase our capture rate at existing venues.
Win New Venue Partners. We intend to expand our revenue by pursuing new venue partners. We estimate we have contracts with approximately 40% of the luxury and upper upscale U.S. hotel venues, and we believe that the remaining 60% provides a significant target market in which to win new venues. In addition, with less than 10% of our revenues generated from events at non-hotel venues, we believe we have a significant opportunity in the $6.2 billion non-hotel venue market including convention centers, sports stadiums, theaters, museums and other cultural centers, as we have on-site contracts at select non-hotel venues and additionally provide services to existing customers at non-hotel venues where we are not currently the preferred on-site provider of event technology services.
Win More Customers Independent of Venue. Certain customers choose to work directly with us because their event technology needs require highly customized solutions or because they seek a consistent solution across a range of venues or geographies. We currently engage with approximately 250 of these customers by assigning a single PSAV point of contact to manage the customer’s events regardless of their venue selection. This market represents a significant revenue opportunity as a large portion of the domestic marketplace continues to be serviced by event technology providers who are not on-site at a particular venue. We plan to leverage our broad branch network and specialized sales teams to continue to capture incremental market share through established relationships with large corporations, associations and meeting planners.
Develop and Market Adjacent Services to Increase Revenue per Event. The trend towards increased technology spend per event is creating substantial opportunities to increase our event technology revenue across our suite of services. In the near term, we believe this trend will allow us to further penetrate the $9.1 billion specialty services market. Our event technology services that are considered part of the specialty services market include rigging, power, Wi-Fi services and creative services and contributed $36 million of revenue in 2010, which has grown to $138 million of revenue in the 2014 Pro Forma Combined Period. We will continue to focus on expanding our suite of services to grow our event technology revenue. Over the longer term, we believe that our close relationships with customers and extensive market presence will enable us to continue to anticipate event technology trends and innovate new services, thereby capturing additional revenue opportunities.
Continue to Expand Margins Through Operational Efficiencies. We have proven our ability to leverage operational efficiencies in driving profitability as our Adjusted EBITDA margin has
103
Table of Contents
expanded by approximately 580 basis points between 2010 and the 2014 Pro Forma Combined Period. We have several initiatives in process to continue to increase margins, focused primarily on labor and equipment utilization. For example, we are improving our labor utilization by standardizing our planning and forecasting of our hourly workforce to optimize staffing levels. We are improving our equipment utilization by increasing the sharing of equipment between individual venues within a market and improving the use of our branch network to serve multiple, nearby venues. We also expect growth in our free cash flow as we implement further capex efficiencies.
Expand International Revenue. The $4.6 billion international event technology services market represents a compelling growth opportunity. The four largest U.S.-based hotel chains with whom we have strong domestic relationships represent approximately 25% of total hotels in key addressable international markets. We intend to leverage our relationships with these and other U.S.-based hotel chains to expand our footprint into their international locations. In addition, we intend to enter new markets as we have recently done in Singapore. Our brand recognition, industry expertise and scale make us well-positioned to seize this significant growth opportunity.
Selectively Pursue Acquisitions. We intend to pursue acquisitions to enter new markets and accelerate growth in existing markets. Over the past few years we have acquired and integrated four event technology service providers and have demonstrated a track record of achieving forecasted synergies. We maintain a pipeline of acquisitions which we evaluate based on established investment criteria including alignment with our culture and customer focus. We source acquisition targets through market research, direct relationships within our industry and reverse inquiry from founders and CEOs of smaller event technology service providers. We believe international markets represent a compelling opportunity for acquisitions given their highly fragmented nature and early stages in outsourcing of event technology services.
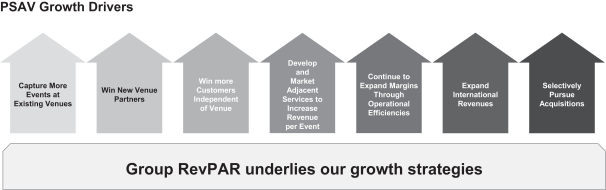
Our Platform
Our highly trained and skilled workforce and our extensive venue and branch network establish a differentiated platform to deliver event technology services.
Our people are the most important asset in developing and maintaining our venue and customer relationships and in delivering high quality service. More than 40% of our full-time domestic workforce has worked with us for more than five years and has an average tenure of 11.3 years. We recruit highly motivated people who have expertise in selling tailored solutions to customers, and we train them in sophisticated technical solutions. We are fully committed to the ongoing professional development of our personnel. In 2014, we hired new leadership to focus on training and the further enhancement of our systems. We have also recently implemented a learning management system, which includes technical, general business, sales leadership and management training.
104
Table of Contents
Our global delivery network consists of an unmatched footprint of more than 1,300 venue partners and 44 global branch network locations strategically located in the key meeting and event geographies where we operate. This network provides our customers access to a broad range of service capabilities and equipment, including specialized or less frequently used equipment and enables us to service even small venues efficiently.
We enter into long-term contracts with our venues to be the exclusive on-site provider of audiovisual and event technology services. In exchange for exclusivity, we pay a commission to our venues based on event technology revenue we generate at their meeting facilities. We believe this commission aligns the incentives of our venue partners with our own as we both seek to maximize revenue. We also sign MSAs with top hotel chains (including four of the five largest U.S. hotel companies) naming us as a preferred event technology services provider for each of the venues in a given hotel chain. Each local venue then executes an individual contract if it elects to partner with us.
We believe that entering into an MSA with the corporate hotel chain provides an endorsement of our brand that individual properties will consider when determining whether to enter into a contract for us to be their exclusive on-site provider of event technology services.
The MSAs typically have terms of three to six years and provide the framework (including commission rates, incentives, reporting and execution obligations, insurance and indemnification obligations and obligations of the hotel chain to endorse us to their properties). The MSAs typically include the form of individual property level service agreements which specify our equipment and service levels, commission rates and each parties’ obligations for the individual hotel properties within the hotel chain that choose to partner with us. Our contracts with venues typically have terms of three to six years. MSAs and individual service agreements can typically be terminated by the hotel chain or partner venue for a breach by us of a material provision of the agreement (following a cure period of typically 30-60 days) or specified bankruptcy events with respect to us. We generally can terminate the MSA or individual service agreements for a breach of a material provision by the hotel chain or individual property (following a cure period of typically 30-60 days) and in connection with specified bankruptcy events of the hotel chain or individual property.
Our Venue Model
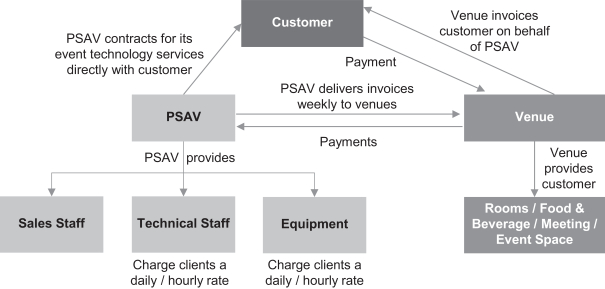
105
Table of Contents
Our services are deployed as follows by our team during the event planning and execution phases:
| • | Event Planning. Our sales personnel meet customers during the planning phase to provide consultation around our portfolio of event technology services. The sales personnel then communicate the customer’s vision to our production team, which consists of industry experts such as staff producers, stage managers, video editors and graphic designers. These staff members can also work in concert with our innovative creative services team to collaborate with customers to establish ways in which the technical solutions and services can convey key messages in a more compelling fashion. We also embed a senior relationship manager at each venue whose responsibility is the general oversight of all the functions associated with servicing our customers at the venue. |
| • | Event Execution. During the actual event, our trained technicians achieve a high level of execution by closely monitoring and troubleshooting the event to address any issues promptly as they occur. Our customers rely on our experience at venues to advise them on event technology needs. Our equipment is either already held on-site or delivered from our branch network to support the event. Our skilled technicians focus on service delivery and have earned a reputation for customer satisfaction. |
Sales and Marketing
Our sales and marketing team is organized across three different dimensions: winning new venues; increasing sales at existing venues; and selling to customers directly independent of venue.
To continue to expand our venue footprint, our regionally-based sales and marketing teams foster relationships with key executives, solicit prospects and execute direct marketing campaigns at the venue level. These teams are focused on adding venues to our network across hotels, convention centers, conference centers and non-traditional venues. The sales team pursues a disciplined sales process and utilizes economic models to evaluate capital investment against projected cash flow over a specific target payback period.
Within our venues, our on-site event sales team leads the sales process with customers. Working in partnership with the venue’s own staff, our sales professionals analyze the venue’s reservations and together identify strategies to best manage group meetings and events. This relationship allows our sales team to secure more business. To help service over 1.5 million meetings per year, our sales team leverages our advanced customer relationship management (“CRM”) platform, which contains proprietary customer and industry information, along with an innovative suite of e-tools, which includes tailored websites and a mobile app to track customer history and preferences within our network. Once the scope of services is contracted with the customer, our sales team will work with our technicians to plan and execute the event.
For a small but growing number of repeat customers, we have begun selling directly through a single, PSAV point of contact. These customers are holding either very large shows with thousands of attendees or frequent, smaller shows that require consistent services replicated across the globe. They are covered by our most experienced event sales managers who are organized by customer segment to create distinct strategies based on the customers’ requests. Our sales managers become intimately familiar with the specific needs of each customer and our dedicated support staff delivers a high-touch customer experience regardless of venue. Today, we serve over 250 national accounts through this channel, including national associations and trade shows, international government agencies, leading corporations and production companies.
106
Table of Contents
Our Services
Our large and highly trained workforce delivers the industry’s broadest suite of event technology services to allow our customers maximum flexibility in creatively designing and executing events. Customers use an increasing number of our services, depending on the scope and complexity of the event, to accomplish their meeting or event objective.
The following are some examples of customer uses of our service offerings:
| • | A small and growing business holding its leadership meeting will use our digital projection and sound technology to ensure all attendees leave with a clear message. |
| • | A consumer goods company announcing a product launch will use lighting and visual imagery to create the right branding for the event while leveraging our rigging and power capabilities to transform the physical meeting space. |
| • | A technology company holding a major developers’ conference will engage our creative services team to design messaging and content that will impact audience engagement to reinforce its culture. |
| • | A global pharmaceutical company training its sales force will work with us to stream video to an audience around the world while using interactive tools and our simultaneous language translation platform to enable any viewer to ask questions. |
Regardless of our customers’ event size or objective, our services deliver an exceptional experience to their attendees. The service offerings that we offer our customers are detailed below:
| Video |
Audio | |||||

|
Technology includes front and rear projection from large format HD high lumen projection to boardroom-style projectors, playback systems, image magnification, digital capture, cameras and display systems, including LED displays and video walls |

|
Full range of microphone and sound solutions with digital mixers, wireless microphones, networked audio and proprietary software to control live sound systems | |||
| Rigging Solutions |
Lighting | |||||

|
Solutions include design and installation of permanently installed rig points in meeting venues, day-to-day deployment of rigging systems to safely transform meeting and event spaces for larger and more sophisticated set and lighting designs and certified trainers and inspectors |

|
Speaker and stage lighting, intelligent lighting and decorative and theatrical lighting through gel lights and LED lights | |||
107
Table of Contents
| Wi-Fi Solutions |
Power Distribution Solutions | |||||

|
Our capabilities include managing our venues’ entire network to provide customers secure and reliable wired and wireless solutions. Our Meeting Room Manager configuration allows bandwidth allocation for mission-critical applications |

|
Streamlining of special event power distribution for event and production power across events, meeting rooms and trade shows | |||
| Staging |
Event Consultation and Support | |||||

|
With one of the largest collections of custom screens and the ability to provide concert sound, broadcast quality projection, seasoned stage producers, CAD drawing and the experienced production team, staging incorporates the elements listed above but in large, technically complex settings |

|
Trained staff (including producers and stage managers) consult with customers for the entire scope of their event from planning to execution. This includes meeting accessories necessary to create a productive environment, including simple flip charts, laptop computers, dongles, printers and teleconference support | |||
| Creative Services |
Virtual Meetings and Events | |||||

|
Thematic creation, PowerPoint display, video creation, stage sets and a team of producers engage to deliver a customer’s marketing and communication goals |

|
Webcasting, webstreaming and social media display support this growing non-traditional segment that complements face-to-face events. Capabilities give customers streamable, playable and recordable solutions for delivering on-site audio, video and presentations to off-site viewers and listeners | |||
| Mobile Device Applications |
Video Mapping / Simultaneous Translation | |||||

|
Custom-designed mobile device applications tailored to the specific events that provide the schedule of events, maps, sponsors and detailed information on the host customer |

|
Video Mapping: Advanced projection technologies (including 3D projection mapping) allows images to be projected on to a variety of building surfaces to provide illusion of movement
Simultaneous Translation: Leading provider of simultaneous interpretation equipment and services in the United States in support of key global and governmental customers | |||
Competition
We are the largest provider of event technology services in the United States, and we compete with a limited number of global event technology providers. We have approximately five times the total venues of our closest competitor, which is Freeman Company. Beyond Freeman, the market is highly fragmented and includes a number of smaller regional providers with limited service offerings. Additionally, a number of venues still in-source event technology services, including many Marriott properties in the United States. Internationally, the market is even more fragmented than in the United States, as numerous small staging companies support venues and customers in single regions.
108
Table of Contents
Within some regions we also compete with regionally-based staging companies, which support selected events within our contracted venues. We estimate that 30% of the event technology services spend taking place within our venues is spent with outside vendors. Many of our larger geographic markets have several small staging companies ranging from simple rental companies that will drop off equipment to production companies that will manage and produce the event for a customer.
We believe that we have a competitive advantage over local providers given our scale, network locations, breadth of services and highly-skilled and stable workforce. We also believe that venues will continue to shift away from in-sourcing of event technology services as they realize the benefits of the outsourced model.
Customers and Venue Partners
Our venue partners include hotel chains, convention centers, meeting spaces and sport facilities. We have entered into long-term contracts with many of these venues, which establish us as the exclusive on-site provider of event technology services. For some of the larger hotel chains, we have entered into long-term MSAs, whereby they have agreed to name us as the preferred event technology services provider to their hotels. Individual hotels in the chain may then choose to contract with us as the exclusive on-site provider of their event technology services and provide us with access to the customers who book events at their hotels. See “—Our Platform” for further information regarding our MSAs and individual property level service agreements.
We operate in venues belonging to all 10 of the top hotel chains in the United States. In 2014, we renewed our MSAs with, among others, Starwood Hotels & Resorts Worldwide, Inc., Hilton Worldwide Holdings Inc., Fairmont Hotels and InterContinental Hotels Group PLC, extending our MSAs with these partners to 2019 or later. Approximately 38% of 2014 domestic revenue was generated in venues affiliated with these four hotel chains.
Our customers include corporations, event organizers, trade associations and meeting planners.
Regulation
Although we do not believe that significant existing laws or government regulations adversely impact us, our business could be affected by different interpretations or applications of existing laws or regulations, future laws or regulations or actions by domestic or foreign regulatory agencies. Failure to comply with these and other laws and regulations may result in, among other consequences, administrative enforcement actions and fines, class action lawsuits and civil and criminal liability.
Many jurisdictions impose an obligation on any entity that holds personally identifiable information or payment card information to adopt appropriate security to protect such data against unauthorized access, misuse, destruction, or modification. Many jurisdictions have enacted laws requiring holders of such information to take certain actions in response to data breach incidents, such as providing prompt notification of the breach to affected individuals and government authorities. We are implementing and maintaining physical, technical and administrative safeguards intended to protect all personal data and have processes in place to assist us in complying with applicable laws and regulations regarding the protection of this data and properly responding to any security incidents. We are adopting a system security plan and security breach incident response plans to address our compliance with these laws.
109
Table of Contents
Employees
As of June 30, 2015, we employed approximately 7,500 people, approximately 6,200 of which were on a full-time basis. In the United States, approximately 8% of our hourly wages related to employees are covered by union agreements that expire at various times from 2015 to 2026. We have not experienced any work stoppages, strikes or labor disputes. We consider our relations with employees to be good.
Properties
Our corporate headquarters are located at 5100 N. River Road, Suite 300, Schiller Park, Illinois 60176, in a leased facility. We lease all of our properties. The following table summarizes information regarding our significant leased properties as of September 1, 2015.
| Location |
Type |
Location |
Type | |||
| Domestic |
Domestic | |||||
| Scottsdale, Arizona (Phoenix) | Office |
Erlanger, Kentucky (Cincinnati) | Branch | |||
| Scottsdale, Arizona (Phoenix) | Office |
Metairie, Louisiana (New Orleans) | Branch | |||
| Scottsdale, Arizona (Phoenix) | Branch |
Dedham, Massachusetts (Boston) | Branch | |||
| Tempe, Arizona (Phoenix) | Warehouse | Newton, Massachusetts (Boston) | Warehouse | |||
| Tempe, Arizona (Phoenix) | Branch | Germantown, Maryland | Warehouse | |||
| Cerritos, California (Los Angeles) | Branch | Lanham, Maryland (Washington D.C.) | Branch | |||
| Long Beach, California | Field Support | Fenton, Missouri (St. Louis) | Branch | |||
| Oakland, California | Field Support | St. Louis, Missouri | Warehouse | |||
| San Bruno, California | Warehouse |
Asheville, North Carolina | Branch | |||
| San Diego, California | Branch | Cary, North Carolina | Branch | |||
| San Francisco, California | Branch | Charlotte, North Carolina | Branch | |||
| Denver, Colorado | Branch | Las Vegas, Nevada | Branch | |||
| Vail, Colorado | Branch | New York, New York | Branch | |||
| Davie, Florida (South Florida) | Branch | Philadelphia, Pennsylvania | Branch | |||
| Orlando, Florida | Branch | Charleston, South Carolina | Branch | |||
| Atlanta, Georgia | Branch | Hilton Head Island, South Carolina |
Branch | |||
| Norcross, Georgia (Atlanta) | Branch | Coppell, Texas (Dallas) |
Branch | |||
| Honolulu, Hawaii | Branch | Houston, Texas |
Branch | |||
| Kawaihae, Hawaii (Big Island) | Warehouse |
San Antonio, Texas |
Branch | |||
| Maui, Hawaii | Warehouse |
Salt Lake City, Utah |
Branch | |||
| Elgin, Illinois | Warehouse | Alexandria, Virginia |
Warehouse | |||
| Elmhurst, Illinois (Chicago) | Branch | Fairfax, Virginia |
Sales Office | |||
| Schiller Park, Illinois | Corporate | Tukwila, Washington (Seattle) |
Branch | |||
| International |
International | |||||
| Calgary, Canada | Branch | Guadalajara, Mexico | Warehouse | |||
| Montreal, Canada | Branch | Monterrey, Mexico | Warehouse | |||
| Vancouver, Canada | Branch | Monterrey, Mexico | Sales Office | |||
| Vaughan, Canada (Toronto) | Branch/Corporate | Naucalpan, Mexico | Branch/Corporate | |||
| Alfortville, France (Paris) | Branch | Vallarta, Mexico | Warehouse | |||
| Büro, Germany (Frankfurt) | Branch | London, United Kingdom | Corporate | |||
| Freising-Pulling, Germany (Munich) | Branch | London, United Kingdom | Branch | |||
| Cabos, Mexico | Branch | Slough, United Kingdom | Branch | |||
| Cancun, Mexico | Branch | Surrey, United Kingdom | Branch | |||
Intellectual Property
Our ability to protect our intellectual property is and will be an important factor in the success and continued growth of our business. We rely on a combination of copyright, trademark, patent and trade secret laws, as well as employee and third-party non-disclosure, confidentiality and other types of contractual arrangements to establish, maintain and enforce our intellectual property rights.
110
Table of Contents
Legal Proceedings
From time to time, we are subject to claims in legal proceedings, including employment claims, wage and hour claims, contractual and commercial disputes and other matters that arise in the ordinary course of our business. While the outcome of these and other claims cannot be predicted with certainty, we do not believe that the outcome of these matters will have a material adverse effect on our business, results of operations or financial condition.
111
Table of Contents
Directors and Executive Officers
The following table sets forth the names, ages and positions as of October 15, 2015, of the individuals who will serve as our executive officers and directors at the time of this offering.
| Name |
Age | Position | ||
| J. Michael McIlwain | 50 | President, Chief Executive Officer and Director | ||
| Benjamin E. Erwin | 38 | Chief Financial Officer | ||
| Skylar Cunningham | 57 | Chief Operating Officer | ||
| J. Whitney Markowitz | 47 | Chief Legal Officer and Secretary | ||
| Manu Bettegowda | 42 | Chairman | ||
| Louis J. D’Ambrosio | 52 | Director | ||
| Evan Eason | 41 | Director | ||
| John J. Gavin | 59 | Director | ||
| Bradley J. Gross | 42 | Director | ||
| Larry B. Porcellato | 57 | Director | ||
| Leonard Seevers | 32 | Director |
J. Michael McIlwain has served as our President and Chief Executive Officer and as a member of our board of directors since May 2011. In addition, Mr. McIlwain served as our Chief Financial Officer from August 2009 to May 2011. Prior to joining us, Mr. McIlwain served as Chief Financial Officer of Motor Coach Industries International Inc. Mr. McIlwain has more than 20 years of financial and managerial experience, and began his career as a Certified Public Accountant with KPMG. Mr. McIlwain was elected to serve on our board of directors due to his role as our President and Chief Executive Officer, his experience in the event technology services industry, his executive leadership experience and his intimate knowledge of the operational, financial and strategic development of our company.
Benjamin E. Erwin has served as our Chief Financial Officer since February 2015. Prior to joining us, Mr. Erwin served as Chief Financial Officer of TestAmerica Laboratories, Inc. from April 2011 to January 2015, where he led all accounting, finance, treasury, information technology and legal functions. Prior to 2011, Mr. Erwin joined the Cornell Companies Inc. in 2002 and served as Senior Vice President Corporate Development from March 2007 to December 2010, where he managed corporate strategy, financial planning and analysis, public market capital transactions and investor relations. Additionally, Mr. Erwin held various positions at Enron Corporation and Trilogy Software Inc.
Skylar Cunningham has served as our Chief Operating Officer since July 2009. Since joining us in 1997, Mr. Cunningham has held a variety of positions with us, including Senior Vice President of Operations, Senior Vice President of Finance, Divisional President and Executive Vice President of Hotel Operations. Prior to joining us, Mr. Cunningham served as President of Bauer Audio Visual, Inc. before its acquisition by us in 1997. Additionally, Mr. Cunningham served as Vice President of Finance for Pratt Hotel Corporation.
J. Whitney Markowitz has served as our Chief Legal Officer and Secretary since July 2000, overseeing legal and compliance for us, including legal services, risk management and internal audit. Prior to joining us, Mr. Markowitz served as the Assistant General Counsel for KSL Resorts. Prior to KSL Resorts, Mr. Markowitz worked in both the public and private sectors, where he practiced general corporate, transactional, labor and employment, real estate and land use planning law.
Manu Bettegowda has served on our board of directors since January 2014, and as Chairman of our board of directors since May 2015. Mr. Bettegowda joined Olympus Partners in 1998 and has served as Partner since 2005. Previously, Mr. Bettegowda focused on mergers and acquisitions,
112
Table of Contents
leveraged buyouts, and refinancing of middle market companies at Bowles Hollowell Conner & Co. Mr. Bettegowda was selected to serve on our board of directors due to his experience in private equity fund management, his financial expertise and his affiliation with Olympus Partners.
Louis J. D’Ambrosio has served on our board of directors since August 2014. Mr. D’Ambrosio currently serves as the Executive Chairman of the board of directors of Sensus, a smart metering company. Mr. D’Ambrosio served as Chief Executive Officer and President of Sears Holdings Corporation from February 2011 to February 2013 and as the Chief Executive Officer and President of Avaya Inc. from July 2006 to June 2008. Mr. D’Ambrosio previously served in various other roles for Avaya Inc., joining the company in December 2002. Before joining Avaya Inc., Mr. D’Ambrosio spent 16 years at International Business Machines Corporation, where he held several executive posts and was a member of the worldwide management committee. His roles included leading strategy for global services, sales and marketing for software, and industry operations for Asia Pacific. Mr. D’Ambrosio was selected to serve on our board of directors due to his valuable experience in leading Fortune 500 companies, his experience serving as a director of public and private companies and overall business acumen.
Evan Eason has served on our board of directors since January 2014. Mr. Eason joined Olympus Partners in 2006 and has served as Partner since 2012. Previously, Mr. Eason was a Vice President at American Capital Strategies, where he focused on leveraged buyouts and financings of middle market companies. Prior to that, Mr. Eason worked at FdG Associates, a middle market private equity firm, and as an investment banker and research analyst at Montgomery Securities. Mr. Eason has served on the board of directors of NPC Restaurant Holdings LLC since December 2011. Mr. Eason was selected to serve on our board of directors due to his experience in private equity fund management, his financial expertise and his affiliation with Olympus Partners.
John J. Gavin has served on our board of directors since July 2015 and as chair of our audit committee since July 2015. Mr. Gavin has served as Chairman and former Chief Executive Officer and President of Strategic Distribution, Inc. since 2011 and as a Senior Operating Advisor of LLR Partners, LLC since 2010. Prior to joining LLR Partners, Mr. Gavin served as Vice Chairman of Drake Beam Morin, Inc., where he had previously served as Chief Executive Officer and President since 2006. Prior to joining Drake Beam Morin, Inc., Mr. Gavin spent eight years at Right Management Consultants Inc. as Director, President and Chief Operating Officer. Mr. Gavin was employed at Arthur Andersen LLP for 18 years in which he served as the Partner-in-Charge of the Manufacturing, Distribution and Consumer Products Practice, from 1995 to 1996. Mr. Gavin currently serves on the board of directors of CareerMinds, Inc. and Strategic Distribution, Inc. since 2011, Ameriquest Business Services, Inc. since 2012 and Gypsum Management and Supply, Inc. since 2014. He served on the board of directors of Tribridge, Inc. from 2010 to 2015, DFC Global Corp. from 2007 to 2014, CSS Industries, Inc. from 2007 to 2013, GCA Services, Inc. from 2004 to 2012 and Interline Brands, Inc. from 2005 to 2012. Mr. Gavin was selected to serve on our board of directors due to his significant experience and expertise in international operations, finance and human capital management.
Bradley J. Gross has served on our board of directors since January 2014. Mr. Gross first joined Goldman, Sachs & Co. in 1995 and has served as a Managing Director in the Principal Investment Area of Goldman, Sachs & Co. since 2007. Mr. Gross has also served as a director of Americold Realty Trust since December 2010, Griffon Corporation since September 2008, Neovia Logistics Services, LLC since February 2015 and Proquest, LLC since December 2013. During the last five years, Mr. Gross served as a director of Aeroflex Holding Corporation, Cequel Communications, LLC, Flynn Restaurant Group, LLC and Interline Brands, Inc. Mr. Gross was selected to serve on our board of directors due to his service on a variety of corporate boards, his financial expertise and his affiliation with Goldman, Sachs & Co.
113
Table of Contents
Larry B. Porcellato has served on our board of directors since August 2014. He served as Chief Executive Officer of The Homax Group, Inc., a specialty application consumer products supplier to the home care and repair markets, from January 2009 to July 2014. Prior to that, Mr. Porcellato served as Chief Executive Officer of ICI Paints North America, a manufacturer and distributor of decorative coatings, from December 2000 to January 2007, and as an independent business consultant from February 2007 to December 2008. Mr. Porcellato has served on the board of directors of HNI Corporation since 2004 and OMNOVA Solutions, Inc. since September 2008. Mr. Porcellato was selected to serve on our board of directors due to his chief executive officer experience, his service as a director of other publicly traded companies and his significant knowledge and expertise in the areas of strategy, general management and finance, accounting and financial reporting.
Leonard Seevers has served on our board of directors since January 2014. Mr. Seevers joined Goldman, Sachs & Co. in 2005 and has been a Vice President in the Principal Investment Area since 2011. Mr. Seevers also serves on the board of directors of Sensus, PSS Companies and Cell Site Solutions. Mr. Seevers was selected to serve on our board of directors due to his service on a variety of corporate boards, his financial expertise and his affiliation with Goldman, Sachs & Co.
Composition of Our Board of Directors
Our business and affairs are managed under the direction of the board of directors. Our board currently consists of eight directors and will consist of 10 directors at the time of this offering. Under the stockholders agreement, entities affiliated with Goldman Sachs will have the right to designate (i) three directors if it owns at least 50% of the common stock it holds at the closing of this offering (the “Closing Date Shares”), (ii) two directors if it owns at least 25% but less than 50% of its Closing Date Shares and (iii) one director if it owns at least 15% but less than 25% of its Closing Date Shares. Olympus Partners will have the right to designate (i) three directors if it owns at least 50% of its Closing Date Shares, (ii) two directors if it owns at least 25% but less than 50% of its Closing Date Shares and (iii) one director if it owns at least 15% but less than 25% of its Closing Date Shares. The Goldman Sachs director designees are initially Bradley J. Gross, Leonard Seevers and . The Olympus Partners director designees are initially Manu Bettegowda, Evan Eason and .
Our amended and restated certificate of incorporation that will be in effect prior to the consummation of this offering provides that the number of directors may be fixed from time to time by resolution of our board of directors. In the case of a vacancy on our board of directors created by the removal or resignation of a director designated by entities affiliated with Goldman Sachs or Olympus Partners, as applicable, the stockholders agreement will require us to fill such vacancy with an individual designated by such entity. Upon the completion of this offering, our board of directors will have 10 members and the terms of office of members of our board of directors will be divided into three classes:
| • | Class I directors, whose terms will expire at the annual meeting of stockholders to be held in 2016; |
| • | Class II directors, whose terms will expire at the annual meeting of stockholders to be held in 2017; and |
| • | Class III directors, whose terms will expire at the annual meeting of stockholders to be held in 2018. |
Our Class I directors will be , our Class II directors will be and our Class III directors will be . At each annual meeting of stockholders, the successors to the directors whose terms will then expire will be elected to serve from the time of election and qualification until the
114
Table of Contents
third annual meeting following such election and until their successors are duly elected and qualified or until his or her earlier death, resignation or removal. Subject to the stockholders agreement, any vacancies in our classified board of directors will be filled by the remaining directors, and the elected person will serve the remainder of the term of the class to which he or she is appointed. Any additional directorships resulting from an increase in the number of directors will be distributed among the three classes so that, as nearly as possible, each class will consist of one-third of the directors.
Controlled Company Exemption
Following this offering, we will be considered a “controlled company” under the New York Stock Exchange listing standards. “Controlled companies” under those rules are companies of which more than 50% of the voting power is held by an individual, a group or another company. On this basis, we will avail ourselves of the “controlled company” exception under the New York Stock Exchange listing standards, and we are not subject to the New York Stock Exchange listing requirements that would otherwise require us to have: (a) a board of directors comprised of a majority of independent directors; (b) a compensation committee composed solely of independent directors; and (c) a nominating committee composed solely of independent directors.
Role of the Board in Risk Oversight
One of the key functions of our board of directors is informed oversight of our risk management process. Our board of directors will administer this oversight function directly, with support from its three standing committees, the audit committee, the compensation committee and the nominating and corporate governance committee, each of which addresses risks specific to its respective areas of oversight.
The audit committee will monitor compliance with legal and regulatory requirements. Our compensation committee will assess and monitor whether any of our compensation policies and programs has the potential to encourage excessive risk-taking. Our nominating and corporate governance committee will monitor the effectiveness of our corporate governance guidelines and recommend amendments to our board of directors as necessary.
Independent Directors
As a controlled company, our board of directors is not required to consist of a majority of directors who meet the definition of independent under the New York Stock Exchange listing requirements, but will become subject to certain independence requirements relating to the audit committee. The audit committee is currently required to consist of only one director who satisfies the independence requirements under the New York Stock Exchange listing requirements and Rule 10A-3 under the Securities Exchange Act of 1934, as amended, or the Exchange Act, until the date that is 90 days after the date of this public offering, after which time the audit committee must consist of a majority of directors who satisfy the independence requirements under the New York Stock Exchange listing requirements and Rule 10A-3 under the Exchange Act. The audit committee is required to consist solely of independent directors by the first anniversary of the initial public offering.
Our corporate governance guidelines will provide that after we cease to be a controlled company and following any phase-in period permitted under the New York Stock Exchange listing standards, our board of directors will consist of a majority of independent directors. Our board of directors will carefully consider all relevant facts and circumstances in evaluating the relationships of each director and nominee before making an affirmative determination that such director or nominee is independent. Under our corporate governance guidelines, an “independent” director will be one who meets the qualification requirements for being independent under applicable laws and the corporate governance listing standards of the New York Stock Exchange.
115
Table of Contents
Our board of directors will evaluate the independence of directors and director nominees under the criteria established by the New York Stock Exchange for director independence and for audit committee membership.
Our board of directors has affirmatively determined that Messrs. are independent directors under the applicable rules of the New York Stock Exchange and as such term is defined in Rule 10A-3(b)(1) under the Exchange Act.
Board Committees
Prior to the completion of this offering, our board of directors will establish an audit committee, a compensation committee and a nominating and corporate governance committee. Each committee will operate under a charter approved by our board of directors. Following this offering, copies of each committee’s charter will be posted on the Corporate Governance section of our website.
Audit Committee. The primary purpose of our audit committee is to assist the board’s oversight of:
| • | the audits and integrity of our financial statements; |
| • | our processes relating to risk management; |
| • | our processes relating the systems of internal control over financial reporting and disclosure controls and procedures; |
| • | the qualifications, engagement, compensation, independence and performance of our independent auditor; |
| • | the auditor’s conduct of the annual audit of our financial statements and any other auditor services provided; |
| • | the performance of our internal audit function; |
| • | our legal and regulatory compliance; and |
| • | the application of our codes of business conduct and ethics as established by management and the board of directors. |
Our audit committee will also produce the annual report of the audit committee as required by SEC rules. Upon the consummation of this offering, our audit committee will consist of Messrs. , and . will serve as chairman of the audit committee and also qualifies as an “audit committee financial expert” as such term has been defined by the SEC in Item 401(h)(2) of Regulation S-K and each audit committee member meets the financial literacy requirements of the New York Stock Exchange. Our board of directors has affirmatively determined that Messrs. and meet the definition of an “independent director” for the purposes of serving on the audit committee under applicable SEC and New York Stock Exchange rules, and we intend to comply with these independence requirements for all members of the audit committee within the time periods specified therein. The audit committee is governed by a charter that complies with the rules of the New York Stock Exchange. Following this offering, both our independent registered public accounting firm and management personnel will periodically meet privately with our audit committee.
Compensation Committee. The primary purposes of our compensation committee are to:
| • | oversee our employee compensation policies and practices; |
| • | determine and approve the compensation of our chief executive officer and other executive officers; review and approve incentive compensation and equity compensation policies and programs; and |
116
Table of Contents
| • | produce the annual report of the compensation committee as required by SEC rules. |
Upon the consummation of this offering, our compensation committee will consist of Messrs. , and . will serve as chair of the compensation committee. The compensation committee is governed by a charter.
Nominating and Corporate Governance Committee. The primary purposes of our nominating and corporate governance committee are to:
| • | identify and screen individuals qualified to serve as directors and recommend to the board of directors candidates for nomination for election; |
| • | evaluate, monitor and make recommendations to the board of directors with respect to our corporate governance guidelines; |
| • | coordinate and oversee the annual self-evaluation of the board of directors and its committees and management; and |
| • | review our overall corporate governance and recommend improvements for approval by the board of directors where appropriate. |
Upon the consummation of this offering, our nominating and corporate governance committee will consist of Messrs. , and . will serve as chair of the nominating and corporate governance committee. The nominating and corporate governance committee is governed by a charter.
Compensation Committee Interlocks and Insider Participation
None of our executive officers serves, or in the past year has served, as a member of the board of directors or compensation committee (or other committee performing equivalent functions) of any entity that has one or more executive officers serving on our board of directors or compensation committee. No interlocking relationship exists between any member of the compensation committee (or other committee performing equivalent functions) and any executive, member of the board of directors or member of the compensation committee (or other committee performing equivalent functions) and of any other company.
Code of Business Conduct and Ethics
We intend to adopt a code of business conduct and ethics that applies to all of our employees, officers and directors, including those officers responsible for financial reporting. These standards are designed to deter wrongdoing and to promote honest and ethical conduct. The code of business conduct and ethics will be available on our website. Any waiver of the code for directors or executive officers may be made only by our board of directors and will be promptly disclosed to our stockholders as required by applicable U.S. federal securities laws and the corporate governance rules of the New York Stock Exchange. Amendments to the code must be approved by our board of directors and will be promptly disclosed (other than technical, administrative or non-substantive changes). Any amendments to the code, or any waivers of its requirements, will be disclosed on our website.
Corporate Governance Guidelines
Our board of directors will adopt corporate governance guidelines in accordance with the corporate governance rules of the New York Stock Exchange that serve as a flexible framework within which our board of directors and its committees operate. These guidelines will cover a number of areas including the size and composition of the board of directors, board membership criteria and director
117
Table of Contents
qualifications, director responsibilities, board agenda, roles of the Chairman of the Board, Chief Executive Officer and presiding director, meetings of independent directors, committee responsibilities and assignments, board member access to management and independent advisors, director communications with third parties, director compensation, director orientation and continuing education, evaluation of senior management and management succession planning. A copy of our corporate governance guidelines will be posted on our website.
Indemnification of Officers and Directors
Our amended and restated bylaws provide that we will indemnify our directors and officers to the fullest extent permitted by the DGCL. We have established directors’ and officers’ liability insurance that insures such persons against the costs of defense, settlement or payment of a judgment under certain circumstances.
Our amended and restated certificate of incorporation provides that our directors will not be liable for monetary damages for breach of fiduciary duty, except for liability relating to any breach of the director’s duty of loyalty, acts or omissions not in good faith or which involve intentional misconduct or a knowing violation of law, violations under Section 174 of the DGCL or any transaction from which the director derived an improper personal benefit.
Prior to the completion of this offering, we will enter into indemnification agreements with each of our directors. The indemnification agreements will provide the directors with contractual rights to indemnifications, expense advancement and reimbursement to the fullest extent permitted under the DGCL.
118
Table of Contents
EXECUTIVE AND DIRECTOR COMPENSATION
The following discussion and analysis of compensation arrangements should be read with the compensation tables and related disclosures set forth below. This discussion contains forward-looking statements that are based on our current plans and expectations regarding future compensation programs. Actual compensation programs that we adopt may differ materially from the programs summarized in this discussion. Except with respect to disclosure related to awards to be granted in connection with this offering or unless otherwise noted, all share numbers and related values do not give effect to our corporate reorganization. See “Organizational Structure.”
Compensation Discussion and Analysis
This section explains the material elements of our executive compensation program and our compensation-setting process. It provides qualitative information regarding the manner in which compensation is earned by, paid to or awarded to our named executive officers and explains the decisions we made for compensation with respect to 2014 for each of the named executive officers listed below.
Named Executive Officers
For 2014, our named executive officers were:
| • | J. Michael McIlwain, President and Chief Executive Officer; |
| • | Skylar Cunningham, Chief Operating Officer; and |
| • | J. Whitney Markowitz, Chief Legal Officer and Secretary. |
In addition, Daniel Bauman and Donald Klink each served as our Chief Financial Officer during 2014. Mr. Bauman was transitioning out of the Chief Financial Officer role following the Sponsors Acquisition and left PSAV on February 2, 2014. Mr. Klink served as our Chief Financial Officer from January 6, 2014 to March 18, 2014. From March 19, 2014 through the remainder of 2014, a Managing Director from the professional services firm Alvarez & Marsal served as our interim Chief Financial Officer.
Overview, Objectives and Design
The objective of our overall compensation program is to attract, motivate and retain highly qualified executive officers by providing pay which is strongly aligned with our success and the executive officer’s contribution to that success. We believe compensation should be designed to ensure that a significant portion of compensation opportunity will be related to factors that directly and indirectly influence stockholder value. Accordingly, a significant portion of each named executive officer’s compensation is tied directly to the increase in stockholder value as well as to the financial performance of our company.
During 2014, we were a privately-held company. We were acquired by our Sponsors on January 24, 2014, and the compensation practices for our named executive officers for 2014 were determined at that time in association with the Sponsors Acquisition. Our compensation plan design for named executive officers reflects this private ownership and was not reflective of typical practices for publicly held companies. We anticipate transitioning over time to a more market comparable compensation program in the future following the completion of this offering.
119
Table of Contents
Most significantly, each of our named executive officers was awarded a substantial interest in our equity, in the form of Class B Units of PSAV Holdings LLC at the time of the Sponsors Acquisition, which represented the majority of their compensation for 2014 and represented approximately 5.8% of our total equity. These Class B Units were structured as “profits interests” and only have value to the extent that the value of the stockholder’s equity increases after issuance. These equity interests were designed to incent and reward our named executive officer for significantly increasing stockholder value over a long-term time horizon. Each of our named executive officers was also provided the opportunity to make a capital investment in PSAV Holdings LLC in connection with the Sponsors Acquisition.
In connection with this offering, holders of the Class B Units will receive shares of our common stock, some of which will be subject to vesting, under the 2015 Equity Incentive Plan that we intend to adopt in connection with this offering. See “—2015 Equity Incentive Plan.” In connection with this offering, our named executive officers will receive the following shares of common stock with respect to their Class B Units in PSAV Holdings LLC.
| Named Executive Officer |
Shares of Common Stock |
Shares of Restricted Common Stock | ||
| J. Michael McIlwain |
||||
| Skylar Cunningham |
||||
| J. Whitney Markowitz |
The restricted shares of common stock granted to each named executive officer will vest ratably over four years on January 24, 2016 and on each of the first three anniversaries following such date, subject to continued employment on each applicable vesting date.
The total compensation for our named executive officers in 2014 consisted of both cash and equity compensation, providing a balance between short-term and long-term incentives to drive our financial performance and to align the interests of management with the interests of stockholders.
120
Table of Contents
Principal Components of Compensation
The following table provides a summary of our executive compensation structure.
| Compensation Component |
Description |
Objectives | ||
| Base Salary |
• Fixed salary paid in biweekly installments for service as an executive. |
• Attract and retain individuals with superior talent.
• Recognize performance of job responsibilities. | ||
| Executive Incentive Plan |
• Annual cash incentive—plan based on financial and qualitative individual objectives.
• The award is tied to financial objectives based on Compensation EBITDA (as defined below) performance goals.
• Targeted between 65% and 100% of annual base salary for named executive officers, with an opportunity to earn between 0% and 250% of target based on our performance. |
• Encourage individual effort and group teamwork toward the accomplishment of our goals.
• Focus the attention of plan participants on achieving the budgeted levels of Compensation EBITDA.
• Reward outstanding managerial performance.
• Provide an incentive to the participant to make a positive contribution to our goals and objectives during the plan year. | ||
| Long-term Incentive Plan |
• One-time award of Class B Units, half of which are subject to time-based vesting and half of which are subject to performance-based vesting, subject to continued employment on each vesting date.
• Performance-based vesting measured based on capital returns to the Sponsors.
• Time-based portion vesting over a five-year time horizon.
• Structured as “profits interests,” which reward participants based on the increase in value since the acquisition. |
• Motivate, incentivize and reward management for building towards our long-term business goals and delivering significant financial return to our stockholders.
• Mix of time-based and performance based equity intended to provide added retention incentive while also requiring that performance goals are met in order for executive officers to realize a significant portion of the award. | ||
| Retirement Savings Benefits |
• Participation in our defined contribution plan, which has a quarterly discretionary match of 25% up to 6% of earnings. The plan has a graded five-year vesting schedule. |
• Provide an opportunity for tax-efficient savings and long-term financial security. | ||
| Other Elements of Compensation and Perquisites |
• Automobile allowance. |
• Attract and retain talented executive officers in a cost-efficient manner by providing benefits with high perceived values at a relatively low cost to us. | ||
121
Table of Contents
Process for Determining Compensation
The compensation committee, which consisted exclusively of representatives of our Sponsors in 2014, does not benchmark pay against a peer group and did not use a compensation consultant to make pay decisions. The compensation committee did review pay data from survey sources provided by our human resources department in evaluating pay decisions for 2014, although the compensation committee did not explicitly target any specific percentile of market practices in determining pay. Rather, in setting the 2014 compensation, the compensation committee determined the total amount and structure of compensation for our named executive officers, the judgment and general industry knowledge of its members, based on experience with comparably-sized companies and other private investments of the Sponsors to ensure we attract, develop and retain superior talent. Compensation decisions in 2014 were also the result of direct negotiations between the Sponsors and our named executive officers as part of the Sponsors Acquisition in the beginning of 2014.
2014 Compensation Determinations
Base Salaries
Base salaries are intended to provide competitive fixed compensation for the performance of an executive officer’s regular job duties. The annual base salaries for our named executive officers in 2014 set forth below were approved by the board of directors in June 2014 and were retroactive to the date of the Sponsors Acquisition as follows:
| Named Executive Officer |
2014 Salary |
|||
| J. Michael McIlwain |
$ | 650,000 | ||
| Skylar Cunningham |
$ | 425,000 | ||
| J. Whitney Markowitz |
$ | 400,000 | ||
2014 Executive Incentive Plan
The 2014 Executive Incentive Plan is designed to reward executive officers and managers for their role in helping us achieve our financial goals. Each participant in the plan has an annual target bonus amount, expressed as a percentage of his or her annual base salary. Target bonuses for the named executive officers are set at 100% of annual base salary for Mr. McIlwain and 65% of annual base salary for the other named executive officers.
122
Table of Contents
In 2014 actual bonus payments were based entirely on EBITDA performance vs. budget.
| Goal |
Mechanics | |
| EBITDA vs. Budget |
• Based on PSAV worldwide performance. • Compensation EBITDA is defined as income before interest, income taxes, depreciation and amortization (but inclusive of accruals for all bonuses) and before:
• foreign currency and interest rate hedge gains or losses,
• fees and expenses associated with any business acquisitions,
• cash restructuring charges and other non-cash add backs and deductions (nonrecurring items) as permitted by our credit facilities; provided, however, forward looking cost savings, operating improvements and expense reductions are not an eligible add back for Compensation EBITDA.
A participant’s achievement against his or her target bonus amount is determined by our actual reported EBITDA performance against budget. |
Actual payouts are determined based on performance against the compensation EBITDA budget established at the beginning of the year, with a 50% multiplier for achieving 90% of budget and a maximum multiplier of 250% for achieving 125% of budget for the year. No payout is made for performance below 90% of budget for the year. During 2014, the compensation committee determined that actual performance was 99% of Compensation EBITDA budget, resulting in a payout multiplier of 95% of target incentives for our executive officers. See column “Non-Equity Incentive Plan Compensation” under “—Summary Compensation Table” for the amounts earned by our named executive officers under the 2014 Executive Incentive Plan.
For 2015, incentive plan payments to our named executive officers will be based 75% on Compensation EBITDA performance versus budget and 25% on individual goals set for each named executive officer, which goals include executing strategic priorities and organizational priorities for our company.
Long-Term Incentives
In 2014, we granted long-term incentive awards in the form of Class B Units in PSAV Holdings LLC under our 2014 Management Incentive Plan. As noted above, the Class B Units were structured to qualify as “profits interests” for U.S. federal income tax purposes and only have value to the extent a distribution threshold is met and equity value of PSAV Holdings LLC increases after issuance. Profits interests are used regularly in private equity investments as a means of tying compensation to value creation and thereby aligning the interests of key leaders and managers with the interests of investors. Half of the Class B Units vest equally on each of the first five anniversaries of the grant date (the “Service Units”) and half of the Class B Units vest upon the achievement of certain returns to investors (the “Performance Units,” in each case subject to continued employment and the terms and conditions of the 2014 Management Incentive Plan, the applicable grant agreement and the Amended and
123
Table of Contents
Restated Limited Liability Company Agreement of PSAV Holding LLC. Half of the performance based Class B Units vest upon the Sponsors achieving a multiple of their invested capital of at least 1.5 times and half of the Performance Units vest upon the Sponsors achieving multiple of their invested capital of at least 2.0 times.
The number of Class B Units for each named executive officer was determined based on the share of the equity appreciation that such units would represent and relative to the overall pool of equity allocated to the management team and employees of our company as a whole. The goal was to provide significant incentives for value creation over a long-term time horizon of up to five years. The value of the Class B Units reflected in the Summary Compensation Table below was determined based on the requirements of FASB ASC Topic 718 Compensation – Stock Compensation (ASC Topic 718) using a Black-Scholes valuation but was not a consideration of the compensation committee in determining the number of Class B Units to award.
We also granted Phantom Units to certain employees pursuant to the Phantom Unit Appreciation Plan and applicable grant agreements. The holders of Phantom Units are generally entitled to receive a cash payment equal to the amount (if any) that a holder of a corresponding Class B Unit would receive, subject to the holder’s continued employment. None of the named executive officers received Phantom Units in 2014.
In connection with this offering, holders of Phantom Units will receive an aggregate of shares of our common stock under the 2015 Equity Incentive Plan, of which shares will be restricted and subject to time-based vesting.
Transaction Bonuses
Each of our named executive officers, other than Mr. Klink, was a participant under the AVSC Holding Corp. 2012 Long-Term Incentive Bonus Plan, or the AVSC Bonus Plan. In connection with the AVSC Bonus Plan, a bonus pool was formed that would only be paid if an exit event occurred and the prior private equity owners of AVSC Holding Corp. received an investment multiple equal to or greater than one.
The Sponsors Acquisition constituted an exit event for purposes of the AVSC Bonus Plan and the investment multiple was met. See footnote 3 to the column “All Other Compensation” under “—Summary Compensation Table” for the amounts paid to our named executive officers under the AVSC Bonus Plan. The bonus pool under the AVSC Plan was paid out in full and terminated in connection with the Sponsors Acquisition.
Retirement and Other Benefits
Each named executive officer is entitled to benefits consistent with the benefits offered to other employees. These include medical, dental, prescription drug and vision insurance, long- and short-term disability, life insurance, and a defined contribution plan. In addition, each named executive officer receives an automobile allowance with a value of up to $1,000 per month.
Tax and Accounting Considerations
Our compensation committee considers the impact of tax and accounting treatments when determining executive compensation.
Our Class B Units were structured as “profits interests” in PSAV Holdings LLC, which are treated as capital investments for the purpose of federal taxes and provide tax benefits to the participants.
124
Table of Contents
Section 162(m) of the Internal Revenue Code places a limit of $1,000,000 on the amount that can be deducted in any one year for compensation paid to certain executive officers. As a private company Section 162(m) did not apply to us during 2014. We will consider the implications of 162(m) in the future as a public company. However, our compensation committee may approve compensation that will not meet these requirements.
Our compensation committee also considers the accounting impact when structuring and approving awards. We account for share-based payments, including long-term incentive grants, in accordance with FASB ASC Topic 718, which governs the appropriate accounting treatment of share-based payments under U.S. GAAP.
Summary Compensation Table
The following table sets forth certain information with respect to compensation awarded to, earned by or paid to our named executive officers for the year ended December 31, 2014.
| Name and Principal Position |
Year | Salary ($) |
Stock Awards ($)(1) |
Non-Equity Incentive Plan Compensation ($)(2) |
All Other Compensation ($)(3) |
Total ($) |
||||||||||||||||||
| J. Michael McIlwain, |
2014 | 638,072 | 761,610 | 617,500 | 3,661,715 | 5,678,897 | ||||||||||||||||||
| Skylar Cunningham, |
2014 | 418,325 | 380,858 | 262,438 | 2,377,758 | 3,439,379 | ||||||||||||||||||
| J. Whitney Markowitz, |
2014 | 394,552 | 380,858 | 247,000 | 1,839,629 | 2,862,039 | ||||||||||||||||||
| Daniel Bauman, |
2014 | 41,224 | — | — | 500,000 | 541,224 | ||||||||||||||||||
| (1) | Represents the grant date fair value of the Class B Units calculated in accordance with FASB ASC Topic 718 granted to our named executive officers in 2014. Because required distribution events and the achievement of a targeted return for holders of units in PSAV Holdings LLC were not deemed probable to occur as of the grant date, the values in this column are attributable only to the Service Units that were granted to our named executive officers in 2014. For a description of the vesting terms associated with the Service Units and the Performance Units, see Footnote 2 to the “Grant of Plan-Based Awards Table.” See Note 15 to our audited consolidated financials included in this prospectus for further information on the assumptions used to calculate the grant date fair value of the Class B Units. |
| (2) | Represents performance-based annual bonuses earned by the named executive officer under the terms of the 2014 Executive Incentive Plan as described under “—Compensation Discussion and Analysis—2014 Compensation Determination—2014 Executive Incentive Plan.” |
| (3) | Consists of a transaction bonus paid pursuant to the 2012 Long Term Incentive Plan in connection with the Sponsors Acquisition and perks whose value exceeds $10,000. In addition, we paid health insurance premiums on behalf of Mr. Markowitz in 2014 that are reflected below. |
| Named Executive Officer |
Transaction Bonus |
Auto Allowance |
Health Insurance Premiums |
Total | ||||||||||||
| J. Michael McIlwain |
$ | 3,651,515 | $ | 10,200 | $ | — | $ | 3,661,715 | ||||||||
| Skylar Cunningham |
$ | 2,365,758 | $ | 12,000 | $ | — | $ | 2,377,758 | ||||||||
| J. Whitney Markowitz |
$ | 1,825,758 | $ | 12,000 | $ | 1,871 | $ | 1,839,629 | ||||||||
| Daniel Bauman |
$ | 500,000 | $ | — | $ | — | $ | 500,000 | ||||||||
| (4) | Daniel Bauman was transitioning out of the Chief Financial Officer role in early 2014. Mr. Bauman left PSAV on February 3, 2014. |
125
Table of Contents
In addition, Donald Klink served as our Chief Financial Officer from January 6, 2014 through March 18, 2014. He received $258,849 in compensation in 2014, of which $189,583 was severance.
Grants of Plan-Based Awards Table
The following table sets forth information concerning awards granted to the named executive officers during the fiscal year ended December 31, 2014.
|
Estimated Future Payouts |
All Other Stock Awards: Number of Shares of Stock or Units (#)(2) |
Grant Date Fair Value of Stock Awards ($)(3) |
||||||||||||||||||||||
| Name |
Grant Date |
Threshold ($) |
Target ($) |
Maximum ($) |
||||||||||||||||||||
| J. Michael McIlwain |
||||||||||||||||||||||||
| 2014 Executive Incentive Plan |
n/a | $ | 325,000 | $ | 650,000 | $ | 1,625,000 | |||||||||||||||||
| Performance Units |
01/24/14 | 3,592.5 | — | |||||||||||||||||||||
| Service Units |
01/24/14 | 3,592.5 | $ | 761,610 | ||||||||||||||||||||
| Skylar Cunningham |
||||||||||||||||||||||||
| 2014 Executive Incentive Plan |
n/a | $ | 138,125 | $ | 276,250 | $ | 690,625 | |||||||||||||||||
| Performance Units |
01/24/14 | 1,796.5 | — | |||||||||||||||||||||
| Service Units |
01/24/14 | 1,796.5 | $ | 380,858 | ||||||||||||||||||||
| J. Whitney Markowitz |
||||||||||||||||||||||||
| 2014 Executive Incentive Plan |
n/a | $ | 130,000 | $ | 260,000 | $ | 650,000 | |||||||||||||||||
| Performance Units |
01/24/14 | 1,796.5 | — | |||||||||||||||||||||
| Service Units |
01/24/14 | 1,796.5 | $ | 380,858 | ||||||||||||||||||||
| (1) | All such payouts are pursuant to the 2014 Executive Incentive Plan, as more particularly described under “—Compensation Discussion and Analysis—2014 Compensation Determinations—2014 Executive Incentive Plan” above, and actual payouts are recorded under “Non-Equity Incentive Plan Compensation” under “—Summary Compensation Table.” |
| (2) | Subject to the grantee’s continued service through the applicable vesting date, Service Units vest ratably over a five-year period on each of the first five anniversaries of the grant date of January 24, 2014. For details regarding the vesting of Performance Units, see “—Compensation Discussion and Analysis—2014 Compensation Determinations—Long-Term Incentives.” |
| (3) | Values provided in this column represent the grant date fair value of the Service Units or Performance Units granted to our named executive officers in 2014 as calculated in accordance with FASB ASC Topic 718. Because required distribution events and the achievement of a targeted return for holders of units in PSAV Holdings LLC were not deemed probable to occur as of the grant date, we have not presented the grant date fair value assigned to the Performance Units. The aggregate grant date fair value of Service Units is based on a grant date fair value of $212.00 per Service Unit. See Note 15 to our audited consolidated financials included in this prospectus for further information on the assumptions used to calculate the grant date fair value of the Class B Units. |
126
Table of Contents
Outstanding Equity Awards at Year-End Table
The following table sets for certain information with respect to outstanding equity awards held by our named executive officers at December 31, 2014.
| Name |
Number of Shares or Units of Stock That Have Not Vested (#) |
Market Value of Shares or Units of Stock That Have Not Vested ($)(1) |
Equity Incentive Plan Awards: Number of Unearned Shares, Units or Other Rights That Have Not Vested (#) |
Equity Incentive Plan Awards: Market or Payout Value of Unearned Shares, Units or Other Rights That Have Note Vested ($)(1) |
||||||||||||
| J. Michael McIlwain |
||||||||||||||||
| Performance Units(2) |
— | — | 3,592.5 | $ | ||||||||||||
| Service Units(3) |
3,592.5 | $ | — | — | ||||||||||||
| Skylar Cunningham |
||||||||||||||||
| Performance Units(2) |
— | — | 1,796.5 | $ | ||||||||||||
| Service Units(3) |
1,796.5 | — | — | |||||||||||||
| J. Whitney Markowitz |
||||||||||||||||
| Performance Units(2) |
— | — | 1,796.5 | $ | ||||||||||||
| Service Units(3) |
1,796.5 | $ | — | — | ||||||||||||
| (1) | The market value of the unvested Class B Units was determined as of December 31, 2014 assuming the corporate reorganization had occurred and that this offering was completed at the assumed initial public offering price of $ per share (the midpoint of the estimated public offering price range set forth on the cover page of this prospectus). |
| (2) | Subject to the grantee’s continued service through the applicable vesting date, the Performance Units vest as described above under “—Compensation Discussion and Analysis—2014 Compensation Determinations—Long-Term Incentives.” |
| (3) | Subject to the grantee’s continued service through the applicable vesting date, Service Units vest ratably over a five-year period on each of the first five anniversaries of the grant date of January 24, 2014. |
Awards Exercised and Vested Table
No awards vested or were exercised in 2014.
Pension Benefits Table
Executive officers received no pension benefits and had no accumulated pension benefits in 2014.
Nonqualified Deferred Compensation Table
Executive officers received no nonqualified deferred compensation and had no deferred compensation balances in 2014.
127
Table of Contents
Employment Agreements, Change of Control and Severance Benefits
Employment Agreements
In connection with the Sponsors Acquisition, we entered into amended and restated employment agreements in January 2014 with J. Michael McIlwain, our President and Chief Executive Officer, Skylar Cunningham, our Chief Operating officer and J. Whitney Markowitz, our Chief Legal Officer. We also entered into an amended and restated employment agreement with Benjamin E. Erwin, our Chief Financial Officer who started in 2015, in September 2015. The employment agreements reflect the then current compensation arrangements of these officers but provide that the salary may be changed from time to time based upon the criteria set forth in the respective agreement as well as on our other policies and practices. Each of the employment agreements includes restrictive covenants, including confidentiality, non-competition, non-solicitation and non-hiring provisions. The non-competition and non-solicitation periods are 24 months for each of Messrs. McIlwain, Cunningham and Markowitz and 18 months for Mr. Erwin. In addition, none of Messrs. McIlwain, Erwin, Cunningham or Markowitz may hire any person who was employed by us or any of our subsidiaries within 12 months prior to such hiring.
Each of Messrs. McIlwain’s, Erwin’s, Cunningham’s and Markowitz’s employment is at-will. Upon our termination of Mr. McIlwain, Mr. Erwin or Mr. Cunningham without cause (as defined in each named executive officer’s employment agreement), each such named executive officer is entitled to a single lump sum payment equal to one and half times the sum of his annual base salary plus his annual target bonus (as in effect as of his last day of employment with us) and any amounts due to such officer prior to the date of discharge. Under Mr. Erwin’s employment agreement he was also entitled to a grant of Phantom Units and a one-time signing bonus of $200,000.
Upon our termination of Mr. Markowitz without cause or if Mr. Markowitz terminates his employment with us for good reason (as defined in Mr. Markowitz’s employment agreement), Mr. Markowitz is entitled to a single lump sum payment equal to his accrued but unpaid base salary plus all amounts owing to him under any compensation and benefit plans and reimbursement of all reasonable expenses incurred by Mr. Markowitz in the performance of his services as our Chief Legal Officer. In addition, Mr. Markowitz will be entitled to a lump sum payment equal to (i) his pro rata annual target bonus through the date of termination plus (ii) two times the sum of his annual base salary plus annual target bonus. Furthermore, if Mr. Markowitz elects to receive continuing coverage under our employee benefit plans pursuant to the Consolidated Omnibus Budget Reconciliation Act, or COBRA, we will reimburse Mr. Markowitz for any premium expenses paid by him during such period (up to 18 months).
The severance payments to the named executive officers described above are subject to each named executive officer signing a waiver and release of claims.
2014 Management Incentive Plan
Pursuant to the award agreements for the Class B Units issued to our named executive officers under the 2014 Management Incentive Plan, all Service Units will vest upon a change of control. Performance- Units will vest only to the extent the compensation committee makes a good faith determination that the Sponsors achieved a multiple of their invested capital of at least 1.5 times or 2.0 times in connection with the change of control. In addition, if recommended by the Chief Executive Officer (or, in the case of a conflict of interest, the compensation committee), unvested Performance Units will remain outstanding and be eligible to vest for one year following the termination of the named executive officer’s employment by us without cause or by such named executive officer for good reason (as defined in the named executive officer’s employment agreement or in the unit award
128
Table of Contents
agreement if such executive officer’s employment agreement does not contain a definition of good reason). See “—Compensation Discussion and Analysis—2014 Compensation Determinations—Long-Term Incentives” and “Grant of Plan-Based Awards Table” for further information regarding the Class B Units.
Potential Payments
The following table summarizes our named executive officers’ potential payments upon the occurrence of the events noted below under their respective employment agreements and Class B Unit award agreements assuming that such events occurred as of December 31, 2014:
| Base Salary(1) |
Bonus(2) | Accelerated Vesting of Units(3) |
Total | |||||||||||||
| J. Michael McIlwain |
||||||||||||||||
| Termination without cause |
$ | 975,000 | $ | 1,625,000 | $ | $ | ||||||||||
| Termination for good reason |
$ | — | $ | — | $ | $ | ||||||||||
| Change of control |
$ | — | $ | — | $ | $ | ||||||||||
| Skylar Cunningham |
||||||||||||||||
| Termination without cause |
$ | 637,500 | $ | 690,625 | $ | $ | ||||||||||
| Termination for good reason |
$ | — | $ | — | $ | $ | ||||||||||
| Change of control |
$ | — | $ | — | $ | $ | ||||||||||
| J. Whitney Markowitz |
||||||||||||||||
| Termination without cause |
$ | 800,000 | $ | 780,000 | $ | $ | ||||||||||
| Termination for good reason |
$ | 800,000 | $ | 780,000 | $ | $ | ||||||||||
| Change of control |
$ | — | $ | — | $ | $ | ||||||||||
| (1) | In the case of Messrs. McIlwain and Cunningham, base salary refers to one and half times his annual base salary. In the case of Mr. Markowitz, base salary refers to two times his annual base salary. |
| (2) | In the case of Messrs. McIlwain and Cunningham, bonus refers to such executive officer’s prorated annual target bonus through December 31, 2014, assuming they are entitled to a prorated bonus upon a termination without cause under applicable law, plus one and a half times his annual target bonus (without proration). In the case of Mr. Markowitz, bonus refers to his prorated annual target bonus through December 31, 2014 plus two times his target bonus (without proration). |
| (3) | Assumes that (i) the market value of the unvested Class B Units was determined as of December 31, 2014 assuming the corporate reorganization had occurred and that this offering was completed at the assumed initial public offering price of $ per share (the midpoint of the estimated public offering price range set forth on the cover page of this prospectus) and (ii) in connection with a change of control or termination by us without cause or for by the named executive officer for good reason, the Performance Units vested in full. |
2015 Equity Incentive Plan
In connection with this offering, we intend to adopt the 2015 PSAV, Inc. Equity Incentive Plan, or the 2015 Equity Plan, which will be administered by our board of directors or, at its election, by one or more committees consisting of one or more members who have been appointed by the board of directors. The 2015 Equity Plan will authorize us to grant options, restricted stock or other awards to our employees, directors and consultants. Shares of common stock representing up to % of our outstanding common stock (calculated on a fully diluted basis) may be issued pursuant to awards under the 2015 Equity Plan. Awards will be made pursuant to agreements and may be subject to vesting and other restrictions as determined by the board of directors or the compensation committee.
129
Table of Contents
Director Compensation
During 2014, our directors who were either our employees or affiliated with our Sponsors did not receive any fees or other compensation for their services as our directors. We reimburse all of our directors for travel expenses and other out-of-pocket costs incurred in connection with attendance at meetings of the board of directors.
The following table sets forth all non-employee, non-affiliated director compensation information for the year ended December 31, 2014.
| Name |
Fees Paid or Earned in Cash ($) |
Equity Awards ($)(1) |
Total ($) |
|||||||||
| Louis J. D’Ambrosio |
20,833 | 106,000 | 126,833 | |||||||||
| Larry B. Porcellato |
20,833 | 106,000 | 126,833 | |||||||||
| (1) | On July 30, 2014, each of Messrs. D’Ambrosio and Porcellato received a grant of 500 Class B Units in PSAV Holdings LLC. The Class B Units vest ratably on each of the first four anniversaries of the grant date of July 30, 2014. This column reflects the grant date fair value of the Class B Units calculated in accordance with FASB ASC Topic 718. See Note 15 to our audited consolidated financials included in this prospectus for further information on the assumptions used to calculate the grant date fair value of the Class B Units. |
After this offering, each of our non-employee, non-affiliated directors will be paid quarterly in arrears:
| • | an annual cash retainer of $60,000; |
| • | an additional retainer of $25,000 for the audit committee chair, $15,000 for the compensation committee chair and $10,000 for the nomination and governance committee chair; |
| • | an additional retainer of $12,500 for audit committee members, $7,500 for compensation committee members and $5,000 for the nomination and governance committee members; |
| • | an additional retainer of $20,000 for a lead director; and |
| • | an annual equity grant upon terms determined by our board of directors. |
130
Table of Contents
PRINCIPAL AND SELLING STOCKHOLDERS
The following table shows information regarding the beneficial ownership of our common stock (1) immediately following the corporate reorganization, but prior to this offering and (2) as adjusted to give effect to the corporate reorganization and this offering by:
| • | each person whom we know to own beneficially more than 5% of our common stock; |
| • | each of our directors and named executive officers individually; |
| • | all directors and executive officers as a group; and |
| • | the selling stockholders. |
Beneficial ownership of shares is determined under rules of the SEC and generally includes any shares over which a person exercises sole or shared voting or investment power. Except as indicated by footnote, and subject to community property laws where applicable, we believe based on the information provided to us that the persons and entities named in the table below have sole voting and investment power with respect to all shares of our common stock shown as beneficially owned by them. Percentage of beneficial ownership is based on shares of common stock outstanding prior to the offering and shares of common stock to be outstanding after the completion of this offering, assuming no exercise of the underwriters’ option to purchase additional shares, or shares, assuming full exercise of the underwriters’ option to purchase additional shares. Shares of common stock subject to options currently exercisable or exercisable within 60 days of the date of this prospectus are deemed to be outstanding and beneficially owned by the person holding the options for the purpose of computing the percentage of beneficial ownership of that person and any group of which that person is a member, but are not deemed outstanding for the purpose of computing the percentage of beneficial ownership for any other person. Unless otherwise indicated, the address for each holder listed below is 5100 N. River Road, Suite 300, Schiller Park, Illinois 60176.
131
Table of Contents
| Shares Beneficially Owned Before Offering |
Shares Offered |
Shares Beneficially Owned After This Offering Assuming Underwriters’ Option Not Exercised |
Shares Subject to Under- writers’ Option |
Shares Beneficially Owned After This Offering Assuming Underwriters’ Option Exercised | ||||||||||||
| Number | Percentage | Number | Percentage | Number | Percentage | |||||||||||
| 5% Stockholders: |
||||||||||||||||
| Affiliates of The Goldman Sachs Group, Inc.(1) |
||||||||||||||||
| Olympus Growth Fund VI, L.P.(2) |
||||||||||||||||
| Race Street Funding LLC and FS Investment Corporation II (3) |
||||||||||||||||
| Directors and Named Executive Officers: |
||||||||||||||||
| J. Michael McIlwain |
||||||||||||||||
| Benjamin E. Erwin |
||||||||||||||||
| Skylar Cunningham |
||||||||||||||||
| J. Whitney Markowitz |
||||||||||||||||
| Manu Bettegowda |
||||||||||||||||
| Louis J. D’Ambrosio |
||||||||||||||||
| Evan Eason |
||||||||||||||||
| John J. Gavin |
||||||||||||||||
| Bradley J. Gross |
||||||||||||||||
| Larry B. Porcellato |
||||||||||||||||
| Leonard Seevers |
||||||||||||||||
| All directors and executive officers as a group (11 people) |
||||||||||||||||
| Additional Selling Stockholders |
||||||||||||||||
| (1) | Shares shown as beneficially owned by affiliates of The Goldman Sachs Group, Inc. reflect an aggregate of the following record ownership: shares held by Broad Street Principal Investments, L.L.C., shares held by Bridge Street 2013, L.P. and shares held by MBD 2013, L.P., in each case prior to this offering. In connection with this offering, Broad Street Principal Investments, L.L.C. is offering shares of our common stock, Bridge Street 2013, L.P. is offering shares of our common stock and MBD 2013, L.P. is offering shares of our common stock. If the underwriters exercise their option to purchase additional shares in full, Broad Street Principal Investments, L.L.C. is offering an additional shares of our common stock, Bridge Street 2013, L.P. is offering an additional shares of our common stock and MBD 2013, L.P. is offering an additional shares of our common stock. |
Goldman, Sachs & Co. and Broad Street Principal Investments, L.L.C. are wholly-owned subsidiaries of The Goldman Sachs Group, Inc. Goldman, Sachs & Co. is the investment manager of Bridge Street 2013, L.P. and MBD 2013, L.P. (collectively, with Broad Street Principal Investments, L.L.C., the “Goldman Sachs Affiliates”). The Goldman Sachs Group, Inc. and Goldman, Sachs & Co. may be deemed to beneficially own indirectly all of the common stock owned by the Goldman Sachs Affiliates because affiliates of The Goldman Sachs Group, Inc. and Goldman, Sachs & Co., are the parent, general partner, managing general partner, managing member or member of each of the Goldman Sachs Affiliates. The address for the Goldman
132
Table of Contents
Sachs Affiliates, The Goldman Sachs Group, Inc. and Goldman, Sachs & Co. is 200 West Street, New York, New York 10282.
| (2) | The general partner of Olympus Growth Fund VI, L.P. is OGP VI, LLC. The managing member of OGP VI, LLC is Robert S. Morris. Accordingly, Mr. Morris has investment and voting control over the shares of common stock held by Olympus Growth Fund VI, L.P. The address of Olympus Growth Fund VI, L.P., OGP VI, LLC and Mr. Morris is c/o Olympus Partners, Metro Center, One Station Place, Stamford, Connecticut 06902. |
| (3) | Includes shares held by Race Street Funding LLC and shares held by FS Investment Corporation II prior to this offering. FS Investment Corporation is the sole member of Race Street Funding LLC. Each of FS Investment Corporation and FS Investment Corporation II are externally managed, non-diversified, closed-end management investment companies that have elected to be regulated as business development companies under the Investment Company Act of 1940, as amended. The investment advisor to FS Investment Corporation is FB Income Advisor, LLC and the investment advisor to FS Investment Corporation II is FSIC II Advisor, LLC. Each of FB Income Advisor, LLC and FSIC II Advisor, LLC are registered investment advisors under the Investment Advisors Act of 1940, as amended. FB Income Advisor, LLC has investment and voting control over the shares of common stock held by Race Street Funding LLC and FSIC II Advisor, LLC has investment and voting control over the shares of common stock held by FS Investment Corporation II, in each case pursuant to the respective investment advisory agreements they have entered into with FS Investment Corporation and FS Investment Corporation II. The address of Race Street Funding, LLC, FS Investment Corporation, FS Investment Corporation II, FB Income Advisor, LLC and FSIC II Advisor, LLC is 201 Rouse Boulevard, Philadelphia, Pennsylvania 19112. |
133
Table of Contents
DESCRIPTION OF CERTAIN INDEBTEDNESS
Credit Facilities
On January 24, 2014, we entered into (a) a $565.0 million first lien credit agreement (the “First Lien Credit Agreement”), comprised of a $60.0 million revolving facility (the “Revolving Facility”) and a $505.0 million term loan (the “First Lien Loan”), and (b) a $180.0 million second lien credit agreement (the “Second Lien Credit Agreement”). We refer to the First Lien Credit Agreement and Second Lien Credit Agreement together as the “Credit Agreements.” On January 16, 2015, we amended our First Lien Credit Agreement in order to obtain additional first lien term loans in an aggregate principal amount of $35.0 million to finance our acquisition of American Audio Visual Center, Inc. as well as to pay fees and expenses associated with borrowing and general corporate purposes. On May 18, 2015, we amended our Credit Agreements to obtain additional first lien term loans in an aggregate principal amount of $180.0 million and increase the maximum borrowing capacity under the Revolving Facility by $15.0 million, to a maximum of $75.0 million. The proceeds of the incremental term loans were used to pay a distribution to members of PSAV Holdings LLC as well as to pay fees and expenses associated with the borrowing and related transactions.
Interest Rates and Fees
Borrowings under the Credit Agreements bear interest at a rate per annum equal to an applicable margin, plus, at our election, either (a) base rate determined by reference to the highest of (i) the federal funds effective rate in effect on such day plus 0.5%, (ii) with respect to the First Lien Loan or a second lien term loan (the “Second Lien Loan”) only, the eurocurrency rate, plus 1.00%, (iii) the prime commercial lending rate of the administrative agent, as in effect on such day and (iv) with respect to the First Lien Loan and the Second Lien Loan only, 2.00% or (b) the eurocurrency rate determined by reference to the applicable Reuters screen page two business days prior to the interest period relevant to such borrowing adjusted for certain additional costs, subject to a LIBOR floor of 1.00% applicable to term loans only.
First Lien Credit Agreement
The applicable margin for borrowings under the First Lien Credit Agreement is (a) with respect to both the initial term loans and the incremental term loans, 2.50% for base rate borrowings and 3.50% for LIBOR borrowings, and (b) with respect to both the initial revolving and swingline loans and additional revolving loans, 2.50% for base rate borrowings and 3.50% for LIBOR borrowings when our first lien leverage ratio is greater than 3.00 to 1.00, with step downs to (i) 2.25% for base rate borrowings and 3.25% for LIBOR borrowings when our first lien leverage ratio is less than or equal to 3.00 to 1.00 but greater than 2.50 to 1.00 and (ii) 2.00% for base rate borrowings and 3.00% for LIBOR borrowings when our first lien leverage ratio is less than or equal to 2.50 to 1.00. Our first lien leverage ratio is determined in accordance with the terms of the First Lien Credit Agreement.
Additionally, the following fees are required to be paid pursuant to the terms of the First Lien Credit Agreement: (a) a commitment fee on the average daily unused portion of the revolving credit commitments of 0.50% per annum when our senior secured leverage ratio is greater than or equal to 4.00 to 1.00 or 0.375% when our senior secured leverage ratio is less than 4.00 to 1.00, (b) a participation fee on the daily face amount of each revolving lender’s letter of credit exposure at a rate equal to the applicable margin for eurocurrency loans under the First Lien Credit Agreement, (c) a fronting fee on the daily face amount of each letter of credit issued by each issuing bank at a rate equal to the rate agreed between us and such issuing bank, but not to exceed 0.125%, and (d) a customary annual administration fee to the first lien administrative agent. Our senior secured leverage ratio is determined in accordance with the terms of the First Lien Credit Agreement.
134
Table of Contents
Second Lien Credit Agreement
The applicable margin for borrowings under the Second Lien Credit Agreement is 7.25% for base rate borrowings or 8.25% for eurocurrency borrowings.
Additionally, we are required to pay under the Second Lien Credit Agreement a customary annual administration fee to the second lien administrative agent.
Voluntary Prepayments
We may voluntarily prepay outstanding loans under either the First Lien Credit Agreement or the Second Lien Credit Agreement, in whole or in part, and such payments will be applied in accordance with each lender’s applicable percentage of the applicable class. Voluntary prepayments may be made under either credit agreement without premium or penalty, subject to certain notice requirements, customary “breakage” costs with respect to eurocurrency borrowings and subject to the following prepayment premiums:
First Lien Credit Agreement
If we refinance any term loans with loans having reduced interest rates or reprice any term loans under the First Lien Credit Agreement on or prior to November 18, 2015, subject to certain exceptions, we are required to pay a premium equal to 1.00% of the aggregate amount of the term loans prepaid or repriced.
Second Lien Credit Agreement
If we prepay or reprice any second lien term loans on or prior to January 24, 2017, we are required to pay a premium equal to: (i) 2.00% of the aggregate principal amount of any second lien term loans voluntarily prepaid or repriced after January 24, 2015 but before January 24, 2016 or (ii) 1.00% of the aggregate principal amount of any second lien terms loans voluntarily prepaid or repriced after January 24, 2016 but before January 24, 2017.
Mandatory Prepayments
First Lien Credit Agreement
The First Lien Credit Agreement requires us to prepay, subject to certain exceptions, the first lien term loans with:
| • | 50% of excess cash flow (determined in accordance with the terms of the First Lien Credit Agreement) for the fiscal year then ended, minus, at our option, any optional prepayments under either the First Lien Credit Agreement or the Second Lien Credit Agreement and cash payments that reduce the outstanding amount of any loan under either credit agreement, subject to certain stepdowns when our senior secured leverage ratio is less than or equal to 4.00 to 1.00; |
| • | 100% of the net cash proceeds of certain asset sales or insurance/condemnation events above a threshold amount, subject to reinvestment rights and other exceptions; and |
| • | 100% of the net cash proceeds of any issuance or incurrence of debt other than debt permitted under the Credit Agreements. |
135
Table of Contents
Second Lien Credit Agreement
The mandatory prepayment requirements under the Second Lien Credit Agreement for second lien term loans are substantially the same as under the First Lien Credit Agreement for first lien term loans, except that no mandatory prepayment is required to be made under the Second Lien Credit Agreement until the First Lien Credit Agreement has been terminated, unless such amounts are declined by the lenders under the first lien credit facility.
Final Maturity and Amortization
First Lien Credit Agreement
The First Lien Loan will mature on January 24, 2021 and the Revolving Facility will mature on January 24, 2019. The First Lien Loan requires quarterly amortization payments equal to approximately 0.25% of the original principal amount.
Second Lien Credit Agreement
The Second Lien Credit Agreement will mature on January 24, 2022.
Guarantors
All obligations under the Credit Agreements are unconditionally guaranteed by our direct wholly-owned subsidiary, PSAV Intermediate Corp., as parent guarantor, and substantially all of our existing and future direct and indirect wholly-owned domestic subsidiaries, other than certain excluded subsidiaries. In connection with our corporate reorganization, PSAV Intermediate LLC will become the parent guarantor under the Credit Agreements. See “Organizational Structure.”
Security
First Lien Credit Agreement
All obligations under the First Lien Credit Agreement are secured, subject to permitted liens and other exceptions, by first-priority perfected security interests in substantially all of the borrower’s and the guarantors’ assets.
Second Lien Credit Agreement
All obligations under the Second Lien Credit Agreement are secured, subject to permitted liens and other exceptions, by second-priority perfected security interests in substantially all of the borrower’s and the guarantors’ assets.
Certain Covenants, Representations and Warranties
The Credit Agreements contain customary representations and warranties, affirmative covenants, reporting obligations and negative covenants. With respect to the negative covenants, these restrictions include, among other things and subject to certain exceptions, restrictions on our and our subsidiaries’ ability to:
| • | incur additional indebtedness or other contingent obligations; |
| • | create liens; |
| • | enter into burdensome agreements with negative pledge clauses or restrictions on subsidiary distributions; |
136
Table of Contents
| • | pay dividends on our equity interests or make other payments in respect of capital stock; |
| • | make payments in respect of subordinated debt; |
| • | make investments, acquisitions, loans and advances; |
| • | consolidate, merge, liquidate or dissolve; |
| • | sell, transfer or otherwise dispose of our assets, including capital stock of our subsidiaries; |
| • | engage in sale-leaseback transactions; |
| • | engage in transactions with our affiliates; |
| • | materially alter the business we conduct; |
| • | modify organizational documents in a manner that is materially adverse to the lenders under the Credit Agreements; |
| • | amend or otherwise change the terms of any restricted debt or any other agreement governing either credit facility; and |
| • | change our fiscal year. |
Financial Covenant
Additionally, the revolving facility under the First Lien Credit Agreement requires, in the event amounts utilized under the revolving facility (borrowings plus the amount of outstanding letters of credit in excess of $17.5 million) exceed 25% of the total commitments, us to maintain a senior secured leverage ratio, determined in accordance with the terms of the First Lien Credit Agreement, of no greater than 6.75:1.00.
In the event that we fail to comply with the financial covenant, the parent guarantor has the option to issue equity or contribute any cash equity contributions received by it to the borrower in order to increase consolidated adjusted EBITDA for the purpose of calculating and determining compliance with such covenant, subject to certain other conditions and limitations.
Events of Default
The lenders under both Credit Agreements are permitted to accelerate the loans and terminate commitments thereunder or exercise other remedies upon the occurrence of certain customary events of default, subject to certain grace periods and exceptions. These events of default include, among others, payment defaults, cross-defaults to certain material indebtedness (provided, that a default under the First Lien Credit Agreement will only constitute a default under the Second Lien Credit Agreement if it results in the acceleration of loans under the First Lien Credit Agreement), covenant defaults, material inaccuracy of representations and warranties, certain events of bankruptcy, material judgments, material defects with respect to lenders’ perfection on the collateral, invalidity of subordination provisions of the subordinated debt and changes of control, none of which are expected to be triggered by this offering.
137
Table of Contents
CERTAIN RELATIONSHIPS AND RELATED PERSON TRANSACTIONS
Set forth below is a description of certain relationships and related person transactions between us or our subsidiaries and our directors, executive officers and holders of more than 5% of our voting securities since January 1, 2012.
Corporate Reorganization
Prior to the completion of this offering, we intend to complete an internal restructuring, which we refer to as the corporate reorganization. Pursuant to the corporate reorganization, the holders of equity interests in PSAV Holdings LLC will become stockholders of PSAV, Inc. which is currently a wholly-owned subsidiary of PSAV Holdings LLC and was incorporated in Delaware on August 11, 2015. PSAV, Inc. has not engaged in any business or other activities except in connection with its formation and in preparation for this offering. In connection with the corporate reorganization, the following steps will occur:
| • | PSAV, Inc. will form a new limited liability company, PSAV Intermediate LLC, as a wholly-owned subsidiary; |
| • | PSAV Intermediate Corp., a wholly-owned subsidiary of PSAV Holdings LLC, will merge with and into PSAV Intermediate LLC, with PSAV Intermediate LLC surviving, and the shares of PSAV Intermediate Corp. will be cancelled with PSAV Intermediate LLC becoming an indirect wholly-owned subsidiary of PSAV Holdings LLC; and |
| • | PSAV Holdings LLC will liquidate and distribute shares of PSAV, Inc. common stock to holders of Class A Units in PSAV Holdings LLC. |
In connection with the corporate reorganization and this offering, we will adopt the 2015 Equity Plan, and holders of Class B Units will receive shares of our common stock, some of which will be subject to vesting, in exchange for their Class B Units in PSAV Holdings LLC.
The corporate reorganization will not materially affect our operations, which we will continue to conduct through our operating subsidiaries. See “Organizational Structure.”
In connection with the corporate reorganization, the following holders of membership units of PSAV Holdings LLC will receive the number of shares of common stock of PSAV, Inc. set forth below in exchange for such membership units:
| Name |
Number of Shares | |
| Entities affiliated with Goldman Sachs |
||
| Olympus Growth Fund VI, L.P. |
||
| Race Street Funding LLC and FS Investment Corporation II |
||
| J. Michael McIlwain, our President and Chief Executive Officer(1) |
||
| Skylar Cunningham, our Chief Operating Officer(1) |
||
| J. Whitney Markowitz, our Chief Legal Officer and Secretary(1) |
| (1) | Includes shares of common stock and restricted common stock each executive officer will receive under the 2015 Equity Incentive Plan in exchange for their Class B Units. |
The Sponsors Acquisition
Stock Purchase, Subscription, Rollover and Contribution and Exchange Agreements
On November 15, 2013, PSAV Acquisition Corp. entered into a stock purchase agreement with AVSC Holding LLC, which was amended on January 26, 2015. The stock purchase agreement
138
Table of Contents
provided for a series of transactions, which we refer to as the “Sponsors Acquisition,” pursuant to which PSAV Holdings LLC, whose members include affiliates of Goldman Sachs and Olympus Growth Fund VI, L.P., Race Street Funding LLC, FS Investment Corporation II and certain management and other investors, acquired all of the equity interests in AVSC Holding Corp.
In connection with the Sponsors Acquisition, members (i) purchased Class A Units directly from PSAV Holdings pursuant to subscription agreements, (ii) entered into a series of agreements, as described below, pursuant to which they rolled over their equity in AVSC Holding LLC to receive Class A Units in PSAV Holding LLC or (iii) utilized a combination of (i) and (ii) above to receive Class A Units in PSAV Holdings LLC. In connection with the Sponsors Acquisition, and as a result of such agreements, (a) Goldman Sachs and Olympus Growth Fund VI, L.P. each received 123,000 Class A Units in PSAV Holdings LLC, (b) Race Street Funding LLC and FS Investment Corporation II collectively received 20,000 Class A Units and (c) executive officers J. Michael McIlwain, Skylar Cunningham and J. Whitney Markowitz each received 1,100, 525 and 525 Class A Units, respectively. In each case the Class A Units were valued $1,000 per Class A Unit.
In connection with the Sponsors Acquisition, certain investors that held equity interests in AVSC Holding LLC prior to the transactions entered into a series of agreements pursuant to which (i) AVSC Holding LLC distributed shares of common stock in AVSC Holding Corp. pursuant to distribution agreements, (ii) such investors then rolled over such shares in AVSC Holding Corp. in exchange for shares of PSAV Intermediate Corp. pursuant to rollover agreements and (iii) such investors entered into exchange and contribution agreements with PSAV Holdings LLC pursuant to which they exchanged the shares of common stock in PSAV Intermediate Corp. for Class A Units.
Equity Grants
In connection with the Sponsors Acquisition, Messrs. McIlwain, Cunningham and Markowitz were granted 7,185, 3,593 and 3,593 Class B Units in PSAV Holdings LLC, respectively. The Class B Units will convert into shares of our common stock, including shares of restricted stock in connection with the corporate reorganization and this offering. See “—Corporate Reorganization” above and “Executive and Director Compensation—Compensation Discussion and Analysis—Overview, Objectives and Design.”
Management Advisory Services Agreement
On January 24, 2014, in connection with the Sponsors Acquisition, one of our subsidiaries entered into a management advisory services agreement with Olympus Advisors LLC and Goldman, Sachs & Co. (together, the “Advisors”), affiliates of our Sponsors, pursuant to which the Advisors provide business and organizational strategy, financial and advisory services to us. The annual advisory fee is $1.5 million, apportioned equally between them and payable on January 24 of each year. We must also pay transaction fees in connection with transactions we may be party to, including acquisitions, divestitures, financings or liquidity events, equal to a fee of 1% of the aggregate value as defined in the management advisory services agreement. Under the management advisory services agreement, we paid a one-time fee of $6.0 million to Olympus Advisors LLC and $8.0 million to Goldman, Sachs & Co. The management advisory services agreement will terminate in connection with this offering, and we believe the Sponsors currently intend to waive any amounts due to them pursuant to such termination.
M&A Advisory Fees and Reimbursement of Expenses
In connection with the Sponsors Acquisition, we paid Goldman, Sachs & Co. an M&A advisory fee of $525,000 and reimbursed approximately of $170,000 of their expenses.
139
Table of Contents
PSAV Holdings Limited Liability Company Agreement
On January 24, 2014, PSAV Holdings LLC entered into the Amended and Restated Limited Liability Company Agreement (the “LLC Agreement”) which provided for the issuance of Class A and Class B Units. Pursuant to the LLC Agreement, the board of managers of PSAV Holdings LLC was set at seven managers, three of whom were appointed by affiliates of Goldman Sachs and three of whom were appointed by Olympus Partners. Certain matters, such as a change of control, sales and acquisitions of assets of certain amounts, termination or replacement of auditors, declaration of any dividends, issuance of new securities and incurrence of debt in certain amounts, among others, required the approval of a majority of the seven managers, including the approval of at least one manager appointed by affiliates of Goldman Sachs and one manager appointed by Olympus Partners. The agreement also gave PSAV Holdings LLC’s members certain rights of preemption, drag along rights and tag along rights, with respect to the transfer of units. In connection with our corporate reorganization and this offering, the LLC Agreement will terminate.
Stockholders’ Agreement
In connection with this offering, we intend to enter into a stockholders agreement with the Sponsors, pursuant to which we will be required to take all necessary action to cause the board of directors to include individuals designated by the Sponsors. These designation rights are described in this prospectus in the sections titled “Management—Composition of Our Board of Directors.” Our stockholders agreement also provides that we will obtain customary director indemnity insurance and enter into indemnification agreements with the Sponsors’ director designees. The stockholders’ agreement also requires the Sponsors to consult with one another regarding the transfer of their equity securities in us, so long as they own, in the aggregate, at least 50% of our outstanding common stock.
Registration Rights Agreement
In connection with the Sponsors Acquisition and pursuant to the LLC Agreement, registration rights were granted to all of PSAV Holdings LLC’s limited liability company members, which included affiliates of Goldman Sachs and Olympus Growth Fund VI, L.P., Race Street Funding LLC, FS Investment Corporation II, certain members of management, including J. Michael McIlwain, Skylar Cunningham and J. Whitney Markowitz and our directors Louis J. D’Ambrosio and Larry B. Porcellato. Under the terms of the LLC Agreement, PSAV Holdings LLC, among other things, agreed to use its best efforts to effect registered offerings upon request from the members and to grant incidental or “piggyback” registration rights with respect to any registerable securities held by the members.
In connection with the corporate reorganization and this offering, the LLC Agreement will be terminated and we will enter into a registration rights agreement with the Sponsors, Race Street Funding LLC, FS Investment Corporation II, our executive officers and directors. The terms of the registration rights agreement will be substantially similar to the registration rights members of PSAV Holdings LLC had under the LLC Agreement.
Employment and Transition Agreements
We have entered into employment agreements with J. Michael McIlwain, Benjamin E. Erwin, Skylar Cunningham and J. Whitney Markowitz. See “Executive and Director Compensation—Employment Agreements, Change of Control and Severance Benefits—Employment Agreements.”
In addition, we entered into employment agreements in November 2012 with Gregory Diekemper, our former Chief Executive Officer, that included restrictive covenants, including confidentiality, non-competition, non-solicitation and non-hiring provisions. Mr. Diekemper’s employment agreement also
140
Table of Contents
set forth amounts that would be payable to him upon his termination by us without cause or by him for good reason. On February 27, 2013, we entered into a transition agreement and general release with Mr. Diekemper. Pursuant to the transition agreement, Mr. Diekemper’s employment was terminated as of March 1, 2013 and the termination was treated as “without cause” for purposes of his employment agreement.
In connection with the transition agreement and release of claims, Mr. Diekemper served as a special advisor to the board of directors of AVSC Holding Corp. from March 2, 2013 through December 31, 2013 as was paid approximately $229,000 for such services. In addition, Mr. Diekemper received a separation payment on March 1, 2013 of $562,500. Mr. Diekemper was also eligible to receive payment under the AVSC Long-Term Incentive Bonus Plan described below as if his employment continued through the date of the change of control as set forth below under “—AVSC Long-Term Incentive Bonus Plan and Bonus Awards” and he received an additional change of control bonus of approximately $1.5 million pursuant to the transition agreement and general release.
AVSC Long-Term Incentive Bonus Plan and Bonus Awards
On February 1, 2012, AVSC Holding Corp. adopted the AVSC Holding Corp. 2012 Long-Term Incentive Bonus Plan, or the AVSC Bonus Plan. In connection with the AVSC Bonus Plan, a bonus pool was formed that would only be paid if an exit event occurred and the prior private equity owners of AVSC Holding Corp. received a specified investment multiple.
The Sponsors Acquisition constituted an exit event for purposes of the AVSC Bonus Plan and the investment multiple was met. Accordingly, Messrs. McIlwain, Cunningham and Markowitz received transaction bonus payments of approximately $3.7 million, $2.4 million and $1.8 million, respectively. In addition, Gregory Diekemper, our former Chief Executive Officer, and Daniel Bauman, our former Chief Financial Officer, received transaction bonuses of $1.0 million and $500,000, respectively.
Although our acquisition of Swank in November 2012 did not constitute an exit event under the AVSC Bonus Plan, due to the importance of the transaction, bonus payments of approximately $1.5 million, $0.8 million and $0.8 million were made to Messrs. McIlwain, Cunningham and Markowitz, respectively, upon the closing of the Swank transaction. In connection with such payments at the time of the Swank transaction, the AVSC Bonus Plan was amended to increase the investment multiple our prior private equity holders were required to achieve in connection with an exit event for bonuses to be paid and reduce the amount of the bonus pool.
Issuances of Class A Units and Phantom Awards
On July 30, 2014, PSAV Holdings LLC sold 250 of its Class A Units to our director Larry B. Porcellato for $1,000 per Class A Unit and 150 of its Class A Units to our director Louis J. D’Ambrosio for $1,000 per Class A Unit pursuant to subscription agreements with each director. In connection in with the corporate reorganization and this offering, Mr. Porcellato’s Class A Units will convert into shares of our common stock and Mr. D’Ambrosio’s Class A Units will convert into shares of our common stock.
On February 9, 2015, PSAV Holdings LLC granted 1,946 Phantom Units to Benjamin E. Erwin pursuant to the terms of his employment agreement. In connection in with this offering, as a holder of Phantom Units, Mr. Erwin will receive shares of our common stock, of which will be restricted, under the 2015 Equity Incentive Plan.
141
Table of Contents
Indemnification Agreements
PSAV Holdings LLC has entered into indemnification agreements with our directors and executive officers. We expect to enter into new indemnification agreements with our current directors and executive officers prior to the completion of this offering and expect to enter in a similar agreement with any new directors or executive officers. These agreements, among other things, will require us to indemnify each director to the fullest extent permitted by Delaware law, including indemnification of expenses such as attorneys’ fees, judgments, fines and settlement amounts incurred by the director in any action or proceeding, including any action or proceeding by or in right of us, arising out of the person’s services as a director.
Credit Agreements and Interest Rate Cap Agreement
On January 24, 2014, we entered into (a) a $565.0 First Lien Credit Agreement, comprised of a $60.0 million Revolving Facility and a $505.0 million First Lien Loan and (b) a $180.0 million Second Lien Credit Agreement. On January 16, 2015, we amended our First Lien Loan in order to obtain additional first lien term loans in an aggregate principal amount of $35.0 million to finance our acquisition of American Audio Visual Center, Inc. as well as to pay fees and expenses associated with borrowing and general corporate purposes. On May 18, 2015, we amended our Credit Agreements to obtain additional first lien term loans in an aggregate principal amount of $180.0 million and increase the maximum borrowing capacity under the Revolving Facility by $15.0 million, to a maximum of $75.0 million. The proceeds of the incremental term loans were used to pay a distribution to Class A unitholders of PSAV Holdings LLC as well as to pay fees and expenses associated with the borrowing and related transactions. See “Dividend Policy.”
Goldman Sachs Lending Partners LLC, an affiliate of Goldman Sachs, was a joint bookrunner and joint lead arranger for our Credit Agreements, and Goldman Sachs Bank USA is a lender under our First Lien Credit Agreement. We paid debt financing costs of $4.9 million and $1.1 million associated with borrowings under our Credit Agreements to affiliates of Goldman Sachs during the six months ended June 30, 2015 and the period from January 25, 2014 through June 30, 2014, respectively.
In January 2014, FS Investment Corporation II, Lehigh River LLC (a subsidiary of FS Investment Corporation II) and Locust Street Funding LLC (a subsidiary of FS Investment Corporation), which we collectively refer to as the “FS Entities” provided financing to support the Sponsors Acquisition. The FS Entities provided $180.0 million of fully committed financing to us pursuant to the Second Lien Credit Agreement. In connection with the amendment of our Second Lien Credit Agreement in May 2015, the FS Entities received amendment fees of $1.2 million. As of June 30, 2015, the FS Entities and their affiliates, held $160.0 million of the $180.0 million of loans outstanding under our Second Lien Agreement. We intend to use the net proceeds from this offering to repay borrowings under our Second Lien Credit Agreement. Accordingly, the FS Entities will receive a portion of the net proceeds we receive from this offering. See “Use of Proceeds.”
Furthermore, the counterparty to one of the deferred premium interest rate cap agreements described in Note 12 to our audited consolidated financial statements is an affiliate of Goldman Sachs. For the period from January 25, 2014 through December 31, 2014 and the six months ended June 30, 2015, we made payments of approximately $118,000 and $234,000, respectively, on the option premium to such affiliate.
Policies for Approval of Related Person Transactions
In connection with this offering, we will adopt a written policy relating to the approval of related person transactions. Our audit committee will review and approve or ratify all relationships and related person transactions between us and (i) our directors, director nominees, executive officers or their
142
Table of Contents
immediate family members, (ii) any 5% record or beneficial owner of our common stock or (iii) any immediate family member of any person specified in (i) and (ii) above. Our Chief Legal Officer will be primarily responsible for the development and implementation of processes and controls to obtain information from our directors and executive officers with respect to related party transactions and for determining, based on the facts and circumstances, whether we or a related person have a direct or indirect material interest in the transaction.
As set forth in the related person transaction policy, in the course of its review and approval or ratification of a related party transaction, the committee will consider:
| • | the nature of the related person’s interest in the transaction; |
| • | the availability of other sources of comparable products or services; |
| • | the material terms of the transaction, including without limitation, the amount and type of transaction; and |
| • | the importance of the transaction to us. |
Any member of the audit committee who is a related person with respect to a transaction under review will not be permitted to participate in the discussions or approval or ratification of the transaction. However, such member of the audit committee will provide all material information concerning the transaction to the audit committee.
143
Table of Contents
The following is a description of the material terms of our amended and restated certificate of incorporation and amended and restated bylaws as they will be in effect following the corporate reorganization and at the time of this offering. We refer you to our amended and restated certificate of incorporation and amended and restated bylaws, copies of which will be filed as exhibits to the registration statement of which this prospectus is a part.
Authorized Capitalization
Following this offering, our authorized capital stock will consist of shares of common stock, par value $0.01 per share, of which shares will be outstanding, and shares of preferred stock, par value $0.01 per share, of which no shares will be outstanding.
Common Stock
Voting Rights
Directors are elected by a plurality of the votes entitled to be cast. Our stockholders do not have cumulative voting rights. Except as otherwise provided in our amended and restated certificate of incorporation, our amended and restated bylaws or as required by law, all matters to be voted on by our stockholders other than matters relating to the election and removal of directors must be approved by a majority of the shares present in person or by proxy at the meeting and entitled to vote on the subject matter or by a written resolution of the stockholders representing the number of affirmative votes required for such matter at a meeting. See “Management—Composition of Our Board of Directors” for information regarding board designation rights of our Sponsors.
Dividend Rights
Subject to the rights of holders of any outstanding preferred stock, the holders of shares of our common stock are entitled to receive ratably such dividends, if any, as may be declared from time to time by the board of directors out of funds legally available therefor. We do we not anticipate paying any dividends on our common stock in the foreseeable future. See “Dividend Policy.”
Liquidation Rights
In the event of any voluntary or involuntary liquidation, dissolution or winding up of our affairs, holders of our common stock are entitled to share ratably in all assets remaining after payment of our debts and other liabilities, subject to prior distribution rights of preferred stock, then outstanding, if any.
Other Rights
Our stockholders have no preemptive or conversion rights or other subscription rights for additional shares. There are no redemption or sinking fund provisions applicable to the common stock. The rights, preferences and privileges of holders of our common stock will be subject to those of the holders of any shares of our preferred stock we may issue in the future.
Preferred Stock
Our board of directors has the authority to issue shares of preferred stock in one or more series and to fix, without further stockholder approval, the designation of such series, the powers (including voting powers), preferences and relative, participating, optional and other special rights, and the
144
Table of Contents
qualifications, limitations or restrictions thereof. Any preferred stock so issued may rank senior to our common stock with respect to the payment of dividends or amounts upon liquidation, dissolution or winding up, or both. In addition, any such shares of preferred stock may have class or series voting rights. The issuance of preferred stock may have the effect of delaying, deferring or preventing a change in control of our company without further action by the stockholders and may adversely affect the voting and other rights of the holders of our common stock.
Registration Rights
Following this offering, certain of our stockholders will have registration rights with respect to our common stock pursuant to a registration rights agreement. For further information regarding this agreement, see “Certain Relationships and Related Person Transactions—The Sponsors Acquisition—Registration Rights Agreement” and “Shares Eligible for Future Sale.”
Anti-takeover Effects of our Amended and Restated Certificate of Incorporation and Amended and Restated Bylaws
Our amended and restated certificate of incorporation and amended and restated bylaws contain provisions that may delay, defer or discourage another party from acquiring control of us. We expect that these provisions, which are summarized below, will discourage coercive takeover practices or inadequate takeover bids. These provisions are also designed to encourage persons seeking to acquire control of us to first negotiate with our board of directors, which we believe may result in an improvement of the terms of any such acquisition in favor of our stockholders. However, they also give our board of directors the power to discourage acquisitions that some stockholders may favor.
Classified Board of Directors
Our amended and restated certificate of incorporation provides that our board of directors is divided into three classes of directors, with the classes to be as nearly equal in number as possible, and with the directors serving three-year terms. As a result, approximately one-third of our board of directors will be elected each year. The classification of directors will have the effect of making it more difficult for stockholders to change the composition of our board of directors. Our amended and restated certificate of incorporation and amended and restated bylaws provide that, subject to any rights of holders of preferred stock to elect additional directors under specified circumstances, the number of directors will be fixed from time to time exclusively pursuant to a resolution adopted by the board of directors. See “Management—Composition of Our Board of Directors” for information regarding class membership.
Removal of Directors and Vacancies
Our amended and restated certificate of incorporation provides that directors may be removed at any time either with or without cause by the affirmative vote of a majority in voting power of all outstanding shares of stock, provided, that so long as our Sponsors and their affiliates beneficially own, in the aggregate, less than 50% in voting power of our stock entitled to vote generally in the election of directors, directors may be removed only for cause by the affirmative vote of the holders of at least 66 2⁄3% of the voting power of all shares of capital stock then entitled to vote on the election of directors, voting together as a single class. Furthermore, any vacancy on our board of directors however occurring, including a vacancy resulting from an increase in the size of our board of directors, at a time when our Sponsors and their affiliates beneficially own, in the aggregate, less than 50% in voting power of our stock entitled to vote generally in the election of directors, may only be filled by the affirmative vote of a majority of our directors then in office even if less than a quorum.
145
Table of Contents
No Stockholder Action by Written Consent
Our amended and restated certificate of incorporation and amended and restated bylaws provide that, subject to the rights of any holders of preferred stock to act by written consent instead of a meeting, stockholder action may be taken only at an annual meeting or special meeting of stockholders and may not be taken by written consent instead of a meeting, unless our Sponsors and their affiliates beneficially own, in the aggregate, at least 50% in voting power of our stock entitled to vote generally in the election of directors.
Requirements for Advance Notification of Stockholder Meetings, Nominations and Proposals
Our amended and restated certificate of incorporation provides that special meetings of the stockholders may be called only by or at the direction of our board of directors or by the chairman of our board of directors. In addition, at any time when either entities affiliated with Goldman Sachs or Olympus Partners beneficially owns at least 20% in voting power of our stock entitled to vote generally in the election of directors, special meetings of the stockholders may be called by or at the direction of our board of directors or by the chairman of our board of directors at the request of entities affiliated with Goldman Sachs or Olympus Partners, as applicable. Our amended and restated bylaws prohibit the conduct of any business at a special meeting other than as specified in the notice for such meeting. These provisions may have the effect of deferring, delaying or discouraging hostile takeovers or changes in control or management of our company.
Our amended and restated bylaws contain advance notice procedures with respect to stockholder proposals and the nomination of candidates for election as directors, other than nominations made by or at the direction of our board of directors or a committee of the board of directors. In order for any matter to be “properly brought” before a meeting, a stockholder must comply with the advance notice requirements. Our amended and restated bylaws allow the presiding officer at a meeting of the stockholders to adopt rules and regulations for the conduct of meetings which may have the effect of precluding the conduct of certain business at a meeting if the rules and regulations are not followed. These provisions may also defer, delay or discourage a potential acquirer from conducting a solicitation of proxies to elect the acquirer’s own slate of directors or otherwise attempting to obtain control of our company.
Supermajority Provisions
Our amended and restated certificate of incorporation and amended and restated bylaws provide that the board of directors is expressly authorized to make, alter, amend, change, add to, rescind or repeal, in whole or in part, our bylaws without a stockholder vote in any matter not inconsistent with the laws of the State of Delaware or our amended and restated certificate of incorporation. For as long as the Sponsors and their affiliates beneficially own, in the aggregate, at least 50% in voting power of our stock entitled to vote generally in the election of directors, any amendment, alteration, rescission or repeal of our bylaws by our stockholders requires the affirmative vote of a majority in voting power of the outstanding shares of our stock present in person or represented by proxy and entitled to vote on such amendment, alteration, rescission or repeal. At any time when the Sponsors and their affiliates beneficially own, in the aggregate, less than 50% in voting power of our stock entitled to vote generally in the election of directors, any amendment, alteration, rescission or repeal of our bylaws by our stockholders will require the affirmative vote of the holders of at least 66 2⁄3% in voting power of all the then-outstanding shares of our stock entitled to vote thereon, voting together as a single class.
The DGCL provides generally that the affirmative vote of a majority of the outstanding shares entitled to vote thereon, voting together as a single class, is required to amend a corporation’s certificate of incorporation, unless the certificate of incorporation requires a greater percentage. Our
146
Table of Contents
amended and restated certificate of incorporation provides that at any time when the Sponsors and their affiliates beneficially own, in the aggregate, less than 50% in voting power of our stock entitled to vote generally in the election of directors, the amendment of the following provisions of our amended and restated certificate of incorporation require the approval of holders of at least 66 2⁄3% in voting power of all the then-outstanding shares of our stock entitled to vote thereon, voting together as a single class:
| • | the provisions relating to the amendment of the certificate of incorporation and bylaws; |
| • | the provisions regarding the election and removal of directors; |
| • | the provisions regarding exculpation and indemnification; |
| • | the provisions regarding ability of stockholders to act by written consent and calling special meetings of stockholders; |
| • | the provisions regarding competition and corporate opportunities; and |
| • | the provisions regarding entering into business combinations with interested stockholders. |
Authorized but Unissued Shares
The authorized but unissued shares of our common stock and our preferred stock will be available for future issuance without any further vote or action by our stockholders. These additional shares may be utilized for a variety of corporate purposes, including future public offerings to raise additional capital, corporate acquisitions and employee benefit plans. The existence of authorized but unissued shares of our common stock and our preferred stock could render more difficult or discourage an attempt to obtain control over us by means of a proxy contest, tender offer, merger or otherwise.
Exclusive Forum
Our amended and restated certificate of incorporation provides that, subject to certain exceptions, the Court of Chancery of the State of Delaware shall be the sole and exclusive forum for certain stockholder litigation matters. However, it is possible that a court could rule that this provision is unenforceable or inapplicable.
Business Combinations
We have opted out of Section 203 of the DGCL. However, our amended and restated certificate of incorporation contains similar provisions providing that we may not engage in certain “business combinations” with any “interested stockholder” for a three-year period following the time that the stockholder became an interested stockholder, unless:
| • | prior to such time, our board of directors approved either the business combination or the transaction which resulted in the stockholder becoming an interested stockholder; |
| • | upon consummation of the transaction that resulted in the stockholder becoming an interested stockholder, the interested stockholder owned at least 85% of our voting stock outstanding at the time the transaction commenced, excluding certain shares; or |
| • | at or subsequent to that time, the business combination is approved by our board of directors and by the affirmative vote of holders of at least 66 2⁄3% of the outstanding voting stock that is not owned by the interested stockholder. |
Generally, a “business combination” includes a merger, asset or stock sale or other transaction resulting in a financial benefit to the interested stockholder. Subject to certain exceptions, an “interested
147
Table of Contents
stockholder” is a person who, together with that person’s affiliates and associates, owns, or within the previous three years owned, 15% or more of our voting stock. For purposes of this section only, “voting stock” has the meaning given to it in Section 203 of the DGCL.
Under certain circumstances, this provision will make it more difficult for a person who would be an “interested stockholder” to effect various business combinations with a corporation for a three-year period. This provision may encourage companies interested in acquiring us to negotiate in advance with our board of directors because the stockholder approval requirement would be avoided if our board of directors approves either the business combination or the transaction which results in the stockholder becoming an interested stockholder. These provisions also may have the effect of preventing changes in our board of directors and may make it more difficult to accomplish transactions which stockholders may otherwise deem to be in their best interests.
Our amended and restated certificate of incorporation provides that the Sponsors and their affiliates and any of their respective direct or indirect transferees and any group as to which such persons are a party do not constitute “interested stockholders” for purposes of this provision.
Corporate Opportunities
Delaware law permits corporations to adopt provisions renouncing any interest or expectancy in certain opportunities that are presented to the corporation or its officers, directors or stockholders. Our amended and restated certificate of incorporation renounces, to the maximum extent permitted from time to time by Delaware law, any interest or expectancy that we have in, or right to be offered an opportunity to participate in, specified business opportunities that are from time to time presented to our officers, directors or stockholders or their respective affiliates, other than those officers, directors, stockholders or affiliates who are our or our subsidiaries’ employees. Our amended and restated certificate of incorporation provides that, to the fullest extent permitted by law, each of the Sponsors or any of their affiliates or any director who is not employed by us (including any non-employee director who serves as one of our officers in both his director and officer capacities) or his or her affiliates has no duty to refrain from (i) engaging in a corporate opportunity in the same or similar lines of business in which we or our affiliates now engage or propose to engage or (ii) otherwise competing with us or our affiliates. In addition, to the fullest extent permitted by law, in the event that the Sponsors or any non-employee director acquires knowledge of a potential transaction or other business opportunity which may be a corporate opportunity for themselves or himself or their or his affiliates or for us or our affiliates, such person has no duty to communicate or offer such transaction or business opportunity to us or any of our affiliates and they may take any such opportunity for themselves or offer it to another person or entity. Our amended and restated certificate of incorporation does not renounce our interest in any business opportunity that is expressly offered to a non-employee director solely in his or her capacity as a director or officer of the Company. To the fullest extent permitted by law, no business opportunity will be deemed to be a potential corporate opportunity for us unless we would be permitted to undertake the opportunity under our amended and restated certificate of incorporation, we have sufficient financial resources to undertake the opportunity and the opportunity would be in line with our business.
Limitations on Liability and Indemnification of Officers and Directors
The DGCL authorizes corporations to limit or eliminate the personal liability of directors to corporations and their stockholders for monetary damages for breaches of directors’ fiduciary duties, subject to certain exceptions. Our amended and restated certificate of incorporation includes a provision that eliminates the personal liability of directors for monetary damages for any breach of fiduciary duty as a director, except to the extent such exemption from liability or limitation thereof is not permitted under the DGCL. The effect of these provisions is to eliminate the rights of us and our
148
Table of Contents
stockholders, through stockholders’ derivative suits on our behalf, to recover monetary damages from a director for breach of fiduciary duty as a director, including breaches resulting from grossly negligent behavior. However, exculpation does not apply to any director if the director has acted in bad faith, knowingly or intentionally violated the law, authorized illegal dividends or redemptions or derived an improper benefit from his or her actions as a director.
Our amended and restated bylaws provide that we must generally indemnify, and advance expenses to, our directors and officers to the fullest extent authorized by the DGCL. We also are expressly authorized to carry directors’ and officers’ liability insurance providing indemnification for our directors, officers and certain employees for some liabilities. We believe that these indemnification and advancement provisions and insurance are useful to attract and retain qualified directors and executive officers.
The limitation of liability, indemnification and advancement provisions in our amended and restated certificate of incorporation and amended and restated bylaws may discourage stockholders from bringing a lawsuit against directors for breach of their fiduciary duty. These provisions also may have the effect of reducing the likelihood of derivative litigation against directors and officers, even though such an action, if successful, might otherwise benefit us and our stockholders. In addition, your investment may be adversely affected to the extent we pay the costs of settlement and damage awards against directors and officers pursuant to these indemnification provisions.
Listing
We intend to apply to list our common stock on the New York Stock Exchange under the symbol “PSAV.”
Transfer Agent and Registrar
The transfer agent and registrar for the common stock is .
149
Table of Contents
SHARES ELIGIBLE FOR FUTURE SALE
Prior to this offering, there has been no market for our common stock. Future sales of substantial amounts of our common stock in the public market or the perception that such sales might occur could adversely affect market prices prevailing from time to time. Furthermore, because only a limited number of shares will be available for sale shortly after this offering due to existing contractual and legal restrictions on resale as described below, there may be sales of substantial amounts of our common stock in the public market after the restrictions lapse. This may adversely affect the prevailing market price of our common stock and our ability to raise equity capital in the future.
After completion of this offering and after giving effect to the corporate reorganization, we will have shares of common stock outstanding (or shares of common stock if the underwriters exercise their overallotment option in full).
All of the shares of common stock sold in this offering will be freely tradable without restrictions or further registration under the Securities Act, unless the shares are purchased by our “affiliates” as that term is defined in Rule 144 and except certain shares that will be subject to the lock-up period described below after completion of this offering. Any shares owned by our affiliates may not be resold except in compliance with Rule 144 volume limitations, manner of sale and notice requirements, pursuant to another applicable exemption from registration or pursuant to an effective registration statement.
In addition, at our request, the underwriters may reserve up to % of the shares of common stock offered for sale pursuant to this prospectus for sale to some of our directors, executive officers, employees and business associates in a directed share program. Any of these directed shares purchased by our directors, executive officers, employees and business associates will be subject to the 180-day lock-up restriction described under “Underwriting (Conflicts of Interest and Other Relationships).” Accordingly, the number of shares freely transferable upon completion of this offering will be reduced by the number of directed shares purchased by our directors, executive officers, employees and business associates, and there will be a corresponding increase in the number of shares that become eligible for sale after 180-day lock-up period expires.
Lock-up Agreements
In connection with this offering, we, each of our directors, executive officers and the selling stockholders, and substantially all of our stockholders, have entered into lock-up agreements described under “Underwriting (Conflicts of Interest and Other Relationships)” that restrict the sale of our securities, subject to certain exceptions, for up to 180 days after the date of this prospectus, subject to an extension in certain circumstances.
In addition, following the expiration of the lock-up period, certain stockholders will have the right, subject to certain conditions, to require us to register the sale of their shares of our common stock under federal securities laws. If these stockholders exercise this right, our other existing stockholders may require us to register their registrable securities. By exercising their registration rights, and selling a large number of shares, the selling stockholders could cause the prevailing market price of our common stock to decline.
Following the lock-up periods described above, all of the shares of our common stock that are restricted securities or are held by our affiliates as of the date of this prospectus will be eligible for sale in the public market in compliance with Rule 144 under the Securities Act.
150
Table of Contents
Rule 144
In general, under Rule 144 as currently in effect, a person who has beneficially owned restricted shares of our common stock sold in this offering will generally be freely transferable without restriction or further registration under the Securities Act, except that any shares of our common stock held by an “affiliate” of ours may not be resold publicly except in compliance with the registration requirements of the Securities Act or under an exemption under Rule 144 or otherwise. Rule 144 permits our common stock that has been acquired by a person who is an affiliate of ours, or has been an affiliate of ours within the past three months, to be sold into the market in an amount that does not exceed, during any three-month period, the greater of:
| • | one percent of the total number of shares of our common stock outstanding; or |
| • | the average weekly reported trading volume of our common stock for the four calendar weeks prior to the sale. |
Such sales are also subject to specific manner of sale provisions, a one-year holding period requirement, notice requirements and the availability of current public information about us.
Approximately shares of our common stock that are not subject to lock-up arrangements described above will be eligible for sale under Rule 144 immediately upon the closing of this offering.
Rule 144 also provides that a person who is not deemed to have been an affiliate of ours at any time during the three months preceding a sale, and who has for at least six months beneficially owned shares of our common stock that are restricted securities, will be entitled to freely sell such shares of our common stock subject only to the availability of current public information regarding us. A person who is not deemed to have been an affiliate of ours at any time during the three months preceding a sale, and who has beneficially owned for at least one year shares of our common stock that are restricted securities, will be entitled to freely sell such shares of our common stock under Rule 144 without regard to the current public information requirements of Rule 144.
Registration Rights
Holders of an aggregate of shares of our common stock are entitled to rights with respect to the registration of these shares under the Securities Act. Registration of these shares under the Securities Act would result in these shares becoming freely tradable without restriction under the Securities Act immediately upon the effectiveness of registration, except for shares purchased by affiliates. For more information, see “Certain Relationships and Related Person Transactions—The Sponsors Acquisition—Registration Rights Agreement.”
Additional Registration Statements
We intend to file one or more registration statements on Form S-8 under the Securities Act to register shares of our common stock issued or reserved for issuance under our equity incentive plans, including the 2015 Equity Plan we intend to adopt in connection with this offering. The first such registration statement is expected to be filed soon after the date of this prospectus and will automatically become effective upon filing with the SEC. Accordingly, shares registered under such registration statement will be available for sale in the open market, unless such shares are subject to vesting restrictions with us or the lock-up restrictions described above.
151
Table of Contents
MATERIAL U.S. FEDERAL INCOME TAX CONSIDERATIONS FOR NON-U.S. HOLDERS
The following is a general discussion of the material U.S. federal income and estate tax consequences to non-U.S. holders (as defined below) of the purchase, ownership and disposition of our common stock. This discussion does not provide a complete analysis of all potential U.S. federal income tax and estate tax considerations relating thereto. This description is based on the Internal Revenue Code of 1986, as amended, or the Code, existing and proposed U.S. Treasury regulations promulgated thereunder, administrative pronouncements, judicial decisions, and interpretations of the foregoing, all as of the date hereof and all of which are subject to change, possibly with retroactive effect. This discussion is limited to non-U.S. Holders who hold shares of our common stock as capital assets within the meaning of Section 1221 of the Code. Moreover, this discussion is for general information only and does not address all of the tax consequences that may be relevant to you in light of your particular circumstances, nor does it discuss special tax provisions, which may apply to you if you are subject to special treatment under U.S. federal income tax laws, such as for certain financial institutions or financial services entities, insurance companies, tax-exempt entities, dealers in securities or currencies, entities that are treated as partnerships for U.S. federal income tax purposes, “controlled foreign corporations,” “passive foreign investment companies,” former U.S. citizens or long-term residents, persons deemed to sell common stock under the constructive sale provisions of the Code, and persons that hold common stock as part of a straddle, hedge, conversion transaction, or other integrated investment. In addition, this summary does not address the Medicare tax on certain investment income or any state, local or foreign taxes or any U.S. federal tax laws other than U.S. federal income tax laws and estate tax laws.
You are urged to consult with your own tax advisor concerning the U.S. federal income tax consequences of acquiring, owning and disposing of our common stock, as well as the application of any state, local, and foreign income and other tax laws.
As used in this section, a “non-U.S. holder” is a beneficial owner of our common stock that is not, for U.S. federal income tax purposes:
| • | an individual who is a citizen or resident of the United States; |
| • | a corporation (or other entity taxable as a corporation) that is created or organized in or under the laws of the United States, any state thereof or the District of Columbia; |
| • | an estate the income of which is subject to U.S. federal income taxation regardless of its source; or |
| • | a trust if (i) a court within the United States is able to exercise primary supervision over the administration of the trust and one or more U.S. persons have the authority to control all substantial decisions of the trust or (ii) it has a valid election in effect under applicable U.S. Treasury regulations to be treated as a domestic trust. |
If you are an individual, you may, in many cases, be deemed to be a resident alien, as opposed to a nonresident alien, by virtue of being present in the United States for at least 31 days in the calendar year and for an aggregate of at least 183 days during a three-year period ending in the current calendar year. For these purposes, all the days present in the current year, one-third of the days present in the immediately preceding year, and one-sixth of the days present in the second preceding year are counted. Resident aliens are subject to U.S. federal income tax as if they were U.S. citizens. Such an individual is urged to consult his or her own tax advisor regarding the U.S. federal income tax consequences of the purchase, ownership or disposition of our common stock.
If a partnership or other pass-through entity is a beneficial owner of our common stock, the tax treatment of a partner in the partnership or an owner of the entity will depend upon the status of the
152
Table of Contents
partner or other owner and the activities of the partnership or other entity. Any partner in a partnership or owner of a pass-through entity holding shares of our common stock should consult its own tax advisor.
INVESTORS CONSIDERING THE PURCHASE OF OUR COMMON STOCK SHOULD CONSULT THEIR OWN TAX ADVISORS REGARDING THE APPLICATION OF THE U.S. FEDERAL INCOME AND ESTATE TAX LAWS TO THEIR PARTICULAR SITUATIONS AND THE CONSEQUENCES OF OTHER FEDERAL, FOREIGN, STATE OR LOCAL TAX LAWS, AND TAX TREATIES.
Distributions on Common Stock
If we pay distributions on shares of our common stock, such distributions will constitute dividends for U.S. federal income tax purposes to the extent paid from our current or accumulated earnings and profits, as determined under U.S. federal income tax principles. Distributions in excess of our current and accumulated earnings and profits will constitute a return of capital that is applied against and reduces, but not below zero, a non-U.S. holder’s adjusted tax basis in shares of our common stock. Any remaining excess will be treated as gain realized on the sale or other disposition of our common stock. See “—Dispositions of Common Stock.”
Any dividend paid to a non-U.S. holder on our common stock will generally be subject to U.S. federal withholding tax at a 30% rate. The withholding tax might not apply, however, or might apply at a reduced rate, under the terms of an applicable income tax treaty between the United States and the non-U.S. holder’s country of residence. You should consult your tax advisors regarding your entitlement to benefits under a relevant income tax treaty. Generally, in order for us or our paying agent to withhold tax at a lower treaty rate, a non-U.S. holder must certify its entitlement to treaty benefits. A non-U.S. holder generally can meet this certification requirement by providing an Internal Revenue Service, or IRS, Form W-8BEN or IRS Form W-8BEN-E, as applicable, to us or our paying agent. If the non-U.S. holder holds the stock through a financial institution or other agent acting on the holder’s behalf, the holder will be required to provide appropriate documentation to the agent. The holder’s agent will then be required to provide certification to us or our paying agent, either directly or through other intermediaries. A non-U.S. holder that does not timely furnish the required documentation, but that qualifies for a reduced treaty rate, may obtain a refund of any excess amounts withheld by timely filing an appropriate claim for refund with the IRS.
Dividends received by a non-U.S. holder that are effectively connected with a U.S. trade or business conducted by the non-U.S. holder and, if required by an applicable income tax treaty between the United States and the non-U.S. holder’s country of residence, are attributable to a permanent establishment (or, in certain cases involving individual holders, a fixed base) maintained by the non-U.S. holder in the United States are not subject to such withholding tax. To obtain this exemption, a non-U.S. holder must provide us with an IRS Form W-8ECI properly certifying such exemption. Such effectively connected dividends, although not subject to withholding tax, are taxed at the same graduated rates applicable to U.S. persons, net of certain deductions and credits. In addition to the graduated tax described above, such effectively connected dividends received by corporate non-U.S. holders may also be subject to a branch profits tax at a rate of 30% or such lower rate as may be specified by an applicable income tax treaty.
Dispositions of Common Stock
Subject to the discussion below on backup withholding and other withholding requirements, gain realized by a non-U.S. holder on a sale, exchange or other disposition of our common stock generally will not be subject to U.S. federal income or withholding tax, unless:
| • | the gain (1) is effectively connected with the conduct by the non-U.S. holder of a U.S. trade or business and (2) if required by an applicable income tax treaty between the United States and |
153
Table of Contents
| the non-U.S. holder’s country of residence, is attributable to a permanent establishment (or, in certain cases involving individual holders, a fixed base) maintained by the non-U.S. holder in the United States (in which case the special rules described below apply); |
| • | the non-U.S. holder is an individual who is present in the United States for 183 or more days in the taxable year of such disposition and certain other conditions are met (in which case the gain would be subject to a flat 30% tax, or such reduced rate as may be specified by an applicable income tax treaty, which may be offset by certain U.S. source capital losses); or |
| • | we are, or have been, a U.S. real property holding corporation, or a USRPHC, for U.S. federal income tax purposes at any time during the shorter of the five-year period ending on the date of disposition of our common stock and the non-U.S. holder’s holding period for our common stock. |
Generally, a corporation is a USRPHC if the fair market value of its “United States real property interests” equals 50% or more of the sum of the fair market value of (a) its worldwide real property interests and (b) its other assets used or held for use in a trade or business. The tax relating to stock in a USRPHC does not apply to a non-U.S. holder whose holdings, actual and constructive, amount to 5% or less of our common stock at all times during the applicable period, provided that our common stock is regularly traded on an established securities market. We believe we have not been and are not currently a USRPHC, and do not anticipate being a USRPHC in the future.
If any gain from the sale, exchange or other disposition of our common stock, (1) is effectively connected with a U.S. trade or business conducted by a non-U.S. holder and (2) if required by an applicable income tax treaty between the United States and the non-U.S. holder’s country of residence, is attributable to a permanent establishment (or, in certain cases involving individuals, a fixed base) maintained by such non-U.S. holder in the United States, then the gain generally will be subject to U.S. federal income tax at the same graduated rates applicable to U.S. persons, net of certain deductions and credits. If the non-U.S. holder is a corporation, under certain circumstances, that portion of its earnings and profits that is effectively connected with its U.S. trade or business, subject to certain adjustments, generally would also be subject to a “branch profits tax.” The branch profits tax rate is generally 30%, although an applicable income tax treaty between the United States and the non-U.S. holder’s country of residence might provide for a lower rate.
U.S. Federal Estate Tax
Individuals, or an entity the property of which is includable in an individual’s gross estate for U.S. federal estate tax purposes, should note that any of our common stock held at the time of such individual’s death will be included in such individual’s gross estate for U.S. federal estate tax purposes, and may be subject to U.S. federal estate tax, unless an applicable estate tax treaty provides otherwise.
Backup Withholding and Information Reporting
Any dividends that are paid to a non-U.S. holder must be reported annually to the IRS and to the non-U.S. holder. Copies of these information returns also may be made available to the tax authorities of the country in which the non-U.S. holder resides under the provisions of various treaties or agreements for the exchange of information. Unless the non-U.S. holder is an exempt recipient, dividends paid on our common stock and the gross proceeds from a taxable disposition of our common stock may be subject to additional information reporting and may also be subject to U.S. federal backup withholding (currently at a rate of 28%) if such non-U.S. holder fails to comply with applicable U.S. information reporting and certification requirements. Provision of any IRS Form W-8 appropriate to the non-U.S. holder’s circumstances will generally satisfy the certification requirements necessary to avoid the backup withholding.
154
Table of Contents
Backup withholding is not an additional tax. Any amounts so withheld under the backup withholding rules will be refunded by the IRS or credited against the non-U.S. holder’s U.S. federal income tax liability, provided that the required information is timely furnished to the IRS.
Other Withholding Requirements
Non-U.S. holders of our common stock may be subject to U.S. withholding tax at a rate of 30% under sections 1471 through 1474 of the Code (commonly referred to as “FATCA”). This withholding tax may apply if a non-U.S. holder (or any foreign financial institution or other non-U.S. non-financial entity that receives a payment on a non-U.S. holder’s behalf) does not comply with certain U.S. informational reporting requirements or otherwise qualifies for an exemption from these rules. The payments potentially subject to this withholding tax include dividends on, and gross proceeds from the sale or other disposition of, our common stock. Withholding under FATCA generally will apply to dividends paid on our common stock regardless of when they are paid. However, withholding under FATCA generally will only apply to payments of gross proceeds from the sale or other disposition of our common stock on or after January 1, 2017. Non-U.S. holders should consult their tax advisors regarding the possible implications of FATCA for their investment in our common stock.
THE PRECEDING DISCUSSION OF U.S. FEDERAL TAX CONSIDERATIONS IS FOR GENERAL INFORMATION ONLY. IT IS NOT TAX ADVICE. EACH PROSPECTIVE INVESTOR SHOULD CONSULT ITS OWN TAX ADVISOR REGARDING THE PARTICULAR U.S. FEDERAL, STATE, LOCAL AND FOREIGN TAX CONSEQUENCES OF PURCHASING, HOLDING AND DISPOSING OF OUR COMMON STOCK, INCLUDING THE CONSEQUENCES OF ANY PROPOSED CHANGE IN APPLICABLE LAWS.
155
Table of Contents
UNDERWRITING (CONFLICTS OF INTEREST AND OTHER RELATIONSHIPS)
We, the selling stockholders and the underwriters named below have entered into an underwriting agreement with respect to the shares being offered. Subject to the terms and conditions stated in the underwriting agreement dated the date of this prospectus, each underwriter has severally agreed to purchase the number of shares indicated in the following table. Goldman, Sachs & Co. and Morgan Stanley & Co. LLC are the representatives of the underwriters.
| Underwriters |
Number of Shares | |
| Goldman, Sachs & Co. |
||
| Morgan Stanley & Co. LLC |
||
| Barclays Capital Inc. |
||
| Credit Suisse Securities (USA) LLC |
||
| Macquarie Capital (USA) Inc. |
||
| Piper Jaffray & Co. |
||
| William Blair & Company, L.L.C. |
||
|
| ||
| Total |
||
|
|
The underwriters are committed to take and pay for all of the shares being offered, if any are taken, other than the shares covered by the option described below unless and until this option is exercised in full.
The underwriters have an option to buy up to an additional shares from the selling stockholders to cover sales by the underwriters of a greater number of shares than the total number set forth in the table above. They may exercise that option for 30 days from the date of this prospectus. If any shares are purchased pursuant to this option, the underwriters will severally purchase shares in approximately the same proportion as set forth in the table above.
The following tables show the per share and total underwriting discounts and commissions to be paid to the underwriters by us and the selling stockholders. Such amounts are shown assuming both no exercise and full exercise of the underwriters’ option to purchase additional shares.
Paid by the Company
| No Exercise | Full Exercise | |||||||
| Per Share |
$ | $ | ||||||
| Total |
$ | $ | ||||||
Paid by the Selling Stockholders
| No Exercise | Full Exercise | |||||||
| Per Share |
$ | $ | ||||||
| Total |
$ | $ | ||||||
Shares sold by the underwriters to the public will initially be offered at the initial public offering price set forth on the cover of this prospectus. Any shares sold by the underwriters to securities dealers may be sold at a discount of up to $ per share from the initial public offering price. After the initial offering of the shares, the representatives may change the offering price and the other selling terms. The offering of the shares by the underwriters is subject to receipt and acceptance and subject to the underwriters’ right to reject any order in whole or in part.
156
Table of Contents
We and our officers, directors, and holders of substantially all of our common stock, including the selling stockholders, have agreed with the underwriters, subject to certain exceptions, not to dispose of or hedge any of their common stock or securities convertible into or exchangeable for shares of common stock during the period from the date of this prospectus continuing through the date 180 days after the date of this prospectus, except with the prior written consent of the representatives. This agreement does not apply to any existing employee benefit plans or the 2015 Equity Plan to be adopted in connection with this offering. See “Shares Eligible for Future Sale” for a discussion of certain transfer restrictions. The representatives may, in their sole discretion, release any of the securities subject to these agreements at any time without notice.
The 180-day restricted period described in the preceding paragraph will be automatically extended if: (1) during the last 17 days of the 180-day restricted period we issue an earnings release or announce material news or a material event; or (2) prior to the expiration of the 180-day restricted period, we announce that we will release earnings results during the 15-day period following the last day of the 180-day period, in which case the restrictions described in the preceding paragraph will continue to apply until the expiration of the 18-day period beginning on the issuance of the earnings release of the announcement of the material news or material event.
Prior to this offering, there has been no public market for the shares. The initial public offering price has been negotiated among us and the representatives. Among the factors to be considered in determining the initial public offering price of the shares, in addition to prevailing market conditions, will be our historical performance, estimates of the business potential and our earnings prospects, an assessment of our management and the consideration of the above factors in relation to market valuation of companies in related businesses.
We intend to apply to list the common stock on the New York Stock Exchange under the symbol “PSAV.”
In connection with the offering, the underwriters may purchase and sell shares of common stock in the open market. These transactions may include short sales, stabilizing transactions and purchases to cover positions created by short sales. Short sales involve the sale by the underwriters of a greater number of shares than they are required to purchase in the offering, and a short position represents the amount of such sales that have not been covered by subsequent purchases. A “covered short position” is a short position that is not greater than the amount of additional shares for which the underwriters’ option described above may be exercised. The underwriters may cover any covered short position by either exercising their option to purchase additional shares or purchasing shares in the open market. In determining the source of shares to cover the covered short position, the underwriters will consider, among other things, the price of shares available for purchase in the open market as compared to the price at which they may purchase additional shares pursuant to the option described above. “Naked” short sales are any short sales that create a short position greater than the amount of additional shares for which the option described above may be exercised. The underwriters must cover any such naked short position by purchasing shares in the open market. A naked short position is more likely to be created if the underwriters are concerned that there may be downward pressure on the price of the common stock in the open market after pricing that could adversely affect investors who purchase in the offering. Stabilizing transactions consist of various bids for or purchases of common stock made by the underwriters in the open market prior to the completion of this offering.
The underwriters may also impose a penalty bid. This occurs when a particular underwriter repays to the underwriters a portion of the underwriting discount received by it because the representatives have repurchased shares sold by or for the account of such underwriter in stabilizing or short covering transactions.
157
Table of Contents
Purchases to cover a short position and stabilizing transactions, as well as other purchases by the underwriters for their own accounts, may have the effect of preventing or retarding a decline in the market price of our common stock, and together with the imposition of the penalty bid, may stabilize, maintain or otherwise affect the market price of our common stock. As a result, the price of our common stock may be higher than the price that otherwise might exist in the open market. The underwriters are not required to engage in these activities and may end any of these activities at any time. These transactions may be effected on , in the over-the-counter market or otherwise.
The underwriters do not expect sales to discretionary accounts to exceed five percent of the total number of shares offered.
We estimate that the total expenses of the offering, including registration, filing and listing fees, printing fees and legal and accounting expenses and the expenses of Financial Industry Regulatory Authority, or FINRA, qualification, but excluding underwriting discounts and commissions, will be approximately $ million. We have agreed to reimburse the underwriters for up to $ of expenses relating to clearance of this offering with FINRA.
We and the selling stockholders have agreed to indemnify the several underwriters against certain liabilities, including liabilities under the Securities Act, or to contribute to payments the underwriters may be required to make because of any of those liabilities.
Directed Share Program
At our request, the underwriters have reserved up to % of the shares of common stock offered by this prospectus for sale, at the initial public offering price, to employees, directors and other persons associated with us who have expressed an interest in purchasing shares in the offering. We call this our Directed Share Program. Reserved shares purchased by our directors and executive officers will be subject to a 180-day restricted period.
Sales in the Directed Share Program will be made at our direction by . We do not know if individual investors will choose to purchase all or any portion of these reserved shares, but any purchases they do make will reduce the number of shares available in the overall offering. Any reserved shares not purchased in the Directed Share Program will be offered by the underwriters to the general public on the same terms as the other shares of common stock.
Notice to Prospective Investors in the European Economic Area
In relation to each Member State of the European Economic Area which has implemented the Prospectus Directive (each, a “Relevant Member State”), each underwriter has represented and agreed that with effect from and including the date on which the Prospectus Directive is implemented in that Relevant Member State (the Relevant Implementation Date) it has not made and will not make an offer of shares to the public in that Relevant Member State prior to the publication of a prospectus in relation to the shares which has been approved by the competent authority in that Relevant Member State or, where appropriate, approved in another Relevant Member State and notified to the competent authority in that Relevant Member State, all in accordance with the Prospectus Directive, except that it may, with effect from and including the Relevant Implementation Date, make an offer of shares to the public in that Relevant Member State at any time:
| (a) | to legal entities which are authorized or regulated to operate in the financial markets or, if not so authorized or regulated, whose corporate purpose is solely to invest in securities; |
158
Table of Contents
| (b) | to any legal entity which has two or more of (1) an average of at least 250 employees during the last financial year; (2) a total balance sheet of more than €43,000,000 and (3) an annual net turnover of more than €50,000,000, as shown in its last annual or consolidated accounts; |
| (c) | to fewer than 100 natural or legal persons (other than qualified investors as defined in the Prospectus Directive) subject to obtaining the prior consent of the representative for any such offer; or |
| (d) | in any other circumstances which do not require the publication by the Issuer of a prospectus pursuant to Article 3 of the Prospectus Directive. |
For the purposes of this provision, the expression an “offer of shares to the public” in relation to any shares in any Relevant Member State means the communication in any form and by any means of
sufficient information on the terms of the offer and the shares to be offered so as to enable an investor to decide to purchase or subscribe the shares, as the same may be varied in that Relevant Member State by any measure implementing the Prospectus Directive in that Relevant Member State and the expression
Prospectus Directive means Directive 2003/71/EC and includes any relevant implementing measure in each Relevant Member State.
Notice to Prospective Investors in the United Kingdom
Each underwriter has represented and agreed that:
| (a) | it has only communicated or caused to be communicated and will only communicate or cause to be communicated an invitation or inducement to engage in investment activity (within the meaning of Section 21 of the Financial Services and Markets Act (“FSMA”) received by it in connection with the issue or sale of the shares in circumstances in which Section 21(1) of the FSMA does not apply to the Issuer; and |
| (b) | it has complied and will comply with all applicable provisions of the FSMA with respect to anything done by it in relation to the shares in, from or otherwise involving the United Kingdom. |
Notice to Prospective Investors in Hong Kong
The shares may not be offered or sold by means of any document other than (i) in circumstances which do not constitute an offer to the public within the meaning of the Companies Ordinance (Cap.32, Laws of Hong Kong), or (ii) to “professional investors” within the meaning of the Securities and Futures Ordinance (Cap.571, Laws of Hong Kong) and any rules made thereunder, or (iii) in other circumstances which do not result in the document being a “prospectus” within the meaning of the Companies Ordinance (Cap.32, Laws of Hong Kong), and no advertisement, invitation or document relating to the shares may be issued or may be in the possession of any person for the purpose of issue (in each case whether in Hong Kong or elsewhere), which is directed at, or the contents of which are likely to be accessed or read by, the public in Hong Kong (except if permitted to do so under the laws of Hong Kong) other than with respect to shares which are or are intended to be disposed of only to persons outside Hong Kong or only to “professional investors” within the meaning of the Securities and Futures Ordinance (Cap. 571, Laws of Hong Kong) and any rules made thereunder.
Notice to Prospective Investors in Singapore
This prospectus has not been registered as a prospectus with the Monetary Authority of Singapore. Accordingly, this prospectus and any other document or material in connection with the
159
Table of Contents
offer or sale, or invitation for subscription or purchase, of the shares may not be circulated or distributed, nor may the shares be offered or sold, or be made the subject of an invitation for subscription or purchase, whether directly or indirectly, to persons in Singapore other than (i) to an institutional investor under Section 274 of the Securities and Futures Act, Chapter 289 of Singapore (the “SFA”), (ii) to a relevant person, or any person pursuant to Section 275(1A), and in accordance with the conditions, specified in Section 275 of the SFA or (iii) otherwise pursuant to, and in accordance with the conditions of, any other applicable provision of the SFA.
Where the shares are subscribed or purchased under Section 275 by a relevant person which is: (a) a corporation (which is not an accredited investor) the sole business of which is to hold investments and the entire share capital of which is owned by one or more individuals, each of whom is an accredited investor; or (b) a trust (where the trustee is not an accredited investor) whose sole purpose is to hold investments and each beneficiary is an accredited investor, shares, debentures and units of shares and debentures of that corporation or the beneficiaries’ rights and interest in that trust shall not be transferable for six months after that corporation or that trust has acquired the shares under Section 275 except: (1) to an institutional investor under Section 274 of the SFA or to a relevant person, or any person pursuant to Section 275(1A), and in accordance with the conditions, specified in Section 275 of the SFA; (2) where no consideration is given for the transfer; or (3) by operation of law.
Notice to Prospective Investors in Canada
The shares may be sold only to purchasers purchasing, or deemed to be purchasing, as principal that are accredited investors, as defined in National Instrument 45-106 Prospectus Exemptions or subsection 73.3(1) of the Securities Act (Ontario), and are permitted clients, as defined in National Instrument 31-103 Registration Requirements, Exemptions and Ongoing Registrant Obligations. Any resale of the shares must be made in accordance with an exemption from, or in a transaction not subject to, the prospectus requirements of applicable securities laws.
Securities legislation in certain provinces or territories of Canada may provide a purchaser with remedies for rescission or damages if this prospectus (including any amendment thereto) contains a misrepresentation, provided that the remedies for rescission or damages are exercised by the purchaser within the time limit prescribed by the securities legislation of the purchaser’s province or territory. The purchaser should refer to any applicable provisions of the securities legislation of the purchaser’s province or territory for particulars of these rights or consult with a legal advisor.
Pursuant to section 3A.3 (or, in the case of securities issued or guaranteed by the government of a non-Canadian jurisdiction, section 3A.4) of National Instrument 33-105 Underwriting Conflicts (“NI 33-105”), the underwriters are not required to comply with the disclosure requirements of NI 33-105 regarding underwriter conflicts of interest in connection with this offering.
Notice to Prospective Investors in Japan
The securities have not been and will not be registered under the Financial Instruments and Exchange Law of Japan (the “Financial Instruments and Exchange Law”) and each underwriter has agreed that it will not offer or sell any securities, directly or indirectly, in Japan or to, or for the benefit of, any resident of Japan (which term as used herein means any person resident in Japan, including any corporation or other entity organized under the laws of Japan), or to others for re-offering or resale, directly or indirectly, in Japan or to a resident of Japan, except pursuant to an exemption from the registration requirements of, and otherwise in compliance with, the Financial Instruments and Exchange Law and any other applicable laws, regulations and ministerial guidelines of Japan.
160
Table of Contents
Conflicts of Interest and Other Relationships
Because Goldman, Sachs & Co. is an underwriter and its affiliates own in excess of 10% of our issued and outstanding common stock, Goldman, Sachs & Co. is deemed to have a “conflict of interest” under FINRA Rule 5121.
Accordingly, this offering will be made in compliance with the applicable provisions of Rule 5121. Rule 5121 requires that a “qualified independent underwriter” meeting certain standards participate in the preparation of the registration statement and prospectus and exercise the usual standards of due diligence in respect thereto, subject to certain exceptions which are not applicable here. Morgan Stanley & Co. LLC will serve as a qualified independent underwriter within the meaning of Rule 5121 in connection with this offering. Morgan Stanley & Co. LLC will not receive any additional compensation for acting as a qualified independent underwriter. In addition, no underwriter with a conflict of interest will confirm sales to any accounts over which it exercises discretionary authority without first receiving a written consent from those accounts. We have agreed to indemnify Morgan Stanley & Co. LLC against certain liabilities incurred in connection with acting as a qualified independent underwriter, including liabilities under the Securities Act.
The underwriters and their respective affiliates are full service financial institutions engaged in various activities, which may include sales and trading, commercial and investment banking, advisory, investment management, investment research, principal investment, hedging, market making, brokerage and other financial and non-financial activities and services. Certain of the underwriters and their respective affiliates have provided, and may in the future provide, a variety of these services to the issuer and to persons and entities with relationships with the issuer, for which they received or will receive customary fees and expenses. Certain of the underwriters or their affiliates are lenders under our credit facilities. In addition, affiliates of certain of the underwriters are parties to interest rate cap agreements with us.
In the ordinary course of their various business activities, the underwriters and their respective affiliates, officers, directors and employees may purchase, sell or hold a broad array of investments and actively trade securities, derivatives, loans, commodities, currencies, credit default swaps and other financial instruments for their own account and for the accounts of their customers, and such investment and trading activities may involve or relate to assets, securities and/or instruments of the issuer (directly, as collateral securing other obligations or otherwise) and/or persons and entities with relationships with the issuer. The underwriters and their respective affiliates may also communicate independent investment recommendations, market color or trading ideas and/or publish or express independent research views in respect of such assets, securities or instruments and may at any time hold, or recommend to clients that they should acquire, long and/or short positions in such assets, securities and instruments. In addition, as described above, an affiliate of Goldman, Sachs & Co. owns in excess of 10% of our issued and outstanding common stock. Bradley Gross and Leonard Seevers, a Managing Director and Vice President, respectively, of an affiliate of Goldman, Sachs & Co., are members of our board of directors.
161
Table of Contents
Weil, Gotshal & Manges LLP, New York, New York, has passed upon the validity of the common stock offered hereby on behalf of us. Certain legal matters will be passed upon on behalf of the underwriters by Kirkland & Ellis LLP, New York, New York.
The financial statement of PSAV, Inc. as of August 24, 2015 and the consolidated financial statements of PSAV Holdings LLC at December 31, 2014 and 2013 and for the periods from January 1, 2014 through January 24, 2014 and January 25, 2014 through December 31, 2014 and for the years ended December 31, 2013 and 2012 included in this Prospectus and the Registration Statement have been audited by Ernst & Young LLP, independent registered public accounting firm, as set forth in their reports thereon, appearing elsewhere herein, and are included in reliance upon such reports given on the authority of such firm as experts in accounting and auditing.
WHERE YOU CAN FIND MORE INFORMATION
We have filed with the SEC a registration statement on Form S-1 under the Securities Act with respect to the shares of our common stock offered by this prospectus. For purposes of this section, the term registration statement means the original registration statement and any and all amendments including the schedules and exhibits to the original registration statement or any amendment. This prospectus, filed as part of the registration statement, does not contain all of the information set forth in the registration statement or the exhibits and schedules thereto as permitted by the rules and regulations of the SEC. For further information about us and our common stock, you should refer to the registration statement, including the exhibits. This prospectus summarizes provisions that we consider material of certain contracts and other documents to which we refer you. Because the summaries may not contain all of the information that you may find important, you should review the full text of those documents.
The registration statement, including its exhibits and schedules, may be inspected and copied at the public reference facilities maintained by the SEC at 100 F Street, N.E., Room 1580, Washington, D.C. 20549. You may obtain information on the operation of the public reference room by calling 1-202-551-8909. Copies of such materials are also available by mail from the Public Reference Branch of the SEC at 100 F Street, N.E., Room 1580, Washington, D.C. 20549 at prescribed rates. In addition, the SEC maintains a website at (http://www.sec.gov) from which interested persons can electronically access the registration statement, including the exhibits and schedules to the registration statement.
We have not authorized anyone to give you any information or to make any representations about us or the transactions we discuss in this prospectus other than those contained in this prospectus. If you are given any information or representations about these matters that is not discussed in this prospectus, you must not rely on that information. This prospectus is not an offer to sell or a solicitation of an offer to buy securities anywhere or to anyone where or to whom we are not permitted to offer or sell securities under applicable law.
162
Table of Contents
| Page | ||||
| PSAV, Inc. |
||||
| Audited Financial Statement |
||||
| F-2 | ||||
| F-3 | ||||
| F-4 | ||||
| PSAV Holdings LLC |
||||
| Audited Consolidated Financial Statements |
||||
| F-5 | ||||
| Consolidated Balance Sheets as of December 31, 2014 (Successor) and December 31, 2013 (Predecessor) |
F-6 | |||
| F-7 | ||||
| F-8 | ||||
| F-9 | ||||
| F-10 | ||||
| F-11 | ||||
| F-12 | ||||
| Unaudited Condensed Consolidated Financial Statements |
||||
| Condensed Consolidated Balance Sheets as of June 30, 2015 and December 31, 2014 |
F-49 | |||
| F-50 | ||||
| F-51 | ||||
| F-52 | ||||
| F-53 | ||||
| Notes to Unaudited Condensed Consolidated Financial Statements |
F-54 | |||
F-1
Table of Contents
REPORT OF INDEPENDENT REGISTERED PUBLIC ACCOUNTING FIRM
The Board of Directors and Stockholder
PSAV, Inc.
We have audited the accompanying balance sheet of PSAV, Inc. (the Company) as of August 24, 2015. The balance sheet is the responsibility of the Company’s management. Our responsibility is to express an opinion on this balance sheet based on our audit.
We conducted our audit in accordance with the standards of the Public Company Accounting Oversight Board (United States). Those standards require that we plan and perform the audit to obtain reasonable assurance about whether the financial statement is free of material misstatement. We were not engaged to perform an audit of the Company’s internal control over financial reporting. Our audit included consideration of internal control over financial reporting as a basis for designing audit procedures that are appropriate in the circumstances, but not for the purpose of expressing an opinion on the effectiveness of the Company’s internal control over financial reporting. Accordingly, we express no such opinion. An audit includes examining, on a test basis, evidence supporting the amounts and disclosures in the financial statements, assessing the accounting principles used and significant estimates made by management, and evaluating the overall financial statement presentation. We believe that our audit provides a reasonable basis for our opinion.
In our opinion, the balance sheet referred to above presents fairly, in all material respects, the financial position of PSAV, Inc. as of August 24, 2015, in conformity with U.S. generally accepted accounting principles.
/s/ Ernst & Young LLP
Chicago, Illinois
September 9, 2015
F-2
Table of Contents
PSAV, INC.
August 24, 2015
| Assets |
||||
| Cash |
$ | 100 | ||
|
|
|
|||
| Total assets |
$ | 100 | ||
|
|
|
|||
| Stockholder’s equity |
||||
| Common stock ($0.01 par value; 1,000 shares authorized, issued and outstanding) |
$ | 10 | ||
| Additional paid-in capital |
90 | |||
|
|
|
|||
| Total stockholder’s equity |
$ | 100 | ||
|
|
|
The accompanying notes are an integral part of these consolidated financial statements.
F-3
Table of Contents
PSAV, INC.
1. Organization and Operations
PSAV, Inc. (the “Company”) is a Delaware Corporation, incorporated on August 11, 2015 to serve as the issuer of an initial public offering of equity (the “IPO”). The Company is wholly owned by PSAV Holdings LLC. Immediately prior to the completion of the IPO, PSAV Holdings LLC will liquidate and distribute its shares of PSAV, Inc. to its members.
2. Summary of Significant Accounting Policies
Basis of Presentation
The Company’s balance sheet has been prepared in accordance with U.S. generally accepted accounting principles. Separate statements of operations, cash flows, and changes in stockholder’s equity and comprehensive income have not been presented because this entity has had no operations to date.
Subsequent Events
The Company has evaluated subsequent events through September 9, 2015, which is the date the balance sheet was issued.
3. Stockholder’s Equity
The Company is authorized to issue 1,000 shares of common stock with a par value $0.01 per share. The Company issued 1,000 shares of its common stock to PSAV Holdings LLC in exchange for a $100 capital contribution.
F-4
Table of Contents
REPORT OF INDEPENDENT REGISTERED PUBLIC ACCOUNTING FIRM
The Board of Directors and Members
PSAV Holdings LLC
We have audited the accompanying consolidated balance sheets of PSAV Holdings LLC (the Company) as of December 31, 2014 (Successor) and 2013 (Predecessor), and the related consolidated statements of operations, comprehensive income (loss), changes in members’ equity, and cash flows for the period from January 25, 2014 through December 31, 2014 (Successor) and the related consolidated statements of operations, comprehensive income (loss), changes in shareholders’ equity, and cash flows for the period from January 1, 2014 through January 24, 2014 and the years ended December 31, 2013 and 2012 (Predecessor). These financial statements are the responsibility of the Company’s management. Our responsibility is to express an opinion on these consolidated financial statements based on our audits.
We conducted our audits in accordance with the standards of the Public Company Accounting Oversight Board (United States). Those standards require that we plan and perform the audit to obtain reasonable assurance about whether the financial statements are free of material misstatement. We were not engaged to perform an audit of the Company’s internal control over financial reporting. Our audits included consideration of internal control over financial reporting as a basis for designing audit procedures that are appropriate in the circumstances, but not for the purpose of expressing an opinion on the effectiveness of the Company’s internal control over financial reporting. Accordingly, we express no such opinion. An audit also includes examining, on a test basis, evidence supporting the amounts and disclosures in the financial statements, assessing the accounting principles used and significant estimates made by management, and evaluating the overall financial statement presentation. We believe that our audits provide a reasonable basis for our opinion.
In our opinion, the consolidated financial statements referred to above present fairly, in all material respects, the consolidated financial position of PSAV Holdings LLC as of December 31, 2014 (Successor) and 2013 (Predecessor), and the results of its operations and its cash flows for the period from January 25, 2014 through December 31, 2014 (Successor) and for the period from January 1, 2014 through January 24, 2014 and the years ended December 31, 2013 and 2012 (Predecessor) in conformity with U.S. generally accepted accounting principles.
/s/ Ernst & Young LLP
Chicago, Illinois
September 9, 2015
F-5
Table of Contents
PSAV HOLDINGS LLC
(In thousands except for share and per share amounts)
| Successor | Predecessor | |||||||
| December 31, 2014 |
December 31, 2013 |
|||||||
| Assets |
||||||||
| Current assets: |
||||||||
| Cash and cash equivalents |
$ | 68,818 | $ | 23,733 | ||||
| Trade accounts receivable, net of allowance for doubtful accounts of $181 at 2014 and $1,425 at 2013 |
76,946 | 77,319 | ||||||
| Deferred tax assets |
13,471 | 10,597 | ||||||
| Prepaid expenses |
15,487 | 11,655 | ||||||
| Other current assets |
6,840 | 264 | ||||||
|
|
|
|
|
|||||
| Total current assets |
181,562 | 123,568 | ||||||
| Property and equipment, net |
109,678 | 83,546 | ||||||
| Goodwill |
367,000 | 231,443 | ||||||
| Trade name, net |
160,395 | 55,991 | ||||||
| Customer relationships, net |
58,420 | 21,472 | ||||||
| Venue contracts, net |
301,886 | 104,515 | ||||||
| Venue incentives |
14,784 | 19,745 | ||||||
| Other assets |
2,132 | 2,003 | ||||||
|
|
|
|
|
|||||
| Total assets |
$ | 1,195,857 | $ | 642,283 | ||||
|
|
|
|
|
|||||
| Liabilities and members’/shareholders’ equity |
||||||||
| Current liabilities: |
||||||||
| Current portion of long-term debt |
$ | 15,050 | $ | 3,400 | ||||
| Trade accounts payable |
29,921 | 26,183 | ||||||
| Accrued expenses |
70,411 | 60,599 | ||||||
|
|
|
|
|
|||||
| Total current liabilities |
115,382 | 90,182 | ||||||
| Long-term debt |
653,217 | 465,442 | ||||||
| Deferred tax liabilities |
165,839 | 32,972 | ||||||
| Other liabilities |
2,651 | 2,178 | ||||||
|
|
|
|
|
|||||
| Total liabilities |
937,089 | 590,774 | ||||||
| Commitments and contingencies (Note 19) |
||||||||
| Predecessor shareholders’ equity: |
||||||||
| Common stock ($0.01 par value; 4,000 shares authorized; |
||||||||
| 3,473 shares issued and outstanding at December 31, 2013) |
— | — | ||||||
| Preferred stock ($0.001 par value; 250,000 shares authorized; |
||||||||
| 74,044 shares issued and outstanding at December 31, 2013) |
— | — | ||||||
| Additional paid-in capital |
— | 241,341 | ||||||
| Accumulated deficit |
— | (190,367 | ) | |||||
| Accumulated other comprehensive income |
— | 535 | ||||||
| Successor members’ equity: |
||||||||
| Class A units, 269,663 units issued and outstanding at December 31, 2014 |
259,097 | — | ||||||
| Class B units, 15,371 units issued and outstanding at December 31, 2014 |
299 | |||||||
| Accumulated other comprehensive loss |
(628 | ) | — | |||||
|
|
|
|
|
|||||
| Total members’/shareholders’ equity |
258,768 | 51,509 | ||||||
|
|
|
|
|
|||||
| Total liabilities and members’/shareholders’ equity |
$ | 1,195,857 | $ | 642,283 | ||||
|
|
|
|
|
|||||
The accompanying notes are an integral part of these consolidated financial statements
F-6
Table of Contents
PSAV HOLDINGS LLC
CONSOLIDATED STATEMENTS OF OPERATIONS
(In thousands)
| Successor | Predecessor | |||||||||||||||
| January 25, through December 31, 2014 |
January 1, through January 24, 2014 |
Year ended December 31, |
||||||||||||||
| 2013 | 2012 | |||||||||||||||
| Revenue |
$ | 1,188,283 | $ | 75,622 | $ | 1,096,374 | $ | 724,848 | ||||||||
| Cost of revenue |
(1,012,548 | ) | (63,684 | ) | (929,871 | ) | (625,535 | ) | ||||||||
|
|
|
|
|
|
|
|
|
|||||||||
| Gross profit |
175,735 | 11,938 | 166,503 | 99,313 | ||||||||||||
| Operating expenses: |
||||||||||||||||
| Selling, general, and administrative expenses |
96,657 | 30,448 | 92,781 | 71,300 | ||||||||||||
| Acquisition-related expenses |
18,977 | 14,160 | 3,316 | 1,668 | ||||||||||||
| Depreciation |
3,740 | 340 | 3,917 | 2,767 | ||||||||||||
| Amortization of intangibles |
22,606 | 950 | 12,491 | 5,071 | ||||||||||||
|
|
|
|
|
|
|
|
|
|||||||||
| Total operating expenses |
141,980 | 45,898 | 112,505 | 80,806 | ||||||||||||
|
|
|
|
|
|
|
|
|
|||||||||
| Income (loss) from operations |
33,755 | (33,960 | ) | 53,998 | 18,507 | |||||||||||
| Other income (expense), net |
(3,892 | ) | 366 | 1,278 | 1,308 | |||||||||||
| Interest expense, net |
(40,536 | ) | (2,830 | ) | (40,700 | ) | (20,011 | ) | ||||||||
|
|
|
|
|
|
|
|
|
|||||||||
| Income (loss) before tax benefit |
(10,673 | ) | (36,424 | ) | 14,576 | (196 | ) | |||||||||
| Income tax benefit |
107 | 10,503 | 3,020 | 9,899 | ||||||||||||
|
|
|
|
|
|
|
|
|
|||||||||
| Net income (loss) |
$ | (10,566 | ) | $ | (25,921 | ) | $ | 17,596 | $ | 9,703 | ||||||
|
|
|
|
|
|
|
|
|
|||||||||
The accompanying notes are an integral part of these consolidated financial statements
F-7
Table of Contents
PSAV HOLDINGS LLC
CONSOLIDATED STATEMENTS OF COMPREHENSIVE INCOME (LOSS)
(In thousands)
| Successor | Predecessor | |||||||||||||||
| January 25, through December 31, 2014 |
January 1, through January 24, 2014 |
Year ended December 31, |
||||||||||||||
| 2013 | 2012 | |||||||||||||||
| Net income (loss) |
$ | (10,566 | ) | $ | (25,921 | ) | $ | 17,596 | $ | 9,703 | ||||||
| Other comprehensive loss, net of tax: |
||||||||||||||||
| Foreign currency translation adjustments |
(628 | ) | (330 | ) | (2,204 | ) | (898 | ) | ||||||||
|
|
|
|
|
|
|
|
|
|||||||||
| Total other comprehensive loss |
(628 | ) | (330 | ) | (2,204 | ) | (898 | ) | ||||||||
|
|
|
|
|
|
|
|
|
|||||||||
| Total comprehensive income (loss) |
$ | (11,194 | ) | $ | (26,251 | ) | $ | 15,392 | $ | 8,805 | ||||||
|
|
|
|
|
|
|
|
|
|||||||||
The accompanying notes are an integral part of these consolidated financial statements
F-8
Table of Contents
PSAV HOLDINGS LLC
CONSOLIDATED STATEMENTS OF SHAREHOLDERS’ EQUITY (PREDECESSOR)
(In thousands except for share and per share amounts)
|
Common Stock |
Preferred Stock | Additional Paid-In Capital |
Accumulated Deficit |
Accumulated Other Comprehensive Income (Loss) |
Total Shareholders’ Equity |
|||||||||||||||||||||||||||
| Shares | Amount | Shares | Amount | |||||||||||||||||||||||||||||
| Predecessor: |
||||||||||||||||||||||||||||||||
| Balances at December 31, 2011 |
3,432 | $ | 0 | — | $ | — | $ | 129,032 | $ | (208,622 | ) | $ | 3,637 | $ | (75,953 | ) | ||||||||||||||||
| Capital contribution |
— | — | — | — | 42,215 | — | — | 42,215 | ||||||||||||||||||||||||
| Exercise of stock options in AVSC Holding Corp. |
41 | — | — | — | — | — | — | — | ||||||||||||||||||||||||
| Issuance of Series A preferred stock, net of offering costs of $3,950 |
— | — | 65,000 | 0 | 61,050 | — | — | 61,050 | ||||||||||||||||||||||||
| Net income |
— | — | — | — | — | 9,703 | — | 9,703 | ||||||||||||||||||||||||
| Other comprehensive loss |
— | — | — | — | — | — | (898 | ) | (898 | ) | ||||||||||||||||||||||
|
|
|
|
|
|
|
|
|
|
|
|
|
|
|
|
|
|||||||||||||||||
| Balances at December 31, 2012 |
3,473 | $ | 0 | 65,000 | $ | 0 | $ | 232,297 | $ | (198,919 | ) | $ | 2,739 | $ | 36,117 | |||||||||||||||||
|
|
|
|
|
|
|
|
|
|
|
|
|
|
|
|
|
|||||||||||||||||
| Preferred stock paid-in-kind dividends |
— | — | 9,044 | 0 | 9,044 | (9,044 | ) | — | — | |||||||||||||||||||||||
| Net income |
— | — | — | — | — | 17,596 | — | 17,596 | ||||||||||||||||||||||||
| Other comprehensive loss |
— | — | — | — | — | — | (2,204 | ) | (2,204 | ) | ||||||||||||||||||||||
|
|
|
|
|
|
|
|
|
|
|
|
|
|
|
|
|
|||||||||||||||||
| Balances at December 31, 2013 |
3,473 | $ | 0 | 74,044 | $ | 0 | $ | 241,341 | $ | (190,367 | ) | $ | 535 | $ | 51,509 | |||||||||||||||||
|
|
|
|
|
|
|
|
|
|
|
|
|
|
|
|
|
|||||||||||||||||
| Preferred stock paid-in-kind dividends |
— | — | 574 | 0 | 574 | (574 | ) | — | — | |||||||||||||||||||||||
| Net loss |
— | — | — | — | — | (25,921 | ) | — | (25,921 | ) | ||||||||||||||||||||||
| Other comprehensive loss |
— | — | — | — | — | — | (330 | ) | (330 | ) | ||||||||||||||||||||||
|
|
|
|
|
|
|
|
|
|
|
|
|
|
|
|
|
|||||||||||||||||
| Balances at January 24, 2014 |
3,473 | $ | 0 | 74,618 | $ | 0 | $ | 241,915 | $ | (216,862 | ) | $ | 205 | $ | 25,258 | |||||||||||||||||
|
|
|
|
|
|
|
|
|
|
|
|
|
|
|
|
|
|||||||||||||||||
The accompanying notes are an integral part of these consolidated financial statements
F-9
Table of Contents
PSAV HOLDINGS LLC
CONSOLIDATED STATEMENT OF MEMBERS’ EQUITY (SUCCESSOR)
(In thousands except for share and per share amounts)
|
Class A Units |
Class B Units | Accumulated other Comprehensive Loss |
Total Members’ Equity |
|||||||||||||||||||||
| Units | Amount | Units | Amount | |||||||||||||||||||||
| Balances at January 25, 2014 |
— | $ | — | — | $ | — | $ | — | $ | — | ||||||||||||||
| Initial equity funding |
269,438 | 269,438 | 14,371 | — | — | 269,438 | ||||||||||||||||||
| Issuances of Class A and Class B Units |
425 | 425 | 1,000 | — | — | 425 | ||||||||||||||||||
| Repurchases of Class A Units |
(200 | ) | (200 | ) | — | — | — | (200 | ) | |||||||||||||||
| Net loss |
— | (10,566 | ) | — | — | — | (10,566 | ) | ||||||||||||||||
| Equity-based compensation |
— | — | — | 299 | — | 299 | ||||||||||||||||||
| Other comprehensive loss |
— | — | — | — | (628 | ) | (628 | ) | ||||||||||||||||
|
|
|
|
|
|
|
|
|
|
|
|
|
|||||||||||||
| Balances at December 31, 2014 |
269,663 | $ | 259,097 | 15,371 | $ | 299 | $ | (628 | ) | $ | 258,768 | |||||||||||||
|
|
|
|
|
|
|
|
|
|
|
|
|
|||||||||||||
The accompanying notes are an integral part of these consolidated financial statements
F-10
Table of Contents
PSAV HOLDINGS LLC
CONSOLIDATED STATEMENTS OF CASH FLOWS
(In thousands)
| Successor | Predecessor | |||||||||||||||
| January 25, through December 31, 2014 |
January 1, through January 24, 2014 |
Year ended December 31, |
||||||||||||||
| 2013 | 2012 | |||||||||||||||
| Operating activities: |
||||||||||||||||
| Net income (loss) |
$ | (10,566 | ) | $ | (25,921 | ) | $ | 17,596 | $ | 9,703 | ||||||
| Adjustments to reconcile net income (loss) to net cash provided by (used in) operating activities: |
||||||||||||||||
| Depreciation |
49,344 | 2,272 | 35,011 | 25,103 | ||||||||||||
| Amortization of intangibles |
22,606 | 950 | 12,491 | 5,071 | ||||||||||||
| Amortization of deferred financing costs and debt discounts |
2,859 | 281 | 4,028 | 1,912 | ||||||||||||
| Expenses incurred in connection with debt modification (Note 11) |
— | — | — | 4,071 | ||||||||||||
| Loss on fixed asset disposals |
2,918 | 127 | 2,052 | 1,695 | ||||||||||||
| Venue incentive amortization |
4,332 | 616 | 9,310 | 8,623 | ||||||||||||
| Venue incentive payments |
(15,542 | ) | (99 | ) | (6,361 | ) | (4,578 | ) | ||||||||
| Deferred tax provision |
(3,702 | ) | (10,567 | ) | (4,389 | ) | (11,847 | ) | ||||||||
| Equity-based compensation expense |
299 | 5,365 | — | — | ||||||||||||
| Changes in assets and liabilities, net of effects of acquired businesses: |
||||||||||||||||
| Accounts receivable |
6,015 | (5,644 | ) | (14,292 | ) | 14,279 | ||||||||||
| Prepaid expenses and other current assets |
(8,462 | ) | (1,947 | ) | 356 | (5,153 | ) | |||||||||
| Other assets |
(115 | ) | 163 | 1,004 | 1,703 | |||||||||||
| Accounts payable |
7,170 | (3,433 | ) | 3,664 | (4,618 | ) | ||||||||||
| Accrued expenses and other liabilities |
(10,885 | ) | 35,819 | (9,140 | ) | 11,467 | ||||||||||
|
|
|
|
|
|
|
|
|
|||||||||
| Net cash provided by (used in) operating activities |
46,271 | (2,018 | ) | 51,330 | 57,431 | |||||||||||
|
|
|
|
|
|
|
|
|
|||||||||
| Investing activities: |
||||||||||||||||
| Proceeds from sale of assets |
— | — | 170 | 147 | ||||||||||||
| Purchase of property and equipment |
(34,130 | ) | (4,268 | ) | (36,506 | ) | (29,354 | ) | ||||||||
| Acquisitions, net of cash acquired |
(877,602 | ) | — | (40,883 | ) | (275,389 | ) | |||||||||
|
|
|
|
|
|
|
|
|
|||||||||
| Net cash used in investing activities |
(911,732 | ) | (4,268 | ) | (77,219 | ) | (304,596 | ) | ||||||||
|
|
|
|
|
|
|
|
|
|||||||||
| Financing activities: |
||||||||||||||||
| Capital contributions |
269,438 | — | — | 42,215 | ||||||||||||
| Issuances of Class A and Class B Units |
425 | — | — | — | ||||||||||||
| Issuance of preferred stock |
— | — | — | 65,000 | ||||||||||||
| Repurchases of Class A Units |
(200 | ) | — | — | — | |||||||||||
| Borrowings of revolving facility |
10,000 | — | — | — | ||||||||||||
| Repayments of long-term debt |
(3,788 | ) | — | (61,250 | ) | (308,260 | ) | |||||||||
| Borrowings of long-term debt |
679,775 | — | 97,000 | 466,200 | ||||||||||||
| Payment of deferred financing costs |
(20,579 | ) | — | — | (28,512 | ) | ||||||||||
| Payment of preferred stock issuance costs |
— | — | — | (3,950 | ) | |||||||||||
|
|
|
|
|
|
|
|
|
|||||||||
| Net cash provided by financing activities |
935,071 | — | 35,750 | 232,693 | ||||||||||||
|
|
|
|
|
|
|
|
|
|||||||||
| Effect of exchange rate changes on cash and cash equivalents |
(792 | ) | (344 | ) | (155 | ) | 183 | |||||||||
|
|
|
|
|
|
|
|
|
|||||||||
| Net increase (decrease) in cash and cash equivalents |
68,818 | (6,630 | ) | 9,706 | (14,289 | ) | ||||||||||
| Cash and cash equivalents at beginning of period |
— | 23,733 | 14,027 | 28,316 | ||||||||||||
|
|
|
|
|
|
|
|
|
|||||||||
| Cash and cash equivalents at end of period |
$ | 68,818 | $ | 17,103 | $ | 23,733 | $ | 14,027 | ||||||||
|
|
|
|
|
|
|
|
|
|||||||||
| Supplemental Cash Flow Information |
||||||||||||||||
| Cash paid (refunds received) during the period for: |
||||||||||||||||
| Interest paid |
$ | 31,816 | $ | 1,344 | $ | 36,552 | $ | 14,023 | ||||||||
| Income taxes |
13,166 | (29 | ) | 2,080 | 1,916 | |||||||||||
The accompanying notes are an integral part of these consolidated financial statements
F-11
Table of Contents
PSAV HOLDINGS LLC
NOTES TO CONSOLIDATED FINANCIAL STATEMENTS
(In thousands except for share and per share amounts)
1. Description of the Business
PSAV Holdings LLC (the “Company” or “PSAV”) is owned by affiliates of The Goldman Sachs Group, Inc. (“Goldman Sachs”) and Olympus Partners (together, “the Sponsors”) and certain management investors and other investors. The Company and its subsidiaries provide event technology services, such as audiovisual services, equipment rental, staging and meeting services, communication systems and related technical support to its customers in various venues, including hotels and convention centers. The Company’s business is primarily conducted under the name PSAV. The Company is organized and operated as two operating segments: Domestic and International. The Domestic segment provides these services to customers throughout the United States and Puerto Rico. The International segment provides services to its customers in Canada, Mexico, the Caribbean, Europe and the Middle East, in addition to providing non-venue based services in Asia.
2. Basis of Presentation
On January 24, 2014, PSAV Acquisition Corp., a wholly owned subsidiary of the Company, acquired AVSC Holding Corp. pursuant to a Stock Purchase Agreement (the “Purchase Agreement”) dated November 15, 2013. Subsequent to the acquisition, PSAV Acquisition Corp. was merged with and into AVSC Holding Corp., with AVSC Holding Corp. being the surviving entity. The acquisition and merger transactions are collectively referred to as the “Sponsors Acquisition.” The Sponsors Acquisition was accounted for as a business combination in accordance with Financial Accounting Standards Board (“FASB”) Accounting Standards Codification (“ASC”) Topic 805, Business Combinations, and the resulting new basis of accounting is reflected in the Company’s consolidated financial statements for all periods beginning on or after January 25, 2014.
The accompanying consolidated financial statements of the Company include all the accounts of PSAV Holdings LLC and its subsidiaries for periods designated as “Successor” and relate to periods after the Sponsors Acquisition. Periods designated as “Predecessor” relate to period prior to the Sponsors Acquisition and include all the accounts of AVSC Holding Corp. and its subsidiaries. The period from January 1, 2014 through January 24, 2014 is referred to herein as the “Predecessor 2014 Period.” The period from January 25, 2014 through December 31, 2014 is referred to herein as the “Successor 2014 Period.” The Successor 2014 Period includes certain acquisition-related expenses of PSAV Acquisition Corp. (see Note 5).
The consolidated financial statements have been prepared in accordance with U.S. generally accepted accounting principles (“U.S. GAAP”) and all significant intercompany balances and transactions have been eliminated in consolidation.
3. Significant Accounting Policies
Use of Estimates
The preparation of financial statements in conformity with U.S. GAAP requires management to make estimates and assumptions that affect the reported amounts of assets and liabilities, the disclosure of contingent assets and liabilities, and the reported amounts of revenues and expenses during the reporting period. Actual results could differ from those estimates. The most significant areas that require management’s estimates relate to the allowance for doubtful accounts, impairment testing
F-12
Table of Contents
PSAV HOLDINGS LLC
NOTES TO CONSOLIDATED FINANCIAL STATEMENTS (continued)
(In thousands except for share and per share amounts)
of goodwill, trade names and long-lived assets, valuation of assets acquired and liabilities assumed in a business combination, reserves for self-insurance losses, income taxes and the useful lives of property and equipment and intangible assets.
Revenue Recognition
The Company’s primary source of revenue is providing event technology services, which can include audiovisual services, audiovisual equipment rental, staging and meeting services and event related communication systems as well as related technical support, to customers in various venues, including hotels and convention centers. The Company recognizes revenue when persuasive evidence of an arrangement exists, services have been rendered, the fee is fixed and determinable and collectability is reasonably assured. Revenue is recognized in the period in which services are provided pursuant to the terms of the Company’s contractual arrangements with its customers. Revenue related to multi-day events is recognized using the proportional performance model as services are provided over the course of the event. Revenue related to contracts for rigging, power and network installations is recognized when the installation is complete.
The Company also evaluates whether it is appropriate to present as revenue the gross amount that customers pay for the Company’s services, and the related commissions paid to the venue as cost of revenue, or to recognize the net amount (gross revenue less the related commissions paid to the venue). In a standard arrangement, the Company negotiates and executes a contract directly with the customer and the Company is responsible for the delivery of the services, including providing the necessary labor and equipment to perform the services. The Company is subject to risk of loss with its equipment, has latitude in establishing prices and selecting suppliers and, while in many cases the venue bills the end customer on behalf of the Company, the Company bears the collection risk from the customer. As a result, the Company’s revenue is primarily reported based on the gross basis.
Venue Incentives
The Company enters into long-term contracts with venue operators for the right to be the exclusive on-site provider of audiovisual and event technology services and to receive customer referrals from the venue operator over the contract period. The Company defers certain up-front cash payments and the estimated cost of capital equipment and/or installation services obligations incurred in connection with signing new venue contracts or renewing existing venue contracts. In the event the contract is early terminated by the venue operator, the venue operator must repay a ratable portion of the cash payment and the value of the capital equipment and/or installation services obligations based on the remaining contract period. Venue incentives are amortized into cost of revenue over the life of the contract with the venue operator, which typically range from three to six years. The Company reviews its venue incentives for impairment whenever events or changes in circumstances indicate the carrying amount of the venue incentives may not be recoverable.
Cost of Revenue
Cost of revenue principally includes commissions paid to venues, direct labor costs, the cost of equipment sub-rentals, depreciation of equipment, amortization of venue incentives and losses on disposals of equipment.
F-13
Table of Contents
PSAV HOLDINGS LLC
NOTES TO CONSOLIDATED FINANCIAL STATEMENTS (continued)
(In thousands except for share and per share amounts)
Advertising
The Company expenses advertising costs as incurred. Advertising costs, which consist primarily of print advertising, amounted to $219, $25, $246 and $181 for the Successor 2014 Period, the Predecessor 2014 Period and the years ended December 31, 2013 and 2012, respectively.
Cash and Cash Equivalents
The Company considers all highly liquid investments purchased with an original maturity of three months or less to be cash equivalents.
Accounts Receivable and Allowance for Doubtful Accounts
Accounts receivable are uncollateralized customer obligations due under normal trade terms, and do not bear interest. The carrying amount of accounts receivable is reduced by an allowance for estimated losses, which is based upon the aging of outstanding balances and other account monitoring analysis. Fully reserved receivables are reviewed on a monthly basis and uncollectible accounts are written off against the allowance after reasonable collection efforts have been exhausted.
Concentrations of credit risk with respect to accounts receivable are limited due to the number of customers making up the Company’s customer base. The Company does not require collateral for trade accounts receivable.
A summary of the activity with respect to the accounts receivable allowance for doubtful accounts is as follows:
| Accounts receivable allowance balance at December 31, 2011 (Predecessor) |
$ | 1,836 | ||
| Additions charged to costs and expenses |
212 | |||
| Write-offs |
(604 | ) | ||
|
|
|
|||
| Accounts receivable allowance balance at December 31, 2012 (Predecessor) |
1,444 | |||
| Additions charged to costs and expenses |
582 | |||
| Write-offs |
(601 | ) | ||
|
|
|
|||
| Accounts receivable allowance balance at December 31, 2013 (Predecessor) |
1,425 | |||
| Credits to costs and expenses |
(6 | ) | ||
| Write-offs |
(78 | ) | ||
|
|
|
|||
| Accounts receivable allowance balance at January 24, 2014 (Predecessor) |
$ | 1,341 | ||
|
|
|
|||
| Accounts receivable allowance balance at January 25, 2014 (Successor) |
$ | — | ||
| Additions charged to costs and expenses |
276 | |||
| Write-offs |
(95 | ) | ||
|
|
|
|||
| Accounts receivable allowance balance at December, 2014 (Successor) |
$ | 181 | ||
|
|
|
Fair Value of Financial Instruments
The Company considers carrying amounts of cash and cash equivalents, trade accounts receivable and accounts payable to approximate fair value because of the short maturity of these financial instruments.
F-14
Table of Contents
PSAV HOLDINGS LLC
NOTES TO CONSOLIDATED FINANCIAL STATEMENTS (continued)
(In thousands except for share and per share amounts)
Derivative Financial Instruments
The Company accounts for derivative instruments in accordance with ASC Topic 815, Derivatives and Hedging. Derivative instruments are recognized as either assets or liabilities at fair value in the Company’s consolidated balance sheet. Changes in fair value are recognized in other expenses, net in the Company’s consolidated statement of operations.
Property and Equipment
Property and equipment are recorded at cost. Depreciation is calculated on the straight-line method over the estimated useful lives of the assets.
The estimated useful lives of property and equipment are as follows:
| Estimated Useful Lives | ||
| Audiovisual rental and production equipment |
3-5 | |
| Furniture and fixtures |
5 | |
| Information systems and software |
3-5 | |
| Leasehold improvements |
1-5 |
Leases
The Company categorizes leases at their inception as either operating or capital leases and may receive renewal or expansion options, rent holidays, and leasehold improvement and other incentives on certain lease agreements. The Company recognizes lease costs on a straight-line basis, taking into account adjustments for free or escalating rental payments and deferred payment terms. Additionally, lease incentives are accounted for as a reduction of lease costs over the term of the agreement. Leasehold improvements are capitalized at cost and amortized over the shorter of their useful life or the non-cancellable term of the lease.
Business Combinations
The Company accounts for business combinations using the acquisition method of accounting in accordance with ASC Topic 805. ASC Topic 805 requires the Company to recognize acquired assets, including identifiable intangible assets and all assumed liabilities, at fair value on the acquisition date. Determining the fair value of assets acquired and liabilities assumed requires management’s judgment and often involves the use of significant estimates and assumptions, including assumptions with respect to future cash flows, discount rates and asset lives.
Goodwill and Indefinite-Lived Intangible Assets
The Company does not amortize goodwill, but tests it at least annually for impairment at the reporting unit level. A reporting unit is the operating segment or one level below that operating segment (the component level) if discrete financial information is prepared and regularly reviewed by segment management. Each of the Company’s operating segments, Domestic and International is made up of a single reporting unit. The Company has the option to assess goodwill for impairment by first performing a qualitative assessment to determine whether it is more-likely-than-not that the fair value of a
F-15
Table of Contents
PSAV HOLDINGS LLC
NOTES TO CONSOLIDATED FINANCIAL STATEMENTS (continued)
(In thousands except for share and per share amounts)
reporting unit is less than its carrying amount. If the Company determines that it is not more-likely-than-not that the fair value of a reporting unit is less than its carrying amount, then further goodwill impairment testing is not required to be performed. If the Company determines that it is more-likely-than-not that the fair value of a reporting unit is less than its carrying amount, or if the Company does not elect the option to perform an initial qualitative assessment, the Company is required to perform a two-step goodwill impairment test. The first step of the goodwill impairment test compares the fair value of each reporting unit with its carrying value, including goodwill. If the carrying amount of a reporting unit exceeds its fair value, an indication of impairment exists. The second step of the goodwill impairment test is performed to measure the amount of the impairment loss, if any. If the carrying value of goodwill exceeds its implied fair value, an impairment loss is recognized equal to the excess. The implied fair value of goodwill is determined by allocating the fair value of each reporting unit in a manner similar to a purchase price allocation. The residual fair value after this allocation is the implied fair value of the reporting unit goodwill. The Company uses a combination of discounted cash flows and market multiples to estimate the fair value of each reporting unit.
Intangible assets with indefinite useful lives are not amortized but are tested for impairment at least annually. Indefinite-lived intangible assets are tested for impairment by comparing the fair value of the intangible asset with its carrying value. If the carrying value exceeds the fair value, an impairment loss is recognized equal to the excess.
The Company performs its annual impairment test as of October 1 of each year for goodwill and indefinite-lived intangible assets. The impairment test would be conducted more frequently if an event or circumstances indicate that an impairment loss has been incurred. Conditions that would trigger an impairment assessment include, but are not limited to, a significant adverse change in legal factors or business climate that could affect the fair value of an asset. No such conditions occurred during 2012, 2013 or 2014.
Long-Lived Assets Impairment Assessments
Under the provisions of ASC Topic 360, Property, Plant, and Equipment, the Company reviews property and equipment and intangibles with finite lives for impairment whenever events or changes in circumstances indicate that the carrying amount of an asset may not be recoverable. Recoverability of assets to be held and used is measured by a comparison of the carrying amount of an asset to future undiscounted cash flows expected to be generated by the asset over its remaining useful life. If such assets are not recoverable under this test, the impairment to be recognized is measured by the amount by which the carrying amount of the assets exceeds the fair value of the assets. There was no impairment of the Company’s long-lived assets recognized for the years ended December 31, 2013 and 2012 or the Predecessor and Successor 2014 Periods.
Long-Term Debt and Deferred Financing Costs
The Company classifies long-term debt that is expected to be settled shortly after the balance sheet date as current if the debt is expected to be repaid with existing resources classified as current assets.
The Company records financing costs incurred as a part of obtaining long-term financing as a reduction in the carrying amount of the related debt liability. These costs are amortized into interest
F-16
Table of Contents
PSAV HOLDINGS LLC
NOTES TO CONSOLIDATED FINANCIAL STATEMENTS (continued)
(In thousands except for share and per share amounts)
expense over the term of the related debt using the effective interest rate method. Deferred financing costs of $18,235 and $1,522 are included as a reduction in the carrying amount of long-term debt at December 31, 2014 and December 2013, respectively, net of accumulated amortization of $2,344 and $378, respectively.
Income Taxes
The Company is currently organized as a limited liability company, which is a pass-through entity for federal and state income tax purposes. However, the Company conducts its business through subsidiaries that are subject to income taxes in both the United States and numerous foreign jurisdictions. Significant judgment is required in determining the provision for income taxes and income tax assets and liabilities, including evaluating uncertainties with the application of accounting principles and corporate laws.
The Company records a provision for income taxes using the asset and liability method. Under this method, the Company recognizes deferred tax assets and liabilities for the expected future tax consequences of temporary differences between the financial reporting and tax bases of assets and liabilities as well as for operating loss and tax credit carryforwards. Deferred tax assets and liabilities are measured using the enacted tax rates that are expected to apply to taxable income for the years in which those tax assets and liabilities are expected to be realized or settled. The Company records valuation allowances to reduce its deferred tax assets to the net amount that management believes is more likely than not to be realized.
The Company recognizes a tax benefit associated with an uncertain tax position when, in management’s judgment, it is more likely than not that the position will be sustained upon examination by a taxing authority based on the technical merits of the position. For a tax position that meets the more-likely-than-not recognition threshold, the Company initially and subsequently measures the tax benefit as the largest amount that management judges to have a greater than 50% likelihood of being realized upon ultimate settlement with a taxing authority. The liability associated with unrecognized tax benefits is adjusted periodically due to changing circumstances, such as the progress of tax audits, case law developments and new or emerging legislation. Such adjustments are recognized entirely in the period in which they are identified. The Company includes interest and penalties in the provision for income taxes on its consolidated statements of operations.
Foreign Currency
The financial statements of foreign subsidiaries are translated into U.S. dollars at current rates as of the balance sheet dates, and revenue, costs and expenses are translated at average current rates during each reporting period. The gains or losses resulting from translation are included as a component of accumulated other comprehensive income (loss), net of taxes, in members’ equity.
Gains and losses resulting from foreign currency transactions are included in the Company’s consolidated statements of operations in other income (expense), net. Net transaction gains and (losses) for the Successor 2014 Period and the Predecessor 2014 Period and the years ended December 31, 2013 and 2012 were $(2,075), $366, $(1,278) and $(1,308), respectively.
F-17
Table of Contents
PSAV HOLDINGS LLC
NOTES TO CONSOLIDATED FINANCIAL STATEMENTS (continued)
(In thousands except for share and per share amounts)
Internal-Use Software
The Company incurs costs related to internal-use software. Costs incurred in the planning and evaluation stage of internally-developed software are expensed as incurred. Costs incurred and accumulated during the application development stage are capitalized and included within property and equipment, net on the Company’s consolidated balance sheet. Capitalized internally-developed software is amortized over its expected economic life ranging from three to five years using the straight-line method.
Unamortized internal-use software development costs totaled $2,249 and $1,672 as of December 31, 2014 and 2013, respectively. Total amortization of these costs, included in depreciation for the Successor 2014 Period and the Predecessor 2014 Period and the years ended December 31, 2013 and 2012, was $816, $63, $1,137 and $1,377, respectively.
Concentration of Credit Risk
Financial instruments that potentially subject the Company to significant concentrations of credit risk consist principally of cash and cash equivalents and trade accounts receivable. The Company maintains deposits at several financial institutions, which often exceed Federal Deposit Insurance Corporation (FDIC) insurance limits. At December 31, 2014 and 2013, the amount held at financial institutions in excess of FDIC limits was $61,486 and $19,878, respectively. The Company believes its deposits are at institutions with strong credit ratings.
Concentration of Labor
Approximately 8.5% of the Company’s Successor 2014 Period Domestic wages and salaries are covered under 52 union agreements that expire at various times from 2015 to 2026.
4. Recent Accounting Pronouncements
In April 2015, the FASB issued Accounting Standards Update (“ASU”) 2015-03, “Interest—Imputation of Interest (Subtopic 835-30): Simplifying the Presentation of Debt Issuance Costs.” This ASU requires that debt issuance costs related to a recognized debt liability be presented in the balance sheet as a direct deduction from the carrying amount of that debt liability, consistent with debt discounts. This ASU is effective for interim and annual periods beginning after December 15, 2015, and early adoption is permitted. The Company has elected to adopt the provisions of this ASU as of December 31, 2014, on a retrospective basis. Adopting ASU 2015-03 resulted in reclassifying deferred financing costs from other assets to long-term debt in the Company’s consolidated balance sheet and did not have an effect on income from operations or net income.
In January 2015, the FASB issued ASU 2015-01, “Income Statement—Extraordinary and Unusual Items (Subtopic 225-20); Simplifying Income Statement Presentation by Eliminating the Concept of Extraordinary Items,” which eliminates from GAAP the concept of extraordinary items stating that the concept causes uncertainty because it is unclear when an item should be considered both unusual and infrequent and that users do not find the classification and presentation necessary to identify those events and transactions. This ASU is effective for fiscal years, and interim periods within those fiscal years, beginning after December 15, 2015, with early adoption permitted provided the
F-18
Table of Contents
PSAV HOLDINGS LLC
NOTES TO CONSOLIDATED FINANCIAL STATEMENTS (continued)
(In thousands except for share and per share amounts)
guidance is applied from the beginning of the fiscal year of adoption. The Company does not expect this standard to have an impact on its consolidated financial statements upon adoption.
In August 2014, the FASB issued ASU 2014-15, “Presentation of Financial Statements—Going Concern (Subtopic 205-40); Disclosure of Uncertainties about an Entity’s Ability to Continue as a Going Concern,” which requires management of a company to evaluate whether there is substantial doubt about the company’s ability to continue as a going concern. This ASU is effective for the annual reporting period ending after December 15, 2016, and for interim and annual reporting periods thereafter, with early adoption permitted. The Company does not expect this standard to have an impact on its consolidated financial statements upon adoption.
In May 2014, the FASB issued ASU No. 2014-09, “Revenue from Contracts with Customers.” Under ASU 2014-09, companies recognize revenue in a manner that depicts the transfer of promised goods or services to customers in an amount that reflects the consideration to which the entity expects to be entitled, in exchange for those goods or services. Additionally, the guidance requires improved disclosures to help users of financial statements better understand the nature, amount, timing and uncertainty of revenue that is recognized. In August 2015, the FASB approved an effective date for interim and annual periods beginning after December 15, 2017, and can be adopted using either the full retrospective method or a modified retrospective method. Early adoption is permitted in interim and annual periods beginning after December 15, 2016. The Company is in the process of evaluating the effect of the new guidance on its financial statements and disclosures.
5. Acquisition of AVSC Holding Corp.
On January 24, 2014, PSAV Acquisition Corp., a wholly owned subsidiary of the Company, acquired 100% of the outstanding common shares of AVSC Holding Corp. from AVSC Holding LLC (the “Seller”) pursuant to the Purchase Agreement. Subsequent to the Sponsors Acquisition, PSAV Acquisition Corp. was merged with and into AVSC Holding Corp., with AVSC Holding Corp. being the surviving entity.
The Sponsors Acquisition was financed by $269,438 of equity investments from the Sponsors. The Company also entered into debt agreements totaling $685,000. The proceeds were used to fund the total consideration paid, pay transaction fees associated with the Sponsors Acquisition and settle certain employee arrangements. The Company also repaid AVSC Holding Corp.’s outstanding debt of $492,094 on the Sponsors Acquisition date. The repayment of the debt has been included as a component of consideration transferred and is presented in “Acquisitions, net of cash acquired” in the Company’s consolidated statement of cash flows. Additionally, pursuant to the terms of the Purchase Agreement, the Company was required to redeem all of AVSC Holding Corp.’s outstanding Series A Preferred Stock using funds provided by PSAV Acquisition Corp.
Transaction costs of $17,751, $14,160 and $3,058 were expensed as incurred and included in acquisition-related expenses in the Company’s consolidated statement of operations in the Successor 2014 Period, Predecessor 2014 Period and year ended December 31, 2013, respectively.
The Company has accounted for the Sponsors Acquisition as a business combination in accordance with ASC Topic 805, whereby the purchase price paid to effect the Sponsors Acquisition
F-19
Table of Contents
PSAV HOLDINGS LLC
NOTES TO CONSOLIDATED FINANCIAL STATEMENTS (continued)
(In thousands except for share and per share amounts)
was allocated to record acquired assets and assumed liabilities at fair value as of the Sponsors Acquisition date. The fair value of the acquired assets and assumed liabilities was recognized in the Company’s consolidated financial statements as of the close of business on January 24, 2014.
The following table summarizes the fair value of the consideration transferred for the Sponsors Acquisition and the allocation of the aggregate purchase price to the fair values of assets acquired and liabilities assumed that were recognized in the Company’s consolidated financial statements at the Sponsors Acquisition date:
| Consideration: |
||||
| Cash paid at closing |
$ | 402,611 | ||
| Debt repaid at closing |
492,094 | |||
| Less cash acquired |
(17,103 | ) | ||
|
|
|
|||
| Total consideration |
$ | 877,602 | ||
|
|
|
|||
| Allocated Fair Value of Acquired Assets and Assumed Liabilities: |
||||
| Trade receivables |
$ | 82,962 | ||
| Other current assets |
13,865 | |||
| Property and equipment |
123,791 | |||
| Intangible assets: |
||||
| Trade name |
160,600 | |||
| Venue contracts |
318,700 | |||
| Customer relationships |
64,600 | |||
| Other assets |
1,853 | |||
| Current liabilities |
(96,757 | ) | ||
| Other liabilities |
(2,244 | ) | ||
| Deferred taxes, net |
(157,240 | ) | ||
|
|
|
|||
| Total identifiable net assets |
510,130 | |||
|
|
|
|||
| Goodwill |
367,472 | |||
|
|
|
|||
| Total net assets acquired |
$ | 877,602 | ||
|
|
|
The cash paid at closing includes $253,313 for the outstanding common shares of AVSC Holding Corp., $74,619 for the redemption of the outstanding Series A Preferred Stock of AVSC Holding Corp., $20,668 for the settlement of transaction costs incurred by the Seller, $1,114 for the settlement of employee arrangements and a reduction of $4,378 for a working capital adjustment.
The fair value of acquired receivables is $82,962, with a gross contractual amount of $84,303.
F-20
Table of Contents
PSAV HOLDINGS LLC
NOTES TO CONSOLIDATED FINANCIAL STATEMENTS (continued)
(In thousands except for share and per share amounts)
Goodwill resulting from the Sponsors Acquisition is primarily attributable to the assembled workforce and expected future growth, including future growth in the Company’s customer base and geographic expansion, not attributable to other identifiable intangibles. The goodwill is not deductible for tax purposes. Intangible assets related to the Sponsors Acquisition consisted of the following:
| Estimated Fair Value |
Amortization Period | |||||
| Intangible assets not subject to amortization: |
||||||
| Trade name |
$ | 160,600 | Indefinite | |||
| Intangible assets subject to amortization: |
||||||
| Venue contracts |
318,700 | 18.0 Years | ||||
| Customer relationships |
64,600 | 10.0 Years | ||||
|
|
|
|||||
| $ | 543,900 | |||||
|
|
|
|||||
The following unaudited combined pro forma results of operations for the Company assume that the Sponsors Acquisition occurred on January 1, 2013. This unaudited combined pro forma information should not be relied upon as necessarily being indicative of the historical results that would have been obtained if the Sponsors Acquisition had actually occurred on that date, nor the results that be obtained in the future.
| Years ended | ||||||||
| December 31, 2014 |
December 31, 2013 |
|||||||
| Revenues |
$ | 1,263,905 | $ | 1,096,374 | ||||
| Net income |
7,904 | (31,231 | ) | |||||
Pro forma adjustments for 2014 include the elimination of $31,911 of acquisition-related costs, comprised of $14,160 recognized in the Predecessor 2014 Period and $17,751 recognized in the Successor 2014 Period, incurred in connection with the Sponsors Acquisition. These costs would not have been incurred in 2014 had the transaction occurred on January 1, 2013.
Pro forma adjustments for the fiscal year 2013 include the addition of $17,751 of acquisition-related expenses that would have been incurred in 2013 had the transaction taken place on January 1, 2013.
6. Predecessor Acquisitions
Acquisition of Visual Aids Electronics Corp.
On November 7, 2013, the Company acquired 100% of the stock of Visual Aids Electronics Corp. (“VAE”). The purchase price was funded through cash on hand. The acquisition of VAE added to the Company’s portfolio of operating locations and greater service coverage for hotel partners and customers. VAE was headquartered in Germantown, Maryland, with operations in 24 U.S. states. The results of VAE have been included in the consolidated financial statements from the date of acquisition.
F-21
Table of Contents
PSAV HOLDINGS LLC
NOTES TO CONSOLIDATED FINANCIAL STATEMENTS (continued)
(In thousands except for share and per share amounts)
The following table summarizes the fair value of the consideration transferred for the acquisition of VAE and the allocation of the aggregate purchase price to the fair values of assets acquired and liabilities assumed that were recognized in the Company’s consolidated financial statements at the acquisition date:
| Consideration: |
||||
| Cash paid at closing |
$ | 42,559 | ||
| Less cash acquired |
(1,676 | ) | ||
|
|
|
|||
| Total consideration |
$ | 40,883 | ||
|
|
|
|||
| Allocated Fair Value of Acquired Assets and Assumed Liabilities: | ||||
| Trade receivables |
$ | 5,411 | ||
| Other current assets |
1,117 | |||
| Property and equipment |
1,614 | |||
| Intangible assets: |
||||
| Trade names |
3,700 | |||
| Venue contracts |
17,600 | |||
| Customer relationships |
7,600 | |||
| Accounts payable and accrued expenses |
(4,613 | ) | ||
| Deferred taxes |
(11,948 | ) | ||
|
|
|
|||
| Total identifiable net assets |
20,481 | |||
|
|
|
|||
| Goodwill |
20,402 | |||
|
|
|
|||
| Total net assets acquired |
$ | 40,883 | ||
|
|
|
The fair value of acquired receivables is $5,411, with a gross contractual amount of $5,437.
Transaction expenses of $258 were recorded in the year ended December 31, 2013 in conjunction with the acquisition of VAE.
The goodwill is primarily attributable to expected synergies and the assembled workforce. The goodwill is not deductible for tax purposes. Intangible assets related to the VAE acquisition consisted of the following:
| Estimated Fair Value |
Amortization Period | |||||
| Intangible assets subject to amortization: |
||||||
| Venue contracts |
$ | 17,600 | 15.0 years | |||
| Customer relationships |
7,600 | 15.0 years | ||||
| Trade name |
3,700 | 3.0 years | ||||
|
|
|
|||||
| Total intangible assets subject to amortization |
$ | 28,900 | ||||
|
|
|
|||||
The amortizable intangible assets reflected in the table above were determined by the Company to have finite lives and will be amortized on a straight line basis over the estimated useful lives. The useful life for the venue contracts and customer contracts intangible assets were based on the Company’s forecasts of venue contract renewals and customer turnover and thus approximates the
F-22
Table of Contents
PSAV HOLDINGS LLC
NOTES TO CONSOLIDATED FINANCIAL STATEMENTS (continued)
(In thousands except for share and per share amounts)
period of benefit of the intangible asset. The useful life for the trade name intangible asset was based on the Company’s estimate of the remaining useful economic life of the asset.
The Company’s revenues for 2013 included $6,241 from VAE. The impact since the acquisition date to net income for 2013 from VAE was not material. Additionally, the Company has determined that the pro forma impact of VAE to consolidated revenue and net income for the years ended December 31, 2013 and December 31, 2012 is not material.
Acquisition of Swank Holdings, Inc.
On November 9, 2012, the Company acquired 100% of the stock of Swank Holdings, Inc. (“Swank”). The acquisition was funded through cash on hand, a capital contribution from AVSC Holding LLC of $42,215, cash received from the issuance of AVSC Holding Corp. preferred units valued at $65,000, and two new credit agreements. Swank was a premier provider of audio visual services for meetings and events, with operations primarily in the United States. Swank was headquartered in St. Louis, Missouri. The results of Swank have been included in the Company’s consolidated financial statements from the date of the acquisition.
The following table summarizes the fair value of the consideration transferred for the acquisition of Swank and the allocation of the aggregate purchase price to the fair values of assets acquired and liabilities assumed that were recognized in the Company’s consolidated financial statements at the acquisition date:
| Consideration: |
||||
| Cash paid at closing |
$ | 277,973 | ||
| Less cash acquired |
(2,584 | ) | ||
|
|
|
|||
| Total consideration |
$ | 275,389 | ||
|
|
|
|||
| Allocated Fair Value of Acquired Assets and Assumed Liabilities: |
||||
| Trade receivables |
$ | 26,443 | ||
| Other current assets |
2,352 | |||
| Property and equipment |
27,771 | |||
| Intangible assets: |
||||
| Trade names |
13,400 | |||
| Venue contracts |
94,400 | |||
| Customer relationships |
15,000 | |||
| Accounts payable and accrued expenses |
(18,446 | ) | ||
| Deferred taxes |
(16,532 | ) | ||
|
|
|
|||
| Total identifiable net assets |
144,388 | |||
|
|
|
|||
| Goodwill |
131,001 | |||
|
|
|
|||
| Total net assets acquired |
$ | 275,389 | ||
|
|
|
The fair value of acquired receivables is $26,443, with a gross contractual amount of $26,688. Transaction expenses of $1,668 were recorded in the year ended December 31, 2012 in conjunction with the acquisition of Swank.
F-23
Table of Contents
PSAV HOLDINGS LLC
NOTES TO CONSOLIDATED FINANCIAL STATEMENTS (continued)
(In thousands except for share and per share amounts)
The goodwill is primarily attributable to expected synergies and the assembled workforce. The goodwill is not deductible for tax purposes. Intangible assets related to the Swank acquisition consisted of the following:
| Estimated Fair Value |
Amortization Period | |||||
| Intangible assets subject to amortization: |
||||||
| Venue contracts |
$ | 94,400 | 15.0 years | |||
| Customer relationships |
15,000 | 15.0 years | ||||
| Trade name |
13,400 | 3.0 years | ||||
|
|
|
|||||
| Total intangible assets subject to amortization |
$ | 122,800 | ||||
|
|
|
|||||
The amortizable intangible assets reflected in the table above were determined by the Company to have finite lives and will be amortized on a straight line basis over the estimated useful lives. The useful life for the venue contracts and customer relationships intangible assets based on the Company’s forecasts of venue contract renewals and customer turnover and thus approximates the period of benefit of the intangible asset. The useful life for the trade name intangible asset was based on the Company’s estimate of the remaining useful economic life of the asset.
The Company’s revenues and net income for 2012 included $19,144 and a loss of $(6,275), respectively, from Swank.
The following unaudited pro forma results of operations for the Company assume that the acquisition of Swank occurred on January 1, 2012. This unaudited pro forma information should not be relied upon as necessarily being indicative of the historical results that would have been obtained if the acquisition had actually occurred on that date, nor the results that will be obtained in the future.
| December 31, 2012 |
||||
| Revenues |
$ | 989,369 | ||
| Net income |
(3,959 | ) | ||
7. Goodwill and Intangible Assets
The following table presents the changes in goodwill by segment in the periods from January 1, 2013 through December 31, 2014:
| Domestic | International | Total | ||||||||||
| January 1, 2013 (Predecessor) |
$ | 211,041 | $ | — | $ | 211,041 | ||||||
| Acquisition of Visual Aids Electronics Corp. |
20,402 | — | 20,402 | |||||||||
|
|
|
|
|
|
|
|||||||
| December 31, 2013 and January 24, 2014 (Predecessor) |
$ | 231,443 | $ | — | $ | 231,443 | ||||||
|
|
|
|
|
|
|
|||||||
| January 25, 2014 (Successor) |
$ | — | $ | — | $ | — | ||||||
| Goodwill recognized as part of the Sponsors Acquisition |
359,173 | 8,299 | 367,472 | |||||||||
| Foreign currency translation adjustment |
— | (472 | ) | (472 | ) | |||||||
|
|
|
|
|
|
|
|||||||
| December 31, 2014 (Successor) |
$ | 359,173 | $ | 7,827 | $ | 367,000 | ||||||
|
|
|
|
|
|
|
|||||||
F-24
Table of Contents
PSAV HOLDINGS LLC
NOTES TO CONSOLIDATED FINANCIAL STATEMENTS (continued)
(In thousands except for share and per share amounts)
As a result of the Sponsors Acquisition, the carrying value of the Predecessor’s goodwill as of January 24, 2014 was eliminated and new goodwill was recorded by the Successor on January 25, 2014.
The following table presents the changes in intangible assets in the periods from January 1, 2013 through December 31, 2014:
| Venue Contracts |
Customer Relationships |
Trade Name |
Total | |||||||||||||
| Gross Value |
||||||||||||||||
| January 1, 2013 (Predecessor) |
$ | 158,338 | $ | 21,934 | $ | 57,600 | $ | 237,872 | ||||||||
| Acquisition of Visual Aids Electronics Corp. |
17,600 | 7,600 | 3,700 | 28,900 | ||||||||||||
|
|
|
|
|
|
|
|
|
|||||||||
| December 31, 2013 and January 24, 2014 (Predecessor) |
$ | 175,938 | $ | 29,534 | $ | 61,300 | $ | 266,772 | ||||||||
|
|
|
|
|
|
|
|
|
|||||||||
| January 25, 2014 (Successor) |
$ | — | $ | — | $ | — | $ | — | ||||||||
| Sponsors Acquisition |
318,700 | 64,600 | 160,600 | 543,900 | ||||||||||||
| Foreign currency translation adjustment |
(254 | ) | (134 | ) | (205 | ) | (593 | ) | ||||||||
|
|
|
|
|
|
|
|
|
|||||||||
| December 31, 2014 (Successor) |
$ | 318,446 | $ | 64,466 | $ | 160,395 | $ | 543,307 | ||||||||
|
|
|
|
|
|
|
|
|
|||||||||
| Accumulated Amortization |
||||||||||||||||
| January 1, 2013 (Predecessor) |
$ | (64,934 | ) | $ | (6,775 | ) | $ | (594 | ) | $ | (72,303 | ) | ||||
| Amortization |
(6,489 | ) | (1,287 | ) | (4,715 | ) | (12,491 | ) | ||||||||
|
|
|
|
|
|
|
|
|
|||||||||
| December 31, 2013 (Predecessor) |
(71,423 | ) | (8,062 | ) | (5,309 | ) | (84,794 | ) | ||||||||
| Amortization |
(483 | ) | (98 | ) | (369 | ) | (950 | ) | ||||||||
|
|
|
|
|
|
|
|
|
|||||||||
| January 24, 2014 (Predecessor) |
$ | (71,906 | ) | $ | (8,160 | ) | $ | (5,678 | ) | $ | (85,744 | ) | ||||
|
|
|
|
|
|
|
|
|
|||||||||
| January 25, 2014 (Successor) |
$ | — | $ | — | $ | — | $ | — | ||||||||
| Amortization |
(16,560 | ) | (6,046 | ) | — | (22,606 | ) | |||||||||
|
|
|
|
|
|
|
|
|
|||||||||
| December 31, 2014 (Successor) |
$ | (16,560 | ) | $ | (6,046 | ) | $ | — | $ | (22,606 | ) | |||||
|
|
|
|
|
|
|
|
|
|||||||||
| Net Value |
||||||||||||||||
| December 31, 2013 (Predecessor) |
$ | 104,515 | $ | 21,472 | $ | 55,991 | $ | 181,978 | ||||||||
| December 31, 2014 (Successor) |
301,886 | 58,420 | 160,395 | 520,701 | ||||||||||||
The Company performed a qualitative assessment for its goodwill and trade name balances as of October 1, 2013 and 2012 and concluded it was more likely than not that the fair value exceeded the carrying value.
In 2014, as the initial annual impairment assessment after the Sponsors Acquisition, the first step of the goodwill impairment analysis was performed by comparing the carrying value of the Company’s reporting units to their fair value determined by applying equal weight to the discounted cash flow method and the guideline public company method. The discounted cash flow method assumes the fair value is based on the present value of projected cash flows. The key estimates in this calculation are the growth forecast and discount rate. The guideline public company method uses multiples as seen in the market for publicly traded companies in a similar line of business. The key assumption in this calculation is the selection of the comparable public companies. The analyses did not indicate that goodwill was impaired, and accordingly the Company did not perform the second step of the goodwill impairment analysis.
F-25
Table of Contents
PSAV HOLDINGS LLC
NOTES TO CONSOLIDATED FINANCIAL STATEMENTS (continued)
(In thousands except for share and per share amounts)
Predecessor Intangible Assets
The Predecessor venue contracts and customer relationships were amortized on a straight-line basis over a useful life of 15 years. The Predecessor trade name had an indefinite life while the Swank and VAE trade names were amortized over a period of three years, which was the expected life of the trade name. The weighted-average amortization period at January 24, 2014 and December 31, 2013 were both 10.6 years.
Successor Intangible Assets
In connection with the Sponsors Acquisition, intangible assets were recorded at fair value as of the Sponsors Acquisition date. Venue contracts are amortized over a period of 18 years and Customer relationships are amortized over a period of 10 years. The PSAV trade name has an indefinite useful life. The weighted-average remaining amortization period for acquired intangible assets at December 31, 2014 is 16.7 years.
Future expected amortization expense relating to intangible assets is as follows for the years ending December 31:
| 2015 |
$ | 24,166 | ||
| 2016 |
24,166 | |||
| 2017 |
24,166 | |||
| 2018 |
24,166 | |||
| 2019 |
24,166 | |||
| Thereafter |
239,476 | |||
|
|
|
|||
| Total |
$ | 360,306 | ||
|
|
|
8. Property and Equipment
Property and equipment consisted of the following:
| Successor | Predecessor | |||||||
| December 31, 2014 |
December 31, 2013 |
|||||||
| Audiovisual rental and production equipment |
$ | 131,902 | $ | 206,588 | ||||
| Furniture and fixtures |
2,396 | 5,082 | ||||||
| Information systems and software |
18,157 | 31,796 | ||||||
| Leasehold improvements |
5,437 | 4,535 | ||||||
| Other |
573 | 885 | ||||||
|
|
|
|
|
|||||
| 158,465 | 248,886 | |||||||
| Less accumulated depreciation |
(48,787 | ) | (165,340 | ) | ||||
|
|
|
|
|
|||||
| Total Property and equipment, net |
$ | 109,678 | $ | 83,546 | ||||
|
|
|
|
|
|||||
The related depreciation expense for the Successor 2014 Period and the Predecessor 2014 Period and the years ended December 31, 2013 and 2012, was $49,344, $2,272, $35,011 and $25,103, respectively, of which $45,604, $1,932, $31,094 and $22,336, respectively, was included in cost of revenue.
F-26
Table of Contents
PSAV HOLDINGS LLC
NOTES TO CONSOLIDATED FINANCIAL STATEMENTS (continued)
(In thousands except for share and per share amounts)
9. Accrued Expenses
Accrued expenses consisted of the following:
| Successor | Predecessor | |||||||
| December 31, 2014 |
December 31, 2013 |
|||||||
| Accrued payroll-related expenses |
$ | 22,349 | $ | 19,542 | ||||
| Accrued bonus and sales commissions |
12,837 | 10,842 | ||||||
| Income taxes payable |
— | 1,872 | ||||||
| Accrued hotel commissions |
10,367 | 6,517 | ||||||
| Accrued interest payable |
6,103 | 2,062 | ||||||
| Worker’s compensation and casualty insurance reserves |
4,134 | 3,470 | ||||||
| Accrued other |
14,621 | 16,294 | ||||||
|
|
|
|
|
|||||
| Total Accrued expenses |
$ | 70,411 | $ | 60,599 | ||||
|
|
|
|
|
|||||
10. Other Current Assets
Other current assets consisted of the following:
| Successor | Predecessor | |||||||
| December 31, 2014 |
December 31, 2013 |
|||||||
| Income taxes receivable |
$ | 6,440 | $ | — | ||||
| Other current assets |
400 | 264 | ||||||
|
|
|
|
|
|||||
| Total Other current assets |
$ | 6,840 | $ | 264 | ||||
|
|
|
|
|
|||||
11. Long-Term Debt
The Company’s total outstanding indebtedness at December 31, 2014 and December 31, 2013, consisted of the following:
| Successor | Predecessor | |||||||
| December 31, 2014 |
December 31, 2013 |
|||||||
| Successor borrowing arrangements: |
||||||||
| First Lien Loan |
$ | 501,212 | $ | — | ||||
| Second Lien Loan |
180,000 | — | ||||||
| Revolving Facility |
10,000 | |||||||
| Predecessor borrowing arrangements: |
||||||||
| Predecessor First Lien Loan |
— | 335,750 | ||||||
| Predecessor Second Lien Loan |
— | 115,000 | ||||||
| Predecessor Revolving Facility |
— | 40,000 | ||||||
| Less: Unamortized loan discount |
(4,710 | ) | (20,386 | ) | ||||
| Less: Unamortized deferred financing costs |
(18,235 | ) | (1,522 | ) | ||||
|
|
|
|
|
|||||
| Total Debt |
668,267 | 468,842 | ||||||
| Less: Current portion |
(15,050 | ) | (3,400 | ) | ||||
|
|
|
|
|
|||||
| Total Long-term debt |
$ | 653,217 | $ | 465,442 | ||||
|
|
|
|
|
|||||
F-27
Table of Contents
PSAV HOLDINGS LLC
NOTES TO CONSOLIDATED FINANCIAL STATEMENTS (continued)
(In thousands except for share and per share amounts)
Successor Borrowing Arrangements
On January 24, 2014, the Company entered into (i) a First Lien Credit Agreement (the “First Lien Credit Agreement”) and (ii) a Second Lien Credit Agreement (the “Second Lien Credit Agreement,” and together with the First Lien Credit Agreement the “Credit Agreements”) with the lenders party thereto (the “Lenders”), including Barclay’s Bank PLC, as administrative and collateral agent, and Goldman Sachs Lending Partners LLC, Barclays Bank PLC, Macquarie Capital (USA) Inc. and Morgan Stanley Senior Funding, Inc., as joint bookrunners and joint lead arrangers, in connection with the Sponsors Acquisition. The Lenders also extended credit in the form of a revolving credit facility (the “Revolving Facility”) with aggregate commitments of $60,000 as part of the First Lien Credit Agreement.
Pursuant to the terms of the Credit Agreements, the Lenders provided us with term loan facilities in an aggregate principal amount of $685,000, consisting of a $505,000 first-lien term loan (“First Lien Loan”) and a $180,000 second-lien term loan (“Second Lien Loan”). Net proceeds from the First Lien Loan and the Second Lien Loan were $659,196 ($685,000 aggregate principal amount less $5,225 stated discount and $20,579 in debt transaction costs). The proceeds were used to finance the Sponsors Acquisition and to pay off the Predecessor Borrowing Arrangements.
First Lien Loan
The First Lien Loan bears interest at either, at the Company’s election, (a) the Alternate Base Rate plus 2.5% or (b) the Eurocurrency Rate plus 3.5%. The Alternate Base Rate is defined as the highest of (1) Federal Funds Effective Rate plus 0.5% (2) LIBOR plus 1% (3) Prime Rate (as defined in the First Lien Credit Agreement), or (4) 2%. The Eurocurrency Rate is defined as adjusted LIBOR (at a period of one, two, three, six or twelve months at the Company’s election) subject to a floor of 1%. Interest is due either monthly, for one month elections, every two months, for two month elections, or every three months for all other elections. The Company has elected the Eurocurrency Rate for all elections in the Successor 2014 Period resulting in a 4.5% interest rate. The maturity of the First Lien Loan is January 24, 2021.
Depending on the Senior Secured Leverage Ratio as defined in the First Lien Credit Agreement, the Company is required to make mandatory prepayments on the outstanding First Lien Loan in an aggregate principal amount equal to 50% of excess cash flow, as defined in the First Lien Credit Agreement, less any principal prepayments made for the year then ended and less any prepayment made pursuant to the Second Lien Credit Agreement, subject to certain other exceptions and deductions. The percentage is reduced to 25% of excess cash flow if the Senior Secured Leverage Ratio is less than or equal to 4.00 to 1.00, but greater than 3.25 to 1.00, and it is reduced to 0% if the Senior Secured Leverage Ratio is less than or equal to 3.25 to 1.00. Subject to certain exceptions and reinvestment rights, the First Lien Credit Agreement also requires 100% of the net cash proceeds from certain asset sales, insurance recoveries and debt issuances be used to pay down outstanding borrowings.
The Company must make mandatory quarterly principal payments on the First Lien Loan in an amount of $1,263. The Company made $3,788 of principal payments on the First Lien Loan during the 2014 Successor Period.
If the Company refinances any portion of the First Lien Loan with loans having reduced interest rates or reprice any portion of the First Lien Loan on or prior to November 18, 2015, subject to certain
F-28
Table of Contents
PSAV HOLDINGS LLC
NOTES TO CONSOLIDATED FINANCIAL STATEMENTS (continued)
(In thousands except for share and per share amounts)
exceptions, the Company is required to pay a premium equal to 1.00% of the aggregate amount of the First Lien Loan repaid or repriced.
Second Lien Loan
The Second Lien Loan bears interest at either, at the Company’s election, (a) the Alternate Base Rate plus 7.25% or (b) the Eurocurrency Rate plus 8.25%. The Alternate Base Rate is defined as the highest of (1) Federal Funds Effective Rate plus 0.5%, (2) LIBOR plus 1% (3) Prime Rate (as defined in the Second Lien Credit Agreement), or (4) 2%. The Eurocurrency Rate is defined as adjusted LIBOR (at a period of one, two, three, six or twelve months at the Company’s election) subject to a floor of 1%. Interest is due either monthly, for one month elections, every two months, for two month elections, or every three months for all other elections. The Company has elected the Eurocurrency Rate for all elections in the Successor 2014 Period resulting in a 9.25% interest rate. The maturity of the Second Lien Loan is January 24, 2022.
The mandatory prepayment requirements under the Second Lien Loan are substantially the same as under the First Lien Loan, except that no mandatory prepayment is required to be made under the Second Lien Loan until the First Lien Loan has been repaid in full, unless such amounts are declined by the Lenders under the First Lien Loan.
If the Company prepays or reprices any portion of the Second Lien Loan on or prior to January 24, 2017, the Company is required to pay a premium equal to: (i) 2.00% of the aggregate principal amount of the Second Lien Loan voluntarily prepaid or repriced after January 24, 2015 but before January 24, 2016 or (ii) 1.00% of the aggregate principal amount of the Second Lien Loan voluntarily prepaid or repriced after January 24, 2016 but before January 24, 2017.
The Company did not make any prepayments on the Second Lien Loan during the 2014 Successor Period.
Revolving Facility
The Revolving Facility, which had an initial maximum borrowing limit of $60,000, was established on January 24, 2014 pursuant to the terms included in the First Lien Credit Agreement. The Revolving Facility bears interest at either, at the Company’s election (a) the Alternate Base Rate plus 2.5% or (b) the Eurocurrency Rate plus 3.5%. The Alternate Base Rate is defined as the highest of (1) Federal Funds Effective Rate plus 0.5% or (2) Prime Rate (as defined in the First Lien Credit Agreement). The Eurocurrency Rate is defined as adjusted LIBOR (at a period of one, two, three, six or twelve months at the Company’s election) subject to a floor of 1%. The Company has elected the Alternate Base Rate for all elections in the Successor 2014 Period resulting in a 5.5% interest rate. The interest rate spread on the Revolving Facility is reduced if the Company meets certain leverage ratios. The Revolving Facility also includes an option to borrow funds under the terms of a swingline loan subfacility, subject to a sublimit of $10,000. The Company had $10,000 in borrowings under the Revolving Credit Facility as of December 31, 2014.
The Revolving Facility also includes capacity for $15,000 of letters of credit. As of December 31, 2014, the Company had issued letters of credit with an aggregate face value of $3,705. These letters of credit were issued to support the workers compensation and general and auto liability insurance programs.
F-29
Table of Contents
PSAV HOLDINGS LLC
NOTES TO CONSOLIDATED FINANCIAL STATEMENTS (continued)
(In thousands except for share and per share amounts)
As of December 31, 2014, there was $46,295 available for borrowing on the Revolving Facility, which matures on January 24, 2019.
The Revolving Facility is subject to a commitment fee that varies based on the Company’s Senior Secured Leverage Ratio, as defined in the First Lien Credit Agreement, of which the Company paid $278 during the period ended December 31, 2014.
Financial Covenants and Terms
The Senior Secured Leverage Ratio may not exceed 6.75 to 1.00 if more than 25% of Revolving Facility is utilized. The Company utilized less than 25% of the Revolving Credit Facility as of December 31, 2014. The Senior Secured Leverage Ratio is calculated as Consolidated Senior Secured Debt to Consolidated Adjusted EBITDA, as each term is defined in the First Lien Credit Agreement, for the trailing 12 months. The Company utilized less than 25% of the Revolving Credit Facility as of December 31, 2014.
Obligations under the Credit Agreements are secured by a first and second lien, respectively, on substantially all of the Company’s assets, including the capital stock of the Company’s subsidiaries, subject to customary exceptions and carve outs.
The Credit Agreements contain customary affirmative and negative covenants, including limitations on the Company’s ability to incur indebtedness, create liens, dispose of assets, make restricted payments and make investments or acquisitions, among other things. Events of default under the Credit Agreements include, among other things, failure to make applicable principal or interest payments when they are due, breach of certain covenants and representations or change in control. At the occurrence of such an event, the administrative agent, at the request of the Lenders, may terminate the commitments and declare the outstanding principal and accrued interest thereon and all fees and other obligations to be due and payable and exercise other rights and remedies provided for in the Credit Agreements.
The Company is not currently in default of any of its loan provisions under the First and Second Lien Credit Agreements.
Predecessor Borrowing Arrangements
In November 2012, the Company entered into two credit agreements with Barclays Bank PLC, as part of the Swank acquisition that occurred on November 9, 2012. The agreements consist of a $340,000 First Lien Term Loan Facility (the “Predecessor First Lien Loan”), a $115,000 Second Lien Term Loan Facility (the “Predecessor Second Lien Loan”), and a $40,000 Revolving Credit Facility (the “Predecessor Revolving Facility” and collectively with the Predecessor First Lien Loan and the Predecessor Second Lien Loan, the “Predecessor Borrowing Arrangements”). The Company paid closing costs totaling $28,392 associated with this financing, which included a debt discount of $24,442. This financing was treated as a debt modification, resulting in $4,071 of the closing costs recorded to expense in 2012. This financing was used in part to pay off existing debt. The Company had pledged substantially all of its assets as collateral for the facilities. The agreements contained restrictive covenants providing for quarterly and annual measures of financial condition and also limited the payment of dividends, permitted acquisitions financed by the agreement, the sale of certain assets
F-30
Table of Contents
PSAV HOLDINGS LLC
NOTES TO CONSOLIDATED FINANCIAL STATEMENTS (continued)
(In thousands except for share and per share amounts)
and other loans, advances and indebtedness. The agreements also contained maximum leverage and interest coverage ratio covenants, which became effective for the first quarter of 2013. The Company was in compliance with all applicable financial covenants through the date the Predecessor Borrowing Arrangements were extinguished.
In connection with the Sponsors Acquisition, all outstanding obligations under the Predecessor Borrowing Arrangements were extinguished and replaced with the Successor Borrowing Arrangements.
Predecessor First Lien Loan
The Predecessor First Lien Loan dated November 9, 2012 was scheduled to mature in November 2018. Amounts borrowed under the Predecessor First Lien Loan bore interest at an annual rate equal to, at the Company’s option, LIBOR plus 5.5% with a LIBOR floor of 1.25% or the Base Rate plus 4.5% with a 2.25% Base Rate floor. At December 31, 2013 and 2012, the effective interest rate on the Predecessor First Lien Term Loan was 7.75%. Interest was paid in arrears for each rate maturity period elected. Principal repayments in $850 quarterly installments were due commencing December 31, 2012.
Predecessor Second Lien Loan
The Predecessor Second Lien Loan dated November 9, 2012 was scheduled to mature in May 2018. Amounts borrowed under the Predecessor Second Lien Loan bore interest at an annual rate equal to, at the Company’s option, LIBOR plus 9.5% with a 1.25% LIBOR floor or the Base Rate plus 8.5% with a 2.25% Base Rate floor. At December 31, 2013 and 2012, the effective interest rate on the Predecessor Second Lien Loan was 10.75%. Interest was paid in arrears for each rate maturity period elected. No principal repayments were required prior to maturity.
Predecessor Revolving Facility
The Predecessor Revolving Facility dated November 9, 2012 was scheduled to mature in November 2017. There were $40,000 and $0 of outstanding borrowings on the Predecessor Revolving Facility at December 31, 2013 and 2012, respectively. At December 31, 2013 and 2012, the effective interest rate on the Predecessor Revolving Facility was 5.67% and 7.75%, respectively. Interest was paid in arrears for each rate maturity period elected. The Company was subject to a commitment fee of 0.50% per annum on the average daily amount of the available revolving commitment during the period.
F-31
Table of Contents
PSAV HOLDINGS LLC
NOTES TO CONSOLIDATED FINANCIAL STATEMENTS (continued)
(In thousands except for share and per share amounts)
Maturities of Long-Term Debt
Annual maturities of debt outstanding at December 31, 2014, are as follows:
| 2015 |
$ | 5,050 | ||
| 2016 |
5,050 | |||
| 2017 |
5,050 | |||
| 2018 |
5,050 | |||
| 2019 |
5,050 | |||
| Thereafter |
665,962 | |||
|
|
|
|||
| $ | 691,212 | |||
|
|
|
Debt maturities of $665,962 for annual periods after 2019 include $10,000 of borrowings due under the Revolving Facility. The Company borrowed $10,000 under the Revolving Facility in December 2014 and repaid the $10,000 in January 2015 with cash on hand. Accordingly, the $10,000 of borrowings under the Revolving Facility is presented in the current portion of long-term debt in the Company’s consolidated balance sheet at December 31, 2014. This table does not reflect future excess cash flow prepayments, if any, that may be required under the Credit Agreements.
12. Interest Rate Derivatives
The Company is subject to market risks from fluctuation in interest rates on their variable-rate term loan borrowings. The Company’s risk management philosophy is to limit its exposure to rising interest rates and minimize the negative impact on its earnings and cash flows.
In May 2014, the Company entered into two deferred premium interest rate cap agreements (“Cap Agreements”) that were effective in July 2014, each with a notional amount of $171,250 and related option premium of $1,750 each. The option premium is being paid quarterly over the term of the Cap Agreements. Each Cap Agreement is a series of 15 individual caplets that reset and settle quarterly over the period from October 2014 to April 2018.
The Cap Agreements limit the Company’s cash flow exposure to an increase in the USD-LIBOR three month rate above 3% over the next 3.75 years. ASC Topic 815 requires recognition of all derivative instruments as either assets or liabilities at fair value in the statement of financial position. See Note 13 for the fair value measurement disclosures. The Company adjusts the value of the derivatives to market each period and records the related gains or losses in income.
The fair value of the interest rate caps, which are not designated as hedging instruments in accordance with ASC Topic 815, of $(1,664) are included in other liabilities in the consolidated balance sheet as of December 31, 2014. Losses on the interest rate caps of $(1,817) are included in other expense, net in the consolidated statement of operations for the 2014 Successor Period.
F-32
Table of Contents
PSAV HOLDINGS LLC
NOTES TO CONSOLIDATED FINANCIAL STATEMENTS (continued)
(In thousands except for share and per share amounts)
13. Fair Value Measurements
Fair value is defined under ASC Topic 820, Fair Value Measurement, as the price that would be received to sell an asset or paid to transfer a liability in the principal or most advantageous market in an orderly transaction between market participants on the measurement date. ASC Topic 820 also establishes a three-level hierarchy, which requires an entity to maximize the use of observable inputs and minimize the use of unobservable inputs when measuring fair value. The valuation hierarchy is based upon the transparency of inputs to the valuation of an asset or liability on the measurement date. The three levels are defined as follows:
| • | Level 1—Inputs to the valuation methodology are quoted prices (unadjusted) for an identical asset or liability in an active market. |
| • | Level 2—Inputs to the valuation methodology include quoted prices for a similar asset or liability in an active market or model-derived valuations in which all significant inputs are observable for substantially the full term of the asset or liability. |
| • | Level 3—Inputs to the valuation methodology are unobservable and significant to the fair value measurement of the asset or liability. |
The following table presents financial assets and liabilities measured at fair value on a recurring basis as of December 31, 2014 and 2013, by the ASC Topic 820 valuation hierarchy.
| December 31, 2014 (Successor) | ||||||||||||||||
| Level 1 | Level 2 | Level 3 | Total Fair Value |
|||||||||||||
| Cash and cash equivalents |
$ | 68,818 | $ | — | $ | — | $ | 68,818 | ||||||||
| Interest rate cap agreements |
— | (1,664 | ) | — | (1,664 | ) | ||||||||||
| December 31, 2013 (Predecessor) | ||||||||||||||||
| Level 1 | Level 2 | Level 3 | Total Fair Value |
|||||||||||||
| Cash and cash equivalents |
$ | 23,733 | $ | — | $ | — | $ | 23,733 | ||||||||
Cash and Cash Equivalents
Cash equivalents primarily consist of highly rated money market funds with overnight liquidity and no stated maturities. The Company classified cash equivalents as Level 1 due to the short-term nature of these instruments and measured the fair value based on quoted prices in active markets for identical assets.
Interest Rate Cap
The estimated fair value of the Company’s interest rate caps are determined using broker quotes that are based on widely accepted valuation techniques, including discounted cash flow analysis on the expected cash flows of each derivative contract. This analysis reflects the contractual terms of the instrument, including the period to maturity, and uses observable market-based inputs, including interest rate curves and implied volatilities. These inputs fall within Level 2 of the fair value hierarchy.
F-33
Table of Contents
PSAV HOLDINGS LLC
NOTES TO CONSOLIDATED FINANCIAL STATEMENTS (continued)
(In thousands except for share and per share amounts)
Long-Term Debt
Estimated fair values and carrying amounts of the Company’s financial instruments that are not measured at fair value on a recurring basis as of December 31, 2014 and December 31, 2013 are as follows:
| Fair Value |
Carrying Amount |
|||||||
| December 31, 2014 |
||||||||
| Successor Borrowing Arrangements: |
||||||||
| First Lien Loan |
$ | 498,080 | $ | 486,743 | ||||
| Second Lien Loan |
178,875 | 172,749 | ||||||
| Revolving Facility |
9,938 | 8,775 | ||||||
| December 31, 2013 |
||||||||
| Predecessor Borrowing Arrangements: |
||||||||
| Predecessor First Lien Loan |
$ | 336,589 | $ | 319,524 | ||||
| Predecessor Second Lien Loan |
116,725 | 109,442 | ||||||
| Predecessor Revolving Facility |
40,100 | 39,876 | ||||||
The fair value of the outstanding principal balance of the Company’s Successor and Predecessor borrowing arrangements at December 31, 2014 and December 31, 2013 are based on pricing from observable market information in a non-active market and would be classified in Level 2 of the fair value hierarchy.
The carrying amounts in the above table are net of the unamortized loan discount and the unamortized deferred financing costs.
14. Members’ Equity
The PSAV Holdings LLC operating agreement (the “Operating Agreement”) provides for classes of membership units, the allocation of profits and losses to each member class, distribution preferences and other member rights.
Allocation of Profits and Losses
Pursuant to the Operating Agreement, net income or net loss shall be allocated among the members (Class A Units and Class B Units) in a manner such that the capital account of each member, immediately after making such allocation, is, as nearly as possible, equal (proportionately) to (a) the distributions that would be made to such member if the Company were dissolved, its affairs wound up and its assets sold for cash equal to their gross asset carrying values, all liabilities of the Company were satisfied and the net assets of the Company were distributed to the members immediately after making such allocations, minus (b) such member’s share of Company nonrecourse debt minimum gains, computed immediately prior to the hypothetical sale of the assets.
Net income or net loss allocated to any member cannot exceed the maximum amount that can be allocated without causing the member to have a capital account deficit, unless each of the members would have a capital account deficit. Net loss in excess of this limitation is allocated first to members who do not have an capital account deficit pro rata in proportion to their capital account balances until
F-34
Table of Contents
PSAV HOLDINGS LLC
NOTES TO CONSOLIDATED FINANCIAL STATEMENTS (continued)
(In thousands except for share and per share amounts)
no member would be entitled to any further allocation, and then to the members in a manner determined in good faith by the Company’s Board of Directors taking into account the relative economic interests of the members.
Accordingly, to the extent there is a net loss reported in a period, it will first be allocated to the Class A Units because those are the only unit holders that have a contributed capital balance. Net income will be allocated to both Class A and Class B Units once there is net income reported in excess of net losses on a cumulative basis. During the Successor 2014 Period, the Company incurred a net loss of $10,566 which was allocated entirely to the Class A Units since only the Class A Units had positive capital accounts.
Distributions
The Operating Agreement provides that any distributions, other than tax distributions, will be made according to the following priority:
| a) | first, to the members holding Class A Units, pro rata among such members in proportion to their unreturned capital contributions with respect to such Class A Units, until the amount of their unreturned capital contributions with respect to such Class A Units has been reduced to zero; |
| b) | second, to the members holding vested Class B Units, until such members have received, with respect to each such vested Class B Unit, a cumulative amount equal to the cumulative amount distributed, after the date such vested Class B Unit was originally issued, with respect to a Class A Unit (excluding, with respect to a vested Class B Unit that has a distribution threshold greater than $0, distributions received with respect to such Class A Unit prior to the time that the aggregate amount of distributions to all Units outstanding on the date of issuance of such vested Class B Unit is equal to the distribution threshold with respect to such vested Class B Unit), pro rata in proportion to the amounts that would need to be distributed to each such member with respect to such vested Class B Units immediately prior to the distribution; and |
| c) | Thereafter, to the members holding Class A Units and vested Class B Units, pro rata in proportion to the number of such units held by them. |
| d) | Notwithstanding the foregoing, no holder of a vested Class B Unit shall be entitled to receive any distributions (other than tax distributions, to the extent applicable) until distributions have been made to holders of units that were outstanding at the time of the issuance of such Class B Unit after the issuance of such Class B Unit (on a cumulative basis), and then such holder of a vested Class B Unit shall be entitled to receive with respect to such vested Class B Unit only distributions made after such time and priority (i.e., only in excess of such distribution threshold). |
15. Equity-Based Compensation
Successor Equity-Based Compensation Plans
On January 24, 2014, in connection with the Sponsors Acquisition, the Company established two equity-based compensation plans: the PSAV Holdings LLC 2014 Management Incentive Plan and the PSAV Holdings LLC Phantom Unit Appreciation Plan. These plans provide management and employees of the Company with an incentive to contribute to and participate in the success of the Company. A total of 29,938 units are reserved for issuance under these plans.
F-35
Table of Contents
PSAV HOLDINGS LLC
NOTES TO CONSOLIDATED FINANCIAL STATEMENTS (continued)
(In thousands except for share and per share amounts)
Profits Interests
The Company is authorized to issue profits interests in the form of Class B Units to employees, officers, managers and directors of the Company, under the PSAV Holdings LLC 2014 Management Incentive Plan. The Company has issued Service Units and Performance Units under this plan. The Company has determined that the Class B Units are a substantive class of members’ equity for accounting purposes because the Class B Units are legal equity of PSAV Holdings LLC, they have participation features, including distribution and liquidation rights which allow them to participate in the residual returns of the LLC, and vested interests are retained upon termination. As a result, these awards are accounted for under ASC Topic 718, Compensation—Stock Compensation.
Service Units
The Service Units generally vest ratably over a five-year period. Vested Service Units will participate in distributions in excess of an underlying benchmark value (“Distribution Threshold”) determined on the issue date. As of December 31, 2014 there were 8,185.5 Service Units outstanding. The Company is recognizing expense related to the Class B Service Units on a straight line basis over the requisite service period of five years from the grant date. The Company recognized compensation expense of $299 in the Successor 2014 period, and is included in selling, general and administrative expenses.
Performance Units
The Performance Units will vest based on an equity distribution event exceeding certain threshold amounts to equity holders (“Distribution Event”) and the achievement of a targeted multiple of invested capital. Vested Performance Units will participate in distributions above the Distribution Threshold determined on the issue date. As of December 31, 2014 there were 7,185.5 Performance Units outstanding. Unvested units are forfeited upon termination, subject to certain conditions. As of December 31, 2014, the Company has determined that the Distribution Event is not probable of being satisfied. No compensation cost has been recognized related to the Performance Units in the Successor 2014 Period.
The following table summarizes the Service and Performance Units activity during the Successor 2014 Period:
| Service Units | Performance Units |
|||||||||||
| Units | Weighted-average grant date fair value per unit |
Units | ||||||||||
| Non-vested at January 25, 2014 |
— | $ | — | — | ||||||||
| Granted |
8,185.5 | 212 | 7,185.5 | |||||||||
| Vested |
— | — | — | |||||||||
| Forfeited / canceled |
— | — | — | |||||||||
|
|
|
|
|
|
|
|||||||
| Non-vested at December 31, 2014 |
8,185.5 | $ | 212 | 7,185.5 | ||||||||
|
|
|
|
|
|
|
|||||||
F-36
Table of Contents
PSAV HOLDINGS LLC
NOTES TO CONSOLIDATED FINANCIAL STATEMENTS (continued)
(In thousands except for share and per share amounts)
The grant date fair value was determined using the Black-Scholes option pricing model. Significant assumptions used in the determination include:
| Expected term |
5 years | |||
| Expected volatility |
45% | |||
| Risk-free interest rate |
1.6% | |||
| Dividend yield |
0% |
The Class B Units do not have a contractual term and rather represent economic interests in a privately held company without an active market for its equity which will benefit from a liquidation event. The expected term is based on the typical period private equity firms hold their investments.
Because the Company was unable to calculate specific stock price volatility as a private company, the Company considered (a) the historical volatility of comparable, publicly traded companies share prices; (b) implied volatility of comparable, publicly traded companies share prices determined from the longest dated publicly traded call options; and (c) relevered volatilities that adjust the public companies levered volatilities to be more consistent with the expected leverage of the Company over the expected term.
As of December 31, 2014, total unrecognized compensation expense related to non-vested Service Units was $1,330, which is expected to be recognized over a weighted-average period of 4.1 years.
Phantom Units
The Company is authorized to issue Phantom Units under the PSAV Holdings LLC Phantom Unit Appreciation Plan. PSAV Holdings LLC has issued Phantom Service Units and Phantom Performance Units under this plan. The Phantom Service Units provide the holder the right to receive a cash payment from the Company equal to the distribution paid to the holder of Service Unit with the same Distribution Threshold. Similarly, the Phantom Performance Units provide the holder the right to receive a cash payment from the Company equal to the distribution paid to the holder of Performance Unit with the same Distribution Threshold. Phantom Units are forfeited by the holder upon termination from the Company. The Phantom Units act as an incentive for holders that are employed as of a distribution date. The Company is accounting for the Phantom Units as a contingent bonus; therefore, the Phantom Units are not within the scope of ASC Topic 718. Accordingly, related expense will be recognized only when payments become probable to Phantom Unit holders. As of December 31, 2014, the Company has determined that a distribution event is not probable of being satisfied. There were 4,939.0 Phantom Service Units and 4,939.0 Phantom Performance Units outstanding at December 31, 2014.
Predecessor Equity-Based Compensation Plans
In connection with a merger transaction that occurred on February 28, 2007, AVSC Holding Corp. issued 56 options which were valued at $2,100. These options were subsequently exercised in August 2012 through a cashless exchange for 41 units in AVSC Holding Corp. They were then converted in November 2012 to units in AVSC Holding LLC. There was no stock option activity or compensation expense in 2013 or 2012.
F-37
Table of Contents
PSAV HOLDINGS LLC
NOTES TO CONSOLIDATED FINANCIAL STATEMENTS (continued)
(In thousands except for share and per share amounts)
In 2007, AVSC Holding LLC, the parent entity of the Predecessor, initiated two share-based plans for key management employees of the Predecessor and its subsidiaries: Override Units and Phantom Units. Payment of benefits under these plans was contingent on a distribution event, which included the sale of AVSC Holding Corp. This was deemed to be a performance condition and no expense was recognized until the distribution event was deemed probable, which occurred immediately prior to the Sponsors Acquisition in the Predecessor 2014 Period.
The Predecessor accounted for share-based awards granted to its employees by its parent as a capital contribution from its parent, and recognized related compensation costs in its consolidated statements of operations.
Predecessor Override Units
Predecessor override units consisted of four types of units (Operating, Value A, Value B and Value C) that could participate in future company distributions subject to financial terms and conditions for each respective type of override unit. All of these units would participate in distributions under specific conditions based on an underlying benchmark value determined as of the issue date. Override units were fully vested when issued, and distributions would be settled in cash. There were 590.339 and 723.744 units issued and outstanding as of December 31, 2013 and 2012, respectively. On January 24, 2014, the holders of 160.531 Operating Units and 122 Value C Units received distributions in connection with the Sponsors Acquisition pursuant to the original terms of the awards. Stock compensation expense of $5,365 was recorded in the Predecessor 2014 Period in selling, general, and administrative expenses in the consolidated statement of operations. Pursuant to their terms and based on the total amount of distributions, the Value A and Value B Units did not participate in any distributions.
Predecessor Phantom Units
Predecessor phantom units consisted of four types of units (Operating, Value A, Value B and Value C) that could participate in future company distributions subject to financial terms and conditions for each respective type of phantom unit. All of these units would participate in distributions under similar conditions as the Predecessor common units with an underlying benchmark value equal to common unit values as of the issue date. Phantom units were fully vested when issued; distributions would be settled in cash and were to expire in 2017. There were 222.936 and 267.480 units issued and outstanding as of December 31, 2013 and 2012. On January 24, 2014, the holders of 25.984 Operating Phantom Units received distributions in connection with the Sponsors Acquisition. Stock compensation expense of $1,063 was recorded in the Predecessor 2014 Period in selling, general, and administrative expenses in the consolidated statement of operations. Pursuant to their terms and based on the total amount of distributions, the Value A, Value B and Value C Phantom Units did not participate in any distributions.
16. Predecessor Preferred Stock
In connection with the acquisition of Swank in November 2012, AVSC Holding Corp. issued 65,000 shares of Series A preferred stock for an initial cash payment of $61,050, net of issuance costs of $3,950. Preferred stockholders were entitled to a payment-in-kind dividend of 12% for the first and second years, 15% for the third year, 17% for the fourth year, and 20% thereafter, payable in
F-38
Table of Contents
PSAV HOLDINGS LLC
NOTES TO CONSOLIDATED FINANCIAL STATEMENTS (continued)
(In thousands except for share and per share amounts)
preference to common stock dividends. There were 74,044 and 65,000 shares of Series A preferred stock issued and outstanding at December 31, 2013 and 2012, respectively. Cumulative dividends in arrears totaled $9,044 and $0 at December 31, 2013 and 2012, respectively. Holders of the Series A Preferred Stock had no voting rights, and the Series A Preferred Stock contained a provision to prohibit additional indebtedness unless certain leverage ratios are achieved.
In the event of a change of control or the sale or transfer of all or substantially all of the assets of the Company occurred, the Series A Preferred Stockholders were entitled to receive an amount equal to 100% of the $1 liquidation preference per share (adjusted for any subdivisions, combinations, or similar events), plus any accrued and unpaid dividends and dividends paid-in-kind, all payable in cash. The Predecessor Series A Preferred Stock was redeemed in connection with the Sponsors Acquisition.
17. Employee Benefit Plans
Defined Contribution Plan
The Company maintains a defined-contribution plan covering all qualified employees. The Company matched 25% of the first 6% of 401(k) contributions that were contributed by an employee during 2014 and 2013. During 2012, the Company matched 25% of the first 4% of 401(k) contributions that were contributed by an employee. Company-matching contributions during the Successor 2014 Period and the Predecessor 2014 Period and the years ended December 31, 2013 and 2012, were $1,914, $159, $1,067 and $625, respectively.
Multi-employer Pension Plans
The Company contributes to multi-employer pension plans that cover its union employees. Contributions to the plans are based on a percentage of applicable wages. Total contributions to the plans correspond to the number of union employees employed at any given time and vary depending on the location and number of ongoing events at a given time and the need for union resources in connection with such events. The risks of participating in a multi-employer plan are different from single-employer plans in the following aspects:
| • | Assets contributed to the multi-employer plan by one employer may be used to provide benefits to employees of other participating employers. |
| • | If a participating employer stops contributing to the plan, the unfunded obligation of the plan may be borne by the remaining participating employers. |
| • | If the Company chose to stop participating in a multi-employer plan, the Company may be required to pay the plan an amount based on the underfunded status of the plan, referred to as a withdrawal liability. |
The following table provides certain information for individually significant multi-employer plans that the Company participates in. The “EIN/Pension Plan Number” column provides the Employer Identification Number (EIN) and the three-digit plan number. The Pension Protection Act (PPA) zone status is for the most recently available plan’s year-end. The zone status is based on information that the Company received from the plan. Among other factors, plans in the red zone are generally less than 65% funded, plans in the yellow zone are less than 80% funded, and plans in the green zone are at least 80%
F-39
Table of Contents
PSAV HOLDINGS LLC
NOTES TO CONSOLIDATED FINANCIAL STATEMENTS (continued)
(In thousands except for share and per share amounts)
funded. The “FIP/RP Status Pending/Implemented” column indicates plans for which a financial improvement plan (FIP) or a rehabilitation plan (RP) is either pending or has been implemented. The last column lists the expiration date of the collective-bargaining agreement to which the plan is subject. The Company’s contributions to the Chicago Moving Pictures Operators Union Local 110 of the IATSE & MPMO Severance Trust and the St. Louis Motion Picture Operators Pension Fund exceeded 5% of total contributions to the plan as indicated in the plan’s most recently available annual report.
| Plan |
Plan’s Employer Identification Number |
Pension Protected Act Certified Zone Status |
Plan year-end | FIP/RP Status Pending/ Implemented |
Surcharge Imposed |
Expiration Date of Collective Bargaining Agreement |
||||||||||||
| New York Hotel Trades Council and Hotel Association of New York City, Inc. Pension Fund |
13-1531223 | Green | 7/31/2014 | N/A | N/A | 6/30/2019 | ||||||||||||
| Chicago Moving Pictures Operators Union Local 110 of the IATSE & MPMO Severance Trust |
36-6487635 | Yellow | 8/31/2013 | Implemented | No | 8/31/2016 | ||||||||||||
| IATSE Local 16 Pension Plan |
94-6296420 | Red | 12/31/2013 | Implemented | 5% | 6/30/2018 | ||||||||||||
| San Diego Theatrical Pension Plan |
95-6336895 | Green | 9/30/2012 | N/A | N/A | 5/14/2016 | ||||||||||||
| Predecessor | ||||||||||||||||
| Plan |
2012 Contributions |
2013 Contributions |
Predecessor 2014 Period Contributions |
Successor 2014 Period Contributions |
||||||||||||
| New York Hotel Trades Council and Hotel Association of New York City, Inc. Pension Fund |
$ | 659 | $ | 753 | $ | 65 | $ | 869 | ||||||||
| Chicago Moving Pictures Operators Union Local 110 of the IATSE & MPMO Severance Trust |
448 | 865 | 7 | 736 | ||||||||||||
| IATSE Local 16 Pension Plan |
N/A | 206 | 2 | 279 | ||||||||||||
| San Diego Theatrical Pension Plan |
N/A | 538 | 9 | 549 | ||||||||||||
F-40
Table of Contents
PSAV HOLDINGS LLC
NOTES TO CONSOLIDATED FINANCIAL STATEMENTS (continued)
(In thousands except for share and per share amounts)
18. Income Taxes
Significant components of the provision (benefit) for income taxes are as follows:
| Successor | Predecessor | |||||||||||||||
| January 25, through December 31, 2014 |
January 1, through January 24, 2014 |
|||||||||||||||
| Year ended December 31, | ||||||||||||||||
| 2013 | 2012 | |||||||||||||||
| Pretax income (loss): |
||||||||||||||||
| Domestic |
$ | (8,698 | ) | $ | (36,993 | ) | $ | 8,466 | $ | (3,640 | ) | |||||
| Foreign |
(1,975 | ) | 569 | 6,110 | 3,444 | |||||||||||
|
|
|
|
|
|
|
|
|
|||||||||
| Total pretax income (loss) |
$ | (10,673 | ) | $ | (36,424 | ) | $ | 14,576 | $ | (196 | ) | |||||
|
|
|
|
|
|
|
|
|
|||||||||
| Current tax (benefit) provision: |
||||||||||||||||
| Federal and state |
$ | 3,137 | $ | — | $ | (73 | ) | $ | 53 | |||||||
| Foreign |
458 | 64 | 1,442 | 1,895 | ||||||||||||
|
|
|
|
|
|
|
|
|
|||||||||
| Total current tax provision |
$ | 3,595 | $ | 64 | $ | 1,369 | $ | 1,948 | ||||||||
|
|
|
|
|
|
|
|
|
|||||||||
| Deferred tax (benefit) provision: |
||||||||||||||||
| Federal and state |
$ | (3,750 | ) | $ | (10,468 | ) | $ | (4,986 | ) | $ | (11,397 | ) | ||||
| Foreign |
48 | (99 | ) | 597 | (450 | ) | ||||||||||
|
|
|
|
|
|
|
|
|
|||||||||
| Total deferred tax benefit |
$ | (3,702 | ) | $ | (10,567 | ) | $ | (4,389 | ) | $ | (11,847 | ) | ||||
|
|
|
|
|
|
|
|
|
|||||||||
| Total income tax benefit |
$ | (107 | ) | $ | (10,503 | ) | $ | (3,020 | ) | $ | (9,899 | ) | ||||
|
|
|
|
|
|
|
|
|
|||||||||
The reconciliation of income taxes attributable to operations computed at the 35% U.S. federal statutory tax rate to income tax (benefit) expense is as follows:
| Successor | Predecessor | |||||||||||||||
| January 25, through December 31, 2014 |
January 1, through January 24, 2014 |
|||||||||||||||
| Year ended December 31, | ||||||||||||||||
| 2013 | 2012 | |||||||||||||||
| Rate reconciliation: |
||||||||||||||||
| Pretax book income (loss) |
$ | (10,673 | ) | $ | (36,424 | ) | $ | 14,576 | $ | (196 | ) | |||||
|
|
|
|
|
|
|
|
|
|||||||||
| Federal income tax (benefit) provision at U.S. statutory rate |
$ | (3,735 | ) | $ | (12,748 | ) | $ | 5,101 | $ | (68 | ) | |||||
| Nondeductible expenses |
2,506 | 3,317 | 2,321 | 1,618 | ||||||||||||
| Foreign rate differential |
389 | (147 | ) | (457 | ) | (199 | ) | |||||||||
| State expense |
(63 | ) | (1,027 | ) | 433 | (236 | ) | |||||||||
| FIN 48 reserve |
23 | — | 53 | 52 | ||||||||||||
| Valuation allowance |
866 | (38 | ) | (10,493 | ) | (11,064 | ) | |||||||||
| Other |
(93 | ) | 140 | 22 | (2 | ) | ||||||||||
|
|
|
|
|
|
|
|
|
|||||||||
| Total income tax expense (benefit) |
$ | (107 | ) | $ | (10,503 | ) | $ | (3,020 | ) | $ | (9,899 | ) | ||||
|
|
|
|
|
|
|
|
|
|||||||||
| Effective tax rate |
1 | % | 29 | % | -21 | % | NM | |||||||||
F-41
Table of Contents
PSAV HOLDINGS LLC
NOTES TO CONSOLIDATED FINANCIAL STATEMENTS (continued)
(In thousands except for share and per share amounts)
The Company is currently organized as a limited liability company, which is a pass-through for federal income tax purposes. However, the Company conducts its business through subsidiaries that are subject to income taxes.
U.S. income tax has not been recognized on the excess of book basis over the tax basis of investments in foreign subsidiaries that are indefinitely reinvested outside of the United States. This amount would become taxable in the United States upon a repatriation of assets from the foreign subsidiary or a sale or liquidation of the foreign subsidiary. Determination of the amount of any unrecognized deferred income tax liability on this temporary difference is not practicable because of the complexities of the hypothetical calculation.
Significant components of the Company’s deferred tax assets and liabilities are as follows:
| Successor | Predecessor | |||||||
| December 31, 2014 |
December 31, 2013 |
|||||||
| Deferred tax assets: |
||||||||
| U.S. NOL and tax credit carryforwards |
$ | 39,383 | $ | 39,847 | ||||
| Allowance for doubtful accounts |
570 | 508 | ||||||
| Tax start up costs |
649 | 736 | ||||||
| Accrued compensation |
10,718 | 7,681 | ||||||
| Foreign NOL carryforward |
9,147 | 8,845 | ||||||
| Transaction costs |
1,622 | 191 | ||||||
| Foreign deferrals |
80 | 245 | ||||||
| Interest rate caps |
708 | — | ||||||
| Deferred financing fees |
2,308 | — | ||||||
| Other accruals |
2,183 | 2,407 | ||||||
|
|
|
|
|
|||||
| Total deferred tax assets |
67,368 | 60,460 | ||||||
| Valuation allowance |
(9,058 | ) | (8,608 | ) | ||||
|
|
|
|
|
|||||
| Net deferred tax assets |
$ | 58,310 | $ | 51,852 | ||||
| Deferred tax liabilities: |
||||||||
| Tax over book depreciation and amortization |
$ | (16,958 | ) | (11,313 | ) | |||
| Intangible assets |
(193,609 | ) | (61,360 | ) | ||||
| Venue incentives |
(111 | ) | (83 | ) | ||||
| Tax deductible goodwill |
— | (1,471 | ) | |||||
|
|
|
|
|
|||||
| Total deferred tax liabilities |
(210,678 | ) | (74,227 | ) | ||||
|
|
|
|
|
|||||
| Net deferred tax liabilities |
$ | (152,368 | ) | $ | (22,375 | ) | ||
|
|
|
|
|
|||||
As of December 31, 2014, the Company had net operating loss (“NOL”) carryforwards for U.S. federal income tax purposes of approximately $91,484 that begin to expire in 2027. As of December 31, 2014, the Company had NOL carryforwards for state income tax purposes of approximately $5,891 that begin to expire in 2015. In addition, all of the NOL carryforwards are subject to limitations under the change in ownership provisions of the Internal Revenue Code and are also limited for state and local income tax purposes.
F-42
Table of Contents
PSAV HOLDINGS LLC
NOTES TO CONSOLIDATED FINANCIAL STATEMENTS (continued)
(In thousands except for share and per share amounts)
The Company has foreign NOL carryforwards of $31,348 as of December 31, 2014. Management believes that it is more likely than not that the benefit from the foreign NOL carryforwards will not be realized. Therefore, the Company has provided a valuation allowance on the deferred tax assets related to these foreign NOL carryforwards in the amount of $9,058. The following is a tabular reconciliation of the total amounts of unrecognized tax benefits:
| Successor | Predecessor | |||||||||||||||
| January 25 through December 31, 2014 |
January 1 through January 24, 2014 |
Year ended December 31, |
||||||||||||||
| 2013 | 2012 | |||||||||||||||
| Beginning unrecognized tax benefits |
$ | 780 | $ | 780 | $ | 729 | $ | 677 | ||||||||
| Gross increases—tax positions in prior period |
23 | — | 51 | 52 | ||||||||||||
|
|
|
|
|
|
|
|
|
|||||||||
| Ending unrecognized tax benefits |
$ | 803 | $ | 780 | $ | 780 | $ | 729 | ||||||||
|
|
|
|
|
|
|
|
|
|||||||||
Included in the balance of unrecognized tax benefits as of December 31, 2014 are $301 of benefits that, if recognized, would affect the effective tax rate. The Company does not anticipate that the total amount of unrecognized tax benefits will increase or decrease significantly in the next 12 months.
The Company recognizes interest and penalty expense related to unrecognized tax positions as a component of the income tax provision (benefit). As of December 31, 2014 and 2013, interest and penalties accrued were $144 and $143, respectively.
The Company is subject to taxation in the United States and various foreign and state jurisdictions. As of December 31, 2014, tax years from 2011 to the present remain subject to examination by major tax jurisdictions. Tax years 2011 and 2012 are currently under audit by the Internal Revenue Service.
19. Commitments and Contingencies
Lease Commitments
The Company leases office facilities, office equipment and computers for various terms under long-term operating leases expiring at various dates. In the normal course of business, it is expected that these leases will be renewed or replaced with leases for other properties or equipment. The leases provide for increases in future minimum annual rental payments and generally require the Company to pay real estate taxes, insurance, and maintenance expenses.
F-43
Table of Contents
PSAV HOLDINGS LLC
NOTES TO CONSOLIDATED FINANCIAL STATEMENTS (continued)
(In thousands except for share and per share amounts)
Minimum annual rentals under noncancelable leases as of December 31, 2014 are payable as follows for the years ending December 31:
| 2015 |
$ | 6,227 | ||
| 2016 |
4,262 | |||
| 2017 |
3,660 | |||
| 2018 |
2,946 | |||
| 2019 |
2,253 | |||
| Thereafter |
3,419 | |||
|
|
|
|||
| Total |
$ | 22,767 | ||
|
|
|
Rent expense charged to operations during the Successor 2014 Period and the Predecessor 2014 Period and the years ended December 31, 2013 and 2012, was $10,754, $728, $9,205 and $6,500, respectively.
On January 20, 2015, the Company entered into a new lease for its corporate headquarters. The lease expires on October 31, 2026. The Company will receive allowances totaling $4,499 to partially offset the costs of tenant improvements made to its corporate headquarters. In addition, the lease provides for the abatement of base rent payments by the Company through January 31, 2017. Thereafter, the Company will have minimum annual cash rent commitments of $875, $990, and $1,028 for the years ending December 31, 2017, 2018 and 2019, respectively, and additional annual payments totaling $8,027 through the expiration of the lease.
Venue Contract Commitments
The Company enters into long-term contracts with venue operators for the right to be the
exclusive on-site provider of audiovisual and event technology services and to receive customer referrals from the venue operator over the contract period. Venue contracts may include commitments for fixed minimum commission guarantees and other incentives that are paid over time.
Commitments under venue contracts as of December 31, 2014 are payable as follows for the years ending December 31:
| 2015 |
$ | 2,114 | ||
| 2016 |
2,680 | |||
| 2017 |
1,821 | |||
| 2018 |
366 | |||
| 2019 |
366 | |||
| Thereafter |
280 | |||
|
|
|
|||
| Total |
$ | 7,627 | ||
|
|
|
F-44
Table of Contents
PSAV HOLDINGS LLC
NOTES TO CONSOLIDATED FINANCIAL STATEMENTS (continued)
(In thousands except for share and per share amounts)
20. Transactions with Related Parties
It is possible that the terms of the following transactions with related parties are not the same as those that would result from transactions among wholly unrelated parties.
Successor Related Party Transactions
The Company is party to an advisory fee agreement (the “Advisory Agreement”) with Goldman, Sachs & Co. and Olympus Advisors LLC (the “Advisors”), affiliates of the Sponsors, pursuant to which the Advisors provide business and organizational strategy, financial and advisory services to the Company and its subsidiaries. The annual advisory fee is $1,500, of which $1,405 has been expensed in the 2014 Successor Period and $95 is included in prepaid expenses and other current assets in the Company’s consolidated balance sheet at December 31, 2014. The Company must also pay transaction fees in connection with transactions the Company or its subsidiaries may be involved in, including acquisitions, divestitures, financings or liquidity events, equal to a fee of 1% of the aggregate value as defined in the Advisory Agreement. The Company paid transaction fees to the Advisors of $14,696, included in acquisition-related expenses in the Successor 2014 Period, for financial advisory and corporate structure review related to the Sponsors Acquisition.
An affiliate of Goldman Sachs, one of the Sponsors, was a joint bookrunner and lead arranger for the issuance of the First Lien Loan and Second Lien Loan. The Company paid $4,999 of debt financing costs associated with borrowings under the Company’s debt facilities to the affiliate during Successor 2014 period.
Travel related expenses and retainer fees paid to independent board members and the Sponsors were $120 for the Successor 2014 Period.
One of the counterparties to the Cap Agreement as detailed in Note 12 is a Goldman Sachs affiliate. Payments of $118 were made on the option premium during the Successor 2014 Period.
Predecessor Related Party Transactions
Transaction fees of $8,426 were incurred by the Predecessor in connection with the Sponsors Acquisition and paid to equity investors of the Predecessor. As these fees were considered seller costs and paid by the Company, they were included in the total consideration paid as part of the Sponsors Acquisition (see Note 5). Travel related expenses paid to the equity investors of the Predecessor were $28, 425, and $257 for the Predecessor 2014 period, and the years ended December 31, 2013 and 2012, respectively.
21. Segment Reporting
The Company operates as two segments: Domestic and International. They are organized based on the geographic location of the operations and both segments provide event technology services.
The Domestic segment operates in the United States and Puerto Rico and is the preferred provider of event technology services to customers at over 1,000 hotel properties and other event venues in these geographies.
F-45
Table of Contents
PSAV HOLDINGS LLC
NOTES TO CONSOLIDATED FINANCIAL STATEMENTS (continued)
(In thousands except for share and per share amounts)
The International segment has operations in Canada, Mexico, the Caribbean, Europe and the Middle East, in addition to providing non-venue based services in Asia, where it is the exclusive provider of event technology services to customers hosting events at over 300 international hotel properties and other venues.
Segment operating results reflect Adjusted EBITDA, which is defined as net income before interest expense, income taxes, depreciation, amortization of intangibles, transaction-related expenses, long-term incentive plan payments gain or loss on disposal of assets, gains or losses on foreign currency transactions, changes in the fair value of the interest rate caps, amortization of venue incentives including the one-time expense impact of certain venue incentive payments for which deferred expense recognition is not applicable under U.S. GAAP, management fees paid to the Sponsors, equity-based compensation expense, executive severance and other one-time or non-recurring costs. Management believes Adjusted EBITDA is useful because it allows management to more effectively evaluate the Company’s operating performance and compare the results of operations from period to period without regard to financing methods or capital structure. In addition, the determination of Adjusted EBITDA is consistent with the definition of a similar measure in the Company’s Credit Agreements other than pro forma adjustments for acquisitions and certain forward-looking adjustments permitted by the Credit Agreements but not considered by management in evaluating the Company’s performance using Adjusting EBITDA.
F-46
Table of Contents
PSAV HOLDINGS LLC
NOTES TO CONSOLIDATED FINANCIAL STATEMENTS (continued)
(In thousands except for share and per share amounts)
Segment information was as follows:
| Successor | Predecessor | |||||||||||||||
| January 25, | January 1, | |||||||||||||||
| through | through | |||||||||||||||
| December 31, | January 24, | Year ended December 31, | ||||||||||||||
| 2014 | 2014 | 2013 | 2012 | |||||||||||||
| Revenues: |
||||||||||||||||
| Domestic |
$ | 1,087,737 | $ | 70,240 | $ | 991,682 | $ | 631,105 | ||||||||
| International |
100,546 | 5,382 | 104,692 | 93,743 | ||||||||||||
|
|
|
|
|
|
|
|
|
|||||||||
| Total |
$ | 1,188,283 | $ | 75,622 | $ | 1,096,374 | $ | 724,848 | ||||||||
|
|
|
|
|
|
|
|
|
|||||||||
| Adjusted EBITDA: |
||||||||||||||||
| Domestic |
$ | 138,594 | $ | 7,280 | $ | 118,618 | $ | 62,933 | ||||||||
| International |
10,453 | 612 | 11,763 | 9,534 | ||||||||||||
|
|
|
|
|
|
|
|
|
|||||||||
| Total of all reportable segments |
149,047 | 7,892 | 130,381 | 72,467 | ||||||||||||
| Interest expense, net |
(40,536 | ) | (2,830 | ) | (40,700 | ) | (20,011 | ) | ||||||||
| Depreciation and amortization of intangibles |
(71,950 | ) | (3,222 | ) | (47,502 | ) | (30,174 | ) | ||||||||
| Transaction-related expenses |
(20,410 | ) | (14,243 | ) | (12,004 | ) | (4,004 | ) | ||||||||
| Long-term incentive plan payments |
(42 | ) | (18,021 | ) | — | (6,850 | ) | |||||||||
| Gain/(loss) on disposal of assets |
(2,918 | ) | (127 | ) | (2,051 | ) | (1,695 | ) | ||||||||
| Foreign currency transactions gain/(loss) |
(2,075 | ) | 366 | 1,278 | 1,308 | |||||||||||
| Changes in fair value of interest rate caps |
(1,817 | ) | — | — | — | |||||||||||
| Amortization of venue incentives |
(8,306 | ) | (705 | ) | (9,318 | ) | (8,623 | ) | ||||||||
| Management fee |
(1,405 | ) | — | — | — | |||||||||||
| Equity-based compensation expense |
(299 | ) | (5,365 | ) | — | — | ||||||||||
| Severance expense |
(798 | ) | (163 | ) | (2,334 | ) | (978 | ) | ||||||||
| Consulting fees and other |
(9,164 | ) | (6 | ) | (3,174 | ) | (1,636 | ) | ||||||||
|
|
|
|
|
|
|
|
|
|||||||||
| Income (loss) before tax benefit (expense) |
$ | (10,673 | ) | $ | (36,424 | ) | $ | 14,576 | (196 | ) | ||||||
|
|
|
|
|
|
|
|
|
|||||||||
| Capital expenditures: |
||||||||||||||||
| Domestic |
$ | 31,400 | $ | 4,111 | $ | 32,818 | $ | 26,366 | ||||||||
| International |
2,730 | 157 | 3,688 | 2,988 | ||||||||||||
|
|
|
|
|
|
|
|
|
|||||||||
| Total |
$ | 34,130 | $ | 4,268 | $ | 36,506 | $ | 29,354 | ||||||||
|
|
|
|
|
|
|
|
|
|||||||||
| Successor |
Predecessor | |||||||||||||||
| December 31, 2014 |
December 31, 2013 |
|||||||||||||||
| Property and equipment, net: |
||||||||||||||||
| Domestic |
$ | 97,234 | $ | 73,719 | ||||||||||||
| International |
12,444 | 9,827 | ||||||||||||||
|
|
|
|
|
|||||||||||||
| Total |
$ | 109,678 | $ | 83,546 | ||||||||||||
|
|
|
|
|
|||||||||||||
F-47
Table of Contents
PSAV HOLDINGS LLC
NOTES TO CONSOLIDATED FINANCIAL STATEMENTS (continued)
(In thousands except for share and per share amounts)
22. Subsequent Events
Management evaluates events occurring subsequent to the date of the financial statements in determining the accounting for and disclosure of transactions and events that affect the financial statements. Subsequent events have been evaluated through September 9, 2015, which is the date the financial statements were issued.
On January 14, 2015, the Company acquired 100% of the stock of American Audio Visual Center Inc. (“AAVC”). AAVC is an in-house high-end production company based in Scottsdale, AZ. The acquisition increases the Company’s portfolio of operating locations by over 60 hotels and resorts in strategic markets. The purchase price to effect the transaction was $30,707, including $3,800 for the fair value of contingent consideration for amounts potentially payable under an earn-out provision.
On January 16, 2015, the Company amended the First Lien Credit Agreement to obtain additional principal borrowings totaling $35,000 for purposes of financing the acquisition of AAVC as well as fees and expenses associated with the borrowings and general corporate purposes.
On April 14, 2015, the Company acquired 100% of the stock of AVC Live Limited (“AVC Live”). AVC Live is based in London, England and is the in-house provider of AV services at 38 hotels and other event venues. AVC Live also provides off-site client direct presentation services. The acquisition increases the Company’s property portfolio in the United Kingdom. The purchase price to effect the transaction was $20,554, including $2,075 for the fair value of contingent consideration for amounts potentially payable under an earn-out provision and $1,493 for the fair value of 496 Class A Units.
On May 6, 2015, the Company’s Board of Directors approved a special distribution to its equity holders in the approximate amount of up to $174,000. On May 18, 2015, the Company amended its First Lien Credit Agreement to obtain additional principal borrowings totaling $180,000 for purposes of funding the special distribution as well as fees associated with the borrowing. The amendment also provided for $15,000 of additional borrowing capacity under the Revolving Facility as well as an increase of $10,000 in the capacity for letters of credit. All other terms and provisions under the First Lien Credit Agreement were substantially the same as prior to the amendment, with some additional flexibility provided regarding the ability to enter into certain types of transactions, including acquisitions. Of this amount, $149,083 was distributed to the Company’s equity holders and the remainder is being held for potential reinvestment in the Company for use in acquisitions or a subsequent distribution to equity holders.
F-48
Table of Contents
PSAV HOLDINGS LLC
CONDENSED CONSOLIDATED BALANCE SHEETS
(In thousands, except share and per share amounts)
| June 30, 2015 |
December 31, 2014 |
|||||||
| (Unaudited) | ||||||||
| Assets |
||||||||
| Current assets: |
||||||||
| Cash and cash equivalents |
$ | 69,184 | $ | 68,818 | ||||
| Trade accounts receivable, net of allowance for doubtful accounts of $486 at June 30, 2015 and $181 at December 31, 2014 |
125,837 | 76,946 | ||||||
| Deferred tax assets |
13,161 | 13,471 | ||||||
| Prepaid expenses |
19,146 | 15,487 | ||||||
| Other current assets |
1,613 | 6,840 | ||||||
|
|
|
|
|
|||||
| Total current assets |
228,941 | 181,562 | ||||||
| Property and equipment, net |
119,085 | 109,678 | ||||||
| Goodwill |
395,044 | 367,000 | ||||||
| Trade names, net |
160,919 | 160,395 | ||||||
| Customer relationships, net |
57,198 | 58,420 | ||||||
| Venue contracts, net |
305,683 | 301,886 | ||||||
| Other contractual relationships, net |
3,251 | — | ||||||
| Venue incentives |
29,233 | 14,784 | ||||||
| Other assets |
1,554 | 2,132 | ||||||
|
|
|
|
|
|||||
| Total assets |
$ | 1,300,908 | $ | 1,195,857 | ||||
|
|
|
|
|
|||||
| Liabilities and members’ equity |
||||||||
| Current liabilities: |
||||||||
| Current portion of long-term debt |
$ | 7,218 | $ | 15,050 | ||||
| Trade accounts payable |
34,600 | 29,921 | ||||||
| Accrued expenses |
94,836 | 70,411 | ||||||
|
|
|
|
|
|||||
| Total current liabilities |
136,654 | 115,382 | ||||||
| Long-term debt |
857,688 | 653,217 | ||||||
| Deferred tax liabilities |
170,350 | 165,839 | ||||||
| Other liabilities |
10,980 | 2,651 | ||||||
|
|
|
|
|
|||||
| Total liabilities |
1,175,672 | 937,089 | ||||||
| Class A units, 270,159 and 269,663 units issued and outstanding at June 30, 2015 and December 31, 2014, respectively |
128,819 | 259,097 | ||||||
| Class B units, 15,371 units issued and outstanding at June 30, 2015 and December 31, 2014 |
(1,717 | ) | 299 | |||||
| Accumulated other comprehensive loss |
(1,866 | ) | (628 | ) | ||||
|
|
|
|
|
|||||
| Total members’ equity |
125,236 | 258,768 | ||||||
|
|
|
|
|
|||||
| Total liabilities and members’ equity |
$ | 1,300,908 | $ | 1,195,857 | ||||
|
|
|
|
|
|||||
The accompanying notes are an integral part of these consolidated financial statements
F-49
Table of Contents
PSAV HOLDINGS LLC
CONDENSED CONSOLIDATED STATEMENTS OF OPERATIONS
(In thousands)
| Successor | Predecessor | |||||||||||
| Six months ended June 30, 2015 |
January 25 through June 30, 2014 |
January 1 through January 24, 2014 |
||||||||||
| (Unaudited) | (Unaudited) | |||||||||||
| Revenue |
$ | 791,988 | $ | 599,543 | $ | 75,622 | ||||||
| Cost of revenue |
(657,031 | ) | (495,341 | ) | (63,684 | ) | ||||||
|
|
|
|
|
|
|
|||||||
| Gross profit |
134,957 | 104,202 | 11,938 | |||||||||
| Operating expenses: |
||||||||||||
| Selling, general, and administrative expenses |
67,291 | 45,286 | 30,448 | |||||||||
| Acquisition-related expenses |
1,049 | 17,774 | 14,160 | |||||||||
| Depreciation |
2,449 | 1,703 | 340 | |||||||||
| Amortization of intangibles |
13,188 | 10,514 | 950 | |||||||||
|
|
|
|
|
|
|
|||||||
| Total operating expenses |
83,977 | 75,277 | 45,898 | |||||||||
|
|
|
|
|
|
|
|||||||
| Income (loss) from operations |
50,980 | 28,925 | (33,960 | ) | ||||||||
| Other income (expense), net |
(1,873 | ) | (767 | ) | 366 | |||||||
| Interest expense, net |
(23,569 | ) | (18,737 | ) | (2,830 | ) | ||||||
|
|
|
|
|
|
|
|||||||
| Income (loss) before tax benefit (expense) |
25,538 | 9,421 | (36,424 | ) | ||||||||
| Income tax benefit (expense) |
(10,405 | ) | (8,556 | ) | 10,503 | |||||||
|
|
|
|
|
|
|
|||||||
| Net income (loss) |
$ | 15,133 | $ | 865 | $ | (25,921 | ) | |||||
|
|
|
|
|
|
|
|||||||
The accompanying notes are an integral part of these consolidated financial statements
F-50
Table of Contents
PSAV HOLDINGS LLC
CONDENSED CONSOLIDATED STATEMENTS OF COMPREHENSIVE INCOME (LOSS)
(In thousands)
| Successor | Predecessor | |||||||||||
| Six months ended June 30, 2015 |
January 25 through June 30, 2014 |
January 1 through January 24, 2014 |
||||||||||
| (Unaudited) | (Unaudited) | |||||||||||
| Net income (loss) |
$ | 15,133 | $ | 865 | $ | (25,921 | ) | |||||
| Other comprehensive income (loss), net of tax: |
||||||||||||
| Foreign currency translation adjustments |
(1,238 | ) | 836 | (330 | ) | |||||||
|
|
|
|
|
|
|
|||||||
| Total other comprehensive income (loss) |
(1,238 | ) | 836 | (330 | ) | |||||||
|
|
|
|
|
|
|
|||||||
| Total comprehensive income (loss) |
$ | 13,895 | $ | 1,701 | $ | (26,251 | ) | |||||
|
|
|
|
|
|
|
|||||||
The accompanying notes are an integral part of these consolidated financial statements
F-51
Table of Contents
PSAV HOLDINGS LLC
CONDENSED CONSOLIDATED STATEMENT OF MEMBERS’ EQUITY
(In thousands except for unit and per unit amounts)
(Unaudited)
|
Class A Units |
Class B Units | Accumulated other comprehensive loss |
Total members’ equity |
|||||||||||||||||||||
| Units | Amount | Units | Amount | |||||||||||||||||||||
| Balances at December 31, 2014 |
269,663 | $ | 259,097 | 15,371 | $ | 299 | $ | (628 | ) | $ | 258,768 | |||||||||||||
| Issuances of Class A Units |
496 | 1,493 | — | — | — | 1,493 | ||||||||||||||||||
| Distribution |
— | (146,770 | ) | — | (2,313 | ) | — | (149,083 | ) | |||||||||||||||
| Net income |
— | 14,999 | — | 134 | — | 15,133 | ||||||||||||||||||
| Equity-based compensation |
— | — | — | 163 | — | 163 | ||||||||||||||||||
| Other comprehensive loss |
— | — | — | — | (1,238 | ) | (1,238 | ) | ||||||||||||||||
|
|
|
|
|
|
|
|
|
|
|
|
|
|||||||||||||
| Balances at June 30, 2015 |
270,159 | $ | 128,819 | 15,371 | $ | (1,717 | ) | $ | (1,866 | ) | $ | 125,236 | ||||||||||||
|
|
|
|
|
|
|
|
|
|
|
|
|
|||||||||||||
The accompanying notes are an integral part of these consolidated financial statements
F-52
Table of Contents
PSAV HOLDINGS LLC
CONDENSED CONSOLIDATED STATEMENTS OF CASH FLOWS
(In thousands)
| Successor | Predecessor | |||||||||||
| Six months ended June 30, 2015 |
January 25 through June 30, 2014 |
January 1 through January 24, 2014 |
||||||||||
| (Unaudited) | (Unaudited) | |||||||||||
| Operating activities: |
||||||||||||
| Net income (loss) |
$ | 15,133 | $ | 865 | $ | (25,921 | ) | |||||
| Adjustments to reconcile net income (loss) to net cash provided by (used in) operating activities: |
||||||||||||
| Depreciation |
29,231 | 22,552 | 2,272 | |||||||||
| Amortization of intangibles |
13,188 | 10,514 | 950 | |||||||||
| Amortization of deferred financing costs and debt discounts |
1,747 | 1,302 | 281 | |||||||||
| Loss on fixed asset disposals |
1,608 | 1,141 | 127 | |||||||||
| Venue incentive amortization |
3,112 | 907 | 616 | |||||||||
| Venue incentive payments |
(16,457 | ) | (4,400 | ) | (99 | ) | ||||||
| Deferred tax provision |
(1,938 | ) | (3,022 | ) | (10,567 | ) | ||||||
| Equity-based compensation expense |
163 | 136 | 5,365 | |||||||||
| Changes in assets and liabilities, net of effects of acquired businesses: |
||||||||||||
| Accounts receivable |
(43,267 | ) | (22,919 | ) | (5,644 | ) | ||||||
| Prepaid expenses and other current assets |
3,463 | 1,149 | (1,947 | ) | ||||||||
| Other assets |
339 | 391 | 163 | |||||||||
| Accounts payable |
2,472 | 5,107 | (3,433 | ) | ||||||||
| Accrued expenses and other liabilities |
19,175 | (10,502 | ) | 35,819 | ||||||||
|
|
|
|
|
|
|
|||||||
| Net cash provided by (used in) operating activities |
27,969 | 3,221 | (2,018 | ) | ||||||||
| Investing activities: |
||||||||||||
| Purchase of property and equipment |
(28,587 | ) | (11,247 | ) | (4,268 | ) | ||||||
| Acquisitions, net of cash acquired |
(43,893 | ) | (877,602 | ) | — | |||||||
|
|
|
|
|
|
|
|||||||
| Net cash used in investing activities |
(72,480 | ) | (888,849 | ) | (4,268 | ) | ||||||
| Financing activities: |
||||||||||||
| Issuances of Class A units |
— | 269,438 | — | |||||||||
| Repurchases of Class A units |
— | (200 | ) | — | ||||||||
| Distribution |
(149,083 | ) | — | — | ||||||||
| Repayment of revolving facility |
(10,000 | ) | — | — | ||||||||
| Repayments of long-term debt |
(3,067 | ) | (1,263 | ) | — | |||||||
| Borrowings of long-term debt |
213,225 | 679,775 | — | |||||||||
| Payment of deferred financing costs |
(5,266 | ) | (20,579 | ) | — | |||||||
|
|
|
|
|
|
|
|||||||
| Net cash provided by financing activities |
45,809 | 927,171 | — | |||||||||
| Effect of exchange rate changes on cash and cash equivalents |
(932 | ) | 305 | (344 | ) | |||||||
|
|
|
|
|
|
|
|||||||
| Net increase (decrease) in cash and cash equivalents |
366 | 41,848 | (6,630 | ) | ||||||||
| Cash and cash equivalents at beginning of period |
68,818 | — | 23,733 | |||||||||
|
|
|
|
|
|
|
|||||||
| Cash and cash equivalents at end of period |
$ | 69,184 | $ | 41,848 | $ | 17,103 | ||||||
|
|
|
|
|
|
|
|||||||
| Supplemental cash flow information |
||||||||||||
| Cash paid (refunds received) during the period for: |
||||||||||||
| Interest paid |
$ | 23,279 | $ | 9,985 | $ | 1,344 | ||||||
| Income taxes |
2,319 | 10,982 | (29 | ) | ||||||||
| Non-cash investing and financing activities |
||||||||||||
| Fair value of contingent consideration |
$ | 5,875 | $ | — | $ | — | ||||||
| Issuance of Class A units in connection with the acquisition of AVC Live |
1,493 | — | — | |||||||||
The accompanying notes are an integral part of these consolidated financial statements
F-53
Table of Contents
PSAV HOLDINGS LLC
NOTES TO UNAUDITED CONDENSED CONSOLIDATED FINANCIAL STATEMENTS
(In thousands except for share and per share amounts)
(Unaudited)
1. Description of the Business
PSAV Holdings LLC (the “Company” or “PSAV”) is owned by affiliates of Goldman Sachs and Olympus Partners (together, “the Sponsors”) and certain management investors and other investors. The Company and its subsidiaries provide event technology services, such as audiovisual services, equipment rental, staging and meeting services, communication systems, and related technical support to its customers in various venues, including hotels and convention centers. The Company’s business is primarily conducted under the name PSAV. The Company is organized and operated as two operating segments: Domestic and International. The Domestic segment provides these services to customers throughout the United States and Puerto Rico. The International segment provides services to its customers in Canada, Mexico, the Caribbean, Europe and the Middle East, in addition to providing non-venue based services in Asia.
2. Basis of Presentation
The accompanying unaudited condensed consolidated financial statements and notes of the Company have been prepared in accordance with United States generally accepted accounting principles (“U.S. GAAP”) and the regulations of the U.S. Securities and Exchange Commission for interim financial reporting. Accordingly, they do not include all of the information and footnotes required by U.S. GAAP for complete financial statements. In the opinion of management, the accompanying unaudited condensed consolidated financial statements contain all adjustments necessary to present fairly the financial position of the Company as of June 30, 2015 and December 31, 2014 and the results of operations and cash flows for the six months ended June 30, 2015, the period from January 25, 2014 through June 30, 2014 and the period from January 1, 2014 through January 24, 2014 and are of a normal and recurring nature. Results of operations for interim periods are not necessarily indicative of the results to be expected for the full year ended December 31, 2015. These unaudited condensed consolidated financial statements should be read in conjunction with the Company’s annual audited consolidated financial statements and notes thereto included elsewhere in this prospectus.
The preparation of financial statements in conformity with U.S. GAAP requires management to make estimates and assumptions that affect the amounts reported in the unaudited condensed consolidated financial statements and accompanying notes. Actual results could differ from these estimates.
On January 24, 2014, PSAV Acquisition Corp., a wholly owned subsidiary of the Company, acquired AVSC Holding Corp. pursuant to a Stock Purchase Agreement (the “Purchase Agreement”) dated November 15, 2013. Subsequent to the acquisition, PSAV Acquisition Corp. was merged with and into AVSC Holding Corp., with AVSC Holding Corp. being the surviving entity. The acquisition and merger transactions are collectively referred to as the “Sponsors Acquisition.” The Sponsors Acquisition was accounted for as a business combination in accordance with Financial Accounting Standards Board (“FASB”) Accounting Standards Codification (“ASC”) Topic 805, Business Combinations, and the resulting new basis of accounting is reflected in the Company’s consolidated financial statements for all periods beginning on or after January 25, 2014.
The accompanying consolidated financial statements of the Company include all the accounts of PSAV Holdings LLC and its subsidiaries for periods designated as “Successor” and relate to periods after the Sponsors Acquisition. Periods designated as “Predecessor” relate to period prior to the
F-54
Table of Contents
PSAV HOLDINGS LLC
NOTES TO UNAUDITED CONDENSED CONSOLIDATED FINANCIAL STATEMENTS (continued)
(In thousands except for share and per share amounts)
Sponsors Acquisition and include all the accounts of AVSC Holding Corp. and its subsidiaries. The period from January 1, 2014 through January 24, 2014 is referred to herein as the “Predecessor 2014 Period.” The period from January 25, 2014 through December 31, 2014 is referred to herein as the “Successor 2014 Period.” The Successor 2014 Period includes certain acquisition-related expenses of PSAV Acquisition Corp. (see Note 3).
The unaudited condensed consolidated financial statements include the accounts of PSAV Holdings LLC and its subsidiaries. All significant intercompany balances and transactions have been eliminated in consolidation.
3. Acquisition of AVSC Holding Corp.
On January 24, 2014, PSAV Acquisition Corp., a wholly owned subsidiary of the Company, acquired 100% of the outstanding common shares of AVSC Holding Corp. from AVSC Holding LLC (the “Seller”) pursuant to the Purchase Agreement. Subsequent to the Sponsors Acquisition, PSAV Acquisition Corp. was merged with and into AVSC Holding Corp., with AVSC Holding Corp. being the surviving entity.
The Sponsors Acquisition was financed by $269,438 of equity investments from the Sponsors. The Company also entered into debt agreements totaling $685,000. The proceeds were used to fund the total consideration paid, pay transaction fees associated with the Sponsors Acquisition and settle certain employee arrangements. The Company also repaid AVSC Holding Corp.’s outstanding debt of $492,094 on the Sponsors Acquisition date. The repayment of the debt has been included as a component of consideration transferred and is presented in “Acquisitions, net of cash acquired” in the Company’s condensed consolidated statement of cash flows. Additionally, pursuant to the terms of the Purchase Agreement, the Company was required to redeem all of AVSC Holding Corp.’s outstanding Series A Preferred Stock using funds provided by PSAV Acquisition Corp.
Transaction costs of $17,751 and $14,160 were expensed as incurred and included in acquisition-related expenses in the Company’s condensed consolidated statement of operations in the Successor 2014 Period and Predecessor 2014 Period, respectively.
The Company has accounted for the Sponsors Acquisition as a business combination in accordance with ASC Topic 805, whereby the purchase price paid to effect the Sponsors Acquisition was allocated to record acquired assets and assumed liabilities at fair value as of the date of the Sponsors Acquisition. The fair value of the acquired assets and assumed liabilities was recognized in the Company’s consolidated financial statements as of the close of business on January 24, 2014.
F-55
Table of Contents
PSAV HOLDINGS LLC
NOTES TO UNAUDITED CONDENSED CONSOLIDATED FINANCIAL STATEMENTS (continued)
(In thousands except for share and per share amounts)
The following table summarizes the fair value of the consideration transferred for the Sponsors Acquisition and the allocation of the aggregate purchase price to the fair values of assets acquired and liabilities assumed that were recognized in the Company’s consolidated financial statements at the Sponsors Acquisition date:
| Consideration: |
||||
| Cash paid at closing |
$ | 402,611 | ||
| Debt repaid at closing |
492,094 | |||
| Less cash acquired |
(17,103 | ) | ||
|
|
|
|||
| Total consideration |
$ | 877,602 | ||
|
|
|
|||
| Allocated Fair Value of Acquired Assets and Assumed Liabilities: |
||||
| Trade receivables |
$ | 82,962 | ||
| Other current assets |
13,865 | |||
| Property and equipment |
123,791 | |||
| Intangible assets: |
||||
| Trade names |
160,600 | |||
| Venue contracts |
318,700 | |||
| Customer relationships |
64,600 | |||
| Other assets |
1,853 | |||
| Current liabilities |
(96,757 | ) | ||
| Other liabilities |
(2,244 | ) | ||
| Deferred taxes, net |
(157,240 | ) | ||
|
|
|
|||
| Total identifiable net assets |
510,130 | |||
|
|
|
|||
| Goodwill |
367,472 | |||
|
|
|
|||
| Total net assets acquired |
$ | 877,602 | ||
|
|
|
The cash paid at closing includes $253,313 for the outstanding common shares of AVSC Holding Corp., $74,619 for the redemption of the outstanding Series A Preferred Stock of AVSC Holding Corp., $20,668 for the settlement of transaction costs incurred by the Seller, $1,114 for the settlement of employee arrangements and a reduction of $4,378 for a working capital adjustment.
Goodwill resulting from the Sponsors Acquisition is primarily attributable to the assembled workforce and expected future growth, including future growth in the Company’s customer base and geographic expansion, not attributable to other identifiable intangibles. The goodwill is not deductible for tax purposes.
4. Other Acquisitions
American Audio Visual Center Inc.
On January 14, 2015, the Company acquired 100% of the stock of American Audio Visual Center Inc. (“AAVC”). AAVC is an in-house, high-end production company based in Scottsdale, AZ. The acquisition increases the Company’s portfolio of operating locations by over 60 hotels and resorts in strategic markets across North America and the Caribbean. The total consideration was $30,707, net of cash acquired, including post-closing adjustments, and $3,800 for the fair value of contingent
F-56
Table of Contents
PSAV HOLDINGS LLC
NOTES TO UNAUDITED CONDENSED CONSOLIDATED FINANCIAL STATEMENTS (continued)
(In thousands except for share and per share amounts)
consideration for amounts potentially payable under an earn-out provision. The maximum amount payable under the earn-out is $4,400 and is payable in two annual installments on the first and second anniversaries of the acquisition date based on the achievement of non-financial criteria related to the retention of certain venue agreements to be managed by the seller (see below). The purchase price was funded with incremental borrowings under the Company’s First Lien Loan (See Note 6).
The following tables summarize the fair value of the consideration transferred for the acquisition of AAVC and the preliminary allocation of the aggregate purchase price to the fair values of assets acquired and liabilities assumed that were recognized in the Company’s consolidated financial statements at the acquisition date:
| Consideration: |
||||
| Cash paid at closing |
$ | 28,254 | ||
| Fair value of contingent consideration |
3,800 | |||
| Less cash acquired |
(1,347 | ) | ||
|
|
|
|||
| Total consideration |
$ | 30,707 | ||
|
|
|
|||
| Allocated Fair Value of Acquired Assets and Assumed Liabilities: |
||||
| Trade receivables |
3,731 | |||
| Other current assets |
1,187 | |||
| Other non-current assets |
66 | |||
| Property and equipment |
8,129 | |||
| Intangible assets: |
||||
| Trade name |
800 | |||
| Venue contracts |
6,600 | |||
| Other contractual relationships |
3,500 | |||
| Customer relationships |
300 | |||
| Current liabilities |
(6,843 | ) | ||
| Deferred tax liabilities, net |
(4,807 | ) | ||
| Other long-term liabilities |
(119 | ) | ||
|
|
|
|||
| Total identifiable net assets |
12,544 | |||
|
|
|
|||
| Goodwill |
18,163 | |||
|
|
|
|||
| Total net assets acquired |
$ | 30,707 | ||
|
|
|
The fair value of acquired receivables is $3,731, with a gross contractual amount of $3,816.
No transaction expenses were incurred in the six months ended June 30, 2015 related to the acquisition of AAVC as all $1,180 of transaction expenses were recognized during the fourth quarter of 2014 due to the timing of the acquisition.
F-57
Table of Contents
PSAV HOLDINGS LLC
NOTES TO UNAUDITED CONDENSED CONSOLIDATED FINANCIAL STATEMENTS (continued)
(In thousands except for share and per share amounts)
The goodwill is primarily attributable to expected synergies and the assembled workforce. The goodwill is not deductible for tax purposes. Intangible assets related to the AAVC acquisition consisted of the following:
| Estimated | Amortization | |||||||
| Fair Value | Period | |||||||
| Intangible assets subject to amortization: |
||||||||
| Trade name |
$ | 800 | 1.0 year | |||||
| Venue contracts |
6,600 | 15.0 years | ||||||
| Other contractual relationships |
3,500 | 7.0 years | ||||||
| Customer relationships |
300 | 7.0 years | ||||||
|
|
|
|||||||
| Total intangible assets subject to amortization |
$ | 11,200 | ||||||
|
|
|
|||||||
The amortizable intangible assets reflected in the table above were determined by the Company to have finite lives and will be amortized on a straight-line basis over the estimated useful lives. The useful life for the venue contracts and customer relationships intangible assets were based on the Company’s forecasts of venue contract renewals and customer turnover and thus approximates the period of benefit of the intangible asset. The useful life for the trade name intangible asset was based on the Company’s estimate of the intended remaining useful economic life of the asset.
In addition to acquiring venue contracts and customer relationships, the Company also entered into three seven-year audiovisual service agreements (representing the other contractual relationships intangible) with a new entity formed by the seller, pertaining to three hotels in the New York metropolitan region. The terms of the contracts provide the Company with a specified percentage of revenues realized by the entity on the three hotel properties in exchange for the Company providing the entity with equipment and certain back office administration and technical support. The contracts have a term of seven years and the fair value of the related intangible will be amortized over this period.
Revenues and income from operations before taxes from AAVC are included in the Company’s unaudited condensed consolidated statements of operations for the six months ended June 30, 2015 and are not separately disclosed as AAVC was significantly integrated immediately upon consummation of the acquisition and, therefore, it is impracticable to separately identify AAVC financial information for the periods following the acquisition.
AVC Live
On April 14, 2015, the Company acquired 100% of the stock of AVC Live Limited (“AVC Live”). AVC Live is based in London, England and is the in-house provider of audiovisual services at 38 hotels and other event venues. AVC also provides off-site client direct presentation services. The acquisition increases the Company’s property portfolio in the United Kingdom and is reported as part of the Company’s International segment. Total consideration was $20,554, net of cash acquired. The consideration is comprised of cash, 496 Class A Units of PSAV Holdings LLC and $2,075 for the fair value of contingent consideration for amounts potentially payable under an earn-out provision. The maximum amount payable under the earn-out is $2,964 and is payable in two annual installments on the first and second anniversaries of the acquisition date based on the achievement of annual gross profit targets for each of the post-acquisition periods.
F-58
Table of Contents
PSAV HOLDINGS LLC
NOTES TO UNAUDITED CONDENSED CONSOLIDATED FINANCIAL STATEMENTS (continued)
(In thousands except for share and per share amounts)
The following tables summarize the fair value of the consideration transferred for the acquisition of AVC Live and the preliminary allocation of the aggregate purchase price to the fair values of assets acquired and liabilities assumed that were recognized in the Company’s consolidated financial statements at the acquisition date:
| Consideration: |
||||
| Cash paid at closing |
$ | 17,685 | ||
| Fair value of contingent consideration |
2,075 | |||
| PSAV Holdings LLC Class A Units |
1,493 | |||
| Less cash acquired |
(699 | ) | ||
|
|
|
|||
| Total consideration |
$ | 20,554 | ||
|
|
|
|||
| Allocated Fair Value of Acquired Assets and Assumed Liabilities: |
||||
| Trade receivables |
1,892 | |||
| Other current assets |
707 | |||
| Property and equipment |
3,920 | |||
| Intangible assets: |
||||
| Trade name |
385 | |||
| Venue contracts |
6,225 | |||
| Customer relationships |
1,779 | |||
| Deferred tax liabilities, net |
(1,952 | ) | ||
| Other liabilities |
(2,157 | ) | ||
|
|
|
|||
| Total identifiable net assets |
10,799 | |||
|
|
|
|||
| Goodwill |
9,755 | |||
|
|
|
|||
| Total net assets acquired |
$ | 20,554 | ||
|
|
|
The fair value of acquired receivables is $1,892, with a gross contractual amount of $1,898.
Transaction expenses of $1,049 were recorded in the six months ended June 30, 2015 in conjunction with the acquisition of AVC Live.
The goodwill is primarily attributable to expected synergies and the assembled workforce. The goodwill is not deductible for tax purposes. Intangible assets related to the AVC Live acquisition consisted of the following:
| Estimated | Amortization | |||||
| Fair Value | Period | |||||
| Intangible assets subject to amortization: |
||||||
| Trade name |
$ | 385 | 1.0 year | |||
| Venue contracts |
6,225 | 15.0 years | ||||
| Customer relationships |
1,779 | 10.0 years | ||||
|
|
|
|||||
| Total intangible assets subject to amortization |
$ | 8,389 | ||||
|
|
|
|||||
The amortizable intangible assets reflected in the table above were determined by the Company to have finite lives and will be amortized on a straight line basis over the estimated useful lives. The
F-59
Table of Contents
PSAV HOLDINGS LLC
NOTES TO UNAUDITED CONDENSED CONSOLIDATED FINANCIAL STATEMENTS (continued)
(In thousands except for share and per share amounts)
useful life for the venue contracts and customer contracts intangible assets were based on the Company’s forecasts of venue contract renewals and customer turnover and thus approximates the period of benefit of the intangible asset. The useful life for the trade name intangible asset was based on the Company’s estimate of the intended remaining useful economic life of the asset.
The Company’s revenues for the six months ended June 30, 2015 included $3,865 from AVC Live. The Company’s income from operations before taxes for the six months ended June 30, 2015 included $1,094 from AVC Live.
The following combined unaudited pro forma results of operations for the Company assume that the acquisition of AAVC and AVC Live occurred on January 1, 2014. This unaudited pro forma information should not be relied upon as necessarily being indicative of the historical results that would have been obtained if the acquisition had actually occurred on that date, nor the results that be obtained in the future.
| Six months ended June 30, 2015 |
Six months ended June 30, 2014 |
|||||||
| Revenues |
$ | 797,630 | $ | 674,907 | ||||
| Net income |
17,444 | (26,901 | ) | |||||
The Company is in the process of finalizing its allocation of the purchase price to the individual assets acquired and liabilities assumed in the AAVC and AVC Live acquisitions. This may result in adjustments in future periods to the carrying values of recorded assets and liabilities, refinement of amounts recorded for certain identifiable intangible assets, revisions of the useful lives of the amortizable intangible assets and the determination of any residual amount that will be allocated to goodwill. The related depreciation and amortization expense from the acquired assets of AAVC and AVC Live recognized in the Company’s consolidated statement of operations for the six months ended June 30, 2015 are also subject to such revisions on a prospective basis.
5. Goodwill and Intangible Assets
The following table presents the changes in goodwill by segment for the six months ended June 30, 2015:
| Domestic | International | Total | ||||||||||
| December 31, 2014 |
$ | 359,173 | $ | 7,827 | $ | 367,000 | ||||||
| Goodwill acquired as part of AAVC acquisition |
17,880 | 283 | 18,163 | |||||||||
| Goodwill acquired as part of AVC Live acquisition |
— | 9,755 | 9,755 | |||||||||
| Foreign currency translation adjustment |
— | 126 | 126 | |||||||||
|
|
|
|
|
|
|
|||||||
| June 30, 2015 |
$ | 377,053 | $ | 17,991 | $ | 395,044 | ||||||
|
|
|
|
|
|
|
|||||||
F-60
Table of Contents
PSAV HOLDINGS LLC
NOTES TO UNAUDITED CONDENSED CONSOLIDATED FINANCIAL STATEMENTS (continued)
(In thousands except for share and per share amounts)
The following table presents the changes in intangible assets for the six months ended June 30, 2015:
| Venue Contracts |
Other Contractual Relationships |
Customer Relationships |
Amortizable Trade Names |
Indefinite- Lived Trade Names |
Total | |||||||||||||||||||
| Gross Value |
||||||||||||||||||||||||
| December 31, 2014 |
$ | 318,446 | $ | — | $ | 64,466 | $ | — | $ | 160,395 | $ | 543,307 | ||||||||||||
| Intangible assets acquired as part of AAVC acquisition |
6,600 | 3,500 | 300 | 800 | — | 11,200 | ||||||||||||||||||
| Intangible assets acquired as part of AVC Live acquisition |
6,225 | — | 1,779 | 385 | — | 8,389 | ||||||||||||||||||
| Foreign currency translation adjustment |
138 | — | (9 | ) | 18 | (198 | ) | (51 | ) | |||||||||||||||
|
|
|
|
|
|
|
|
|
|
|
|
|
|||||||||||||
| June 30, 2015 |
$ | 331,409 | $ | 3,500 | $ | 66,536 | $ | 1,203 | $ | 160,197 | $ | 562,845 | ||||||||||||
|
|
|
|
|
|
|
|
|
|
|
|
|
|||||||||||||
| Accumulated Amortization |
||||||||||||||||||||||||
| December 31, 2014 |
$ | (16,560 | ) | $ | — | $ | (6,046 | ) | $ | — | $ | — | $ | (22,606 | ) | |||||||||
| Amortization |
(9,166 | ) | (249 | ) | (3,292 | ) | (481 | ) | — | (13,188 | ) | |||||||||||||
|
|
|
|
|
|
|
|
|
|
|
|
|
|||||||||||||
| June 30, 2015 |
$ | (25,726 | ) | $ | (249 | ) | $ | (9,338 | ) | $ | (481 | ) | $ | — | $ | (35,794 | ) | |||||||
|
|
|
|
|
|
|
|
|
|
|
|
|
|||||||||||||
| Net Value |
||||||||||||||||||||||||
| December 31, 2014 |
$ | 301,886 | $ | — | $ | 58,420 | $ | — | $ | 160,395 | $ | 520,701 | ||||||||||||
| June 30, 2015 |
305,683 | 3,251 | 57,198 | 722 | 160,197 | 527,051 | ||||||||||||||||||
Future amortization expense relating to intangible assets as of June 30, 2015 is as follows for the six-month period ending December 31, 2015 and annual periods thereafter:
| 2015 |
$ | 13,458 | ||
| 2016 |
25,854 | |||
| 2017 |
25,741 | |||
| 2018 |
25,741 | |||
| 2019 |
25,741 | |||
| Thereafter |
250,319 | |||
|
|
|
|||
| Total |
$ | 366,854 | ||
|
|
|
F-61
Table of Contents
PSAV HOLDINGS LLC
NOTES TO UNAUDITED CONDENSED CONSOLIDATED FINANCIAL STATEMENTS (continued)
(In thousands except for share and per share amounts)
6. Long-Term Debt
The Company’s total outstanding indebtedness at June 30, 2015 and December 31, 2014, consisted of the following:
| June 30, | December 31, | |||||||
| 2015 | 2014 | |||||||
| First Lien Loan |
$ | 713,146 | $ | 501,212 | ||||
| Second Lien Loan |
180,000 | 180,000 | ||||||
| Revolving Facility |
— | 10,000 | ||||||
| Less: Unamortized loan discount |
(6,124 | ) | (4,710 | ) | ||||
| Less: Unamortized deferred financing costs |
(22,116 | ) | (18,235 | ) | ||||
|
|
|
|
|
|||||
| Total Debt |
864,906 | 668,267 | ||||||
| Less: Current portion |
(7,218 | ) | (15,050 | ) | ||||
|
|
|
|
|
|||||
| Total Long-term debt |
$ | 857,688 | $ | 653,217 | ||||
|
|
|
|
|
|||||
First Lien Loan
The First Lien Loan bears interest at either, at the Company’s election, (a) the Alternate Base Rate plus 2.5% or (b) the Eurocurrency Rate plus 3.5%. The Alternate Base Rate is defined as the highest of (1) Federal Funds Effective Rate plus 0.5% (2) LIBOR plus 1% (3) Prime Rate (as defined in the First Lien Credit Agreement), or (4) 2%. The Eurocurrency Rate is defined as adjusted LIBOR (at a period of one, two, three, six or twelve months at the Company’s election) subject to a floor of 1%. Interest is due either monthly, for one month elections, every two months, for two month elections, or every three months for all other elections. The Company has elected the Eurocurrency Rate for all elections in the six months ended June 30, 2015 and in the Successor 2014 Period resulting in an interest rate of 4.5% for both periods. The maturity of the First Lien Loan is January 24, 2021.
Depending on the Senior Secured Leverage Ratio as defined in the First Lien Term Agreement, the Company is required to make mandatory prepayments on the outstanding First Lien Loan in an aggregate principal amount equal to 50% of excess cash flow, as defined in the First Lien Credit Agreement, less any principal prepayments made for the year then ended and less any prepayment made pursuant to the Second Lien Credit Agreement, subject to certain other exceptions and deductions. The percentage is reduced to 25% of excess cash flow if the Senior Secured Leverage Ratio is less than or equal to 4.00 to 1.00, but greater than 3.25 to 1.00, and it is reduced to 0% if the Senior Secured Leverage Ratio is less than or equal to 3.25 to 1.00. Subject to certain exceptions and reinvestment rights, the First Lien Credit Agreement also requires 100% of the net cash proceeds from certain asset sales, insurance recoveries and debt issuances be used to pay down outstanding borrowings.
The Company must make mandatory quarterly principal payments on the First Lien Loan in an amount of $1,804. The Company made $3,067 and $1,263 of principal payments on the First Lien Loan during the six months ended June 30, 2015 and 2014 Successor Period, respectively.
If the Company refinances any portion of the First Lien Loan with loans having reduced interest rates or reprice any portion of the First Lien Loan on or prior to November 18, 2015, subject to certain
F-62
Table of Contents
PSAV HOLDINGS LLC
NOTES TO UNAUDITED CONDENSED CONSOLIDATED FINANCIAL STATEMENTS (continued)
(In thousands except for share and per share amounts)
exceptions, the Company is required to pay a premium equal to 1.00% of the aggregate amount of the First Lien Loan repaid or repriced.
Second Lien Loan
The Second Lien Loan bears interest at either, at the Company’s election, (a) the Alternate Base Rate plus 7.25% or (b) the Eurocurrency Rate plus 8.25%. The Alternate Base Rate is defined as the highest of (1) Federal Funds Effective Rate plus 0.5%, (2) LIBOR plus 1% (3) Prime Rate (as defined in the Second Lien Credit Agreement), or (4) 2%. The Eurocurrency Rate is defined as adjusted LIBOR (at a period of one, two, three, six or twelve months at the Company’s election) subject to a floor of 1%. %. Interest is due either monthly, for one month elections, every two months, for two month elections, or every three months for all other elections. The Company has elected the Eurocurrency Rate for all elections in the six months ended June 30, 2015 and the Successor 2014 Period resulting in an interest rate of 9.25% for both periods. The maturity of the Second Lien Loan is January 24, 2022.
The mandatory prepayment requirements under the Second Lien Loan are substantially the same as under the First Lien Loan, except that no mandatory prepayment is required to be made under the Second Lien Loan until the First Lien Loan has been repaid in full, unless such amounts are declined by the Lenders under the First Lien Loan.
If the Company prepays or reprices any portion of the Second Lien Loan on or prior to January 24, 2017, the Company is required to pay a premium equal to: (i) 2.00% of the aggregate principal amount of the Second Lien Loan voluntarily prepaid or repriced after January 24, 2015 but before January 24, 2016 or (ii) 1.00% of the aggregate principal amount of the Second Lien Loan voluntarily prepaid or repriced after January 24, 2016 but before January 24, 2017.
The Company did not make any prepayments on the Second Lien Loan during the six months ended June 30, 2015 or Successor 2014 Period.
Revolving Facility
The Revolving Facility, which has a maximum borrowing limit of $75,000, was issued on January 24, 2014 pursuant to the terms included in the First Lien Term Credit Agreement. The Revolving Facility bears interest at either, at the Company’s election, (a) the alternate base rate (the Prime Rate for the Revolving Facility) plus 2.5% or (b) the Eurocurrency Interest Rate (adjusted LIBOR, at a period of one, two, three, six, or twelve months at the Company’s election) plus 3.5%. The Company has elected the Alternate Base Rate for all elections in the Successor 2014 Period resulting in an interest rate of 5.5%. The interest rate spread on the Revolving Facility is reduced if the Company meets certain leverage ratios. The Revolving Facility also includes an option to borrow funds under the terms of a swingline loan subfacility (the “Swingline Loan”), subject to a sublimit of $10,000.
The Revolving Facility also includes capacity for $25,000 of letters of credit. As of June 30, 2015, the Company had issued letters of credit with an aggregate face value of $8,400. These letters of credit were issued to support various insurance programs, the security deposit on the Company’s new office lease and to backstop a major customer event.
F-63
Table of Contents
PSAV HOLDINGS LLC
NOTES TO UNAUDITED CONDENSED CONSOLIDATED FINANCIAL STATEMENTS (continued)
(In thousands except for share and per share amounts)
As of June 30, 2015, there was $66,600 available for borrowing on the Revolving Facility, which matures on January 24, 2019.
The Revolving Facility is subject to a commitment fee that varies based on the Company’s Senior Secured Leverage Ratio, as defined in the First Lien Credit Agreement, of which the Company paid $70 during the six months ended June 30, 2015.
Financial Covenants and Terms
The Senior Secured Leverage ratio may not exceed 6.75 to 1.00 if more than 25% of Revolving Facility is utilized (borrowings plus the amount of outstanding letters of credit in excess of $17,500). The Senior Secured Leverage Ratio is calculated as Consolidated Senior Secured Debt to Consolidated Adjusted EBITDA, as each term is defined in the First Lien Credit Agreement, for the trailing 12 months. The Company utilized less than 25% of the Revolving Credit Facility as of December 31, 2014 and none as of June 30, 2015.
Obligations under the First and Second Lien Credit Agreements are secured by a first and second lien, respectively, on substantially all of the Company’s assets, including the capital stock of the Company’s subsidiaries, subject to customary exceptions and carve outs.
The Credit Agreements contain customary affirmative and negative covenants, including limitations on the Company’s ability to incur indebtedness, create liens, dispose of assets, make restricted payments and make investments or acquisitions, among other things. Events of default under the Credit Agreements include, among other things, failure to make applicable principal or interest payments when they are due, breach of certain covenants and representations or change in control. At the occurrence of such an event, the administrative agent, at the request of the Lenders, may terminate the commitments and declare the outstanding principal and accrued interest thereon and all fees and other obligations to be due and payable and exercise other rights and remedies provided for in the Credit Agreements.
The Company is not currently in default of any of its loan provisions under the First and Second Lien Credit Agreements.
Incremental First Lien Loan Borrowings
On January 16, 2015, the Company amended the First Lien Credit Agreement to obtain additional first lien term loans in an aggregate principal amount of $35,000 for purposes of financing the acquisition of AAVC as well as fees and expenses associated with the borrowings and general corporate purposes.
On May 18, 2015, the Company amended the First Lien Credit Agreement to obtain additional first lien term loans in an aggregate principal amount of $180,000 for purposes of funding a special dividend as well as fees and expenses associated with the borrowing and related transactions. The amendment also increased the maximum borrowing capacity under the Revolving Credit Facility by $15,000 to a maximum of $75,000 and increased the sublimit on capacity of letters of credit by $10,000 to a sublimit of $25,000.
All other terms and provisions under the First Lien Credit Agreement were substantially the same as prior to these amendments, with some additional flexibility providing regarding the ability to enter into certain types of transactions, including acquisitions.
F-64
Table of Contents
PSAV HOLDINGS LLC
NOTES TO UNAUDITED CONDENSED CONSOLIDATED FINANCIAL STATEMENTS (continued)
(In thousands except for share and per share amounts)
7. Accrued expenses
Accrued expenses were as follows:
| June 30, 2015 |
December 31, 2014 |
|||||||
| Accrued payroll-related expenses |
$ | 29,078 | $ | 22,349 | ||||
| Accrued bonus and sales commissions |
12,292 | 12,837 | ||||||
| Income taxes payable |
5,013 | — | ||||||
| Accrued venue commissions |
13,905 | 10,367 | ||||||
| Accrued interest payable |
4,836 | 6,103 | ||||||
| Worker’s compensation and casualty insurance reserves |
3,024 | 4,134 | ||||||
| Accrued other |
26,688 | 14,621 | ||||||
|
|
|
|
|
|||||
| Total Accrued expenses |
$ | 94,836 | $ | 70,411 | ||||
|
|
|
|
|
|||||
8. Interest Rate Derivatives
The Company is subject to market risks from fluctuation in interest rates on their variable-rate term loan borrowings. The Company’s risk management philosophy is to limit its exposure to rising interest rates and minimize the negative impact on its earnings and cash flows.
In May 2014, the Company entered into two deferred premium interest rate cap agreements (“Cap Agreements”) that were effective in July 2014, each with a notional amount of $171,250 and related option premium of $1,750 each. The option premium is being paid quarterly over the term of the Cap Agreements. Each Cap Agreement is a series of 15 individual caplets that reset and settle quarterly over the period from October 2014 to April 2018.
The Cap Agreements limit the Company’s cash flow exposure to an increase in the USD-LIBOR three month rate above 3% over the next 3.75 years. ASC Topic 815, Derivatives and Hedging, requires recognition of all derivative instruments as either assets or liabilities at fair value in the statement of financial position. See Note 9 for the fair value measurement disclosures. The Company adjusts the value of the derivatives to market each period and records the related gains or losses in income.
The fair value of the interest rate caps, which are not designated as hedging instruments in accordance with ASC Topic 815, of $(2,223) and $(1,664) are included in other liabilities in the consolidated balance sheet as of June 30, 2015 and December 31, 2014, respectively. Losses on the interest rate caps of $(973) and $(1,817) are included in other expense, net in the consolidated statement of operations for the six months ended June 30, 2015 and the 2014 Successor Period, respectively.
9. Fair Value Measurements
Fair value is defined under ASC Topic 820, Fair Value Measurement, as the price that would be received to sell an asset or paid to transfer a liability in the principal or most advantageous market in an orderly transaction between market participants on the measurement date. ASC Topic 820 also
F-65
Table of Contents
PSAV HOLDINGS LLC
NOTES TO UNAUDITED CONDENSED CONSOLIDATED FINANCIAL STATEMENTS (continued)
(In thousands except for share and per share amounts)
establishes a three-level hierarchy, which requires an entity to maximize the use of observable inputs and minimize the use of unobservable inputs when measuring fair value. The valuation hierarchy is based upon the transparency of inputs to the valuation of an asset or liability on the measurement date. The three levels are defined as follows:
| • | Level 1—Inputs to the valuation methodology are quoted prices (unadjusted) for an identical asset or liability in an active market. |
| • | Level 2—Inputs to the valuation methodology include quoted prices for a similar asset or liability in an active market or model-derived valuations in which all significant inputs are observable for substantially the full term of the asset or liability. |
| • | Level 3—Inputs to the valuation methodology are unobservable and significant to the fair value measurement of the asset or liability. |
The following table presents financial assets and liabilities measured at fair value on a recurring basis as of June 30, 2015 and December 31, 2014, by the ASC Topic 820 valuation hierarchy.
| June 30, 2015 | ||||||||||||||||
| Level 1 | Level 2 | Level 3 | Total Fair Value |
|||||||||||||
| Cash and cash equivalents |
$ | 69,184 | $ | — | $ | — | $ | 69,184 | ||||||||
| Interest rate cap agreements |
— | (2,223 | ) | — | (2,223 | ) | ||||||||||
| Contingent consideration liabilities |
— | — | (6,012 | ) | (6,012 | ) | ||||||||||
| December 31, 2014 | ||||||||||||||||
| Level 1 | Level 2 | Level 3 | Total Fair Value |
|||||||||||||
| Cash and cash equivalents |
$ | 68,818 | $ | — | $ | — | $ | 68,818 | ||||||||
| Interest rate cap agreements |
— | (1,664 | ) | — | (1,664 | ) | ||||||||||
Cash and Cash Equivalents
Cash equivalents primarily consist of highly rated money market funds with overnight liquidity and no stated maturities. The Company classified cash equivalents as Level 1 due to the short-term nature of these instruments and measured the fair value based on quoted prices in active markets for identical assets.
Interest Rate Cap
The estimated fair value of the Company’s interest rate caps are determined using broker quotes that are based on widely accepted valuation techniques, including discounted cash flow analysis on the expected cash flows of each derivative contract. This analysis reflects the contractual terms of the instrument, including the period to maturity, and uses observable market-based inputs, including interest rate curves and implied volatilities. These inputs fall within Level 2 of the fair value hierarchy.
F-66
Table of Contents
PSAV HOLDINGS LLC
NOTES TO UNAUDITED CONDENSED CONSOLIDATED FINANCIAL STATEMENTS (continued)
(In thousands except for share and per share amounts)
Contingent Consideration Liabilities
The Company has recognized contingent consideration liabilities for potential earn-out payments related to its acquisitions of AAVC and AVC Live (see Note 4). The estimated fair value of these liabilities was based on probability-weighted future cash flows, discounted at rates commensurate with the subordinated nature of these obligations. These inputs fall within Level 3 of the fair value hierarchy due to the lack of observable market data over the fair value inputs such as the probability-weighted estimates of future cash flows which are based largely on management’s projections. The Company recognized $137 of expense in other income (expense), net in its consolidated statement of operations for the six months ended June 30, 2015 related to an increase in the fair value of the contingent consideration liabilities since the acquisition dates.
Long-Term Debt
Estimated fair values and carrying amounts of the Company’s financial instruments that are not measured at fair value on a recurring basis as of June 30, 2015 and December 31, 2014 are as follows:
| June 30, 2015 | December 31, 2014 | |||||||||||||||
| Fair Value | Carrying Amount |
Fair Value |
Carrying Amount |
|||||||||||||
| Long-term debt: |
||||||||||||||||
| First Lien Loan |
$ | 713,146 | $ | 692,671 | $ | 498,080 | $ | 486,743 | ||||||||
| Second Lien Loan |
180,000 | 173,310 | 178,875 | 172,749 | ||||||||||||
| Revolving Facility |
— | (1,075 | ) | 9,938 | 8,775 | |||||||||||
The fair value of the outstanding principal balance of the Company’s borrowing arrangements at June 30, 2015 and December 31, 2014 are based on pricing from observable market information in a non-active market and would be classified in Level 2 of the fair value hierarchy.
The carrying amounts in the above table are net of the unamortized loan discount and the unamortized deferred financing costs.
10. Members’ Equity
The PSAV Holdings LLC operating agreement (the “Operating Agreement”) provides for classes of membership units, the allocation of profits and losses to each member class, distribution preferences and other member rights.
Allocation of Profits and Losses
Pursuant to the Operating Agreement, net income or net loss shall be allocated among the members (Class A Units and Class B Units) in a manner such that the capital account of each member, immediately after making such allocation, is, as nearly as possible, equal (proportionately) to (a) the distributions that would be made to such member if the Company were dissolved, its affairs wound up and its assets sold for cash equal to their gross asset carrying values, all liabilities of the Company were satisfied and the net assets of the Company were distributed to the members immediately after making such allocations, minus (b) such member’s share of Company nonrecourse debt minimum gains, computed immediately prior to the hypothetical sale of the assets.
F-67
Table of Contents
PSAV HOLDINGS LLC
NOTES TO UNAUDITED CONDENSED CONSOLIDATED FINANCIAL STATEMENTS (continued)
(In thousands except for share and per share amounts)
Net income or net loss allocated to any member cannot exceed the maximum amount that can be allocated without causing the member to have a capital account deficit, unless each of the members would have a capital account deficit. Net loss in excess of this limitation is allocated first to members who do not have an capital account deficit pro rata in proportion to their capital account balances until no member would be entitled to any further allocation, and then to the members in a manner determined in good faith by the Company’s Board of Directors taking into account the relative economic interests of the members.
Accordingly, to the extent there is a net loss reported in a period, it will first be allocated to the Class A Units because those are the only unit holders that have a contributed capital balance. Net income will be allocated to both Class A and Class B Units once there is net income reported in excess of net losses on a cumulative basis. During the six months ended June 30, 2015, the Company reported net income of $15,133, of which $10,566 was first allocated to Class A Units to offset the loss allocated to the Class A Units in 2014 until there was net income reported on a cumulative basis. The remaining $4,567 of net income was allocated proportionately the member’s equity accounts of the Class A Units and Class B Units based on their ownership interests.
Distributions
The Operating Agreement provides that any distributions, other than tax distributions, will be made according to the following priority:
| a) | first, to the members holding Class A Units, pro rata among such members in proportion to their unreturned capital contributions with respect to such Class A Units, until the amount of their unreturned capital contributions with respect to such Class A Units has been reduced to zero; |
| b) | second, to the members holding vested Class B Units, until such members have received, with respect to each such vested Class B Unit, a cumulative amount equal to the cumulative amount distributed, after the date such vested Class B Unit was originally issued, with respect to a Class A Unit (excluding, with respect to a vested Class B Unit that has a distribution threshold greater than $0, distributions received with respect to such Class A Unit prior to the time that the aggregate amount of distributions to all Units outstanding on the date of issuance of such vested Class B Unit is equal to the distribution threshold with respect to such vested Class B Unit), pro rata in proportion to the amounts that would need to be distributed to each such member with respect to such vested Class B Units immediately prior to the distribution; and |
| c) | Thereafter, to the members holding Class A Units and vested Class B Units, pro rata in proportion to the number of such units held by them. |
| d) | Notwithstanding the foregoing, no holder of a vested Class B Unit shall be entitled to receive any distributions (other than tax distributions, to the extent applicable) until distributions have been made to holders of units that were outstanding at the time of the issuance of such Class B Unit after the issuance of such Class B Unit (on a cumulative basis) equal to the distribution threshold with respect to such Class B Unit, and then such holder of a vested Class B Unit shall be entitled to receive with respect to such vested Class B Unit only distributions made after such time and priority (i.e., only in excess of such distribution threshold). |
F-68
Table of Contents
PSAV HOLDINGS LLC
NOTES TO UNAUDITED CONDENSED CONSOLIDATED FINANCIAL STATEMENTS (continued)
(In thousands except for share and per share amounts)
On May 6, 2015, the Company’s Board of Directors approved a special distribution to its equity holders in the approximate amount of up to $174,000 to be paid utilizing net proceeds from incremental borrowings under the First Lien Credit Agreement. Of this amount, $149,083 was distributed to the Company’s equity holders and the remainder is being held for potential reinvestment in the Company for use in acquisitions or a subsequent distribution to equity holders, with $2,313 distributed to holders of Class B Units as a tax distribution and $146,770 distributed to holders of Class A Units. The $2,313 paid to holders of Class B Units represents a tax distribution which is treated as an advance against any other distributions to be made to them under the LLC agreement.
11. Equity-Based Compensation
The following table sets forth summary information with respect to the Company’s equity-based awards for the six months ended June 30, 2015. See Note 15 to the Company’s annual audited consolidated financial statements included in this prospectus for a description of the Company’s equity-based compensation plans.
Profits Interests
| Service Units | Performance Units | |||||||
| Equity-based compensation expense (January 25—June 30, 2014) |
$ | 136 | $ | — | ||||
| Equity-based compensation expense (Six months ended June 30, 2015) |
$ | 163 | $ | — | ||||
| Non-vested at December 31, 2014 |
8,185.5 | 7,185.5 | ||||||
| Granted |
— | — | ||||||
| Vested |
(1,437.1 | ) | — | |||||
| Forfeited / cancelled |
— | — | ||||||
|
|
|
|
|
|||||
| Non-vested at June 30, 2015 |
6,748.4 | 7,185.5 | ||||||
|
|
|
|
|
|||||
Phantom Units
| Phantom Service Units |
Phantom Performance Units |
|||||||
| Equity-based compensation expense (January 25—June 30, 2014) |
$ | — | $ | — | ||||
| Equity-based compensation expense (Six months ended June 30, 2015) |
$ | — | $ | — | ||||
| Non-vested at December 31, 2014 |
4,939.0 | 4,939.0 | ||||||
| Granted |
1,422.0 | 1,422.0 | ||||||
| Vested |
— | — | ||||||
| Forfeited / cancelled |
(1,347.0 | ) | (1,347.0 | ) | ||||
|
|
|
|
|
|||||
| Non-vested at June 30, 2015 |
5,014.0 | 5,014.0 | ||||||
|
|
|
|
|
|||||
Equity-based compensation expense of $6,428 was recognized in the Predecessor 2014 Period which includes amounts recognized for Predecessor Override and Predecessor Phantom units in connection with the Sponsors Acquisition.
F-69
Table of Contents
PSAV HOLDINGS LLC
NOTES TO UNAUDITED CONDENSED CONSOLIDATED FINANCIAL STATEMENTS (continued)
(In thousands except for share and per share amounts)
12. Income Taxes
Income tax expense of $8,556 for the Successor 2014 Period represents an effective rate of 90.8%. Income tax benefit of $(10,503) for the Predecessor 2014 Period represents an effective tax rate of 28.8%. The effective rates in the Successor 2014 Period and the Predecessor 2014 Period were impacted by non-deductible transaction costs.
Income tax expense of $10,405 for the six months ended June 30, 2015 represents an effective tax rate of 40.7%.
13. Segment Information
The Company is organized and operated as two operating segments: Domestic and International. They are organized based on geographic location of operations and provide a similar range of services to customers.
The Domestic segment operates in the United States and Puerto Rico and is the preferred provider of event technology services at over 1,000 hotel properties and other event venues in these geographies.
The International segment has operations in Canada, Mexico, the Caribbean, Europe and the Middle East, in addition to providing non-venue based services in Asia, and is the exclusive provider of event technology services at over 300 international hotel properties and other event venues.
Segment operating results reflect Adjusted EBITDA, which is defined as net income before interest expense, income taxes, depreciation, amortization of intangibles, transaction-related expenses, long-term incentive plan payments gain or loss on disposal of assets, gains or losses on foreign currency transactions, changes in the fair value of the interest rate caps, amortization of venue incentives including the one-time expense impact of certain venue incentive payments for which deferred expense recognition is not applicable under U.S. GAAP, management fees paid to the Sponsors, equity-based compensation expense, executive severance and other one-time or non-recurring costs. Management believes Adjusted EBITDA is useful because it allows management to more effectively evaluate the Company’s operating performance and compare the results of operations from period to period without regard to financing methods or capital structure. In addition, the determination of Adjusted EBITDA is consistent with the definition of a similar measure in the Company’s Credit Agreements other than pro forma adjustments for acquisitions and certain forward-looking adjustments permitted by the Credit Agreements but not considered by management in evaluating the Company’s performance using Adjusting EBITDA.
F-70
Table of Contents
PSAV HOLDINGS LLC
NOTES TO UNAUDITED CONDENSED CONSOLIDATED FINANCIAL STATEMENTS (continued)
(In thousands except for share and per share amounts)
Segment information was as follows:
| Successor | Predecessor | |||||||||||
| Six months ended June 30, 2015 |
January 25 through June 30, 2014 |
January 1 through January 24, 2014 |
||||||||||
| Revenues: |
||||||||||||
| Domestic |
$ | 731,524 | $ | 549,635 | $ | 70,240 | ||||||
| International |
60,464 | 49,908 | 5,382 | |||||||||
|
|
|
|
|
|
|
|||||||
| Total |
$ | 791,988 | $ | 599,543 | $ | 75,622 | ||||||
| Adjusted EBITDA: |
||||||||||||
| Domestic |
$ | 106,435 | $ | 86,344 | $ | 7,280 | ||||||
| International |
6,883 | 6,120 | 612 | |||||||||
|
|
|
|
|
|
|
|||||||
| Total of all reportable segments |
113,318 | 92,464 | 7,892 | |||||||||
| Interest expense, net |
(23,569 | ) | (18,737 | ) | (2,830 | ) | ||||||
| Depreciation and amortization of intangibles |
(42,419 | ) | (33,066 | ) | (3,222 | ) | ||||||
| Transaction-related expenses |
(2,757 | ) | (19,057 | ) | (14,243 | ) | ||||||
| Long-term incentive plan payments |
— | (42 | ) | (18,021 | ) | |||||||
| Gain/(loss) on disposal of assets |
(1,608 | ) | (1,141 | ) | (127 | ) | ||||||
| Foreign currency transactions gain/(loss) |
(763 | ) | 381 | 366 | ||||||||
| Changes in fair value of interest rate caps |
(973 | ) | (1,148 | ) | — | |||||||
| Amortization of venue incentives |
(3,456 | ) | (5,489 | ) | (705 | ) | ||||||
| Management fee |
(786 | ) | (649 | ) | — | |||||||
| Equity-based compensation expense |
(163 | ) | (136 | ) | (5,365 | ) | ||||||
| Severance expense |
(1,982 | ) | (758 | ) | (163 | ) | ||||||
| Consulting fees and other |
(9,304 | ) | (3,201 | ) | (6 | ) | ||||||
|
|
|
|
|
|
|
|||||||
| Income (loss) before tax benefit (expense) |
$ | 25,538 | $ | 9,421 | $ | (36,424 | ) | |||||
|
|
|
|
|
|
|
|||||||
| Capital expenditures: |
||||||||||||
| Domestic |
$ | 24,630 | $ | 9,824 | $ | 4,111 | ||||||
| International |
3,957 | 1,423 | 157 | |||||||||
|
|
|
|
|
|
|
|||||||
| Total |
$ | 28,587 | $ | 11,247 | $ | 4,268 | ||||||
| June 30, 2015 |
December 31, 2014 |
|||||||||||
| Property and equipment, net: |
||||||||||||
| Domestic |
$ | 102,615 | $ | 97,234 | ||||||||
| International |
16,470 | 12,444 | ||||||||||
|
|
|
|
|
|||||||||
| Total |
$ | 119,085 | $ | 109,678 | ||||||||
14. Transactions with Related Parties
It is possible that the terms of the following transactions with related parties are not the same as those that would result from transactions among wholly unrelated parties.
F-71
Table of Contents
PSAV HOLDINGS LLC
NOTES TO UNAUDITED CONDENSED CONSOLIDATED FINANCIAL STATEMENTS (continued)
(In thousands except for share and per share amounts)
The Company is party to an advisory fee agreement (the “Advisory Agreement”) with Goldman, Sachs & Co. and Olympus Advisors LLC (the “Advisors”), affiliates of the Sponsors, pursuant to which the Advisors provide business and organizational strategy, financial and advisory services to the Company and its subsidiaries. The annual advisory fee is $1,500, of which $744 and $649 has been expensed in the six months ended June 30, 2015 and Successor 2014 Period, respectively. $851 and $95 is included in prepaid expenses and other current assets in the Company’s consolidated balance sheet at June 30, 2015 and December 31, 2014, respectively. The Company must also pay transaction fees in connection with transactions the Company or its subsidiaries may be party to, including acquisitions, divestitures, financings or liquidity events, equal to a fee of 1% of the aggregate value as defined in the Advisory Agreement. The Company paid transaction fees to the Advisors of $14,696, included in acquisition-related expenses in the Successor 2014 Period, for financial advisory and corporate structure review related to the Sponsors Acquisition.
An affiliate of Goldman Sachs, one of the Sponsors, was a joint bookrunner and lead arranger for the issuance of the First Lien Loan and Second Lien Loan. The Company paid $1,130 and $4,999 of debt financing costs associated with borrowings under the Company’s debt facilities to the affiliate during the six months ended June 30, 2015 and the Successor 2014 period, respectively.
One of the counterparties to one of the Cap Agreements (see Note 8) is an affiliate of Goldman Sachs. Payments totaling $234 were made to this entity on the option premium for the Cap Agreement during the six months ended June 30, 2015.
15. Subsequent Events
Management evaluates events occurring subsequent to the date of the financial statements in determining the accounting for and disclosure of transactions and events that affect the financial statements. Subsequent events have been evaluated through September 9, 2015, which is the date the financial statements were issued.
F-72
Table of Contents
Shares
PSAV, Inc.
Common Stock
| Goldman, Sachs & Co. | Morgan Stanley | |||
| Barclays | Credit Suisse | |||
| Macquarie Capital | Piper Jaffray | William Blair |
Through and including , 2015 (the 25th day after the date of this prospectus), all dealers effecting transactions in these securities, whether or not participating in this offering, may be required to deliver a prospectus. This is in addition to a dealer’s obligation to deliver a prospectus when acting as an underwriter and with respect to an unsold allotment or subscription.
Table of Contents
PART II—INFORMATION NOT REQUIRED IN PROSPECTUS
Item 13. Other Expenses of Issuance and Distribution.
The following table sets forth all costs and expenses, other than underwriting discounts and commissions, paid or payable by us in connection with the sale of the common stock being registered. All amounts shown are estimates except for the SEC registration fee, the FINRA filing fee and the listing fee for the New York Stock Exchange.
| Amount Paid or to be Paid |
||||
| SEC registration fee |
$ | 11,620 | ||
| FINRA filing fee |
15,500 | |||
| New York Stock Exchange listing fee |
* | |||
| Blue sky qualification fees and expenses |
* | |||
| Printing and engraving expenses |
* | |||
| Legal fees and expenses |
* | |||
| Accounting fees and expenses |
* | |||
| Transfer agent and registrar fees and expenses |
* | |||
| Miscellaneous expenses |
* | |||
|
|
|
|||
| Total |
$ * | |||
|
|
|
|||
| * | To be provided by amendment |
Item 14. Indemnification of Officers and Directors.
The Registrant is governed by the Delaware General Corporation Law (the “DGCL”). Section 145 of the DGCL provides that a corporation may indemnify any person, including an officer or director, who was or is, or is threatened to be made, a party to any threatened, pending or completed legal action, suit or proceeding, whether civil, criminal, administrative or investigative (other than an action by or in the right of such corporation), by reason of the fact that such person was or is an officer, director, employee or agent of such corporation or is or was serving at the request of such corporation as a director, officer, employee or agent of another corporation or enterprise. The indemnity may include expenses (including attorneys’ fees), judgments, fines and amounts paid in settlement actually and reasonably incurred by such person in connection with such action, suit or proceeding, provided such officer, director, employee or agent acted in good faith and in a manner such person reasonably believed to be in, or not opposed to, the corporation’s best interest and, for criminal proceedings, had no reasonable cause to believe that such person’s conduct was unlawful. A Delaware corporation may indemnify any person, including an officer or director, who was or is, or is threatened to be made, a party to any threatened, pending or contemplated action or suit by or in the right of such corporation, under the same conditions, except that such indemnification is limited to expenses (including attorneys’ fees) actually and reasonably incurred by such person, and except that no indemnification is permitted without judicial approval if such person is adjudged to be liable to such corporation. Where an officer or director of a corporation is successful, on the merits or otherwise, in the defense of any action, suit or proceeding referred to above, or any claim, issue or matter therein, the corporation must indemnify that person against the expenses (including attorneys’ fees) which such officer or director actually and reasonably incurred in connection therewith.
The Registrant’s amended and restated bylaws will authorize the indemnification of its officers and directors, consistent with Section 145 of the Delaware General Corporation Law, as amended. The Registrant intends to enter into indemnification agreements with each of its directors and executive officers. These agreements, among other things, will require the Registrant to indemnify each director and executive officer to the fullest extent permitted by Delaware law, including indemnification of
II-1
Table of Contents
expenses such as attorneys’ fees, judgments, fines and settlement amounts incurred by the director or executive officer in any action or proceeding, including any action or proceeding by or in right of the Registrant, arising out of the person’s services as a director or executive officer.
Reference is made to Section 102(b)(7) of the DGCL, which enables a corporation in its original certificate of incorporation or an amendment thereto to eliminate or limit the personal liability of a director for violations of the director’s fiduciary duty, except (i) for any breach of the director’s duty of loyalty to the corporation or its stockholders, (ii) for acts or omissions not in good faith or which involve intentional misconduct or a knowing violation of law, (iii) pursuant to Section 174 of the DGCL, which provides for liability of directors for unlawful payments of dividends of unlawful stock purchase or redemptions or (iv) for any transaction from which a director derived an improper personal benefit.
The Registrant intends to enter into indemnification agreements with each of its directors. These agreements, among other things, will require the Registrant to indemnify each director to the fullest extent permitted by Delaware law, including indemnification of expenses such as attorneys’ fees, judgments, fines and settlement amounts incurred by the director in any action or proceeding, including any action or proceeding by or in right of the Registrant, arising out of the person’s services as a director.
The Registrant expects to maintain standard policies of insurance that provide coverage (i) to its directors and officers against loss rising from claims made by reason of breach of duty or other wrongful act and (ii) to the Registrant with respect to indemnification payments that it may make to such directors and officers.
The Underwriting Agreement to be filed as Exhibit 1.1 to this Registration Statement provides for indemnification to the Registrant’s directors and officers by the underwriters against certain liabilities.
Item 15. Recent Sales of Unregistered Securities
The following sets forth all unregistered securities sold by the Registrant since its formation.
On August 11, 2015, the Registrant issued and sold 1,000 shares of its common stock to PSAV Holdings LLC for $0.10 per share.
As described in the prospectus included in this Registration Statement, the Registrant will issue shares of common stock to Class A Unitholders of PSAV Holdings LLC as part of the corporate reorganization.
The shares of common stock in all the transactions listed above were issued or will be issued in reliance on Section 4(a)(2) of the Securities Act of 1933, as amended, as the sale of such securities did not or will not involve a public offering. Appropriate legends were and will be affixed to the share certificate issued in each transaction.
II-2
Table of Contents
Item 16. Exhibits
| (a) | Exhibits: |
EXHIBIT INDEX
| Exhibit No. |
Description | |
| 1.1* | Form of Underwriting Agreement | |
| 2.1† | Stock Purchase Agreement, dated November 15, 2013, by and between PSAV Acquisition Corp. and AVSC Holding LLC | |
| 2.2† | Amendment to the Stock Purchase Agreement, dated January 26, 2015, to the Stock Purchase Agreement, dated November 15, 2013, by and between PSAV Acquisition Corp. and AVSC Holding LLC | |
| 3.1* | Form of Amended and Restated Certificate of Incorporation of PSAV, Inc. to be in effect prior to the consummation of the offering made under this Registration Statement | |
| 3.2* | Form of Amended and Restated Bylaws of PSAV, Inc. to be in effect prior to the consummation of the offering made under this Registration Statement | |
| 4.1* | Form of Common Stock Certificate | |
| 4.2* | Form of Stockholders’ Agreement | |
| 4.3* | Form of Registration Rights Agreement | |
| 5.1* | Opinion of Weil, Gotshal & Manges, LLP | |
| 10.1* | Amended and Restated Limited Liability Company Agreement of PSAV Holdings LLC, dated as of January 24, 2014 | |
| 10.2* | Amendment No. 1, dated as of July 2, 2014, to the Amended and Restated Limited Liability Company Agreement of PSAV Holdings LLC, dated as of January 24, 2014 | |
| 10.3* | Management Advisory Services Agreement, dated as of January 24, 2014, by and among PSAV Holdings LLC, PSAV Intermediate Corp. and AVSC Holding Corp. and each Olympus Advisors LLC and Goldman, Sachs & Co. | |
| 10.4* | First Lien Credit Agreement, dated January 24, 2014, among PSAV Acquisition Corp. (to be merged with and into AVSC Holding Corp.), PSAV Intermediate Corp., the Subsidiaries of AVSC Holding Corp. from time to time party thereto, the financial institutions party thereto, as Lenders, and Barclays Bank PLC, as Administrative Agent and Goldman Sachs Lending Partners LLC, Barclays Bank PLC, Macquarie Capital (USA) Inc. and Morgan Stanley Senior Funding, Inc., as Joint Bookrunners and Joint Lead Arrangers | |
| 10.5* | Second Lien Credit Agreement, dated January 24, 2014, among PSAV Acquisition Corp. (to be merged with and into AVSC Holding Corp.), PSAV Intermediate Corp., the Subsidiaries of AVSC Holding Corp. from time to time party thereto, the financial institutions party thereto, as Lenders, and Barclays Bank PLC, as Administrative Agent and Goldman Sachs Lending Partners LLC, Barclays Bank PLC, Macquarie Capital (USA) Inc. and Morgan Stanley Senior Funding, Inc., as Joint Bookrunners and Joint Lead Arrangers | |
| 10.6* | Tranche 1 Incremental Facility Agreement, dated January 16, 2015, among PSAV Intermediate Corp., AVSC Holding Corp. as Borrower, the subsidiaries of the Borrower party thereto as guarantors, the Tranche 1 Incremental Term Lenders party thereto and Barclays Bank PLC as Administrative Agent | |
| 10.7* | First Amendment to First Lien Credit Agreement, dated May 18, 2015, to First Lien Credit Agreement, dated January 24, 2014, among PSAV Intermediate Corp., AVSC Holding Corp., the Subsidiaries of AVSC Holding Corp., the Lenders party thereto, and Barclays Bank PLC, as Administrative Agent and Goldman Sachs Lending Partners LLC, Barclays Bank PLC, Macquarie Capital (USA) Inc. and Morgan Stanley Senior Funding, Inc., as Lead Arrangers | |
II-3
Table of Contents
| Exhibit No. |
Description | |
| 10.8* | First Amendment to Second Lien Credit Agreement, dated May 18, 2015, to Second Lien Credit Agreement, dated January 24, 2014, among PSAV Intermediate Corp., AVSC Holding Corp., the Subsidiaries of AVSC Holding Corp., the Lenders party thereto, and Barclays Bank PLC, as Administrative Agent and Goldman Sachs Lending Partners LLC, Barclays Bank PLC, Macquarie Capital (USA) Inc. and Morgan Stanley Senior Funding, Inc., as Lead Arrangers | |
| 10.9* | Amended & Restated Employment Agreement, dated September 4, 2015, by and between Audio Visual Services Group, Inc. and Ben Erwin | |
| 10.10* | Employment Agreement, dated January 24, 2014, by and between Audio Visual Services Group, Inc. and J. Michael McIlwain | |
| 10.11* | Employment Agreement, dated January 24, 2014, by and between Audio Visual Services Group, Inc. and Skylar Cunningham | |
| 10.12* | Employment Agreement, dated January 24, 2014, by and between Audio Visual Services Group, Inc. and James Whitney Markowitz | |
| 10.13† | PSAV Holdings LLC Amended and Restated Phantom Unit Appreciation Plan | |
| 10.14† | Form of PSAV Holdings LLC Phantom Unit Appreciation Plan Award Agreement | |
| 10.15† | PSAV Holdings LLC 2014 Management Incentive Plan | |
| 10.16† | Form of PSAV Holdings LLC 2014 Management Incentive Plan Unit Award Agreement for Directors | |
| 10.17† | Form of PSAV Holdings LLC 2014 Management Incentive Plan Unit Award Agreement for Named Executive Officers | |
| 10.18† | Class A Unit Subscription Agreement, dated as of January 24, 2014, by and between PSAV Holdings LLC and J. Michael McIlwain | |
| 10.19† | Class A Unit Subscription Agreement, dated as of January 24, 2014, by and between PSAV Holdings LLC and Skylar Cunningham | |
| 10.20† | Unit Subscription Agreement, dated as of January 24, 2014, by and between PSAV Holdings LLC and Broad Street Principal Investments, L.L.C., Bridge Street 2013 Holdings, L.P., MBD 2013 Holdings, L.P. and Olympus Growth Fund VI, L.P. | |
| 10.21† | Class A Unit Subscription Agreement, dated as of January 24, 2014, by and between PSAV Holdings LLC and FS Investment Corporation II | |
| 10.22† | Class A Unit Subscription Agreement, dated as of January 24, 2014, by and between PSAV Holdings LLC and Race Street Funding LLC | |
| 10.23† | Rollover Agreement, dated as of January 24, 2014, by and among PSAV Intermediate Corp. and J. Michael McIlwain | |
| 10.24† | Rollover Agreement, dated as of January 24, 2014, by and among PSAV Intermediate Corp. and J. Whitney Markowitz | |
| 10.25† | Contribution Agreement, dated as of January 24, 2014, by and between PSAV Intermediate Corp. and PSAV Acquisition Corp. | |
| 10.26† | Contribution and Exchange Agreement, dated as of January 24, 2014, by and among PSAV Holdings LLC and J. Michael McIlwain | |
II-4
Table of Contents
| Exhibit No. |
Description | |
| 10.27† | Contribution and Exchange Agreement, dated as of January 24, 2014, by and among PSAV Holdings LLC and J. Whitney Markowitz | |
| 10.28† | Form of Indemnification Agreement for PSAV Holdings LLC | |
| 10.29* | Form of Indemnification Agreement for PSAV, Inc. | |
| 10.30† | Class A Unit Subscription Agreement, dated as of July 30, 2014, by and between PSAV Holdings LLC and Lou D’Ambrosio | |
| 10.31† | Class A Unit Subscription Agreement, dated as of August 30, 2014, by and between PSAV Holdings LLC and Larry Porcellato | |
| 11.1 | Statement re computation of per share earnings (incorporated by reference to Notes to the Financial Statements included in Part I of this Registration Statement) | |
| 21.1* | List of subsidiaries of PSAV, Inc. | |
| 23.1 | Consent of Ernst & Young LLP, Independent Registered Public Accounting Firm | |
| 23.2* | Consent of Weil, Gotshal & Manges LLP (included in Exhibit 5.1) | |
| 24.1† | Power of Attorney | |
| * | To be filed by amendment. |
| † | Previously filed. |
Item 17. Undertakings
The undersigned Registrant hereby undertakes to provide to the underwriters at the closing specified in the underwriting agreements, certificates in such denominations and registered in such names as required by the underwriters to permit prompt delivery to each purchaser.
Insofar as indemnification for liabilities arising under the Securities Act may be permitted to directors, officers and controlling persons of the Registrant pursuant to the provisions referenced in Item 14 of this registration statement, or otherwise, the Registrant has been advised that in the opinion of the SEC such indemnification is against public policy as expressed in the Securities Act and is, therefore, unenforceable. In the event that a claim for indemnification against such liabilities (other than the payment by the Registrant of expenses incurred or paid by a director, officer, or controlling person of the Registrant in the successful defense of any action, suit or proceeding) is asserted by such director, officer or controlling person in connection with the securities being registered hereunder, the Registrant will, unless in the opinion of its counsel the matter has been settled by controlling precedent, submit to a court of appropriate jurisdiction the question of whether such indemnification by it is against public policy as expressed in the Securities Act and will be governed by the final adjudication of such issue.
The undersigned Registrant hereby undertakes that:
| (1) | For purposes of determining any liability under the Securities Act, the information omitted from the form of prospectus filed as part of this registration statement in reliance upon Rule 430A and contained in a form of prospectus filed by the Registrant pursuant to Rule 424(b)(1) or (4) or 497(h) under the Securities Act shall be deemed to be part of this registration statement as of the time it was declared effective. |
| (2) | For the purpose of determining any liability under the Securities Act, each post-effective amendment that contains a form of prospectus shall be deemed to be a new registration statement relating to the securities offered therein, and the offering of such securities at that time shall be deemed to be the initial bona fide offering thereof. |
II-5
Table of Contents
| (3) | For the purpose of determining liability under the Securities Act of 1933 to any purchaser, if the Registrant is subject to Rule 430C, each prospectus filed pursuant to Rule 424(b) as part of a registration statement relating to an offering, other than registration statements relying on Rule 430B or other than prospectuses filed in reliance on Rule 430A, shall be deemed to be part of and included in the registration statement as of the date it is first used after effectiveness. Provided, however, that no statement made in a registration statement or prospectus that is part of the registration statement or made in a document incorporated or deemed incorporated by reference into the registration statement or prospectus that is part of the registration statement will, as to a purchaser with a time of contract of sale prior to such first use, supersede or modify any statement that was made in the registration statement or prospectus that was part of the registration statement or made in any such document immediately prior to such date of first use. |
| (4) | For the purpose of determining liability of the Registrant under the Securities Act of 1933 to any purchaser in the initial distribution of the securities, the undersigned Registrant undertakes that in a primary offering of securities of the undersigned Registrant pursuant to this registration statement, regardless of the underwriting method used to sell the securities to the purchaser, if the securities are offered or sold to such purchaser by means of any of the following communications, the undersigned Registrant will be a seller to the purchaser and will be considered to offer or sell such securities to such purchaser: |
| (a) | Any preliminary prospectus or prospectus of the undersigned Registrant relating to the offering required to be filed pursuant to Rule 424; |
| (b) | Any free writing prospectus relating to the offering prepared by or on behalf of the undersigned Registrant or used or referred to by the undersigned Registrant; |
| (c) | The portion of any other free writing prospectus relating to the offering containing material information about the undersigned Registrant or its securities provided by or on behalf of the undersigned Registrant; and |
| (d) | Any other communication that is an offer in the offering made by the undersigned Registrant to the purchaser. |
II-6
Table of Contents
SIGNATURES
Pursuant to the requirements of the Securities Act of 1933, the Registrant has duly caused this registration statement to be signed on its behalf by the undersigned, thereunto duly authorized in the City of Schiller Park, State of Illinois, on October 23, 2015.
| PSAV, Inc. | ||
| By: | /s/ Benjamin E. Erwin | |
| Name: | Benjamin E. Erwin | |
| Title: | Chief Financial Officer | |
Pursuant to the requirements of the Securities Act of 1933, this registration statement has been signed by the following persons in the capacities indicated on October 23, 2015.
| Signature |
Title | |
| /s/ J. Michael McIlwain J. Michael McIlwain |
President, Chief Executive Officer and Director (Principal Executive Officer) | |
| /s/ Benjamin E. Erwin Benjamin E. Erwin |
Chief Financial Officer (Principal Financial and Accounting Officer) | |
| * Manu Bettegowda |
Chairman | |
| * Louis J. D’Ambrosio |
Director | |
| * Evan Eason |
Director | |
| * John J. Gavin |
Director | |
| * Bradley J. Gross |
Director | |
| * Larry B. Porcellato |
Director | |
| * Leonard Seevers |
Director | |
| * By: | /s/ J. Whitney Markowitz | |
|
| ||
| J. Whitney Markowitz | ||
| Attorney-in-fact | ||
Table of Contents
EXHIBIT INDEX
| Exhibit No. |
Description | |
| 1.1* | Form of Underwriting Agreement | |
| 2.1† | Stock Purchase Agreement, dated November 15, 2013, by and between PSAV Acquisition Corp. and AVSC Holding LLC | |
| 2.2† | Amendment to the Stock Purchase Agreement, dated January 26, 2015, to the Stock Purchase Agreement, dated November 15, 2013, by and between PSAV Acquisition Corp. and AVSC Holding LLC | |
| 3.1* | Form of Amended and Restated Certificate of Incorporation of PSAV, Inc. to be in effect prior to the consummation of the offering made under this Registration Statement | |
| 3.2* | Form of Amended and Restated Bylaws of PSAV, Inc. to be in effect prior to the consummation of the offering made under this Registration Statement | |
| 4.1* | Form of Common Stock Certificate | |
| 4.2* | Form of Stockholders’ Agreement | |
| 4.3* | Form of Registration Rights Agreement | |
| 5.1* | Opinion of Weil, Gotshal & Manges, LLP | |
| 10.1* | Amended and Restated Limited Liability Company Agreement of PSAV Holdings LLC, dated as of January 24, 2014 | |
| 10.2* | Amendment No. 1, dated as of July 2, 2014, to the Amended and Restated Limited Liability Company Agreement of PSAV Holdings LLC, dated as of January 24, 2014 | |
| 10.3* | Management Advisory Services Agreement, dated as of January 24, 2014, by and among PSAV Holdings LLC, PSAV Intermediate Corp. and AVSC Holding Corp. and each Olympus Advisors LLC and Goldman, Sachs & Co. | |
| 10.4* | First Lien Credit Agreement, dated January 24, 2014, among PSAV Acquisition Corp. (to be merged with and into AVSC Holding Corp.), PSAV Intermediate Corp., the Subsidiaries of AVSC Holding Corp. from time to time party thereto, the financial institutions party thereto, as Lenders, and Barclays Bank PLC, as Administrative Agent and Goldman Sachs Lending Partners LLC, Barclays Bank PLC, Macquarie Capital (USA) Inc. and Morgan Stanley Senior Funding, Inc., as Joint Bookrunners and Joint Lead Arrangers | |
| 10.5* | Second Lien Credit Agreement, dated January 24, 2014, among PSAV Acquisition Corp. (to be merged with and into AVSC Holding Corp.), PSAV Intermediate Corp., the Subsidiaries of AVSC Holding Corp. from time to time party thereto, the financial institutions party thereto, as Lenders, and Barclays Bank PLC, as Administrative Agent and Goldman Sachs Lending Partners LLC, Barclays Bank PLC, Macquarie Capital (USA) Inc. and Morgan Stanley Senior Funding, Inc., as Joint Bookrunners and Joint Lead Arrangers | |
| 10.6* | Tranche 1 Incremental Facility Agreement, dated January 16, 2015, among PSAV Intermediate Corp., AVSC Holding Corp. as Borrower, the subsidiaries of the Borrower party thereto as guarantors, the Tranche 1 Incremental Term Lenders party thereto and Barclays Bank PLC as Administrative Agent | |
| 10.7* | First Amendment to First Lien Credit Agreement, dated May 18, 2015, to First Lien Credit Agreement, dated January 24, 2014, among PSAV Intermediate Corp., AVSC Holding Corp., the Subsidiaries of AVSC Holding Corp., the Lenders party thereto, and Barclays Bank PLC, as Administrative Agent and Goldman Sachs Lending Partners LLC, Barclays Bank PLC, Macquarie Capital (USA) Inc. and Morgan Stanley Senior Funding, Inc., as Lead Arrangers | |
Table of Contents
| Exhibit No. |
Description | |
| 10.8* | First Amendment to Second Lien Credit Agreement, dated May 18, 2015, to Second Lien Credit Agreement, dated January 24, 2014, among PSAV Intermediate Corp., AVSC Holding Corp., the Subsidiaries of AVSC Holding Corp., the Lenders party thereto, and Barclays Bank PLC, as Administrative Agent and Goldman Sachs Lending Partners LLC, Barclays Bank PLC, Macquarie Capital (USA) Inc. and Morgan Stanley Senior Funding, Inc., as Lead Arrangers | |
| 10.9* | Amended & Restated Employment Agreement, dated September 4, 2015, by and between Audio Visual Services Group, Inc. and Ben Erwin | |
| 10.10* | Employment Agreement, dated January 24, 2014, by and between Audio Visual Services Group, Inc. and J. Michael McIlwain | |
| 10.11* | Employment Agreement, dated January 24, 2014, by and between Audio Visual Services Group, Inc. and Skylar Cunningham | |
| 10.12* | Employment Agreement, dated January 24, 2014, by and between Audio Visual Services Group, Inc. and James Whitney Markowitz | |
| 10.13† | PSAV Holdings LLC Amended and Restated Phantom Unit Appreciation Plan | |
| 10.14† | Form of PSAV Holdings LLC Phantom Unit Appreciation Plan Award Agreement | |
| 10.15† | PSAV Holdings LLC 2014 Management Incentive Plan | |
| 10.16† | Form of PSAV Holdings LLC 2014 Management Incentive Plan Unit Award Agreement for Directors | |
| 10.17† | Form of PSAV Holdings LLC 2014 Management Incentive Plan Unit Award Agreement for Named Executive Officers | |
| 10.18† | Class A Unit Subscription Agreement, dated as of January 24, 2014, by and between PSAV Holdings LLC and J. Michael McIlwain | |
| 10.19† | Class A Unit Subscription Agreement, dated as of January 24, 2014, by and between PSAV Holdings LLC and Skylar Cunningham | |
| 10.20† | Unit Subscription Agreement, dated as of January 24, 2014, by and between PSAV Holdings LLC and Broad Street Principal Investments, L.L.C., Bridge Street 2013 Holdings, L.P., MBD 2013 Holdings, L.P. and Olympus Growth Fund VI, L.P. | |
| 10.21† | Class A Unit Subscription Agreement, dated as of January 24, 2014, by and between PSAV Holdings LLC and FS Investment Corporation II | |
| 10.22† | Class A Unit Subscription Agreement, dated as of January 24, 2014, by and between PSAV Holdings LLC and Race Street Funding LLC | |
| 10.23† | Rollover Agreement, dated as of January 24, 2014, by and among PSAV Intermediate Corp. and J. Michael McIlwain | |
| 10.24† | Rollover Agreement, dated as of January 24, 2014, by and among PSAV Intermediate Corp. and J. Whitney Markowitz | |
| 10.25† | Contribution Agreement, dated as of January 24, 2014, by and between PSAV Intermediate Corp. and PSAV Acquisition Corp. | |
| 10.26† | Contribution and Exchange Agreement, dated as of January 24, 2014, by and among PSAV Holdings LLC and J. Michael McIlwain | |
| 10.27† | Contribution and Exchange Agreement, dated as of January 24, 2014, by and among PSAV Holdings LLC and J. Whitney Markowitz | |
Table of Contents
| Exhibit No. |
Description | |
| 10.28† | Form of Indemnification Agreement for PSAV Holdings LLC | |
| 10.29* | Form of Indemnification Agreement for PSAV, Inc. | |
| 10.30† | Class A Unit Subscription Agreement, dated as of July 30, 2014, by and between PSAV Holdings LLC and Lou D’Ambrosio | |
| 10.31† | Class A Unit Subscription Agreement, dated as of August 30, 2014, by and between PSAV Holdings LLC and Larry Porcellato | |
| 11.1 | Statement re computation of per share earnings (incorporated by reference to Notes to the Financial Statements included in Part I of this Registration Statement) | |
| 21.1* | List of subsidiaries of PSAV, Inc. | |
| 23.1 | Consent of Ernst & Young LLP, Independent Registered Public Accounting Firm | |
| 23.2* | Consent of Weil, Gotshal & Manges LLP (included in Exhibit 5.1) | |
| 24.1† | Power of Attorney | |
| * | To be filed by amendment. |
| † | Previously filed. |