Attached files
| file | filename |
|---|---|
| 8-K - JAS Q1 FY16 EARNINGS POWERPOINT - PROCTER & GAMBLE Co | jasq1fy16pp.htm |

Procter & GambleEarnings Release:Q1 FY 2016 Results October 23, 2015

Business ResultsQ1 FY 2016
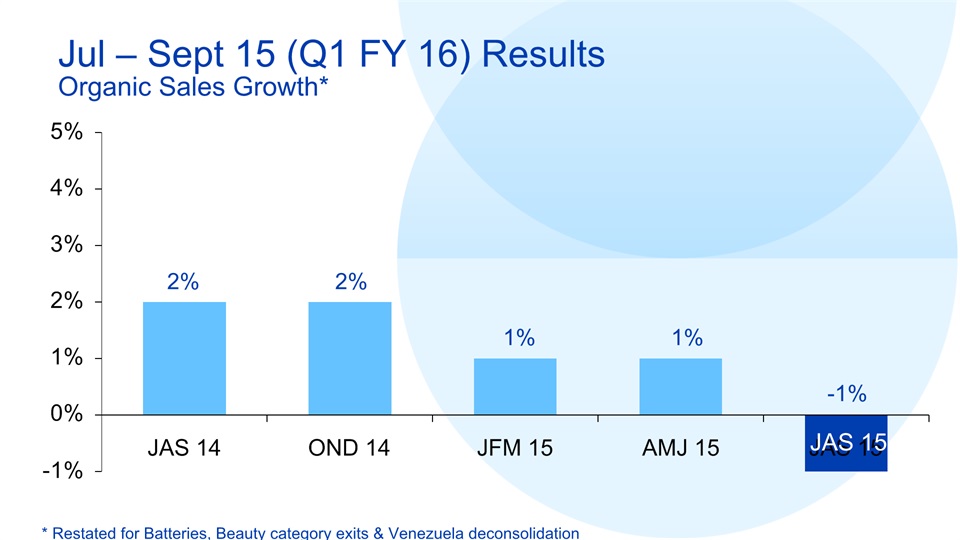
Jul – Sept 15 (Q1 FY 16) ResultsOrganic Sales Growth* * Restated for Batteries, Beauty category exits & Venezuela deconsolidation JAS 15
Jul – Sept 15 (Q1 FY 16) ResultsMarket Share Global value share ~22% % of Sales Holding/Growing Share ~35%
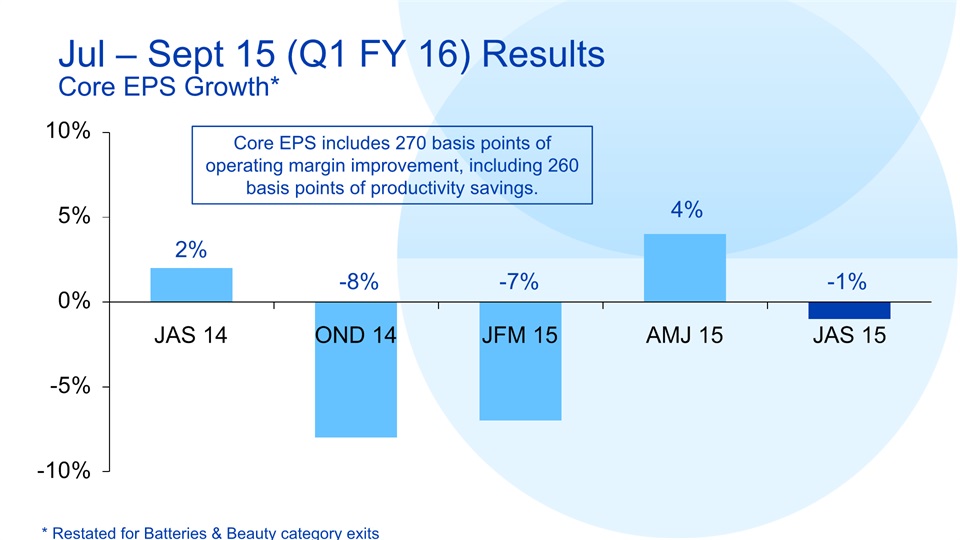
Jul – Sept 15 (Q1 FY 16) ResultsCore EPS Growth* * Restated for Batteries & Beauty category exits Core EPS includes 270 basis points of operating margin improvement, including 260 basis points of productivity savings.
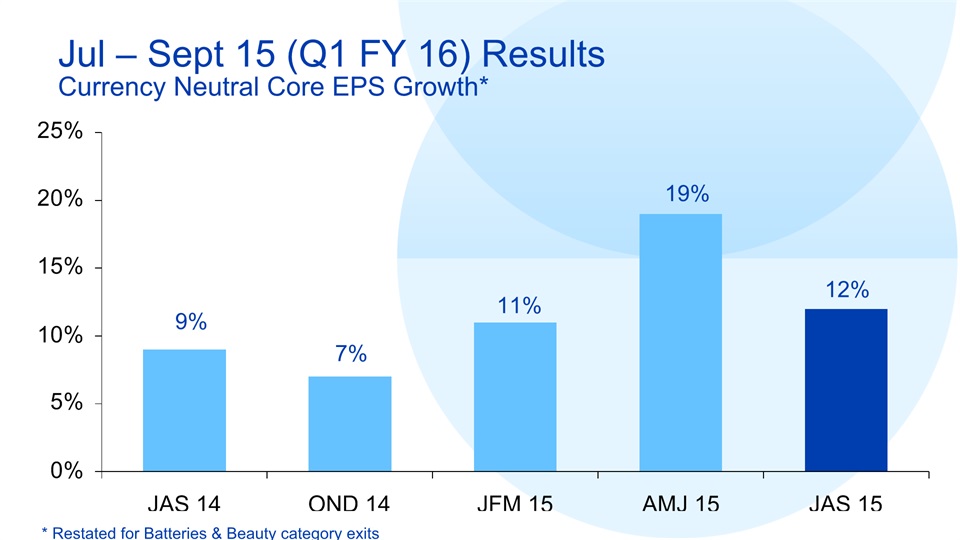
Jul – Sept 15 (Q1 FY 16) ResultsCurrency Neutral Core EPS Growth* * Restated for Batteries & Beauty category exits
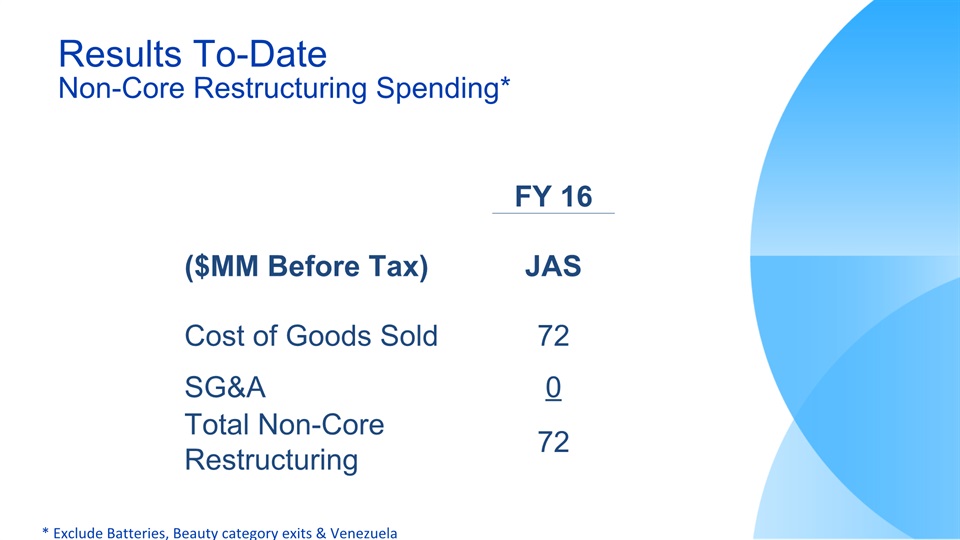
Results To-DateNon-Core Restructuring Spending* FY 16 ($MM Before Tax) JAS Cost of Goods Sold 72 SG&A 0 Total Non-Core Restructuring 72 * Exclude Batteries, Beauty category exits & Venezuela

Business SegmentsQ1 FY 201
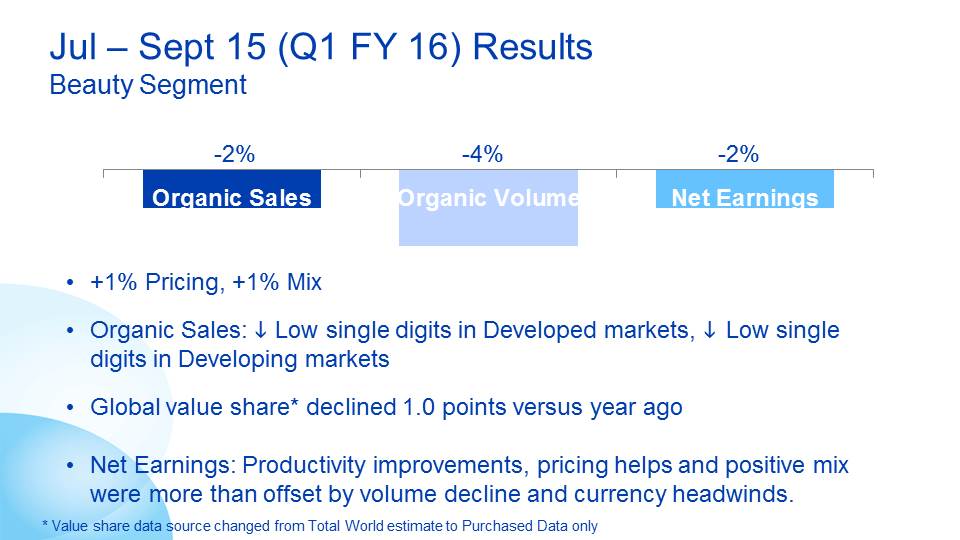
Jul – Sept 15 (Q1 FY 16) ResultsBeauty Segment -2% -4% -2% +1% Pricing, +1% MixOrganic Sales: i Low single digits in Developed markets, i Low single digits in Developing marketsGlobal value share* declined 1.0 points versus year agoNet Earnings: Productivity improvements, pricing helps and positive mix were more than offset by volume decline and currency headwinds. * Value share data source changed from Total World estimate to Purchased Data only
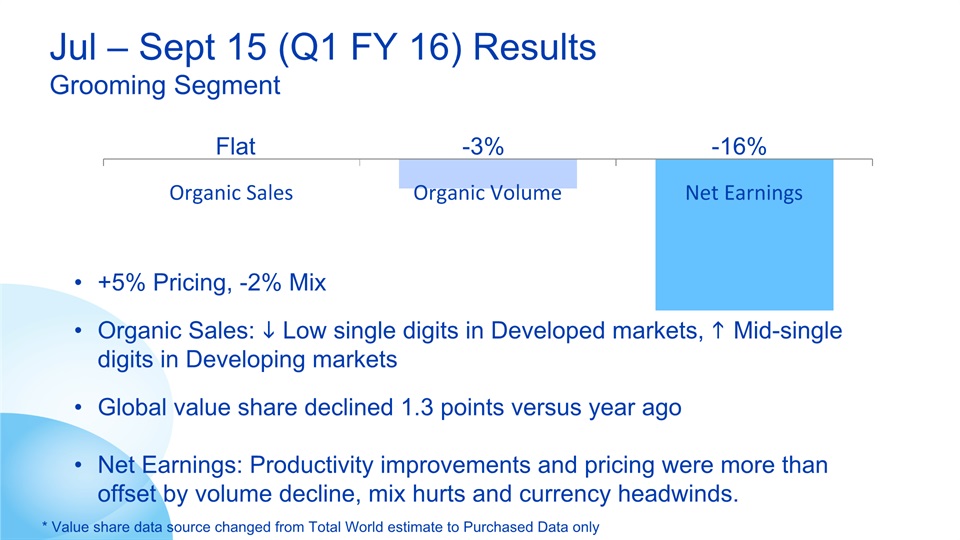
Jul – Sept 15 (Q1 FY 16) ResultsGrooming Segment Flat -3% -16% +5% Pricing, -2% MixOrganic Sales: i Low single digits in Developed markets, h Mid-single digits in Developing marketsGlobal value share declined 1.3 points versus year agoNet Earnings: Productivity improvements and pricing were more than offset by volume decline, mix hurts and currency headwinds. * Value share data source changed from Total World estimate to Purchased Data only
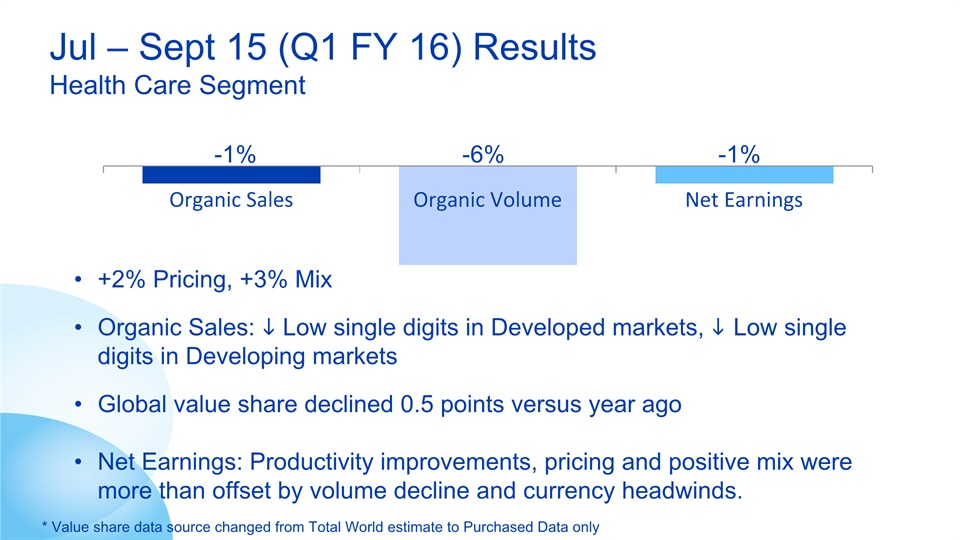
Jul – Sept 15 (Q1 FY 16) ResultsHealth Care Segment -1% -6% -1% +2% Pricing, +3% MixOrganic Sales: i Low single digits in Developed markets, i Low single digits in Developing marketsGlobal value share declined 0.5 points versus year agoNet Earnings: Productivity improvements, pricing and positive mix were more than offset by volume decline and currency headwinds. * Value share data source changed from Total World estimate to Purchased Data only
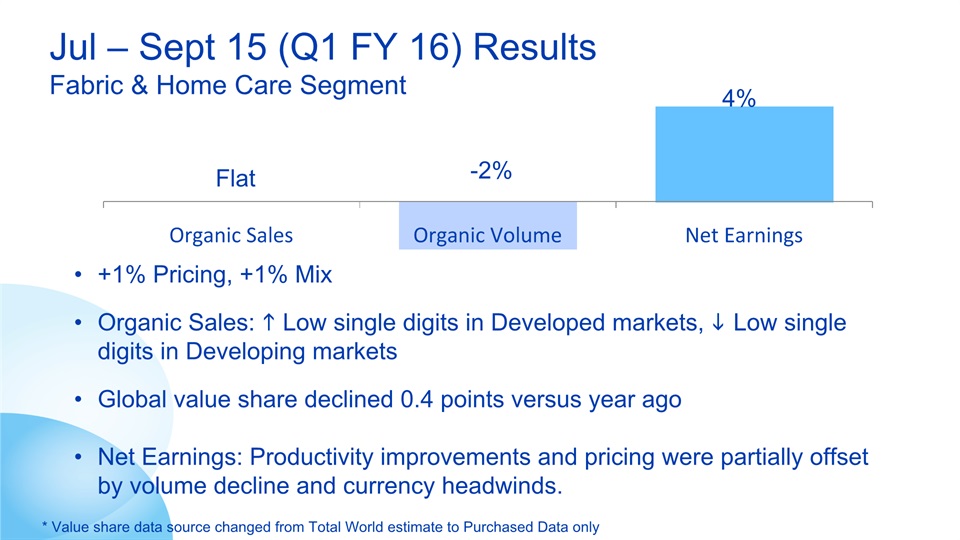
Jul – Sept 15 (Q1 FY 16) ResultsFabric & Home Care Segment Flat -2% 4% +1% Pricing, +1% MixOrganic Sales: h Low single digits in Developed markets, i Low single digits in Developing marketsGlobal value share declined 0.4 points versus year agoNet Earnings: Productivity improvements and pricing were partially offset by volume decline and currency headwinds. * Value share data source changed from Total World estimate to Purchased Data only
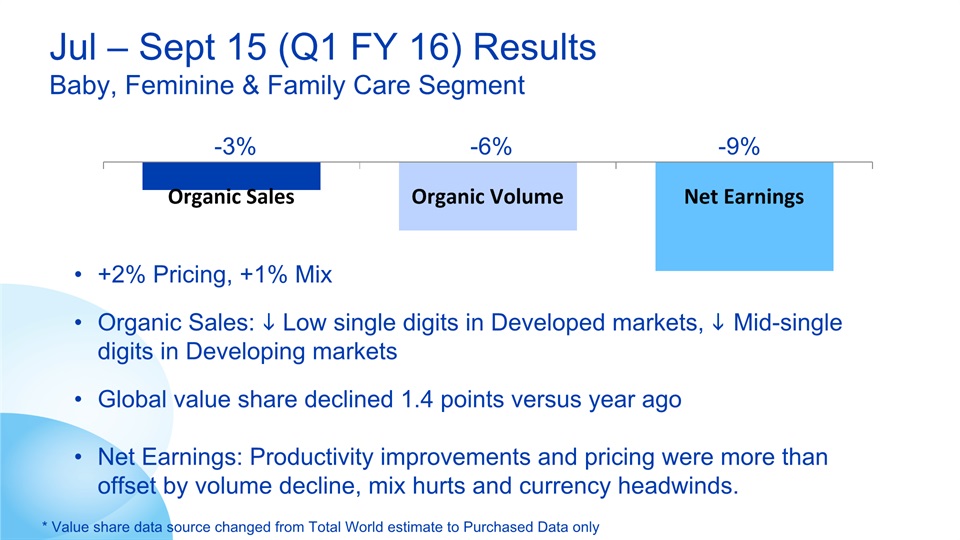
Jul – Sept 15 (Q1 FY 16) ResultsBaby, Feminine & Family Care Segment -3% -6% -9% +2% Pricing, +1% MixOrganic Sales: i Low single digits in Developed markets, i Mid-single digits in Developing marketsGlobal value share declined 1.4 points versus year agoNet Earnings: Productivity improvements and pricing were more than offset by volume decline, mix hurts and currency headwinds. * Value share data source changed from Total World estimate to Purchased Data only

Category HighlightsQ1 FY 2016
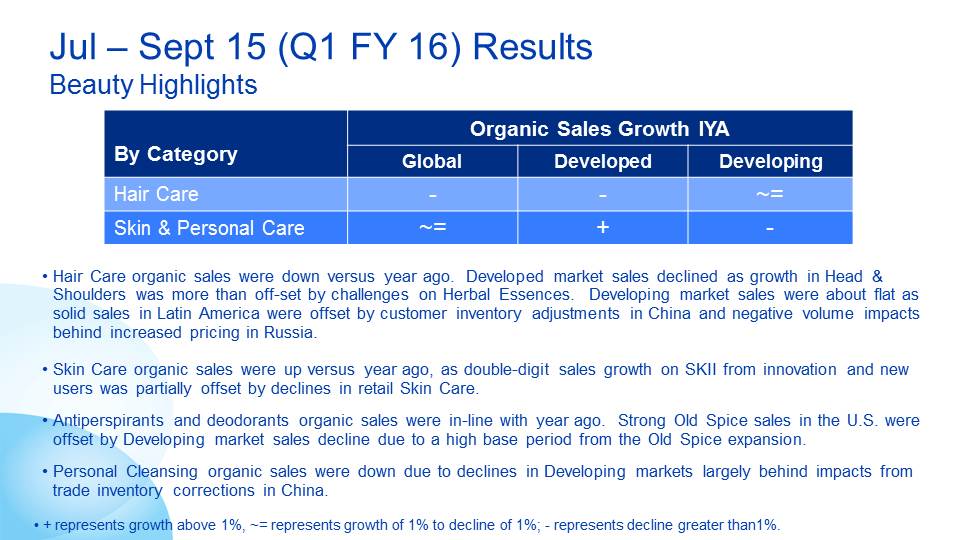
Jul – Sept 15 (Q1 FY 16) ResultsBeauty Highlights Hair Care organic sales were down versus year ago. Developed market sales declined as growth in Head & Shoulders was more than off-set by challenges on Herbal Essences. Developing market sales were about flat as solid sales in Latin America were offset by customer inventory adjustments in China and negative volume impacts behind increased pricing in Russia.Skin Care organic sales were up versus year ago, as double-digit sales growth on SKII from innovation and new users was more than offset by declines in retail Skin Care. Antiperspirants and deodorants organic sales were in-line with year ago. Strong Old Spice sales in the U.S. were offset by Developing market sales decline due to a high base period from the Old Spice expansion.Personal Cleansing organic sales were down due to declines in Developing markets largely behind impacts from trade inventory corrections in China. By Category Organic Sales Growth IYA Global Developed Developing Hair Care - - ~= Skin & Personal Care ~= + - + represents growth above 1%, ~= represents growth of 1% to decline of 1%; - represents decline greater than1%.
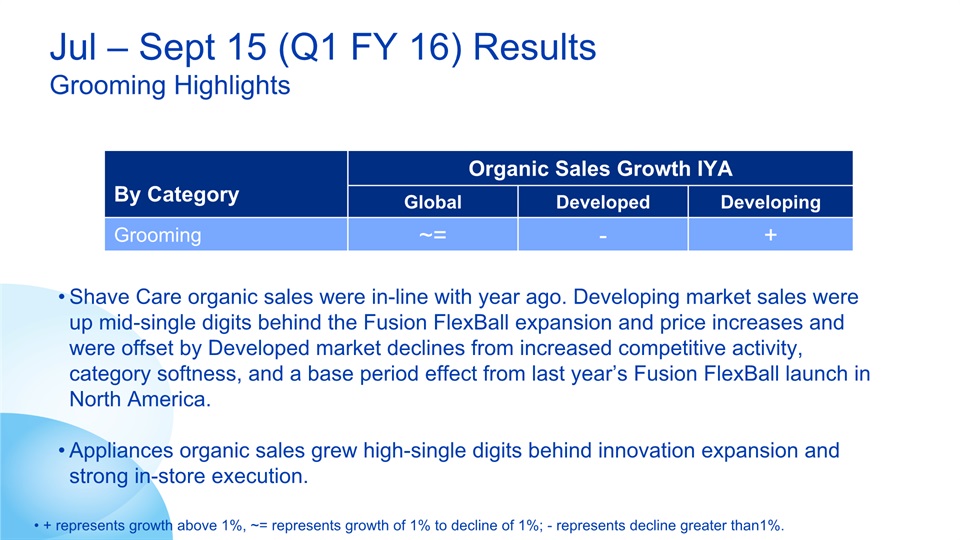
Jul – Sept 15 (Q1 FY 16) ResultsGrooming Highlights Shave Care organic sales were in-line with year ago. Developing market sales were up mid-single digits behind the Fusion FlexBall expansion and price increases and were offset by Developed market declines from increased competitive activity, category softness, and a base period effect from last year’s Fusion FlexBall launch in North America.Appliances organic sales grew high-single digits behind innovation expansion and strong in-store execution. By Category Organic Sales Growth IYA Global Developed Developing Grooming ~= - + + represents growth above 1%, ~= represents growth of 1% to decline of 1%; - represents decline greater than1%.
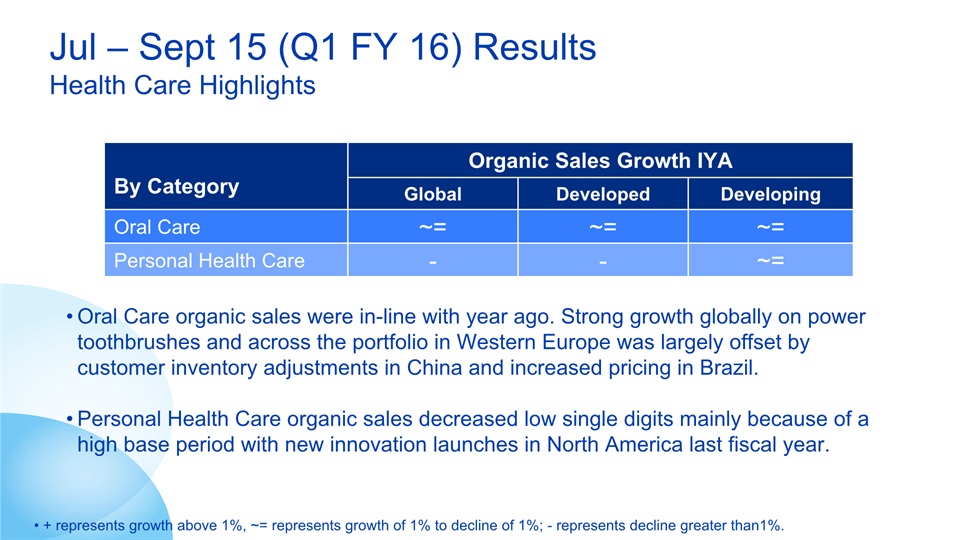
Jul – Sept 15 (Q1 FY 16) ResultsHealth Care Highlights Oral Care organic sales were in-line with year ago. Strong growth globally on power toothbrushes and across the portfolio in Western Europe was largely offset by customer inventory adjustments in China and increased pricing in Brazil.Personal Health Care organic sales decreased low single digits mainly because of a high base period with new innovation launches in North America last fiscal year. By Category Organic Sales Growth IYA Global Developed Developing Oral Care ~= ~= ~= Personal Health Care - - ~= + represents growth above 1%, ~= represents growth of 1% to decline of 1%; - represents decline greater than1%.
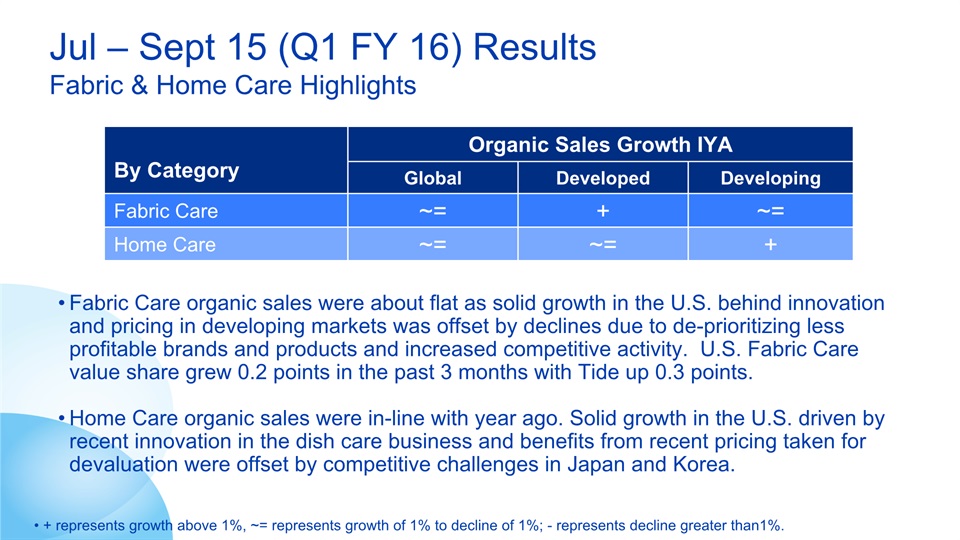
Jul – Sept 15 (Q1 FY 16) ResultsFabric & Home Care Highlights Fabric Care organic sales were about flat as solid growth in the U.S. behind innovation and pricing in developing markets was offset by declines due to de-prioritizing less profitable brands and products and increased competitive activity. U.S. Fabric Care value share grew 0.2 points in the past 3 months with Tide up 0.3 points.Home Care organic sales were in-line with year ago. Solid growth in the U.S. driven by recent innovation in the dish care business and benefits from recent pricing taken for devaluation were offset by competitive challenges in Japan and Korea. + represents growth above 1%, ~= represents growth of 1% to decline of 1%; - represents decline greater than1%. By Category Organic Sales Growth IYA Global Developed Developing Fabric Care ~= + ~= Home Care ~= ~= +
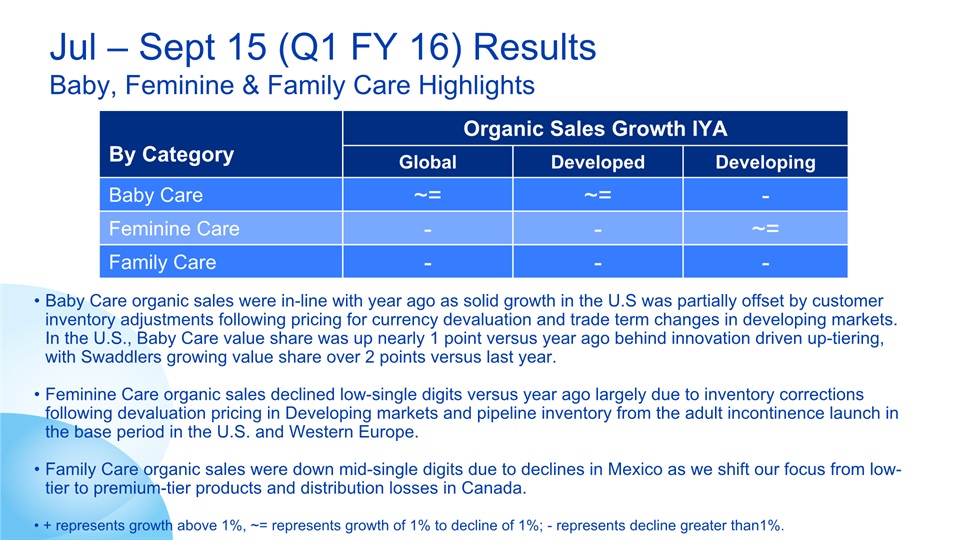
Jul – Sept 15 (Q1 FY 16) ResultsBaby, Feminine & Family Care Highlights Baby Care organic sales were in-line with year ago as solid growth in the U.S was partially offset by customer inventory adjustments following pricing for currency devaluation and trade term changes in developing markets. In the U.S., Baby Care value share was up nearly 1 point versus year ago behind innovation driven up-tiering, with Swaddlers growing value share over 2 points versus last year.Feminine Care organic sales declined low-single digits versus year ago largely due to inventory corrections following devaluation pricing in Developing markets and pipeline inventory from the adult incontinence launch in the base period in the U.S. and Western Europe.Family Care organic sales were down mid-single digits due to declines in Mexico as we shift our focus from low-tier to premium-tier products and distribution losses in Canada. By Category Organic Sales Growth IYA Global Developed Developing Baby Care ~= ~= - Feminine Care - - ~= Family Care - - - + represents growth above 1%, ~= represents growth of 1% to decline of 1%; - represents decline greater than1%.

FY 2016 Guidance
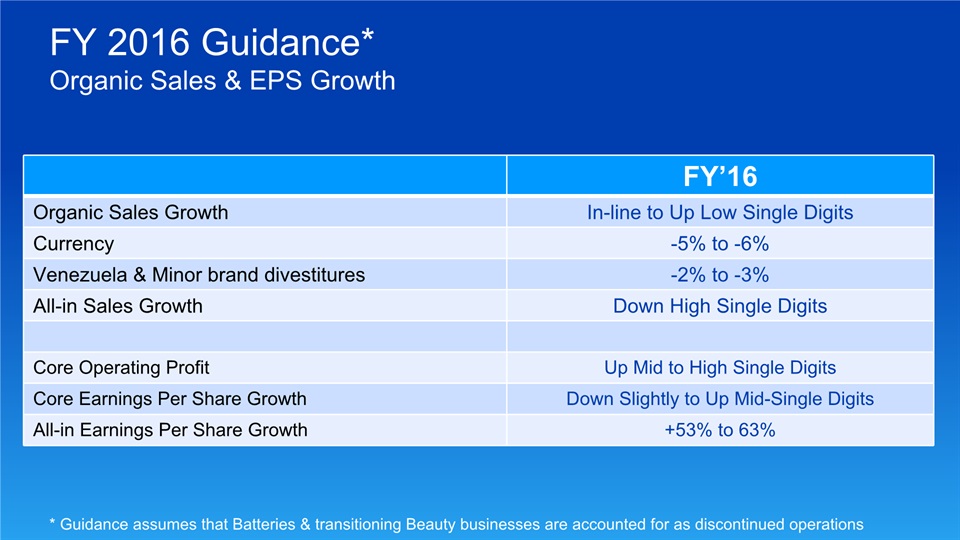
FY 2016 Guidance*Organic Sales & EPS Growth FY’16 Organic Sales Growth In-line to Up Low Single Digits Currency -5% to -6% Venezuela & Minor brand divestitures -2% to -3% All-in Sales Growth Down High Single Digits Core Operating Profit Up Mid to High Single Digits Core Earnings Per Share Growth Down Slightly to Up Mid-Single Digits All-in Earnings Per Share Growth +53% to 63% * Guidance assumes that Batteries & transitioning Beauty businesses are accounted for as discontinued operations
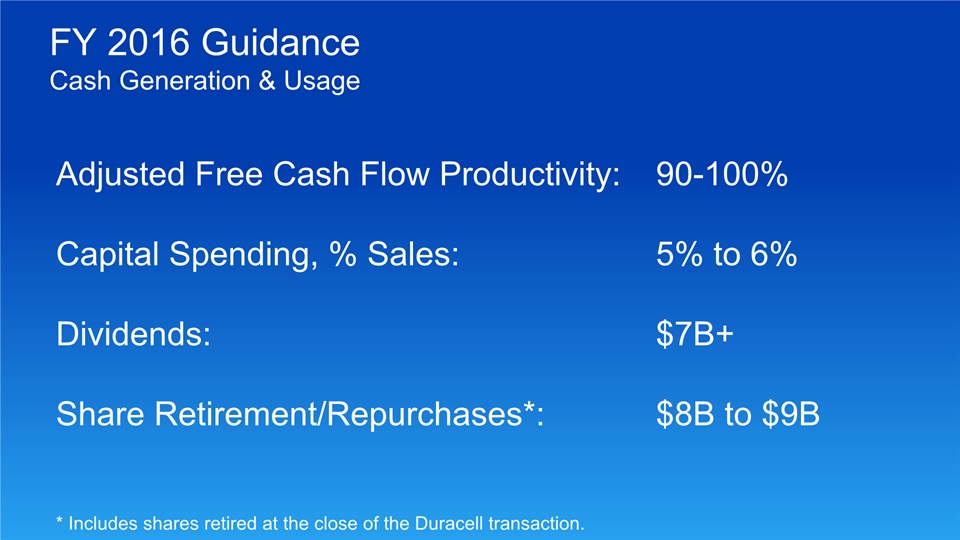
FY 2016 GuidanceCash Generation & Usage Adjusted Free Cash Flow Productivity: 90-100%Capital Spending, % Sales: 5% to 6%Dividends: $7B+Share Retirement/Repurchases*: $8B to $9B * Includes shares retired at the close of the Duracell transaction.

FY 2016 GuidancePotential Headwinds Not Included in Guidance Further foreign currency weaknessChange in market growth rates Unrest in the Middle East, Russia & the UkraineMarkets like Argentina and Brazil – with softened market conditions

FY 2016 GuidancePotential Tailwinds Not Included in Guidance Strengthening of foreign currencies Expansion of marketsU.S. economic growth accelerates

Forward Looking Statements Certain statements in this release or presentation, other than purely historical information, including estimates, projections, statements relating to our business plans, objectives, and expected operating results, and the assumptions upon which those statements are based, are “forward-looking statements” within the meaning of the Private Securities Litigation Reform Act of 1995, Section 27A of the Securities Act of 1933 and Section 21E of the Securities Exchange Act of 1934. These forward-looking statements generally are identified by the words “believe,” “project,” “expect,” “anticipate,” “estimate,” “intend,” “strategy,” “future,” “opportunity,” “plan,” “may,” “should,” “will,” “would,” “will be,” “will continue,” “will likely result,” and similar expressions. Forward-looking statements are based on current expectations and assumptions, which are subject to risks and uncertainties that may cause results to differ materially from those expressed or implied in the forward-looking statements. We undertake no obligation to update or revise publicly any forward-looking statements, whether because of new information, future events or otherwise. Risks and uncertainties to which our forward-looking statements are subject include, without limitation: (1) the ability to successfully manage global financial risks, including foreign currency fluctuations, currency exchange or pricing controls and localized volatility; (2) the ability to successfully manage local, regional or global economic volatility, including disruptions in credit markets, reduced market growth rates or changes affecting our credit rating, and generate sufficient income and cash flow to allow the Company to effect the expected share repurchases and dividend payments; (3) the ability to maintain key manufacturing and supply arrangements (including sole supplier and sole manufacturing plant arrangements) and manage disruption of business due to factors outside of our control, such as natural disasters and acts of war or terrorism; (4) the ability to successfully manage cost fluctuations and pressures, including commodity prices, raw materials, labor costs, energy costs and pension and health care costs, and achieve cost savings described in our announced productivity plan; (5) the ability to stay on the leading edge of innovation, obtain necessary intellectual property protections and successfully respond to technological advances attained by, and patents granted to, competitors; (6) the ability to compete with our local and global competitors in new and existing sales channels by successfully responding to competitive factors, including prices, promotional incentives and trade terms for products; (7) the ability to manage and maintain key customer relationships; (8) the ability to protect our reputation and brand equity by successfully managing real or perceived issues, including concerns about safety, quality, efficacy or similar matters that may arise; (9) the ability to successfully manage the financial, legal, reputational and operational risk associated with third party relationships, such as our suppliers, contractors and external business partners; (10) the ability to rely on and maintain key information technology systems and networks (including Company and third-party systems and networks) and maintain the security and functionality of such systems and networks and the data contained therein; (11) the ability to successfully manage regulatory and legal requirements and matters (including, without limitation, those laws and regulations involving product liability, intellectual property, antitrust, privacy, accounting standards and environmental) and to resolve pending matters within current estimates; (12) the ability to manage changes in applicable tax laws and regulations; (13) the ability to successfully manage our portfolio optimization strategy, as well as ongoing acquisition, divestiture and joint venture activities, to achieve the Company’s overall business strategy, without impacting the delivery of base business objectives; and (14) the ability to successfully achieve productivity improvements and manage ongoing organizational changes, while successfully identifying, developing and retaining particularly key employees, especially in key growth markets where the availability of skilled or experienced employees may be limited. For additional information concerning factors that could cause actual results to materially differ from those projected herein, please refer to our most recent 10-K, 10-Q and 8K reports.
The Procter & Gamble Company Regulation G Reconciliation of Non-GAAP Measures
In accordance with the SEC's Regulation G, the following provides definitions of the non-GAAP measures used in Procter & Gamble's October 23, 2015 earnings call and associated slides and the reconciliation to the most closely related GAAP measure. The measures provided are as follows:
|
1.
|
Organic Sales Growth—pages 1 and 2
|
|
2.
|
Core EPS and Currency-Neutral Core EPS—pages 3-5
|
|
3.
|
Core Operating Profit Margin—page 6
|
|
4.
|
Core Gross Margin—page 6
|
|
5.
|
Core Effective Tax Rate—page 6
|
|
6.
|
Free Cash Flow and Adjusted Free Cash Flow—page 7
|
|
7.
|
Adjusted Free Cash Flow Productivity—page 7
|
1. Organic sales growth: Organic sales growth is a non-GAAP measure of sales growth excluding the impacts of Venezuela deconsolidation, acquisitions, divestitures and foreign exchange from year-over-year comparisons. We believe this provides investors with a more complete understanding of underlying sales trends by providing sales growth on a consistent basis. Organic sales is also one of the measures used to evaluate senior management and is a factor in determining their at-risk compensation.
The reconciliation of reported sales growth to organic sales is as follows:
|
Three Months Ended
September 30, 2015
|
Net Sales Growth
|
Foreign Exchange Impact
|
Acquisition/
Divestiture Impact* |
Organic Sales Growth
|
|||
|
Beauty
|
(12)%
|
7%
|
3%
|
(2)%
|
|||
|
Grooming
|
(14)%
|
13%
|
1%
|
-
|
|||
|
Health Care
|
(11)%
|
9%
|
1%
|
(1)%
|
|||
|
Fabric Care and Home Care
|
(11)%
|
9%
|
2%
|
-
|
|||
|
Baby, Feminine and Family Care
|
(12)%
|
8%
|
1%
|
(3)%
|
|||
|
Total P&G
|
(12)%
|
9%
|
2%
|
(1)%
|
*Acquisition/Divestiture Impact also includes the Venezuela deconsolidation, the mix impacts of acquisitions and divestitures and rounding impacts necessary to reconcile net sales to organic sales.
Organic Sales
Prior Periods
|
Total Company
|
Net Sales Growth
|
Foreign Exchange Impact
|
Acquisition/ Divestiture Impact*
|
Organic Sales Growth
|
||||
|
JAS 2014
|
-
|
2%
|
-
|
2%
|
||||
|
OND 2014
|
(4)%
|
6%
|
-
|
2%
|
||||
|
JFM 2015
|
(7)%
|
8%
|
-
|
1%
|
||||
|
AMJ 2015
|
(9)%
|
9%
|
1%
|
1%
|
||||
*Acquisition/Divestiture Impact includes volume and mix impacts of acquired and divested businesses, as well as rounding impacts necessary to reconcile net sales to organic sales.
Guidance
|
Total Company
|
Net Sales Growth
|
Foreign Exchange Impact
|
Acquisition/ Divestiture Impact*
|
Organic Sales Growth
|
||||
|
FY 2016
Estimate
|
Down high single
digits
|
(5)% to (6)%
|
(2)% to (3)%
|
In line to up low single digits
|
*Acquisition/Divestiture Impact also includes the Venezuela deconsolidation, the mix impacts of acquisitions and divestitures and rounding impacts necessary to reconcile net sales to organic sales
The Core earnings measures included in the following reconciliation tables refer to the equivalent GAAP measures adjusted as applicable for the following items:
|
•
|
charge in 2015 related to the deconsolidation for our Venezuelan subsidiaries
|
|
•
|
charges for incremental restructuring due to increased focus on productivity and cost savings
|
|
•
|
charges for balance sheet impacts from the devaluation of the foreign currency exchange rate in Venezuela prior to deconsolidation and
|
|
•
|
charges for certain European legal matters.
|
We do not view these items to be part of our sustainable results. We believe that these Core measures provide an important perspective of underlying business trends and results and provide a more comparable measure of year-on-year results per share growth.
2. Core EPS and currency-neutral Core EPS: Core EPS is a measure of the Company's diluted net earnings per share from continuing operations adjusted as indicated below. Core EPS is also one of the measures used to evaluate senior management and is a factor in determining their at-risk compensation.
Currency-neutral Core EPS is a measure of the Company's Core EPS excluding the incremental current year impact of foreign exchange. We believe the currency-neutral Core EPS measure provides a more comparable view of year-on-year earnings per share growth. The table below provides a reconciliation of diluted net earnings per share to Core EPS and Core EPS to Currency-neutral Core EPS:
|
Three Months Ended September 30
|
||||||||
|
2015
|
2014
|
|||||||
|
Diluted Net Earnings Per Share from Continuing Operations
|
$
|
0.96
|
$
|
0.93
|
||||
|
Incremental Restructuring
|
0.02
|
0.02
|
||||||
|
Venezuela Balance Sheet Remeasurement
|
-
|
0.04
|
||||||
|
Core EPS
|
$
|
0.98
|
$
|
0.99
|
||||
|
Percentage change vs. prior period
|
(1
|
)%
|
||||||
|
Currency Impact to Earnings
|
$
|
0.13
|
||||||
|
Currency-Neutral Core EPS
|
$
|
1.11
|
||||||
|
Percentage change vs. prior period
|
12
|
%
|
||||||
Note – All reconciling items are presented net of tax. Tax effects are calculated consistent with the nature of the underlying transaction.
Guidance
|
Total Company
|
Diluted EPS Growth
|
Impact of Incremental Non-Core Items*
|
Core EPS Growth
|
||||
|
FY 2016 (Estimate)
|
53% to 63%
|
(48)% to (64)%
|
Down slightly to up mid-single digits
|
*Includes change in discontinued operations (includes Batteries impairments) and the absence of significant one-time items (e.g. Venezuela charge)
Core EPS and Currency-Neutral Core EPS
Prior Periods
|
|
|
JAS 14
|
|
|
JAS 13
|
|
|
OND 14
|
|
|
OND 13
|
|
|
JFM 15
|
|
|
JFM 14
|
|
|
AMJ 15
|
|
|
AMJ 14
|
|
|
|
|
|
|
|
|
|
|
|
|
|
|
|
|
|
|
|
|
|
|
|
|
|
|
Diluted Net Earnings Per Share from Continuing Operations, attributable to P&G
|
$
|
0.93
|
|
$
|
0.96
|
|
$
|
0.92
|
|
$
|
1.00
|
|
$
|
0.82
|
|
$
|
0.83
|
|
$
|
0.17
|
|
$
|
0.83
|
|
Incremental Restructuring
|
|
0.02
|
|
|
0.02
|
|
|
0.02
|
|
|
0.02
|
|
|
0.06
|
|
|
0.04
|
|
|
0.06
|
|
|
0.03
|
|
Venezuela B/S Remeasurement & Devaluation Impacts
|
|
0.04
|
|
|
-
|
|
|
-
|
|
|
-
|
|
|
-
|
|
|
0.10
|
|
|
-
|
|
|
-
|
|
Charges for Pending European Legal Matters
|
|
-
|
|
|
-
|
|
|
0.01
|
|
|
-
|
|
|
-
|
|
|
-
|
|
|
(0.01)
|
|
|
0.02
|
|
Venezuela Deconsolidation Charge
|
|
-
|
|
|
-
|
|
|
-
|
|
|
-
|
|
|
-
|
|
|
-
|
|
|
0.71
|
|
|
-
|
|
Rounding
|
|
-
|
|
|
(0.01)
|
|
|
-
|
|
|
0.01
|
|
|
0.01
|
|
|
(0.01)
|
|
|
-
|
|
|
0.01
|
|
Core EPS
|
$
|
0.99
|
|
$
|
0.97
|
|
$
|
0.95
|
|
$
|
1.03
|
|
$
|
0.89
|
|
$
|
0.96
|
|
$
|
0.93
|
|
$
|
0.89
|
|
|
|
|
|
|
|
|
|
|
|
|
|
|
|
|
|
|
|
|
|
|
|
|
|
|
Percentage change vs. prior period
|
|
2%
|
|
|
|
|
|
(8)%
|
|
|
|
|
|
(7)%
|
|
|
|
|
|
4%
|
|
|
|
|
|
|
|
|
|
|
|
|
|
|
|
|
|
|
|
|
|
|
|
|
|
|
|
|
|
Currency Impact to Earnings
|
|
0.07
|
|
|
|
|
|
0.15
|
|
|
|
|
|
0.18
|
|
|
|
|
|
0.13
|
|
|
|
|
Currency-Neutral Core EPS
|
$
|
1.06
|
|
|
|
|
$
|
1.10
|
|
|
|
|
$
|
1.07
|
|
|
|
|
$
|
1.06
|
|
|
|
|
Percentage change vs. prior period
|
|
9%
|
|
|
|
|
|
7%
|
|
|
|
|
|
11%
|
|
|
|
|
|
19%
|
|
|
|
3. Core rating profit margin: This is a measure of the Company's operating margin adjusted for items as indicated below.
|
JAS 15
|
JAS 14
|
|||
|
Operating Profit Margin
|
22.8%
|
19.4%
|
||
|
Incremental Restructuring
|
0.4%
|
0.4%
|
||
|
Venezuela Balance Sheet Revaluation and Devaluation
|
-
|
0.7%
|
||
|
Core Operating Profit Margin
|
23.2%
|
20.5%
|
||
|
Basis Point Change
|
270
|
4. Core gross margin: This is a measure of the Company's gross margin adjusted for items as indicated below.
|
JAS 15
|
JAS 14
|
|||
|
Gross Margin
|
50.7%
|
48.1%
|
||
|
Incremental Restructuring
|
0.4%
|
0.5%
|
||
|
Core Gross Margin
|
51.1%
|
48.6%
|
||
|
Basis Point Change
|
250
|
5. Core tax rate: This is a measure of the Company's tax rate on continuing operations adjusted for items as indicated below.
|
JAS 15
|
JAS 14
|
|||
|
Effective Tax Rate
|
24.0%
|
22.6%
|
||
|
Incremental Restructuring
|
(0.1)%
|
(0.1)%
|
||
|
Venezuela Balance Sheet Revaluation and Devaluation
|
-
|
0.1%
|
||
|
Rounding
|
-
|
(0.1)%
|
||
|
Core Tax Rate
|
23.9%
|
22.5%
|
||
|
Basis Point Change
|
140
|
6. Free cash flow and adjusted free cash flow: Free cash flow is defined as operating cash flow less capital spending. Adjusted free cash flow is free cash flow plus tax payments for the Pet Care divestiture. We view these as important measures because they are a factor used in determining the amount of cash available for dividends and discretionary investment. The reconciliation of free cash flow and adjusted free cash flow is provided below (amounts in millions):
|
Operating
Cash Flow
|
Capital Spending
|
Free Cash Flow
|
Cash Tax Payment Pet-Care Sale
|
Adjusted Free Cash Flow
|
|||||||||||||||
|
Three Months Ended September 30, 2015
|
$
|
3,538
|
$
|
(532
|
)
|
$
|
3,006
|
-
|
$
|
3,006
|
|||||||||
|
Year Ended June 30, 2015
|
14,608
|
(3,736
|
)
|
10,872
|
729
|
11,601
|
|||||||||||||
7. Adjusted free cash flow productivity: Adjusted free cash flow productivity is defined as the ratio of free cash flow (or adjusted free cash flow, as applicable) to net earnings excluding impairment charges on the batteries business. The Company's long-term target is to generate annual adjusted free cash flow at or above 90 percent of net earnings. Adjusted free cash flow productivity is also a measure used to evaluate senior management and is a factor in determining their at-risk compensation. The reconciliation of adjusted free cash flow productivity is provided below (dollar amounts in millions):
|
Adjusted Free Cash Flow
|
Net Earnings
|
Impairment & Deconsolidation Charges
|
Net Earnings Excl.
Impairment Charges |
Adjusted Free Cash Flow Productivity
|
|||||||||||||||
|
Three Months Ended September 30, 2015
|
$
|
3,006
|
$
|
2,635
|
$
|
350
|
$
|
2,985
|
101%
|
||||||||||
|
Year Ended June 30, 2015
|
11,601
|
7,144
|
4,187
|
11,331
|
102%
|
||||||||||||||