Attached files
| file | filename |
|---|---|
| 8-K - 8-K - POPULAR, INC. | d201538d8k.htm |
Exhibit 99.1
|
|

Investor Presentation
Third Quarter 2015
|
|
Forward Looking Statements
The information contained in this presentation contains forward-looking statements within the meaning of the Private Securities Litigation
Reform Act of 1995. These forward-looking statements are based on management’s current expectations and are subject to risks and uncertainties that may cause the Corporation’s actual results to differ materially from any future results expressed or implied by such forward-looking statements. Please refer to our Annual Report on Form 10-K for the year ended December 31, 2014, the Quarterly Reports on Form 10-
Q for the quarters ended March 31, 2015 and June 30, 2015 and our other filings with the SEC for a discussion of those factors that could impact our future results. Other than to the extent required by applicable law, the Corporation undertakes no obligation to publicly update or revise any forward-looking statement to reflect events or circumstances after the date of such statements.
|
|
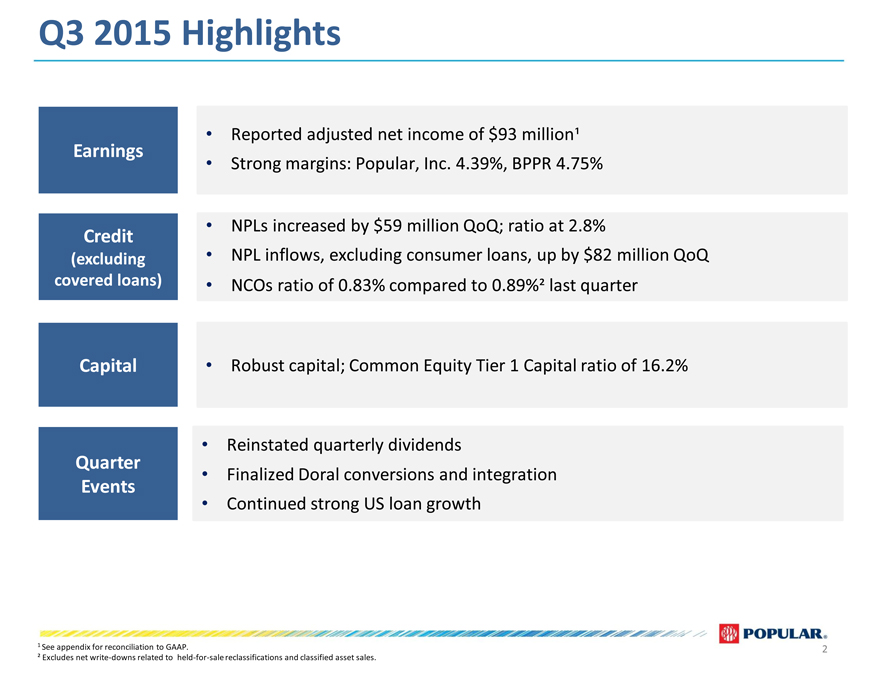
Q3 2015 Highlights
Reported adjusted net income of $93 million¹
Strong margins: Popular, Inc. 4.39%, BPPR 4.75%
NPLs increased by $59 million QoQ; ratio at 2.8%
NPL inflows, excluding consumer loans, up by $82 million QoQ
NCOs ratio of 0.83% compared to 0.89%² last quarter
Robust capital; Common Equity Tier 1 Capital ratio of 16.2%
Reinstated quarterly dividends
Finalized Doral conversions and integration
Continued strong US loan growth
Earnings
Credit
(excluding covered loans)
Capital
Quarter
Events
| 1 |
|
See appendix for reconciliation to GAAP. |
² Excludes net write-downs related to held-for-sale reclassifications and classified asset sales.
| 2 |
|
|
|
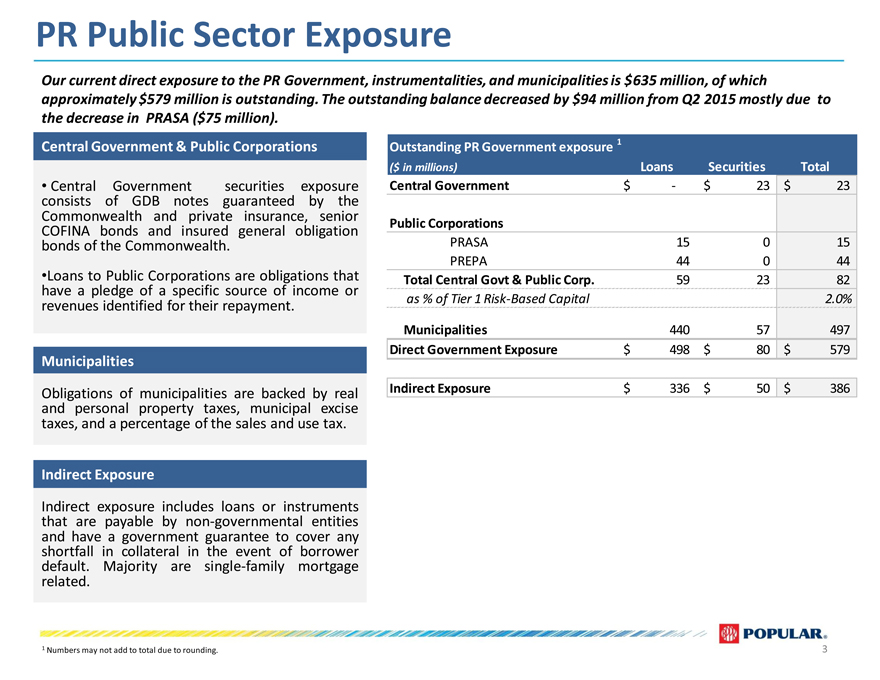
PR Public Sector Exposure
Our current direct exposure to the PR Government, instrumentalities, and municipalities is $ 635 million, of which
approximately $579 million is outstanding. The outstanding balance decreased by $94 million from Q2 2015 mostly due to
the decrease in PRASA ($75 million).
Central Government & Public Corporations Outstanding PR Government exposure 1
($ in millions) Loans Securities Total
Central Government securities exposure Central Government $ — $ 23 $ 23
consists of GDB notes guaranteed by the
Commonwealth and private insurance, senior Public Corporations
COFINA bonds and insured general obligation
bonds of the Commonwealth. PRASA 15 0 15
PREPA 44 0 44
Loans to Public Corporations are obligations that Total Central Govt & Public Corp. 59 23 82
have a pledge of a specific source of income or
revenues identified for their repayment. as % of Tier 1 Risk-Based Capital 2.0%
Municipalities 440 57 497
Direct Government Exposure $ 498 $ 80 $ 579
Municipalities
Obligations of municipalities are backed by real Indirect Exposure $ 336 $ 50 $ 386
and personal property taxes, municipal excise
taxes, and a percentage of the sales and use tax.
Indirect Exposure
Indirect exposure includes loans or instruments
that are payable by non-governmental entities
and have a government guarantee to cover any
shortfall in collateral in the event of borrower
default. Majority are single-family mortgage
related.
| 1 |
|
Numbers may not add to total due to rounding. |
| 3 |
|
|
|
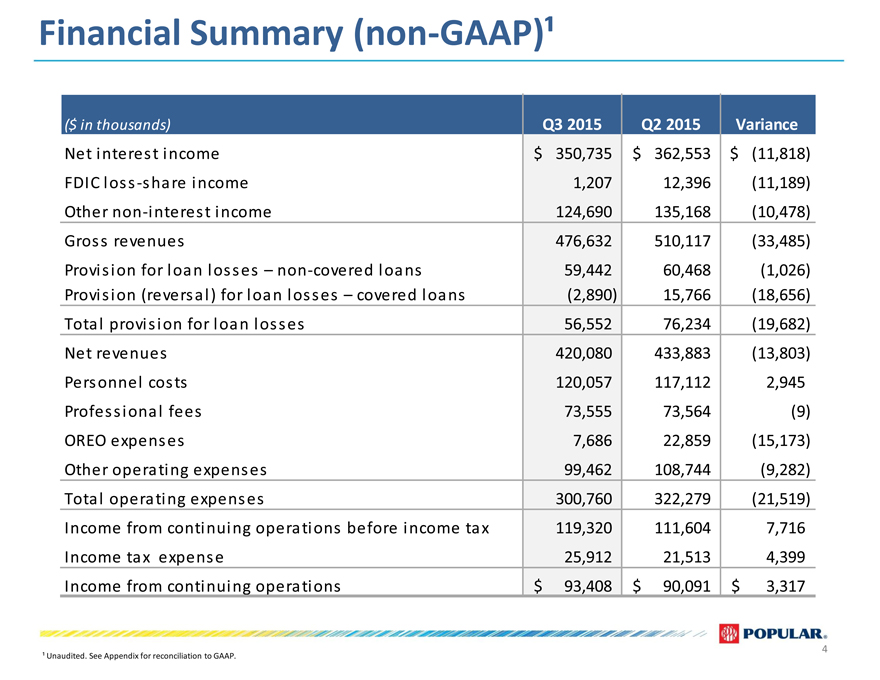
Financial Summary (non-GAAP)¹
($ in thousands) Q3 2015 Q2 2015 Variance
Net interest income $ 350,735 $ 362,553 $ (11,818)
FDIC loss -share income 1,207 12,396 (11,189)
Other non -interest income 124,690 135,168 (10,478)
Gross revenues 476,632 510,117 (33,485)
Provision for loan losses – non -covered loans 59,442 60,468 (1,026)
Provision (reversal) for loan losses – covered loans (2,890) 15,766 (18,656)
Total provision for loan losses 56,552 76,234 (19,682)
Net revenues 420,080 433,883 (13,803)
Personnel costs 120,057 117,112 2,945
Professional fees 73,555 73,564 (9)
OREO expenses 7,686 22,859 (15,173)
Other operating expenses 99,462 108,744 (9,282)
Total operating expenses 300,760 322,279 (21,519)
Income from continuing operations before income tax 119,320 111,604 7,716
Income tax expense 25,912 21,513 4,399
Income from continuing operations $ 93,408 $ 90,091 $ 3,317
¹ Unaudited. See Appendix for reconciliation to GAAP.
| 4 |
|
|
|
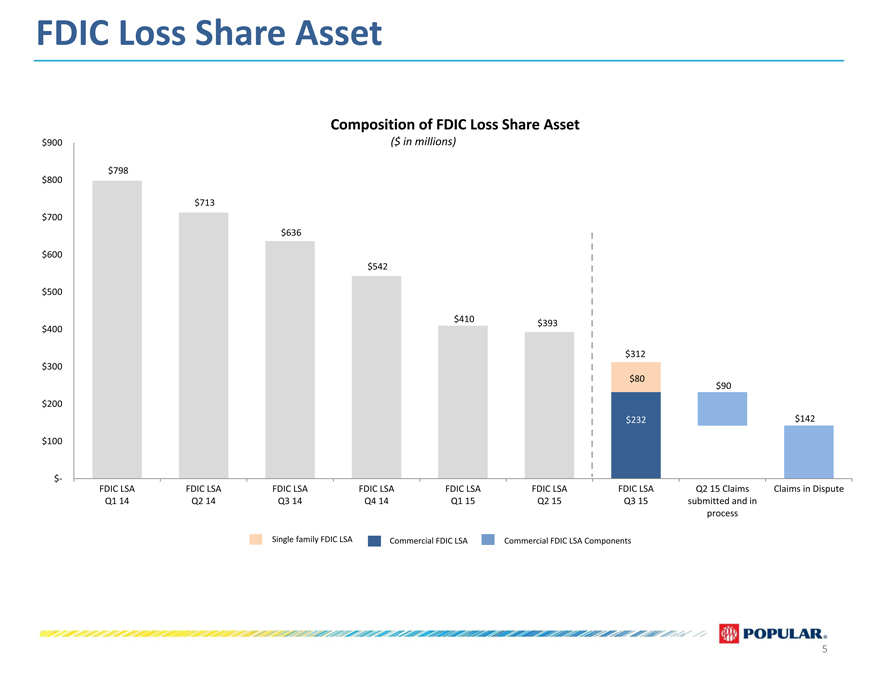
FDIC Loss Share Asset
Composition of FDIC Loss Share Asset
$900 ($ in millions)
$798
$800
$713
$700
$636
$600
$542
$500
$410 $393
$400
$312
$300
$80
$90
$200
$232 $142
$100
$-
FDIC LSA FDIC LSA FDIC LSA FDIC LSA FDIC LSA FDIC LSA FDIC LSA Q2 15 Claims Claims in Dispute
Q1 14 Q2 14 Q3 14 Q4 14 Q1 15 Q2 15 Q3 15 submitted and in
process
Single family FDIC LSA Commercial FDIC LSA Commercial FDIC LSA Components
| 5 |
|
|
|
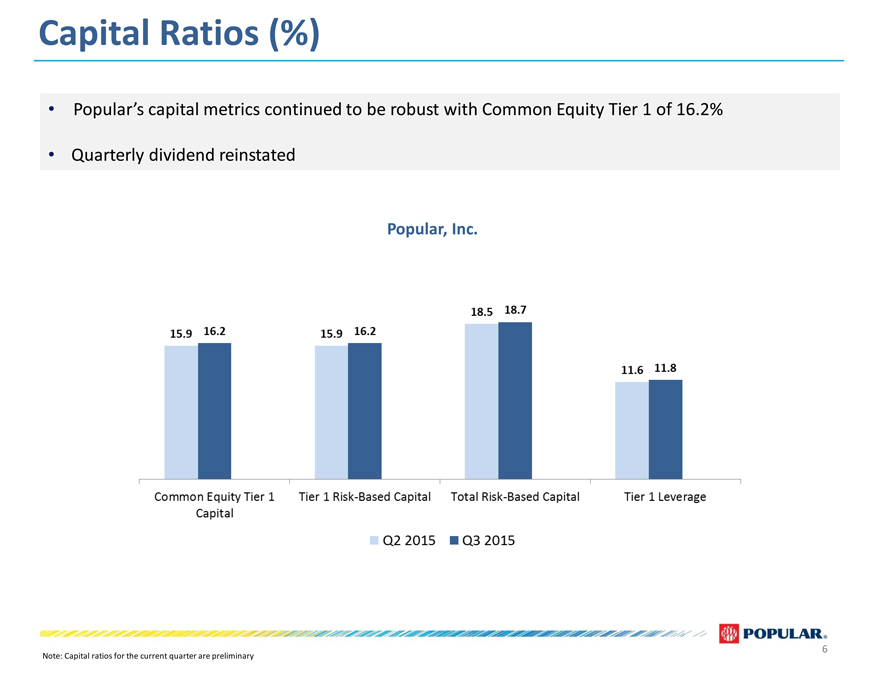
Capital Ratios (%)
Popular’s capital metrics continued to be robust with Common Equity Tier 1 of 16.2%
Quarterly dividend reinstated
Popular, Inc.
Note: Capital ratios for the current quarter are preliminary
| 6 |
|
|
|
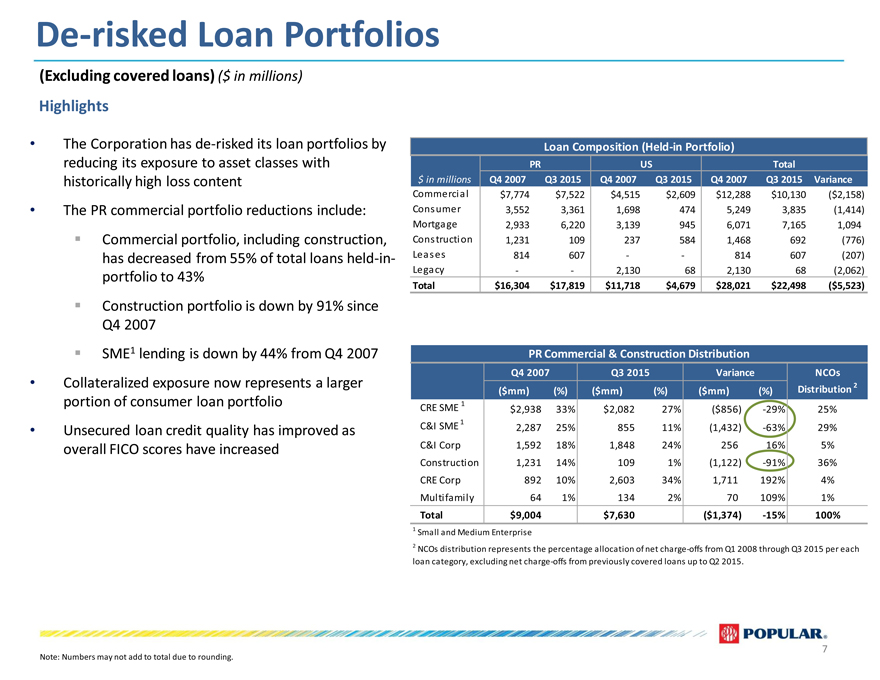
De-risked Loan Portfolios
(Excluding covered loans) ($ in millions)
Highlights
The Corporation has de-risked its loan portfolios by Loan Composition (Held-in Portfolio)
reducing its exposure to asset classes with PR US Total
historically high loss content $ in millions Q4 2007 Q3 2015 Q4 2007 Q3 2015 Q4 2007 Q3 2015 Variance
Commercial $7,774 $7,522 $4,515 $2,609 $12,288 $10,130 ($2,158)
The PR commercial portfolio reductions include: Consumer 3,552 3,361 1,698 474 5,249 3,835 (1,414)
Mortgage 2,933 6,220 3,139 945 6,071 7,165 1,094
Commercial portfolio, including construction, Construction 1,231 109 237 584 1,468 692 (776)
has decreased from 55% of total loans held-in- Leases 814 607 — — 814 607 (207)
portfolio to 43% Legacy —— 2,130 68 2,130 68 (2,062)
Total $16,304 $17,819 $11,718 $4,679 $28,021 $22,498 ($5,523)
Construction portfolio is down by 91% since
Q4 2007
SME1 lending is down by 44% from Q4 2007 PR Commercial & Construction Distribution
Q4 2007 Q3 2015 Variance NCOs
Collateralized exposure now represents a larger 2
($mm) (%) ($mm) (%) ($mm) (%) Distribution
portion of consumer loan portfolio CRE SME 1 $2,938 33% $2,082 27% ($856) -29% 25%
Unsecured loan credit quality has improved as C&I SME 1 2,287 25% 855 11% (1,432) -63% 29%
overall FICO scores have increased C&I Corp 1,592 18% 1,848 24% 256 16% 5%
Construction 1,231 14% 109 1% (1,122) -91% 36%
CRE Corp 892 10% 2,603 34% 1,711 192% 4%
Multifamily 64 1% 134 2% 70 109% 1%
Total $9,004 $7,630 ($1,374) -15% 100%
| 1 |
|
Small and Medium Enterprise |
| 2 |
|
NCOs distribution represents the percentage allocation of net charge-offs from Q1 2008 through Q3 2015 per each |
loan category, excluding net charge-offs from previously covered loans up to Q2 2015.
Note: Numbers may not add to total due to rounding.
| 7 |
|
|
|
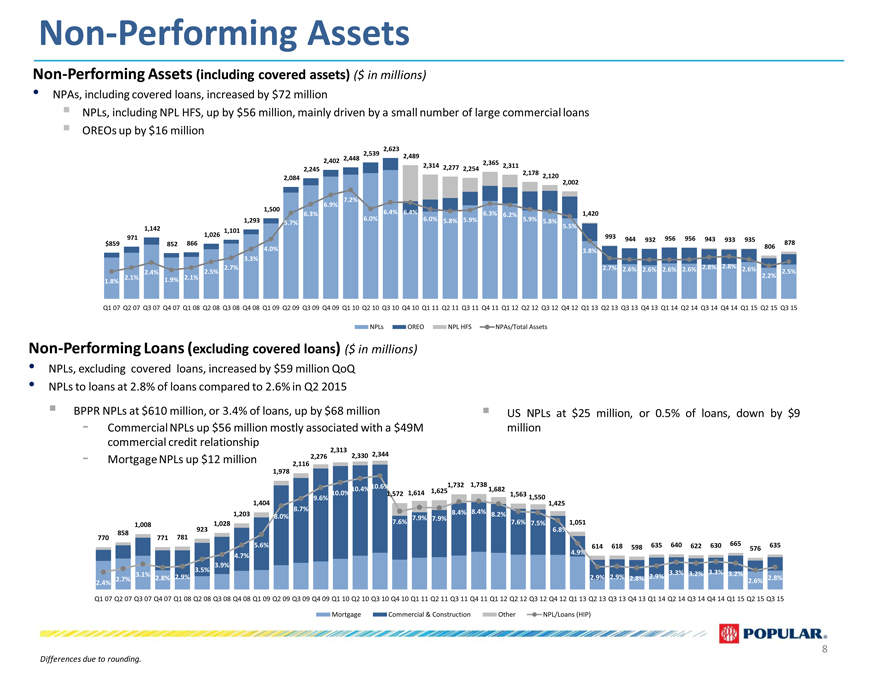
Non-Performing Assets
Non-Performing Assets (including covered assets) ($ in millions)
NPAs, including covered loans, increased by $72 million
NPLs, including NPL HFS, up by $56 million, mainly driven by a small number of large commercial loans
OREOs up by $16 million
2,539 2,623
2,448 2,489
2,402 2,365
2,245 2,314 2,277 2,254 2,311
2,084 2,178 2,120
2,002
7.2%
6.9%
1,500 6.3% 6.4% 6.4% 6.3% 6.2% 1,420
1,293 5.7% 6.0% 6.0% 5.8% 5.9% 5.9% 5.8%
5.5%
1,142 1,101
971 1,026 993 944 932 956 956 943 933 935
$859 852 866 806 878
4.0% 3.8%
3.3%
2.4% 2.5% 2.7% 2.7% 2.6% 2.6% 2.6% 2.6% 2.8% 2.8% 2.6% 2.5%
2.1% 2.1% 2.2%
1.8% 1.9%
Q1 07 Q2 07 Q3 07 Q4 07 Q1 08 Q2 08 Q3 08 Q4 08 Q1 09 Q2 09 Q3 09 Q4 09 Q1 10 Q2 10 Q3 10 Q4 10 Q1 11 Q2 11 Q3 11 Q4 11 Q1 12 Q2 12 Q3 12 Q4 12 Q1 13 Q2 13 Q3 13 Q4 13 Q1 14 Q2 14 Q3 14 Q4 14 Q1 15 Q2 15 Q3 15
NPLs OREO NPL HFS NPAs/Total Assets
Non-Performing Loans (excluding covered loans) ($ in millions)
NPLs, excluding covered loans, increased by $59 million QoQ
NPLs to loans at 2.8% of loans compared to 2.6% in Q2 2015
BPPR NPLs at $610 million, or 3.4% of loans, up by $68 million ? US NPLs at $25 million, or 0.5% of loans, down by $9
Commercial NPLs up $56 million mostly associated with a $49M million
14.0%
commercial credit relationship
2,313
Mortgage NPLs up $12 million 2,276 2,330 2,344 12.0%
2,116
1,978
10.6% 1,732 1,738 10.0%
10.0% 10.4% 1,572 1,614 1,625 1,682 1,563
9.6% 1,550
1,404 1,425 8.0%
1,203 8.7% 8.4% 8.4% 8.2%
8.0% 7.9% 7.9%
1,008 1,028 7.6% 7.6% 7.5% 1,051
858 923 6.8% 6.0%
770 771 781
5.6% 614 618 598 635 640 622 630 665 576 635
4.7% 4.9% 4.0%
3.5% 3.9%
3.1% 3.3% 3.2% 3.3% 3.2%
2.4% 2.7% 2.8% 2.9% 2.9% 2.9% 2.8% 2.9% 2.6% 2.8% 2.0%
Q1 07 Q2 07 Q3 07 Q4 07 Q1 08 Q2 08 Q3 08 Q4 08 Q1 09 Q2 09 Q3 09 Q4 09 Q1 10 Q2 10 Q3 10 Q4 10 Q1 11 Q2 11 Q3 11 Q4 11 Q1 12 Q2 12 Q3 12 Q4 12 Q1 13 Q2 13 Q3 13 Q4 13 Q1 14 Q2 14 Q3 14 Q4 14 Q1 15 Q2 15 Q3 15 0.0%
Mortgage Commercial & Construction Other NPL/Loans (HIP)
Differences due to rounding.
| 8 |
|
|
|
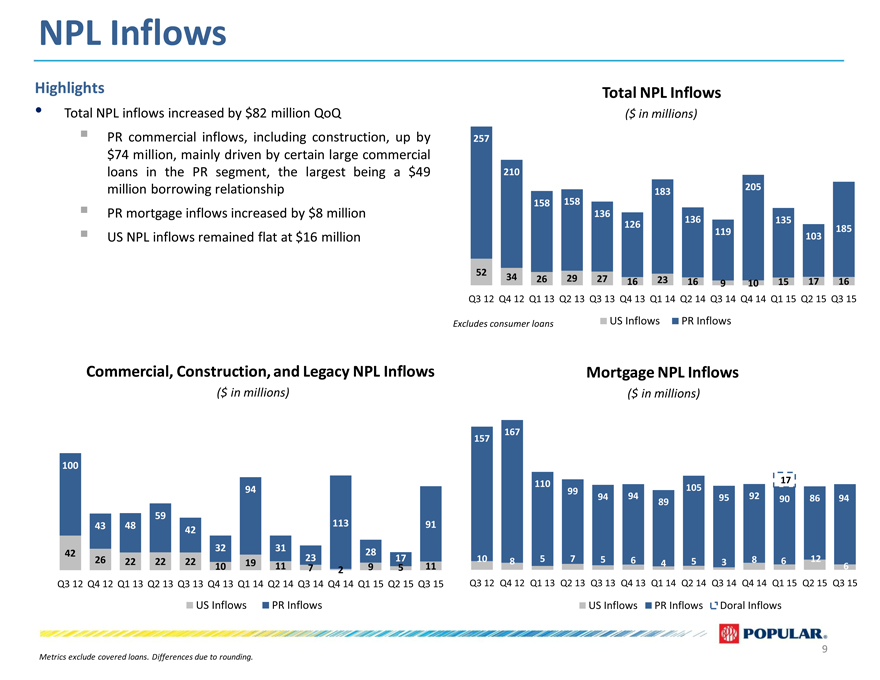
NPL Inflows
Highlights Total NPL Inflows
Total NPL inflows increased by $82 million QoQ ($ in millions)
PR commercial inflows, including construction, up by 257
$74 million, mainly driven by certain large commercial
loans in the PR segment, the largest being a $49 210
million borrowing relationship 183 205
158 158
PR mortgage inflows increased by $8 million 136
126 136 135
119 185
US NPL inflows remained flat at $16 million 103
52
34 26 29 27 16 23 16 9 10 15 17 16
Q3 12 Q4 12 Q1 13 Q2 13 Q3 13 Q4 13 Q1 14 Q2 14 Q3 14 Q4 14 Q1 15 Q2 15 Q3 15
Excludes consumer loans US Inflows PR Inflows
Commercial, Construction, and Legacy NPL Inflows Mortgage NPL Inflows
($ in millions) ($ in millions)
167
157
100
110 17
94 99 105
94 94 89 95 92 90 86 94
59
43 48 113 91
42
32 31
42 28
26 22 22 22 19 23 17 10 8 5 7 5 6 4 5 3 8 6 12
10 11 7 2 9 5 11 6
Q3 12 Q4 12 Q1 13 Q2 13 Q3 13 Q4 13 Q1 14 Q2 14 Q3 14 Q4 14 Q1 15 Q2 15 Q3 15 Q3 12 Q4 12 Q1 13 Q2 13 Q3 13 Q4 13 Q1 14 Q2 14 Q3 14 Q4 14 Q1 15 Q2 15 Q3 15
US Inflows PR Inflows US Inflows PR Inflows Doral Inflows
Metrics exclude covered loans. Differences due to rounding.
9
|
|
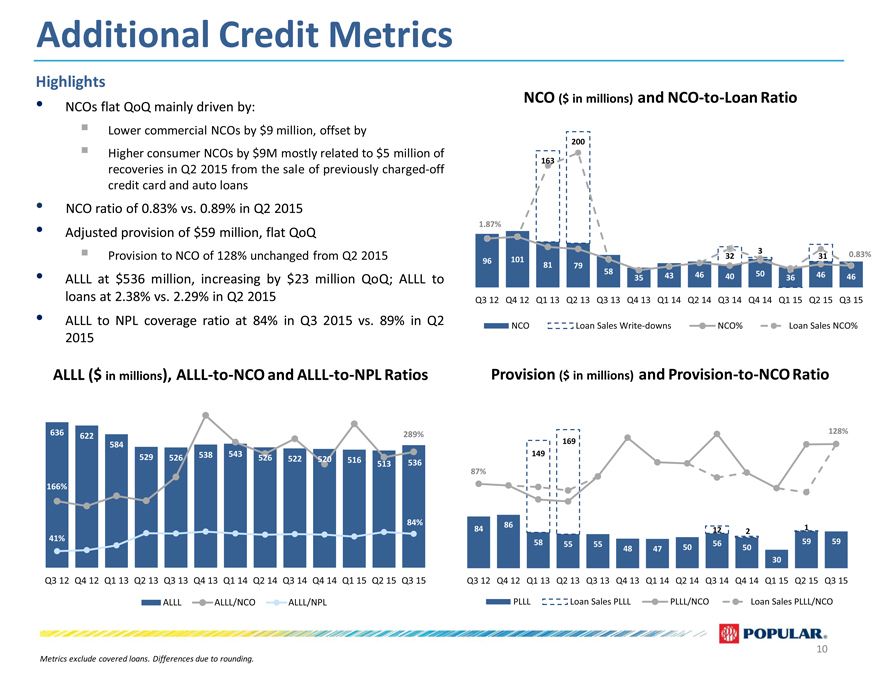
Additional Credit Metrics
Highlights
NCOs flat QoQ mainly driven by: NCO ($ in millions) and NCO-to-Loan Ratio
Lower commercial NCOs by $9 million, offset by
Higher consumer NCOs by $9M mostly related to $5 million of 200
163
recoveries in Q2 2015 from the sale of previously charged-off
credit card and auto loans
NCO ratio of 0.83% vs. 0.89% in Q2 2015
Adjusted provision of $59 million, flat QoQ 1.87%
| 3 |
|
Provision to NCO of 128% unchanged from Q2 2015 32 31 0.83%
96 101 81 79 0
ALLL at $536 million, increasing by $23 million QoQ; ALLL to 58 35 43 46 40 50 36 46 46
loans at 2.38% vs. 2.29% in Q2 2015 Q3 12 Q4 12 Q1 13 Q2 13 Q3 13 Q4 13 Q1 14 Q2 14 Q3 14 Q4 14 Q1 15 Q2 15 Q3 15
ALLL to NPL coverage ratio at 84% in Q3 2015 vs. 89% in Q2 NCO Loan Sales Write-downs NCO% Loan Sales NCO%
2015
ALLL ($ in millions), ALLL-to-NCO and ALLL-to-NPL Ratios Provision ($ in millions) and Provision-to-NCO Ratio
636 622 289% 128%
584 169
529 526 538 543 526 522 520 516 513 536 149
87%
166%
84% 86
84 12 2 1
41% 58 55 55 56 59 59
48 47 50 50
30
Q3 12 Q4 12 Q1 13 Q2 13 Q3 13 Q4 13 Q1 14 Q2 14 Q3 14 Q4 14 Q1 15 Q2 15 Q3 15 Q3 12 Q4 12 Q1 13 Q2 13 Q3 13 Q4 13 Q1 14 Q2 14 Q3 14 Q4 14 Q1 15 Q2 15 Q3 15
ALLL ALLL/NCO ALLL/NPL PLLL Loan Sales PLLL PLLL/NCO Loan Sales PLLL/NCO
Metrics exclude covered loans. Differences due to rounding.
10
|
|
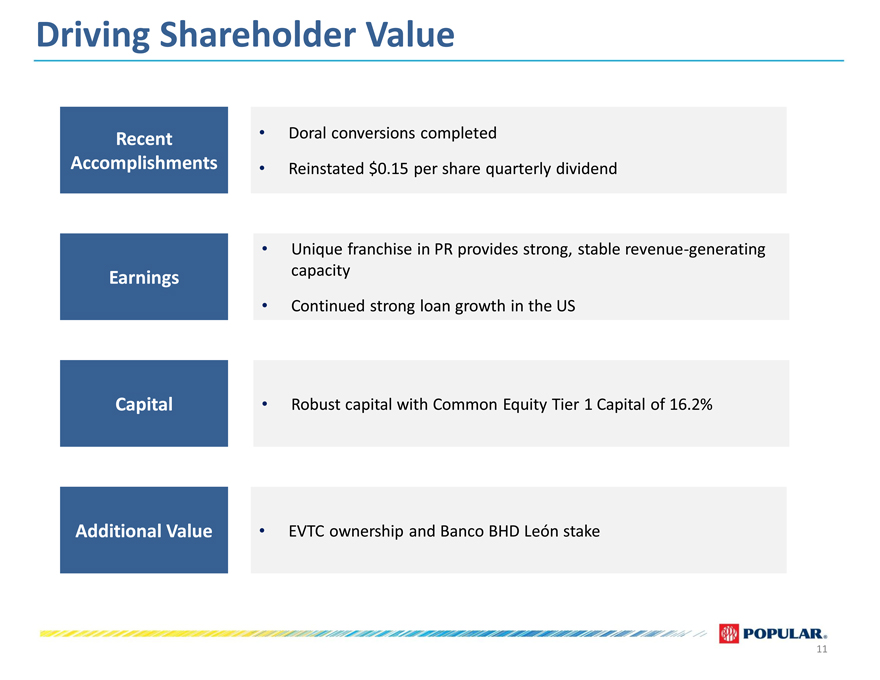
Driving Shareholder Value
Doral conversions completed
Reinstated $0.15 per share quarterly dividend
Unique franchise in PR provides strong, stable revenue-generating capacity
Continued strong loan growth in the US
Robust capital with Common Equity Tier 1 Capital of 16.2%
EVTC ownership and Banco BHD León stake
Recent
Accomplishments
Earnings
Capital
Additional Value
11
|
|
APPENDIX
Investor Presentation
Third Quarter 2015
|
|
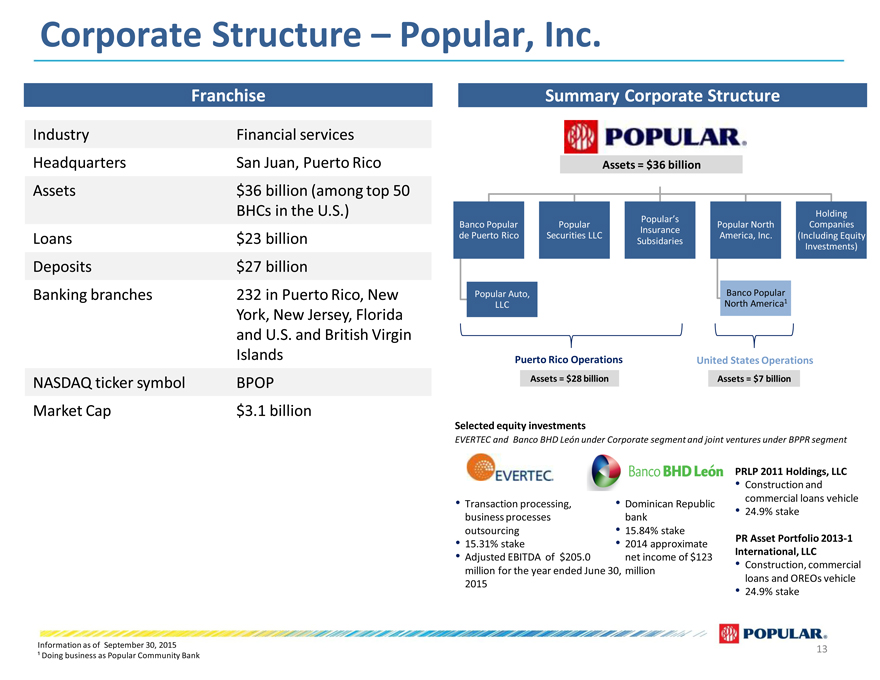
WhoCorporateWe Ar –StructurePopula , Inc.– Popular, Inc.
Franchise Summary Corporate Structure
Industry Financial services
Headquarters San Juan, Puerto Rico Assets = $36 billion
Assets $36 billion (among top 50
BHCs in the U.S.) Holding
Popular’s
Banco Popular Popular Popular North Companies
Insurance
Loans $23 billion de Puerto Rico Securities LLC America, Inc. (Including Equity
Subsidaries Investments)
Deposits $27 billion
Banking branches 232 in Puerto Rico, New Popular Auto, Banco Popular
LLC North America1
York, New Jersey, Florida
and U.S. and British Virgin
Islands Puerto Rico Operations United States Operations
NASDAQ ticker symbol BPOP Assets = $28 billion Assets = $7 billion
Market Cap $3.1 billion
Selected equity investments
EVERTEC and Banco BHD León under Corporate segment and joint ventures under BPPR segment
PRLP 2011 Holdings, LLC
Construction and
Transaction processing, Dominican Republic commercial loans vehicle
business processes bank 24.9% stake
outsourcing 15.84% stake
15.31% stake 2014 approximate PR Asset Portfolio 2013-1
Adjusted EBITDA of $205.0 net income of $123 International, LLC
million for the year ended June 30, million Construction, commercial
loans and OREOs vehicle
2015 24.9% stake
Information as of September 30, 2015 ¹ Doing business as Popular Community Bank
13
|
|
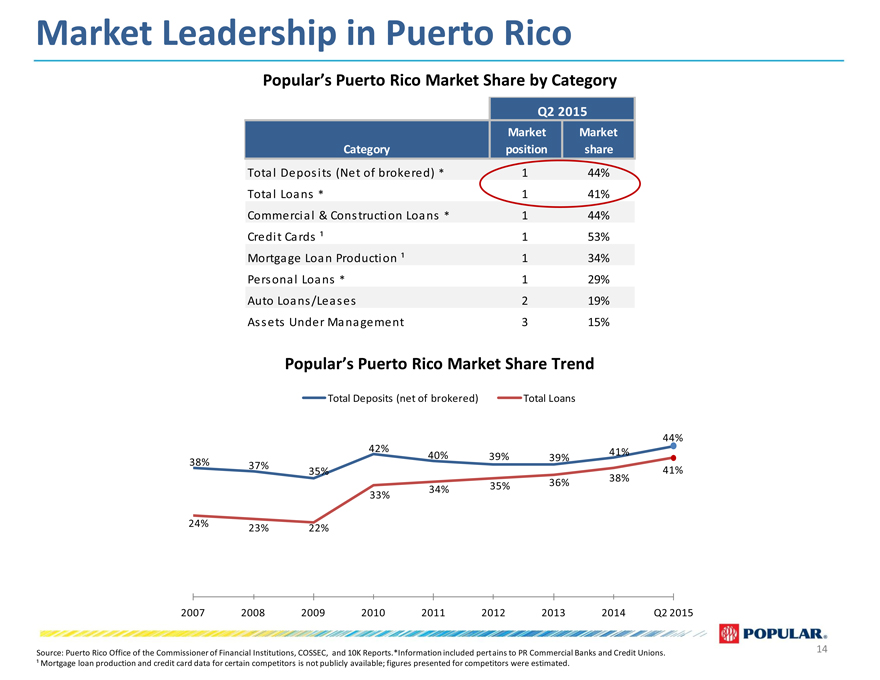
Market Leadership in Puerto Rico
Popular’s Puerto Rico Market Share by Category
Q2 2015
Market Market
Category position share
Total Deposits (Net of brokered) * 1 44%
Total Loans * 1 41%
Commercial & Construction Loans * 1 44%
Credit Cards ¹ 1 53%
Mortgage Loan Production ¹ 1 34%
Personal Loans * 1 29%
Auto Loans/Leases 2 19%
Assets Under Management 3 15%
Popular’s Puerto Rico Market Share Trend
Total Deposits (net of brokered) Total Loans
44%
42% 41%
40% 39% 39%
38% 37% 35% 41%
38%
34% 35% 36%
33%
24% 23% 22%
2007 2008 2009 2010 2011 2012 2013 2014 Q2 2015
Source: Puerto Rico Office of the Commissioner of Financial Institutions, COSSEC, and 10K Reports.*Information included pertains to PR Commercial Banks and Credit Unions.
¹ Mortgage loan production and credit card data for certain competitors is not publicly available; figures presented for competitors were estimated.
14
|
|
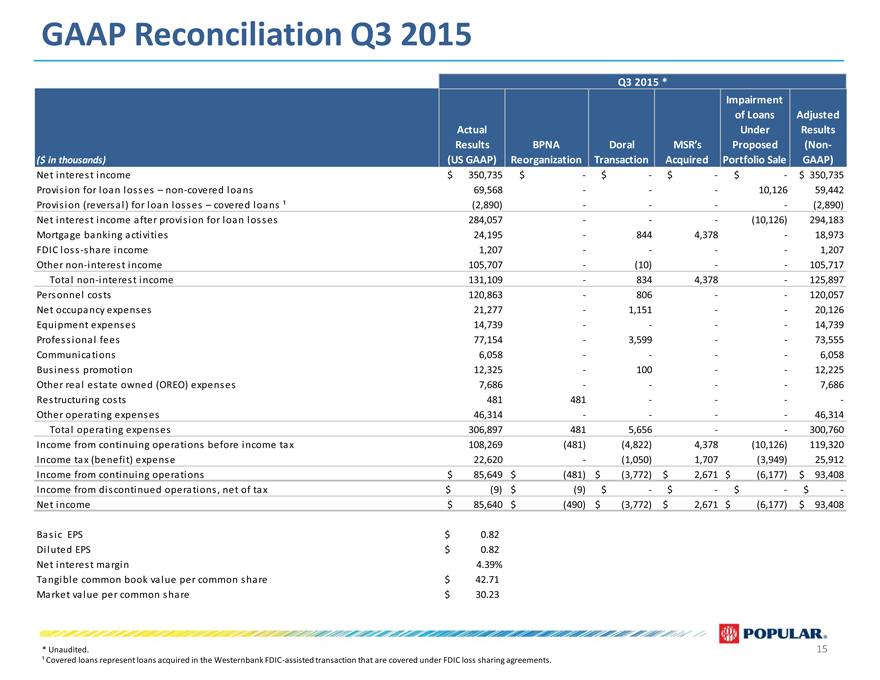
GAAP Reconciliation Q3 2015
Q3 2015 *
Impairment
of Loans Adjusted
Actual Under Results
Results BPNA Doral MSR’s Proposed (Non-
($ in thousands) (US GAAP) Reorganization Transaction Acquired Portfolio Sale GAAP)
Net interest income $ 350,735 $ — $ — $ — $ — $ 350,735
Provision for loan losses – non-covered loans 69,568 — — — 10,126 59,442
Provision (reversal) for loan losses – covered loans ¹ (2,890) — — — — (2,890)
Net interest income after provision for loan losses 284,057 — — — (10,126) 294,183
Mortgage banking activities 24,195 — 844 4,378 — 18,973
FDIC loss -share income 1,207 — — — — 1,207
Other non-interest income 105,707 — (10) — — 105,717
Total non-interest income 131,109 — 834 4,378 — 125,897
Personnel costs 120,863 — 806 — — 120,057
Net occupancy expenses 21,277 — 1,151 — — 20,126
Equipment expenses 14,739 — — — — 14,739
Professional fees 77,154 — 3,599 — — 73,555
Communications 6,058 — — — — 6,058
Business promotion 12,325 — 100 — — 12,225
Other real estate owned (OREO) expenses 7,686 — — — — 7,686
Restructuring costs 481 481 — — — -
Other operating expenses 46,314 — — — — 46,314
Total operating expenses 306,897 481 5,656 — — 300,760
Income from continuing operations before income tax 108,269 (481) (4,822) 4,378 (10,126) 119,320
Income tax (benefit) expense 22,620 — (1,050) 1,707 (3,949) 25,912
Income from continuing operations $ 85,649 $ (481) $ (3,772) $ 2,671 $ (6,177) $ 93,408
Income from discontinued operations, net of tax $ (9) $ (9) $ — $ — $ — $ -
Net income $ 85,640 $ (490) $ (3,772) $ 2,671 $ (6,177) $ 93,408
Basic EPS $ 0.82
Diluted EPS $ 0.82
Net interest margin 4.39%
Tangible common book value per common share $ 42.71
Market value per common share $ 30.23
| * |
|
Unaudited. |
¹ Covered loans represent loans acquired in the Westernbank FDIC-assisted transaction that are covered under FDIC loss sharing agreements.
15
|
|
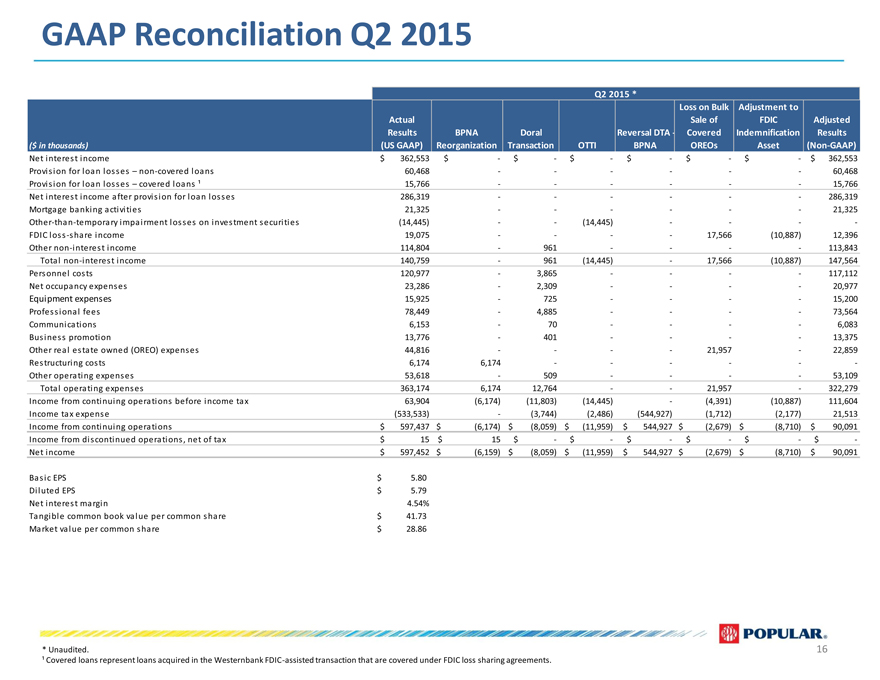
GAAP Reconciliation Q2 2015
Q2 2015 *
Loss on Bulk Adjustment to
Actual Sale of FDIC Adjusted
Results BPNA Doral Reversal DTA—Covered Indemnification Results
($ in thousands) (US GAAP) Reorganization Transaction OTTI BPNA OREOs Asset (Non-GAAP)
Net interest income $ 362,553 $ — $ — $ — $ — $ — $ — $ 362,553
Provision for loan losses – non-covered loans 60,468 — — — — — — 60,468
Provision for loan losses – covered loans ¹ 15,766 — — — — — — 15,766
Net interest income after provision for loan losses 286,319 — — — — — — 286,319
Mortgage banking activities 21,325 — — — — — — 21,325
Other-than-temporary impairment losses on investment securities (14,445) — — (14,445) — — — -
FDIC loss -share income 19,075 — — — — 17,566 (10,887) 12,396
Other non-interest income 114,804 — 961 — — — — 113,843
Total non-interest income 140,759 — 961 (14,445) — 17,566 (10,887) 147,564
Personnel costs 120,977 — 3,865 — — — — 117,112
Net occupancy expenses 23,286 — 2,309 — — — — 20,977
Equipment expenses 15,925 — 725 — — — — 15,200
Professional fees 78,449 — 4,885 — — — — 73,564
Communications 6,153 — 70 — — — — 6,083
Business promotion 13,776 — 401 — — — — 13,375
Other real estate owned (OREO) expenses 44,816 — — — — 21,957 — 22,859
Restructuring costs 6,174 6,174 — — — — — -
Other operating expenses 53,618 — 509 — — — — 53,109
Total operating expenses 363,174 6,174 12,764 — — 21,957 — 322,279
Income from continuing operations before income tax 63,904 (6,174) (11,803) (14,445) — (4,391) (10,887) 111,604
Income tax expense (533,533) — (3,744) (2,486) (544,927) (1,712) (2,177) 21,513
Income from continuing operations $ 597,437 $ (6,174) $ (8,059) $ (11,959) $ 544,927 $ (2,679) $ (8,710) $ 90,091
Income from discontinued operations, net of tax $ 15 $ 15 $ — $ — $ — $ — $ — $ -
Net income $ 597,452 $ (6,159) $ (8,059) $ (11,959) $ 544,927 $ (2,679) $ (8,710) $ 90,091
Basic EPS $ 5.80
Diluted EPS $ 5.79
Net interest margin 4.54%
Tangible common book value per common share $ 41.73
Market value per common share $ 28.86
| * |
|
Unaudited. |
¹ Covered loans represent loans acquired in the Westernbank FDIC-assisted transaction that are covered under FDIC loss sharing agreements.
16
|
|
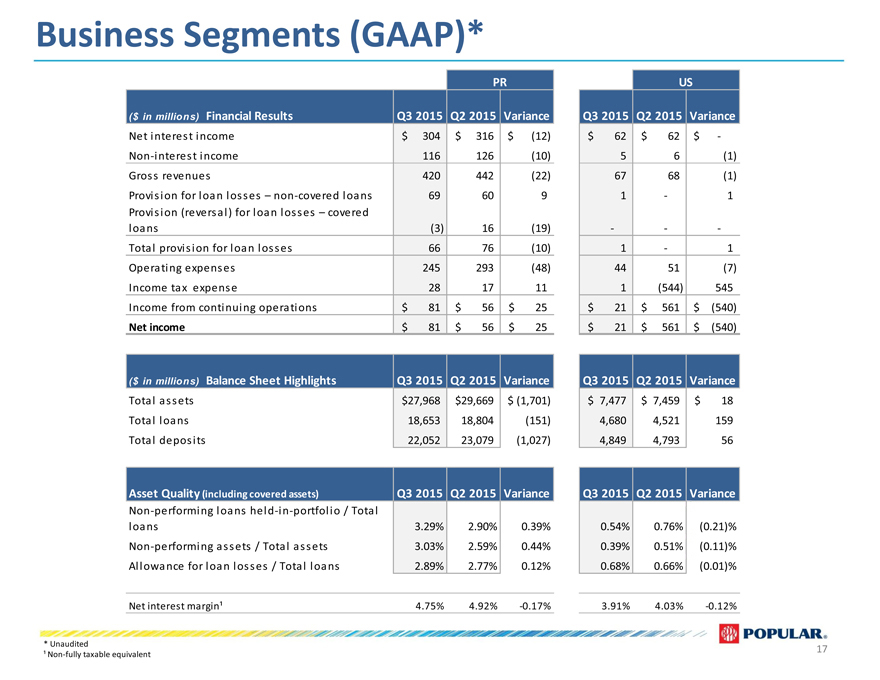
Business Segments (GAAP)*
PR US
($ in millions) Financial Results Q3 2015 Q2 2015 Variance Q3 2015 Q2 2015 Variance
Net interest income $ 304 $ 316 $ (12) $ 62 $ 62 $ -
Non-interest income 116 126 (10) 5 6 (1)
Gross revenues 420 442 (22) 67 68 (1)
Provision for loan losses – non-covered loans 69 60 9 1 — 1
Provision (reversal) for loan losses – covered
loans (3) 16 (19) — — -
Total provision for loan losses 66 76 (10) 1 — 1
Operating expenses 245 293 (48) 44 51 (7)
Income tax expense 28 17 11 1 (544) 545
Income from continuing operations $ 81 $ 56 $ 25 $ 21 $ 561 $ (540)
Net income $ 81 $ 56 $ 25 $ 21 $ 561 $ (540)
($ in millions) Balance Sheet Highlights Q3 2015 Q2 2015 Variance Q3 2015 Q2 2015 Variance
Total assets $27,968 $29,669 $ (1,701) $ 7,477 $ 7,459 $ 18
Total loans 18,653 18,804 (151) 4,680 4,521 159
Total deposits 22,052 23,079 (1,027) 4,849 4,793 56
Asset Quality (including covered assets) Q3 2015 Q2 2015 Variance Q3 2015 Q2 2015 Variance
Non-performing loans held-in-portfolio / Total
loans 3.29% 2.90% 0.39% 0.54% 0.76% (0.21)%
Non-performing assets / Total assets 3.03% 2.59% 0.44% 0.39% 0.51% (0.11)%
Allowance for loan losses / Total loans 2.89% 2.77% 0.12% 0.68% 0.66% (0.01)%
Net interest margin¹ 4.75% 4.92% -0.17% 3.91% 4.03% -0.12%
| * |
|
Unaudited |
¹ Non-fully taxable equivalent
17
|
|
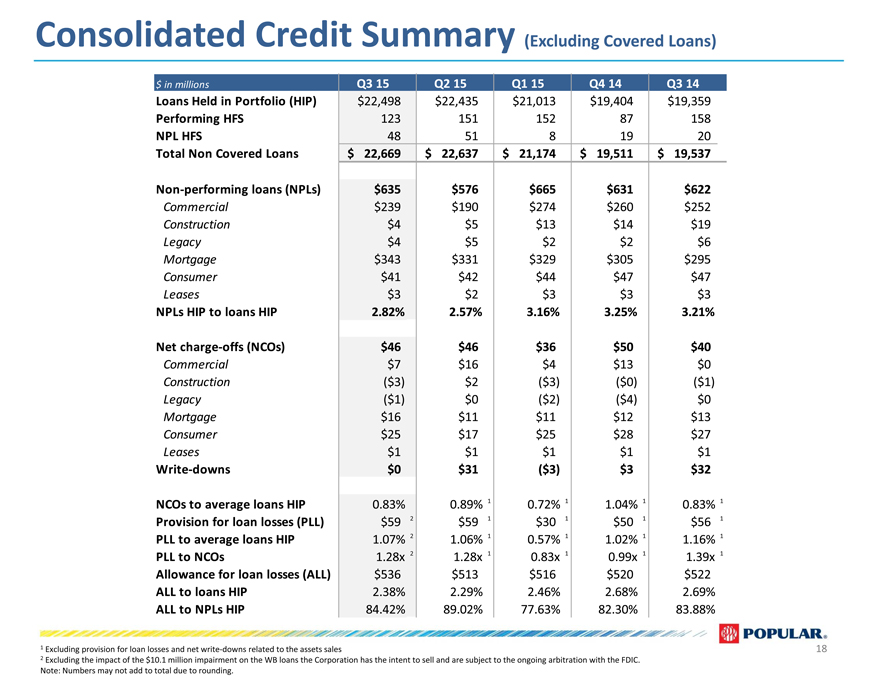
Consolidated Credit Summary (Excluding Covered Loans)
$ in millions Q3 15 Q2 15 Q1 15 Q4 14 Q3 14
Loans Held in Portfolio (HIP) $22,498 $22,435 $21,013 $19,404 $19,359
Performing HFS 123 151 152 87 158
NPL HFS 48 51 8 19 20
Total Non Covered Loans $ 22,669 $ 22,637 $ 21,174 $ 19,511 $ 19,537
Non-performing loans (NPLs) $635 $576 $665 $631 $622
Commercial $239 $190 $274 $260 $252
Construction $4 $5 $13 $14 $19
Legacy $4 $5 $2 $2 $6
Mortgage $343 $331 $329 $305 $295
Consumer $41 $42 $44 $47 $47
Leases $3 $2 $3 $3 $3
NPLs HIP to loans HIP 2.82% 2.57% 3.16% 3.25% 3.21%
Net charge-offs (NCOs) $46 $46 $36 $50 $40
Commercial $7 $16 $4 $13 $0
Construction ($3) $2 ($3) ($0) ($1)
Legacy ($1) $0 ($2) ($4) $0
Mortgage $16 $11 $11 $12 $13
Consumer $25 $17 $25 $28 $27
Leases $1 $1 $1 $1 $1
Write-downs $0 $31 ($3) $3 $32
NCOs to average loans HIP 0.83% 0.89% 1 0.72% 1 1.04% 1 0.83% 1
Provision for loan losses (PLL) $59 2 $59 1 $30 1 $50 1 $56 1
PLL to average loans HIP 1.07% 2 1.06% 1 0.57% 1 1.02% 1 1.16% 1
PLL to NCOs 1.28x 2 1.28x 1 0.83x 1 0.99x 1 1.39x 1
Allowance for loan losses (ALL) $536 $513 $516 $520 $522
ALL to loans HIP 2.38% 2.29% 2.46% 2.68% 2.69%
ALL to NPLs HIP 84.42% 89.02% 77.63% 82.30% 83.88%
| 1 |
|
Excluding provision for loan losses and net write-downs related to the assets sales |
| 2 |
|
Excluding the impact of the $10.1 million impairment on the WB loans the Corporation has the intent to sell and are subject to the ongoing arbitration with the FDIC. |
Note: Numbers may not add to total due to rounding.
18
|
|
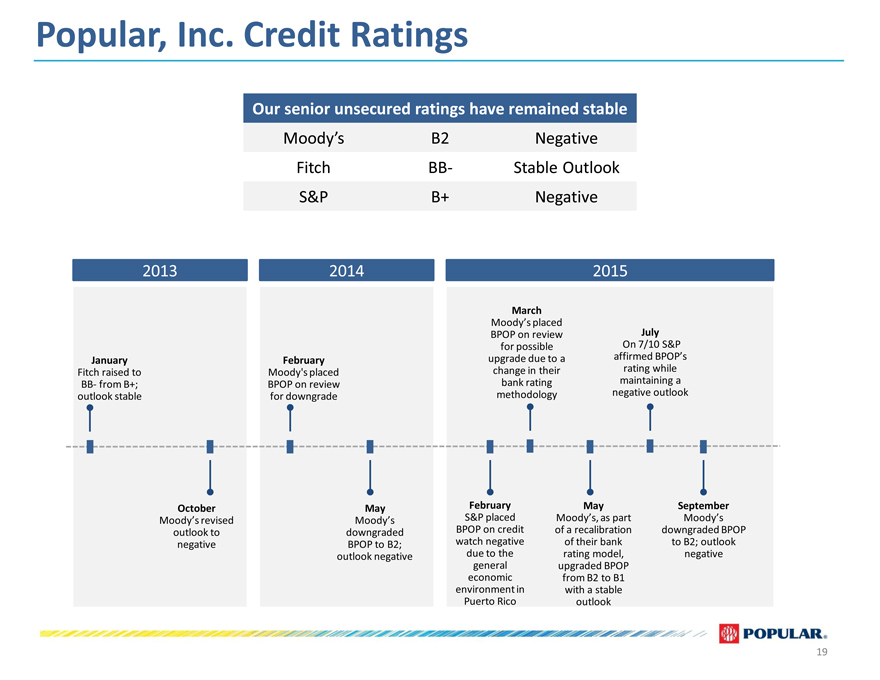
Popular, Inc. Credit Ratings
Our senior unsecured ratings have remained stable
Moody’s B2 Negative
Fitch BB- Stable Outlook
S&P B+ Negative
2013 2014 2015
March
Moody’s placed
BPOP on review July
for possible On 7/10 S&P
January February upgrade due to a affirmed BPOP’s
Fitch raised to Moody’s placed change in their rating while
BB- from B+; BPOP on review bank rating maintaining a
outlook stable for downgrade methodology negative outlook
October May February May September
Moody’s revised Moody’s S&P placed Moody’s, as part Moody’s
outlook to downgraded BPOP on credit of a recalibration downgraded BPOP
negative BPOP to B2; watch negative of their bank to B2; outlook
outlook negative due to the rating model, negative
general upgraded BPOP
economic from B2 to B1
environment in with a stable
Puerto Rico outlook
19
|
|

Investor Presentation
Third Quarter 2015