Attached files
| file | filename |
|---|---|
| 8-K - FORM 8-K - FARMERS NATIONAL BANC CORP /OH/ | d24149d8k.htm |
| EX-99.1 - EX-99.1 - FARMERS NATIONAL BANC CORP /OH/ | d24149dex991.htm |
 Investor Presentation September 30, 2015 Exhibit 99.2 |
 2 Disclosure Statements Forward-Looking Statements This presentation contains forward-looking statements within the meaning of the Private Securities Litigation
Reform Act of 1995, including statements
about the financial condition, results of operations, asset quality trends and profitability of Farmers National Banc Corp. (“Farmers”). Forward-looking statements are not historical facts but instead express
management’s current expectations,
forecasts of future events or long-term-goals, many of which, by their nature, are inherently uncertain and outside of Farmers control. Forward-looking statements are preceded by terms such as “expects,”
“believes,” “anticipates,” “intends” and similar expressions, as well as any statements related to future expectations of performance or conditional verbs,
such as “will,”
“would,” “should,” “could”
or “may.” Farmers’ actual results and financial condition could differ, possibly materially, from those indicated in these forward-looking statements. Factors that could cause Farmers’ actual results to differ
materially from those described in the
forward-looking statements can be found in Farmers’ periodic reports and registration statements filed with the Securities and Exchange Commission, including its Annual Report on Form 10-K for the year ended December 31,
2014, as amended, and Quarterly Report on
Form 10-Q for the period ended June 30, 2015, which have been filed with the Securities and Exchange Commission and are available on Farmers’ website (www.farmersbankgroup.com) and on the Securities
and Exchange Commission’s website
(www.sec.gov). Factors that may cause or contribute to these differences may also include, without limitation, Farmers’ failure to integrate Tri-State and its subsidiary in accordance with expectations,
and deviations from performance
expectations related to Tri-State and its subsidiary. Forward-looking statements are not guarantees of future performance and should not be relied upon as representing management’s views as of any subsequent date.
Farmers undertakes no obligation to update
forward-looking statements, whether as a result of new information, future events or otherwise, except as may be required by law. Use of Non-GAAP Financial Measures This presentation contains certain financial information determined by methods other than in accordance with
accounting principles generally accepted
in the United States (“GAAP”). These non-GAAP financial measures include “Core Deposits” and “Pre-tax, Pre-provision Earnings”. Farmers believes that these non-GAAP financial
measures provide both management and
investors a more complete understanding of the
Company’s deposit profile and profitability. These non-GAAP financial measures are supplemental and are not a substitute for any analysis based on GAAP financial measures.
Because not all companies use the same
calculation of “Core Deposits” and “Pre-tax, Pre-provision Earnings”, this presentation may not be comparable to other similarly titled measures as calculated by other companies. |
 3 FMNB - Legacy Financial Highlights at March 31, 2015 •Banking Locations: 19
•Assets:
$1.13 billion •Loans: $673.78 million •Deposits: $909.41 million
•Loan/Deposit
Ratio: 74.09% •Tangible Common Equity: 10.50% •Market Capitalization: $150.77 million
Strategic Objectives
•Strong Capital
Position •Strong Asset Quality •Loan Growth
•Diversifying
Revenue Stream •Controlling Non-interest Expenses (PIC) |
 4 FMNB-NBOH Merger Financial Highlights at September 30, 2015 •Banking Locations: 33
•Assets:
$1.71billion •Loans: $1.18 billion •Deposits: $1.33 billion
•Loan/Deposit
Ratio: 88.93% •Tangible Common Equity: 8.80% •Market Capitalization: $211.0 million
Strategic Objectives
•Creates
the
third
largest
community
bank
1
by
asset size headquartered in NE Ohio
•Complementary
business lines & compelling
cultural fit
•Enhanced
board of directors and management
team bringing strengths and best practices from
both sides
•Catalyst
for additional growth opportunities
(1) Community Banks defined as those with assets less
than $20.0 billion. Northeast Ohio includes area codes 216, 330 and 440 |
 5 FMNB-NBOH Combined with TSOH Acquisition Pro Forma Financial Highlights •Banking Locations: 38
•Assets:
$1.8 billion •Loans: $1.3 billion •Deposits: $1.5 billion
•Loan/Deposit
Ratio: 85.87% •Tangible Common Equity: 8.75% •Market
Capitalization:
$227
million
1
Strategic Objectives
• share with ~20% of the county’s deposits •TSOH provides an attractive deposit base with
$53.0 million of demand deposits
and an overall cost of deposits of
0.19% •Entrance into the Pennsylvania market (1) Based on FMNB’s stock price of $8.40 on October 1, 2015
Source: SNL Financial
nd
Pro-forma,
Farmers
will
rank
2
in
market |
 6 Who We Are Today • Operating in eight counties in Ohio – Founded over 128 years ago • Entered the Pennsylvania market in Beaver County with the closing
of the Tri-State acquisition on October 1,
2015 •
Sound franchise with commitment to independence and
positioned for growth
• Profitable throughout cycle and growth in current year core
earnings
• Diversified and growing revenue streams • Compelling valuation: – 1.44x of tangible book value – 13.70x LTM pre-tax pre-provision earnings (excludes security gains)
– 1.46% dividend yield |
 7 About Farmers National Banc Corp. • Stock Price: $8.22 • Dividend (yield): $0.03 (1.46%) • Cash Dividends: $770 thousand • Tangible Book Value: $5.72 Stock Data – NASDAQ: FMNB as of 9/30/15 • Revenue: $20.3 million • Net Income: $1.9 million • Net Income-Diluted Share: $0.07
•
ROAA: 0.43%
•
ROAE:
3.97% Operating Results for 3 Months Ended 9/30/15 • Revenue: $20.3 million • Net Income: $3.7 million • Net Income-Diluted Share: $0.15
•
ROAA: 0.87%
•
ROAE:
7.97% Operating Results for 3 Months Ended 9/30/15 excluding One-time Acquisition Expenses |
 • Established and experienced management team with over 300 years of combined experience,
130 of which has been with Farmers.
Experienced Management Team
8 Years of Experience FMNB Industry President & Chief Executive Officer Kevin J. Helmick (43) 21+ 21+ Senior EVP, Chief Banking Officer Mark Witmer (51) <1 25+ EVP, Chief Financial Officer Carl D. Culp (52) 26+ 30+ EVP, Chief Credit Officer Mark L. Graham (60) 37+ 37+ SVP, Chief Retail & Marketing Officer Amber Wallace (49) 7+ 7+ SVP, Chief Information Officer Brian Jackson (46) 6+ 22+ SVP, Chief Risk Officer Jay VanSickle (45) <1 20+ SVP, Chief Lending Officer and Regional President Joseph Gerzina (59) 4+ 33+ SVP, Regional President Tim Shaffer (53) 3+ 29+ SVP, Director of Human Resources Mark A. Nicastro (44) 6+ 17+ President, Farmers Trust Company Joseph J. DePascale (50) 4+ 21+ President, National Associates Inc. Aubrey Christ (42) 1 21+ VP, Farmers National Investments/Farmers National Insurance Dan Cvercko (43) 14+ 17+ |
 9 Seven Key Focuses • Lending/Credit • Wealth Management • Retail/Marketing • Finance • Information Technology • Enterprise Risk Management • Human Resources |
 10 New Locations - Alliance |
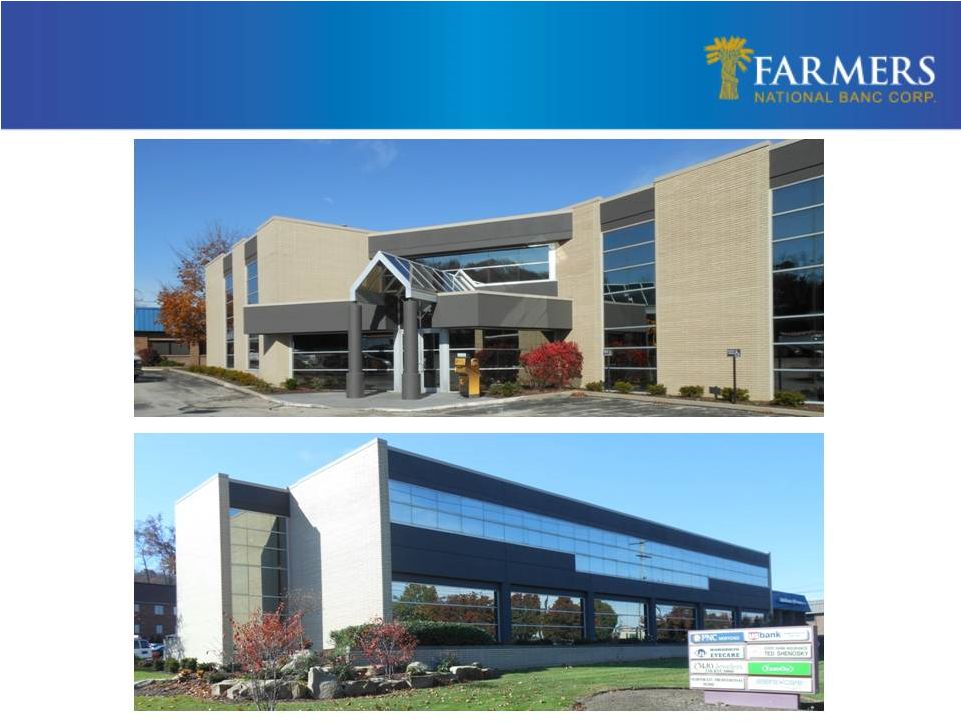 11 New Locations - Fairlawn |
 12 Commitment to Stakeholders • Four Pillars – Shareholders o 2015 Strategic Initiative o Increased Communication Plan – Customers o Small Business Support o 45% of small business
lending
comes from community banks* – Associates o 415 associates o Top 100 employer in the region – Community o 2015 Community Giving as of September 30, 2015: $228,743
*Source:
FDIC
Quarterly
Banking
Profile
-
Second
Quarter
2014
Arts
4%
Civic
14%
Community
Athletics
1%
Education/Higher
Education
19%
Health & Wellness
15%
Religious
1%
Social Services
15%
CRA
31%
2015 Community Giving
YTD 10/15/15 |
 13 Increasing Shareholder Value Stable Dividend Policy • Consistently paid a quarterly cash dividend • Current yield 1.46% • Dividend payout range policy of 25% - 35% • Dividend payout 2015 YTD* is 38.42% of net income *As of September 30, 2015 0.00 1.00 2.00 3.00 4.00 5.00 6.00 7.00 8.00 9.00 10 11 12 13 14 15* $3.62 $4.95 $6.20 $6.55 $8.35 $8.22 Stock Price |
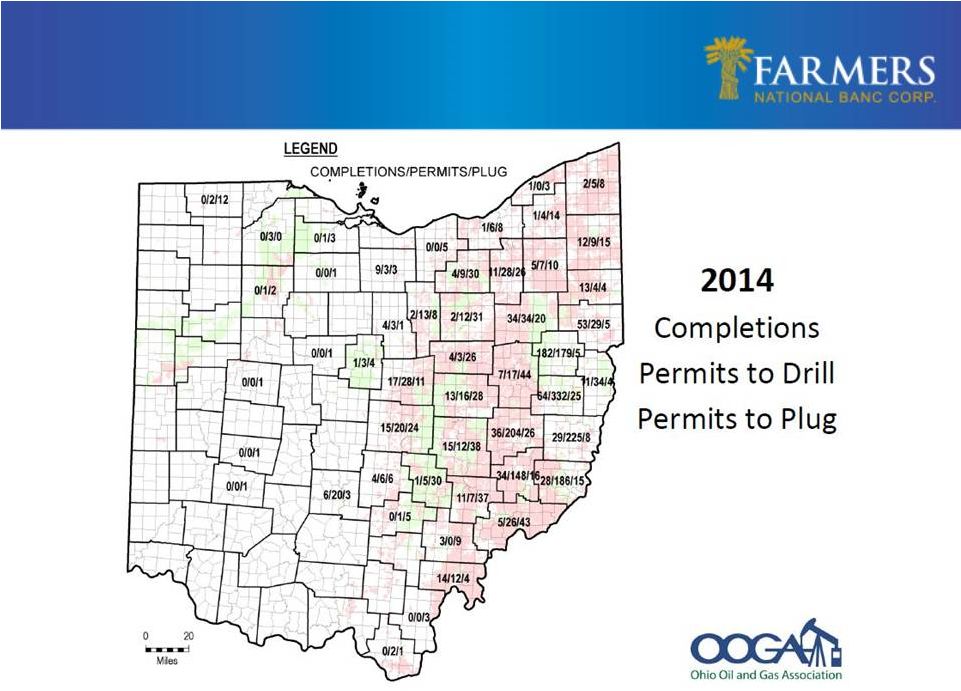
 14 Source: Debrosse Memorial Report, 2014 Ohio and Gas Activity in Ohio, Ohio Oil and Gas Association
• Completions – Top 10 Counties in Ohio – Columbiana #3 – Stark # 6 • Top 12 Most Active Counties in Ohio – By Well – Columbiana #3 – Stark #5 • Top 12 Most Active Counties in Ohio – By Footage – Columbiana #3 – Stark #7 – Trumbull #8 – Mahoning #9 Utica Shale Impact |
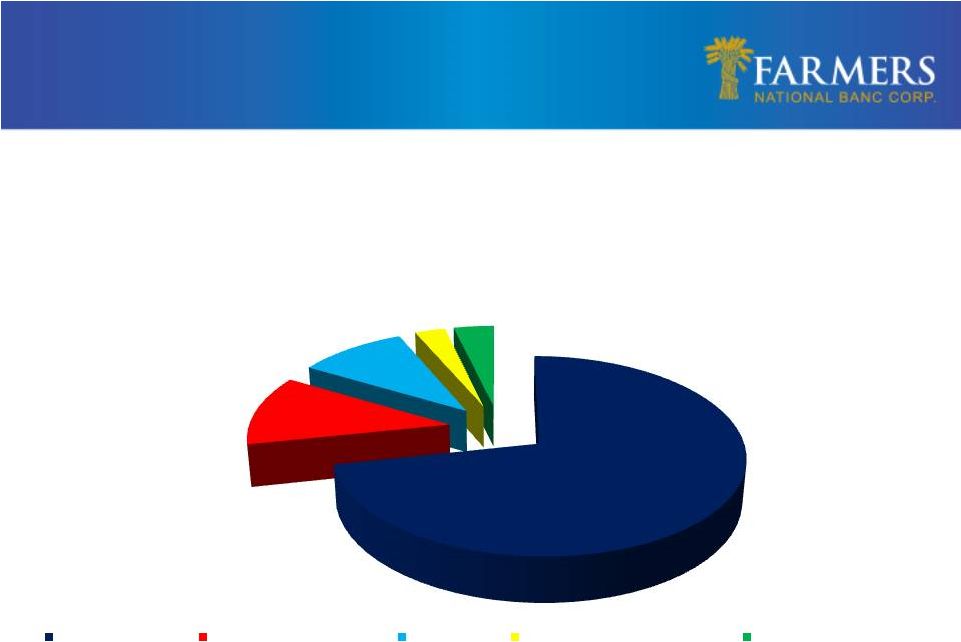
 15 Source: Debrosse Memorial Report, 2014 Ohio and Gas Activity in Ohio, Ohio Oil and Gas Association
Utica Shale Impact |
 16 Source: Debrosse Memorial Report, 2014 Ohio and Gas Activity in Ohio, Ohio Oil and Gas Association
Utica Shale Impact |
 Virtual Bank 17 |
 Mobile Banking Analytics Transactions •Account to Account Transfers
• Bill Payments • Mobile Captures • Picture Payments Growth: 319% * Farmers’ Active Users: 82% Active User Target: 75% 18 |
 Online Banking Analytics Transactions - Fiserv •Bill Pay
•PopMoney
•Account to Account Transactions •Same Day EBT
•All
Other Electronic Payments •Overnight Checks •All Other Paper Payments
19 |
 20 • Focus for Growth – Continued organic growth in current markets – Growth opportunities in new markets with Private Banking, Trust
and Investments
– Targeted acquisitions include fee-based business and banks
• Target Metrics for Acquisition – Accretive to earnings near term (excluding one-time charges)
– Manageable initial tangible book value dilution – Growth of fee revenue to 30+% of total revenue – Must enhance shareholder value – Must sustain our culture – Not materially change our investment merits – Sustain our TCE and regulatory ratios Growth Focus and Target Metrics |
 The Health of Our Wealth • Wealth Management Creates Fee-based Income – Fee Income 2009: 14.5% of total gross income o Noninterest income excluding security gains – Fee Income 2015*: 26.5% of total gross income o Noninterest income excluding security gains • Wealth Management Build-out Timeline – 2000 Farmers National Investments – 2009 Farmers Trust Company – 2010 Farmers National Insurance – 2012 Private Client Services – 2013 National Associates, Inc. *For the nine months ended September 30, 2015 21 |
 22 • 131 consecutive quarters of profitability • First full quarter with recently acquired National Bancshares
Corporation
• Net income for quarter ended September 30, 2015 was $1.9 million
compared to $812 thousand for most recent
quarter •
Costs related to acquisitions were $2.5 million
pre-tax for the third
quarter
• Noninterest income increased 20.8% compared to same quarter in
2014
• Non-performing assets to total assets remain at low levels, 0.62% at
September 30, 2015
• Completed merger with Tri-State 1 Banc Inc. on October 1, 2015 Continued Strong Results – Overview of 3Q 2015 st |
 23 Net Interest Income and Margin Dollars in thousands $9,285 $9,243 $8,992 $9,749 $14,538 3.58% 3.63% 3.64% 3.66% 3.84% 3.50% 3.55% 3.60% 3.65% 3.70% 3.75% 3.80% 3.85% 3.90% $0 $2,000 $4,000 $6,000 $8,000 $10,000 $12,000 $14,000 $16,000 3Q 2014 4Q 2014 1Q 2015 2Q 2015 3Q 2015 Net Interest Income Net Interest Margin |
 24 Growing and Diverse Revenue Stream • Continued Focus on Growing Noninterest Income • Non-interest Revenue: 26.5% of Total Revenue *For the nine months ended September 30, 2015 71.7% 11.8% 10.0% 2.8% 3.7% Total Revenue 2015*: $49.4 million Net Interest Income Other Non-interest Income Trust Income Insurance & Investment Income Retirement Planning Income |
 25 Loan Growth $- $200,000 $400,000 $600,000 $800,000 $1,000,000 $1,200,000 9/30/2012 9/30/2013 9/30/2014 9/30/2015 $572,903 $611,349 $646,981 $753,016 $430,000 Total Loans Farmers Total Loans NBOH Acquisition YOY Growth: 6.71% YOY Growth: 5.83% YOY Growth: 82.85% Organic Growth:16.39% Growth from Acquisition: 66.46% $1,183,016 |
 26 • Diverse loan mix • No national lending • No sub-prime lending • Farmers’ practice is to lend primarily within its market area • Less than 2% of loan portfolio is participations purchased • Less than 4.5% of loan portfolio is construction loans Loan Portfolio Mix – September 30, 2015 Overview of Loan Portfolio Note: Dollars in thousands Commercial Real Estate $394,614 33.4% Residential Real Estate $335,249 28.3% Consumer $177,881 15.0% Commercial & Industrial $224,559 19.0% Commercial Construction $40,839 3.5% Residential Construction $9,874 0.8% |
 27 Excellent Asset Quality Note: Dollars in millions; Asset quality ratios exclude troubled debt restructuring
9/30/2015
Nonaccrual loans
$8.7
Accruing loans past due 90 days or more
0.9
OREO
1.1
Total nonperforming assets (NPAs)
$10.7
Troubled Debt Restructuring (TDR)
$8.2
Loans 30-89 days delinquent
7.0
Gross portfolio loans
1,183.0
Loans held for sale (HFS)
0.6
Allowance for loan losses (ALL)
8.3
Total Assets
$1,707.8
NPLs & 90 days past due/Gross loans (excl.
HFS) 0.81%
NPAs/Total Assets
0.62%
TDR/Gross loans (excl. HFS)
0.69%
30-89 days delinquent/Gross loans (excl.
HFS) 0.59%
ALL/NPLs & 90 days past due
86.22%
ALL/Gross loans (excl. HFS)
0.70%
Texas Ratio
6.53%
Nonaccrual Loans by Type
Nonaccrual
$8.7mm
81.3%
Accruing
loans past
due 90 days
or more
$0.9mm
8.4%
OREO
$1.1mm
10.3%
Commercial
Real Estate
41.3%
Residential
Real Estate
33.1%
Commercial
21.6%
Consumer
4.0% |
 Interest Rate Risk Management • NII benefits from asset re-pricings in a rising rate environment
– 50% of total loans are floating/variable rate – Investment portfolio duration of approximately 3.8 years
– Short-term wholesale funding represents approximately 3.7% of total funding
– Approximately $15.5 million in non-core funding matures beyond one year
Estimated Net Interest Income (NII) Sensitivity Profile
at June 30, 2015 Percent Change in NII
(FTE) ALCO Policy Limits
Change in Interest Rates
12 Months
13 to 24
Months
12 Months
13 to 24
Months
+200
bps 4.00% 7.40% 10% - +100
bps 2.20% 4.20% 5% - Estimated Economic Value of Equity (EVE) Sensitivity Profile
Change in Interest Rates
Change in Eve
ALCO Policy Limit
+200 bps
-1.10%
15%
+100 bps
0.60%
10%
-25 bps
-4.60%
10% |
 29 Supplemental Information |
 30 GAAP to Non-GAAP Reconciliation Reconciliation of Common Stockholders' Equity to Tangible Common Equity
Sept. 30,
June 30,
March 31,
Dec. 31,
Sept. 30,
2015
2015
2015
2014
2014
Stockholders' Equity
$186,151
$182,575
$126,771
$123,560
$121,401
Less Goodwill and other intangibles
39,265
39,569
8,646
8,813
9,768
Tangible Common Equity
$146,886
$143,006
$118,125
$114,747
$111,633
Reconciliation of Total Assets to Tangible
Assets Sept. 30,
June 30,
March 31,
Dec. 31,
Sept. 30,
2015
2015
2015
2014
2014
Total Assets
$1,707,797
$1,672,403
$1,133,651
$1,136,967
$1,139,739
Less Goodwill and other intangibles
39,265
39,569
8,646
8,813
9,768
Tangible Assets
$1,668,532
$1,632,834
$1,125,005
$1,128,154
$1,129,971
Reconciliation of Income Before Taxes to Pre-Tax,
Pre-Provision Income For the Three
Months Ended For the Nine Months
Ended
Sept. 30,
June 30,
March 31,
Dec. 31,
Sept. 30,
Sept. 30,
Sept. 30,
2015
2015
2015
2014
2014
2015
2014
Income before income taxes
$2,482
$1,221
$2,828
$2,744
$2,964
$6,531
$8,853
Provision for loan losses
1,220
850
450
825
425
2,520
1,055
Pre-tax, pre-provision income
$3,702
$2,071
$3,278
$3,569
$3,389
$9,051
$9,908 |
 31 Consolidated Statements of Income Consolidated Statements of Income For the Three Months Ended For the Nine Months Ended Sept. 30, June 30, March 31, Dec. 31, Sept. 30, Sept. 30, Sept. 30, Percent 2015 2015 2015 2014 2014 2015 2014 Change Total interest income $15,594 $10,753 $9,999 $10,321 $10,413 $36,346 $30,594 18.8% Total interest expense 1,056 1,004 1,007 1,078 1,128 3,067 3,501 -12.4% Net interest income 14,538 9,749 8,992 9,243 9,285 33,279 27,093 22.8% Provision for loan losses 1,220 850 450 825 425 2,520 1,055 138.9% Other income 4,685 4,409 4,037 4,193 3,880 13,131 11,110 18.2% Other expense 15,521 12,087 9,751 9,867 9,776 37,359 28,295 32.0% Income before income taxes 2,482 1,221 2,828 2,744 2,964 6,531 8,853 -26.2% Income taxes 625 409 617 597 688 1,651 2,035 -18.9% Net income $1,857 $812 $2,211 $2,147 $2,276 $4,880 $6,818 -28.4% |
 32 Consolidated Statements of Financial Condition Consolidated Statements of Financial Condition Sept. 30, June 30, March 31, Dec. 31, Sept. 30, 2015 2015 2015 2014 2014 Assets Cash and cash equivalents $34,344 $37,028 $26,929 $27,428 $28,294 Securities available for sale 379,138 386,319 369,919 389,829 404,895 Loans held for sale 566 399 146 511 895 Loans 1,183,016 1,134,838 673,784 663,852 646,981 Less allowance for loan losses 8,294 7,286 7,723 7,632 7,333 Net Loans 1,174,722 1,127,552 666,061 656,220 639,648 Other assets 119,027 121,105 70,596 62,979 66,007 Total Assets $1,707,797 $1,672,403 $1,133,651 $1,136,967 $1,139,739 Liabilities and Stockholders' Equity Deposits $1,330,249 $1,320,569 $909,408 $915,703 $913,000 Other interest-bearing liabilities 179,701 155,591 80,338 87,517 90,649 Other liabilities 11,696 13,668 17,134 10,187 14,689 Total liabilities 1,521,646 1,489,828 1,006,880 1,013,407 1,018,338 Stockholders' Equity 186,151 182,575 126,771 123,560 121,401 Total Liabilities and Stockholders' Equity $1,707,797 $1,672,403 $1,133,651 $1,136,967 $1,139,739 |
 Trumbull Top 10 2015 Rank Company Branches Dep. ($M) Market Share 1 Huntington National Bank 15 548,131 19.99 2 JPMorgan Chase Bank NA 8 439,275 16.02 3 Talmer Bank and Trust 8 421,582 15.38 4 Cortland Savings and Banking Co. 7 349,257 12.74 5 PNC Bank NA 5 274,113 10.00 6 Farmers National Bank of Canfield 7 231,093 8.43 7 Home Savings and Loan 4 121,496 4.43 8 First National Bank of Pennsylvania 3 112,977 4.12 9 Citizens Bank NA 3 73,595 2.68 10 Home FS&LA of Niles Ohio 1 59,599 2.17 Total for Institutions in the Market 65 2,741,609 100.00 33 Note: Market share data as of June 30, 2015 Source:
SNL •
Opportunity for growth with approximately 12% deposit
market share in the Mahoning Valley
–
Large regional competitors lack
focus – Community competitors inwardly focused Deposit Market Share by County Columbiana Top 10 2015 Rank Company Branches Dep. ($M) Market Share 1 Huntington National Bank 9 323,597 24.29 2 Farmers National Bank of Canfield 8 263,005 19.74 3 Home Savings and Loan 5 234,890 17.63 4 JPMorgan Chase Bank NA 3 122,812 9.22 5 PNC Bank NA 3 109,052 8.19 6 Consumers National Bank 3 97,365 7.31 7 CFBank 2 86,142 6.47 8 Citizens Bank NA 1 50,270 3.77 9 KeyBank NA 1 42,194 3.17 10 Woodforest National Bank 2 3,002 0.23 Total for Institutions in the Market 37 1,332,329 100.00 Mahoning Top 10 2015 Rank Company Branches Dep. ($M) Market Share 1 Huntington National Bank 19 1,272,722 28.95 2 Home Savings and Loan 11 779,270 17.72 3 PNC Bank NA 9 615,784 14.01 4 Farmers National Bank of Canfield 8 515,147 11.72 5 JPMorgan Chase Bank NA 7 410,973 9.35 6 Talmer Bank and Trust 8 348,893 7.94 7 First National Bank of Pennsylvania 5 249,151 5.67 8 KeyBank NA 4 84,633 1.93 9 Citizens Bank NA 2 68,389 1.56 10 Cortland Savings and Banking Co. 3 49,925 1.14 Total for Institutions in the Market 77 4,396,479 100.00 |
 34 Note: Market share data as of June 30, 2015 Source:
SNL Deposit Market Share by
County Medina Top 10
2015
Rank
Company
Branches
Dep.
($M)
1
FirstMerit Bank NA 12 880,759 26.49 2 Westfield Bank FSB 3 484,825 14.58 3 Third Federal S&LA of Cleveland 2 345,471 10.39 4 PNC Bank NA 6 294,871 8.87 5 JPMorgan Chase Bank NA 4 258,320 7.77 6 Fifth Third Bank 5 245,830 7.39 7 Huntington National Bank 5 187,412 5.64 8 Farmers Savings Bank 1 146,441 4.40 9 U.S. Bank NA 5 126,658 3.81 10 Citizens Bank NA 3 115,466 3.47 14 Farmers National Bank of Canfield 2 32,074 0.96 Total for Institutions in the Market 54 3,325,383 100.00 Wayne Top 10 2015 Rank Company Branches Dep.
($M)
1
PNC Bank NA 11 524,901 27.94 2 FirstMerit Bank NA 5 336,446 17.91 3 Farmers National Bank of Canfield 9 327,742 17.44 4 Wayne Savings Community Bank 7 240,116 12.78 5 JPMorgan Chase Bank NA 2 118,169 6.29 6 Commercial and Savings Bank of Millersburg Ohio 5 111,035 5.91 7 Apple Creek Banking Co. 3 78,756 4.19 8 Farmers State Bank 3 53,940 2.87 9 Westfield Bank FSB 1 29,991 1.60 10 U.S. Bank NA 1 28,726 1.53 Total for Institutions in the Market 50 1,878,892 100.00 Stark Top 10 2015 Rank Company Branches Dep.
($M)
1
Huntington National Bank
26
1,611,346 26.17 2 FirstMerit Bank NA 15 1,509,861 24.52 3 JPMorgan Chase Bank NA 13 814,769 13.23 4 Citizens Bank NA 14 601,167 9.76 5 KeyBank NA 12 537,739 8.73 6 PNC Bank NA 10 364,544 5.92 7 Premier Bank & Trust 7 188,282 3.06 8 Consumers National Bank 2 176,013 2.86 9 Fifth Third Bank 5 109,106 1.77 10 Bank of Magnolia Co. 3 66,352 1.08 11 Farmers National Bank of Canfield 4 64,336 1.04 Total for Institutions in the Market 124 6,156,680 100.00 Market Share Market Share Market Share |